Exhibit 99.1

 | Corporate Communications | |||||||
| [email protected] | ||||||||
| Investor Relations | ||||||||
| [email protected] | ||||||||
FOR RELEASE: Thursday, July 22, 2021
AMERICAN AIRLINES REPORTS SECOND-QUARTER 2021 FINANCIAL RESULTS
Record liquidity and confidence in recovery drive accelerated deleveraging
FORT WORTH, Texas –– American Airlines Group Inc. (NASDAQ: AAL) today reported its second-quarter 2021 financial results, including:
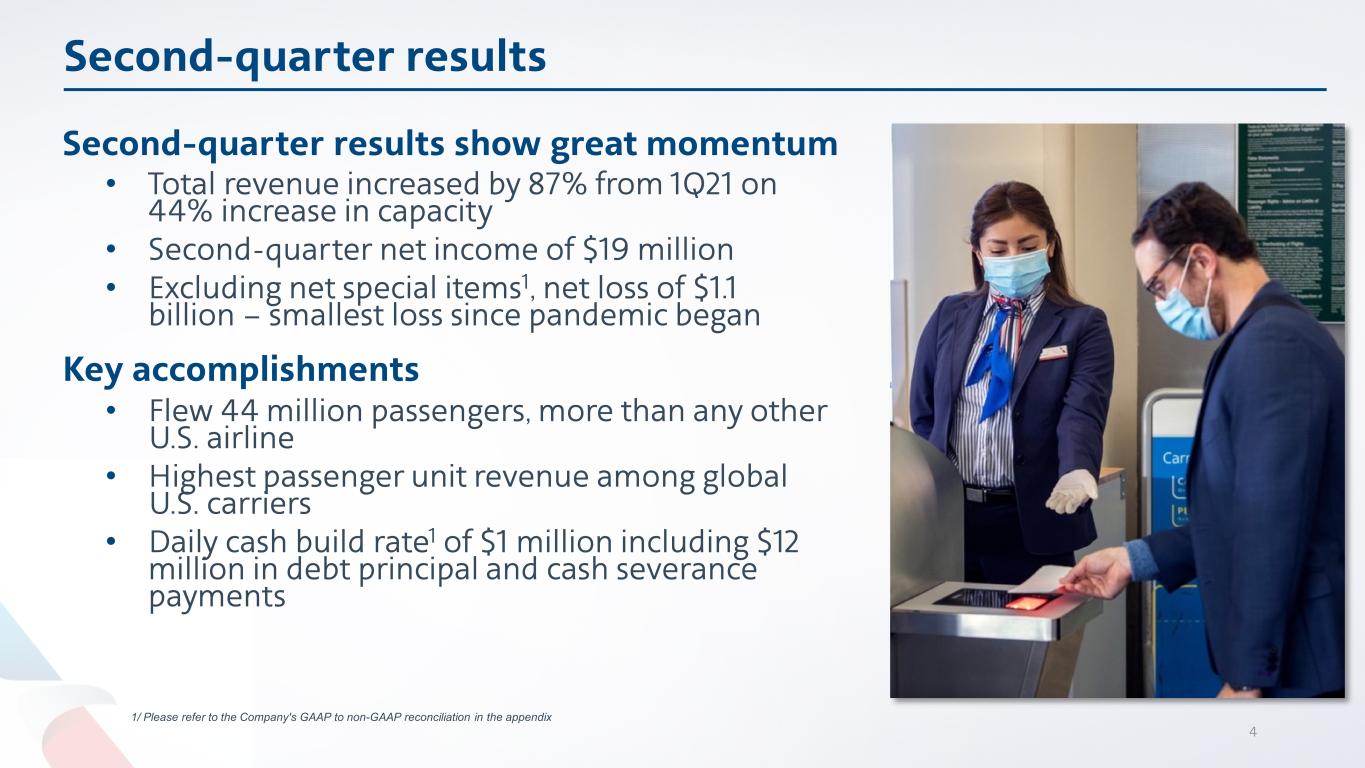
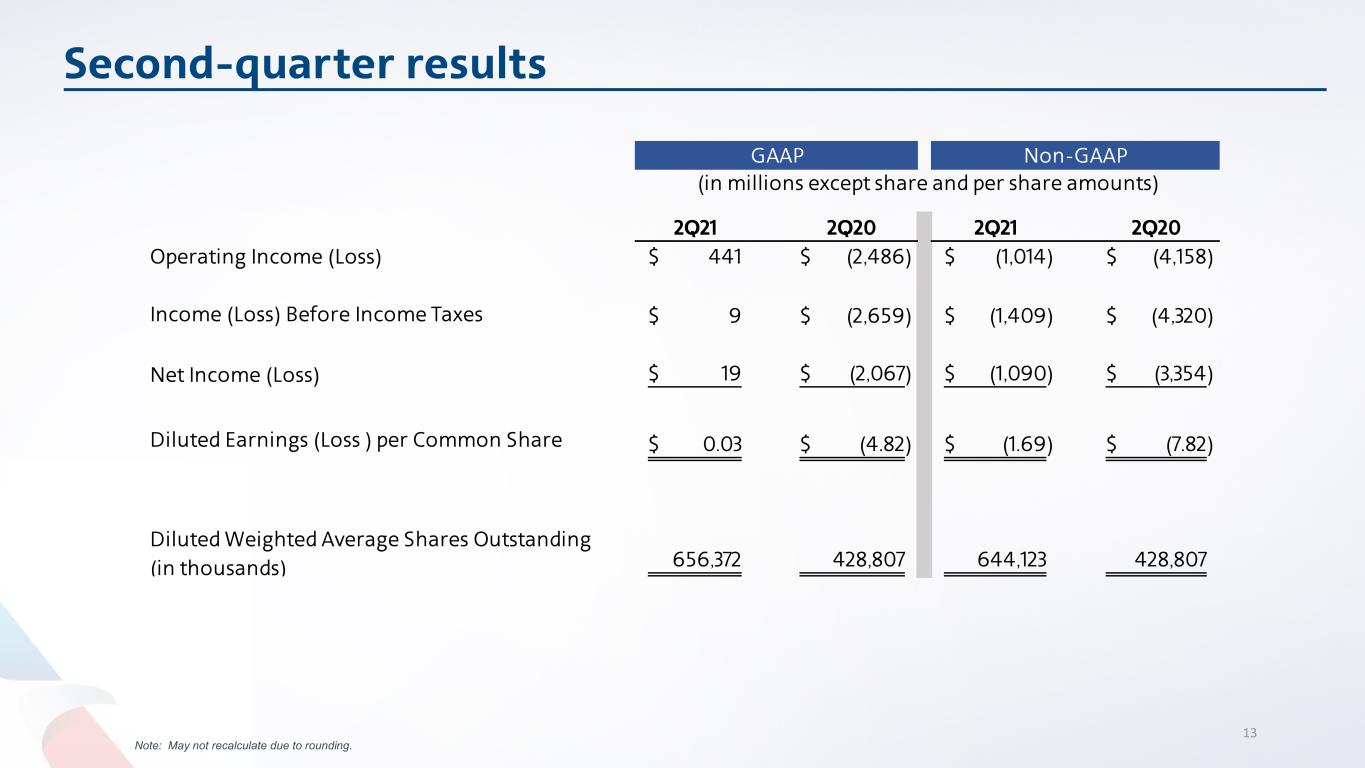
•Second-quarter net profit of $19 million, or $0.03 per diluted share. Excluding net special items1, second-quarter net loss of $1.1 billion, or ($1.69) per share.
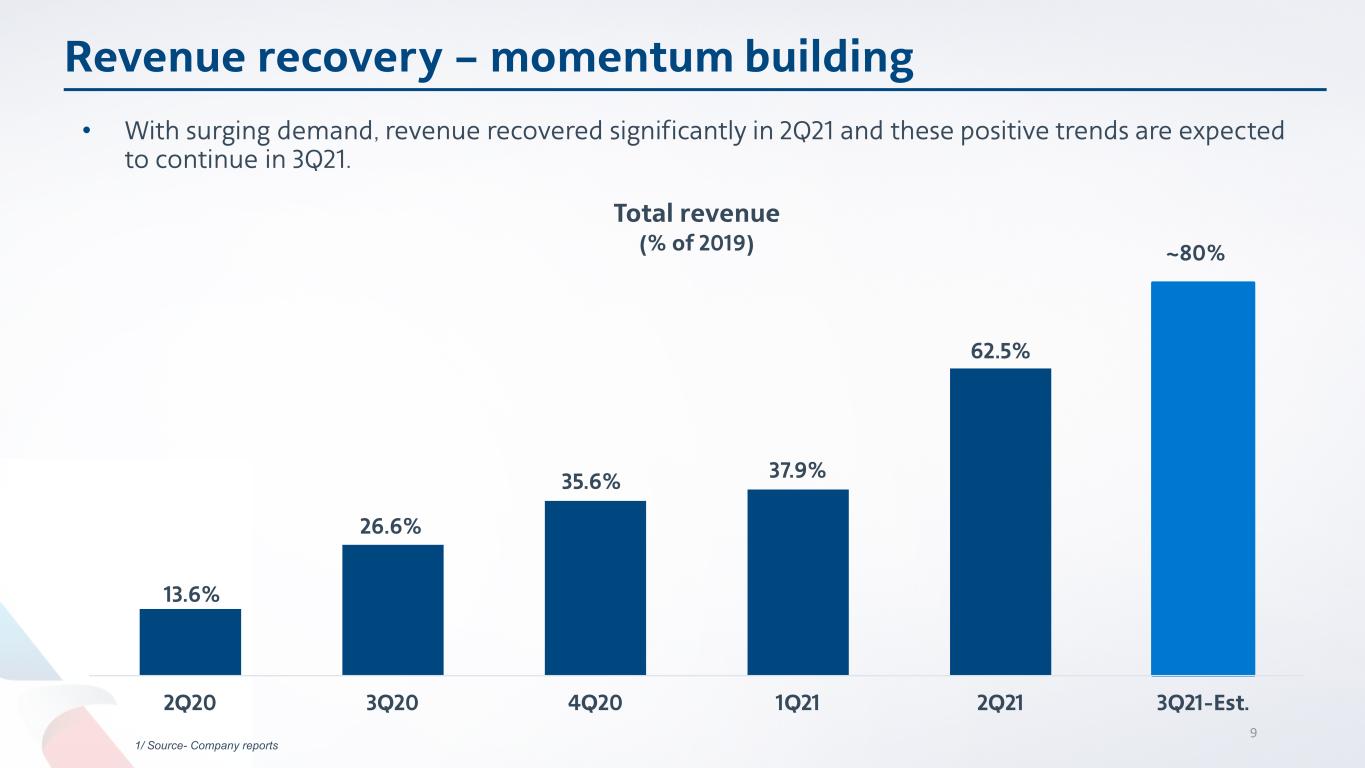
•Second-quarter revenue of $7.5 billion, up 87% sequentially from the first quarter of 2021.
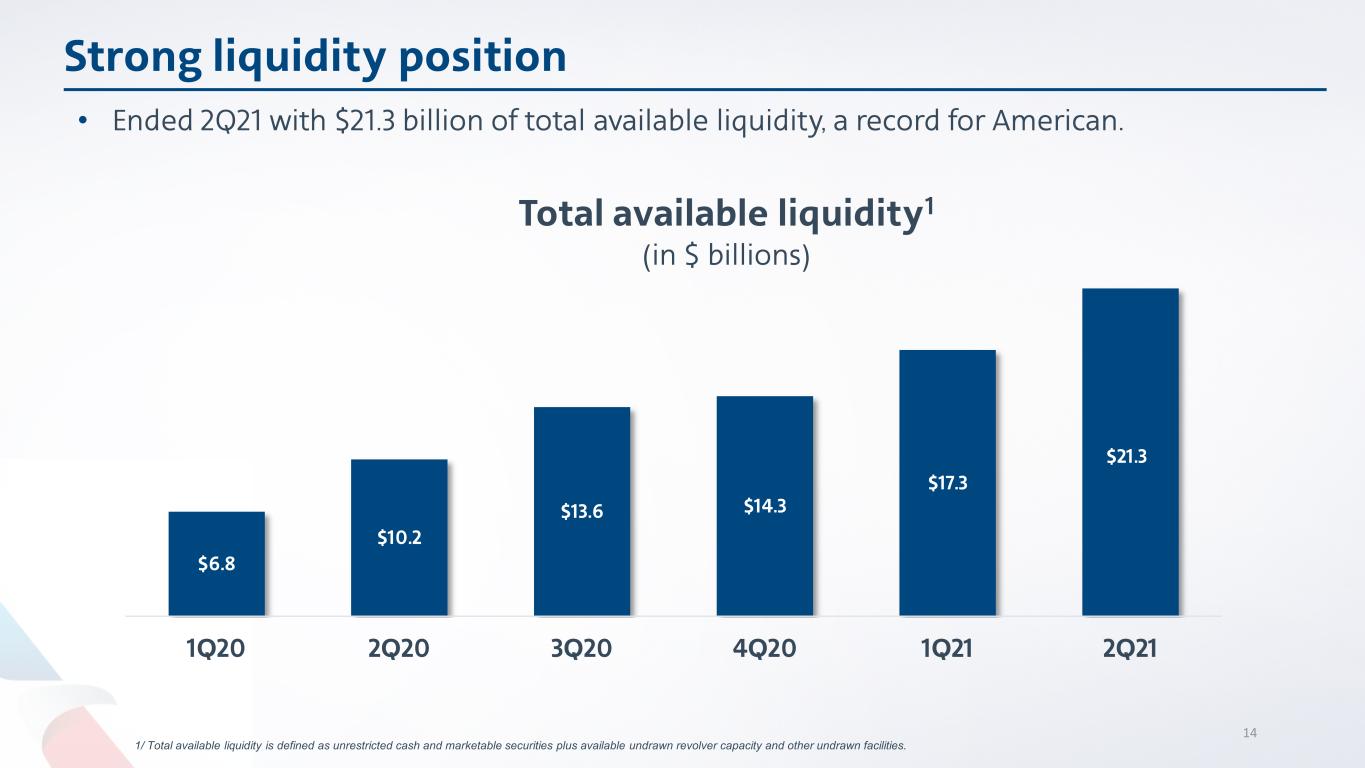
•Ended the second quarter with approximately $21.3 billion of total available liquidity, a record for the Company.
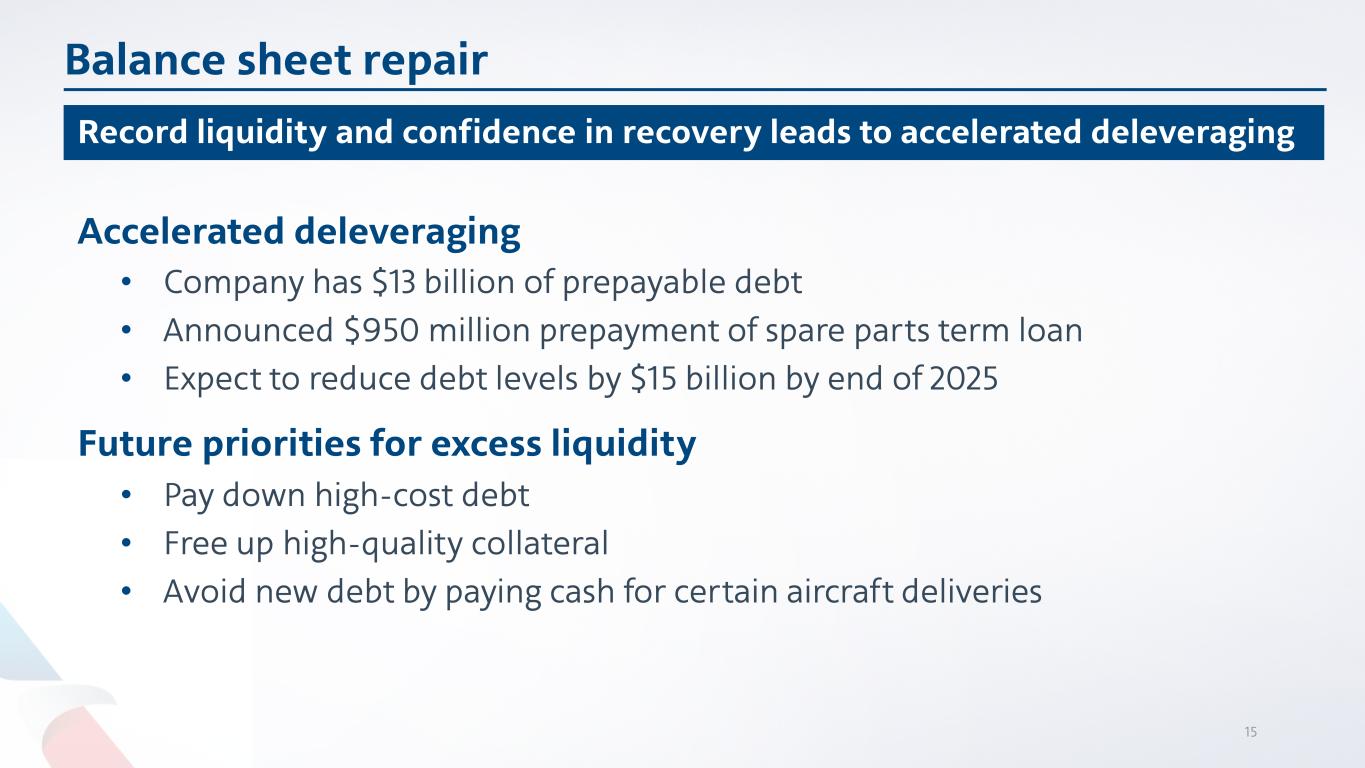
•Accelerated the deleveraging process with prepayment of $950 million spare parts term loan.
•Company plans to pay down approximately $15 billion of debt by the end of 2025.
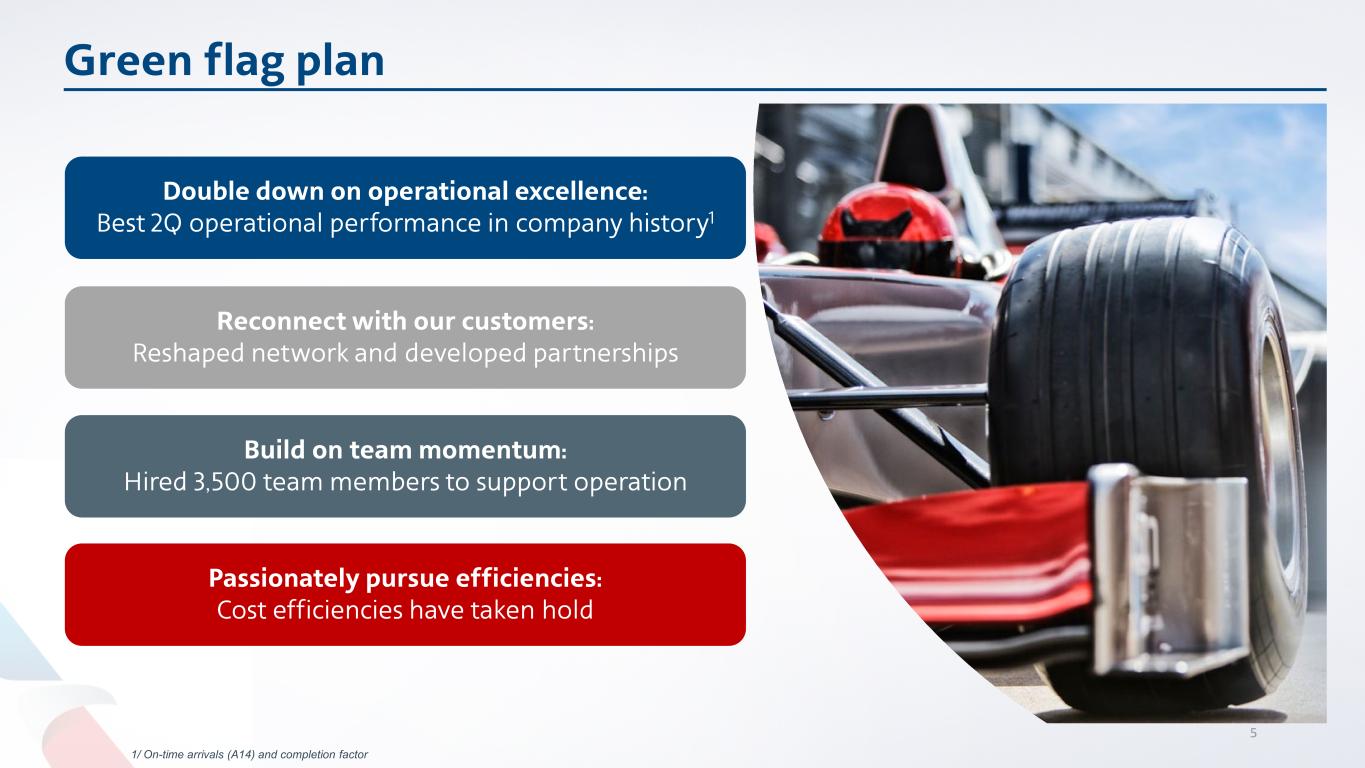
“We have taken a number of steps to solidify our business through our Green Flag Plan and it shows in our second-quarter results,” said American’s Chairman and CEO Doug Parker. “We have reshaped our network, simplified our fleet and made our cost structure more efficient, all to create an airline that will outperform competitors and deliver for customers. The green flag has dropped and we are ready thanks to the tremendous efforts and dedication of the American Airlines team.”
American is committed to strengthening its business and returning to profitability by focusing on its three strategic objectives: Create a world-class customer experience, make culture a competitive advantage and build American to thrive forever.
To create a world-class customer experience, American:
•Plans to operate more than 150 new routes this summer, including several new destinations and greater connectivity in Miami, Austin, Texas, and Orlando, Florida. During the summer season, American expects to fly more than 90% of its domestic seat capacity and 80% of its international seat capacity, in each case as compared to 2019.
•Scheduled 10 new domestic and four new international destinations from Austin for this fall as a result of increased customer demand. American and its partners will offer the most options in Austin this fall, with nearly 100 peak day departures.
American Airlines Reports Second-Quarter 2021 Financial Results
July 22, 2021
Page 2
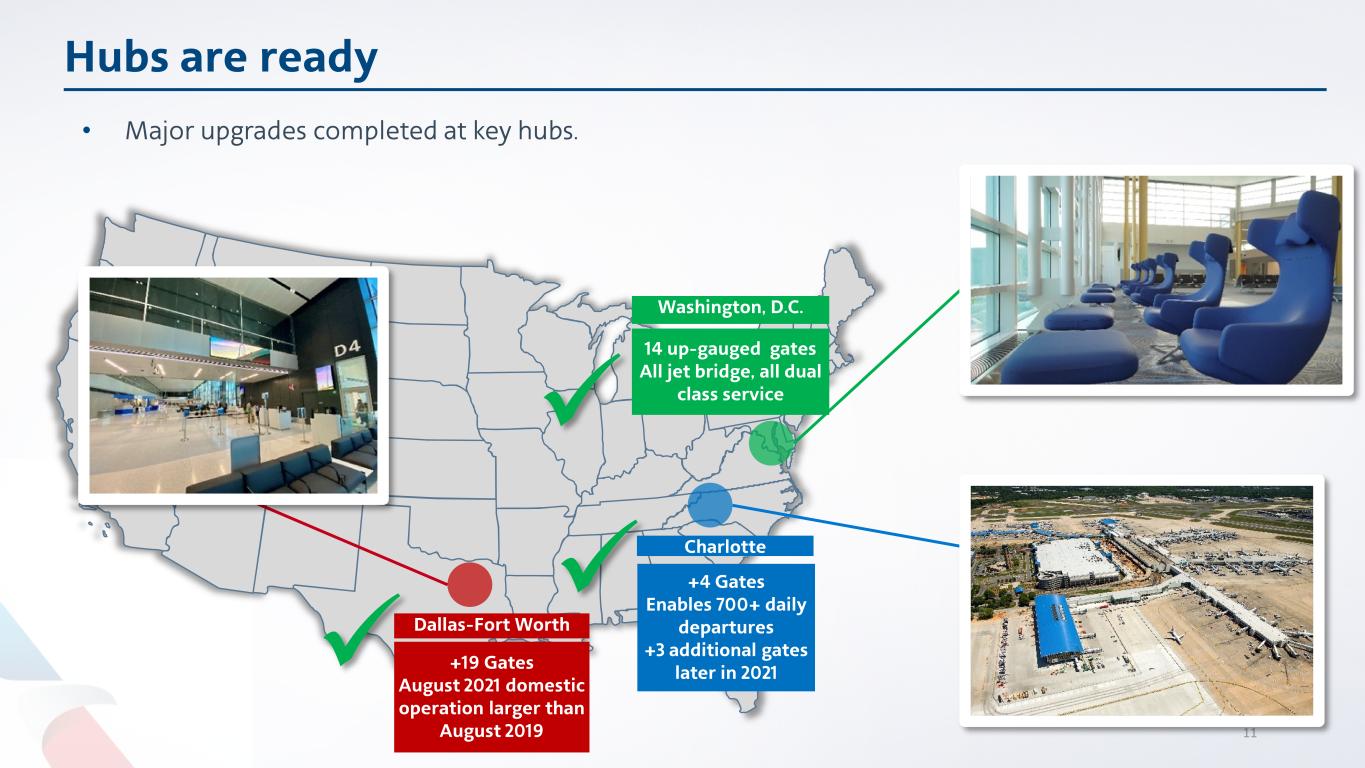
•Transitioned regional flight operations at Reagan National Airport from Gate 35X to a new 14-gate concourse, providing customers with a range of new amenities, including an all dual-class operation.
•Continued to launch COVID-19 testing tools to make flying safer and easier, including self-administered and packable home tests.
•Worked with VeriFLY to expand the app's capabilities to include COVID-19 vaccination verification, which is now available in 11 countries, with more planned in the third quarter. Customer usage of VeriFLY has quadrupled since the first quarter and the app can be used at expedited check-in lanes at most U.S. hub airports.
•Introduced Five Star Essentials at Charlotte Douglas International Airport, Dallas Fort Worth International Airport and Miami International Airport. The service provides an extra set of hands during the customer journey from check-in to the gate.
•Continued to welcome back customers to Admirals Club lounges across the system with new signature menu offerings and the expansion of innovative touchless technology. All Admirals Club lounges will reopen by the end of August and American’s Flagship Lounge locations will start reopening this fall.
•Reintroduced full beverage service in all domestic premium cabins and resumed offering canned drinks, juice and water in the main cabin.
•Revamped its premium cabin onboard amenity kits in partnership with Shinola and D.S. & Durga, brands celebrated for thoughtful design and creativity.
•Refreshed its inflight entertainment offerings by adding new lifestyle entertainment choices with free access to Rosetta Stone and Skillshare, making it the first U.S. airline to tap into online/remote learning from 35,000 feet.
To make culture a competitive advantage, American:
•Fortified its staffing by completing all required recall pilot training and bringing back more than 3,000 team members from leaves — with thousands more flight attendants returning from leaves this fall. American has hired nearly 3,500 new team members so far in 2021 and plans to hire 350 pilots this year and more than 1,000 pilots and 800 flight attendants in 2022.
•Donated 10 million AAdvantage® miles to Make-A-Wish, the organization that creates life-changing wishes for children with critical illnesses, to help grant 95 wishes, in honor of American’s 95th birthday.
•Initiated a new partnership with the National Park Foundation to encourage exploration of some of the country’s most iconic natural wonders, historic sites, and cultural treasures, and to connect customers with opportunities to support the future of America’s national parks. Customers donated more than 37 million AAdvantage miles to the National Park Foundation through the airline’s new Miles for Our Planet initiative.
•Raised nearly $1.5 million in support of the American Red Cross and Red Crescent Societies’ efforts to fight the COVID-19 pandemic around the world, including in Brazil, India and other countries in need of assistance to battle the devastating virus. The airline and more than 11,000 AAdvantage members raised the full amount in less than one month.
•Partnered with United Way of Miami-Dade to provide travel assistance and help reunite families that were impacted by the tragic building collapse in Surfside, Florida.
American Airlines Reports Second-Quarter 2021 Financial Results
July 22, 2021
Page 3
To build American to thrive forever, American:
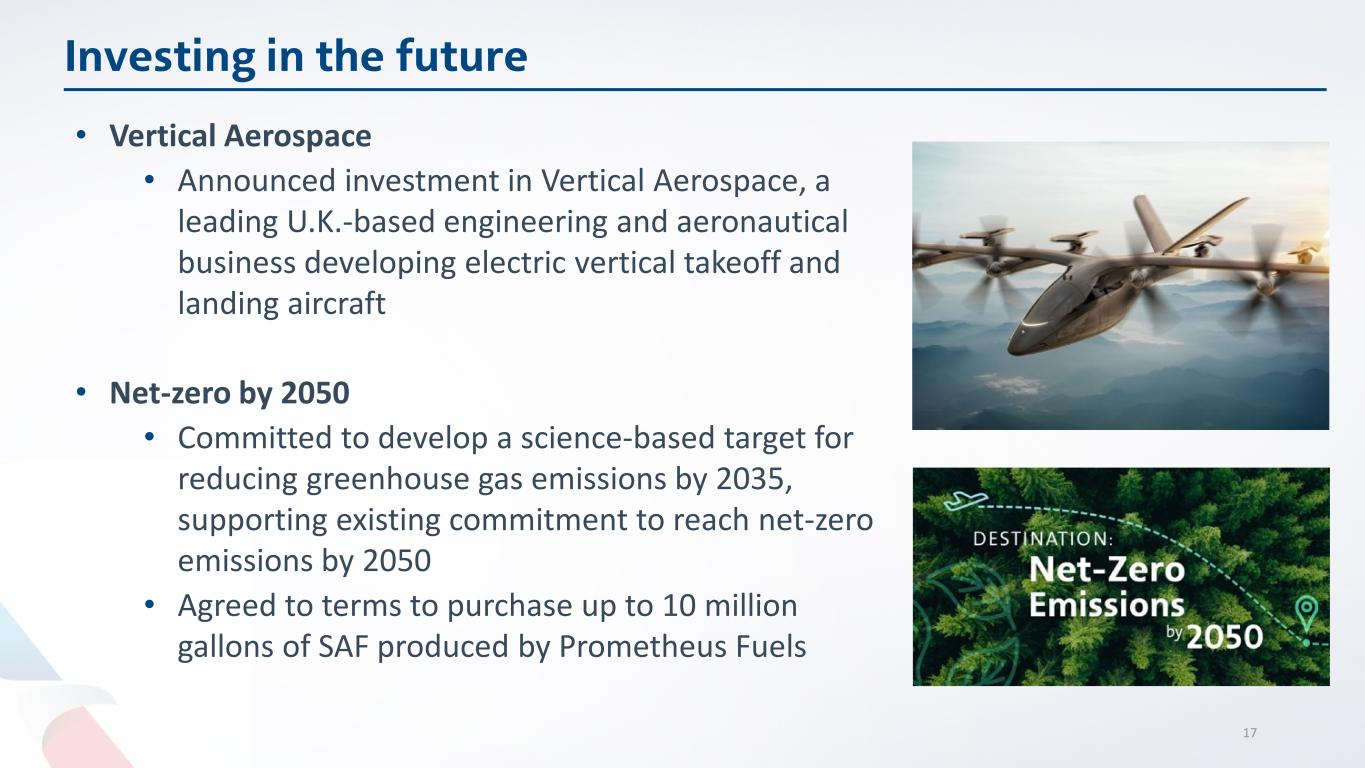
•Committed to develop a science-based target for reducing its greenhouse gas emissions by 2035, supporting the airline’s existing commitment to reach net-zero emissions by 2050. American also agreed to terms to purchase up to 10 million gallons of carbon-neutral sustainable aviation fuel (SAF) produced by Prometheus Fuels, which uses a novel process to make net zero carbon transportation fuels, including SAF.
•Announced investment in Vertical Aerospace, a leading U.K.-based engineering and aeronautical business developing electric vertical takeoff and landing aircraft. With the investment, American is demonstrating its focus on emerging technologies to reduce carbon emissions and investing in innovative ways that could improve the customer journey.
•During the second quarter, American had debt amortization and prepayments of approximately $985 million.
Liquidity and balance sheet
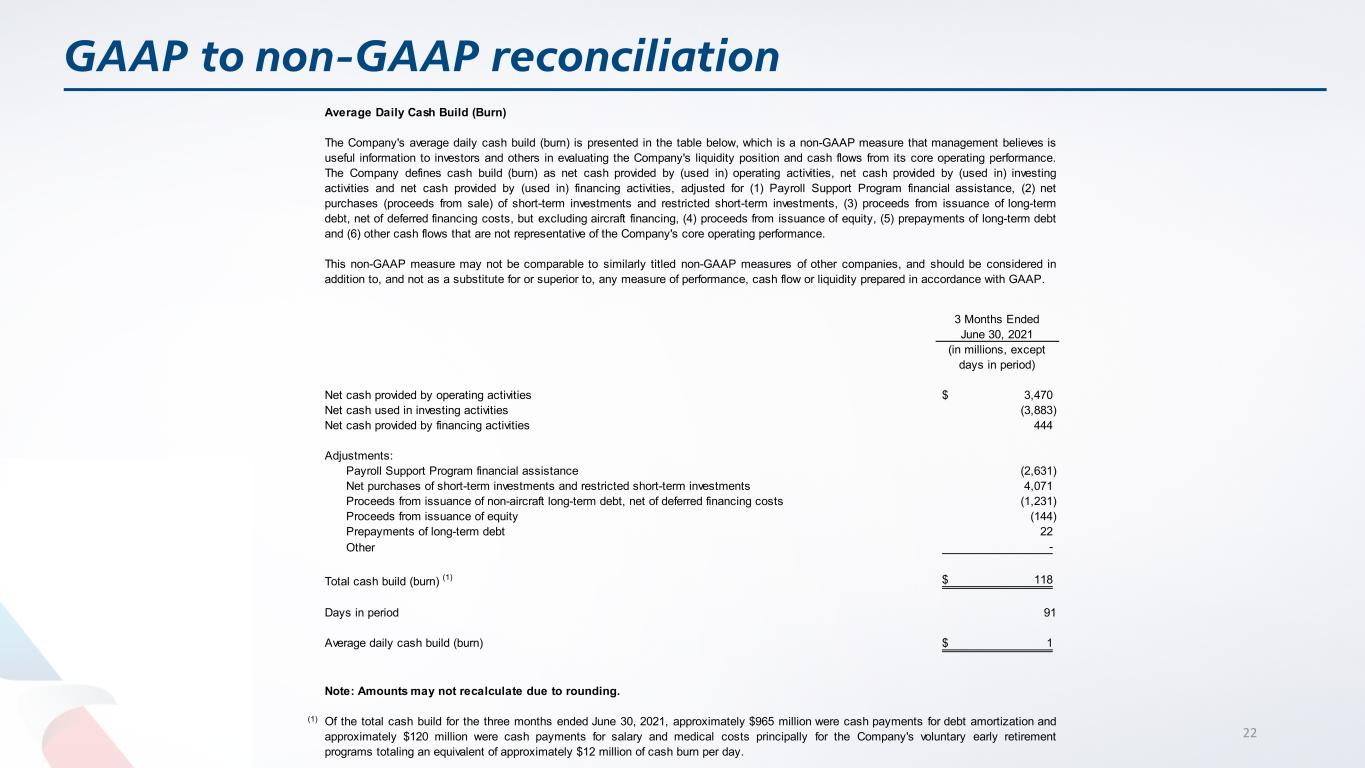
The Company’s daily cash burn rate turned positive for the second quarter to a cash build rate of approximately $1 million per day2. American ended the second quarter with a record of approximately $21.3 billion of total available liquidity. The Company expects to keep near-term liquidity at elevated levels but expects to step down its target liquidity to approximately $10 billion to $12 billion in 2022.
American is committed to improving its balance sheet. The Company now expects to reduce its debt by more than $15 billion by the end of 2025 versus its previous guidance of $8 billion to $10 billion. American plans to accomplish this objective through naturally occurring amortization, by using excess cash and free cash flow to pay down prepayable debt, and by potentially using cash instead of debt for certain future aircraft deliveries.
As evidence of the Company’s commitment to delever and its confidence in the future, today American is prepaying the entirety of its $950 million spare parts term loan that was scheduled to mature in April 2023.
Network and partnerships
American and JetBlue continue to roll out benefits for customers to create a seamless customer experience. Starting this fall, AAdvantage elite and TrueBlue Mosaic members will also begin to enjoy benefits across both carriers. This next phase of benefits will include priority check-in, security and boarding, plus up to two complimentary checked bags. American’s AAdvantage members and JetBlue’s TrueBlue members already earn miles or points traveling on either carrier. AAdvantage is now the only loyalty program that allows elite status-earning opportunities when flying across three U.S. carriers — American, JetBlue and Alaska Airlines.
As a result of American’s Northeast Alliance with JetBlue, New York and Boston travelers are seeing significantly expanded travel opportunities with new nonstop service and additional codeshare routes. As part of the alliance, American and JetBlue will operate more than 700 daily flights from New York and Boston this winter, giving customers more choice than any other airline can offer. Additionally, customers traveling on a joint American-JetBlue itinerary will now experience the fastest secure side connecter at New York — JFK and an industry-leading network. Expansion of the airline’s network will provide better global connectivity for growing markets like Austin, Texas, and Nashville, Tennessee.
American Airlines Reports Second-Quarter 2021 Financial Results
July 22, 2021
Page 4
With American’s extensive network, partnerships and membership in oneworld, customers returning to travel have access to an unmatched global network.
Guidance and investor update
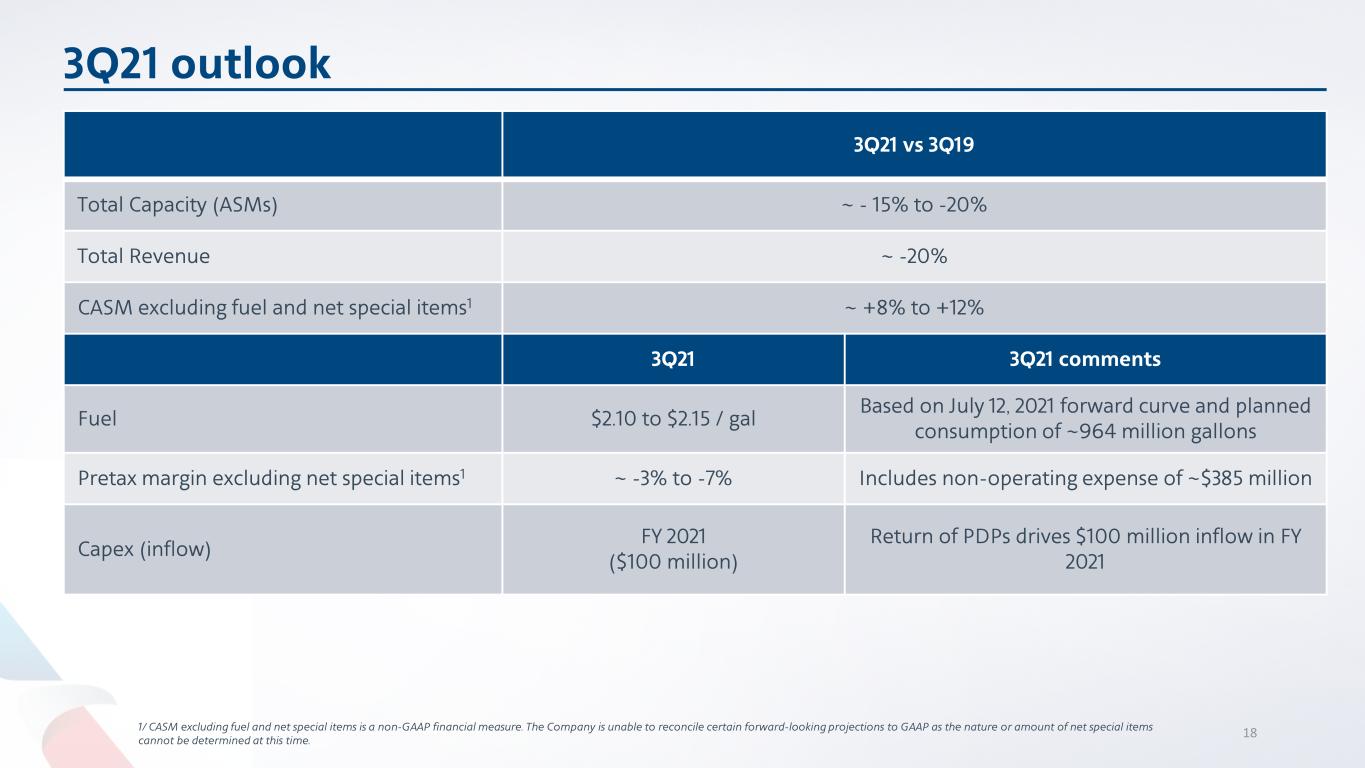
American will continue to match its forward capacity with observed bookings trends. Based on current trends, the Company expects its third-quarter capacity to be down approximately 15% to 20% compared to the third quarter of 2019. American expects its third-quarter total revenue to be down approximately 20% versus the third quarter of 2019. The Company also expects its third quarter pre-tax margin excluding net special items will be between negative 3% and negative 7%3.
For additional financial forecasting detail, please refer to the Company’s investor update, filed with this press release with the SEC on Form 8-K. This filing will be available at
aa.com/investorrelations.
Conference call and webcast details
The Company will conduct a live audio webcast of its financial results conference call at 7:30 a.m. CDT today. The call will be available to the public on a listen-only basis at
aa.com/investorrelations. An archive of the webcast will be available on the website through at least Aug. 22.
Notes
See the accompanying notes in the Financial Tables section of this press release for further explanation, including a reconciliation of all GAAP to non-GAAP financial information.
1.The Company recognized $1.4 billion of net special credits before the effect of taxes in the second quarter of 2021 principally related to the financial assistance received pursuant to Payroll Support Program Agreements.
2.A reconciliation of this calculation can be found in the tables that follow.
3.American is unable to reconcile certain forward-looking projections to GAAP, as the nature or amount of net special items cannot be determined at this time.
About American Airlines Group
American's purpose is to care for people on life’s journey. Shares of American Airlines Group Inc. trade on Nasdaq under the ticker symbol AAL and the Company’s stock is included in the S&P 500. Learn more about what’s happening at American by visiting news.aa.com and connect with American on Twitter @AmericanAir and at Facebook.com/AmericanAirlines.
American Airlines Reports Second-Quarter 2021 Financial Results
July 22, 2021
Page 5
Cautionary statement regarding forward-looking statements and information
Certain of the statements contained in this report should be considered forward-looking statements within the meaning of the Securities Act, the Exchange Act and the Private Securities Litigation Reform Act of 1995. These forward-looking statements may be identified by words such as “may,” “will,” “expect,” “intend,” “anticipate,” “believe,” “estimate,” “plan,” “project,” “could,” “should,” “would,” “continue,” “seek,” “target,” “guidance,” “outlook,” “if current trends continue,” “optimistic,” “forecast” and other similar words. Such statements include, but are not limited to, statements about the Company’s plans, objectives, expectations, intentions, estimates and strategies for the future, and other statements that are not historical facts. These forward-looking statements are based on the Company’s current objectives, beliefs and expectations, and they are subject to significant risks and uncertainties that may cause actual results and financial position and timing of certain events to differ materially from the information in the forward-looking statements. These risks and uncertainties include, but are not limited to, those set forth herein as well as in the Company’s Quarterly Report on Form 10-Q for the quarter ended June 30, 2021 (especially in Part I, Item 2. Management’s Discussion and Analysis of Financial Condition and Results of Operations and Part II, Item 1A. Risk Factors), and other risks and uncertainties listed from time to time in the Company’s other filings with the Securities and Exchange Commission. In particular, the consequences of the coronavirus outbreak to economic conditions and the travel industry in general and the financial position and operating results of the Company in particular have been material, are changing rapidly, and cannot be predicted. Additionally, there may be other factors of which the Company is not currently aware that may affect matters discussed in the forward-looking statements and may also cause actual results to differ materially from those discussed. The Company does not assume any obligation to publicly update or supplement any forward-looking statement to reflect actual results, changes in assumptions or changes in other factors affecting these forward-looking statements other than as required by law. Any forward-looking statements speak only as of the date hereof or as of the dates indicated in the statement.
American Airlines Reports Second-Quarter 2021 Financial Results
July 22, 2021
Page 6
American Airlines Group Inc.
Condensed Consolidated Statements of Operations
(In millions, except share and per share amounts)
(Unaudited)
| 3 Months Ended June 30, | Percent Increase (Decrease) | 6 Months Ended June 30, | Percent Increase (Decrease) | ||||||||||||||||||||||||||||||||
| 2021 | 2020 (1) | 2021 | 2020 (1) | ||||||||||||||||||||||||||||||||
| Operating revenues: | |||||||||||||||||||||||||||||||||||
| Passenger | $ | 6,545 | $ | 1,108 | nm | (2) | $ | 9,724 | $ | 8,788 | 10.7 | ||||||||||||||||||||||||
| Cargo | 326 | 130 | nm | 641 | 277 | nm | |||||||||||||||||||||||||||||
| Other | 607 | 384 | 57.9 | 1,121 | 1,072 | 4.5 | |||||||||||||||||||||||||||||
| Total operating revenues | 7,478 | 1,622 | nm | 11,486 | 10,137 | 13.3 | |||||||||||||||||||||||||||||
| Operating expenses: | |||||||||||||||||||||||||||||||||||
| Aircraft fuel and related taxes | 1,611 | 309 | nm | 2,644 | 2,092 | 26.4 | |||||||||||||||||||||||||||||
| Salaries, wages and benefits | 2,862 | 2,610 | 9.6 | 5,593 | 5,830 | (4.1) | |||||||||||||||||||||||||||||
| Regional expenses: | |||||||||||||||||||||||||||||||||||
| Regional operating expenses | 558 | 408 | 37.1 | 1,102 | 1,464 | (24.7) | |||||||||||||||||||||||||||||
| Regional depreciation and amortization | 77 | 84 | (8.2) | 159 | 168 | (5.5) | |||||||||||||||||||||||||||||
| Maintenance, materials and repairs | 459 | 287 | 59.9 | 835 | 915 | (8.8) | |||||||||||||||||||||||||||||
| Other rent and landing fees | 686 | 413 | 66.2 | 1,256 | 1,024 | 22.7 | |||||||||||||||||||||||||||||
| Aircraft rent | 356 | 334 | 6.4 | 706 | 669 | 5.6 | |||||||||||||||||||||||||||||
| Selling expenses | 277 | 57 | nm | 427 | 442 | (3.4) | |||||||||||||||||||||||||||||
| Depreciation and amortization | 481 | 499 | (3.6) | 959 | 1,059 | (9.4) | |||||||||||||||||||||||||||||
| Special items, net | (1,288) | (1,494) | (13.8) | (2,996) | (362) | nm | |||||||||||||||||||||||||||||
| Other | 958 | 601 | 59.6 | 1,675 | 1,870 | (10.5) | |||||||||||||||||||||||||||||
| Total operating expenses | 7,037 | 4,108 | 71.3 | 12,360 | 15,171 | (18.5) | |||||||||||||||||||||||||||||
| Operating income (loss) | 441 | (2,486) | nm | (874) | (5,034) | (82.6) | |||||||||||||||||||||||||||||
| Nonoperating income (expense): | |||||||||||||||||||||||||||||||||||
| Interest income | 5 | 10 | (50.7) | 8 | 31 | (73.2) | |||||||||||||||||||||||||||||
| Interest expense, net | (486) | (254) | 91.0 | (856) | (512) | 67.3 | |||||||||||||||||||||||||||||
| Other income (expense), net | 49 | 71 | (31.1) | 158 | (34) | nm | |||||||||||||||||||||||||||||
| Total nonoperating expense, net | (432) | (173) | nm | (690) | (515) | 34.2 | |||||||||||||||||||||||||||||
| Income (loss) before income taxes | 9 | (2,659) | nm | (1,564) | (5,549) | (71.8) | |||||||||||||||||||||||||||||
| Income tax benefit | (10) | (592) | (98.4) | (333) | (1,241) | (73.1) | |||||||||||||||||||||||||||||
| Net income (loss) | $ | 19 | $ | (2,067) | nm | $ | (1,231) | $ | (4,308) | (71.4) | |||||||||||||||||||||||||
| Earnings (loss) per common share: | |||||||||||||||||||||||||||||||||||
| Basic | $ | 0.03 | $ | (4.82) | $ | (1.92) | $ | (10.08) | |||||||||||||||||||||||||||
| Diluted | $ | 0.03 | $ | (4.82) | $ | (1.92) | $ | (10.08) | |||||||||||||||||||||||||||
| Weighted average shares outstanding (in thousands): | |||||||||||||||||||||||||||||||||||
| Basic | 644,123 | 428,807 | 639,366 | 427,260 | |||||||||||||||||||||||||||||||
| Diluted | 656,372 | 428,807 | 639,366 | 427,260 | |||||||||||||||||||||||||||||||
Note: Percent change may not recalculate due to rounding.
(1)Beginning in the first quarter of 2021, aircraft fuel and related taxes as well as certain salaries, wages and benefits, other rent and landing fees, selling and other expenses are no longer allocated to regional expenses on the Company's condensed consolidated statements of operations. The three and six months ended June 30, 2020 condensed consolidated statements of operations have been recast to conform to the 2021 presentation. This statement of operations presentation change has no impact on total operating expenses or net loss.
(2)Not meaningful or greater than 100% change.
American Airlines Reports Second-Quarter 2021 Financial Results
July 22, 2021
Page 7
American Airlines Group Inc.
Consolidated Operating Statistics (1)
(Unaudited)
| 3 Months Ended June 30, | Increase (Decrease) | 6 Months Ended June 30, | Increase (Decrease) | ||||||||||||||||||||||||||||||||
| 2021 | 2020 | 2021 | 2020 | ||||||||||||||||||||||||||||||||
| Revenue passenger miles (millions) | 42,022 | 7,231 | nm % | 64,486 | 52,402 | 23.1 % | |||||||||||||||||||||||||||||
| Available seat miles (ASM) (millions) | 54,555 | 17,081 | nm % | 92,319 | 79,180 | 16.6 % | |||||||||||||||||||||||||||||
| Passenger load factor (percent) | 77.0 | 42.3 | 34.7 pts | 69.9 | 66.2 | 3.7 pts | |||||||||||||||||||||||||||||
| Yield (cents) | 15.57 | 15.32 | 1.7 % | 15.08 | 16.77 | (10.1) % | |||||||||||||||||||||||||||||
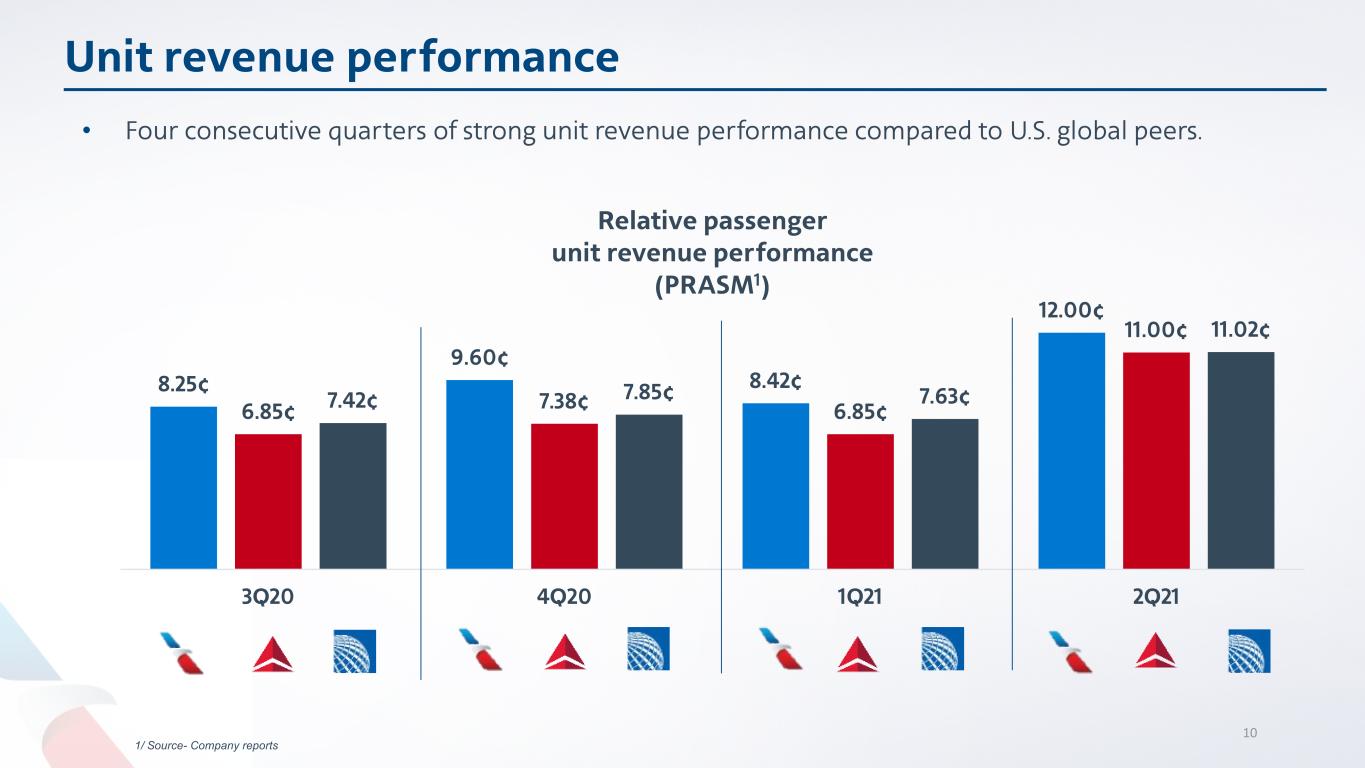
| Passenger revenue per ASM (cents) | 12.00 | 6.48 | 85.0 % | 10.53 | 11.10 | (5.1) % | |||||||||||||||||||||||||||||
| Total revenue per ASM (cents) | 13.71 | 9.50 | 44.3 % | 12.44 | 12.80 | (2.8) % | |||||||||||||||||||||||||||||
| Cargo ton miles (millions) | 555 | 176 | nm % | 1,087 | 612 | 77.5 % | |||||||||||||||||||||||||||||
| Cargo yield per ton mile (cents) | 58.86 | 73.98 | (20.4) % | 59.02 | 45.24 | 30.4 % | |||||||||||||||||||||||||||||
| Fuel consumption (gallons in millions) | 844 | 275 | nm % | 1,452 | 1,246 | 16.5 % | |||||||||||||||||||||||||||||
| Average aircraft fuel price including related taxes (dollars per gallon) | 1.91 | 1.13 | 69.5 % | 1.82 | 1.68 | 8.4 % | |||||||||||||||||||||||||||||
| Operating cost per ASM (cents) | 12.90 | 24.05 | (46.4) % | 13.39 | 19.16 | (30.1) % | |||||||||||||||||||||||||||||
| Operating cost per ASM excluding net special items (cents) | 15.57 | 33.84 | (54.0) % | 17.05 | 19.73 | (13.6) % | |||||||||||||||||||||||||||||
| Operating cost per ASM excluding net special items and fuel (cents) | 12.61 | 32.04 | (60.6) % | 14.18 | 17.08 | (17.0) % | |||||||||||||||||||||||||||||
| Passenger enplanements (thousands) | 44,019 | 8,371 | nm % | 68,256 | 50,573 | 35.0 % | |||||||||||||||||||||||||||||
| Departures (thousands): | |||||||||||||||||||||||||||||||||||
| Mainline | 220 | 81 | nm % | 372 | 333 | 11.8 % | |||||||||||||||||||||||||||||
| Regional | 247 | 103 | nm % | 433 | 383 | 13.0 % | |||||||||||||||||||||||||||||
| Total | 467 | 184 | nm % | 805 | 716 | 12.4 % | |||||||||||||||||||||||||||||
| Average stage length (miles): | |||||||||||||||||||||||||||||||||||
| Mainline | 1,172 | 1,068 | 9.8 % | 1,186 | 1,132 | 4.7 % | |||||||||||||||||||||||||||||
| Regional | 483 | 482 | 0.1 % | 492 | 473 | 4.2 % | |||||||||||||||||||||||||||||
| Total | 808 | 738 | 9.3 % | 813 | 779 | 4.3 % | |||||||||||||||||||||||||||||
| Aircraft at end of period: | |||||||||||||||||||||||||||||||||||
Mainline (2) | 854 | 849 | 0.6 % | 854 | 849 | 0.6 % | |||||||||||||||||||||||||||||
Regional (3) | 559 | 545 | 2.6 % | 559 | 545 | 2.6 % | |||||||||||||||||||||||||||||
| Total | 1,413 | 1,394 | 1.4 % | 1,413 | 1,394 | 1.4 % | |||||||||||||||||||||||||||||
| Full-time equivalent employees at end of period: | |||||||||||||||||||||||||||||||||||
| Mainline | 91,100 | 86,000 | 5.9 % | 91,100 | 86,000 | 5.9 % | |||||||||||||||||||||||||||||
Regional (4) | 26,300 | 21,400 | 22.9 % | 26,300 | 21,400 | 22.9 % | |||||||||||||||||||||||||||||
| Total | 117,400 | 107,400 | 9.3 % | 117,400 | 107,400 | 9.3 % | |||||||||||||||||||||||||||||
Note: Amounts may not recalculate due to rounding.
(1)Unless otherwise noted, operating statistics include mainline and regional operations. Regional includes wholly-owned regional airline subsidiaries and operating results from capacity purchase carriers.
(2)Excludes 37 Boeing 737-800 mainline aircraft that are in temporary storage at June 30, 2021.
(3)Includes aircraft owned and leased by American as well as aircraft operated by third-party regional carriers under capacity purchase agreements. Excludes three Embraer 145 regional aircraft that are in temporary storage at June 30, 2021.
(4)Regional full-time equivalent employees only include our wholly-owned regional airline subsidiaries.
American Airlines Reports Second-Quarter 2021 Financial Results
July 22, 2021
Page 8
American Airlines Group Inc.
Consolidated Revenue Statistics by Region
(Unaudited)
| 3 Months Ended June 30, | Increase (Decrease) | 6 Months Ended June 30, | Increase (Decrease) | ||||||||||||||||||||||||||||||||
| 2021 | 2020 | 2021 | 2020 | ||||||||||||||||||||||||||||||||
Domestic (1) | |||||||||||||||||||||||||||||||||||
| Revenue passenger miles (millions) | 34,871 | 6,804 | nm % | 53,408 | 38,661 | 38.1 % | |||||||||||||||||||||||||||||
| Available seat miles (ASM) (millions) | 41,037 | 15,434 | nm % | 68,989 | 59,672 | 15.6 % | |||||||||||||||||||||||||||||
| Passenger load factor (percent) | 85.0 | 44.1 | 40.9 pts | 77.4 | 64.8 | 12.6 pts | |||||||||||||||||||||||||||||
| Passenger revenue (dollars in millions) | 5,444 | 1,027 | nm % | 8,099 | 6,806 | 19.0 % | |||||||||||||||||||||||||||||
| Yield (cents) | 15.61 | 15.09 | 3.5 % | 15.16 | 17.60 | (13.9) % | |||||||||||||||||||||||||||||
| Passenger revenue per ASM (cents) | 13.27 | 6.65 | 99.5 % | 11.74 | 11.41 | 2.9 % | |||||||||||||||||||||||||||||
Latin America (2) | |||||||||||||||||||||||||||||||||||
| Revenue passenger miles (millions) | 5,970 | 200 | nm % | 9,546 | 7,316 | 30.5 % | |||||||||||||||||||||||||||||
| Available seat miles (millions) | 8,461 | 700 | nm % | 16,326 | 9,768 | 67.1 % | |||||||||||||||||||||||||||||
| Passenger load factor (percent) | 70.6 | 28.6 | 42.0 pts | 58.5 | 74.9 | (16.4) pts | |||||||||||||||||||||||||||||
| Passenger revenue (dollars in millions) | 936 | 34 | nm % | 1,417 | 1,214 | 16.8 % | |||||||||||||||||||||||||||||
| Yield (cents) | 15.68 | 17.07 | (8.2) % | 14.85 | 16.59 | (10.5) % | |||||||||||||||||||||||||||||
| Passenger revenue per ASM (cents) | 11.06 | 4.88 | nm % | 8.68 | 12.42 | (30.1) % | |||||||||||||||||||||||||||||
| Atlantic | |||||||||||||||||||||||||||||||||||
| Revenue passenger miles (millions) | 939 | 189 | nm % | 1,139 | 4,374 | (74.0) % | |||||||||||||||||||||||||||||
| Available seat miles (millions) | 4,035 | 817 | nm % | 5,186 | 7,056 | (26.5) % | |||||||||||||||||||||||||||||
| Passenger load factor (percent) | 23.3 | 23.1 | 0.2 pts | 22.0 | 62.0 | (40.0) pts | |||||||||||||||||||||||||||||
| Passenger revenue (dollars in millions) | 125 | 42 | nm % | 147 | 565 | (74.0) % | |||||||||||||||||||||||||||||
| Yield (cents) | 13.26 | 22.28 | (40.5) % | 12.88 | 12.92 | (0.3) % | |||||||||||||||||||||||||||||
| Passenger revenue per ASM (cents) | 3.09 | 5.16 | (40.1) % | 2.83 | 8.01 | (64.7) % | |||||||||||||||||||||||||||||
| Pacific | |||||||||||||||||||||||||||||||||||
| Revenue passenger miles (millions) | 242 | 38 | nm % | 393 | 2,051 | (80.9) % | |||||||||||||||||||||||||||||
| Available seat miles (millions) | 1,022 | 130 | nm % | 1,818 | 2,684 | (32.3) % | |||||||||||||||||||||||||||||
| Passenger load factor (percent) | 23.7 | 29.0 | (5.3) pts | 21.6 | 76.4 | (54.8) pts | |||||||||||||||||||||||||||||
| Passenger revenue (dollars in millions) | 40 | 5 | nm % | 61 | 203 | (70.0) % | |||||||||||||||||||||||||||||
| Yield (cents) | 16.71 | 12.61 | 32.6 % | 15.49 | 9.89 | 56.6 % | |||||||||||||||||||||||||||||
| Passenger revenue per ASM (cents) | 3.96 | 3.65 | 8.4 % | 3.35 | 7.56 | (55.7) % | |||||||||||||||||||||||||||||
| Total International | |||||||||||||||||||||||||||||||||||
| Revenue passenger miles (millions) | 7,151 | 427 | nm % | 11,078 | 13,741 | (19.4) % | |||||||||||||||||||||||||||||
| Available seat miles (millions) | 13,518 | 1,647 | nm % | 23,330 | 19,508 | 19.6 % | |||||||||||||||||||||||||||||
| Passenger load factor (percent) | 52.9 | 25.9 | 27.0 pts | 47.5 | 70.4 | (22.9) pts | |||||||||||||||||||||||||||||
| Passenger revenue (dollars in millions) | 1,101 | 81 | nm % | 1,625 | 1,982 | (18.0) % | |||||||||||||||||||||||||||||
| Yield (cents) | 15.39 | 18.98 | (18.9) % | 14.67 | 14.42 | 1.7 % | |||||||||||||||||||||||||||||
| Passenger revenue per ASM (cents) | 8.14 | 4.92 | 65.5 % | 6.97 | 10.16 | (31.4) % | |||||||||||||||||||||||||||||
Note: Amounts may not recalculate due to rounding.
(1)Domestic results include Canada, Puerto Rico and U.S. Virgin Islands.
(2)Latin America results include the Caribbean.
American Airlines Reports Second-Quarter 2021 Financial Results
July 22, 2021
Page 9
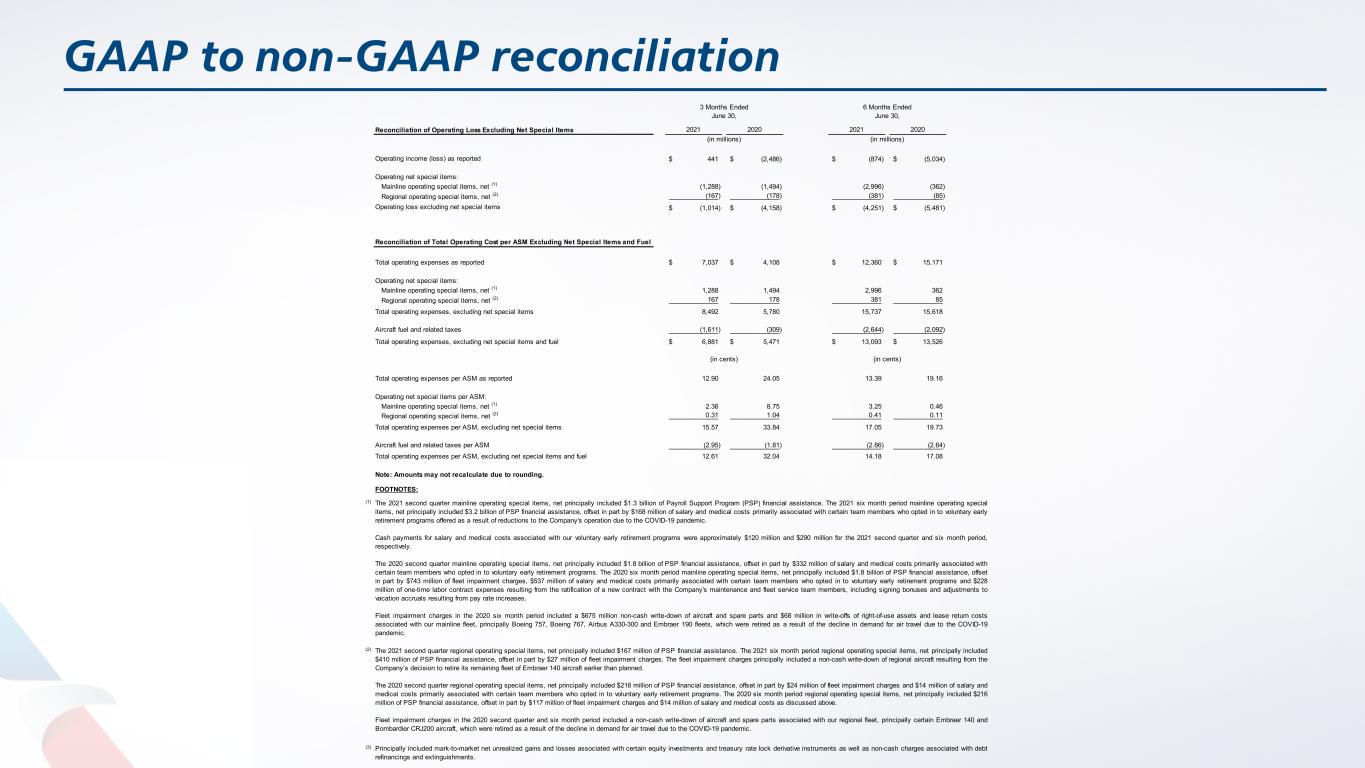
Reconciliation of GAAP Financial Information to Non-GAAP Financial Information
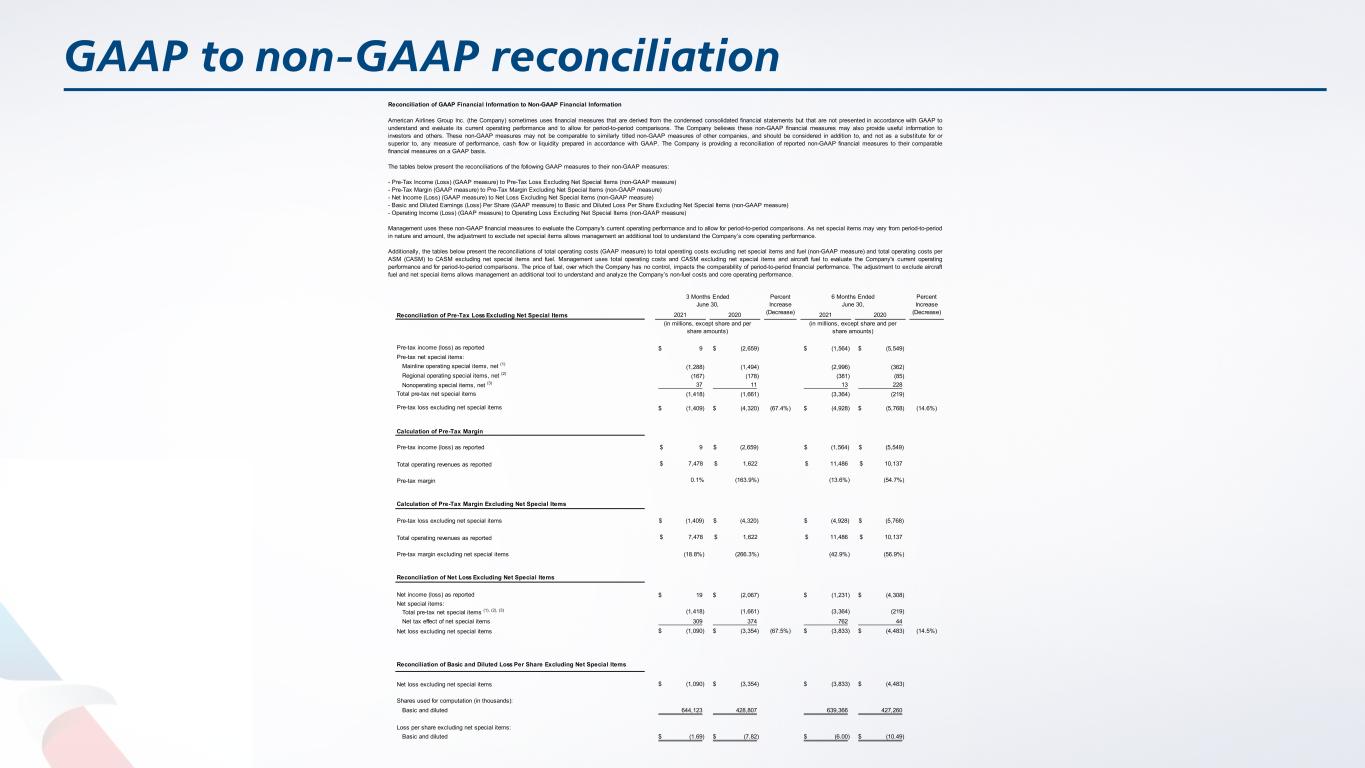
American Airlines Group Inc. (the Company) sometimes uses financial measures that are derived from the condensed consolidated financial statements but that are not presented in accordance with GAAP to understand and evaluate its current operating performance and to allow for period-to-period comparisons. The Company believes these non-GAAP financial measures may also provide useful information to investors and others. These non-GAAP measures may not be comparable to similarly titled non-GAAP measures of other companies, and should be considered in addition to, and not as a substitute for or superior to, any measure of performance, cash flow or liquidity prepared in accordance with GAAP. The Company is providing a reconciliation of reported non-GAAP financial measures to their comparable financial measures on a GAAP basis.
The tables below present the reconciliations of the following GAAP measures to their non-GAAP measures:
–Pre-Tax Income (Loss) (GAAP measure) to Pre-Tax Loss Excluding Net Special Items (non-GAAP measure)
–Pre-Tax Margin (GAAP measure) to Pre-Tax Margin Excluding Net Special Items (non-GAAP measure)
–Net Income (Loss) (GAAP measure) to Net Loss Excluding Net Special Items (non-GAAP measure)
–Basic and Diluted Earnings (Loss) Per Share (GAAP measure) to Basic and Diluted Loss Per Share Excluding Net Special Items (non-GAAP measure)
–Operating Income (Loss) (GAAP measure) to Operating Loss Excluding Net Special Items (non-GAAP measure)
Management uses these non-GAAP financial measures to evaluate the Company's current operating performance and to allow for period-to-period comparisons. As net special items may vary from period-to-period in nature and amount, the adjustment to exclude net special items allows management an additional tool to understand the Company’s core operating performance.
Additionally, the tables below present the reconciliations of total operating costs (GAAP measure) to total operating costs excluding net special items and fuel (non-GAAP measure) and total operating costs per ASM (CASM) to CASM excluding net special items and fuel. Management uses total operating costs and CASM excluding net special items and aircraft fuel to evaluate the Company's current operating performance and for period-to-period comparisons. The price of fuel, over which the Company has no control, impacts the comparability of period-to-period financial performance. The adjustment to exclude aircraft fuel and net special items allows management an additional tool to understand and analyze the Company’s non-fuel costs and core operating performance.
| Reconciliation of Pre-Tax Loss Excluding Net Special Items | 3 Months Ended June 30, | Percent Increase (Decrease) | 6 Months Ended June 30, | Percent Increase (Decrease) | ||||||||||||||||||||||||||||||||||
| 2021 | 2020 | 2021 | 2020 | |||||||||||||||||||||||||||||||||||
| (in millions, except share and per share amounts) | (in millions, except share and per share amounts) | |||||||||||||||||||||||||||||||||||||
| Pre-tax income (loss) as reported | $ | 9 | $ | (2,659) | $ | (1,564) | $ | (5,549) | ||||||||||||||||||||||||||||||
| Pre-tax net special items: | ||||||||||||||||||||||||||||||||||||||
Mainline operating special items, net (1) | (1,288) | (1,494) | (2,996) | (362) | ||||||||||||||||||||||||||||||||||
Regional operating special items, net (2) | (167) | (178) | (381) | (85) | ||||||||||||||||||||||||||||||||||
Nonoperating special items, net (3) | 37 | 11 | 13 | 228 | ||||||||||||||||||||||||||||||||||
| Total pre-tax net special items | (1,418) | (1,661) | (3,364) | (219) | ||||||||||||||||||||||||||||||||||
| Pre-tax loss excluding net special items | $ | (1,409) | $ | (4,320) | (67.4%) | $ | (4,928) | $ | (5,768) | (14.6%) | ||||||||||||||||||||||||||||
| Calculation of Pre-Tax Margin | ||||||||||||||||||||||||||||||||||||||
| Pre-tax income (loss) as reported | $ | 9 | $ | (2,659) | $ | (1,564) | $ | (5,549) | ||||||||||||||||||||||||||||||
| Total operating revenues as reported | $ | 7,478 | $ | 1,622 | $ | 11,486 | $ | 10,137 | ||||||||||||||||||||||||||||||
| Pre-tax margin | 0.1% | (163.9%) | (13.6%) | (54.7%) | ||||||||||||||||||||||||||||||||||
| Calculation of Pre-Tax Margin Excluding Net Special Items | ||||||||||||||||||||||||||||||||||||||
| Pre-tax loss excluding net special items | $ | (1,409) | $ | (4,320) | $ | (4,928) | $ | (5,768) | ||||||||||||||||||||||||||||||
| Total operating revenues as reported | $ | 7,478 | $ | 1,622 | $ | 11,486 | $ | 10,137 | ||||||||||||||||||||||||||||||
| Pre-tax margin excluding net special items | (18.8%) | (266.3%) | (42.9%) | (56.9%) | ||||||||||||||||||||||||||||||||||
| Reconciliation of Net Loss Excluding Net Special Items | ||||||||||||||||||||||||||||||||||||||
| Net income (loss) as reported | $ | 19 | $ | (2,067) | $ | (1,231) | $ | (4,308) | ||||||||||||||||||||||||||||||
| Net special items: | ||||||||||||||||||||||||||||||||||||||
Total pre-tax net special items (1), (2), (3) | (1,418) | (1,661) | (3,364) | (219) | ||||||||||||||||||||||||||||||||||
| Net tax effect of net special items | 309 | 374 | 762 | 44 | ||||||||||||||||||||||||||||||||||
| Net loss excluding net special items | $ | (1,090) | $ | (3,354) | (67.5%) | $ | (3,833) | $ | (4,483) | (14.5%) | ||||||||||||||||||||||||||||
| Reconciliation of Basic and Diluted Loss Per Share Excluding Net Special Items | ||||||||||||||||||||||||||||||||||||||
| Net loss excluding net special items | $ | (1,090) | $ | (3,354) | $ | (3,833) | $ | (4,483) | ||||||||||||||||||||||||||||||
| Shares used for computation (in thousands): | ||||||||||||||||||||||||||||||||||||||
| Basic and diluted | 644,123 | 428,807 | 639,366 | 427,260 | ||||||||||||||||||||||||||||||||||
| Loss per share excluding net special items: | ||||||||||||||||||||||||||||||||||||||
| Basic and diluted | $ | (1.69) | $ | (7.82) | $ | (6.00) | $ | (10.49) | ||||||||||||||||||||||||||||||
American Airlines Reports Second-Quarter 2021 Financial Results
July 22, 2021
Page 10
| Reconciliation of Operating Loss Excluding Net Special Items | 3 Months Ended June 30, | 6 Months Ended June 30, | ||||||||||||||||||||||||||||||||||||
| 2021 | 2020 | 2021 | 2020 | |||||||||||||||||||||||||||||||||||
| (in millions) | (in millions) | |||||||||||||||||||||||||||||||||||||
| Operating income (loss) as reported | $ | 441 | $ | (2,486) | $ | (874) | $ | (5,034) | ||||||||||||||||||||||||||||||
| Operating net special items: | ||||||||||||||||||||||||||||||||||||||
Mainline operating special items, net (1) | (1,288) | (1,494) | (2,996) | (362) | ||||||||||||||||||||||||||||||||||
Regional operating special items, net (2) | (167) | (178) | (381) | (85) | ||||||||||||||||||||||||||||||||||
| Operating loss excluding net special items | $ | (1,014) | $ | (4,158) | $ | (4,251) | $ | (5,481) | ||||||||||||||||||||||||||||||
| Reconciliation of Total Operating Cost per ASM Excluding Net Special Items and Fuel | ||||||||||||||||||||||||||||||||||||||
| Total operating expenses as reported | $ | 7,037 | $ | 4,108 | $ | 12,360 | $ | 15,171 | ||||||||||||||||||||||||||||||
| Operating net special items: | ||||||||||||||||||||||||||||||||||||||
Mainline operating special items, net (1) | 1,288 | 1,494 | 2,996 | 362 | ||||||||||||||||||||||||||||||||||
Regional operating special items, net (2) | 167 | 178 | 381 | 85 | ||||||||||||||||||||||||||||||||||
| Total operating expenses, excluding net special items | 8,492 | 5,780 | 15,737 | 15,618 | ||||||||||||||||||||||||||||||||||
| Aircraft fuel and related taxes | (1,611) | (309) | (2,644) | (2,092) | ||||||||||||||||||||||||||||||||||
| Total operating expenses, excluding net special items and fuel | $ | 6,881 | $ | 5,471 | $ | 13,093 | $ | 13,526 | ||||||||||||||||||||||||||||||
| (in cents) | (in cents) | |||||||||||||||||||||||||||||||||||||
| Total operating expenses per ASM as reported | 12.90 | 24.05 | 13.39 | 19.16 | ||||||||||||||||||||||||||||||||||
| Operating net special items per ASM: | ||||||||||||||||||||||||||||||||||||||
Mainline operating special items, net (1) | 2.36 | 8.75 | 3.25 | 0.46 | ||||||||||||||||||||||||||||||||||
Regional operating special items, net (2) | 0.31 | 1.04 | 0.41 | 0.11 | ||||||||||||||||||||||||||||||||||
| Total operating expenses per ASM, excluding net special items | 15.57 | 33.84 | 17.05 | 19.73 | ||||||||||||||||||||||||||||||||||
| Aircraft fuel and related taxes per ASM | (2.95) | (1.81) | (2.86) | (2.64) | ||||||||||||||||||||||||||||||||||
| Total operating expenses per ASM, excluding net special items and fuel | 12.61 | 32.04 | 14.18 | 17.08 | ||||||||||||||||||||||||||||||||||
Note: Amounts may not recalculate due to rounding.
FOOTNOTES:
(1)The 2021 second quarter mainline operating special items, net principally included $1.3 billion of Payroll Support Program (PSP) financial assistance. The 2021 six month period mainline operating special items, net principally included $3.2 billion of PSP financial assistance, offset in part by $168 million of salary and medical costs primarily associated with certain team members who opted in to voluntary early retirement programs offered as a result of reductions to the Company's operation due to the COVID-19 pandemic.
Cash payments for salary and medical costs associated with our voluntary early retirement programs were approximately $120 million and $290 million for the 2021 second quarter and six month period, respectively.
The 2020 second quarter mainline operating special items, net principally included $1.8 billion of PSP financial assistance, offset in part by $332 million of salary and medical costs primarily associated with certain team members who opted in to voluntary early retirement programs. The 2020 six month period mainline operating special items, net principally included $1.8 billion of PSP financial assistance, offset in part by $743 million of fleet impairment charges, $537 million of salary and medical costs primarily associated with certain team members who opted in to voluntary early retirement programs and $228 million of one-time labor contract expenses resulting from the ratification of a new contract with the Company's maintenance and fleet service team members, including signing bonuses and adjustments to vacation accruals resulting from pay rate increases.
Fleet impairment charges in the 2020 six month period included a $675 million non-cash write-down of aircraft and spare parts and $68 million in write-offs of right-of-use assets and lease return costs associated with our mainline fleet, principally Boeing 757, Boeing 767, Airbus A330-300 and Embraer 190 fleets, which were retired as a result of the decline in demand for air travel due to the COVID-19 pandemic.
(2)The 2021 second quarter regional operating special items, net principally included $167 million of PSP financial assistance. The 2021 six month period regional operating special items, net principally included $410 million of PSP financial assistance, offset in part by $27 million of fleet impairment charges. The fleet impairment charges principally included a non-cash write-down of regional aircraft resulting from the Company’s decision to retire its remaining fleet of Embraer 140 aircraft earlier than planned.
The 2020 second quarter regional operating special items, net principally included $216 million of PSP financial assistance, offset in part by $24 million of fleet impairment charges and $14 million of salary and medical costs primarily associated with certain team members who opted in to voluntary early retirement programs. The 2020 six month period regional operating special items, net principally included $216 million of PSP financial assistance, offset in part by $117 million of fleet impairment charges and $14 million of salary and medical costs as discussed above.
Fleet impairment charges in the 2020 second quarter and six month period included a non-cash write-down of aircraft and spare parts associated with our regional fleet, principally certain Embraer 140 and Bombardier CRJ200 aircraft, which were retired as a result of the decline in demand for air travel due to the COVID-19 pandemic.
(3)Principally included mark-to-market net unrealized gains and losses associated with certain equity investments and treasury rate lock derivative instruments as well as non-cash charges associated with debt refinancings and extinguishments.
American Airlines Reports Second-Quarter 2021 Financial Results
July 22, 2021
Page 11
Average Daily Cash Build (Burn)
The Company's average daily cash build (burn) is presented in the table below, which is a non-GAAP measure that management believes is useful information to investors and others in evaluating the Company's liquidity position and cash flows from its core operating performance. The Company defines cash build (burn) as net cash provided by (used in) operating activities, net cash provided by (used in) investing activities and net cash provided by (used in) financing activities, adjusted for (1) Payroll Support Program financial assistance, (2) net purchases (proceeds from sale) of short-term investments and restricted short-term investments, (3) proceeds from issuance of long-term debt, net of deferred financing costs, but excluding aircraft financing, (4) proceeds from issuance of equity, (5) prepayments of long-term debt and (6) other cash flows that are not representative of the Company's core operating performance.
This non-GAAP measure may not be comparable to similarly titled non-GAAP measures of other companies, and should be considered in addition to, and not as a substitute for or superior to, any measure of performance, cash flow or liquidity prepared in accordance with GAAP.
| 3 Months Ended June 30, 2021 | ||||||||
| (in millions, except days in period) | ||||||||
| Net cash provided by operating activities | $ | 3,470 | ||||||
| Net cash used in investing activities | (3,883) | |||||||
| Net cash provided by financing activities | 444 | |||||||
| Adjustments: | ||||||||
| Payroll Support Program financial assistance | (2,631) | |||||||
| Net purchases of short-term investments and restricted short-term investments | 4,071 | |||||||
| Proceeds from issuance of non-aircraft long-term debt, net of deferred financing costs | (1,231) | |||||||
| Proceeds from issuance of equity | (144) | |||||||
| Prepayments of long-term debt | 22 | |||||||
| Other | — | |||||||
Total cash build (burn) (1) | $ | 118 | ||||||
| Days in period | 91 | |||||||
| Average daily cash build (burn) | $ | 1 | ||||||
Note: Amounts may not recalculate due to rounding.
(1)Of the total cash build for the three months ended June 30, 2021, approximately $965 million were cash payments for debt amortization and approximately $120 million were cash payments for salary and medical costs principally for the Company's voluntary early retirement programs totaling an equivalent of approximately $12 million of cash burn per day.
American Airlines Reports Second-Quarter 2021 Financial Results
July 22, 2021
Page 12
American Airlines Group Inc.
Condensed Consolidated Statements of Cash Flows
(In millions)(Unaudited)
| 6 Months Ended June 30, | |||||||||||
| 2021 | 2020 | ||||||||||
| Net cash provided by (used in) operating activities | $ | 3,644 | $ | (1,076) | |||||||
| Cash flows from investing activities: | |||||||||||
| Capital expenditures, net of aircraft purchase deposit returns | 118 | (1,233) | |||||||||
| Proceeds from sale-leaseback transactions | 163 | 376 | |||||||||
| Proceeds from sale of property and equipment | 161 | 148 | |||||||||
| Purchases of short-term investments | (13,840) | (7,936) | |||||||||
| Sales of short-term investments | 2,837 | 2,131 | |||||||||
| Increase in restricted short-term investments | (404) | (386) | |||||||||
| Other investing activities | (71) | (61) | |||||||||
| Net cash used in investing activities | (11,036) | (6,961) | |||||||||
| Cash flows from financing activities: | |||||||||||
| Proceeds from issuance of long-term debt | 12,096 | 9,464 | |||||||||
| Payments on long-term debt and finance leases | (5,040) | (2,477) | |||||||||
| Proceeds from issuance of equity | 460 | 1,527 | |||||||||
| Deferred financing costs | (166) | (84) | |||||||||
| Treasury stock repurchases and shares withheld for taxes pursuant to employee stock plans | (13) | (173) | |||||||||
| Dividend payments | — | (43) | |||||||||
| Other financing activities | 121 | — | |||||||||
| Net cash provided by financing activities | 7,458 | 8,214 | |||||||||
| Net increase in cash and restricted cash | 66 | 177 | |||||||||
| Cash and restricted cash at beginning of period | 399 | 290 | |||||||||
Cash and restricted cash at end of period (1) | $ | 465 | $ | 467 | |||||||
(1)The following table provides a reconciliation of cash and restricted cash to amounts reported within the condensed consolidated balance sheets:
| Cash | $ | 325 | $ | 462 | |||||||
| Restricted cash included in restricted cash and short-term investments | 140 | 5 | |||||||||
| Total cash and restricted cash | $ | 465 | $ | 467 | |||||||
American Airlines Reports Second-Quarter 2021 Financial Results
July 22, 2021
Page 13
American Airlines Group Inc.
Condensed Consolidated Balance Sheets
(In millions, except shares)
| June 30, 2021 | December 31, 2020 | ||||||||||
| (unaudited) | |||||||||||
| Assets | |||||||||||
| Current assets | |||||||||||
| Cash | $ | 325 | $ | 245 | |||||||
| Short-term investments | 17,625 | 6,619 | |||||||||
| Restricted cash and short-term investments | 999 | 609 | |||||||||
| Accounts receivable, net | 1,249 | 1,342 | |||||||||
| Aircraft fuel, spare parts and supplies, net | 1,789 | 1,614 | |||||||||
| Prepaid expenses and other | 660 | 666 | |||||||||
| Total current assets | 22,647 | 11,095 | |||||||||
| Operating property and equipment | |||||||||||
| Flight equipment | 37,577 | 37,816 | |||||||||
| Ground property and equipment | 9,132 | 9,194 | |||||||||
| Equipment purchase deposits | 714 | 1,446 | |||||||||
| Total property and equipment, at cost | 47,423 | 48,456 | |||||||||
| Less accumulated depreciation and amortization | (17,218) | (16,757) | |||||||||
| Total property and equipment, net | 30,205 | 31,699 | |||||||||
| Operating lease right-of-use assets | 7,958 | 8,039 | |||||||||
| Other assets | |||||||||||
| Goodwill | 4,091 | 4,091 | |||||||||
| Intangibles, net | 2,008 | 2,029 | |||||||||
| Deferred tax asset | 3,631 | 3,239 | |||||||||
| Other assets | 1,924 | 1,816 | |||||||||
| Total other assets | 11,654 | 11,175 | |||||||||
| Total assets | $ | 72,464 | $ | 62,008 | |||||||
| Liabilities and Stockholders’ Equity (Deficit) | |||||||||||
| Current liabilities | |||||||||||
| Current maturities of long-term debt and finance leases | $ | 2,798 | $ | 2,797 | |||||||
| Accounts payable | 2,172 | 1,196 | |||||||||
| Accrued salaries and wages | 1,580 | 1,716 | |||||||||
| Air traffic liability | 7,095 | 4,757 | |||||||||
| Loyalty program liability | 2,632 | 2,033 | |||||||||
| Operating lease liabilities | 1,587 | 1,651 | |||||||||
| Other accrued liabilities | 3,657 | 2,419 | |||||||||
| Total current liabilities | 21,521 | 16,569 | |||||||||
| Noncurrent liabilities | |||||||||||
| Long-term debt and finance leases, net of current maturities | 37,201 | 29,796 | |||||||||
| Pension and postretirement benefits | 6,627 | 7,069 | |||||||||
| Loyalty program liability | 6,674 | 7,162 | |||||||||
| Operating lease liabilities | 6,711 | 6,777 | |||||||||
| Other liabilities | 1,397 | 1,502 | |||||||||
| Total noncurrent liabilities | 58,610 | 52,306 | |||||||||
| Stockholders' equity (deficit) | |||||||||||
| Common stock, 647,446,499 shares outstanding at June 30, 2021 | 6 | 6 | |||||||||
| Additional paid-in capital | 7,200 | 6,894 | |||||||||
| Accumulated other comprehensive loss | (6,997) | (7,103) | |||||||||
| Retained deficit | (7,876) | (6,664) | |||||||||
| Total stockholders' deficit | (7,667) | (6,867) | |||||||||
| Total liabilities and stockholders’ equity (deficit) | $ | 72,464 | $ | 62,008 | |||||||