Exhibit 99.1

 | Corporate Communications | |||||||
| [email protected] | ||||||||
| Investor Relations | ||||||||
| [email protected] | ||||||||
FOR RELEASE: Thursday, July 24, 2025
AMERICAN AIRLINES REPORTS SECOND-QUARTER 2025 FINANCIAL RESULTS
FORT WORTH, Texas — American Airlines Group Inc. (NASDAQ: AAL) today reported its second-quarter 2025 financial results, including:
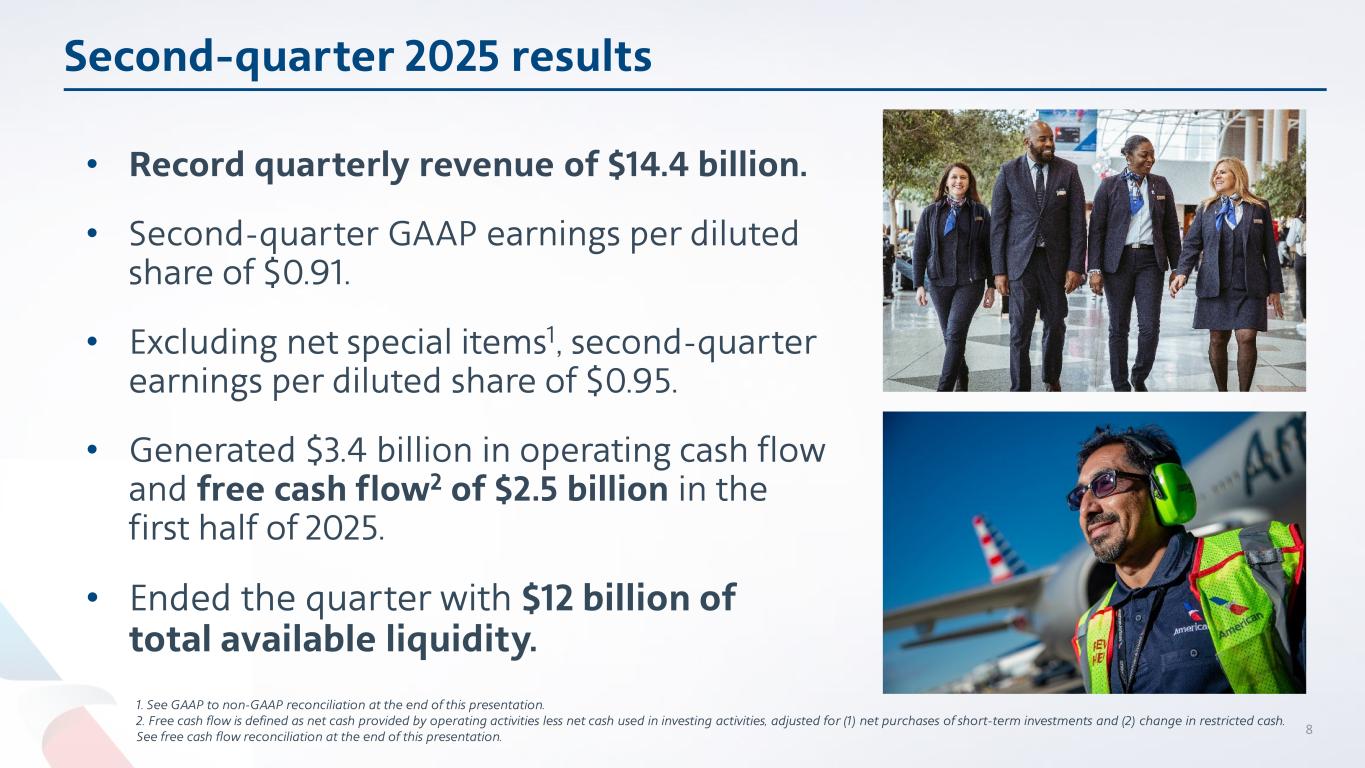
•Record quarterly revenue of $14.4 billion
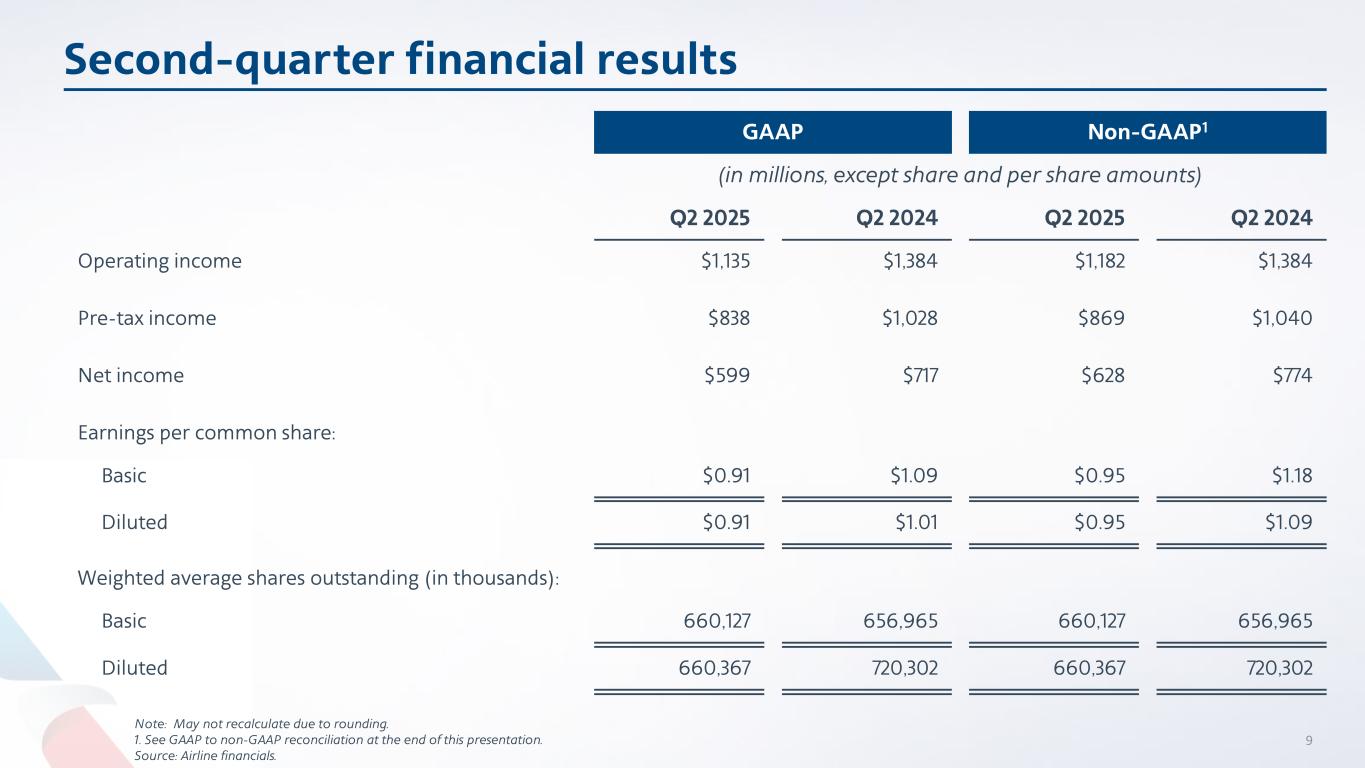
•Second-quarter GAAP net income of $599 million, or $0.91 per diluted share
•Excluding net special items1, second-quarter net income of $628 million, or $0.95 per diluted share
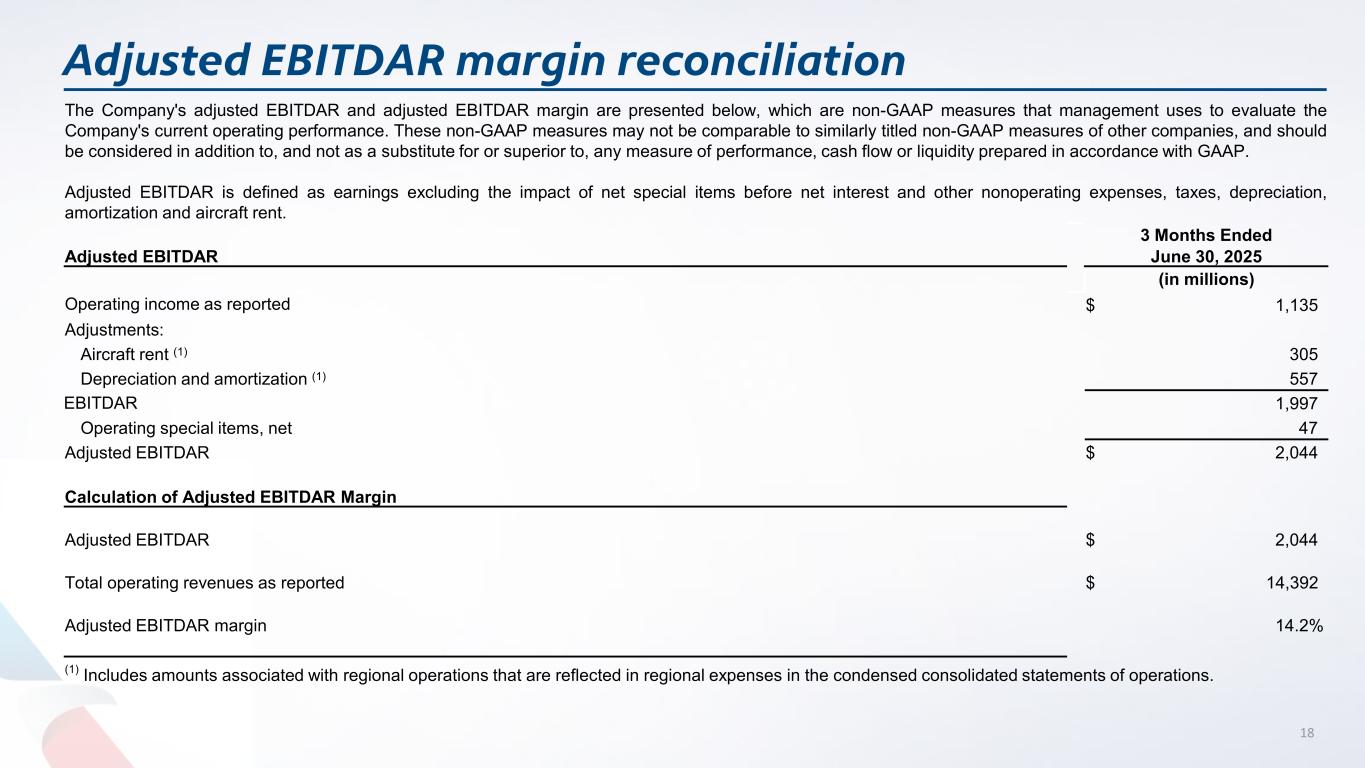
•Second-quarter operating margin of approximately 8%
•Ended the quarter with $12 billion of total available liquidity
“American delivered record revenue in an evolving demand environment in the second quarter thanks to the hard work and dedication of our team,” said American’s CEO Robert Isom. “We remain confident that the actions we have taken over the past several years to refresh our fleet, manage costs and strengthen our balance sheet position us well for the future. The investments we have made toward achieving our revenue potential, including bolstering our network, customer experience and loyalty program, are paying off, and the team remains focused on delivering on our long-term strategy.”
Revenue performance
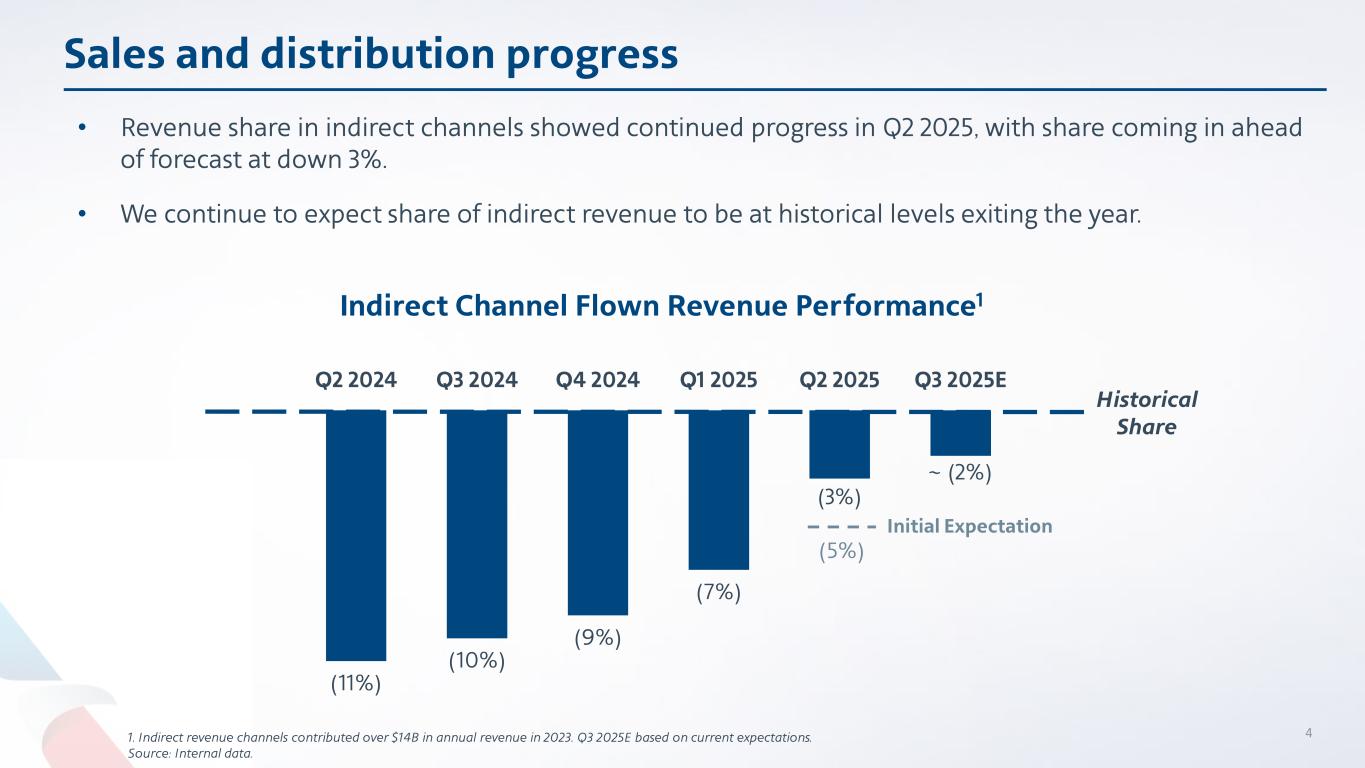
American produced record quarterly revenue of $14.4 billion. The company continued the restoration of revenue from indirect channels, driven by a faster-than-expected recovery in leisure channels, further solidifying its plan to return to historical share of indirect channel revenue exiting this year. American saw continued strength in premium cabin demand in the second quarter, particularly to long-haul international destinations. All international entities delivered positive unit revenue growth year over year, with Atlantic passenger unit revenue up 5%. These results contributed to American’s industry-leading passenger unit revenue year-over-year improvement for the fourth consecutive quarter.
AAdvantage program and co-branded credit card performance
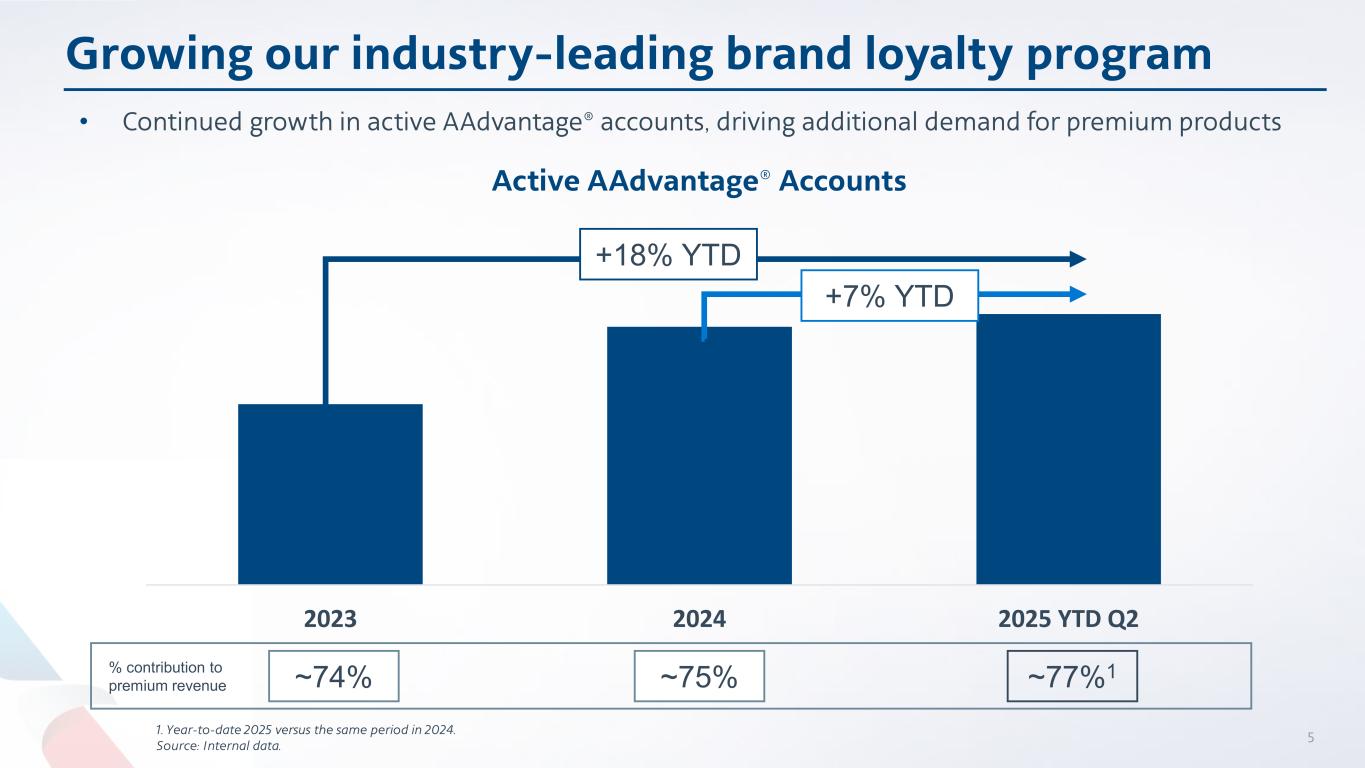
American continues to see strong engagement with its industry-leading AAdvantage® loyalty program, with active accounts up 7% year over year. Spending on co-branded credit cards increased 6% year over year as customers continue to value earning rewards for future travel with American.
Customer experience
American’s new Customer Experience organization continues to make meaningful progress in elevating the travel journey. In the second quarter, American introduced the ability for customers
American Airlines Reports Second-Quarter Financial Results
July 24, 2025
Page 2
to use miles as a form of payment for instant upgrades and announced plans to open a new Flagship® lounge and nearly double the amount of lounge space at Miami International Airport. American also debuted its new Flagship Suite®, an elevated premium inflight experience that is expected to expand to more destinations this winter.
Operational performance
The American team delivered a resilient operation in the second quarter, which had a 36% increase in disruptive operational events year over year primarily driven by increased storm activity at the airline’s hubs in Dallas-Fort Worth, Chicago, Washington, D.C., and the Northeast. American continues to demonstrate its ability to quickly recover from irregular operations, and its investments in technology are driving additional enhancements to both reliability and the customer experience.
Balance sheet and liquidity
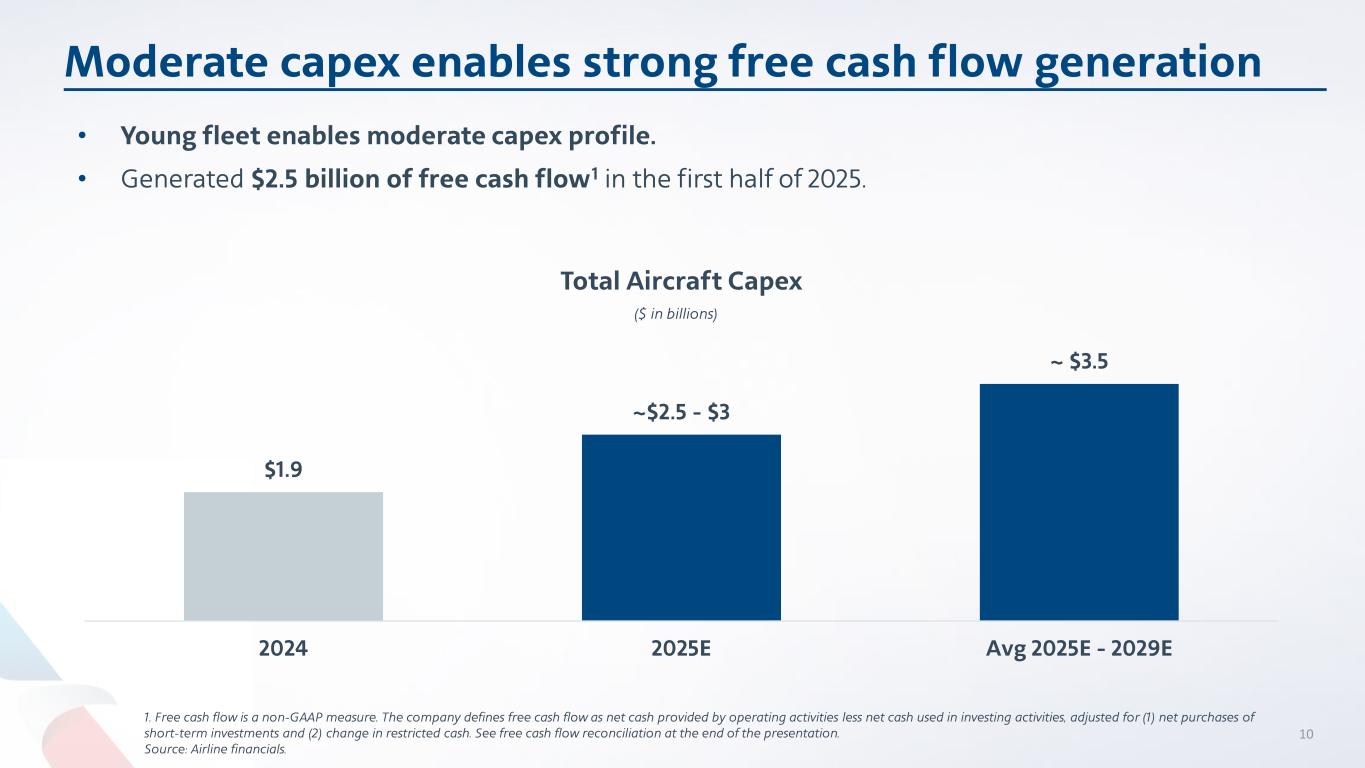
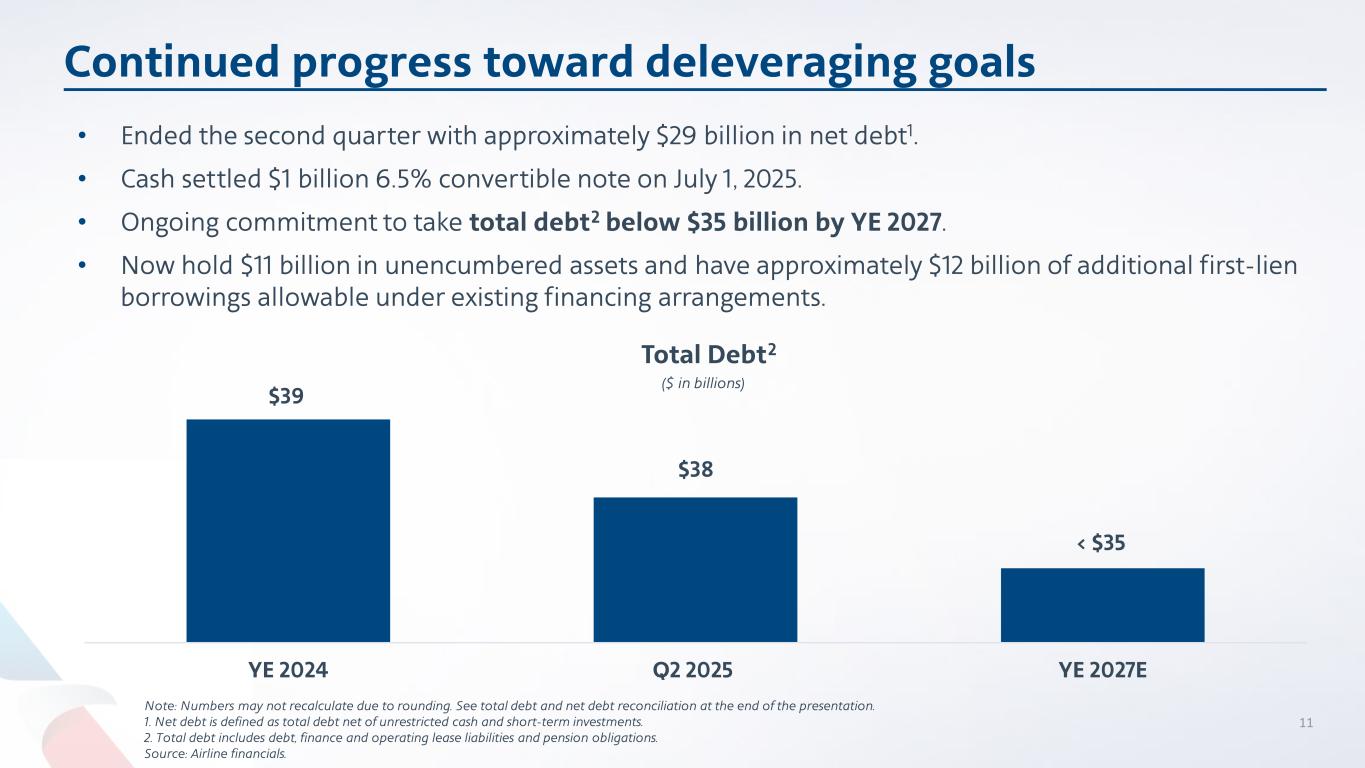
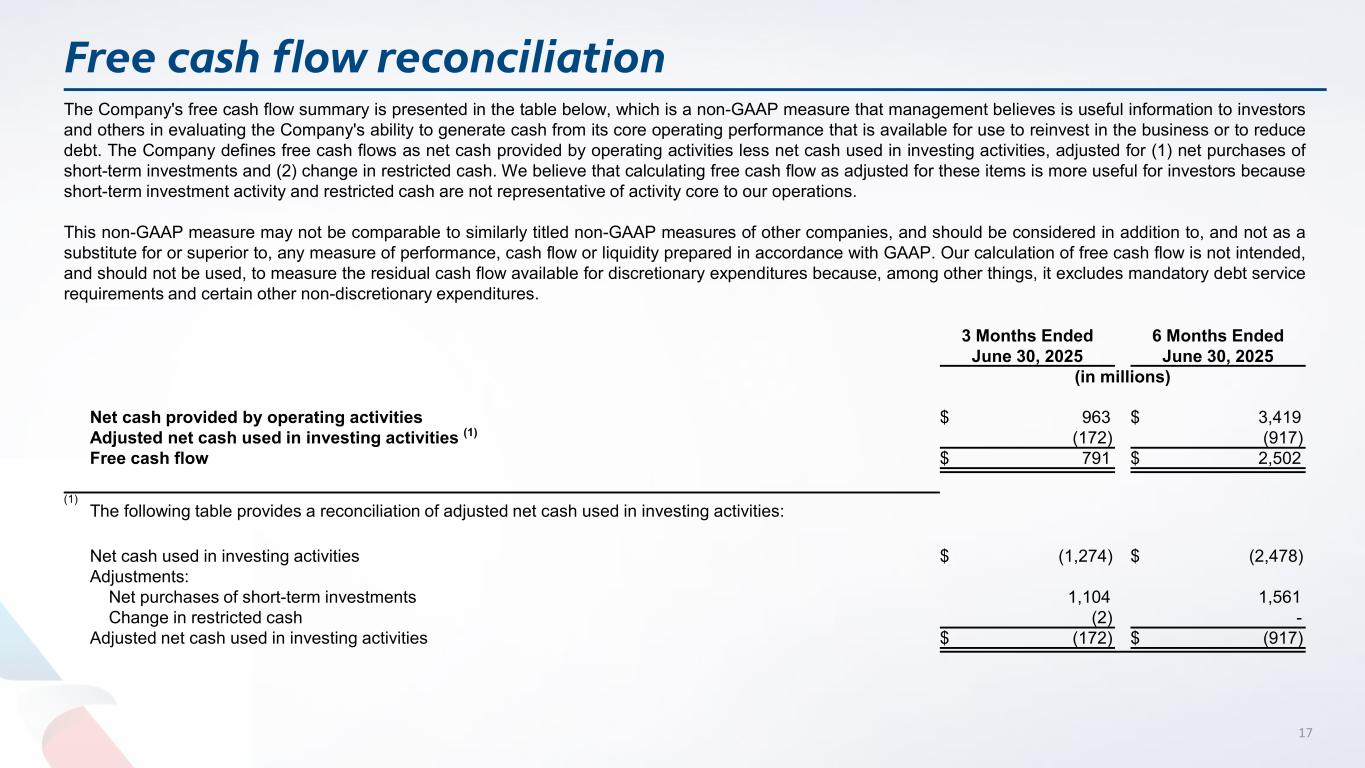
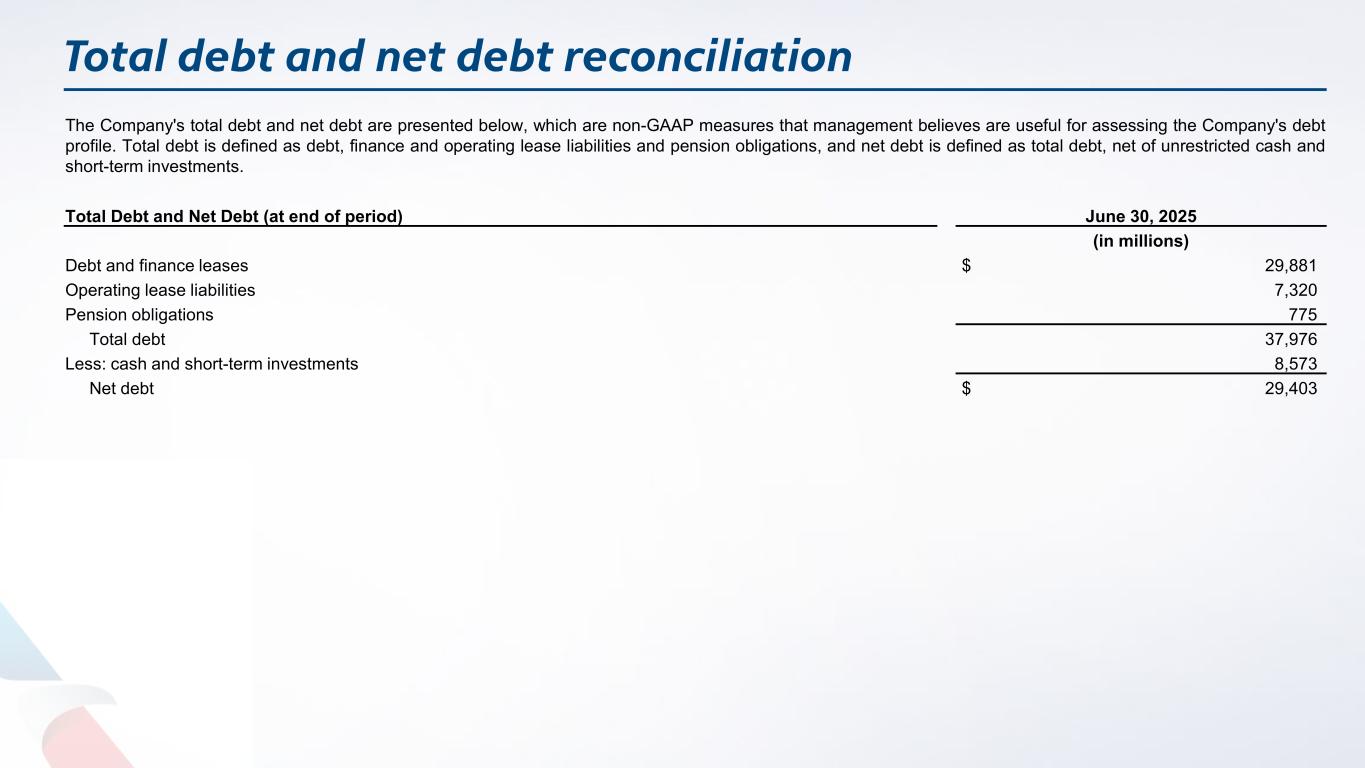
The company’s operating cash flow of $3.4 billion and free cash flow2 generation of $2.5 billion in the first half of 2025 enabled further strengthening of its balance sheet. The company ended the second quarter with $38 billion of total debt3 and $29 billion of net debt4. The company ended the second quarter with $12 billion of total available liquidity, comprised of cash and short-term investments plus undrawn capacity under revolving credit and other facilities.
Guidance and investor update
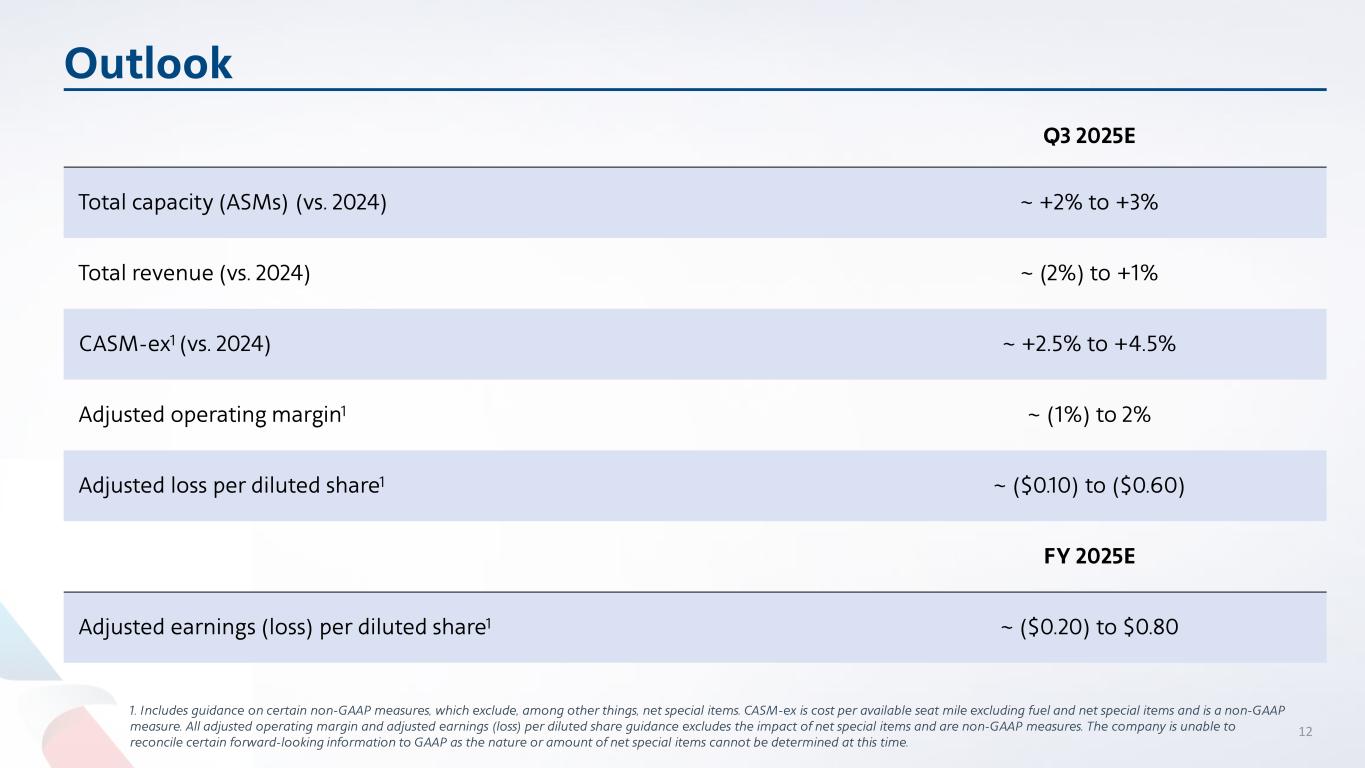
Based on its current booked revenue, expectations of future demand trends and fuel price, and excluding the impact of special items, the company expects a third-quarter 2025 adjusted loss per diluted share5 to be between ($0.10) and ($0.60). Based on recent booking trends, American expects its full-year adjusted earnings (loss) per diluted share5 to be between ($0.20) and $0.80, with a mid-point of $0.30. The company believes the top end of the range is achievable if demand in the domestic market continues to strengthen and only expects to be at the bottom end of the range if there were to be macro weaknesses that are not seen today.
For additional financial forecasting detail, please refer to the company’s investor update, furnished, together with this press release, with the SEC on a current report on Form 8-K. This filing is also available at aa.com/investorrelations.
Conference call and webcast details
The company will conduct a live audio webcast of its financial results conference call at 7:30 a.m. CT today. The call will be available to the public on a listen-only basis at
aa.com/investorrelations. An archive of the webcast will be available through Aug. 24, 2025.
Notes
See the accompanying notes in the financial tables section of this press release for further explanation, including a reconciliation of all GAAP to non-GAAP financial information and the calculation of free cash flow.
1.The company recognized $29 million of net special items in the second quarter after the effect of taxes, which principally included adjustments to litigation reserves, offset in part by mark-to-market net unrealized gains associated with certain equity investments.
2.Please see the accompanying notes for the company’s definition of free cash flow, a non-GAAP measure.
3.All references to total debt include debt, finance and operating lease liabilities and pension obligations.
American Airlines Reports Second-Quarter 2025 Financial Results
July 24, 2025
Page 3
4.Net debt is defined as total debt net of unrestricted cash and short-term investments.
5.Adjusted earnings (loss) per diluted share guidance excludes the impact of net special items. The company is unable to reconcile certain forward-looking information to GAAP as the nature or amount of net special items cannot be determined at this time.
About American Airlines Group
As a leading global airline, American Airlines offers thousands of flights per day to more than 350 destinations in more than 60 countries. The airline is a founding member of the oneworld alliance, whose members serve more than 900 destinations around the globe. Shares of American Airlines Group Inc. trade on Nasdaq under the ticker symbol AAL. Learn more about what’s happening at American by visiting news.aa.com and connect with American @AmericanAir and at Facebook.com/AmericanAirlines. To Care for People on Life’s Journey®.
Cautionary statement regarding forward-looking statements and information
Certain of the statements contained in this report should be considered forward-looking statements within the meaning of the Securities Act of 1933, as amended, the Securities Exchange Act of 1934, as amended, and the Private Securities Litigation Reform Act of 1995. These forward-looking statements may be identified by words such as “may,” “will,” “expect,” “intend,” “anticipate,” “believe,” “estimate,” “plan,” “project,” “could,” “should,” “would,” “continue,” “seek,” “target,” “guidance,” “outlook,” “if current trends continue,” “optimistic,” “forecast” and other similar words. Such statements include, but are not limited to, statements about the company’s plans, objectives, expectations, intentions, estimates and strategies for the future, and other statements that are not historical facts. These forward-looking statements are based on the company’s current objectives, beliefs and expectations, and they are subject to significant risks and uncertainties that may cause actual results and financial position and timing of certain events to differ materially from the information in the forward-looking statements. These risks and uncertainties include, but are not limited to, downturns in economic conditions; our inability to obtain sufficient financing or other capital to operate successfully; our high level of debt and other obligations; our significant pension and other postretirement benefit funding obligations; any deterioration of our financial condition; any loss of key personnel, or our inability to attract, develop and retain additional qualified personnel; changing economic, geopolitical, commercial, regulatory and other conditions beyond our control, including the recently announced tariffs and other global events that affect travel behavior; changes in current legislation, regulations and economic conditions regarding federal governmental tariffs, the implementation of federal government budget cuts and the potential that any of the foregoing affects the demand for, or restricts the use of, travel by government employees and their families or private sector enterprises that contract or otherwise interface with the federal government; the intensely competitive and dynamic nature of the airline industry; union disputes, employee strikes and other labor-related disruptions; problems with any of our third-party regional operators or third-party service providers; any damage to our reputation or brand image; losses and adverse publicity stemming from any public incidents involving our company, our people or our brand; changes to our business model that may not be successful and may cause operational difficulties or decreased demand; our inability to protect our intellectual property rights, particularly our branding rights; litigation in the normal course of business or otherwise; our inability to use net operating losses and other carryforwards; any new U.S. and international tax legislation; any impairment of goodwill and intangible assets or long-lived assets; any inability of our commercial relationships with other companies to produce the returns or results we expect; our dependence on price and availability of aircraft fuel; extensive government regulation and compliance risks; economic and political instability outside of the U.S. where we have significant operations; ongoing security concerns due to conflicts, terrorist attacks or other acts of violence, domestically or abroad; climate change; environmental and
American Airlines Reports Second-Quarter 2025 Financial Results
July 24, 2025
Page 4
social matters, and compliance risks with environmental, health and noise regulations; a shortage of pilots; our dependence on a limited number of suppliers for aircraft, aircraft engines and parts; any failure of technology and automated systems, including artificial intelligence, that we rely on to operate our business; evolving data privacy requirements, risks from cyberattacks and data privacy incidents, and compliance risks with regulations related therewith; any inability to effectively manage the costs, rights and functionality of third-party distribution channels; any inability to obtain and maintain adequate facilities and infrastructure throughout our system and, at some airports, adequate slots; interruptions or disruptions in service at one or more of our key facilities; increases in insurance costs or reductions in insurance coverage; heavy taxation in the airline industry; risks related to ownership of American Airlines Group Inc. common stock; and other risks set forth herein as well as in the company’s latest annual report on Form 10-K for the year ended December 31, 2024 (especially in Part I, Item 1A. Risk Factors and Part II, Item 7. Management’s Discussion and Analysis of Financial Condition and Results of Operations) and subsequent quarterly reports on Form 10-Q (especially in Part I, Item 2. Management’s Discussion and Analysis of Financial Condition and Results of Operations and Part II, Item 1A. Risk Factors), and other risks and uncertainties listed from time to time in the company’s other filings with the Securities and Exchange Commission. Additionally, there may be other factors of which the company is not currently aware that may affect matters discussed in the forward-looking statements and may also cause actual results to differ materially from those discussed. The company does not assume any obligation to publicly update or supplement any forward-looking statement to reflect actual results, changes in assumptions or changes in other factors affecting these forward-looking statements other than as required by law. Any forward-looking statements speak only as of the date hereof or as of the dates indicated in the statement.
American Airlines Reports Second-Quarter 2025 Financial Results
July 24, 2025
Page 5
American Airlines Group Inc.
Condensed Consolidated Statements of Operations
(In millions, except share and per share amounts)
(Unaudited)
| 3 Months Ended June 30, | Percent Increase (Decrease) | 6 Months Ended June 30, | Percent Increase (Decrease) | ||||||||||||||||||||||||||||||||
| 2025 | 2024 | 2025 | 2024 | ||||||||||||||||||||||||||||||||
| Operating revenues: | |||||||||||||||||||||||||||||||||||
| Passenger | $ | 13,123 | $ | 13,202 | (0.6) | $ | 24,514 | $ | 24,661 | (0.6) | |||||||||||||||||||||||||
| Cargo | 211 | 195 | 8.2 | 400 | 382 | 4.7 | |||||||||||||||||||||||||||||
| Other | 1,058 | 937 | 13.0 | 2,029 | 1,861 | 9.0 | |||||||||||||||||||||||||||||
| Total operating revenues | 14,392 | 14,334 | 0.4 | 26,943 | 26,904 | 0.1 | |||||||||||||||||||||||||||||
| Operating expenses: | |||||||||||||||||||||||||||||||||||
| Aircraft fuel and related taxes | 2,663 | 3,061 | (13.0) | 5,250 | 6,042 | (13.1) | |||||||||||||||||||||||||||||
| Salaries, wages and benefits | 4,382 | 3,953 | 10.9 | 8,604 | 7,820 | 10.0 | |||||||||||||||||||||||||||||
| Regional expenses: | |||||||||||||||||||||||||||||||||||
| Regional operating expenses | 1,250 | 1,189 | 5.2 | 2,523 | 2,311 | 9.2 | |||||||||||||||||||||||||||||
| Regional depreciation and amortization | 81 | 79 | 1.6 | 160 | 158 | 0.9 | |||||||||||||||||||||||||||||
| Maintenance, materials and repairs | 927 | 950 | (2.5) | 1,848 | 1,834 | 0.8 | |||||||||||||||||||||||||||||
| Other rent and landing fees | 894 | 834 | 7.2 | 1,720 | 1,653 | 4.1 | |||||||||||||||||||||||||||||
| Aircraft rent | 303 | 314 | (3.8) | 600 | 642 | (6.6) | |||||||||||||||||||||||||||||
| Selling expenses | 535 | 456 | 17.5 | 985 | 864 | 14.0 | |||||||||||||||||||||||||||||
| Depreciation and amortization | 476 | 474 | 0.5 | 944 | 944 | — | |||||||||||||||||||||||||||||
| Special items, net | 47 | — | nm | (1) | 118 | 70 | 67.9 | ||||||||||||||||||||||||||||
| Other | 1,699 | 1,640 | 3.6 | 3,327 | 3,175 | 4.8 | |||||||||||||||||||||||||||||
| Total operating expenses | 13,257 | 12,950 | 2.4 | 26,079 | 25,513 | 2.2 | |||||||||||||||||||||||||||||
| Operating income | 1,135 | 1,384 | (18.0) | 864 | 1,391 | (37.9) | |||||||||||||||||||||||||||||
| Nonoperating income (expense): | |||||||||||||||||||||||||||||||||||
| Interest income | 100 | 128 | (21.5) | 194 | 246 | (20.9) | |||||||||||||||||||||||||||||
| Interest expense, net | (433) | (486) | (10.9) | (861) | (984) | (12.4) | |||||||||||||||||||||||||||||
| Other income (expense), net | 36 | 2 | nm | (8) | (38) | (80.0) | |||||||||||||||||||||||||||||
| Total nonoperating expense, net | (297) | (356) | (16.6) | (675) | (776) | (13.0) | |||||||||||||||||||||||||||||
| Income before income taxes | 838 | 1,028 | (18.5) | 189 | 615 | (69.2) | |||||||||||||||||||||||||||||
| Income tax provision | 239 | 311 | (23.4) | 63 | 210 | (69.8) | |||||||||||||||||||||||||||||
| Net income | $ | 599 | $ | 717 | (16.4) | $ | 126 | $ | 405 | (68.8) | |||||||||||||||||||||||||
| Earnings per common share: | |||||||||||||||||||||||||||||||||||
| Basic | $ | 0.91 | $ | 1.09 | $ | 0.19 | $ | 0.62 | |||||||||||||||||||||||||||
| Diluted | $ | 0.91 | $ | 1.01 | $ | 0.19 | $ | 0.59 | |||||||||||||||||||||||||||
| Weighted average shares outstanding (in thousands): | |||||||||||||||||||||||||||||||||||
| Basic | 660,127 | 656,965 | 659,504 | 656,406 | |||||||||||||||||||||||||||||||
| Diluted | 660,367 | 720,302 | 660,523 | 720,712 | |||||||||||||||||||||||||||||||
Note: Percent change may not recalculate due to rounding.
(1)Not meaningful or greater than 100% change.
American Airlines Reports Second-Quarter 2025 Financial Results
July 24, 2025
Page 6
American Airlines Group Inc.
Consolidated Operating Statistics (1)
(Unaudited)
| 3 Months Ended June 30, | Increase (Decrease) | 6 Months Ended June 30, | Increase (Decrease) | ||||||||||||||||||||||||||||||||
| 2025 | 2024 | 2025 | 2024 | ||||||||||||||||||||||||||||||||
| Revenue passenger miles (millions) | 65,762 | 65,144 | 0.9 % | 122,118 | 122,617 | (0.4) % | |||||||||||||||||||||||||||||
| Available seat miles (ASM) (millions) | 77,636 | 75,263 | 3.2 % | 147,539 | 145,779 | 1.2 % | |||||||||||||||||||||||||||||
| Passenger load factor (percent) | 84.7 | 86.6 | (1.9) pts | 82.8 | 84.1 | (1.3) pts | |||||||||||||||||||||||||||||
| Yield (cents) | 19.96 | 20.27 | (1.5) % | 20.07 | 20.11 | (0.2) % | |||||||||||||||||||||||||||||
| Passenger revenue per ASM (cents) | 16.90 | 17.54 | (3.6) % | 16.62 | 16.92 | (1.8) % | |||||||||||||||||||||||||||||
| Total revenue per ASM (cents) | 18.54 | 19.05 | (2.7) % | 18.26 | 18.46 | (1.0) % | |||||||||||||||||||||||||||||
| Cargo ton miles (millions) | 521 | 515 | 1.2 % | 1,004 | 999 | 0.5 % | |||||||||||||||||||||||||||||
| Cargo yield per ton mile (cents) | 40.48 | 37.87 | 6.9 % | 39.84 | 38.25 | 4.2 % | |||||||||||||||||||||||||||||
| Fuel consumption (gallons in millions) | 1,163 | 1,132 | 2.7 % | 2,206 | 2,174 | 1.4 % | |||||||||||||||||||||||||||||
| Average aircraft fuel price including related taxes (dollars per gallon) | 2.29 | 2.70 | (15.3) % | 2.38 | 2.78 | (14.3) % | |||||||||||||||||||||||||||||
| Operating cost per ASM (cents) | 17.08 | 17.21 | (0.8) % | 17.68 | 17.50 | 1.0 % | |||||||||||||||||||||||||||||
| Operating cost per ASM excluding net special items (cents) | 17.02 | 17.21 | (1.1) % | 17.60 | 17.45 | 0.8 % | |||||||||||||||||||||||||||||
| Operating cost per ASM excluding net special items and fuel (cents) | 13.59 | 13.14 | 3.4 % | 14.04 | 13.31 | 5.5 % | |||||||||||||||||||||||||||||
| Passenger enplanements (thousands) | 58,711 | 59,188 | (0.8) % | 109,746 | 111,954 | (2.0) % | |||||||||||||||||||||||||||||
| Departures (thousands): | |||||||||||||||||||||||||||||||||||
| Mainline | 306 | 306 | (0.2) % | 583 | 596 | (2.2) % | |||||||||||||||||||||||||||||
| Regional | 270 | 243 | 10.9 % | 520 | 462 | 12.5 % | |||||||||||||||||||||||||||||
| Total | 576 | 549 | 4.7 % | 1,103 | 1,058 | 4.2 % | |||||||||||||||||||||||||||||
| Average stage length (miles): | |||||||||||||||||||||||||||||||||||
| Mainline | 1,185 | 1,154 | 2.7 % | 1,181 | 1,155 | 2.3 % | |||||||||||||||||||||||||||||
| Regional | 460 | 457 | 0.7 % | 465 | 460 | 1.0 % | |||||||||||||||||||||||||||||
| Total | 845 | 845 | — % | 843 | 852 | (1.0) % | |||||||||||||||||||||||||||||
| Aircraft at end of period: | |||||||||||||||||||||||||||||||||||
| Mainline | 992 | 970 | 2.3 % | 992 | 970 | 2.3 % | |||||||||||||||||||||||||||||
Regional (2) | 547 | 559 | (2.1) % | 547 | 559 | (2.1) % | |||||||||||||||||||||||||||||
| Total | 1,539 | 1,529 | 0.7 % | 1,539 | 1,529 | 0.7 % | |||||||||||||||||||||||||||||
| Full-time equivalent employees at end of period: | |||||||||||||||||||||||||||||||||||
| Mainline | 106,100 | 107,400 | (1.2) % | 106,100 | 107,400 | (1.2) % | |||||||||||||||||||||||||||||
Regional (3) | 32,000 | 30,000 | 6.7 % | 32,000 | 30,000 | 6.7 % | |||||||||||||||||||||||||||||
| Total | 138,100 | 137,400 | 0.5 % | 138,100 | 137,400 | 0.5 % | |||||||||||||||||||||||||||||
Note: Amounts may not recalculate due to rounding.
(1)Unless otherwise noted, operating statistics include mainline and regional operations. Regional includes wholly-owned regional airline subsidiaries and operating results from capacity purchase carriers.
(2)Includes aircraft owned and leased by American as well as aircraft operated by third-party regional carriers under capacity purchase agreements. Excluded from the aircraft count above are six regional aircraft in temporary storage as of June 30, 2025 as follows: four Bombardier CRJ 900 and two Embraer 145.
(3)Regional full-time equivalent employees only include our wholly-owned regional airline subsidiaries.
American Airlines Reports Second-Quarter 2025 Financial Results
July 24, 2025
Page 7
American Airlines Group Inc.
Consolidated Revenue Statistics by Region
(Unaudited)
| 3 Months Ended June 30, | Increase (Decrease) | 6 Months Ended June 30, | Increase (Decrease) | ||||||||||||||||||||||||||||||||
| 2025 | 2024 | 2025 | 2024 | ||||||||||||||||||||||||||||||||
Domestic (1) | |||||||||||||||||||||||||||||||||||
| Revenue passenger miles (millions) | 43,772 | 43,183 | 1.4 % | 81,465 | 81,994 | (0.6) % | |||||||||||||||||||||||||||||
| Available seat miles (ASM) (millions) | 51,988 | 49,613 | 4.8 % | 98,657 | 96,716 | 2.0 % | |||||||||||||||||||||||||||||
| Passenger load factor (percent) | 84.2 | 87.0 | (2.8) pts | 82.6 | 84.8 | (2.2) pts | |||||||||||||||||||||||||||||
| Passenger revenue (dollars in millions) | 9,159 | 9,342 | (2.0) % | 17,286 | 17,604 | (1.8) % | |||||||||||||||||||||||||||||
| Yield (cents) | 20.93 | 21.63 | (3.3) % | 21.22 | 21.47 | (1.2) % | |||||||||||||||||||||||||||||
| Passenger revenue per ASM (cents) | 17.62 | 18.83 | (6.4) % | 17.52 | 18.20 | (3.7) % | |||||||||||||||||||||||||||||
Latin America (2) | |||||||||||||||||||||||||||||||||||
| Revenue passenger miles (millions) | 8,358 | 8,576 | (2.5) % | 18,380 | 18,672 | (1.6) % | |||||||||||||||||||||||||||||
| Available seat miles (millions) | 9,725 | 9,873 | (1.5) % | 21,728 | 21,611 | 0.5 % | |||||||||||||||||||||||||||||
| Passenger load factor (percent) | 85.9 | 86.9 | (1.0) pts | 84.6 | 86.4 | (1.8) pts | |||||||||||||||||||||||||||||
| Passenger revenue (dollars in millions) | 1,550 | 1,562 | (0.8) % | 3,455 | 3,464 | (0.2) % | |||||||||||||||||||||||||||||
| Yield (cents) | 18.54 | 18.21 | 1.8 % | 18.80 | 18.55 | 1.3 % | |||||||||||||||||||||||||||||
| Passenger revenue per ASM (cents) | 15.94 | 15.82 | 0.7 % | 15.90 | 16.03 | (0.8) % | |||||||||||||||||||||||||||||
| Atlantic | |||||||||||||||||||||||||||||||||||
| Revenue passenger miles (millions) | 11,432 | 11,527 | (0.8) % | 17,366 | 17,982 | (3.4) % | |||||||||||||||||||||||||||||
| Available seat miles (millions) | 13,414 | 13,629 | (1.6) % | 21,377 | 22,671 | (5.7) % | |||||||||||||||||||||||||||||
| Passenger load factor (percent) | 85.2 | 84.6 | 0.6 pts | 81.2 | 79.3 | 1.9 pts | |||||||||||||||||||||||||||||
| Passenger revenue (dollars in millions) | 2,086 | 2,019 | 3.3 % | 3,052 | 3,012 | 1.3 % | |||||||||||||||||||||||||||||
| Yield (cents) | 18.25 | 17.52 | 4.2 % | 17.57 | 16.75 | 4.9 % | |||||||||||||||||||||||||||||
| Passenger revenue per ASM (cents) | 15.55 | 14.82 | 5.0 % | 14.28 | 13.28 | 7.5 % | |||||||||||||||||||||||||||||
| Pacific | |||||||||||||||||||||||||||||||||||
| Revenue passenger miles (millions) | 2,200 | 1,858 | 18.4 % | 4,907 | 3,969 | 23.6 % | |||||||||||||||||||||||||||||
| Available seat miles (millions) | 2,509 | 2,148 | 16.8 % | 5,777 | 4,781 | 20.8 % | |||||||||||||||||||||||||||||
| Passenger load factor (percent) | 87.7 | 86.5 | 1.2 pts | 84.9 | 83.0 | 1.9 pts | |||||||||||||||||||||||||||||
| Passenger revenue (dollars in millions) | 328 | 279 | 17.5 % | 721 | 581 | 24.1 % | |||||||||||||||||||||||||||||
| Yield (cents) | 14.92 | 15.02 | (0.7) % | 14.69 | 14.64 | 0.4 % | |||||||||||||||||||||||||||||
| Passenger revenue per ASM (cents) | 13.08 | 13.00 | 0.6 % | 12.48 | 12.15 | 2.7 % | |||||||||||||||||||||||||||||
| Total International | |||||||||||||||||||||||||||||||||||
| Revenue passenger miles (millions) | 21,990 | 21,961 | 0.1 % | 40,653 | 40,623 | 0.1 % | |||||||||||||||||||||||||||||
| Available seat miles (millions) | 25,648 | 25,650 | — % | 48,882 | 49,063 | (0.4) % | |||||||||||||||||||||||||||||
| Passenger load factor (percent) | 85.7 | 85.6 | 0.1 pts | 83.2 | 82.8 | 0.4 pts | |||||||||||||||||||||||||||||
| Passenger revenue (dollars in millions) | 3,964 | 3,860 | 2.7 % | 7,228 | 7,057 | 2.4 % | |||||||||||||||||||||||||||||
| Yield (cents) | 18.03 | 17.58 | 2.5 % | 17.78 | 17.37 | 2.4 % | |||||||||||||||||||||||||||||
| Passenger revenue per ASM (cents) | 15.46 | 15.05 | 2.7 % | 14.79 | 14.38 | 2.8 % | |||||||||||||||||||||||||||||
Note: Amounts may not recalculate due to rounding.
(1)Domestic results include Canada, Puerto Rico and U.S. Virgin Islands.
(2)Latin America results include the Caribbean.
American Airlines Reports Second-Quarter 2025 Financial Results
July 24, 2025
Page 8
Reconciliation of GAAP Financial Information to Non-GAAP Financial Information
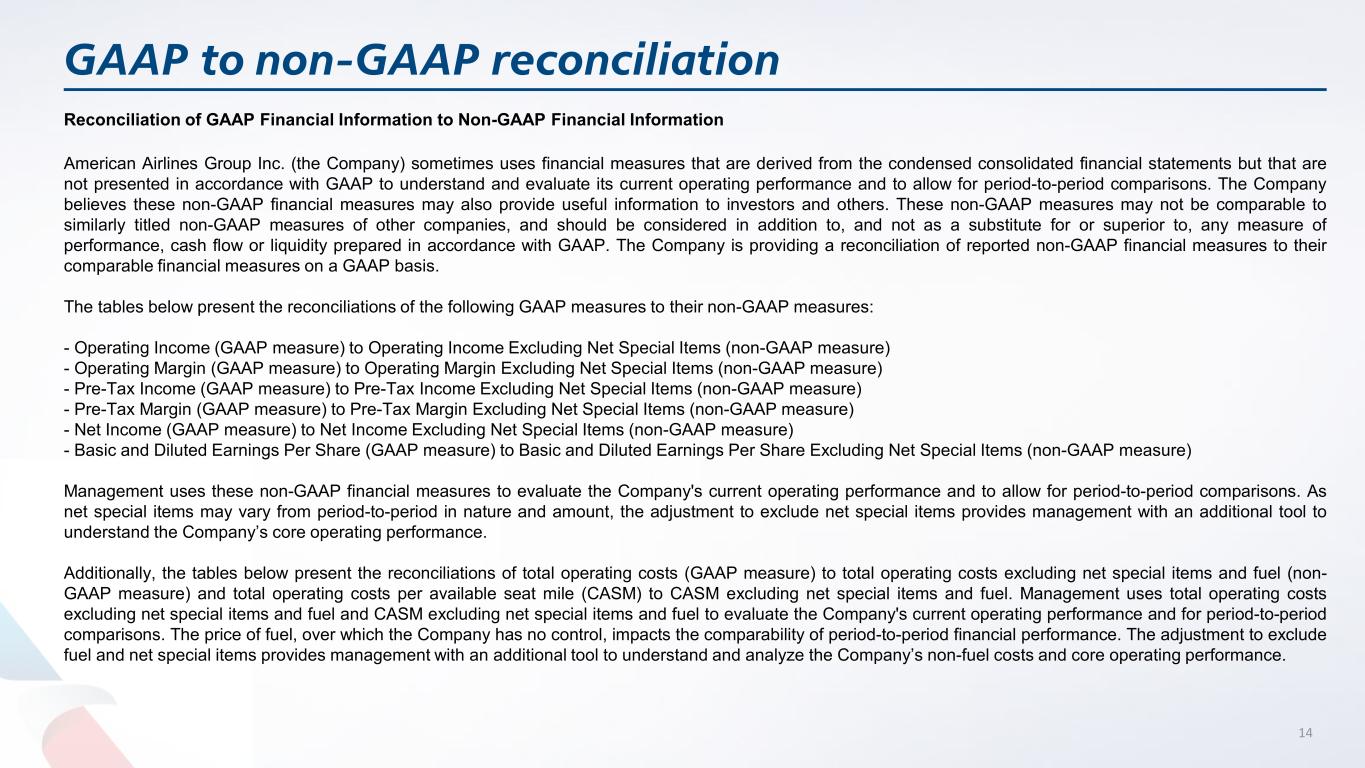
American Airlines Group Inc. (the Company) sometimes uses financial measures that are derived from the condensed consolidated financial statements but that are not presented in accordance with GAAP to understand and evaluate its current operating performance and to allow for period-to-period comparisons. The Company believes these non-GAAP financial measures may also provide useful information to investors and others. These non-GAAP measures may not be comparable to similarly titled non-GAAP measures of other companies, and should be considered in addition to, and not as a substitute for or superior to, any measure of performance, cash flow or liquidity prepared in accordance with GAAP. The Company is providing a reconciliation of reported non-GAAP financial measures to their comparable financial measures on a GAAP basis.
The tables below present the reconciliations of the following GAAP measures to their non-GAAP measures:
–Operating Income (GAAP measure) to Operating Income Excluding Net Special Items (non-GAAP measure)
–Operating Margin (GAAP measure) to Operating Margin Excluding Net Special Items (non-GAAP measure)
–Pre-Tax Income (GAAP measure) to Pre-Tax Income Excluding Net Special Items (non-GAAP measure)
–Pre-Tax Margin (GAAP measure) to Pre-Tax Margin Excluding Net Special Items (non-GAAP measure)
–Net Income (GAAP measure) to Net Income Excluding Net Special Items (non-GAAP measure)
–Basic and Diluted Earnings Per Share (GAAP measure) to Basic and Diluted Earnings Per Share Excluding Net Special Items (non-GAAP measure)
Management uses these non-GAAP financial measures to evaluate the Company's current operating performance and to allow for period-to-period comparisons. As net special items may vary from period-to-period in nature and amount, the adjustment to exclude net special items provides management with an additional tool to understand the Company’s core operating performance.
Additionally, the tables below present the reconciliations of total operating costs (GAAP measure) to total operating costs excluding net special items and fuel (non-GAAP measure) and total operating costs per ASM (CASM) to CASM excluding net special items and fuel. Management uses total operating costs excluding net special items and fuel and CASM excluding net special items and fuel to evaluate the Company's current operating performance and for period-to-period comparisons. The price of fuel, over which the Company has no control, impacts the comparability of period-to-period financial performance. The adjustment to exclude fuel and net special items provides management with an additional tool to understand and analyze the Company’s non-fuel costs and core operating performance.
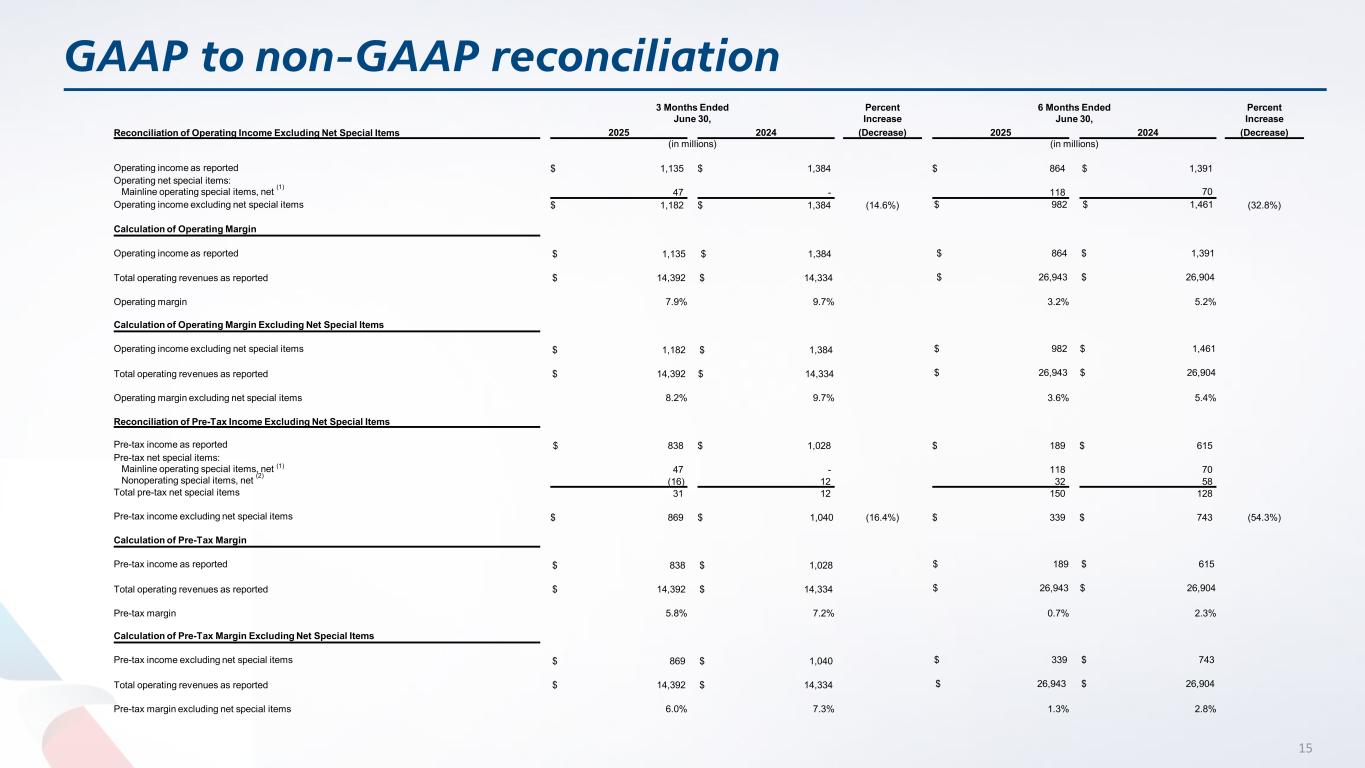
| Reconciliation of Operating Income Excluding Net Special Items | 3 Months Ended June 30, | Percent Increase (Decrease) | 6 Months Ended June 30, | Percent Increase (Decrease) | ||||||||||||||||||||||||||||||||||
| 2025 | 2024 | 2025 | 2024 | |||||||||||||||||||||||||||||||||||
| (in millions) | (in millions) | |||||||||||||||||||||||||||||||||||||
| Operating income as reported | $ | 1,135 | $ | 1,384 | $ | 864 | $ | 1,391 | ||||||||||||||||||||||||||||||
| Operating net special items: | ||||||||||||||||||||||||||||||||||||||
Mainline operating special items, net (1) | 47 | — | 118 | 70 | ||||||||||||||||||||||||||||||||||
| Operating income excluding net special items | $ | 1,182 | $ | 1,384 | (14.6%) | $ | 982 | $ | 1,461 | (32.8%) | ||||||||||||||||||||||||||||
| Calculation of Operating Margin | ||||||||||||||||||||||||||||||||||||||
| Operating income as reported | $ | 1,135 | $ | 1,384 | $ | 864 | $ | 1,391 | ||||||||||||||||||||||||||||||
| Total operating revenues as reported | $ | 14,392 | $ | 14,334 | $ | 26,943 | $ | 26,904 | ||||||||||||||||||||||||||||||
| Operating margin | 7.9 | % | 9.7 | % | 3.2 | % | 5.2 | % | ||||||||||||||||||||||||||||||
| Calculation of Operating Margin Excluding Net Special Items | ||||||||||||||||||||||||||||||||||||||
| Operating income excluding net special items | $ | 1,182 | $ | 1,384 | $ | 982 | $ | 1,461 | ||||||||||||||||||||||||||||||
| Total operating revenues as reported | $ | 14,392 | $ | 14,334 | $ | 26,943 | $ | 26,904 | ||||||||||||||||||||||||||||||
| Operating margin excluding net special items | 8.2 | % | 9.7 | % | 3.6 | % | 5.4 | % | ||||||||||||||||||||||||||||||
| Reconciliation of Pre-Tax Income Excluding Net Special Items | ||||||||||||||||||||||||||||||||||||||
| Pre-tax income as reported | $ | 838 | $ | 1,028 | $ | 189 | $ | 615 | ||||||||||||||||||||||||||||||
| Pre-tax net special items: | ||||||||||||||||||||||||||||||||||||||
Mainline operating special items, net (1) | 47 | — | 118 | 70 | ||||||||||||||||||||||||||||||||||
Nonoperating special items, net (2) | (16) | 12 | 32 | 58 | ||||||||||||||||||||||||||||||||||
| Total pre-tax net special items | 31 | 12 | 150 | 128 | ||||||||||||||||||||||||||||||||||
| Pre-tax income excluding net special items | $ | 869 | $ | 1,040 | (16.4%) | $ | 339 | $ | 743 | (54.3%) | ||||||||||||||||||||||||||||
| Calculation of Pre-Tax Margin | ||||||||||||||||||||||||||||||||||||||
| Pre-tax income as reported | $ | 838 | $ | 1,028 | $ | 189 | $ | 615 | ||||||||||||||||||||||||||||||
| Total operating revenues as reported | $ | 14,392 | $ | 14,334 | $ | 26,943 | $ | 26,904 | ||||||||||||||||||||||||||||||
| Pre-tax margin | 5.8 | % | 7.2 | % | 0.7 | % | 2.3 | % | ||||||||||||||||||||||||||||||
| Calculation of Pre-Tax Margin Excluding Net Special Items | ||||||||||||||||||||||||||||||||||||||
| Pre-tax income excluding net special items | $ | 869 | $ | 1,040 | $ | 339 | $ | 743 | ||||||||||||||||||||||||||||||
| Total operating revenues as reported | $ | 14,392 | $ | 14,334 | $ | 26,943 | $ | 26,904 | ||||||||||||||||||||||||||||||
| Pre-tax margin excluding net special items | 6.0 | % | 7.3 | % | 1.3 | % | 2.8 | % | ||||||||||||||||||||||||||||||
American Airlines Reports Second-Quarter 2025 Financial Results
July 24, 2025
Page 9
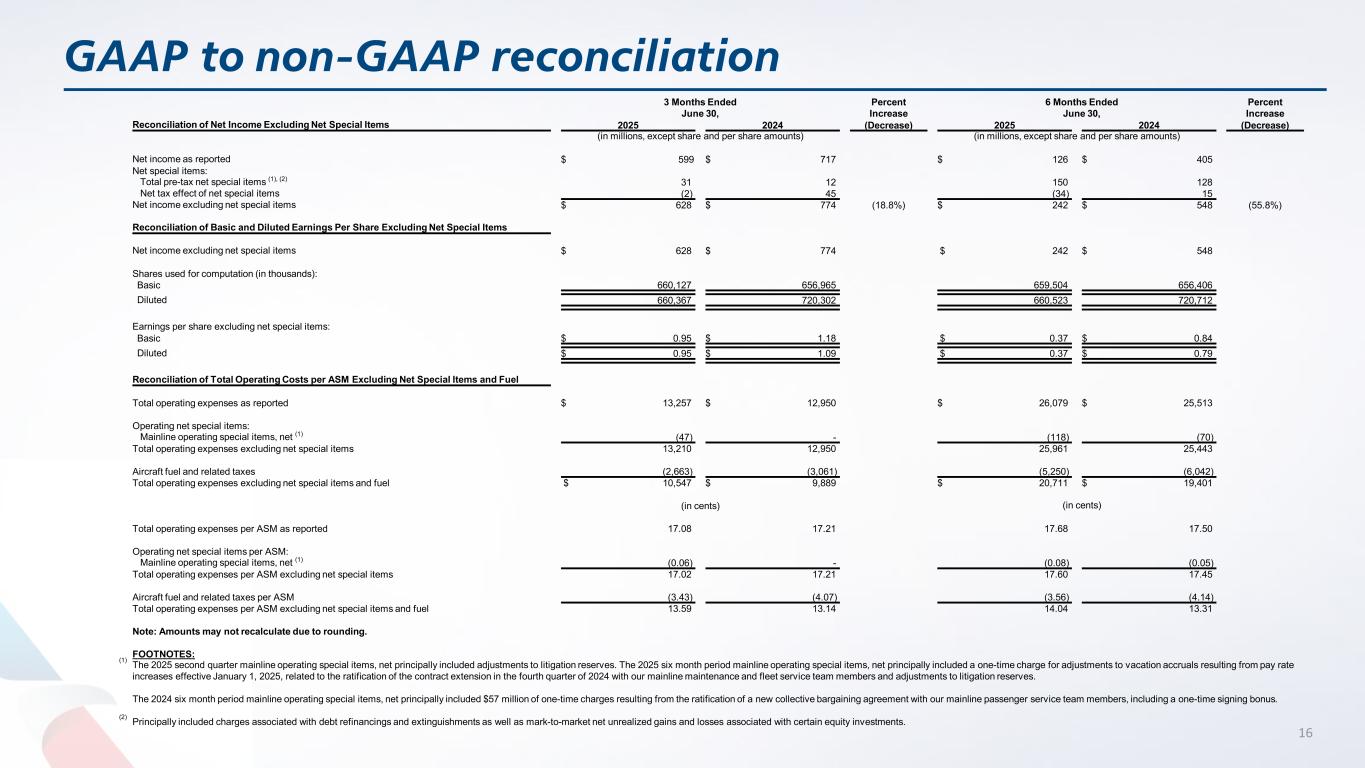
| Reconciliation of Net Income Excluding Net Special Items | 3 Months Ended June 30, | Percent Increase (Decrease) | 6 Months Ended June 30, | Percent Increase (Decrease) | ||||||||||||||||||||||||||||||||||
| 2025 | 2024 | 2025 | 2024 | |||||||||||||||||||||||||||||||||||
| (in millions, except share and per share amounts) | (in millions, except share and per share amounts) | |||||||||||||||||||||||||||||||||||||
| Net income as reported | $ | 599 | $ | 717 | $ | 126 | $ | 405 | ||||||||||||||||||||||||||||||
| Net special items: | ||||||||||||||||||||||||||||||||||||||
Total pre-tax net special items (1), (2) | 31 | 12 | 150 | 128 | ||||||||||||||||||||||||||||||||||
| Net tax effect of net special items | (2) | 45 | (34) | 15 | ||||||||||||||||||||||||||||||||||
| Net income excluding net special items | $ | 628 | $ | 774 | (18.8%) | $ | 242 | $ | 548 | (55.8%) | ||||||||||||||||||||||||||||
| Reconciliation of Basic and Diluted Earnings Per Share Excluding Net Special Items | ||||||||||||||||||||||||||||||||||||||
| Net income excluding net special items | $ | 628 | $ | 774 | $ | 242 | $ | 548 | ||||||||||||||||||||||||||||||
| Shares used for computation (in thousands): | ||||||||||||||||||||||||||||||||||||||
| Basic | 660,127 | 656,965 | 659,504 | 656,406 | ||||||||||||||||||||||||||||||||||
| Diluted | 660,367 | 720,302 | 660,523 | 720,712 | ||||||||||||||||||||||||||||||||||
| Earnings per share excluding net special items: | ||||||||||||||||||||||||||||||||||||||
| Basic | $ | 0.95 | $ | 1.18 | $ | 0.37 | $ | 0.84 | ||||||||||||||||||||||||||||||
| Diluted | $ | 0.95 | $ | 1.09 | $ | 0.37 | $ | 0.79 | ||||||||||||||||||||||||||||||
| Reconciliation of Total Operating Costs per ASM Excluding Net Special Items and Fuel | ||||||||||||||||||||||||||||||||||||||
| Total operating expenses as reported | $ | 13,257 | $ | 12,950 | $ | 26,079 | $ | 25,513 | ||||||||||||||||||||||||||||||
| Operating net special items: | ||||||||||||||||||||||||||||||||||||||
Mainline operating special items, net (1) | (47) | — | (118) | (70) | ||||||||||||||||||||||||||||||||||
| Total operating expenses excluding net special items | 13,210 | 12,950 | 25,961 | 25,443 | ||||||||||||||||||||||||||||||||||
| Aircraft fuel and related taxes | (2,663) | (3,061) | (5,250) | (6,042) | ||||||||||||||||||||||||||||||||||
| Total operating expenses excluding net special items and fuel | $ | 10,547 | $ | 9,889 | $ | 20,711 | $ | 19,401 | ||||||||||||||||||||||||||||||
| (in cents) | (in cents) | |||||||||||||||||||||||||||||||||||||
| Total operating expenses per ASM as reported | 17.08 | 17.21 | 17.68 | 17.50 | ||||||||||||||||||||||||||||||||||
| Operating net special items per ASM: | ||||||||||||||||||||||||||||||||||||||
Mainline operating special items, net (1) | (0.06) | — | (0.08) | (0.05) | ||||||||||||||||||||||||||||||||||
| Total operating expenses per ASM excluding net special items | 17.02 | 17.21 | 17.60 | 17.45 | ||||||||||||||||||||||||||||||||||
| Aircraft fuel and related taxes per ASM | (3.43) | (4.07) | (3.56) | (4.14) | ||||||||||||||||||||||||||||||||||
| Total operating expenses per ASM excluding net special items and fuel | 13.59 | 13.14 | 14.04 | 13.31 | ||||||||||||||||||||||||||||||||||
Note: Amounts may not recalculate due to rounding.
FOOTNOTES:
(1)The 2025 second quarter mainline operating special items, net principally included adjustments to litigation reserves. The 2025 six month period mainline operating special items, net principally included a one-time charge for adjustments to vacation accruals resulting from pay rate increases effective January 1, 2025, related to the ratification of the contract extension in the fourth quarter of 2024 with our mainline maintenance and fleet service team members and adjustments to litigation reserves.
The 2024 six month period mainline operating special items, net principally included $57 million of one-time charges resulting from the ratification of a new collective bargaining agreement with our mainline passenger service team members, including a one-time signing bonus.
(2)Principally included charges associated with debt refinancings and extinguishments as well as mark-to-market net unrealized gains and losses associated with certain equity investments.
American Airlines Reports Second-Quarter 2025 Financial Results
July 24, 2025
Page 10
American Airlines Group Inc.
Condensed Consolidated Statements of Cash Flows
(In millions)(Unaudited)
| 6 Months Ended June 30, | |||||||||||
| 2025 | 2024 | ||||||||||
| Net cash provided by operating activities | $ | 3,419 | $ | 3,308 | |||||||
| Cash flows from investing activities: | |||||||||||
| Capital expenditures and aircraft purchase deposits | (1,323) | (1,475) | |||||||||
| Proceeds from sale-leaseback transactions and sale of property and equipment | 200 | 353 | |||||||||
| Purchases of short-term investments | (4,680) | (4,714) | |||||||||
| Sales of short-term investments | 3,119 | 3,881 | |||||||||
| Decrease (increase) in restricted short-term investments | (73) | 68 | |||||||||
| Other investing activities | 279 | (5) | |||||||||
| Net cash used in investing activities | (2,478) | (1,892) | |||||||||
| Cash flows from financing activities: | |||||||||||
| Payments on long-term debt and finance leases | (2,365) | (1,836) | |||||||||
| Proceeds from issuance of long-term debt | 1,659 | 527 | |||||||||
| Other financing activities | (206) | (48) | |||||||||
| Net cash used in financing activities | (912) | (1,357) | |||||||||
| Net increase in cash and restricted cash | 29 | 59 | |||||||||
| Cash and restricted cash at beginning of period | 902 | 681 | |||||||||
Cash and restricted cash at end of period (1) | $ | 931 | $ | 740 | |||||||
(1)The following table provides a reconciliation of cash and restricted cash to amounts reported within the condensed consolidated balance sheets:
| Cash | $ | 833 | $ | 605 | |||||||
| Restricted cash included in restricted cash and short-term investments | 98 | 135 | |||||||||
| Total cash and restricted cash | $ | 931 | $ | 740 | |||||||
American Airlines Reports Second-Quarter 2025 Financial Results
July 24, 2025
Page 11
Free Cash Flow
The Company's free cash flow summary is presented in the table below, which is a non-GAAP measure that management believes is useful information to investors and others in evaluating the Company's ability to generate cash from its core operating performance that is available for use to reinvest in the business or to reduce debt. The Company defines free cash flows as net cash provided by operating activities less net cash used in investing activities, adjusted for (1) net purchases of short-term investments and (2) change in restricted cash. We believe that calculating free cash flow as adjusted for these items is more useful for investors because short-term investment activity and restricted cash are not representative of activity core to our operations.
This non-GAAP measure may not be comparable to similarly titled non-GAAP measures of other companies, and should be considered in addition to, and not as a substitute for or superior to, any measure of performance, cash flow or liquidity prepared in accordance with GAAP. Our calculation of free cash flow is not intended, and should not be used, to measure the residual cash flow available for discretionary expenditures because, among other things, it excludes mandatory debt service requirements and certain other non-discretionary expenditures.
| 3 Months Ended June 30, 2025 | 6 Months Ended June 30, 2025 | ||||||||||
| (in millions) | |||||||||||
| Net cash provided by operating activities | $ | 963 | $ | 3,419 | |||||||
Adjusted net cash used in investing activities (1) | (172) | (917) | |||||||||
| Free cash flow | $ | 791 | $ | 2,502 | |||||||
(1)The following table provides a reconciliation of adjusted net cash used in investing activities:
| Net cash used in investing activities | $ | (1,274) | $ | (2,478) | |||||||
| Adjustments: | |||||||||||
| Net purchases of short-term investments | 1,104 | 1,561 | |||||||||
| Change in restricted cash | (2) | — | |||||||||
| Adjusted net cash used in investing activities | $ | (172) | $ | (917) | |||||||
American Airlines Reports Second-Quarter 2025 Financial Results
July 24, 2025
Page 12
American Airlines Group Inc.
Condensed Consolidated Balance Sheets
(In millions, except shares)
| June 30, 2025 | December 31, 2024 | ||||||||||
| (unaudited) | |||||||||||
| Assets | |||||||||||
| Current assets | |||||||||||
| Cash | $ | 833 | $ | 804 | |||||||
| Short-term investments | 7,740 | 6,180 | |||||||||
| Restricted cash and short-term investments | 807 | 732 | |||||||||
| Accounts receivable, net | 2,057 | 2,006 | |||||||||
| Aircraft fuel, spare parts and supplies, net | 2,776 | 2,638 | |||||||||
| Prepaid expenses and other | 855 | 794 | |||||||||
| Total current assets | 15,068 | 13,154 | |||||||||
| Operating property and equipment | |||||||||||
| Flight equipment | 44,219 | 43,521 | |||||||||
| Ground property and equipment | 10,304 | 10,202 | |||||||||
| Equipment purchase deposits | 976 | 1,012 | |||||||||
| Total property and equipment, at cost | 55,499 | 54,735 | |||||||||
| Less accumulated depreciation and amortization | (24,298) | (23,608) | |||||||||
| Total property and equipment, net | 31,201 | 31,127 | |||||||||
| Operating lease right-of-use assets | 7,488 | 7,333 | |||||||||
| Other assets | |||||||||||
| Goodwill | 4,091 | 4,091 | |||||||||
| Intangibles, net | 2,040 | 2,044 | |||||||||
| Deferred tax asset | 2,411 | 2,485 | |||||||||
| Other assets | 1,368 | 1,549 | |||||||||
| Total other assets | 9,910 | 10,169 | |||||||||
| Total assets | $ | 63,667 | $ | 61,783 | |||||||
| Liabilities and Stockholders’ Equity (Deficit) | |||||||||||
| Current liabilities | |||||||||||
| Current maturities of long-term debt and finance leases | $ | 4,605 | $ | 5,322 | |||||||
| Accounts payable | 3,130 | 2,455 | |||||||||
| Accrued salaries and wages | 1,900 | 2,150 | |||||||||
| Air traffic liability | 8,240 | 6,759 | |||||||||
| Loyalty program liability | 3,666 | 3,556 | |||||||||
| Operating lease liabilities | 1,120 | 1,092 | |||||||||
| Other accrued liabilities | 3,110 | 2,961 | |||||||||
| Total current liabilities | 25,771 | 24,295 | |||||||||
| Noncurrent liabilities | |||||||||||
| Long-term debt and finance leases, net of current maturities | 25,276 | 25,154 | |||||||||
| Pension and postretirement benefits | 1,814 | 2,128 | |||||||||
| Loyalty program liability | 6,805 | 6,498 | |||||||||
| Operating lease liabilities | 6,200 | 5,976 | |||||||||
| Other liabilities | 1,671 | 1,709 | |||||||||
| Total noncurrent liabilities | 41,766 | 41,465 | |||||||||
| Stockholders' equity (deficit) | |||||||||||
Common stock, 659,797,256 shares outstanding at June 30, 2025 | 7 | 7 | |||||||||
| Additional paid-in capital | 7,370 | 7,424 | |||||||||
| Accumulated other comprehensive loss | (4,530) | (4,565) | |||||||||
| Retained deficit | (6,717) | (6,843) | |||||||||
| Total stockholders' deficit | (3,870) | (3,977) | |||||||||
| Total liabilities and stockholders’ equity (deficit) | $ | 63,667 | $ | 61,783 | |||||||