Exhibit 99.1

 | Corporate Communications | |||||||
| [email protected] | ||||||||
| Investor Relations | ||||||||
| [email protected] | ||||||||
FOR RELEASE: Thursday, Oct. 21, 2021
AMERICAN AIRLINES REPORTS THIRD-QUARTER 2021 FINANCIAL RESULTS
FORT WORTH, Texas –– American Airlines Group Inc. (NASDAQ: AAL) today reported its third-quarter 2021 financial results, including:
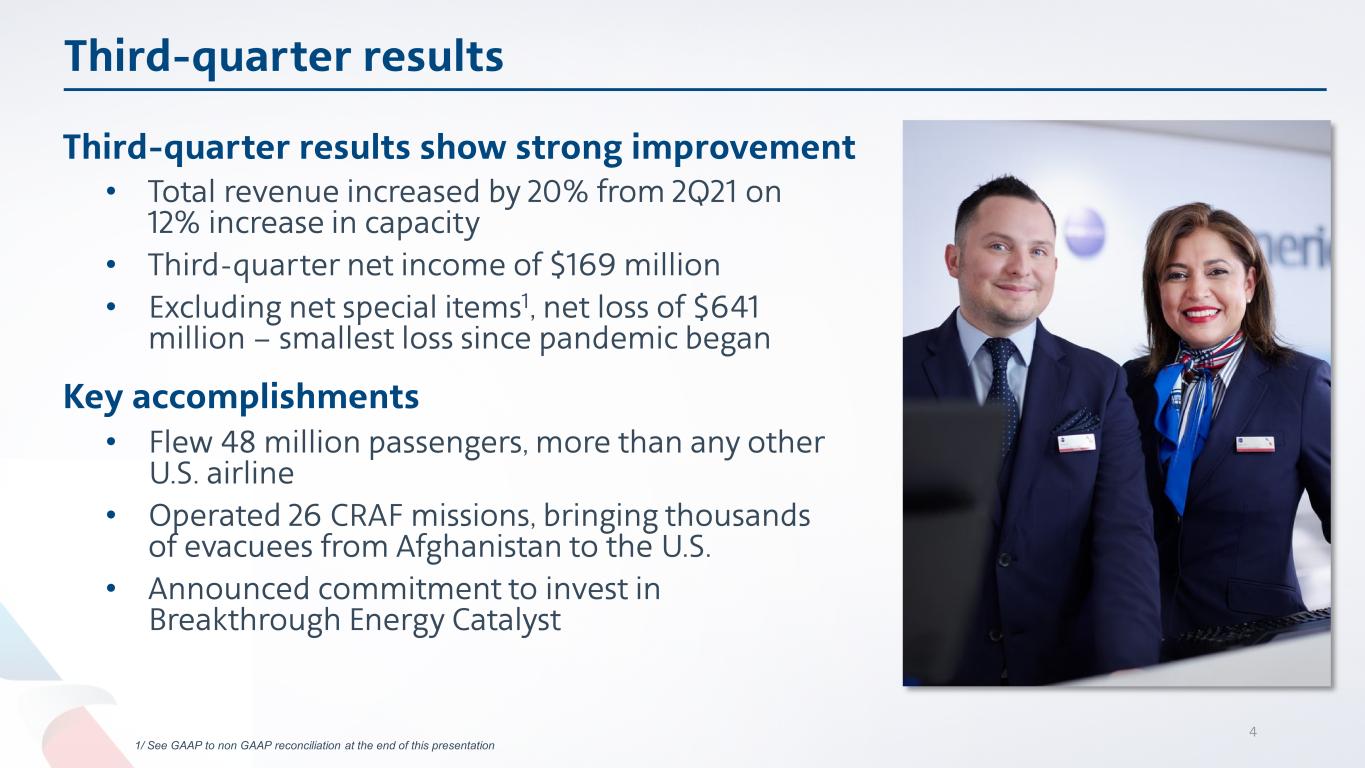
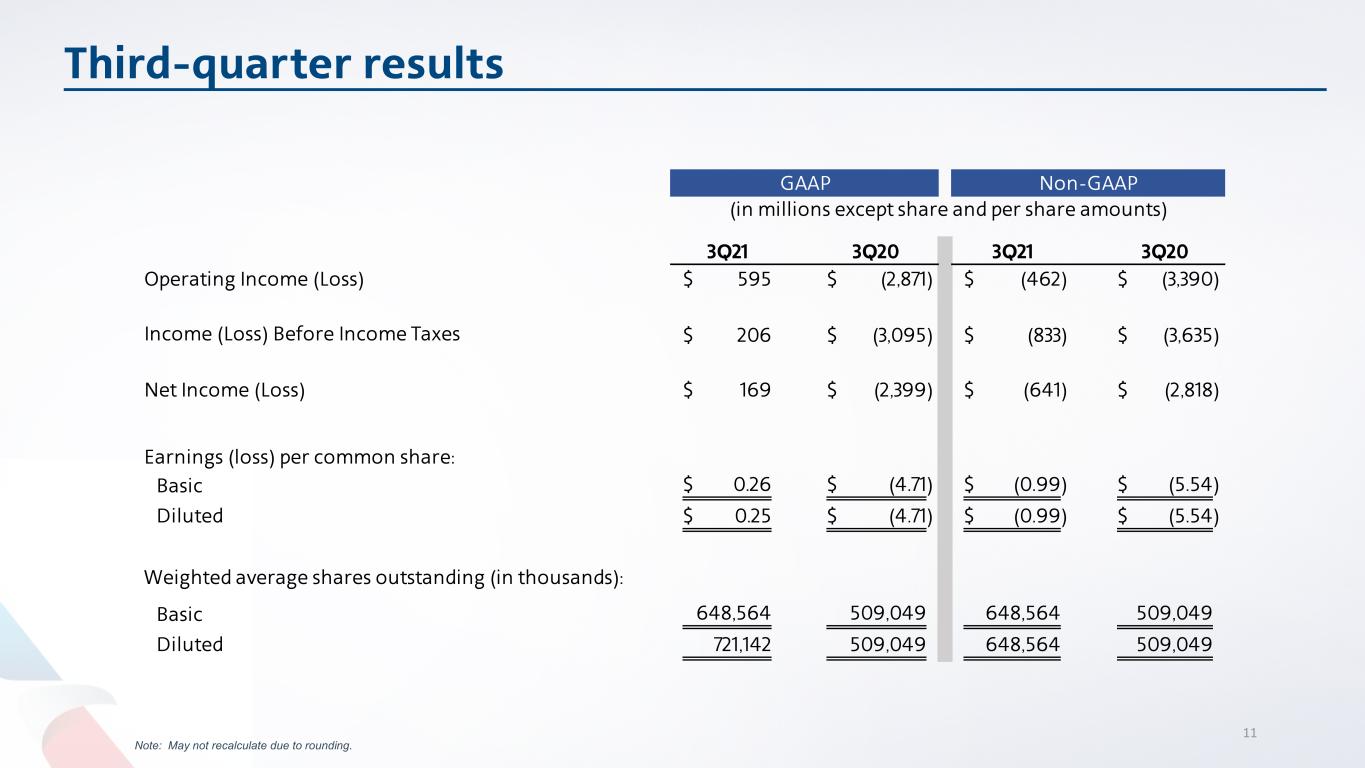
•Third-quarter net profit of $169 million, or $0.25 per diluted share. Excluding net special items1, third-quarter net loss of $641 million, or ($0.99) per share.
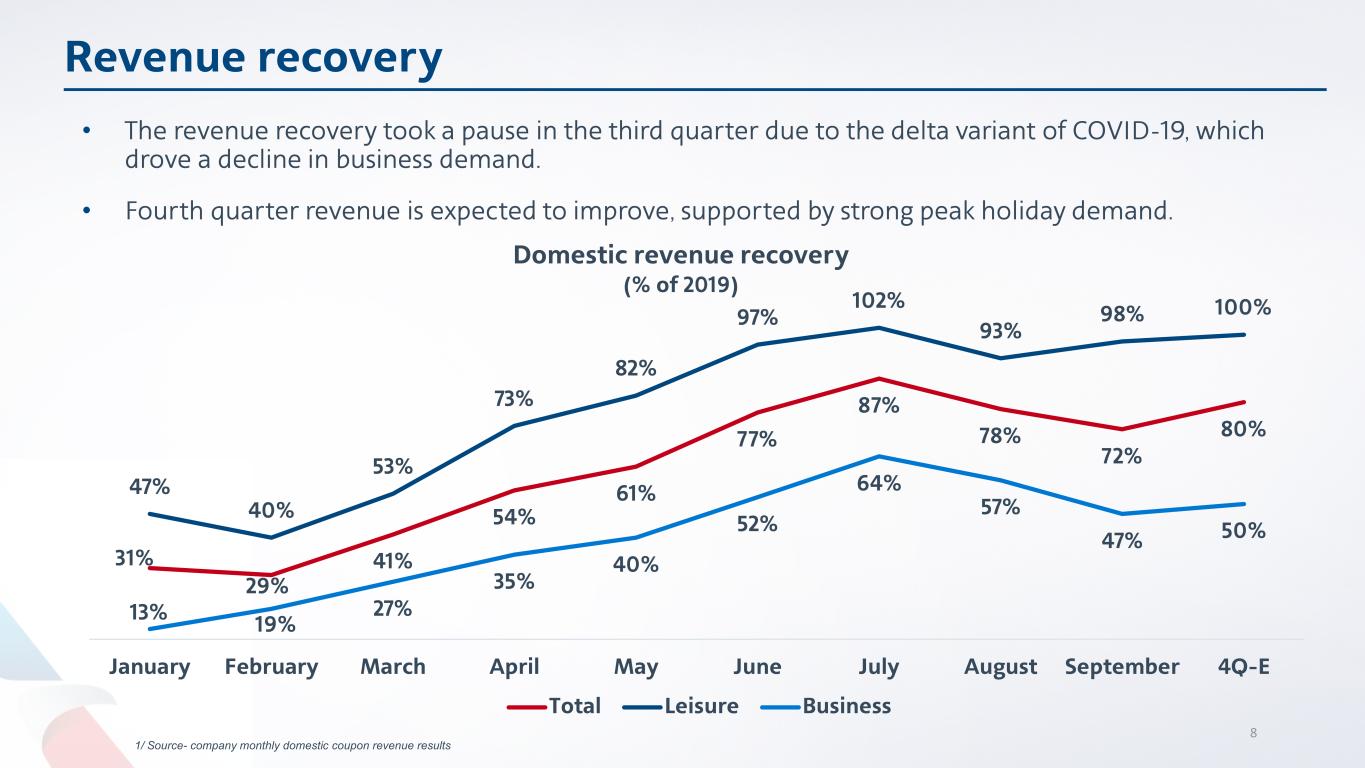
•Third-quarter revenue of $9.0 billion, up 20% sequentially from the second quarter of 2021.
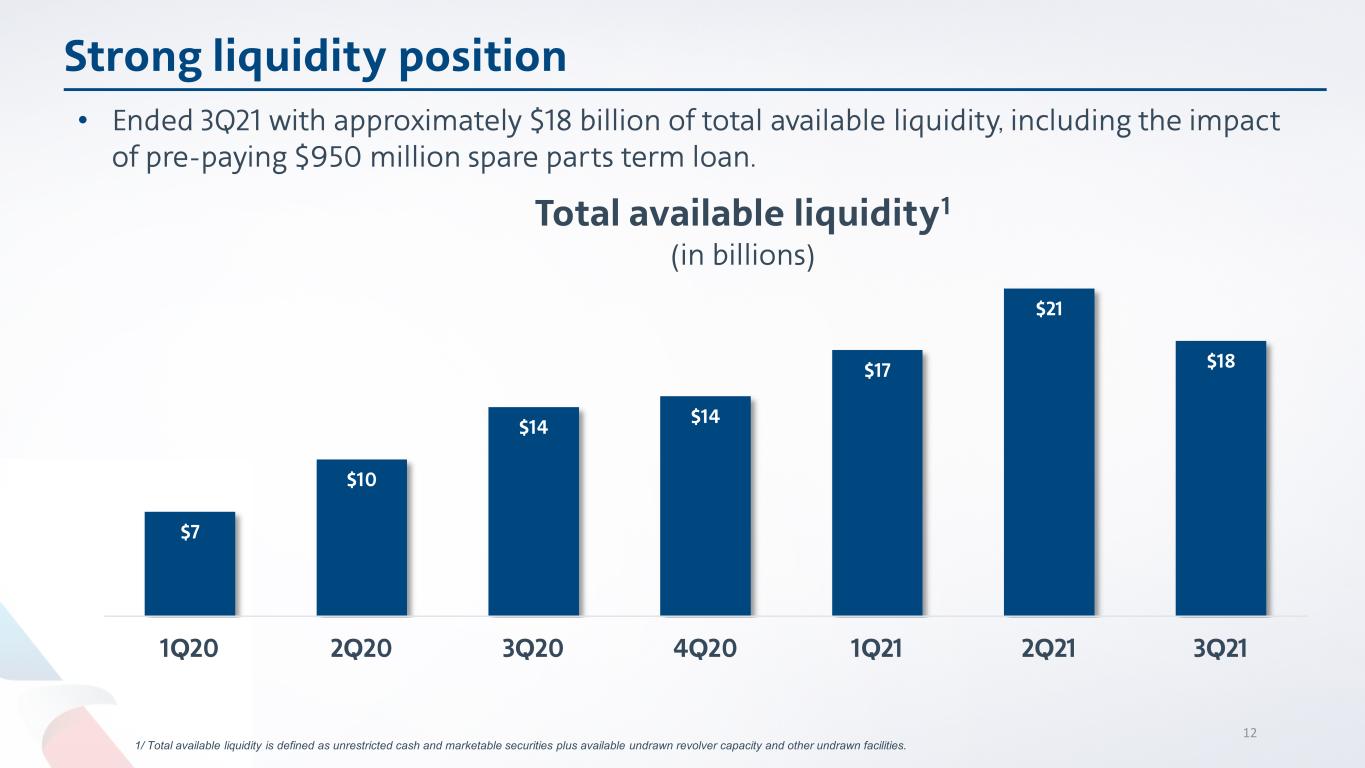
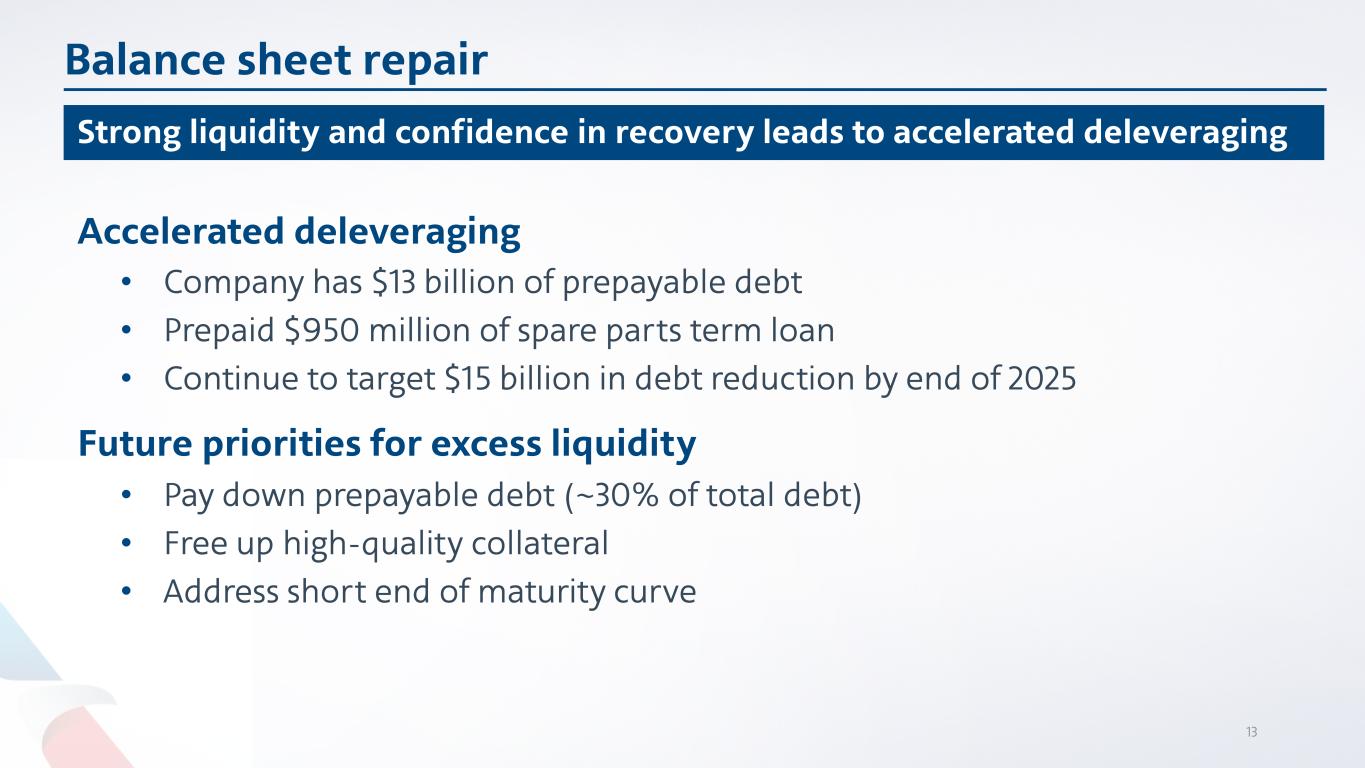
•Ended the third quarter with approximately $18 billion of total available liquidity, after prepayment of $950 million spare parts term loan during the quarter.
•Company continues to expect robust demand during peak travel periods in the fourth quarter, with more than 6,000 peak day departures.
•Company continues to execute on its plan to pay down approximately $15 billion of debt by the end of 2025.
“The American Airlines team continues to demonstrate its resilience and ability to execute, enabling us to deliver our best quarter since the pandemic began as measured by pre-tax financial results,” said American’s Chairman and CEO Doug Parker. “While the rise of the COVID-19 delta variant delayed some of our revenue recovery, it has not stopped our progress. We are incredibly proud of the team’s hard work to operate a great airline, and with the network, cost and fleet simplification actions we have taken, we’re confident American is well-positioned as the recovery takes hold.”
American is committed to strengthening its business and returning to profitability by focusing on its three strategic objectives: Create a world-class customer experience, make culture a competitive advantage and build American to thrive forever.
To create a world-class customer experience, American:
•Reopened its industry-leading premium Flagship Lounges at John F. Kennedy International Airport (JFK) and Miami International Airport, with new chefs and creative menus in partnership with the James Beard Foundation.
•Introduced free access to live sports and news, 24/7, on the airline’s domestic narrowbody aircraft. American has the fastest Wi-Fi on more aircraft than any other carrier.
American Airlines Reports Third-Quarter 2021 Financial Results
Oct. 21, 2021
Page 2
•Was recognized by the American Society of Travel Advisors (ASTA) as Airline Partner of the Year for the third year in a row for its work supporting travel advisors. ASTA is the world's largest association of travel professionals and strives to promote excellence within the travel industry, while recognizing professionals who make lasting contributions to the industry.
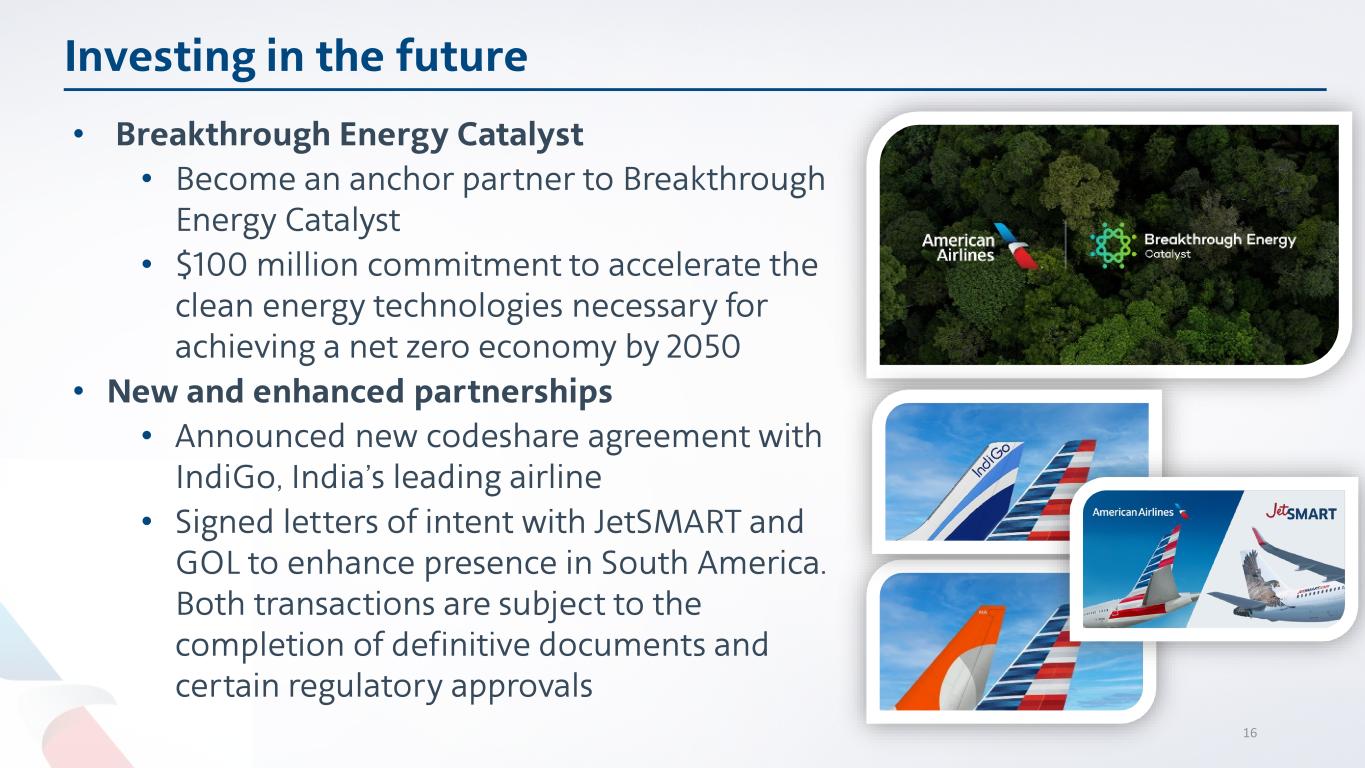
•Announced a new codeshare agreement with IndiGo, India’s leading airline. The agreement will place American’s code on 29 IndiGo domestic routes in India, providing a convenient option for customers arriving on American’s new Bengaluru (BLR) and Delhi (DEL) flights.
•Signed letters of intent to establish a partnership with JetSMART and expand its partnership with GOL to build on its strong South American network and increase long-haul flying. Both transactions are subject to the completion of definitive documents and certain regulatory approvals.
To make culture a competitive advantage, American:
•Operated 26 missions as part of the U.S. Civil Reserve Air Fleet (CRAF) program, aiding in the effort to bring thousands of evacuees from Afghanistan to the U.S. Team members throughout the airline and around the world came together to support American’s CRAF activation.
•Delivered 4.5 million COVID-19 vaccine doses to Guatemala as part of the White House’s plan to share at least 80 million U.S. vaccine doses globally this summer.
•Was named to the Seramount 2021 Inclusion Index, which recognizes organizations for their efforts to create an inclusive workplace. Seramount evaluates nearly 200 organizations and helps them understand trends and gaps in demographic representation and identify diversity, equity and inclusion solutions to close the gaps.
•Received a top score of 100 on the Disability Equality Index (DEI) and was named one of the best places to work for disability inclusion in 2021. The DEI was launched in 2015 by Disability:IN and The American Association of People with Disabilities and is acknowledged as the most robust disability inclusion assessment tool in business.
To build American to thrive forever, American:
•Announced that it is an anchor partner to Breakthrough Energy Catalyst, committing to invest $100 million in a groundbreaking collaborative effort to accelerate the clean energy technologies necessary for achieving a net zero economy by 2050. Breakthrough Energy Catalyst is a first-of-its-kind model that brings together companies, governments, and private philanthropy to accelerate the adoption of critical, next-generation clean technologies.
•Committed to develop a science-based target for reducing its greenhouse gas emissions by 2035, supporting the airline’s existing commitment to reach net-zero emissions by 2050. American also agreed to terms to purchase carbon-neutral sustainable aviation fuel (SAF) produced by Prometheus Fuels, which uses a novel process to make net-zero carbon transportation fuels, including SAF.
Northeast Alliance
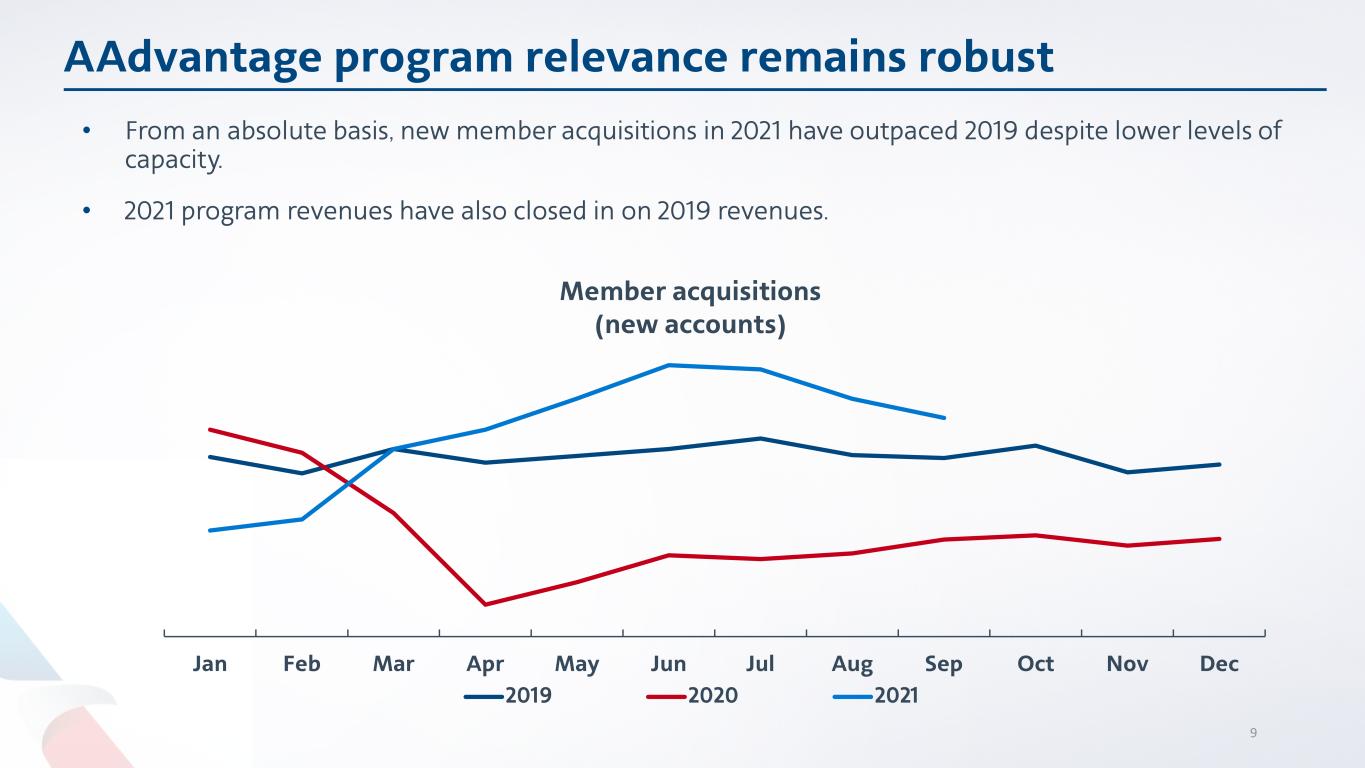
American and JetBlue continue to roll out benefits to create a seamless customer experience. AAdvantage® and TrueBlue Mosaic members now receive their elite benefits, including priority check-in, priority baggage, priority security and priority boarding, when traveling on both airlines. American also expects to introduce AAdvantage award redemption on JetBlue soon.
American Airlines Reports Third-Quarter 2021 Financial Results
Oct. 21, 2021
Page 3
Since January, American and JetBlue have brought more service to customers in New York and Boston, including 58 new routes, increased frequencies on more than 130 routes and codesharing on 175 routes. The alliance is connecting the Northeast to almost 150 global destinations, including 10 new international routes on American. These routes, made possible by the Northeast Alliance, include new services from JFK to Tel Aviv, Israel (TLV); Athens, Greece (ATH); and Delhi (DEL).
Liquidity and balance sheet
American ended the third quarter with approximately $18 billion of total available liquidity. During the quarter, the Company announced its intention to reduce its debt by $15 billion by the end of 2025. American plans to accomplish this through naturally occurring amortization and by using excess cash and free cash flow to pay down prepayable debt. As part of that plan, the Company prepaid in full its $950 million spare parts term loan facility in the third quarter. In addition, during the third quarter, American had scheduled debt amortization payments of approximately $649 million and unencumbered 20 Boeing 777-200 aircraft.
Guidance and investor update
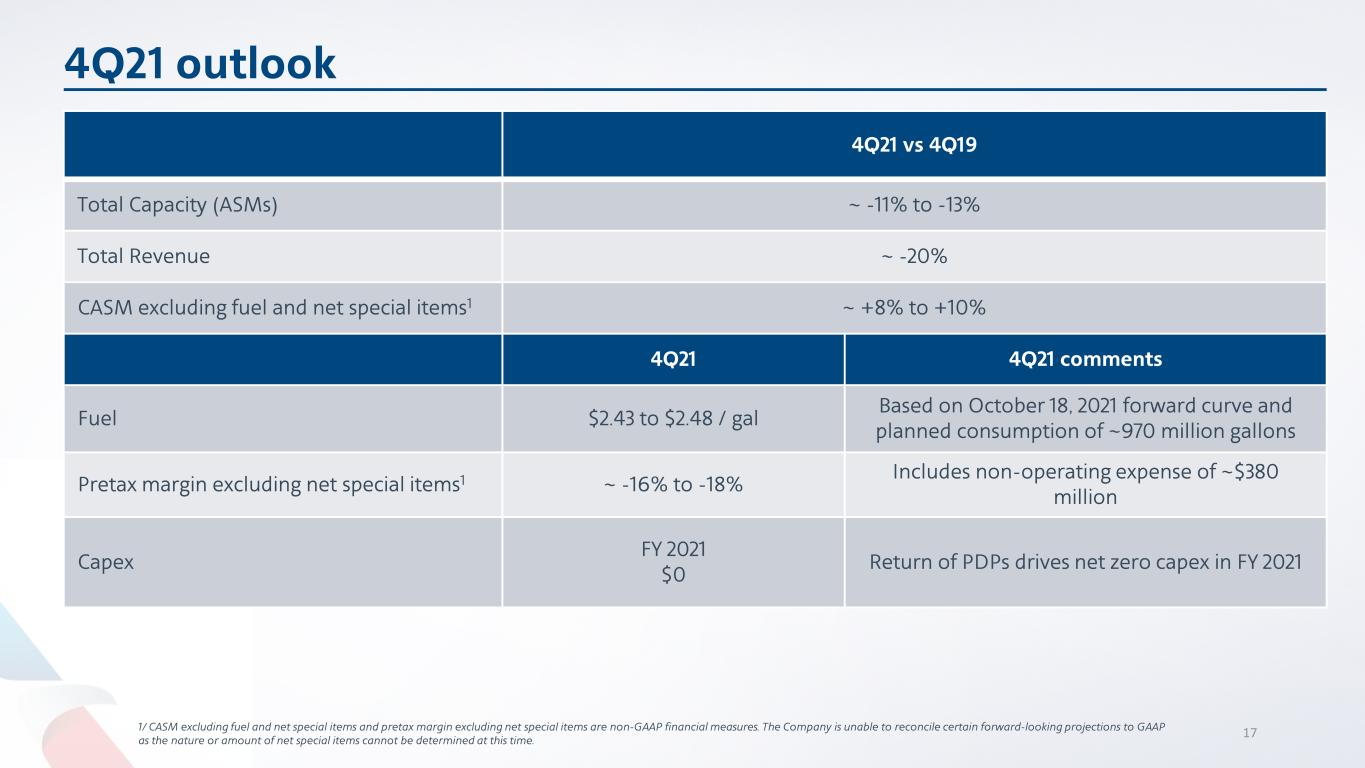
American will continue to match its forward capacity with observed bookings trends. Based on current trends, the Company expects its fourth-quarter capacity to be down approximately 11% to 13% compared to the fourth quarter of 2019. American expects its fourth-quarter total revenue to be down approximately 20% versus the fourth quarter of 2019. The Company also expects its fourth quarter pre-tax margin excluding net special items will be between negative 16% and negative 18%2.
For additional financial forecasting detail, please refer to the Company’s investor update, filed with this press release with the SEC on Form 8-K. This filing will also be available at
aa.com/investorrelations.
Conference call and webcast details
The Company will conduct a live audio webcast of its financial results conference call at 7:30 a.m. CDT today. The call will be available to the public on a listen-only basis at
aa.com/investorrelations. An archive of the webcast will be available on the website through at least Nov. 21.
Notes
See the accompanying notes in the Financial Tables section of this press release for further explanation, including a reconciliation of all GAAP to non-GAAP financial information.
1.The Company recognized $1.04 billion of net special credits before the effect of taxes in the third quarter of 2021 principally related to the financial assistance received pursuant to Payroll Support Program Agreements with the U.S. Department of Treasury.
2.American is unable to reconcile certain forward-looking projections to GAAP, as the nature or amount of net special items cannot be determined at this time.
About American Airlines Group
American's purpose is to care for people on life’s journey. Shares of American Airlines Group Inc. trade on Nasdaq under the ticker symbol AAL and the Company’s stock is included in the S&P 500. Learn more about what’s happening at American by visiting news.aa.com and connect with American on Twitter @AmericanAir and at Facebook.com/AmericanAirlines.
American Airlines Reports Third-Quarter 2021 Financial Results
Oct. 21, 2021
Page 4
Cautionary statement regarding forward-looking statements and information
Certain of the statements contained in this report should be considered forward-looking statements within the meaning of the Securities Act, the Exchange Act and the Private Securities Litigation Reform Act of 1995. These forward-looking statements may be identified by words such as “may,” “will,” “expect,” “intend,” “anticipate,” “believe,” “estimate,” “plan,” “project,” “could,” “should,” “would,” “continue,” “seek,” “target,” “guidance,” “outlook,” “if current trends continue,” “optimistic,” “forecast” and other similar words. Such statements include, but are not limited to, statements about the Company’s plans, objectives, expectations, intentions, estimates and strategies for the future, and other statements that are not historical facts. These forward-looking statements are based on the Company’s current objectives, beliefs and expectations, and they are subject to significant risks and uncertainties that may cause actual results and financial position and timing of certain events to differ materially from the information in the forward-looking statements. These risks and uncertainties include, but are not limited to, those set forth herein as well as in the Company’s Quarterly Report on Form 10-Q for the quarter ended September 30, 2021 (especially in Part I, Item 2. Management’s Discussion and Analysis of Financial Condition and Results of Operations and Part II, Item 1A. Risk Factors), and other risks and uncertainties listed from time to time in the Company’s other filings with the Securities and Exchange Commission. In particular, the consequences of the coronavirus outbreak to economic conditions and the travel industry in general and the financial position and operating results of the Company in particular have been material, are changing rapidly, and cannot be predicted. Additionally, there may be other factors of which the Company is not currently aware that may affect matters discussed in the forward-looking statements and may also cause actual results to differ materially from those discussed. The Company does not assume any obligation to publicly update or supplement any forward-looking statement to reflect actual results, changes in assumptions or changes in other factors affecting these forward-looking statements other than as required by law. Any forward-looking statements speak only as of the date hereof or as of the dates indicated in the statement.
American Airlines Reports Third-Quarter 2021 Financial Results
Oct. 21, 2021
Page 5
American Airlines Group Inc.
Condensed Consolidated Statements of Operations
(In millions, except share and per share amounts)
(Unaudited)
| 3 Months Ended September 30, | Percent Increase (Decrease) | 9 Months Ended September 30, | Percent Increase (Decrease) | ||||||||||||||||||||||||||||||||
| 2021 | 2020 (1) | 2021 | 2020 (1) | ||||||||||||||||||||||||||||||||
| Operating revenues: | |||||||||||||||||||||||||||||||||||
| Passenger | $ | 7,957 | $ | 2,540 | nm | (2) | $ | 17,682 | $ | 11,328 | 56.1 | ||||||||||||||||||||||||
| Cargo | 332 | 207 | 59.9 | 973 | 484 | nm | |||||||||||||||||||||||||||||
| Other | 680 | 426 | 59.8 | 1,800 | 1,497 | 20.2 | |||||||||||||||||||||||||||||
| Total operating revenues | 8,969 | 3,173 | nm | 20,455 | 13,309 | 53.7 | |||||||||||||||||||||||||||||
| Operating expenses: | |||||||||||||||||||||||||||||||||||
| Aircraft fuel and related taxes | 1,952 | 611 | nm | 4,596 | 2,703 | 70.0 | |||||||||||||||||||||||||||||
| Salaries, wages and benefits | 3,018 | 2,763 | 9.3 | 8,611 | 8,592 | 0.2 | |||||||||||||||||||||||||||||
| Regional expenses: | |||||||||||||||||||||||||||||||||||
| Regional operating expenses | 809 | 450 | 80.1 | 1,912 | 1,914 | (0.1) | |||||||||||||||||||||||||||||
| Regional depreciation and amortization | 78 | 79 | (1.7) | 236 | 247 | (4.2) | |||||||||||||||||||||||||||||
| Maintenance, materials and repairs | 548 | 337 | 62.3 | 1,383 | 1,253 | 10.4 | |||||||||||||||||||||||||||||
| Other rent and landing fees | 694 | 472 | 47.1 | 1,950 | 1,495 | 30.4 | |||||||||||||||||||||||||||||
| Aircraft rent | 358 | 336 | 6.6 | 1,064 | 1,004 | 6.0 | |||||||||||||||||||||||||||||
| Selling expenses | 318 | 97 | nm | 745 | 540 | 38.1 | |||||||||||||||||||||||||||||
| Depreciation and amortization | 480 | 498 | (3.5) | 1,439 | 1,557 | (7.5) | |||||||||||||||||||||||||||||
| Special items, net | (990) | (295) | nm | (3,986) | (657) | nm | |||||||||||||||||||||||||||||
| Other | 1,109 | 696 | 59.2 | 2,784 | 2,567 | 8.4 | |||||||||||||||||||||||||||||
| Total operating expenses | 8,374 | 6,044 | 38.5 | 20,734 | 21,215 | (2.3) | |||||||||||||||||||||||||||||
| Operating income (loss) | 595 | (2,871) | nm | (279) | (7,906) | (96.5) | |||||||||||||||||||||||||||||
| Nonoperating income (expense): | |||||||||||||||||||||||||||||||||||
| Interest income | 5 | 5 | (4.1) | 13 | 36 | (63.2) | |||||||||||||||||||||||||||||
| Interest expense, net | (476) | (340) | 40.0 | (1,332) | (851) | 56.4 | |||||||||||||||||||||||||||||
| Other income, net | 82 | 111 | (26.0) | 241 | 77 | nm | |||||||||||||||||||||||||||||
| Total nonoperating expense, net | (389) | (224) | 73.8 | (1,078) | (738) | 46.2 | |||||||||||||||||||||||||||||
| Income (loss) before income taxes | 206 | (3,095) | nm | (1,357) | (8,644) | (84.3) | |||||||||||||||||||||||||||||
| Income tax provision (benefit) | 37 | (696) | nm | (296) | (1,937) | (84.7) | |||||||||||||||||||||||||||||
| Net income (loss) | $ | 169 | $ | (2,399) | nm | $ | (1,061) | $ | (6,707) | (84.2) | |||||||||||||||||||||||||
| Earnings (loss) per common share: | |||||||||||||||||||||||||||||||||||
| Basic | $ | 0.26 | $ | (4.71) | $ | (1.65) | $ | (14.76) | |||||||||||||||||||||||||||
| Diluted | $ | 0.25 | $ | (4.71) | $ | (1.65) | $ | (14.76) | |||||||||||||||||||||||||||
| Weighted average shares outstanding (in thousands): | |||||||||||||||||||||||||||||||||||
| Basic | 648,564 | 509,049 | 642,432 | 454,523 | |||||||||||||||||||||||||||||||
| Diluted | 721,142 | 509,049 | 642,432 | 454,523 | |||||||||||||||||||||||||||||||
Note: Percent change may not recalculate due to rounding.
(1)Beginning in the first quarter of 2021, aircraft fuel and related taxes as well as certain salaries, wages and benefits, other rent and landing fees, selling and other expenses are no longer allocated to regional expenses on the Company's condensed consolidated statements of operations. The three and nine months ended September 30, 2020 condensed consolidated statements of operations have been recast to conform to the 2021 presentation. This statement of operations presentation change has no impact on total operating expenses or net loss.
(2)Not meaningful or greater than 100% change.
American Airlines Reports Third-Quarter 2021 Financial Results
Oct. 21, 2021
Page 6
American Airlines Group Inc.
Consolidated Operating Statistics (1)
(Unaudited)
| 3 Months Ended September 30, | Increase (Decrease) | 9 Months Ended September 30, | Increase (Decrease) | ||||||||||||||||||||||||||||||||
| 2021 | 2020 | 2021 | 2020 | ||||||||||||||||||||||||||||||||
| Revenue passenger miles (millions) | 48,069 | 18,121 | nm % | 112,555 | 70,523 | 59.6 % | |||||||||||||||||||||||||||||
| Available seat miles (ASM) (millions) | 61,111 | 30,768 | 98.6 % | 153,431 | 109,948 | 39.5 % | |||||||||||||||||||||||||||||
| Passenger load factor (percent) | 78.7 | 58.9 | 19.8 pts | 73.4 | 64.1 | 9.3 pts | |||||||||||||||||||||||||||||
| Yield (cents) | 16.55 | 14.01 | 18.1 % | 15.71 | 16.06 | (2.2) % | |||||||||||||||||||||||||||||
| Passenger revenue per ASM (cents) | 13.02 | 8.25 | 57.8 % | 11.52 | 10.30 | 11.9 % | |||||||||||||||||||||||||||||
| Total revenue per ASM (cents) | 14.68 | 10.31 | 42.3 % | 13.33 | 12.11 | 10.1 % | |||||||||||||||||||||||||||||
| Cargo ton miles (millions) | 510 | 337 | 51.5 % | 1,597 | 949 | 68.3 % | |||||||||||||||||||||||||||||
| Cargo yield per ton mile (cents) | 65.02 | 61.61 | 5.5 % | 60.94 | 51.05 | 19.4 % | |||||||||||||||||||||||||||||
| Fuel consumption (gallons in millions) | 941 | 499 | 88.5 % | 2,393 | 1,745 | 37.1 % | |||||||||||||||||||||||||||||
| Average aircraft fuel price including related taxes (dollars per gallon) | 2.07 | 1.23 | 69.3 % | 1.92 | 1.55 | 24.0 % | |||||||||||||||||||||||||||||
| Operating cost per ASM (cents) | 13.70 | 19.64 | (30.2) % | 13.51 | 19.30 | (30.0) % | |||||||||||||||||||||||||||||
| Operating cost per ASM excluding net special items (cents) | 15.43 | 21.33 | (27.7) % | 16.40 | 20.17 | (18.7) % | |||||||||||||||||||||||||||||
| Operating cost per ASM excluding net special items and fuel (cents) | 12.24 | 19.34 | (36.7) % | 13.41 | 17.72 | (24.3) % | |||||||||||||||||||||||||||||
| Passenger enplanements (thousands) | 48,129 | 21,114 | nm % | 116,384 | 71,686 | 62.4 % | |||||||||||||||||||||||||||||
| Departures (thousands): | |||||||||||||||||||||||||||||||||||
| Mainline | 245 | 144 | 69.7 % | 618 | 478 | 29.3 % | |||||||||||||||||||||||||||||
| Regional | 263 | 163 | 61.8 % | 696 | 546 | 27.5 % | |||||||||||||||||||||||||||||
| Total | 508 | 307 | 65.5 % | 1,314 | 1,024 | 28.4 % | |||||||||||||||||||||||||||||
| Average stage length (miles): | |||||||||||||||||||||||||||||||||||
| Mainline | 1,171 | 1,094 | 7.0 % | 1,180 | 1,121 | 5.3 % | |||||||||||||||||||||||||||||
| Regional | 482 | 465 | 3.7 % | 489 | 470 | 3.9 % | |||||||||||||||||||||||||||||
| Total | 814 | 761 | 7.0 % | 813 | 774 | 5.1 % | |||||||||||||||||||||||||||||
| Aircraft at end of period: | |||||||||||||||||||||||||||||||||||
Mainline (2) | 857 | 848 | 1.1 % | 857 | 848 | 1.1 % | |||||||||||||||||||||||||||||
Regional (3) | 557 | 533 | 4.5 % | 557 | 533 | 4.5 % | |||||||||||||||||||||||||||||
| Total | 1,414 | 1,381 | 2.4 % | 1,414 | 1,381 | 2.4 % | |||||||||||||||||||||||||||||
| Full-time equivalent employees at end of period: | |||||||||||||||||||||||||||||||||||
| Mainline | 94,000 | 87,700 | 7.2 % | 94,000 | 87,700 | 7.2 % | |||||||||||||||||||||||||||||
Regional (4) | 25,800 | 22,800 | 13.2 % | 25,800 | 22,800 | 13.2 % | |||||||||||||||||||||||||||||
| Total | 119,800 | 110,500 | 8.4 % | 119,800 | 110,500 | 8.4 % | |||||||||||||||||||||||||||||
Note: Amounts may not recalculate due to rounding.
(1)Unless otherwise noted, operating statistics include mainline and regional operations. Regional includes wholly-owned regional airline subsidiaries and operating results from capacity purchase carriers.
(2)Excludes 37 Boeing 737-800 mainline aircraft that are in temporary storage at September 30, 2021.
(3)Includes aircraft owned and leased by American as well as aircraft operated by third-party regional carriers under capacity purchase agreements. Excludes eight Embraer 145 and one Embraer 170 regional aircraft that are in temporary storage at September 30, 2021.
(4)Regional full-time equivalent employees only include our wholly-owned regional airline subsidiaries.
American Airlines Reports Third-Quarter 2021 Financial Results
Oct. 21, 2021
Page 7
American Airlines Group Inc.
Consolidated Revenue Statistics by Region
(Unaudited)
| 3 Months Ended September 30, | Increase (Decrease) | 9 Months Ended September 30, | Increase (Decrease) | ||||||||||||||||||||||||||||||||
| 2021 | 2020 | 2021 | 2020 | ||||||||||||||||||||||||||||||||
Domestic (1) | |||||||||||||||||||||||||||||||||||
| Revenue passenger miles (millions) | 38,869 | 16,508 | nm % | 92,277 | 55,168 | 67.3 % | |||||||||||||||||||||||||||||
| Available seat miles (ASM) (millions) | 46,505 | 26,284 | 76.9 % | 115,494 | 85,956 | 34.4 % | |||||||||||||||||||||||||||||
| Passenger load factor (percent) | 83.6 | 62.8 | 20.8 pts | 79.9 | 64.2 | 15.7 pts | |||||||||||||||||||||||||||||
| Passenger revenue (dollars in millions) | 6,547 | 2,296 | nm % | 14,646 | 9,102 | 60.9 % | |||||||||||||||||||||||||||||
| Yield (cents) | 16.84 | 13.91 | 21.1 % | 15.87 | 16.50 | (3.8) % | |||||||||||||||||||||||||||||
| Passenger revenue per ASM (cents) | 14.08 | 8.74 | 61.2 % | 12.68 | 10.59 | 19.8 % | |||||||||||||||||||||||||||||
Latin America (2) | |||||||||||||||||||||||||||||||||||
| Revenue passenger miles (millions) | 5,759 | 1,133 | nm % | 15,306 | 8,450 | 81.2 % | |||||||||||||||||||||||||||||
| Available seat miles (millions) | 7,733 | 1,773 | nm % | 24,059 | 11,541 | nm % | |||||||||||||||||||||||||||||
| Passenger load factor (percent) | 74.5 | 63.9 | 10.6 pts | 63.6 | 73.2 | (9.6) pts | |||||||||||||||||||||||||||||
| Passenger revenue (dollars in millions) | 957 | 172 | nm % | 2,375 | 1,386 | 71.3 % | |||||||||||||||||||||||||||||
| Yield (cents) | 16.62 | 15.23 | 9.1 % | 15.52 | 16.41 | (5.4) % | |||||||||||||||||||||||||||||
| Passenger revenue per ASM (cents) | 12.38 | 9.73 | 27.2 % | 9.87 | 12.01 | (17.8) % | |||||||||||||||||||||||||||||
| Atlantic | |||||||||||||||||||||||||||||||||||
| Revenue passenger miles (millions) | 3,163 | 342 | nm % | 4,302 | 4,716 | (8.8) % | |||||||||||||||||||||||||||||
| Available seat miles (millions) | 6,035 | 1,827 | nm % | 11,222 | 8,883 | 26.3 % | |||||||||||||||||||||||||||||
| Passenger load factor (percent) | 52.4 | 18.7 | 33.7 pts | 38.3 | 53.1 | (14.8) pts | |||||||||||||||||||||||||||||
| Passenger revenue (dollars in millions) | 408 | 56 | nm % | 555 | 621 | (10.6) % | |||||||||||||||||||||||||||||
| Yield (cents) | 12.90 | 16.22 | (20.5) % | 12.90 | 13.16 | (2.0) % | |||||||||||||||||||||||||||||
| Passenger revenue per ASM (cents) | 6.76 | 3.04 | nm % | 4.94 | 6.99 | (29.3) % | |||||||||||||||||||||||||||||
| Pacific | |||||||||||||||||||||||||||||||||||
| Revenue passenger miles (millions) | 278 | 138 | nm % | 670 | 2,189 | (69.4) % | |||||||||||||||||||||||||||||
| Available seat miles (millions) | 838 | 884 | (5.2) % | 2,656 | 3,568 | (25.6) % | |||||||||||||||||||||||||||||
| Passenger load factor (percent) | 33.1 | 15.6 | 17.5 pts | 25.2 | 61.4 | (36.2) pts | |||||||||||||||||||||||||||||
| Passenger revenue (dollars in millions) | 45 | 16 | nm % | 106 | 219 | (51.4) % | |||||||||||||||||||||||||||||
| Yield (cents) | 16.35 | 11.28 | 45.0 % | 15.85 | 9.98 | 58.8 % | |||||||||||||||||||||||||||||
| Passenger revenue per ASM (cents) | 5.42 | 1.76 | nm % | 4.00 | 6.12 | (34.7) % | |||||||||||||||||||||||||||||
| Total International | |||||||||||||||||||||||||||||||||||
| Revenue passenger miles (millions) | 9,200 | 1,613 | nm % | 20,278 | 15,355 | 32.1 % | |||||||||||||||||||||||||||||
| Available seat miles (millions) | 14,606 | 4,484 | nm % | 37,937 | 23,992 | 58.1 % | |||||||||||||||||||||||||||||
| Passenger load factor (percent) | 63.0 | 36.0 | 27.0 pts | 53.5 | 64.0 | (10.5) pts | |||||||||||||||||||||||||||||
| Passenger revenue (dollars in millions) | 1,410 | 244 | nm % | 3,036 | 2,226 | 36.4 % | |||||||||||||||||||||||||||||
| Yield (cents) | 15.33 | 15.10 | 1.5 % | 14.97 | 14.49 | 3.3 % | |||||||||||||||||||||||||||||
| Passenger revenue per ASM (cents) | 9.66 | 5.43 | 77.8 % | 8.00 | 9.28 | (13.7) % | |||||||||||||||||||||||||||||
Note: Amounts may not recalculate due to rounding.
(1)Domestic results include Canada, Puerto Rico and U.S. Virgin Islands.
(2)Latin America results include the Caribbean.
American Airlines Reports Third-Quarter 2021 Financial Results
Oct. 21, 2021
Page 8
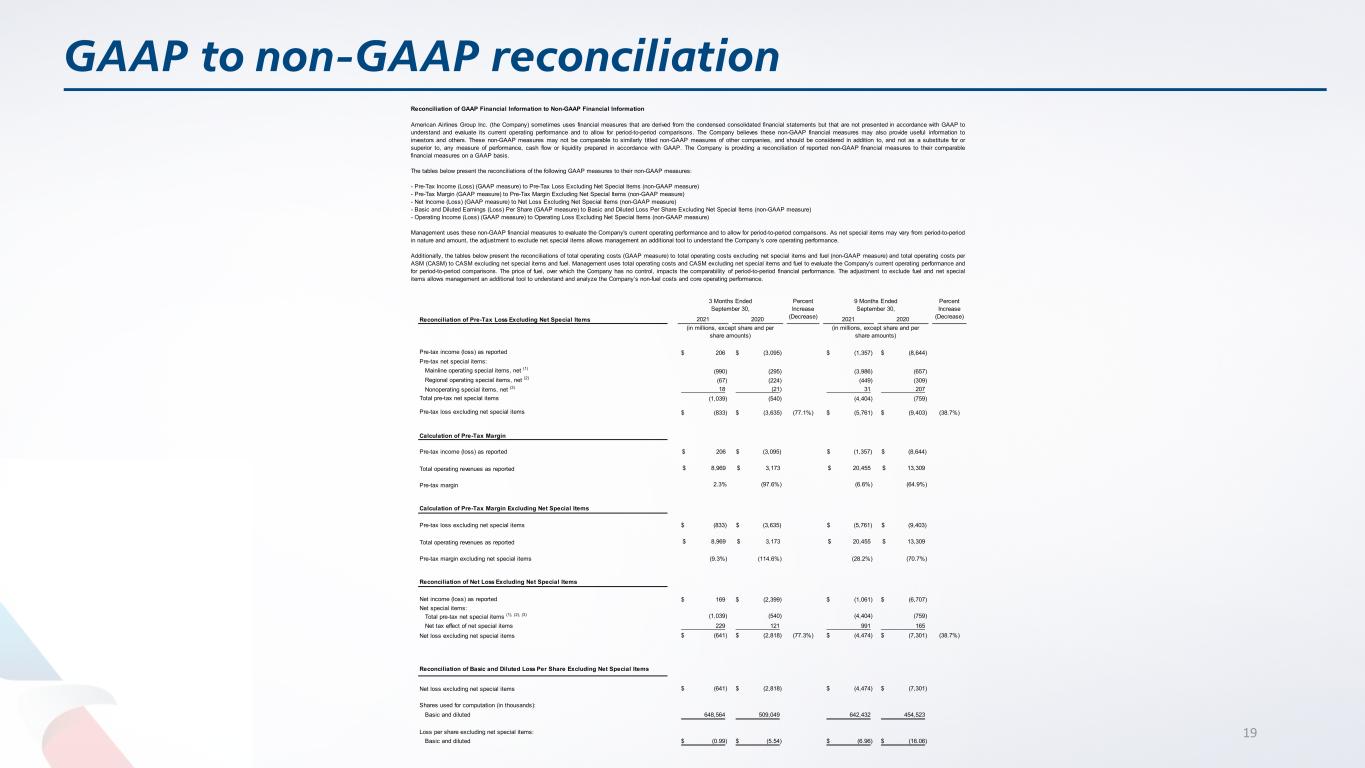
Reconciliation of GAAP Financial Information to Non-GAAP Financial Information
American Airlines Group Inc. (the Company) sometimes uses financial measures that are derived from the condensed consolidated financial statements but that are not presented in accordance with GAAP to understand and evaluate its current operating performance and to allow for period-to-period comparisons. The Company believes these non-GAAP financial measures may also provide useful information to investors and others. These non-GAAP measures may not be comparable to similarly titled non-GAAP measures of other companies, and should be considered in addition to, and not as a substitute for or superior to, any measure of performance, cash flow or liquidity prepared in accordance with GAAP. The Company is providing a reconciliation of reported non-GAAP financial measures to their comparable financial measures on a GAAP basis.
The tables below present the reconciliations of the following GAAP measures to their non-GAAP measures:
–Pre-Tax Income (Loss) (GAAP measure) to Pre-Tax Loss Excluding Net Special Items (non-GAAP measure)
–Pre-Tax Margin (GAAP measure) to Pre-Tax Margin Excluding Net Special Items (non-GAAP measure)
–Net Income (Loss) (GAAP measure) to Net Loss Excluding Net Special Items (non-GAAP measure)
–Basic and Diluted Earnings (Loss) Per Share (GAAP measure) to Basic and Diluted Loss Per Share Excluding Net Special Items (non-GAAP measure)
–Operating Income (Loss) (GAAP measure) to Operating Loss Excluding Net Special Items (non-GAAP measure)
Management uses these non-GAAP financial measures to evaluate the Company's current operating performance and to allow for period-to-period comparisons. As net special items may vary from period-to-period in nature and amount, the adjustment to exclude net special items allows management an additional tool to understand the Company’s core operating performance.
Additionally, the tables below present the reconciliations of total operating costs (GAAP measure) to total operating costs excluding net special items and fuel (non-GAAP measure) and total operating costs per ASM (CASM) to CASM excluding net special items and fuel. Management uses total operating costs and CASM excluding net special items and fuel to evaluate the Company's current operating performance and for period-to-period comparisons. The price of fuel, over which the Company has no control, impacts the comparability of period-to-period financial performance. The adjustment to exclude fuel and net special items allows management an additional tool to understand and analyze the Company’s non-fuel costs and core operating performance.
| Reconciliation of Pre-Tax Loss Excluding Net Special Items | 3 Months Ended September 30, | Percent Increase (Decrease) | 9 Months Ended September 30, | Percent Increase (Decrease) | ||||||||||||||||||||||||||||||||||
| 2021 | 2020 | 2021 | 2020 | |||||||||||||||||||||||||||||||||||
| (in millions, except share and per share amounts) | (in millions, except share and per share amounts) | |||||||||||||||||||||||||||||||||||||
| Pre-tax income (loss) as reported | $ | 206 | $ | (3,095) | $ | (1,357) | $ | (8,644) | ||||||||||||||||||||||||||||||
| Pre-tax net special items: | ||||||||||||||||||||||||||||||||||||||
Mainline operating special items, net (1) | (990) | (295) | (3,986) | (657) | ||||||||||||||||||||||||||||||||||
Regional operating special items, net (2) | (67) | (224) | (449) | (309) | ||||||||||||||||||||||||||||||||||
Nonoperating special items, net (3) | 18 | (21) | 31 | 207 | ||||||||||||||||||||||||||||||||||
| Total pre-tax net special items | (1,039) | (540) | (4,404) | (759) | ||||||||||||||||||||||||||||||||||
| Pre-tax loss excluding net special items | $ | (833) | $ | (3,635) | (77.1%) | $ | (5,761) | $ | (9,403) | (38.7%) | ||||||||||||||||||||||||||||
| Calculation of Pre-Tax Margin | ||||||||||||||||||||||||||||||||||||||
| Pre-tax income (loss) as reported | $ | 206 | $ | (3,095) | $ | (1,357) | $ | (8,644) | ||||||||||||||||||||||||||||||
| Total operating revenues as reported | $ | 8,969 | $ | 3,173 | $ | 20,455 | $ | 13,309 | ||||||||||||||||||||||||||||||
| Pre-tax margin | 2.3% | (97.6%) | (6.6%) | (64.9%) | ||||||||||||||||||||||||||||||||||
| Calculation of Pre-Tax Margin Excluding Net Special Items | ||||||||||||||||||||||||||||||||||||||
| Pre-tax loss excluding net special items | $ | (833) | $ | (3,635) | $ | (5,761) | $ | (9,403) | ||||||||||||||||||||||||||||||
| Total operating revenues as reported | $ | 8,969 | $ | 3,173 | $ | 20,455 | $ | 13,309 | ||||||||||||||||||||||||||||||
| Pre-tax margin excluding net special items | (9.3%) | (114.6%) | (28.2%) | (70.7%) | ||||||||||||||||||||||||||||||||||
| Reconciliation of Net Loss Excluding Net Special Items | ||||||||||||||||||||||||||||||||||||||
| Net income (loss) as reported | $ | 169 | $ | (2,399) | $ | (1,061) | $ | (6,707) | ||||||||||||||||||||||||||||||
| Net special items: | ||||||||||||||||||||||||||||||||||||||
Total pre-tax net special items (1), (2), (3) | (1,039) | (540) | (4,404) | (759) | ||||||||||||||||||||||||||||||||||
| Net tax effect of net special items | 229 | 121 | 991 | 165 | ||||||||||||||||||||||||||||||||||
| Net loss excluding net special items | $ | (641) | $ | (2,818) | (77.3%) | $ | (4,474) | $ | (7,301) | (38.7%) | ||||||||||||||||||||||||||||
| Reconciliation of Basic and Diluted Loss Per Share Excluding Net Special Items | ||||||||||||||||||||||||||||||||||||||
| Net loss excluding net special items | $ | (641) | $ | (2,818) | $ | (4,474) | $ | (7,301) | ||||||||||||||||||||||||||||||
| Shares used for computation (in thousands): | ||||||||||||||||||||||||||||||||||||||
| Basic and diluted | 648,564 | 509,049 | 642,432 | 454,523 | ||||||||||||||||||||||||||||||||||
| Loss per share excluding net special items: | ||||||||||||||||||||||||||||||||||||||
| Basic and diluted | $ | (0.99) | $ | (5.54) | $ | (6.96) | $ | (16.06) | ||||||||||||||||||||||||||||||
American Airlines Reports Third-Quarter 2021 Financial Results
Oct. 21, 2021
Page 9
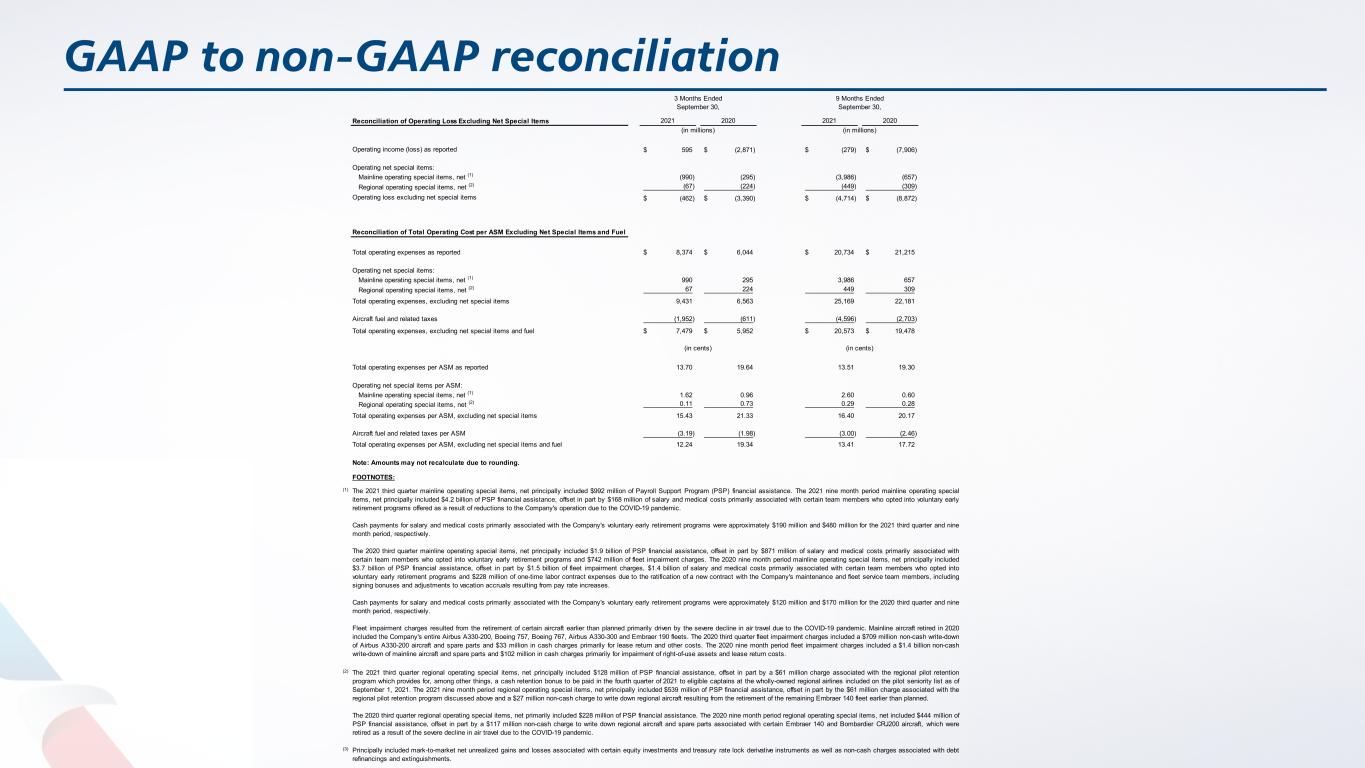
| Reconciliation of Operating Loss Excluding Net Special Items | 3 Months Ended September 30, | 9 Months Ended September 30, | ||||||||||||||||||||||||||||||||||||
| 2021 | 2020 | 2021 | 2020 | |||||||||||||||||||||||||||||||||||
| (in millions) | (in millions) | |||||||||||||||||||||||||||||||||||||
| Operating income (loss) as reported | $ | 595 | $ | (2,871) | $ | (279) | $ | (7,906) | ||||||||||||||||||||||||||||||
| Operating net special items: | ||||||||||||||||||||||||||||||||||||||
Mainline operating special items, net (1) | (990) | (295) | (3,986) | (657) | ||||||||||||||||||||||||||||||||||
Regional operating special items, net (2) | (67) | (224) | (449) | (309) | ||||||||||||||||||||||||||||||||||
| Operating loss excluding net special items | $ | (462) | $ | (3,390) | $ | (4,714) | $ | (8,872) | ||||||||||||||||||||||||||||||
| Reconciliation of Total Operating Cost per ASM Excluding Net Special Items and Fuel | ||||||||||||||||||||||||||||||||||||||
| Total operating expenses as reported | $ | 8,374 | $ | 6,044 | $ | 20,734 | $ | 21,215 | ||||||||||||||||||||||||||||||
| Operating net special items: | ||||||||||||||||||||||||||||||||||||||
Mainline operating special items, net (1) | 990 | 295 | 3,986 | 657 | ||||||||||||||||||||||||||||||||||
Regional operating special items, net (2) | 67 | 224 | 449 | 309 | ||||||||||||||||||||||||||||||||||
| Total operating expenses, excluding net special items | 9,431 | 6,563 | 25,169 | 22,181 | ||||||||||||||||||||||||||||||||||
| Aircraft fuel and related taxes | (1,952) | (611) | (4,596) | (2,703) | ||||||||||||||||||||||||||||||||||
| Total operating expenses, excluding net special items and fuel | $ | 7,479 | $ | 5,952 | $ | 20,573 | $ | 19,478 | ||||||||||||||||||||||||||||||
| (in cents) | (in cents) | |||||||||||||||||||||||||||||||||||||
| Total operating expenses per ASM as reported | 13.70 | 19.64 | 13.51 | 19.30 | ||||||||||||||||||||||||||||||||||
| Operating net special items per ASM: | ||||||||||||||||||||||||||||||||||||||
Mainline operating special items, net (1) | 1.62 | 0.96 | 2.60 | 0.60 | ||||||||||||||||||||||||||||||||||
Regional operating special items, net (2) | 0.11 | 0.73 | 0.29 | 0.28 | ||||||||||||||||||||||||||||||||||
| Total operating expenses per ASM, excluding net special items | 15.43 | 21.33 | 16.40 | 20.17 | ||||||||||||||||||||||||||||||||||
| Aircraft fuel and related taxes per ASM | (3.19) | (1.98) | (3.00) | (2.46) | ||||||||||||||||||||||||||||||||||
| Total operating expenses per ASM, excluding net special items and fuel | 12.24 | 19.34 | 13.41 | 17.72 | ||||||||||||||||||||||||||||||||||
Note: Amounts may not recalculate due to rounding.
FOOTNOTES:
(1)The 2021 third quarter mainline operating special items, net principally included $992 million of Payroll Support Program (PSP) financial assistance. The 2021 nine month period mainline operating special items, net principally included $4.2 billion of PSP financial assistance, offset in part by $168 million of salary and medical costs primarily associated with certain team members who opted into voluntary early retirement programs offered as a result of reductions to the Company's operation due to the COVID-19 pandemic.
Cash payments for salary and medical costs primarily associated with the Company's voluntary early retirement programs were approximately $190 million and $480 million for the 2021 third quarter and nine month period, respectively.
The 2020 third quarter mainline operating special items, net principally included $1.9 billion of PSP financial assistance, offset in part by $871 million of salary and medical costs primarily associated with certain team members who opted into voluntary early retirement programs and $742 million of fleet impairment charges. The 2020 nine month period mainline operating special items, net principally included $3.7 billion of PSP financial assistance, offset in part by $1.5 billion of fleet impairment charges, $1.4 billion of salary and medical costs primarily associated with certain team members who opted into voluntary early retirement programs and $228 million of one-time labor contract expenses due to the ratification of a new contract with the Company's maintenance and fleet service team members, including signing bonuses and adjustments to vacation accruals resulting from pay rate increases.
Cash payments for salary and medical costs primarily associated with the Company's voluntary early retirement programs were approximately $120 million and $170 million for the 2020 third quarter and nine month period, respectively.
Fleet impairment charges resulted from the retirement of certain aircraft earlier than planned primarily driven by the severe decline in air travel due to the COVID-19 pandemic. Mainline aircraft retired in 2020 included the Company's entire Airbus A330-200, Boeing 757, Boeing 767, Airbus A330-300 and Embraer 190 fleets. The 2020 third quarter fleet impairment charges included a $709 million non-cash write-down of Airbus A330-200 aircraft and spare parts and $33 million in cash charges primarily for lease return and other costs. The 2020 nine month period fleet impairment charges included a $1.4 billion non-cash write-down of mainline aircraft and spare parts and $102 million in cash charges primarily for impairment of right-of-use assets and lease return costs.
(2)The 2021 third quarter regional operating special items, net principally included $128 million of PSP financial assistance, offset in part by a $61 million charge associated with the regional pilot retention program which provides for, among other things, a cash retention bonus to be paid in the fourth quarter of 2021 to eligible captains at the wholly-owned regional airlines included on the pilot seniority list as of September 1, 2021. The 2021 nine month period regional operating special items, net principally included $539 million of PSP financial assistance, offset in part by the $61 million charge associated with the regional pilot retention program discussed above and a $27 million non-cash charge to write down regional aircraft resulting from the retirement of the remaining Embraer 140 fleet earlier than planned.
The 2020 third quarter regional operating special items, net primarily included $228 million of PSP financial assistance. The 2020 nine month period regional operating special items, net included $444 million of PSP financial assistance, offset in part by a $117 million non-cash charge to write down regional aircraft and spare parts associated with certain Embraer 140 and Bombardier CRJ200 aircraft, which were retired as a result of the severe decline in air travel due to the COVID-19 pandemic.
(3)Principally included mark-to-market net unrealized gains and losses associated with certain equity investments and treasury rate lock derivative instruments as well as non-cash charges associated with debt refinancings and extinguishments.
American Airlines Reports Third-Quarter 2021 Financial Results
Oct. 21, 2021
Page 10
American Airlines Group Inc.
Condensed Consolidated Statements of Cash Flows
(In millions)(Unaudited)
| 9 Months Ended September 30, | |||||||||||
| 2021 | 2020 | ||||||||||
| Net cash provided by (used in) operating activities | $ | 1,904 | $ | (3,680) | |||||||
| Cash flows from investing activities: | |||||||||||
| Capital expenditures, net of aircraft purchase deposit returns | (25) | (1,810) | |||||||||
| Proceeds from sale-leaseback transactions | 168 | 433 | |||||||||
| Proceeds from sale of property and equipment | 181 | 251 | |||||||||
| Purchases of short-term investments | (15,159) | (7,086) | |||||||||
| Sales of short-term investments | 7,540 | 2,603 | |||||||||
| Increase in restricted short-term investments | (330) | (317) | |||||||||
| Other investing activities | (96) | (112) | |||||||||
| Net cash used in investing activities | (7,721) | (6,038) | |||||||||
| Cash flows from financing activities: | |||||||||||
| Proceeds from issuance of long-term debt | 12,096 | 11,564 | |||||||||
| Payments on long-term debt and finance leases | (6,639) | (3,018) | |||||||||
| Proceeds from issuance of equity | 460 | 1,527 | |||||||||
| Deferred financing costs | (176) | (132) | |||||||||
| Treasury stock repurchases and shares withheld for taxes pursuant to employee stock plans | (13) | (173) | |||||||||
| Dividend payments | — | (43) | |||||||||
| Other financing activities | 121 | — | |||||||||
| Net cash provided by financing activities | 5,849 | 9,725 | |||||||||
| Net increase in cash and restricted cash | 32 | 7 | |||||||||
| Cash and restricted cash at beginning of period | 399 | 290 | |||||||||
Cash and restricted cash at end of period (1) | $ | 431 | $ | 297 | |||||||
(1)The following table provides a reconciliation of cash and restricted cash to amounts reported within the condensed consolidated balance sheets:
| Cash | $ | 293 | $ | 253 | |||||||
| Restricted cash included in restricted cash and short-term investments | 138 | 44 | |||||||||
| Total cash and restricted cash | $ | 431 | $ | 297 | |||||||
American Airlines Reports Third-Quarter 2021 Financial Results
Oct. 21, 2021
Page 11
American Airlines Group Inc.
Condensed Consolidated Balance Sheets
(In millions, except shares)
| September 30, 2021 | December 31, 2020 | ||||||||||
| (unaudited) | |||||||||||
| Assets | |||||||||||
| Current assets | |||||||||||
| Cash | $ | 293 | $ | 245 | |||||||
| Short-term investments | 14,243 | 6,619 | |||||||||
| Restricted cash and short-term investments | 923 | 609 | |||||||||
| Accounts receivable, net | 1,332 | 1,342 | |||||||||
| Aircraft fuel, spare parts and supplies, net | 1,851 | 1,614 | |||||||||
| Prepaid expenses and other | 553 | 666 | |||||||||
| Total current assets | 19,195 | 11,095 | |||||||||
| Operating property and equipment | |||||||||||
| Flight equipment | 37,689 | 37,816 | |||||||||
| Ground property and equipment | 9,114 | 9,194 | |||||||||
| Equipment purchase deposits | 626 | 1,446 | |||||||||
| Total property and equipment, at cost | 47,429 | 48,456 | |||||||||
| Less accumulated depreciation and amortization | (17,632) | (16,757) | |||||||||
| Total property and equipment, net | 29,797 | 31,699 | |||||||||
| Operating lease right-of-use assets | 7,804 | 8,039 | |||||||||
| Other assets | |||||||||||
| Goodwill | 4,091 | 4,091 | |||||||||
| Intangibles, net | 1,998 | 2,029 | |||||||||
| Deferred tax asset | 3,582 | 3,239 | |||||||||
| Other assets | 1,970 | 1,816 | |||||||||
| Total other assets | 11,641 | 11,175 | |||||||||
| Total assets | $ | 68,437 | $ | 62,008 | |||||||
| Liabilities and Stockholders’ Equity (Deficit) | |||||||||||
| Current liabilities | |||||||||||
| Current maturities of long-term debt and finance leases | $ | 2,550 | $ | 2,797 | |||||||
| Accounts payable | 1,835 | 1,196 | |||||||||
| Accrued salaries and wages | 1,501 | 1,716 | |||||||||
| Air traffic liability | 6,450 | 4,757 | |||||||||
| Loyalty program liability | 2,791 | 2,033 | |||||||||
| Operating lease liabilities | 1,490 | 1,651 | |||||||||
| Other accrued liabilities | 2,321 | 2,419 | |||||||||
| Total current liabilities | 18,938 | 16,569 | |||||||||
| Noncurrent liabilities | |||||||||||
| Long-term debt and finance leases, net of current maturities | 36,047 | 29,796 | |||||||||
| Pension and postretirement benefits | 6,495 | 7,069 | |||||||||
| Loyalty program liability | 6,404 | 7,162 | |||||||||
| Operating lease liabilities | 6,568 | 6,777 | |||||||||
| Other liabilities | 1,422 | 1,502 | |||||||||
| Total noncurrent liabilities | 56,936 | 52,306 | |||||||||
| Stockholders' equity (deficit) | |||||||||||
Common stock, 647,477,469 shares outstanding at September 30, 2021 | 6 | 6 | |||||||||
| Additional paid-in capital | 7,221 | 6,894 | |||||||||
| Accumulated other comprehensive loss | (6,957) | (7,103) | |||||||||
| Retained deficit | (7,707) | (6,664) | |||||||||
| Total stockholders' deficit | (7,437) | (6,867) | |||||||||
| Total liabilities and stockholders’ equity (deficit) | $ | 68,437 | $ | 62,008 | |||||||