Exhibit 99.1
NEWS RELEASE
AbCellera Reports Full Year 2022 Business Results
02/21/2023

|
• |
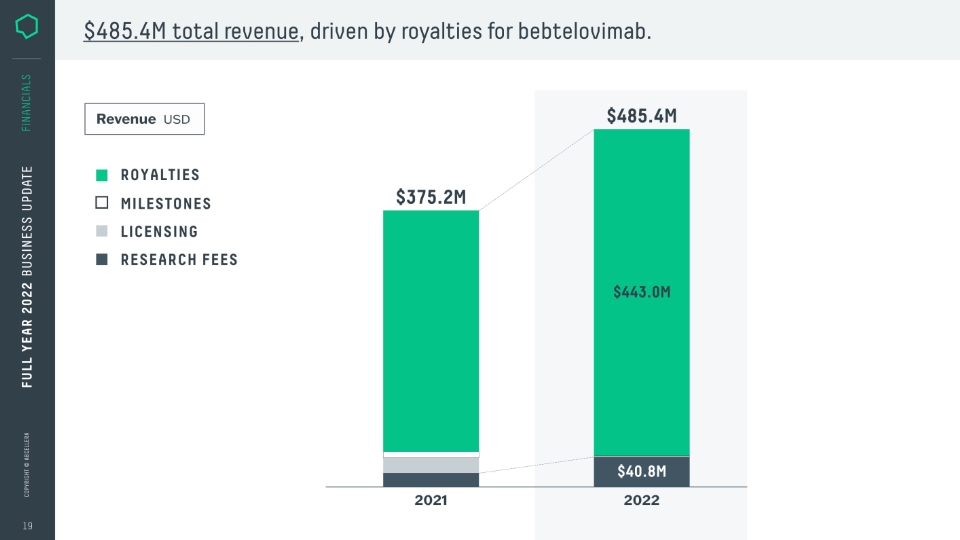
Total revenue of $485 million, compared to $375 million in FY 2021 |
|
• |
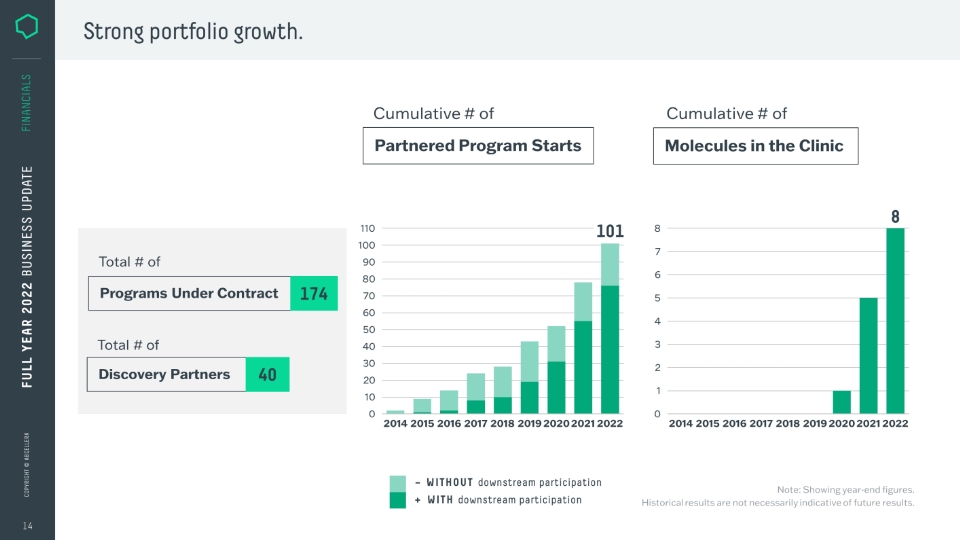
Total cumulative partnered program starts of 101, with 23 new starts in the year |
|
• |
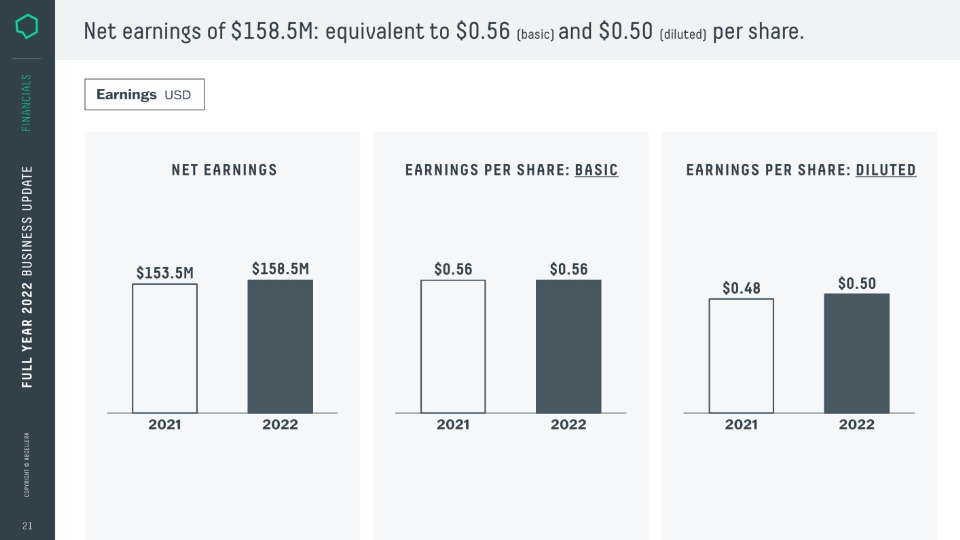
Net earnings of $0.56 per share on a basic and $0.50 on a diluted basis, compared to earnings of $0.56 (basic) and $0.48 (diluted) per share in 2021 |
VANCOUVER, British Columbia, February 21, 2023 -- AbCellera (Nasdaq: ABCL) today announced financial results for the full year 2022. All financial information in this press release is reported in U.S. dollars, unless otherwise indicated.
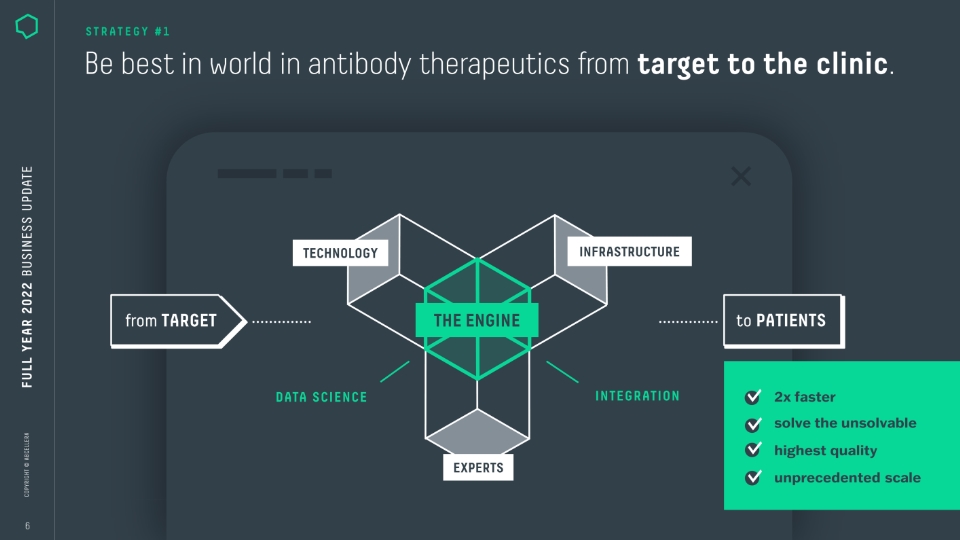
“In 2022 we demonstrated strong topline results and ongoing success in our partnering business. Even more significant is the progress we made in scaling and expanding the capabilities of our engine during the year,” said Carl Hansen, Ph.D., founder and CEO of AbCellera. “We believe we are at an inflection point and expect to drive deeper value with partners and to prove our ability to consistently deliver clinical candidates for patients in need.”
FY 2022 Business Summary
|
|
• |
Earned $485.4 million in total revenue. |
|
|
|
• |
Generated net income of $158.5 million, compared to net income of $153.5 million in 2021. |
|
|
|
• |
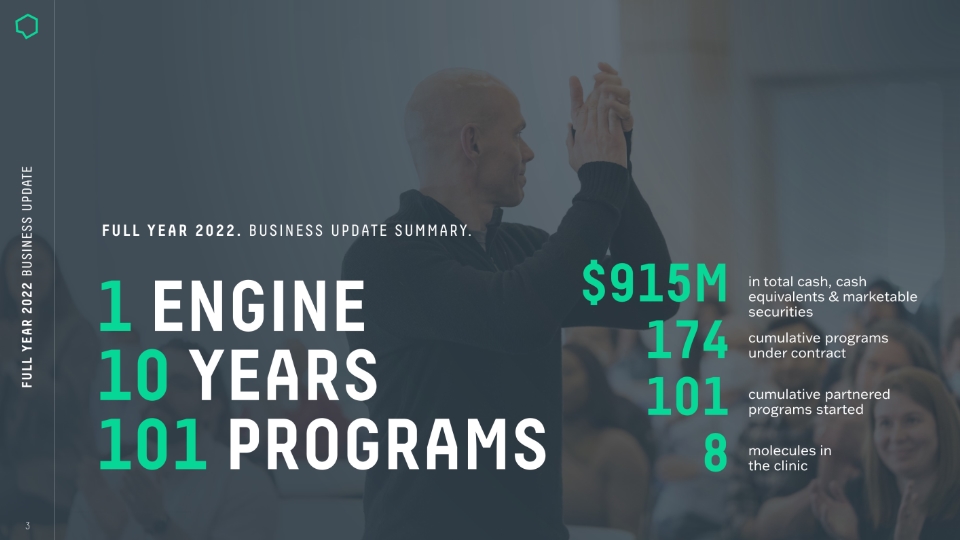
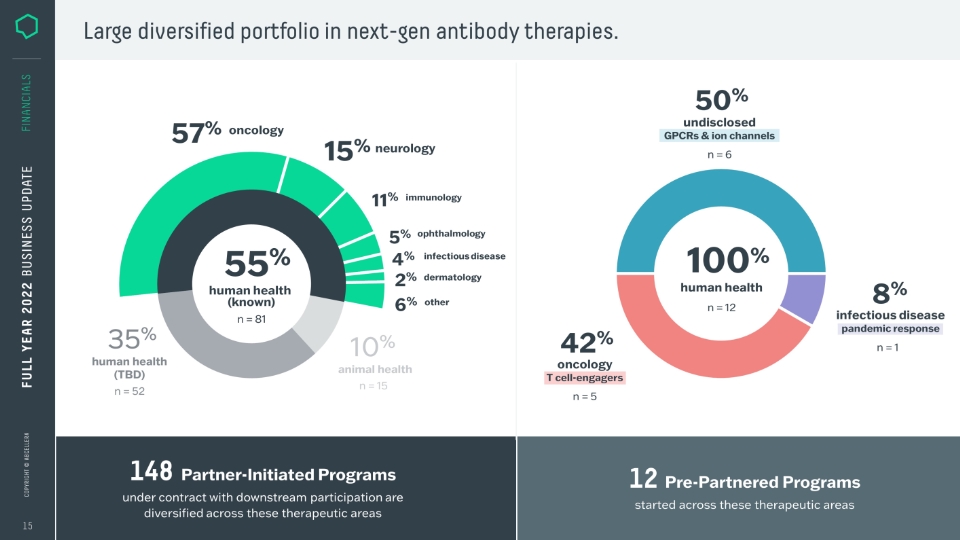
Reached a cumulative total of 174 programs under contract with 40 different partners. |
|
|
|
• |
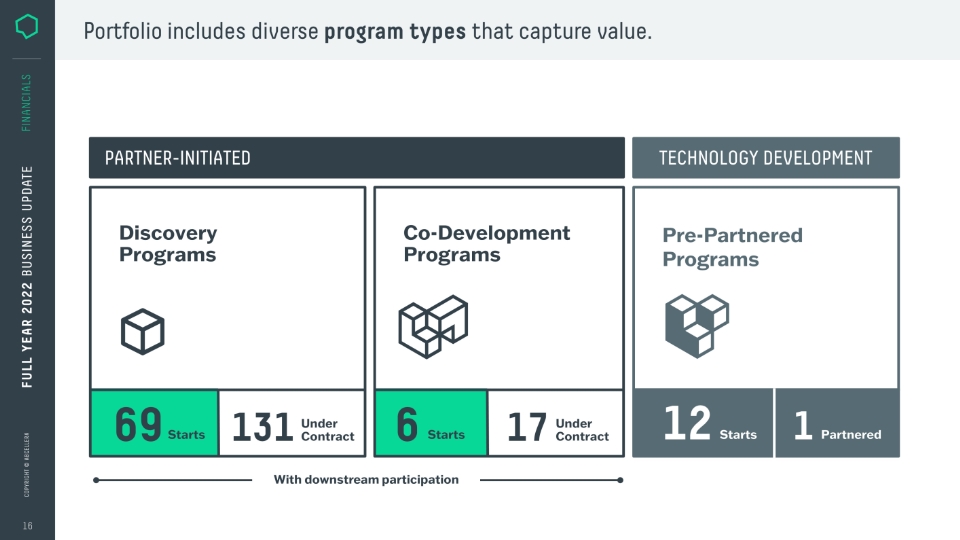
Started discovery on 23 partnered programs, bringing the cumulative number of partnered program starts to 101. |
|
|
|
• |
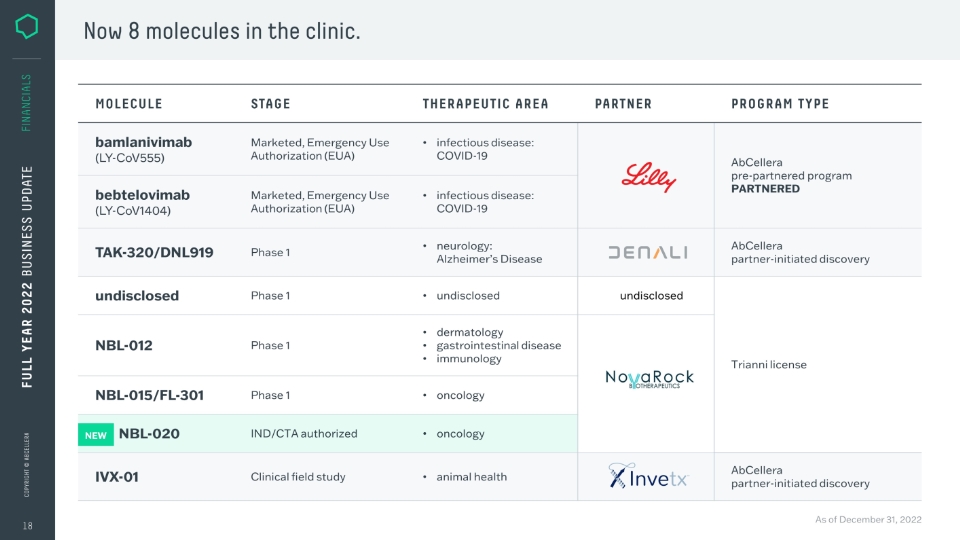
Reporting the advancement of three additional molecules, taking the cumulative total to eight molecules in the clinic. |
|
Key Business Metrics
|
|
|
Year Ended December 31, |
|
|
Change |
|
||||||
|
Cumulative Metrics |
|
2021 |
|
|
2022 |
|
|
% |
|
|||
|
Number of discovery partners |
|
|
36 |
|
|
|
40 |
|
|
|
11 |
% |
|
Programs under contract |
|
|
156 |
|
|
|
174 |
|
|
|
12 |
% |
|
Partnered program starts |
|
|
78 |
|
|
|
101 |
|
|
|
29 |
% |
|
Molecules in the clinic |
|
|
5 |
|
|
|
8 |
|
|
|
60 |
% |
AbCellera added 18 partnered programs in 2022 to reach a cumulative total of 174 programs under contract that are either completed, in progress, or under contract with 40 different partners as of December 31, 2022 (up 12% from 156 on December 31, 2021). AbCellera started discovery on 23 partnered programs in 2022 to reach a cumulative total of 101 partnered program starts (up 29% from 78 on December 31, 2021). AbCellera’s partners advanced an
1
additional three molecules into the clinic in 2022, bringing the cumulative total to eight molecules in the clinic.
Discussion of FY 2022 Financial Results
|
|
• |
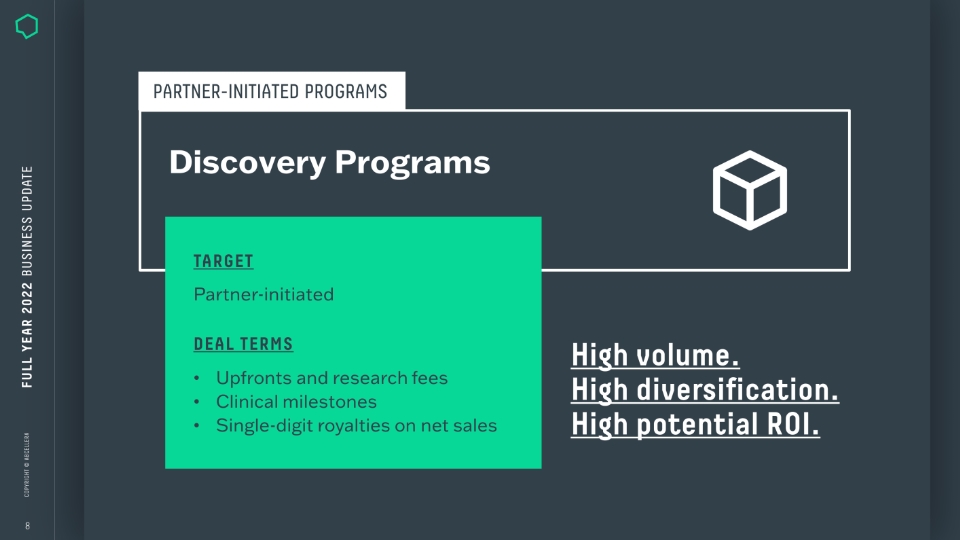
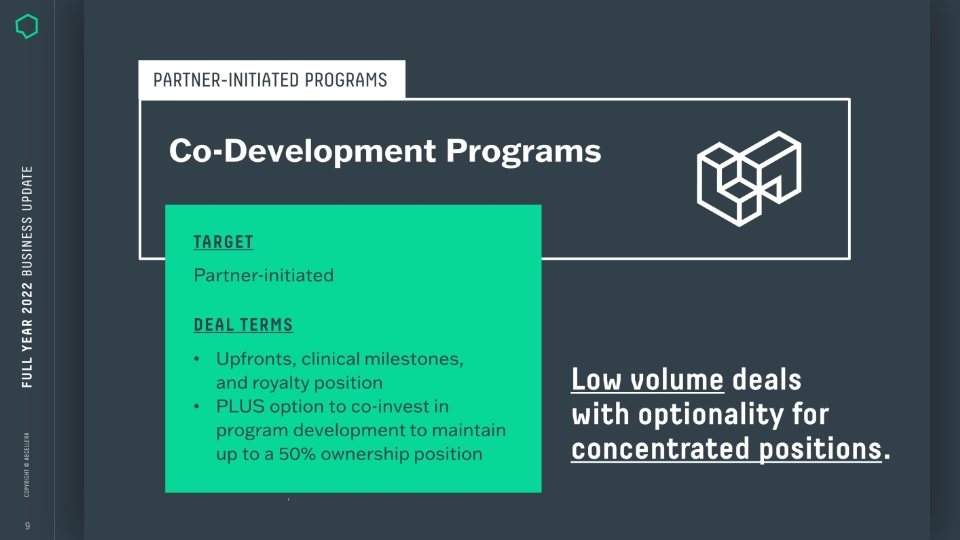
Revenue – Total revenue was $485.4 million, compared to $375.2 million in 2021. Royalties associated with bamlanivimab and bebtelovimab were $443.0 million. The partnership business generated research fees of $40.8 million, compared to $19.1 million in 2021. Milestone payments were $0.9 million and licensing revenue was $0.7 million. |
|
|
• |
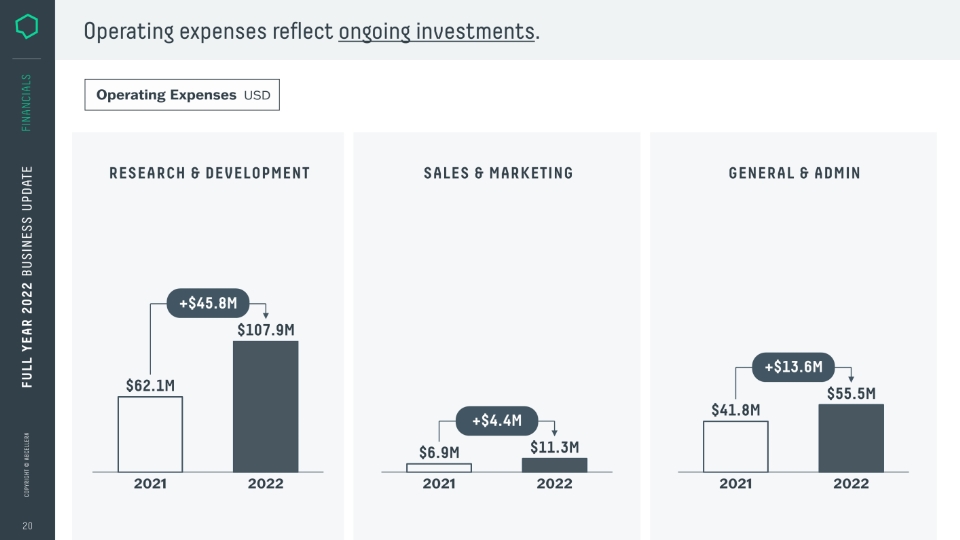
Research & Development (R&D) Expenses – R&D expenses were $107.9 million, compared to $62.1 million in 2021, reflecting continuing investments in the capacity and capabilities of AbCellera’s engine for antibody discovery and development. |
|
|
• |
Sales & Marketing (S&M) Expenses – S&M expenses were $11.3 million, compared to $6.9 million in 2021. The increase reflects continued investments in business development. |
|
|
• |
General & Administrative (G&A) Expenses – G&A expenses were $55.5 million, compared to $41.8 million in 2021, with the increase driven by investments to support the growth of the company. |
|
|
• |
Net Earnings – Net earnings were $158.5 million, or $0.56 per share on a basic and $0.50 on a diluted basis, compared to $153.5 million, or $0.56 per share on a basic and $0.48 diluted basis in 2021. |
|
|
• |
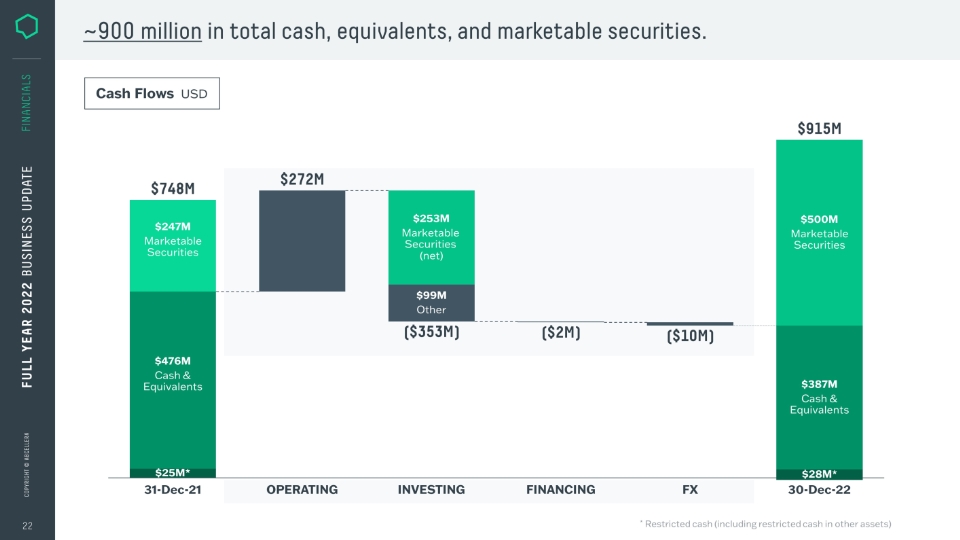
Liquidity – $886.5 million of cash, cash equivalents, and marketable securities. |
Q4 Highlights and Financial Results
|
|
• |
Started nine partner-initiated programs. |
|
|
• |
U.S. emergency use authorization (EUA) for bebtelovimab was suspended due to emergence of COVID-19 variants resistant to the treatment. |
|
|
• |
Added ten programs under contract with two new partners. |
Revenue for the fourth quarter of 2022 was $21.5 million, representing 4% of the total for 2022. $9.5 million was generated in the quarter from royalties on net sales of bebtelovimab prior to the EUA suspension, and $11.4 million was generated from research fees, representing 2% and 28% of the respective totals for 2022.
Operating expenses totaled $59.3 million in the fourth quarter or 22% of the total for 2022 and include $1.6 million in royalty fees, 2% of the total for the year.
The net loss for the fourth quarter was $29.9 million, or ($0.10) per share on a basic and diluted basis.
Conference Call and Webcast
AbCellera will host a conference call and live webcast to discuss these results today at 2:00 p.m. Pacific Time (5:00 p.m. Eastern Time).
The live webcast of the earnings conference call can be accessed on the Events and Presentations section of AbCellera’s Investor Relations website. A replay of the webcast will be available through the same link following the conference call.
About AbCellera Biologics Inc.
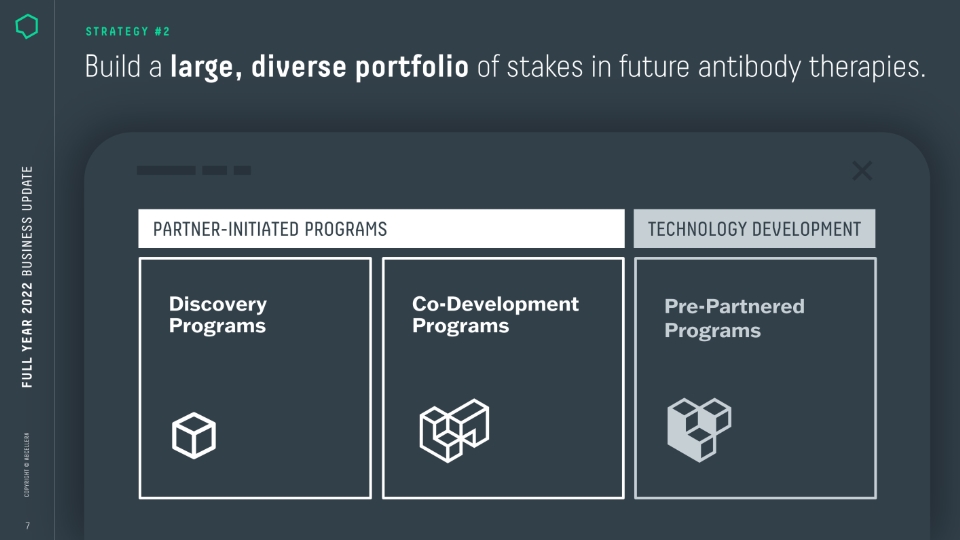
AbCellera searches, decodes, and analyzes natural immune systems to find antibodies that its partners can develop into drugs to prevent and treat disease. AbCellera partners with drug
2
developers of all sizes, from large pharmaceutical to small biotechnology companies, empowering them to move quickly, reduce costs, and tackle the toughest problems in antibody drug development. For more information, please visit www.abcellera.com.
Definition of Key Business Metrics
We regularly review the following key business metrics to evaluate our business, measure our performance, identify trends affecting our business, formulate financial projections, and make strategic decisions. We believe that the following metrics are important to understand our current business. These metrics may change or may be substituted for additional or different metrics as our business develops.
Number of discovery partners represents the unique number of partners with whom we have executed partnership contracts. We view this metric as an indication of the competitiveness of our engine and our level of market penetration. The metric also relates to our opportunities to secure programs under contract.
Programs under contract represent the number of antibody development programs that are under contract for delivery of discovery research activities. A program under contract is counted when a contract is executed with a partner under which we commit to discover or deliver antibodies against one selected target. A target is any relevant antigen for which a partner seeks our support in developing binding antibodies. We view this metric as an indication of commercial success and technological competitiveness. It further relates to revenue from access fees. The cumulative number of programs under contract with downstream participation is related to our ability to generate future revenue from milestone payments and royalties.
Partnered program starts represent the number of unique programs under contract for which we have commenced the discovery effort. The discovery effort commences on the later of (i) the day on which we receive sufficient reagents to start discovery of antibodies against a target and (ii) the day on which the kick-off meeting for the program is held. We view this metric as an indication of our operational capacity to execute on programs under contract. It is also an indication of the selection and initiation of discovery projects by our partners and the resulting potential for near-term payments. Cumulatively, partnered program starts with downstream participation indicate our total opportunities to earn downstream revenue from milestone fees and royalties in the mid- to long-term.
Molecules in the clinic represent the count of unique molecules for which an Investigational New Drug, or IND, New Animal Drug, or equivalent under other regulatory regimes, application has been approved based on an antibody that was discovered either by us or by a partner using licensed AbCellera technology. Where the date of such application approval is not known to us, the date of the first public announcement of a clinical trial will be used for the purpose of this metric. We view this metric as an indication of our near- and mid-term potential revenue from milestone fees and potential royalty payments in the long term.
AbCellera Forward-Looking Statements
This press release contains forward-looking statements, including statements made pursuant to the safe harbor provisions of the Private Securities Litigation Reform Act of 1995. The forward-looking statements are based on management’s current beliefs and assumptions and on information currently available to management. All statements contained in this release other than statements of historical fact are forward-looking statements, including statements regarding our ability to develop, commercialize and achieve market acceptance of our current and planned products and services, our research and development efforts, and other matters regarding our
3
business strategies, use of capital, results of operations and financial position, and plans and objectives for future operations.
In some cases, you can identify forward-looking statements by the words “may,” “will,” “could,” “would,” “should,” “expect,” “intend,” “plan,” “anticipate,” “believe,” “estimate,” “predict,” “project,” “potential,” “continue,” “ongoing” or the negative of these terms or other comparable terminology, although not all forward-looking statements contain these words. These statements involve risks, uncertainties and other factors that may cause actual results, levels of activity, performance, or achievements to be materially different from the information expressed or implied by these forward-looking statements. These risks, uncertainties and other factors are described under "Risk Factors," "Management's Discussion and Analysis of Financial Condition and Results of Operations" and elsewhere in the documents we file with the Securities and Exchange Commission from time to time. We caution you that forward-looking statements are based on a combination of facts and factors currently known by us and our projections of the future, about which we cannot be certain. As a result, the forward-looking statements may not prove to be accurate. The forward-looking statements in this press release represent our views as of the date hereof. We undertake no obligation to update any forward-looking statements for any reason, except as required by law.
Source: AbCellera Biologics Inc.
Inquiries
Media: Jessica Yingling, Ph.D.; [email protected], +1(236) 521-6774
Business Development: Murray McCutcheon, Ph.D.; [email protected], +1(604) 559-9005
Investor Relations: Josephine Hellschlienger, Ph.D.; [email protected], +1(778) 729-9116
4
AbCellera Biologics Inc.
Consolidated Statements of Income and Comprehensive Income
(All figures in U.S. dollars. Amounts are expressed in thousands except share and per share data)
|
|
|
Year Ended December 31, |
|
|||||||||
|
|
|
2020 |
|
|
2021 |
|
|
2022 |
|
|||
|
Revenue: |
|
|
|
|
|
|
|
|
|
|
|
|
|
Research fees |
|
$ |
19,848 |
|
|
$ |
19,076 |
|
|
$ |
40,802 |
|
|
Licensing revenue |
|
|
- |
|
|
|
20,778 |
|
|
|
696 |
|
|
Milestone payments |
|
|
15,000 |
|
|
|
8,000 |
|
|
|
900 |
|
|
Royalty revenue |
|
|
198,307 |
|
|
|
327,349 |
|
|
|
443,026 |
|
|
Total revenue |
|
|
233,155 |
|
|
|
375,203 |
|
|
|
485,424 |
|
|
Operating expenses: |
|
|
|
|
|
|
|
|
|
|
|
|
|
Royalty fees |
|
|
27,143 |
|
|
|
45,516 |
|
|
|
66,436 |
|
|
Research and development(1) |
|
|
29,393 |
|
|
|
62,062 |
|
|
|
107,879 |
|
|
Sales and marketing(1) |
|
|
3,842 |
|
|
|
6,913 |
|
|
|
11,270 |
|
|
General and administrative(1) |
|
|
11,910 |
|
|
|
41,848 |
|
|
|
55,485 |
|
|
Depreciation, amortization, and impairment |
|
|
4,836 |
|
|
|
14,451 |
|
|
|
27,843 |
|
|
Total operating expenses |
|
|
77,124 |
|
|
|
170,790 |
|
|
|
268,913 |
|
|
Income from operations |
|
|
156,031 |
|
|
|
204,413 |
|
|
|
216,511 |
|
|
Other (income) expense |
|
|
|
|
|
|
|
|
|
|
|
|
|
Interest (income) |
|
|
(293 |
) |
|
|
(3,330 |
) |
|
|
(16,079 |
) |
|
Interest and other |
|
|
6,811 |
|
|
|
6,080 |
|
|
|
4,045 |
|
|
Grants and incentives |
|
|
(8,320 |
) |
|
|
(17,486 |
) |
|
|
(10,554 |
) |
|
Total other income |
|
|
(1,802 |
) |
|
|
(14,736 |
) |
|
|
(22,588 |
) |
|
Net earnings before income tax |
|
|
157,833 |
|
|
|
219,149 |
|
|
|
239,099 |
|
|
Income tax expense |
|
|
38,915 |
|
|
|
65,685 |
|
|
|
80,580 |
|
|
Net earnings |
|
$ |
118,918 |
|
|
$ |
153,464 |
|
|
$ |
158,519 |
|
|
Foreign currency translation adjustment |
|
|
- |
|
|
|
280 |
|
|
|
(1,671 |
) |
|
Comprehensive income |
|
$ |
118,918 |
|
|
$ |
153,744 |
|
|
$ |
156,848 |
|
|
|
|
|
|
|
|
|
|
|
|
|
|
|
|
Net earnings per share attributable to common shareholders |
|
|
|
|
|
|
|
|
|
|
|
|
|
Basic |
|
$ |
0.53 |
|
|
$ |
0.56 |
|
|
$ |
0.56 |
|
|
Diluted |
|
$ |
0.45 |
|
|
$ |
0.48 |
|
|
$ |
0.50 |
|
|
Weighted-average common shares outstanding |
|
|
|
|
|
|
|
|
|
|
|
|
|
Basic |
|
|
159,195,023 |
|
|
|
275,763,745 |
|
|
|
285,056,606 |
|
|
Diluted |
|
|
263,129,765 |
|
|
|
318,294,236 |
|
|
|
314,827,255 |
|
(1) Exclusive of depreciation, amortization, and impairment
5
AbCellera Biologics Inc.
Consolidated Balance Sheet
(All figures in U.S. dollars. Amounts are expressed in thousands except share data)
|
|
|
December 31, 2021 |
|
|
December 31, 2022 |
|
||
|
Assets |
|
|
|
|
|
|
|
|
|
Current assets: |
|
|
|
|
|
|
|
|
|
Cash and cash equivalents |
|
$ |
476,142 |
|
|
$ |
386,535 |
|
|
Marketable securities |
|
|
246,835 |
|
|
|
499,950 |
|
|
Total cash, cash equivalents, and marketable securities |
|
|
722,977 |
|
|
|
886,485 |
|
|
Accounts and accrued receivable |
|
|
160,576 |
|
|
|
38,593 |
|
|
Restricted cash |
|
|
25,000 |
|
|
|
25,000 |
|
|
Other current assets |
|
|
21,247 |
|
|
|
75,413 |
|
|
Total current assets |
|
|
929,800 |
|
|
|
1,025,491 |
|
|
Long-term assets: |
|
|
|
|
|
|
|
|
|
Property and equipment, net |
|
|
111,616 |
|
|
|
217,255 |
|
|
Intangible assets, net |
|
|
148,392 |
|
|
|
131,502 |
|
|
Goodwill |
|
|
47,806 |
|
|
|
47,806 |
|
|
Investments in and loans to equity accounted investees |
|
|
50,313 |
|
|
|
72,522 |
|
|
Other long-term assets |
|
|
30,642 |
|
|
|
46,331 |
|
|
Total long-term assets |
|
|
388,769 |
|
|
|
515,416 |
|
|
Total assets |
|
$ |
1,318,569 |
|
|
$ |
1,540,907 |
|
|
Liabilities and shareholders' equity |
|
|
|
|
|
|
|
|
|
Current liabilities: |
|
|
|
|
|
|
|
|
|
Accounts payable and other liabilities |
|
$ |
32,017 |
|
|
$ |
33,150 |
|
|
Current portion of contingent consideration payable |
|
|
22,934 |
|
|
|
44,211 |
|
|
Income taxes payable |
|
|
35,683 |
|
|
|
- |
|
|
Accrued royalties payable |
|
|
22,506 |
|
|
|
19,347 |
|
|
Deferred revenue |
|
|
7,536 |
|
|
|
21,612 |
|
|
Total current liabilities |
|
|
120,676 |
|
|
|
118,320 |
|
|
Long-term liabilities: |
|
|
|
|
|
|
|
|
|
Operating lease liability |
|
|
36,413 |
|
|
|
76,675 |
|
|
Deferred revenue |
|
|
27,409 |
|
|
|
19,516 |
|
|
Deferred grant funding |
|
|
33,349 |
|
|
|
40,801 |
|
|
Contingent consideration payable |
|
|
35,886 |
|
|
|
16,054 |
|
|
Deferred tax liability |
|
|
37,370 |
|
|
|
33,178 |
|
|
Other long-term liabilities |
|
|
1,733 |
|
|
|
3,086 |
|
|
Total long-term liabilities |
|
|
172,160 |
|
|
|
189,310 |
|
|
Total liabilities |
|
|
292,836 |
|
|
|
307,630 |
|
|
Commitments and contingencies |
|
|
|
|
|
|
|
|
|
Shareholders' equity: |
|
|
|
|
|
|
|
|
|
Common shares: no par value, unlimited authorized shares at December 31, 2021 and 2022: 283,257,104 and 286,851,595 shares issued and outstanding at December 31, 2021 and 2022 respectively |
|
|
722,430 |
|
|
|
734,365 |
|
|
Additional paid-in capital |
|
|
35,357 |
|
|
|
74,118 |
|
|
Accumulated other comprehensive income (loss) |
|
|
280 |
|
|
|
(1,391 |
) |
|
Accumulated earnings |
|
|
267,666 |
|
|
|
426,185 |
|
|
Total shareholders' equity |
|
|
1,025,733 |
|
|
|
1,233,277 |
|
|
Total liabilities and shareholders' equity |
|
$ |
1,318,569 |
|
|
$ |
1,540,907 |
|
|
Subsequent event |
|
|
|
|
|
|
|
|
6
AbCellera Biologics Inc.
Consolidated Statement of Cash Flows
(Expressed in thousands of U.S. dollars)
|
|
|
December 31, 2020 |
|
|
December 31, 2021 |
|
|
December 31, 2022 |
|
|||
|
Cash flows from operating activities: |
|
|
|
|
|
|
|
|
|
|
|
|
|
Net earnings |
|
$ |
118,918 |
|
|
$ |
153,464 |
|
|
$ |
158,519 |
|
|
Cash flows from operating activities: |
|
|
|
|
|
|
|
|
|
|
|
|
|
Depreciation of property and equipment |
|
|
2,317 |
|
|
|
4,403 |
|
|
|
8,953 |
|
|
Amortization and impairment of intangible assets |
|
|
2,519 |
|
|
|
10,062 |
|
|
|
18,890 |
|
|
Amortization of operating lease right-of-use assets |
|
|
435 |
|
|
|
2,785 |
|
|
|
5,259 |
|
|
Stock-based compensation |
|
|
8,397 |
|
|
|
30,646 |
|
|
|
49,481 |
|
|
Deferred tax expense |
|
|
2,098 |
|
|
|
(2,018 |
) |
|
|
(2,114 |
) |
|
Other |
|
|
4,707 |
|
|
|
3,570 |
|
|
|
8,547 |
|
|
Changes in operating assets and liabilities: |
|
|
|
|
|
|
|
|
|
|
|
|
|
Accounts and accrued research fees receivable |
|
|
(5,467 |
) |
|
|
(37,386 |
) |
|
|
(22,715 |
) |
|
Accrued royalties receivable |
|
|
(197,553 |
) |
|
|
59,864 |
|
|
|
129,171 |
|
|
Income taxes payable |
|
|
36,412 |
|
|
|
(13,530 |
) |
|
|
(88,609 |
) |
|
Accounts payable and accrued liabilities |
|
|
6,601 |
|
|
|
1,400 |
|
|
|
1,066 |
|
|
Operating lease liabilities |
|
|
(350 |
) |
|
|
(778 |
) |
|
|
(3,064 |
) |
|
Deferred revenue |
|
|
21,810 |
|
|
|
8,624 |
|
|
|
6,183 |
|
|
Accrued royalties payable |
|
|
27,143 |
|
|
|
(4,637 |
) |
|
|
(3,160 |
) |
|
Deferred grant revenue |
|
|
(6,763 |
) |
|
|
30,718 |
|
|
|
9,264 |
|
|
Other operating assets and liabilities |
|
|
1,466 |
|
|
|
(2,603 |
) |
|
|
1,689 |
|
|
Net cash provided by operating activities |
|
|
22,690 |
|
|
|
244,584 |
|
|
|
277,360 |
|
|
Cash flows from investing activities: |
|
|
|
|
|
|
|
|
|
|
|
|
|
Purchases of property and equipment |
|
|
(9,673 |
) |
|
|
(58,452 |
) |
|
|
(70,660 |
) |
|
Purchase of intangible assets |
|
|
(5,000 |
) |
|
|
- |
|
|
|
(2,000 |
) |
|
Purchases of marketable securities |
|
|
- |
|
|
|
(274,710 |
) |
|
|
(763,982 |
) |
|
Proceeds from marketable securities |
|
|
- |
|
|
|
27,608 |
|
|
|
510,631 |
|
|
Receipt of grant funding |
|
|
- |
|
|
|
32,621 |
|
|
|
16,434 |
|
|
Acquisitions, net of cash acquired |
|
|
(87,643 |
) |
|
|
(11,457 |
) |
|
|
- |
|
|
Long-term investments and other |
|
|
1,783 |
|
|
|
(17,534 |
) |
|
|
(17,369 |
) |
|
Investment in and loans to equity accounted investees |
|
|
(19,247 |
) |
|
|
(30,323 |
) |
|
|
(25,679 |
) |
|
Net cash used in investing activities |
|
|
(119,780 |
) |
|
|
(332,247 |
) |
|
|
(352,625 |
) |
|
Cash flows from financing activities: |
|
|
|
|
|
|
|
|
|
|
|
|
|
Repayment of long-term debt and contingent consideration |
|
|
(19,942 |
) |
|
|
(4,373 |
) |
|
|
(323 |
) |
|
Proceeds from long-term debt and exercise of stock options |
|
|
16,490 |
|
|
|
5,487 |
|
|
|
2,755 |
|
|
Proceeds from convertible debentures |
|
|
89,990 |
|
|
|
- |
|
|
|
- |
|
|
Payment of liability for in-licensing agreement and other |
|
|
(387 |
) |
|
|
(5,000 |
) |
|
|
(4,060 |
) |
|
Net proceeds from issuance of common shares |
|
|
522,840 |
|
|
|
- |
|
|
|
- |
|
|
Proceeds from issuance of preferred shares - series A1 and A2 financing |
|
|
74,662 |
|
|
|
- |
|
|
|
- |
|
|
Net cash provided by (used in) financing activities |
|
|
683,653 |
|
|
|
(3,886 |
) |
|
|
(1,628 |
) |
|
Effect of exchange rate changes on cash and cash equivalents |
|
|
- |
|
|
|
(1,425 |
) |
|
|
(9,599 |
) |
|
Increase (decrease) in cash and cash equivalents |
|
|
586,563 |
|
|
|
(92,974 |
) |
|
|
(86,492 |
) |
|
Cash and cash equivalents and restricted cash, beginning of year |
|
|
7,553 |
|
|
|
594,116 |
|
|
|
501,142 |
|
|
Cash and cash equivalents and restricted cash, end of year |
|
$ |
594,116 |
|
|
$ |
501,142 |
|
|
$ |
414,650 |
|
|
Restricted cash included within other current and other long-term assets |
|
|
- |
|
|
|
- |
|
|
|
3,115 |
|
|
Total cash, cash equivalents, and restricted cash shown on the balance sheets |
|
$ |
594,116 |
|
|
$ |
501,142 |
|
|
$ |
411,535 |
|
|
Supplemental disclosure of non-cash investing and financing activities: |
|
|
|
|
|
|
|
|
|
|
|
|
|
Property and equipment purchases in accounts payable |
|
|
656 |
|
|
|
5,397 |
|
|
|
5,868 |
|
|
Right-of-use assets obtained in exchange for operating lease obligation |
|
|
1,679 |
|
|
|
36,638 |
|
|
|
50,694 |
|
|
Purchase of intangible assets in exchange for in-licensing agreement payable |
|
|
9,060 |
|
|
|
- |
|
|
|
- |
|
7