Accel Entertainment Reports Record First Quarter Revenue and Strong Operating Results
Chicago, IL – May 5, 2025 – Accel Entertainment, Inc. (NYSE: ACEL) today announced financial and operating results for the first quarter March 31, 2025.
Highlights:
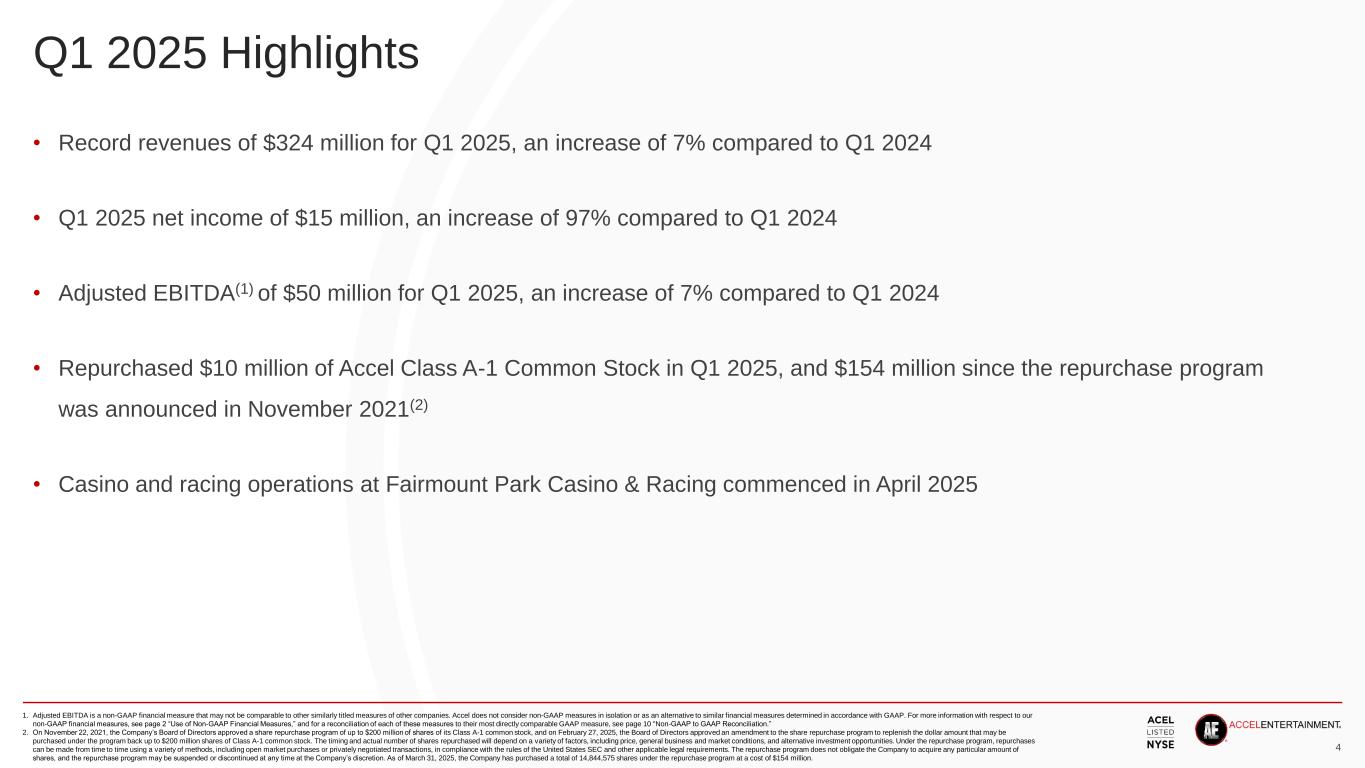
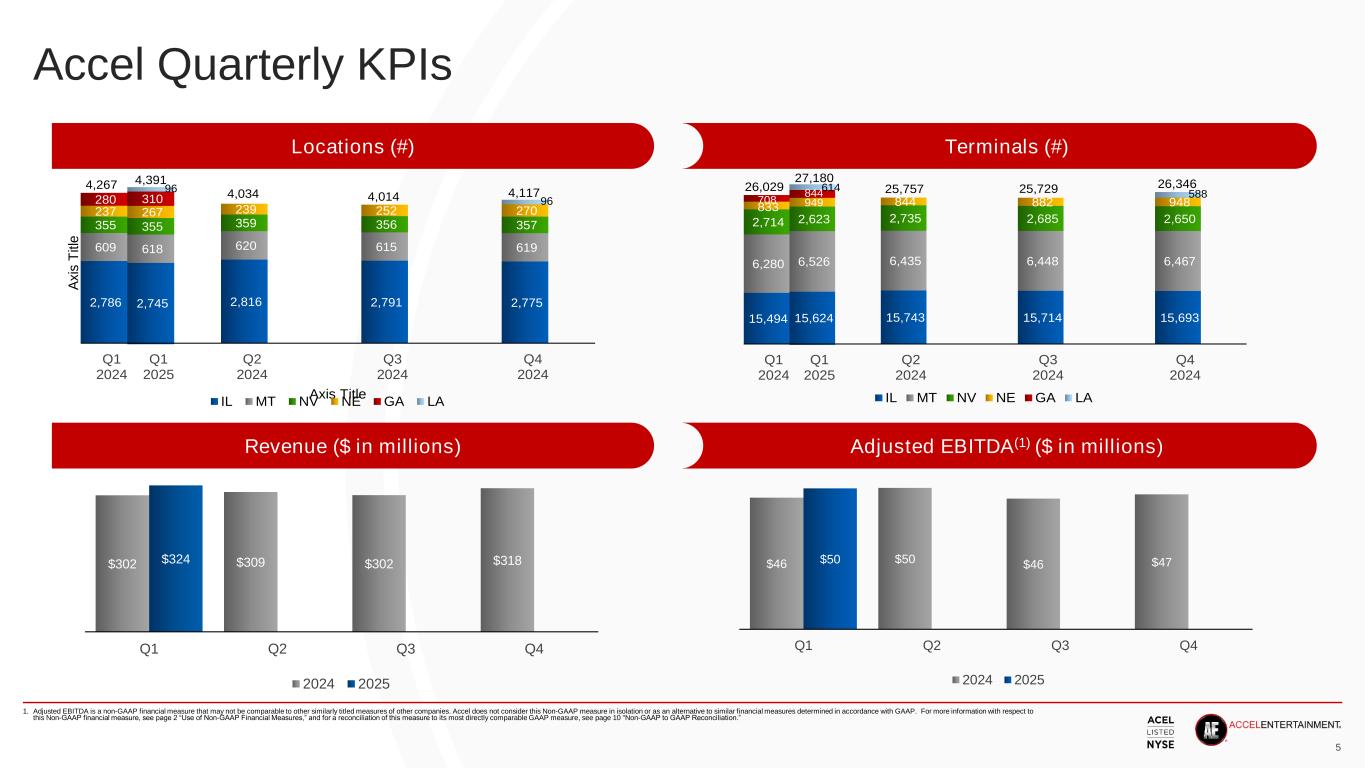
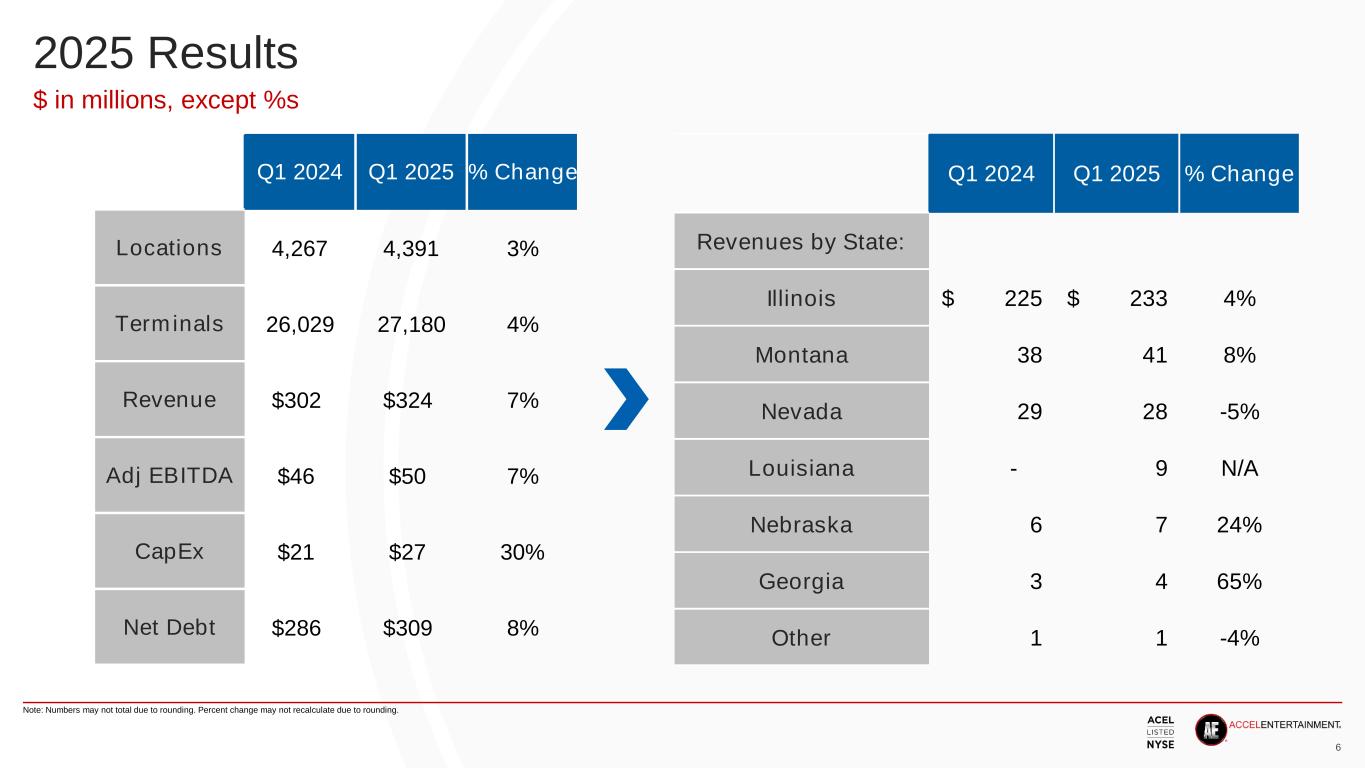
•Record revenues of $323.9 million in Q1 '25; an increase of 7.3% compared to Q1 '24
•Net income of $14.6 million for Q1 '25; an increase of 97.0% compared to Q1 '24
•Adjusted EBITDA of $49.5 million for Q1 '25; an increase of 7.1% compared to Q1 '24
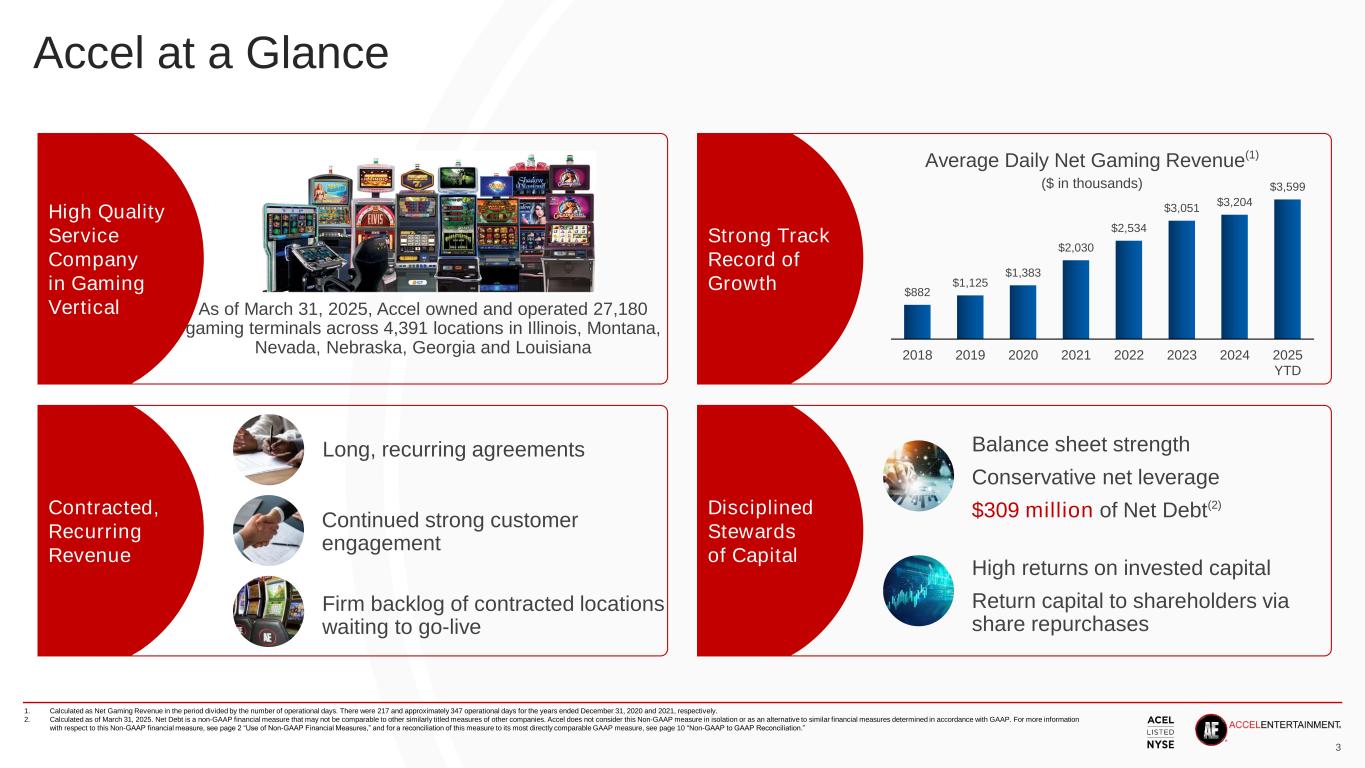
•Ended Q1 '25 with 4,391 locations; an increase of 2.9% compared to Q1 '24
•Ended Q1 '25 with 27,180 gaming terminals; an increase of 4.4% compared to Q1 '24
•Net debt of $309 million at March 31, 2025
•Repurchased 1 million shares of Accel Class A-1 common stock in Q1 '25 for approximately $10.2 million
•Commenced our casino and racing operations at Fairmount Park Casino & Racing in April 2025.
Accel CEO Andy Rubenstein commented, “Our operating and financial momentum continues in 2025. In the first quarter, we generated our highest quarterly revenue since going public and strong Adjusted EBITDA as we expanded the number of locations we serve and increased the number of gaming terminals. In April, we opened Phase I of our casino and commenced horse racing operations at Fairmount Park Casino & Racing, which has already garnered solid customer visitation and play. This past Saturday, we hosted Fairmount Park’s “Derby Day at the Track.” Despite the inclement weather forcing us to cancel races at our Derby Day, we still had a fantastic turnout that drove very strong play at the casino, demonstrating the value of our acquisition. We remain confident that Fairmount will be another meaningful growth driver for Accel.”
“We continue to execute on our near- and long-term growth plans to improve our core operations and expand into complimentary markets, including Fairmount, to leverage our operating disciplines. These initiatives are already benefiting our operating performance and we expect our expansion efforts will allow Accel to maintain attractive low-teens returns on capital, generate growing free cash flow, and ultimately improve our trading multiples to enhance shareholder value.”
1
Condensed Consolidated Statements of Operations and Other Data
| Three Months Ended March 31, | |||||||||||
| (in thousands) | 2025 | 2024 | |||||||||
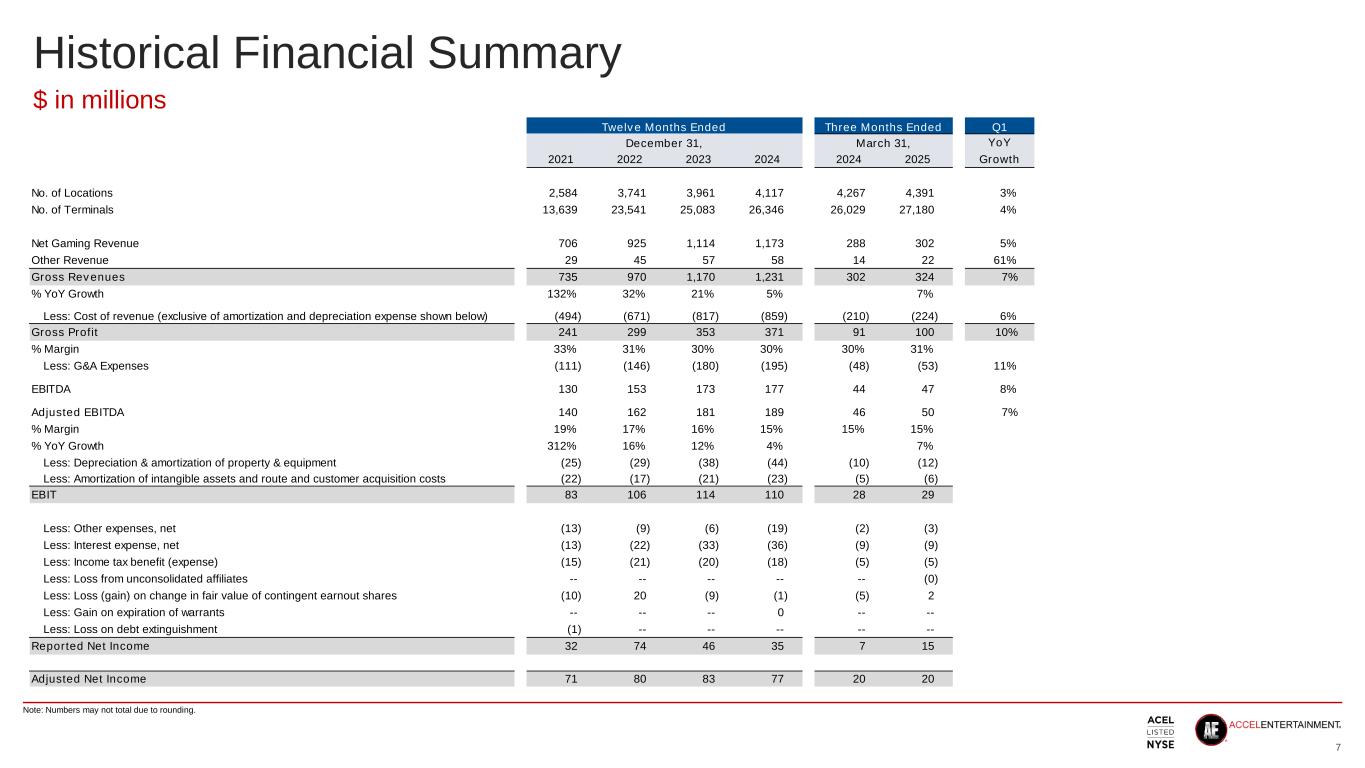
Total net revenues | $ | 323,912 | $ | 301,817 | |||||||
| Operating income | 25,952 | 25,559 | |||||||||
| Income before income tax expense | 19,606 | 12,183 | |||||||||
| Net income | 14,613 | 7,416 | |||||||||
| Other Financial Data: | |||||||||||
Adjusted EBITDA(1) | 49,514 | 46,247 | |||||||||
Adjusted net income (2) | 20,218 | 19,505 | |||||||||
(1)Adjusted EBITDA is a non-GAAP metric. See "Non-GAAP Financial Measures" for a reconciliation to GAAP.
(2)Adjusted net income is a non-GAAP metric. See "Non-GAAP Financial Measures" for a reconciliation to GAAP.
Net Revenues
| (in thousands) | Three Months Ended March 31, | Increase / (Decrease) | |||||||||||||||||||||
| 2025 | 2024 | Change ($) | Change (%) | ||||||||||||||||||||
| Net revenues by state: | |||||||||||||||||||||||
| Illinois | $ | 233,479 | $ | 224,863 | $ | 8,616 | 3.8 | % | |||||||||||||||
| Montana | 41,136 | 38,141 | 2,995 | 7.9 | % | ||||||||||||||||||
Nevada | 27,617 | 29,209 | (1,592) | (5.5) | % | ||||||||||||||||||
Louisiana | 9,025 | — | 9,025 | N/A | |||||||||||||||||||
| Nebraska | 7,230 | 5,834 | 1,396 | 23.9 | % | ||||||||||||||||||
Georgia | 4,325 | 2,624 | 1,701 | 64.8 | % | ||||||||||||||||||
| Other | 1,100 | 1,146 | (46) | (4.0) | % | ||||||||||||||||||
| Total net revenues | $ | 323,912 | $ | 301,817 | $ | 22,095 | 7.3 | % | |||||||||||||||
2
Key Business Metrics
Locations (1) | As of March 31, | Increase / (Decrease) | |||||||||||||||||||||
| 2025 | 2024 | Change | Change (%) | ||||||||||||||||||||
| Illinois | 2,745 | 2,786 | (41) | (1.5) | % | ||||||||||||||||||
| Montana | 618 | 609 | 9 | 1.5 | % | ||||||||||||||||||
| Nevada | 355 | 355 | — | — | % | ||||||||||||||||||
| Louisiana | 96 | — | 96 | N/A | |||||||||||||||||||
| Nebraska | 267 | 237 | 30 | 12.7 | % | ||||||||||||||||||
| Georgia | 310 | 280 | 30 | 10.7 | % | ||||||||||||||||||
| Total locations | 4,391 | 4,267 | 124 | 2.9 | % | ||||||||||||||||||
Gaming terminals (1) | As of March 31, | Increase / (Decrease) | |||||||||||||||||||||
| 2025 | 2024 | Change | Change (%) | ||||||||||||||||||||
| Illinois | 15,624 | 15,494 | 130 | 0.8 | % | ||||||||||||||||||
| Montana | 6,526 | 6,280 | 246 | 3.9 | % | ||||||||||||||||||
| Nevada | 2,623 | 2,714 | (91) | (3.4) | % | ||||||||||||||||||
| Louisiana | 614 | — | 614 | N/A | |||||||||||||||||||
| Nebraska | 949 | 833 | 116 | 13.9 | % | ||||||||||||||||||
Georgia | 844 | 708 | 136 | 19.2 | % | ||||||||||||||||||
| Total gaming terminals | 27,180 | 26,029 | 1,151 | 4.4 | % | ||||||||||||||||||
Location hold-per-day (2) | Three Months Ended March 31, | Increase / (Decrease) | |||||||||||||||||||||
| 2025 | 2024 | Change ($) | Change (%) | ||||||||||||||||||||
| Illinois | $ | 885 | $ | 860 | $ | 25 | 2.9 | % | |||||||||||||||
| Montana | 610 | 594 | 16 | 2.7 | % | ||||||||||||||||||
| Nevada | 802 | 847 | (45) | (5.3) | % | ||||||||||||||||||
Louisiana | 972 | — | 972 | N/A | |||||||||||||||||||
| Nebraska | 263 | 233 | 30 | 12.9 | % | ||||||||||||||||||
Georgia | 145 | 91 | 54 | 59.3 | % | ||||||||||||||||||
(1)Based on a combination of third-party portal data and data from our internal systems. This metric is utilized by Accel to continually monitor growth from existing locations, organic openings, acquired locations, and competitor conversions.
(2)Location hold-per-day is calculated by dividing net gaming revenue in the period by the average number of locations. We then divide the calculated amount by the number of operational days. We utilize this metric to compare market and location performance on a normalized basis. The percent change in location hold-per-day is the underlying metric used to determine the change in same-store sales.
3
Condensed Consolidated Statements of Cash Flows Data
| Year Ended March 31, | |||||||||||||||||
| (in thousands) | 2025 | 2024 | Change ($) | ||||||||||||||
| Net cash provided by operating activities | $ | 44,752 | $ | 28,750 | $ | 16,002 | |||||||||||
| Net cash used in investing activities | (26,186) | (25,896) | (290) | ||||||||||||||
Net cash used in financing activities | (27,932) | (10,546) | (17,386) | ||||||||||||||
Non-GAAP Financial Measures
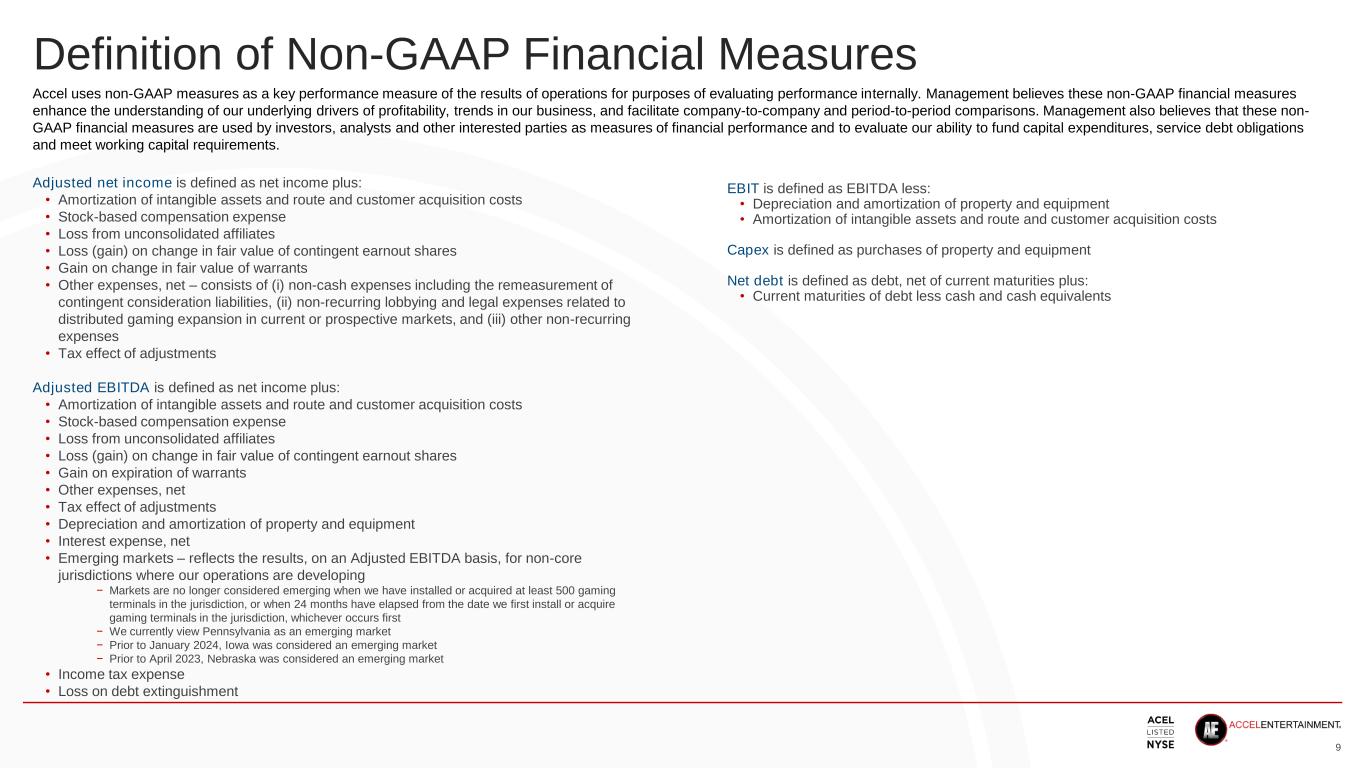
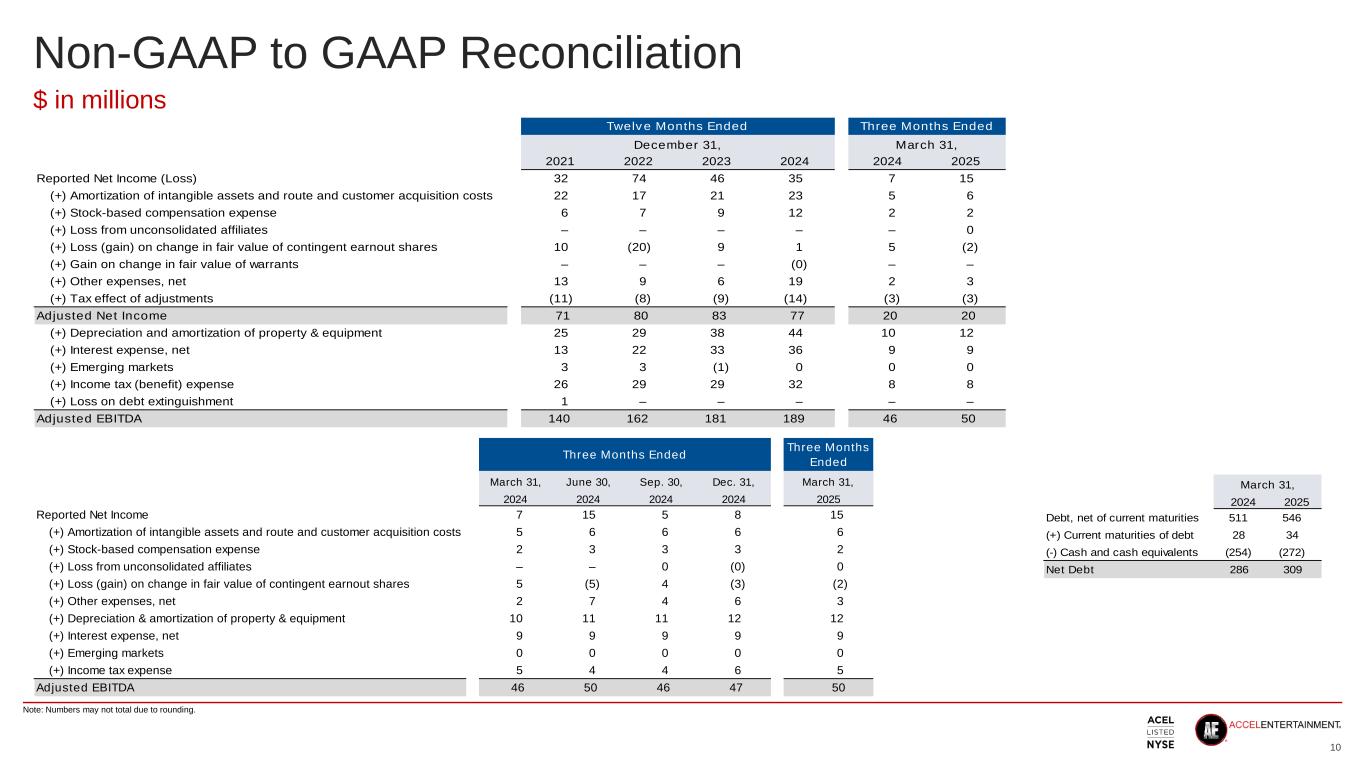
Adjusted net income is defined as net income plus:
•Amortization of intangible assets and route and customer acquisition costs
•Stock-based compensation expense
•Loss from unconsolidated affiliates
•(Gain) loss on change in fair value of contingent earnout shares
•Other expenses, net which consists of (i) non-cash expenses including the remeasurement of contingent consideration liabilities, (ii) non-recurring lobbying and legal expenses related to distributed gaming expansion in current or prospective markets, and (iii) other non-recurring expenses
•Tax effect of adjustments
Adjusted EBITDA is defined as net income plus:
•Amortization of intangible assets and route and customer acquisition costs
•Stock-based compensation expense
•Loss from unconsolidated affiliates
•(Gain) loss on change in fair value of contingent earnout shares
•Other expenses, net
•Tax effect of adjustments
•Depreciation and amortization of property and equipment
•Interest expense, net
•Emerging markets, which reflects the results, on an Adjusted EBITDA basis, for non-core jurisdictions where our operations are developing
◦Markets are no longer considered emerging when we have installed or acquired at least 500 gaming terminals in the jurisdiction, or when 24 months have elapsed from the date we first install or acquire gaming terminals in the jurisdiction, whichever occurs first
◦We currently view Pennsylvania as an emerging market
◦Prior to January 2024, Iowa was considered an emerging market
•Income tax expense
4
Net debt is defined as debt, net of current maturities:
•plus Current maturities of debt
•less Cash and cash equivalents
Adjusted net income and Adjusted EBITDA
| Three Months Ended March 31, | Increase / (Decrease) | |||||||||||||||||||||||||
| (in thousands) | 2024 | 2023 | Change ($) | Change (%) | ||||||||||||||||||||||
| Net income | $ | 14,613 | $ | 7,416 | $ | 7,197 | 97.0 | % | ||||||||||||||||||
| Adjustments: | ||||||||||||||||||||||||||
Amortization of intangible assets and route and customer acquisition costs | 6,290 | 5,438 | 852 | 15.7 | % | |||||||||||||||||||||
Stock-based compensation expense | 2,091 | 2,350 | (259) | (11.0) | % | |||||||||||||||||||||
| Loss from unconsolidated affiliates | 16 | — | 16 | 100.0 | % | |||||||||||||||||||||
(Gain) loss on change in fair value of contingent earnout shares | (2,355) | 4,716 | (7,071) | (149.9) | % | |||||||||||||||||||||
Other expenses, net | 2,817 | 2,426 | 391 | 16.1 | % | |||||||||||||||||||||
Tax effect of adjustments | (3,254) | (2,841) | (413) | (14.5) | % | |||||||||||||||||||||
| Adjusted net income | 20,218 | 19,505 | 713 | 3.7 | % | |||||||||||||||||||||
| Depreciation and amortization of property and equipment | 12,301 | 10,434 | 1,867 | 17.9 | % | |||||||||||||||||||||
| Interest expense, net | 8,685 | 8,660 | 25 | 0.3 | % | |||||||||||||||||||||
Emerging markets | 63 | 40 | 23 | 57.5 | % | |||||||||||||||||||||
| Income tax expense | 8,247 | 7,608 | 639 | 8.4 | % | |||||||||||||||||||||
| Adjusted EBITDA | $ | 49,514 | $ | 46,247 | $ | 3,267 | 7.1 | % | ||||||||||||||||||
Net Debt
| As of March 31, | |||||||||||
| (in thousands) | 2025 | 2024 | |||||||||
| Debt, net of current maturities | $ | 546,425 | $ | 511,425 | |||||||
| Plus: Current maturities of debt | 34,280 | 28,485 | |||||||||
| Less: Cash and cash equivalents | (271,939) | (253,919) | |||||||||
| Net debt | $ | 308,766 | $ | 285,991 | |||||||
5
Conference Call
Accel will host an investor conference call on May 5, 2025 at 4:30 p.m. Central time (5:30 p.m. Eastern time) to discuss these financial and operating results. Interested parties may join the live webcast by registering at https://www.netroadshow.com/events/login?show=e00222af&confId=80950 or accessing the webcast via the company’s investor relations website: ir.accelentertainment.com. Following completion of the call, a replay of the webcast will be posted on Accel’s investor relations website.
About Accel
Accel Entertainment, Inc. (NYSE: ACEL) is a leading distributed gaming operator in the United States, as well as a developer of brick-and-mortar casinos that serve local gaming markets and horse racing venues. Accel is dedicated to delivering unmatched value to its customers through its innovative solutions and exceptional service and is a preferred partner for local business owners in the markets it serves. Accel is the largest terminal operator in the country, supporting more than 27,000 gaming terminals in 4,300 local and regional establishments across ten states. Offering turnkey full-service gaming solutions, Accel designs, manufactures, installs, and operates gaming terminals and related equipment, including slot machines, redemption terminals, video game machines, gaming software, and amusements to authorized non-casino locations including bars, restaurants, convenience stores, truck stops, fraternal and veteran establishments as well as casinos and horse racing venues.
Media Contact:
Eric Bonach
H/Advisors Abernathy
212-371-5999
Forward-Looking Statements
This press release contains forward-looking statements within the meaning of Section 27A of the Securities Act of 1933, as amended, and Section 21E of the Securities Exchange Act of 1934, as amended. All statements, other than statements of historical fact, contained in this press release are forward-looking statements, including, but not limited to, any statements regarding our estimates of number of gaming terminals, locations, revenues, Adjusted EBITDA, Adjusted net income, location hold-per-day and capital expenditures, our ability to continue to generate returns on capital and improve our trading multiples, and our expansion into casino operations and horse racing. The words “predict,” “estimated,” “anticipates,” “believes,” “estimates,” “expects,” “intends,” “may,” “plans,” “projects,” “will,” “would,” “continue,” and similar expressions or the negatives thereof are intended to identify forward-looking statements. These forward-looking statements represent our current reasonable expectations and involve known and unknown risks, uncertainties and other factors that may cause our actual results, performance and achievements, or industry results, to be materially different from any future results, performance or achievements expressed or implied by such forward-looking statements. We cannot guarantee the accuracy of the forward-looking statements, and you should be aware that results and events could differ materially and adversely from those contained in the forward-looking statements due to a number of factors including, but not limited to: Accel’s ability to operate in existing markets or expand into new jurisdictions; Accel’s ability to offer new and innovative products and services that fulfill the needs of location partners and create strong and sustained player appeal; Accel’s dependence on relationships with key manufacturers, developers and third parties to obtain gaming terminals, amusement machines, and related supplies, programs, and technologies for its business on acceptable terms; the negative impact on Accel’s future results of operations by the slow growth in
6
demand for gaming terminals and by the slow growth of new gaming jurisdictions; Accel’s heavy dependency on its ability to win, maintain and renew contracts with location partners; Accel's expansion into casino operations and horse racing; unfavorable macroeconomic conditions or decreased discretionary spending due to other factors such as interest rate volatility, persistent inflation, increased or retaliatory tariffs, actual or perceived instability in the U.S. and global banking systems, high fuel rates, recessions, epidemics or other public health issues, terrorist activity or threat thereof, civil unrest or other macroeconomic or political uncertainties, that could adversely affect Accel’s business, results of operations, cash flows and financial conditions and other risks and uncertainties indicated from time to time in documents filed or to be filed with the U.S. Securities and Exchange Commission (the "SEC").
Accordingly, forward-looking statements, including any projections or analysis, should not be viewed as factual and should not be relied upon as an accurate prediction of future results. The forward-looking statements contained in this press release are based on our current expectations and beliefs concerning future developments and their potential effects on Accel. These forward-looking statements involve a number of risks, uncertainties (some of which are beyond our control), or other assumptions that may cause actual results or performance to be materially different from those expressed or implied by these forward-looking statements. These risks and uncertainties include, but are not limited to, those factors described in the section entitled “Risk Factors” in the Annual Report on Form 10-K for the fiscal year ended December 31, 2024 (the "Form 10-K"). Except as required by law, we do not undertake publicly to update or revise these statements, even if experience or future changes make it clear that any projected results expressed in this or other press releases or future quarterly reports, or company statements will not be realized. In addition, the inclusion of any statement in this press release does not constitute an admission by us that the events or circumstances described in such statement are material. We qualify all of our forward-looking statements by these cautionary statements. In addition, the industry in which we operate is subject to a high degree of uncertainty and risk due to a variety of factors including those described in the section entitled “Risk Factors” in the Form 10-K, as well as Accel’s other filings with the SEC. These and other factors could cause our results to differ materially from those expressed in this press release.
Industry and Market Data
Unless otherwise indicated, information contained in this press release concerning our industry and the markets in which we operate, including our general expectations and market position, market opportunity, and market size, is based on information from various sources, on assumptions that we have made that are based on those data and other similar sources, and on our knowledge of the markets for our services. This information includes a number of assumptions and limitations, and you are cautioned not to give undue weight to such information. In addition, projections, assumptions, and estimates of our future performance and the future performance of the industry in which we operate are necessarily subject to a high degree of uncertainty and risk due to a variety of factors, including those described in the Form 10-K, as well as Accel's other filings with the SEC. These and other factors could cause results to differ materially from those expressed in the estimates made by third parties and by us.
7
Non-GAAP Financial Information
This press release includes certain financial information not prepared in accordance with Generally Accepted Accounting Principles in the United States (“GAAP”), including Adjusted EBITDA, Adjusted net income, and Net Debt. Adjusted EBITDA, Adjusted net income, and Net Debt are non-GAAP financial measures and are key metrics used to monitor ongoing core operations. Management of Accel believes Adjusted EBITDA, Adjusted net income, and Net Debt enhance the understanding of Accel’s underlying drivers of profitability and trends in Accel’s business and facilitates company-to-company and period-to-period comparisons, because these non-GAAP financial measures exclude the effects of certain non-cash items, represents certain nonrecurring items that are unrelated to core performance, or excludes non-core operations. Management of Accel also believes that these non-GAAP financial measures are used by investors, analysts and other interested parties as measures of financial performance.
8
ACCEL ENTERTAINMENT, INC.
CONSOLIDATED STATEMENTS OF OPERATIONS
| (In thousands, except per share amounts) | Three Months Ended March 31, | ||||||||||
| 2025 | 2024 | ||||||||||
| Net revenues: | |||||||||||
| Net gaming | $ | 301,951 | $ | 288,137 | |||||||
| Amusement | 5,908 | 6,129 | |||||||||
| Manufacturing | 3,858 | 2,209 | |||||||||
| ATM fees and other | 12,195 | 5,342 | |||||||||
| Total net revenues | 323,912 | 301,817 | |||||||||
| Operating expenses: | |||||||||||
| Cost of revenue (exclusive of depreciation and amortization expense shown below) | 221,472 | 209,167 | |||||||||
| Cost of manufacturing goods sold (exclusive of depreciation and amortization expense shown below) | 2,076 | 1,159 | |||||||||
| General and administrative | 53,004 | 47,634 | |||||||||
| Depreciation and amortization of property and equipment | 12,301 | 10,434 | |||||||||
| Amortization of intangible assets and route and customer acquisition costs | 6,290 | 5,438 | |||||||||
| Other expenses, net | 2,817 | 2,426 | |||||||||
| Total operating expenses | 297,960 | 276,258 | |||||||||
| Operating income | 25,952 | 25,559 | |||||||||
| Interest expense, net | 8,685 | 8,660 | |||||||||
| Loss from unconsolidated affiliates | 16 | — | |||||||||
(Gain) loss on change in fair value of contingent earnout shares | (2,355) | 4,716 | |||||||||
| Income before income tax expense | 19,606 | 12,183 | |||||||||
| Income tax expense | 4,993 | 4,767 | |||||||||
| Net income | $ | 14,613 | $ | 7,416 | |||||||
Less: Net income attributed to redeemable noncontrolling interests | $ | (26) | $ | — | |||||||
Net income attributable to Accel Entertainment, Inc. | $ | 14,639 | $ | 7,416 | |||||||
| Earnings per common share: | |||||||||||
| Basic | $ | 0.17 | $ | 0.09 | |||||||
| Diluted | 0.17 | 0.09 | |||||||||
| Weighted average number of common shares outstanding: | |||||||||||
| Basic | 86,003 | 84,298 | |||||||||
| Diluted | 87,223 | 85,300 | |||||||||
9
ACCEL ENTERTAINMENT, INC.
CONSOLIDATED BALANCE SHEETS
(In thousands, except par value and share amounts) | March 31, | December 31, | |||||||||
| 2025 | 2024 | ||||||||||
| Assets | |||||||||||
| Current assets: | |||||||||||
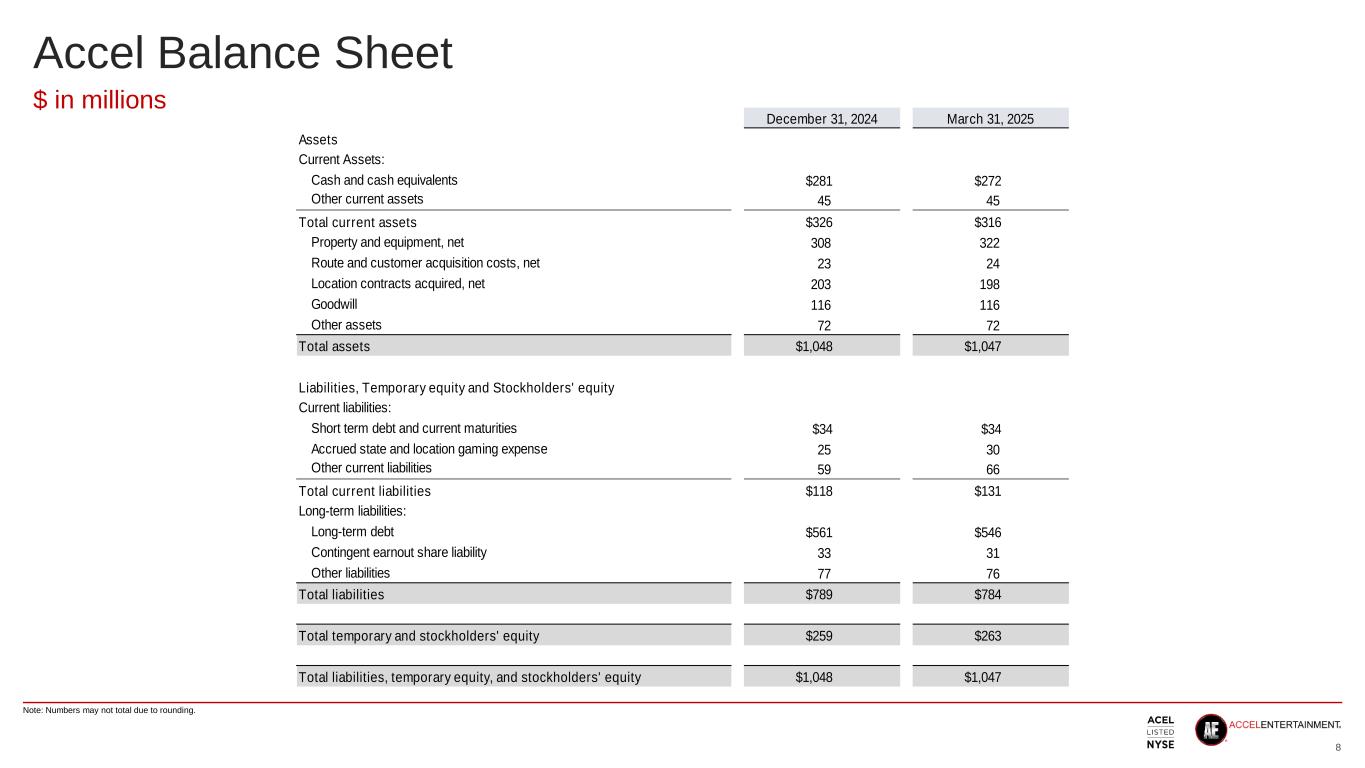
| Cash and cash equivalents | $ | 271,939 | $ | 281,305 | |||||||
| Accounts receivable, net | 12,673 | 10,550 | |||||||||
| Prepaid expenses | 8,606 | 8,950 | |||||||||
| Inventories | 8,558 | 8,122 | |||||||||
| Interest rate caplets | 5,024 | 6,342 | |||||||||
| Other current assets | 9,686 | 10,883 | |||||||||
| Total current assets | 316,486 | 326,152 | |||||||||
| Property and equipment, net | 321,802 | 307,997 | |||||||||
| Noncurrent assets: | |||||||||||
| Route and customer acquisition costs, net | 23,578 | 23,258 | |||||||||
| Location contracts acquired, net | 197,539 | 202,618 | |||||||||
| Goodwill | 116,252 | 116,252 | |||||||||
| Other intangible assets, net | 53,344 | 53,940 | |||||||||
| Interest rate caplets, net of current | — | 479 | |||||||||
| Other assets | 18,255 | 17,702 | |||||||||
| Total noncurrent assets | 408,968 | 414,249 | |||||||||
| Total assets | $ | 1,047,256 | $ | 1,048,398 | |||||||
Liabilities, Temporary equity, and Stockholders’ equity | |||||||||||
| Current liabilities: | |||||||||||
| Current maturities of debt | $ | 34,280 | $ | 34,443 | |||||||
| Current portion of route and customer acquisition costs payable | 2,218 | 2,197 | |||||||||
| Accrued location gaming expense | 10,175 | 4,734 | |||||||||
| Accrued state gaming expense | 20,203 | 19,802 | |||||||||
| Accounts payable and other accrued expenses | 51,892 | 41,944 | |||||||||
| Accrued compensation and related expenses | 8,863 | 12,117 | |||||||||
| Current portion of consideration payable | 3,137 | 3,116 | |||||||||
| Total current liabilities | 130,768 | 118,353 | |||||||||
| Long-term liabilities: | |||||||||||
| Debt, net of current maturities | 546,425 | 560,936 | |||||||||
| Route and customer acquisition costs payable, less current portion | 7,475 | 7,160 | |||||||||
| Consideration payable, less current portion | 14,403 | 14,596 | |||||||||
| Contingent earnout share liability | 30,748 | 33,103 | |||||||||
| Other long-term liabilities | 7,886 | 7,571 | |||||||||
| Deferred income tax liability, net | 46,231 | 47,372 | |||||||||
| Total long-term liabilities | 653,168 | 670,738 | |||||||||
| Temporary equity - Redeemable noncontrolling interest | 4,252 | 4,278 | |||||||||
| Stockholders’ equity: | |||||||||||
Preferred Stock, par value of $0.0001; 1,000,000 shares authorized; 0 shares issued and outstanding at March 31, 2025 and December 31, 2024 | — | — | |||||||||
Class A-1 Common Stock, par value $0.0001; 250,000,000 shares authorized; 96,110,689 shares issued and 84,927,240 shares outstanding at March 31, 2025; 95,865,026 shares issued and 85,670,255 shares outstanding at December 31, 2024 | 8 | 8 | |||||||||
| Additional paid-in capital | 222,462 | 221,625 | |||||||||
| Treasury stock, at cost | (115,789) | (105,485) | |||||||||
| Accumulated other comprehensive income | 3,012 | 4,145 | |||||||||
| Accumulated earnings | 149,375 | 134,736 | |||||||||
| Total stockholders' equity | 259,068 | 255,029 | |||||||||
| Total liabilities, temporary equity, and stockholders' equity | $ | 1,047,256 | $ | 1,048,398 | |||||||
10