UNITED STATES
SECURITIES AND EXCHANGE COMMISSION
Washington, DC 20549
FORM
CURRENT REPORT
Pursuant to Section 13 OR 15(d) of the Securities Exchange Act of 1934
Date of Report (Date of earliest event reported):
(Exact name of registrant as specified in its charter)
(State or other jurisdiction of | (Commission | (I.R.S. Employer | |
incorporation or organization) | File Number) | Identification No.) | |
(Address of principal executive | |||
offices) | (Zip Code) | ||
Post Office Box 27626, | |||
Richmond, Virginia | 23261-7626 | ||
(Mailing address of principal | |||
executive offices) | (Zip Code) |
Registrant’s telephone number, including area code
Securities registered pursuant to Section 12(b) of the Act:
Title of each class | | Trading Symbol(s) | | Name of each exchange on which registered |
Check the appropriate box below if the Form 8-K filing is intended to simultaneously satisfy the filing obligation of the registrant under any of the following provisions (see General Instruction A.2.below):
Indicate by check mark whether the registrant is an emerging growth company as defined in Rule 405 of the Securities Act of 1933 (§230.405 of this chapter) or Rule 12b-2 of the Securities Exchange Act of 1934 (§240.12b-2 of this chapter).
Emerging growth company
Item 2.02Results of Operations and Financial Condition.
On February 19, 2026, Accendra Health, Inc. (the “Company”) issued a press release regarding its financial results for the fourth quarter and year ended December 31, 2025. The Company is furnishing the press release attached hereto as Exhibit 99.1 pursuant to Item 2.02 of Form 8-K. In accordance with General Instruction B.2 of Form 8-K, the information in this Item 2.02, including Exhibit 99.1, shall not be deemed “filed” for the purposes of Section 18 of the Securities Exchange Act of 1934, as amended, or otherwise subject to the liability of that section, nor shall it be deemed incorporated by reference in any filing under the Securities Act of 1933, as amended, except as shall be expressly set forth by specific reference in such a filing.
Item 7.01Regulation FD Disclosure.
On February 19, 2026, the Company posted an earnings presentation on the Investor Relations section of its website. The Company is furnishing the earnings presentation attached hereto as Exhibits 99.2 pursuant to Item 7.01 of Form 8-K. In accordance with General Instruction B.2 of Form 8-K, the information in this Item 7.01, including Exhibit 99.2, shall not be deemed “filed” for the purposes of Section 18 of the Securities Exchange Act of 1934, as amended, or otherwise subject to the liability of that section, nor shall it be deemed incorporated by reference in any filing under the Securities Act of 1933, as amended, except as shall be expressly set forth by specific reference in such a filing.
Item 9.01Financial Statements and Exhibits.
(d)Exhibits.
SIGNATURE
Pursuant to the requirements of the Securities Exchange Act of 1934, the registrant has duly caused this report to be signed on its behalf by the undersigned thereunto duly authorized.
ACCENDRA HEALTH, INC. | ||||
Date: February 19, 2026 | By: | /s/ Heath H. Galloway | ||
Name: |
| Heath H. Galloway | ||
Title: | Executive Vice President, General Counsel and Corporate Secretary | |||
Exhibit 99.1
Accendra Health Reports Fourth Quarter 2025 Financial Results
Completed Sale of Products & Healthcare Services Business On December 31, 2025
Strong Cash Flow and Debt Reduction In Quarter
RICHMOND, VA – February 19, 2026 – Accendra Health, Inc. (NYSE: ACH) today reported financial results for the fourth quarter ended December 31, 2025. Unless otherwise noted, the results herein reflect the Company’s continuing operations, which primarily represent what was previously the Patient Direct segment and certain functional operations.
“We ended the fourth quarter with the completion of the sale of the Products & Healthcare Services (P&HS) business on December 31, 2025, and we are extremely excited to embark on the next chapter of our business as Accendra Health. The next several months will be a period of transition as we work towards completing the separation from Owens & Minor, thereby unlocking the strength of Accendra Health. As we look ahead, we are entering 2026 as a leaner, more nimble company that is well positioned to drive sustainable growth and long-term value creation.” said Edward A. Pesicka, President & Chief Executive Officer, Accendra Health.
“In addition, as we move forward, we will be focused on improving the strength of our financial position through cost controls, improved cash flow generation, and balance sheet optimization. In the years ahead, we look forward to showcasing Accendra’s continuation of higher quality of earnings, low working capital requirements, and more stable and consistent cash flow generation leading to greater value for all stakeholders” Pesicka concluded.
Full Year 2025 Continuing Operations Key Highlights:
| ● | Net revenue of $2.8 billion, representing 3% growth vs. prior year |
| ● | Operating cash flow of $154 million |
| ● | Successful completion of sale of Products & Healthcare Services business, Owens & Minor |
Fourth Quarter Results(1) | | | | | | | | YTD | | YTD | ||
($ in millions, except per share data) | | 4Q25 | | 4Q24 | | 2025 | | 2024 | ||||
| | | | | | | | | | | | |
Revenue | | $ | 709.0 | | $ | 695.0 | | $ | 2,762.0 | | $ | 2,680.1 |
| | | | | | | | | | | | |
Loss from continuing operations, net of tax, GAAP | | $ | (9.4) | | $ | (331.9) | | $ | (102.7) | | $ | (350.7) |
Adj. net income from continuing operations, Non-GAAP | | $ | 16.7 | | $ | 25.0 | | $ | 80.3 | | $ | 75.1 |
| | | | | | | | | | | | |
Adj. EBITDA, Non-GAAP | | $ | 90.0 | | $ | 102.5 | | $ | 374.8 | | $ | 370.5 |
Free cash flow, Non-GAAP | | $ | 18.3 | | $ | 30.1 | | $ | 98.3 | | $ | 96.4 |
| | | | | | | | | | | | |
Loss from continuing operations, net of tax per common share, GAAP | | $ | (0.12) | | $ | (4.30) | | $ | (1.34) | | $ | (4.57) |
Adj. net income from continuing operations per share, Non-GAAP | | $ | 0.21 | | $ | 0.32 | | $ | 1.01 | | $ | 0.96 |
| (1) | Reconciliations of the differences between the non-GAAP financial measures presented in this release and their most directly comparable GAAP financial measures are included in the tables below. |
1
2026 Continuing Operations Financial Outlook
The Company provided financial guidance for 2026; summarized below:
| ● | Revenue ranging between $2.55 billion and $2.65 billion |
| ● | Adjusted EBITDA ranging between $335 million to $355 million |
| ● | Free cash flow of $90 million to $110 million, defined as: |
| • | Adjusted EBITDA (non-GAAP) |
| • | Plus non-cash convert to sale write off expense |
| • | Minus patient service equipment capital expenditures |
| • | Minus interest paid |
Although the Company provides guidance for free cash flow and adjusted EBITDA (which are non-GAAP financial measures), it is not able to forecast the most directly comparable measures calculated and presented in accordance with GAAP without unreasonable effort. Certain elements of the composition of the GAAP amounts are not predictable, making it impracticable for the Company to forecast. Such elements include, but are not limited to, restructuring and acquisition charges which could have a significant and unpredictable impact on our GAAP results. As a result, no GAAP guidance or reconciliation of the Company’s free cash flow or adjusted EBITDA guidance is provided. The outlook is based on certain assumptions, including, but not limited to market conditions, consumer demand, supply chain stability, interest rates, and other factors that are subject to the risk factors discussed in the Company’s filings with the SEC.
Investor Conference Call for Fourth Quarter 2025 Financial Results
Accendra Health will host a conference call for investors and analysts on Thursday, February 19, 2026, at 5:00 p.m. E.T. Participants may access the call via the toll-free dial-in number at 1-888-300-2035, or the toll dial-in number at 1-646-517-7437. The conference ID access code is 1058917. All interested stakeholders are encouraged to access the simultaneous live webcast by visiting the Investor Relations page of the Accendra Health website available at investors.accendrahealth.com/events-and-presentations/. A replay of the webcast can be accessed following the presentation at the link provided above.
This release is intended to be disclosure through methods reasonably designed to provide broad, non-exclusionary distribution to the public in compliance with the SEC’s Fair Disclosure Regulation. This release contains certain “forward looking” statements made pursuant to the Safe Harbor provisions of the Private Securities Litigation Reform Act of 1995. These statements include, but are not limited to, the statements in this release regarding our future prospects and performance, including our expectations with respect to our financial performance, our 2026 financial results, our expectations regarding the performance of our business following the completion of the sale of the Products & Healthcare Services business, our cost saving initiatives, future indebtedness and growth, industry trends, as well as statements related to our expectations regarding the performance of our business, including our ability to address macro and market conditions. Forward-looking statements involve known and unknown risks and uncertainties that may cause our actual results in future periods to differ materially from those projected or contemplated in the forward-looking statements. Investors should refer to the Company’s Annual Report on Form 10-K for the year ended December 31, 2025, expected to be filed with the SEC on or around February 20, 2026, including the section captioned “Item 1A. Risk Factors,” as applicable, and subsequent quarterly reports on Form 10-Q and current reports on Form 8-K filed with or furnished to the SEC, for a discussion of certain known risk factors that could cause the Company’s actual results to differ materially from its current estimates. These filings are available at www.accendrahealth.com. Given these risks and uncertainties, the Company can give no assurance that any forward-looking statements will, in fact, transpire and, therefore, cautions investors not to place undue reliance on them. The Company specifically disclaims any obligation to update or revise any forward-looking statements, whether as a result of new information, future developments or otherwise.
2
About Accendra Health
Accendra Health, Inc. (NYSE: ACH) is a leading nationwide provider of products, technology and services that support health beyond the hospital for millions of people each year. We connect patients, providers, and insurers, delivering innovative solutions that help promote better health outcomes and improve quality of life for people living with chronic, complex health conditions. Backed by the industry-leading expertise of our Apria and Byram brands, Accendra Health is reimagining the future of home-based care. To learn more about our broad portfolio of essentials for diabetes, sleep health, wound care, respiratory care, urology and ostomy, visit www.accendrahealth.com.
3
Accendra Health, Inc.
Consolidated Statements of Operations (unaudited)
(dollars in thousands, except per share data)
| | Three Months Ended December 31, | ||||
| | 2025 | | 2024 | ||
Net revenue | | $ | 708,967 | | $ | 695,023 |
Operating costs and expenses: | | | | | | |
Cost of net revenue | | | 385,709 | | | 362,032 |
Selling, general and administrative expenses | | | 271,499 | | | 269,891 |
Goodwill impairment charge | | | — | | | 307,112 |
Transaction breakage fee | | | — | | | — |
Acquisition-related charges and intangible amortization | | | 29,229 | | | 18,943 |
Exit and realignment charges, net | | | 1,621 | | | 9,744 |
Total operating costs and expenses | | | 688,058 | | | 967,722 |
Operating income (loss) | |
| 20,909 | |
| (272,699) |
Interest expense, net | | | 27,931 | | | 27,617 |
Other expense, net | | | 949 | | | 1,721 |
Loss from continuing operations before income taxes | |
| (7,971) | |
| (302,037) |
Income tax provision | |
| 1,472 | |
| 29,824 |
Loss from continuing operations, net of tax | | | (9,443) | | | (331,861) |
(Loss) income from discontinued operations, net of tax | | | (46,883) | | | 35,744 |
Net loss | | $ | (56,326) | | $ | (296,117) |
| | | | | | |
Basic loss per common share | | | | | | |
Loss from continuing operations, net of tax | | $ | (0.12) | | $ | (4.30) |
(Loss) income from discontinued operations, net of tax | | | (0.61) | | | 0.46 |
Net loss | | $ | (0.73) | | $ | (3.84) |
| | | | | | |
Diluted loss per common share | |
| | |
| |
Loss from continuing operations, net of tax | | $ | (0.12) | | $ | (4.30) |
(Loss) income from discontinued operations, net of tax | | | (0.61) | | | 0.46 |
Net loss | | $ | (0.73) | | $ | (3.84) |
4
Accendra Health, Inc.
Consolidated Statements of Operations (unaudited)
(dollars in thousands, except per share data)
| | Years Ended December 31, | ||||
| | 2025 | | 2024 | ||
Net revenue | | $ | 2,762,032 | | $ | 2,680,112 |
Operating costs and expenses: | | | | | | |
Cost of net revenue | | | 1,472,733 | | | 1,399,732 |
Selling, general and administrative expenses | | | 1,067,560 | | | 1,082,344 |
Goodwill impairment charge | | | — | | | 307,112 |
Transaction breakage fee | | | 80,000 | | | — |
Acquisition-related charges and intangible amortization | | | 95,832 | | | 61,848 |
Exit and realignment charges, net | | | 18,447 | | | 46,806 |
Total operating costs and expenses | | | 2,734,572 | | | 2,897,842 |
Operating income (loss) | |
| 27,460 | |
| (217,730) |
Interest expense, net | | | 107,183 | | | 107,566 |
Transaction financing fees, net | | | 18,288 | | | — |
Other expense, net | | | 3,942 | | | 4,589 |
Loss from continuing operations before income taxes | |
| (101,953) | |
| (329,885) |
Income tax provision | |
| 729 | |
| 20,850 |
Loss from continuing operations, net of tax | | | (102,682) | | | (350,735) |
Loss from discontinued operations, net of tax | | | (997,960) | | | (11,951) |
Net loss | | $ | (1,100,642) | | $ | (362,686) |
| | | | | | |
Basic loss per common share | | | | | | |
Loss from continuing operations, net of tax | | $ | (1.34) | | $ | (4.57) |
Loss from discontinued operations, net of tax | | | (12.97) | | | (0.16) |
Net loss | | $ | (14.31) | | $ | (4.73) |
| | | | | | |
Diluted loss per common share | |
| | |
| |
Loss from continuing operations, net of tax | | $ | (1.34) | | $ | (4.57) |
Loss from discontinued operations, net of tax | | | (12.97) | | | (0.16) |
Net loss | | $ | (14.31) | | $ | (4.73) |
5
Accendra Health, Inc.
Condensed Consolidated Balance Sheets (unaudited)
(dollars in thousands)
| | | | | | |
| | December 31, 2025 | | December 31, 2024 | ||
Assets | | | | | | |
Current assets | | | | | | |
Cash and cash equivalents | | $ | 281,989 | | $ | 27,572 |
Accounts receivable, net | |
| 95,907 | |
| 218,270 |
Inventories, net | |
| 74,435 | |
| 67,581 |
Other current assets | |
| 95,540 | |
| 82,240 |
Current assets held for sale - discontinued operations | | | — | | | 1,625,354 |
Total current assets | |
| 547,871 | |
| 2,021,017 |
Patient service equipment and other fixed assets, net | |
| 256,161 | |
| 249,283 |
Operating lease assets | |
| 109,099 | |
| 126,928 |
Goodwill | |
| 1,228,140 | |
| 1,228,140 |
Intangible assets, net | |
| 136,465 | |
| 210,056 |
Other assets, net | |
| 174,025 | |
| 89,539 |
Noncurrent assets held for sale - discontinued operations | | | — | | | 731,193 |
Total assets | | $ | 2,451,761 | | $ | 4,656,156 |
Liabilities and (deficit) equity | |
| | |
| |
Current liabilities | |
| | |
| |
Accounts payable | | $ | 363,565 | | $ | 359,927 |
Accrued payroll and related liabilities | |
| 69,426 | |
| 73,678 |
Current portion of long-term debt | | | 250,000 | | | 42,866 |
Other current liabilities | |
| 264,084 | |
| 294,685 |
Current liabilities held for sale - discontinued operations | | | — | | | 1,080,896 |
Total current liabilities | |
| 947,075 | |
| 1,852,052 |
Long-term debt, excluding current portion | |
| 1,799,876 | |
| 1,798,393 |
Operating lease liabilities, excluding current portion | |
| 70,317 | |
| 89,466 |
Deferred income taxes, net | |
| — | |
| 19,436 |
Other liabilities | |
| 95,471 | |
| 72,551 |
Noncurrent liabilities held for sale - discontinued operations | | | — | | | 237,894 |
Total liabilities | |
| 2,912,739 | |
| 4,069,792 |
Total (deficit) equity | |
| (460,978) | |
| 586,364 |
Total liabilities and (deficit) equity | | $ | 2,451,761 | | $ | 4,656,156 |
6
Accendra Health, Inc.
Consolidated Statements of Cash Flows (unaudited)
(dollars in thousands)
| | Three Months Ended December 31, | ||||
| | 2025 | | 2024 | ||
Operating activities: |
| | |
| | |
Net loss | | $ | (56,326) | | $ | (296,117) |
Loss (income) from discontinued operations, net of tax | | | 46,883 | | | (35,744) |
Adjustments to reconcile net loss to cash (used for) provided by operating activities: | |
| | |
| |
Depreciation and amortization | |
| 64,536 | |
| 42,525 |
Goodwill impairment charge | | | — | | | 307,112 |
Share-based compensation expense | |
| 3,748 | |
| 4,528 |
Loss on extinguishment of debt | |
| — | |
| 790 |
Deferred income tax benefit | |
| (845) | |
| (18,701) |
Changes in operating lease right-of-use assets and lease liabilities | |
| (3,800) | |
| (516) |
Gain from sale and dispositions of patient service equipment | |
| (10,889) | |
| (7,023) |
Changes in operating assets and liabilities: | |
| | | | |
Accounts receivable, net | |
| 106,824 | |
| 14,004 |
Inventories | |
| (10,588) | |
| 7,215 |
Accounts payable | |
| 26,762 | |
| (34,762) |
Net change in other assets and liabilities | | | (34,374) | | | 13,890 |
Other, net | | | 2,840 | | | 1,845 |
Cash (used for) provided by operating activities from discontinued operations | | | (66,585) | | | 71,955 |
Cash provided by operating activities | |
| 68,186 | |
| 71,001 |
Investing activities: | |
| | |
| |
Proceeds from P&HS sale | | | 342,351 | | | — |
Cash sold with P&HS sale | | | (18,091) | | | — |
Additions to patient service equipment ($45 million and $47 million) and other fixed assets | |
| (45,414) | | | (50,123) |
Proceeds from sale of patient service equipment | |
| 24,599 | |
| 18,667 |
Additions to computer software | |
| (3,061) | |
| (3,132) |
Other, net | |
| — | |
| 465 |
Cash used for investing activities from discontinued operations | | | (15,380) | | | (18,181) |
Cash provided by (used for) investing activities | |
| 285,004 | |
| (52,304) |
Financing activities: | |
| | |
| |
Borrowings under amended Receivables Financing Agreement | |
| — | |
| 179,400 |
Repayments under amended Receivables Financing Agreement | |
| — | |
| (179,400) |
Borrowings under Revolving Credit Facility | | | 472,300 | | | 635,800 |
Repayments under Revolving Credit Facility | | | (539,500) | | | (635,800) |
Repayments of debt | |
| — | |
| (32,750) |
Repurchase of common stock | | | (3,523) | | | — |
Other, net | |
| 259 | |
| 1,719 |
Cash used for financing activities from discontinued operations | | | (47,032) | | | (12,065) |
Cash used for financing activities | |
| (117,496) | |
| (43,096) |
Effect of exchange rate changes on cash, cash equivalents and restricted cash | |
| 129 | |
| (1,309) |
Net increase (decrease) in cash, cash equivalents and restricted cash | |
| 235,823 | |
| (25,708) |
Cash, cash equivalents and restricted cash at beginning of period ¹ | |
| 46,166 | |
| 75,090 |
Cash, cash equivalents and restricted cash at end of period | | $ | 281,989 | | $ | 49,382 |
Supplemental disclosure of cash flow information: | |
| | |
| |
Income taxes paid (received), net | | $ | 3,687 | | $ | (2,057) |
Interest paid | | $ | 38,572 | | $ | 37,269 |
Noncash investing activity: | |
| | |
| |
Unpaid purchases of patient service equipment and other fixed assets at end of period | | $ | 74,119 | | $ | 84,562 |
| (1) | This amount includes cash from discontinued operations of $13 million as of September 30, 2025. There was no restricted cash as of December 31, 2025 or September 30, 2025. |
7
Accendra Health, Inc.
Consolidated Statements of Cash Flows (unaudited)
(dollars in thousands)
| | Years Ended December 31, | ||||
| | 2025 | | 2024 | ||
Operating activities: | | | | | | |
Net loss | | $ | (1,100,642) | | $ | (362,686) |
Loss from discontinued operations, net of tax | | | 997,960 | | | 11,951 |
Adjustments to reconcile net loss to cash (used for) provided by operating activities: | |
| | |
| |
Depreciation and amortization | |
| 214,524 | |
| 181,281 |
Goodwill impairment charge | | | — | | | 307,112 |
Share-based compensation expense | |
| 12,873 | |
| 16,638 |
Loss (gain) on extinguishment of debt | |
| — | |
| 1,101 |
Deferred income tax benefit | |
| (17,887) | |
| (8,042) |
Changes in operating lease right-of-use assets and lease liabilities | |
| 735 | |
| 1,472 |
Gain from sale and dispositions of patient service equipment | |
| (27,274) | |
| (35,355) |
Changes in operating assets and liabilities: | |
| | |
| |
Accounts receivable, net | |
| 122,363 | |
| (3,677) |
Inventories | |
| (6,854) | |
| (4,591) |
Accounts payable | |
| 6,478 | |
| 66,894 |
Net change in other assets and liabilities | |
| (56,779) | |
| (36,026) |
Other, net | |
| 8,999 | |
| 7,614 |
Cash (used for) provided by operating activities from discontinued operations | | | (256,286) | | | 17,809 |
Cash (used for) provided by operating activities | |
| (101,790) | |
| 161,495 |
Investing activities: | |
| | |
| |
Proceeds from P&HS sale | |
| 342,351 | |
| — |
Cash sold with P&HS sale | | | (18,091) | |
| — |
Additions to patient service equipment ($189 million and $167 million) and other fixed assets | |
| (190,956) | |
| (170,286) |
Proceeds from sale of patient service equipment | |
| 77,968 | |
| 69,926 |
Additions to computer software | | | (10,369) | | | (12,379) |
Other, net | |
| (1,910) | |
| 14,703 |
Cash used for investing activities from discontinued operations | | | (54,570) | | | (18,497) |
Cash provided by (used for) investing activities | |
| 144,423 | |
| (116,533) |
Financing activities: | |
| | |
| |
Borrowings under amended Receivables Financing Agreement | |
| — | |
| 1,465,800 |
Repayments under amended Receivables Financing Agreement | |
| — | |
| (1,465,800) |
Borrowings under Revolving Credit Facility | | | 2,914,784 | | | 635,800 |
Repayments under Revolving Credit Facility | | | (2,711,284) | | | (635,800) |
Repayments of debt | |
| — | |
| (244,197) |
Repurchase of common stock | |
| (10,179) | |
| — |
Other, net | |
| (3,116) | |
| (5,826) |
Cash used for financing activities from discontinued operations | | | (2,127) | | | (17,580) |
Cash provided by (used for) financing activities | |
| 188,078 | |
| (267,603) |
Effect of exchange rate changes on cash, cash equivalents and restricted cash | |
| 1,896 | |
| (901) |
Net increase (decrease) in cash, cash equivalents and restricted cash | |
| 232,607 | |
| (223,542) |
Cash, cash equivalents and restricted cash at beginning of period | |
| 49,382 | |
| 272,924 |
Cash, cash equivalents and restricted cash at end of period(1) | | $ | 281,989 | | $ | 49,382 |
Supplemental disclosure of cash flow information: | |
| | |
| |
Income taxes paid, net | | $ | 12,471 | | $ | 5,553 |
Interest paid | | $ | 134,710 | | $ | 141,547 |
Noncash investing activity: | |
| | |
| |
Unpaid purchases of patient service equipment and other fixed assets at end of period | | $ | 74,119 | | $ | 84,562 |
| (1) | This amount includes cash from discontinued operations of $22 million as of December 31, 2024. There was no restricted cash as of December 31, 2025 and December 31, 2024. |
8
Accendra Health, Inc.
Net Loss Per Common Share (unaudited)
(dollars in thousands, except per share data)
| | Three Months Ended December 31, | | ||||
| | 2025 | | 2024 | | ||
Loss from continuing operations, net of tax | | $ | (9,443) | | $ | (331,861) | |
Loss from discontinued operations, net of tax | | | (46,883) | | | 35,744 | |
Net loss | | $ | (56,326) |
| $ | (296,117) | |
| |
| |
| | | |
Weighted average shares outstanding - basic | | | 76,699 |
| | 77,169 | |
Dilutive shares | | | — | | | — | |
Weighted average shares outstanding - diluted | | | 76,699 |
| | 77,169 | |
| | | | | | | |
Basic loss per common share | | | | | | | |
Loss from continuing operations, net of tax | | $ | (0.12) | | $ | (4.30) | |
(Loss) income from discontinued operations, net of tax | | | (0.61) | | | 0.46 | |
Net loss | | $ | (0.73) | | $ | (3.84) | |
| | | | | | | |
Diluted loss per common share: | | | |
| | | |
Loss from continuing operations, net of tax | | $ | (0.12) |
| $ | (4.30) | |
(Loss) income from discontinued operations, net of tax | | | (0.61) | | | 0.46 | |
Net loss | | $ | (0.73) | | $ | (3.84) | |
Share-based awards for the three months ended December 31, 2025 and 2024 of approximately 2.4 million and 1.4 million shares were excluded from the calculation of diluted loss per common share as the effect would be anti-dilutive.
9
Accendra Health, Inc.
Net Loss Per Common Share (unaudited)
(dollars in thousands, except per share data)
| | Years Ended December 31, | ||||
| | 2025 | | 2024 | ||
Loss from continuing operations, net of tax | | $ | (102,682) | | $ | (350,735) |
Loss from discontinued operations, net of tax | | | (997,960) | | | (11,951) |
Net loss |
| $ | (1,100,642) |
| $ | (362,686) |
|
| | |
| | |
Weighted average shares outstanding - basic |
| | 76,897 |
| | 76,741 |
Dilutive shares | | | — | | | — |
Weighted average shares outstanding - diluted |
| | 76,897 |
| | 76,741 |
| | | | | | |
Basic loss per common share | | | | | | |
Loss from continuing operations, net of tax | | $ | (1.34) | | $ | (4.57) |
Loss from discontinued operations, net of tax | | | (12.97) | | | (0.16) |
Net loss | | $ | (14.31) | | $ | (4.73) |
| | | | | | |
Diluted loss per common share: |
| | |
| | |
Loss from continuing operations, net of tax |
| $ | (1.34) |
| $ | (4.57) |
Loss from discontinued operations, net of tax | | | (12.97) | | | (0.16) |
Net loss | | $ | (14.31) | | $ | (4.73) |
Share-based awards for the years ended December 31, 2025 and 2024 of approximately 2.2 million and 1.5 million shares were excluded from the calculation of diluted loss per common share as the effect would be anti-dilutive.
10
Accendra Health, Inc.
GAAP/Non-GAAP Reconciliations (unaudited)
(dollars in thousands, except per share data)
The following table provides a reconciliation of reported operating income (loss), loss from continuing operations, net of tax and loss from continuing operations, net of tax per share to non-GAAP measures used by management.
| | | | | | | | | | | | | |
| | Three Months Ended December 31, | | Years Ended December 31, |
| ||||||||
| | 2025 | | 2024 | | 2025 | | 2024 |
| ||||
Operating income (loss), as reported (GAAP) | | $ | 20,909 | | $ | (272,699) | | $ | 27,460 | | $ | (217,730) | |
Acquisition-related charges and intangible amortization (1) | |
| 29,229 | |
| 18,943 | |
| 95,832 | |
| 61,848 | |
Transaction breakage fee (2) | | | — | | | — | | | 80,000 | | | — | |
Exit and realignment charges, net (3) | |
| 1,621 | |
| 9,744 | |
| 18,447 | |
| 46,806 | |
Goodwill impairment charge (6) | | | — | | | 307,112 | | | — | | | 307,112 | |
Litigation and related charges (5) | | | 262 | | | 458 | | | 2,418 | | | 17,119 | |
Operating income, adjusted (non-GAAP) (Adjusted Operating Income) | | $ | 52,021 | | $ | 63,558 | | $ | 224,157 | | $ | 215,155 | |
Operating income (loss) as a percent of net revenue (GAAP) | |
| 2.95 | % |
| (39.24) | % |
| 0.99 | % |
| (8.12) | % |
Adjusted operating income as a percent of net revenue (non-GAAP) | |
| 7.34 | % |
| 9.14 | % |
| 8.12 | % |
| 8.03 | % |
| | | | | | | | | | | | | |
Loss from continuing operations, net of tax, as reported (GAAP) | | $ | (9,443) | | $ | (331,861) | | $ | (102,682) | | $ | (350,735) | |
Pre-tax adjustments: | |
| | |
| | |
| | |
| | |
Acquisition-related charges and intangible amortization (1) | |
| 29,229 | |
| 18,943 | |
| 95,832 | | | 61,848 | |
Transaction breakage fee (2) | | | — | | | — | | | 80,000 | | | — | |
Exit and realignment charges, net (3) | |
| 1,621 | |
| 9,744 | |
| 18,447 | | | 46,806 | |
Goodwill impairment charge (6) | | | — | | | 307,112 | | | — | | | 307,112 | |
Transaction financing fees, net (4) | | | — | | | — | | | 18,288 | | | — | |
Litigation and related charges (5) | | | 262 | | | 458 | | | 2,418 | | | 17,119 | |
Other (9) | |
| 424 | |
| 1,221 | |
| 1,696 | | | 2,823 | |
Income tax benefit on pre-tax adjustments (11) | |
| (5,384) | |
| 19,408 | |
| (33,710) | | | (9,846) | |
Income from continuing operations, net of tax, adjusted (non-GAAP) (Adjusted Net Income) | | $ | 16,709 | | $ | 25,025 | | $ | 80,289 | | $ | 75,127 | |
| | | | | | | | | | | | | |
Loss from continuing operations, net of tax per common share, as reported (GAAP) | | $ | (0.12) | | $ | (4.30) | | $ | (1.34) | | $ | (4.57) | |
After-tax adjustments: | |
| | |
| | |
| | |
| | |
Acquisition-related charges and intangible amortization (1) | |
| 0.31 | |
| 0.42 | |
| 0.91 | |
| 0.76 | |
Transaction breakage fee (2) | | | — | | | — | | | 1.04 | | | — | |
Exit and realignment charges, net (3) | |
| 0.02 | |
| 0.22 | |
| 0.18 | |
| 0.55 | |
Goodwill impairment charge (6) | | | — | | | 3.95 | | | — | | | 3.97 | |
Transaction financing fees, net (4) | | | — | | | — | | | 0.17 | | | — | |
Litigation and related charges (5) | | | — | | | 0.01 | | | 0.03 | | | 0.21 | |
Other (9) | | | — | | | 0.02 | | | 0.02 | | | 0.04 | |
Income from continuing operations, net of tax, per common share, adjusted (non-GAAP) (Adjusted EPS) | | $ | 0.21 | | $ | 0.32 | | $ | 1.01 | | $ | 0.96 | |
11
Accendra Health, Inc.
GAAP/Non-GAAP Reconciliations (unaudited), continued
(dollars in thousands)
The following tables provide reconciliations of loss from continuing operations, net of tax and total debt to non-GAAP measures used by management.
| | Three Months Ended December 31, | ||||
| | 2025 | | 2024 | ||
Loss from continuing operations, net of tax, as reported (GAAP) | | $ | (9,443) | | $ | (331,861) |
Income tax provision | |
| 1,472 | |
| 29,824 |
Interest expense, net | |
| 27,931 | |
| 27,617 |
Acquisition-related charges and intangible amortization (1) | | | 29,229 | | | 18,943 |
Exit and realignment charges, net (3) | | | 1,621 | | | 9,744 |
Litigation and related charges (5) | | | 262 | | | 458 |
Goodwill impairment charge (6) | | | — | | | 307,112 |
Other depreciation and amortization (7) | | | 35,307 | | | 34,959 |
Stock compensation (8) | | | 3,217 | | | 4,528 |
Other (9) | |
| 424 | |
| 1,221 |
Adjusted EBITDA (non-GAAP) | | | 90,020 | | | 102,545 |
Non-cash convert to sale write off expense (10) | |
| 11,881 | |
| 11,394 |
Patient service equipment capital expenditures | |
| (45,033) | |
| (46,588) |
Interest paid | | | (38,572) | | | (37,269) |
Free cash flow (non-GAAP) | | $ | 18,296 | | $ | 30,082 |
| | Years Ended December 31, | ||||
| | 2025 | | 2024 | ||
Loss from continuing operations, net of tax, as reported (GAAP) | | $ | (102,682) | | $ | (350,735) |
Income tax provision | |
| 729 | |
| 20,850 |
Interest expense, net | |
| 107,183 | |
| 107,566 |
Acquisition-related charges and intangible amortization (1) | | | 95,832 | | | 61,848 |
Transaction breakage fee (2) | | | 80,000 | | | — |
Exit and realignment charges, net (3) | | | 18,447 | | | 46,806 |
Transaction financing fees, net (4) | | | 18,288 | | | — |
Litigation and related charges (5) | | | 2,418 | | | 17,119 |
Goodwill impairment charge (6) | | | — | | | 307,112 |
Other depreciation and amortization (7) | | | 140,935 | | | 141,545 |
Stock compensation (8) | | | 12,001 | | | 15,581 |
Other (9) | |
| 1,696 | |
| 2,823 |
Adjusted EBITDA (non-GAAP) | | | 374,847 | | | 370,515 |
Non-cash convert to sale write off expense (10) | |
| 46,951 | |
| 34,105 |
Patient service equipment capital expenditures | |
| (188,823) | |
| (166,659) |
Interest paid | | | (134,710) | | | (141,547) |
Free cash flow (non-GAAP) | | $ | 98,265 | | $ | 96,414 |
| December 31, | | September 30, | | December 31, | |||
| 2025 | | 2025 | | 2024 | |||
Total debt, as reported (GAAP) | $ | 2,049,876 | | $ | 2,115,261 | | $ | 1,841,259 |
Cash and cash equivalents |
| (281,989) | |
| (32,837) | |
| (27,572) |
Net debt (non-GAAP) | $ | 1,767,887 | | $ | 2,082,424 | | $ | 1,813,687 |
12
Accendra Health, Inc.
GAAP/Non-GAAP Reconciliations (unaudited), continued
The following items have been excluded in our non-GAAP financial measures:
13
Use of Non-GAAP Measures
This earnings release contains financial measures that are not calculated in accordance with U.S. generally accepted accounting principles (GAAP). In general, the measures exclude items and charges that (i) management does not believe reflect Accendra Health, Inc.’s (the Company) core business and relate more to strategic, multi-year corporate activities; or (ii) relate to activities or actions that may have occurred over multiple or in prior periods without predictable trends. Management uses these non-GAAP financial measures internally to evaluate the Company’s performance, evaluate the balance sheet, engage in financial and operational planning and determine incentive compensation.
Management provides these non-GAAP financial measures to investors as supplemental metrics to assist readers in assessing the effects of items and events on its financial and operating results and in comparing the Company’s performance to that of its competitors. However, the non-GAAP financial measures used by the Company may be calculated differently from, and therefore may not be comparable to, similarly titled measures used by other companies.
The non-GAAP financial measures disclosed by the Company should not be considered substitutes for, or superior to, financial measures calculated in accordance with GAAP, and the financial results calculated in accordance with GAAP and reconciliations to those financial statements set forth above should be carefully evaluated.
CONTACT:
Investors
Will Parrish
Vice President, Strategy, Corporate Development, & Investor Relations
Media
Darla Turner
ACH-CORP
ACH-IR
SOURCE: Accendra Health, Inc.
14
| Fourth Quarter 2025 Continuing Operations Supplemental Slides February 19, 2026 |
| p. 2 This presentation is intended to be disclosure through methods reasonably designed to provide broad, non-exclusionary distribution to the public in compliance with the SEC’s Fair Disclosure Regulation. This presentation contains certain “forward looking” statements made pursuant to the Safe Harbor provisions of the Private Securities Litigation Reform Act of 1995. These statements include, but are not limited to, the statements in this presentation regarding our future prospects and performance, including our expectations with respect to our financial performance, our 2026 financial results, our expectations regarding the performance of our business following the completion of the sale of the Products & Healthcare Services business, our cost saving initiatives, future indebtedness and growth, industry trends, as well as statements related to our expectations regarding the performance of our business, including our ability to address macro and market conditions. Forward-looking statements involve known and unknown risks and uncertainties that may cause our actual results in future periods to differ materially from those projected or contemplated in the forward-looking statements. Investors should refer to the Accendra Health, Inc.’s (the Company)’s Annual Report on Form 10-K for the year ended December 31, 2025, expected to be filed with the SEC on or around February 20, 2026, including the section captioned “Item 1A. Risk Factors,” as applicable, and subsequent quarterly reports on Form 10-Q and current reports on Form 8-K filed with or furnished to the SEC, for a discussion of certain known risk factors that could cause the Company’s actual results to differ materially from its current estimates. These filings are available at www.accendrahealth.com. Given these risks and uncertainties, the Company can give no assurance that any forward-looking statements will, in fact, transpire and, therefore, cautions investors not to place undue reliance on them. The Company specifically disclaims any obligation to update or revise any forward-looking statements, whether as a result of new information, future developments or otherwise. This presentation contains financial measures that are not calculated in accordance with U.S. generally accepted accounting principles (GAAP). In general, the measures exclude items and charges that (i) management does not believe reflect the Company’s core business and relate more to strategic, multi-year corporate activities; or (ii) relate to activities or actions that may have occurred over multiple or in prior periods without predictable trends. Management uses these non-GAAP financial measures internally to evaluate the Company’s performance, evaluate the balance sheet, engage in financial and operational planning, and determine incentive compensation. Management provides these non-GAAP financial measures to investors as supplemental metrics to assist readers in assessing the effects of items and events on its financial and operating results and in comparing the Company’s performance to that of its competitors. However, the non-GAAP financial measures used by the Company may be calculated differently from, and therefore may not be comparable to, similarly titled measures used by other companies. The non-GAAP financial measures disclosed by the Company should not be considered substitutes for, or superior to, financial measures calculated in accordance with GAAP, and the financial results calculated in accordance with GAAP and reconciliations to those financial statements set forth above should be carefully evaluated. Safe Harbor |

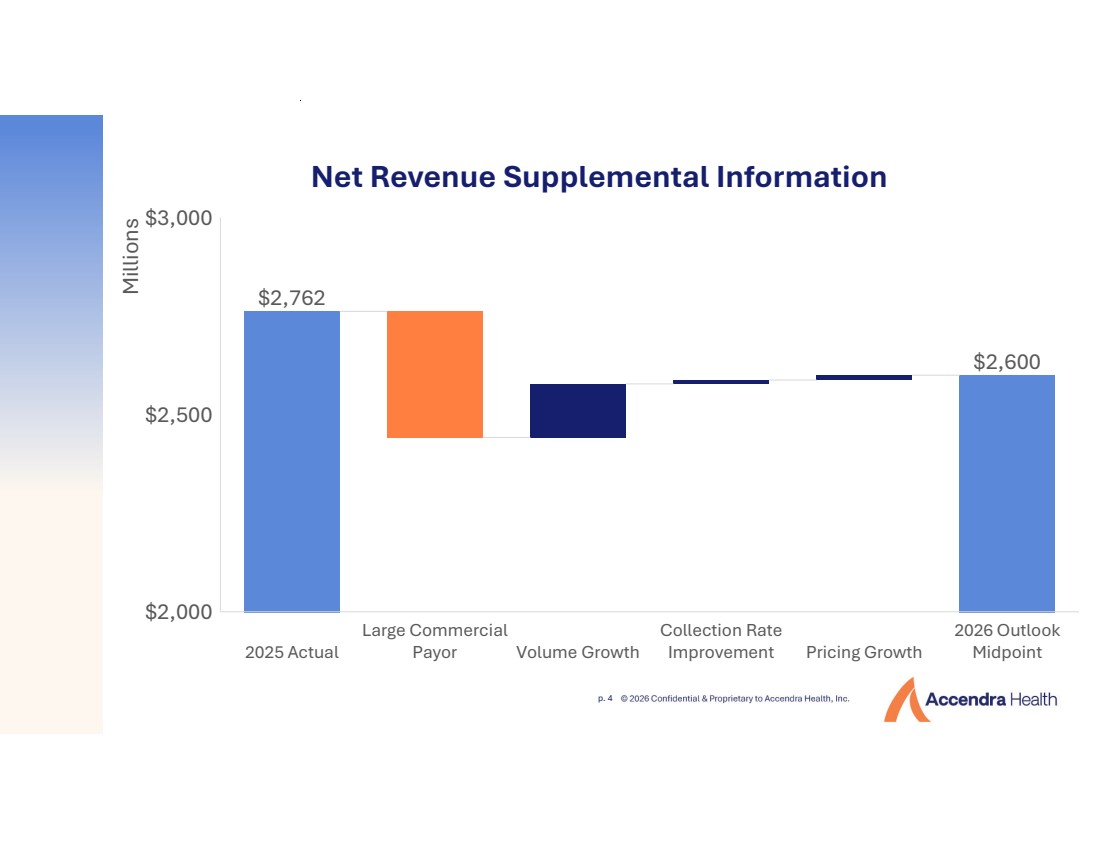
| p. 3 2026 Continuing Operations Outlook & Modeling Assumptions Modeling Assumptions(1) Full Year 2026 Outlook Revenue $2.55 - $2.65 billion Adjusted EBITDA (2) $335 - $355 million Interest Expense $115 - $120 million Adjusted Effective Tax Rate 29.0% - 30.0% Diluted Weighted Average Shares Outstanding ~79 million Gross Capital Expenditures $160 - $170 million (3) Free Cash Flow $90 - $110 million (2) 1. Company outlook and modeling assumptions are assumptions used for 2026 adjusted EBITDA guidance, and the Company undertakes no obligation to update such assumptions subsequent to the date of this presentation (February 19, 2026). Please see Form 8-K filed by Accendra Health, Inc. with the SEC on or around February 19, 2026, for additional financial information. 2. Although the Company does provide guidance for adjusted EBITDA and free cash flow (which are non-GAAP financial measures), it is not able to forecast the most directly comparable measures calculated and presented in accordance with GAAP without unreasonable effort. Certain elements of the composition of the GAAP amounts are not predictable, making it impracticable for the Company to forecast. Such elements include, but are not limited to, restructuring and acquisition charges, which could have a significant and unpredictable impact on our GAAP results. As a result, no GAAP guidance or reconciliation of the Company’s adjusted EBITDA guidance or free cash flow guidance is provided. The outlook is based on certain assumptions that are subject to the risk factors discussed in the Company’s filings with the Securities and Exchange Commission (“SEC”). See slide 6 for a reconciliation of historical adjusted EBITDA and free cash flow to the most directly comparable GAAP measure. 3. Does not include proceeds from sale of patient service equipment. |
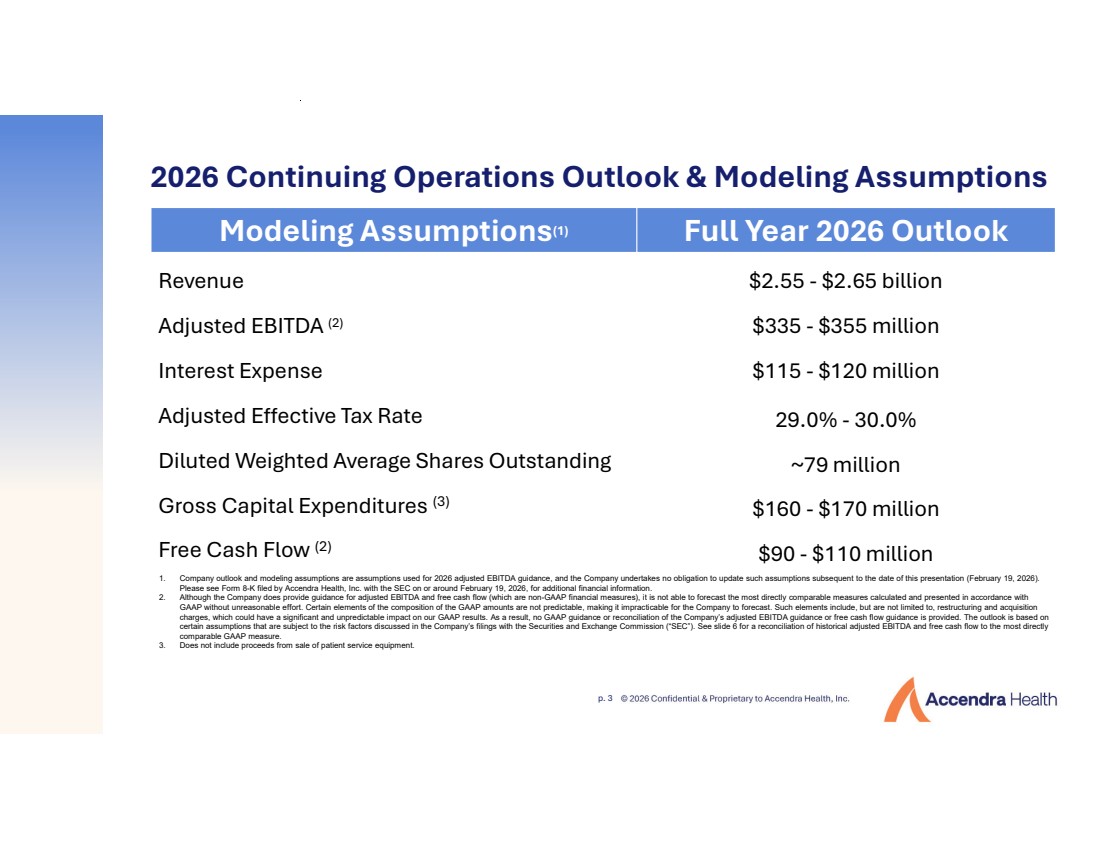
| p. 4 Net Revenue Supplemental Information $2,762 $2,600 2025 Actual Large Commercial Payor Volume Growth Collection Rate Improvement Pricing Growth 2026 Outlook Midpoint Millions $2,000 $2,100 $2,200 $2,300 $2,400 $2,500 $2,600 $2,700 $2,800 $2,900 $3,000 |
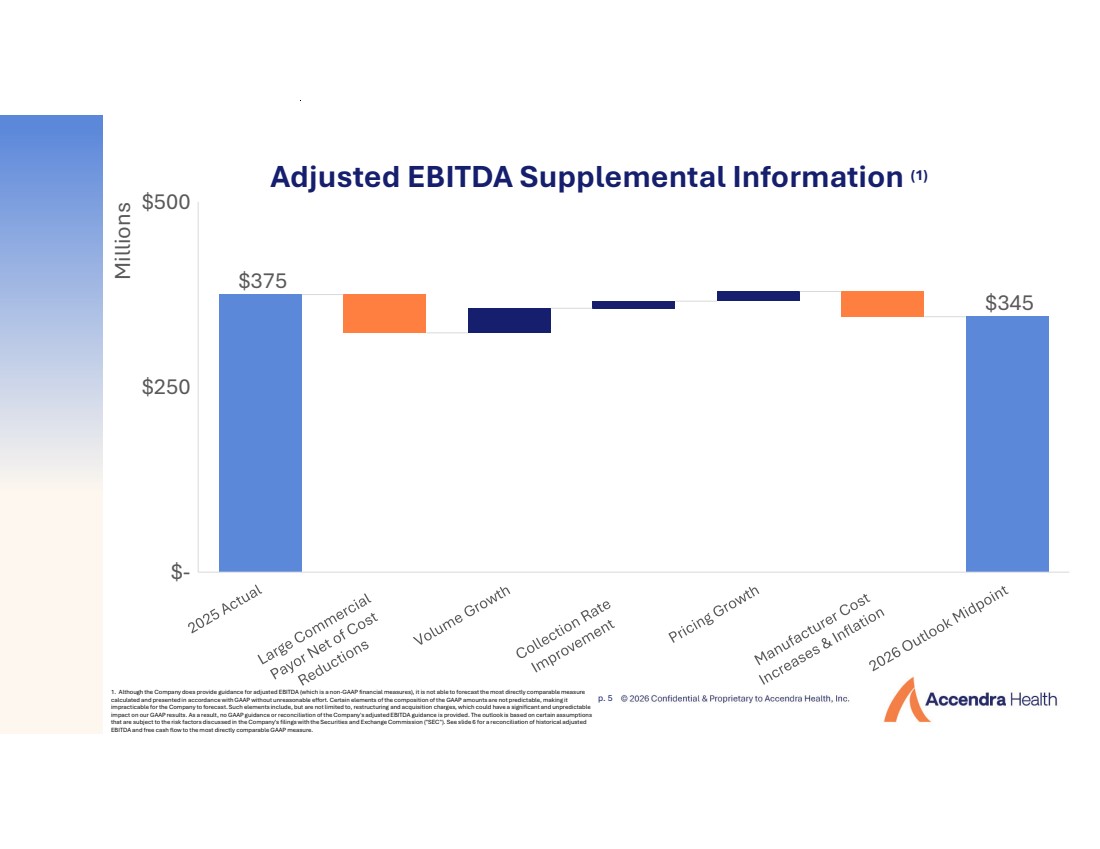
| p. 5 $375 $345 Millions $- $50 $100 $150 $200 $250 $300 $350 $400 $450 $500 Adjusted EBITDA Supplemental Information (1) 1. Although the Company does provide guidance for adjusted EBITDA (which is a non-GAAP financial measures), it is not able to forecast the most directly comparable measure calculated and presented in accordance with GAAP without unreasonable effort. Certain elements of the composition of the GAAP amounts are not predictable, making it impracticable for the Company to forecast. Such elements include, but are not limited to, restructuring and acquisition charges, which could have a significant and unpredictable impact on our GAAP results. As a result, no GAAP guidance or reconciliation of the Company's adjusted EBITDA guidance is provided. The outlook is based on certain assumptions that are subject to the risk factors discussed in the Company's filings with the Securities and Exchange Commission ("SEC"). See slide 6 for a reconciliation of historical adjusted EBITDA and free cash flow to the most directly comparable GAAP measure. |
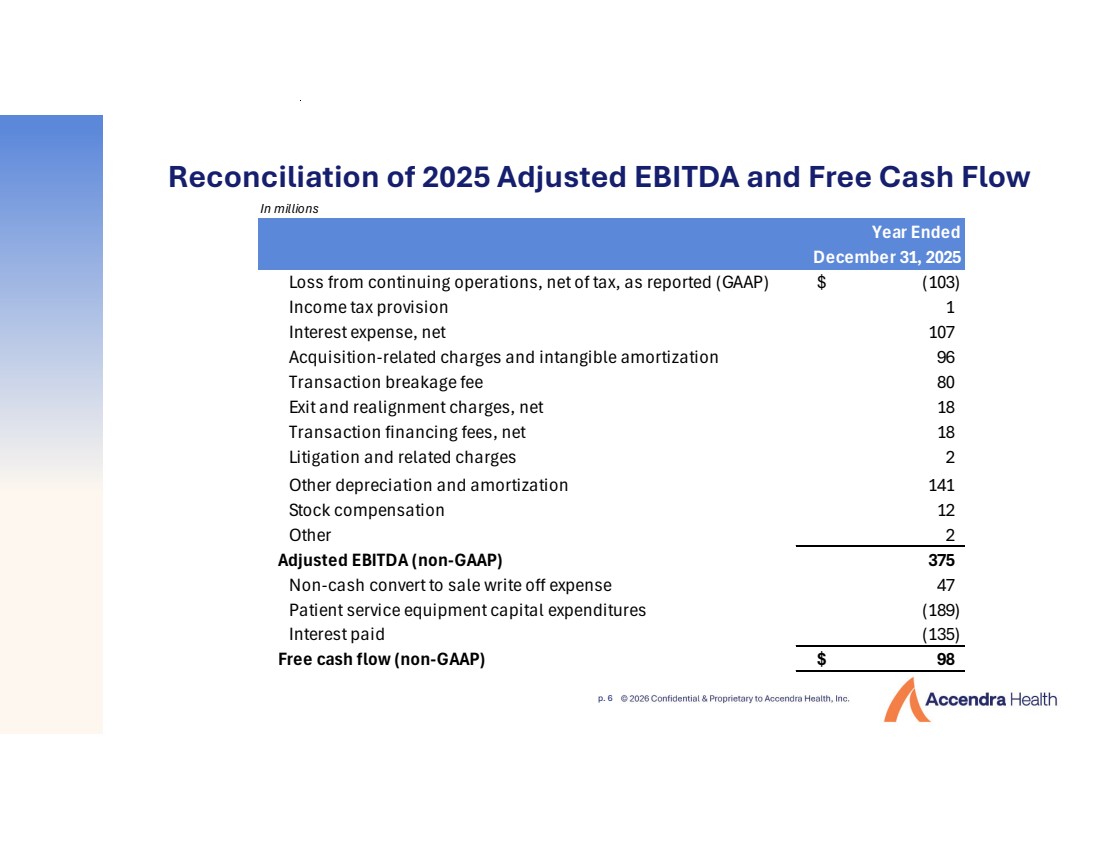
| p. 6 Reconciliation of 2025 Adjusted EBITDA and Free Cash Flow In millions Year Ended December 31, 2025 Loss from continuing operations, net of tax, as reported (GAAP) (103) $ Income tax provision 1 Interest expense, net 107 Acquisition-related charges and intangible amortization 96 Transaction breakage fee 80 Exit and realignment charges, net 18 Transaction financing fees, net 18 Litigation and related charges 2 Other depreciation and amortization 141 Stock compensation 12 Other 2 Adjusted EBITDA (non-GAAP) 375 Non-cash convert to sale write off expense 47 Patient service equipment capital expenditures (189) Interest paid (135) Free cash flow (non-GAAP) 98 $ |
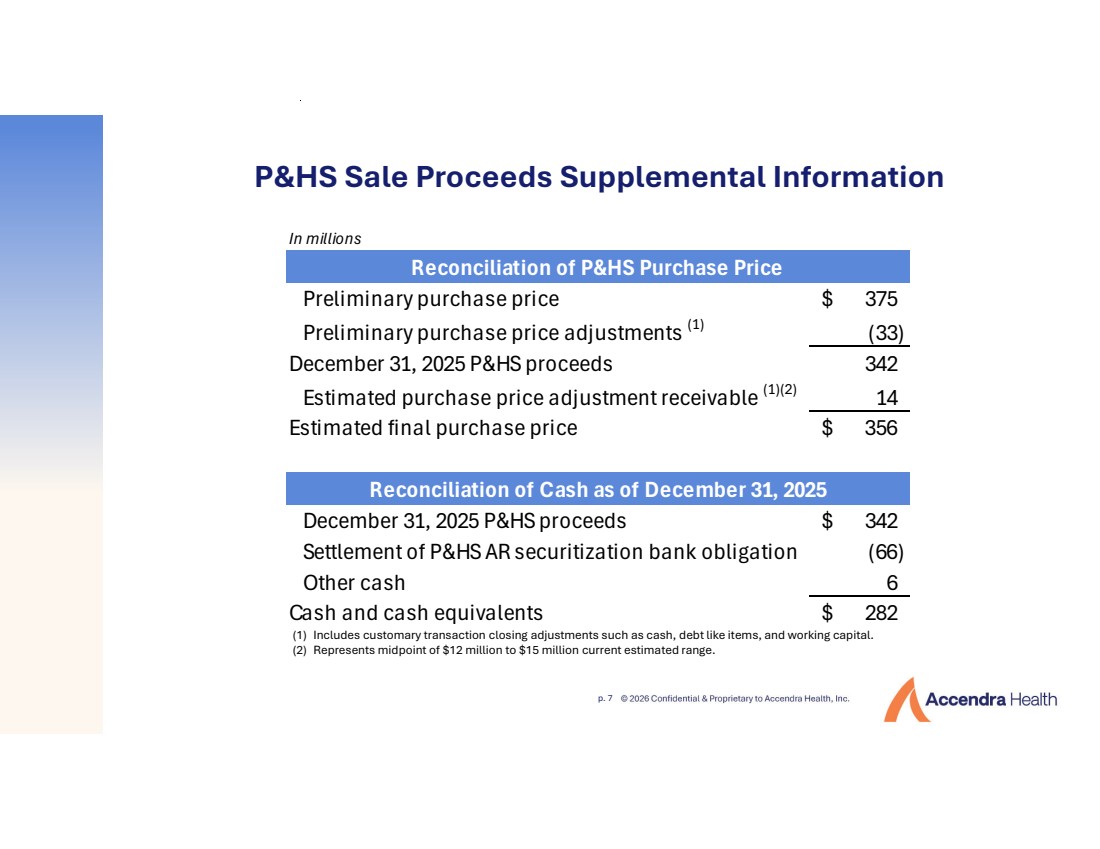
| p. 7 P&HS Sale Proceeds Supplemental Information (1) Includes customary transaction closing adjustments such as cash, debt like items, and working capital. (2) Represents midpoint of $12 million to $15 million current estimated range. In millions Preliminary purchase price 375 $ Preliminary purchase price adjustments (1) (33) December 31, 2025 P&HS proceeds 342 Estimated purchase price adjustment receivable (1)(2) 14 Estimated final purchase price 356 $ December 31, 2025 P&HS proceeds 342 $ Settlement of P&HS AR securitization bank obligation (66) Other cash 6 Cash and cash equivalents 282 $ Reconciliation of P&HS Purchase Price Reconciliation of Cash as of December 31, 2025 |