FOR IMMEDIATE RELEASE
March 4, 2020
Owens & Minor Reports 4th Quarter and Full Year 2019 Financial Results
RICHMOND, VA – March 4, 2020 – Owens & Minor, Inc. (NYSE-OMI) today reported financial results for the fourth quarter and the year ended December 31, 2019, as summarized in the table below.
“I am very pleased that we were able to sustain sequential improvement in adjusted operating income and adjusted earnings per share while also continuing to generate positive cash flow and reduce debt. Looking back at 2019, I am proud that we changed our culture, significantly improved customer service, built a great leadership team, and drove operating efficiencies, enabling us to establish a strong foundation for the future,” said Edward A. Pesicka, President & Chief Executive Officer of Owens & Minor.
“In addition to the strong foundation we have built in 2019, we’ve already taken action in 2020 to provide financial flexibility through the pending sale of Movianto and our improved debt profile. This further enables us to reinvest and focus on our core businesses – distribution, products, and services. We believe these investments will continue to drive long-term profitable growth generating consistent annual double-digit earnings growth beyond 2020.”
|
| | | | | | | | | |
Financial Summary1 | | | | | FYE | | FYE | |
($ in millions, except per share data) | 4Q19 | | 4Q18 | | 2019 | | 2018 | |
| | | | | | | | |
Revenue | $2,191 | | $2,434 | | $9,211 | | $9,418 | |
| | | | | | | | |
Operating Income (loss), GAAP2,3 | $14.5 | | ($238) | | $73.2 | | ($352) | |
Adj. Operating Income, Non-GAAP2,3 | $43.5 | | $33.7 | | $153 | | $177 | |
| | | | | | | | |
Net Income (Loss), GAAP2,3 | ($39.0) | | ($262) | | ($62.4) | | ($437) | |
Adj. Net Income, Non-GAAP2,3 | $14.7 | | $5.3 | | $34.0 | | $70.4 | |
| | | | | | | | |
Net Income (Loss) per share, GAAP2,3 | ($0.65) | | ($4.37) | | ($1.03) | | ($7.28) | |
Adj. Net Income per share, Non-GAAP2,3 | $0.24 | | $0.09 | | $0.56 | | $1.15 | |
Adj. Net Income per share, Non-GAAP, constant currency2,3,4 | $0.26 | | $0.09 | | $0.60 | | $1.15 | |
| | | | | | | | |
1. Current and prior period financial results reflect the reporting of Movianto as a discontinued operation due to the pending sale. 2. Reconciliations of the differences between the non-GAAP financial measures presented in this release and their most directly comparable GAAP financial measures are included in the tables below. 3. Quarterly and year-to-date comparisons to prior year results are impacted by the 2018 goodwill and intangible asset impairment charges. These charges were classified as non-GAAP items and, accordingly, did not affect results reported on an adjusted basis. 4. Adjusted net income per share, non-GAAP at 2018 foreign currency exchange rates. | | |
2019 Results
| |
• | Adjusted operating income and adjusted net income per share improved sequentially in every quarter throughout 2019 as a result of operational effectiveness, seasonality, and revenue mix. |
| |
• | Year-over-year adjusted operating income and adjusted net income per share improved for both the fourth quarter and second half of 2019. |
| |
• | The revenue changes were driven by lower Medical Distribution sales, partially offset by increased sales from Global Products and certain business lines within Global Solutions. |
| |
• | Operating results reflect adjusted operating margin expansion from operating efficiencies and improved sales mix, partially offset by investments to support business growth and Fusion5. |
| |
• | The Company generated $27 million of operating cash flow in the fourth quarter and a total of $166 million for the year including $227 million generated in the last three quarters of the year. |
| |
• | Total debt was reduced by $41 million in the fourth quarter and by $117 million for the full year. Combined debt reduction for the second through fourth quarter of 2019 was $171 million. |
| |
• | Interest expense increased $27.1 million for the full year compared to prior year. |
Recent Highlights
| |
• | On January 16, 2020, the Company announced the pending sale of its European logistics business, Movianto, to EHDH Holding Group, a privately held French company and the transaction, which is subject to certain customary approvals and conditions to close, is expected to close in the first half of 2020. |
| |
• | On February 18, 2020, the Company announced it amended its credit agreement providing enhanced financial flexibility. |
| |
• | On February 19, 2020, the Company closed an expanded accounts receivable securitization facility in the amount of $325 million allowing it to reduce interest costs. |
| |
• | The Company continued to achieve historically strong customer service levels. |
| |
• | Andrew G. Long was named Executive Vice President & Chief Financial Officer effective November 11, 2019. |
| |
• | Michael C. Riordan, former Co-Chief Executive Officer and Director of Prisma Health, was elected to the Company’s Board of Directors in December of 2019. |
| |
• | Gwendolyn M. Bingham, retired U.S. Army Lieutenant General, was elected to the Company’s Board of Directors effective March 5, 2020. |
Financial Outlook
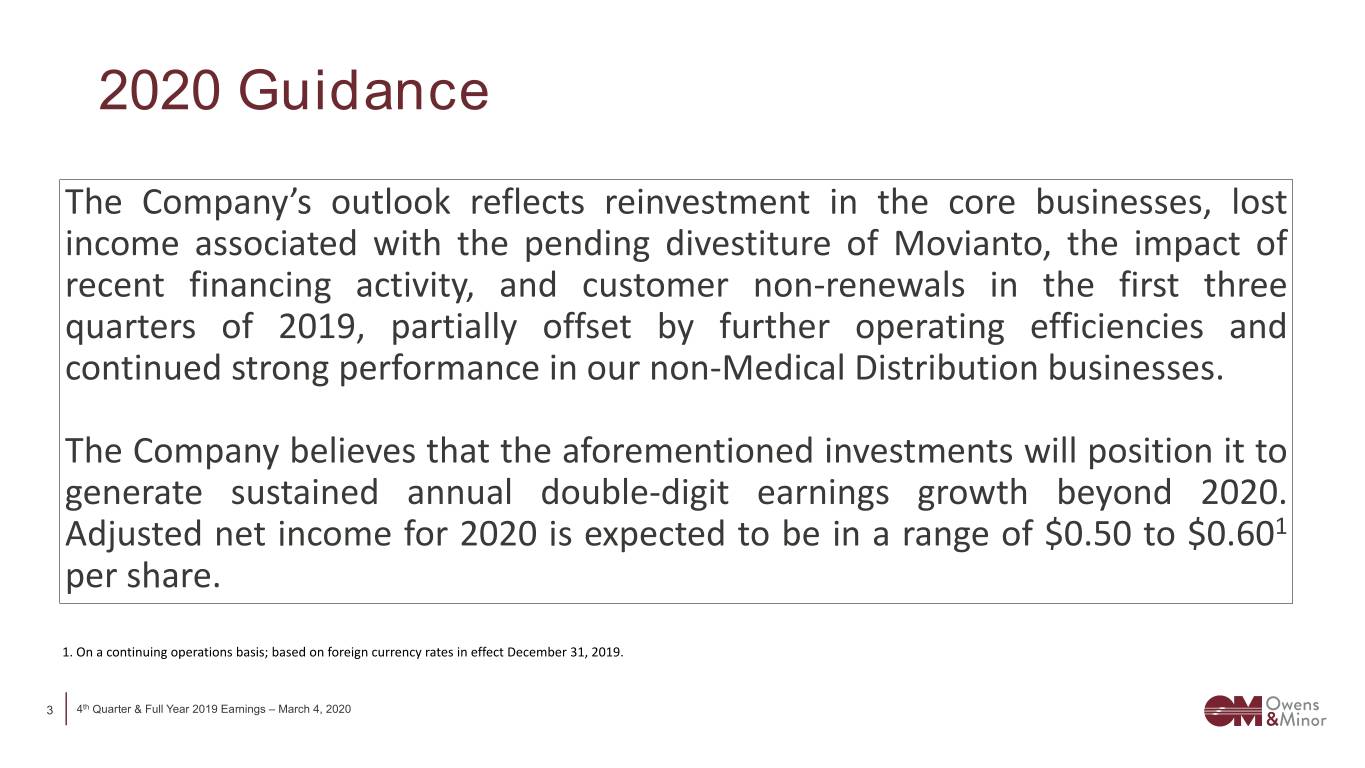
The Company’s outlook reflects reinvestment in the core businesses, lost income associated with the pending divestiture of Movianto, the impact of recent financing activity, and customer non-renewals in the first three quarters of 2019, partially offset by further operating efficiencies and continued strong performance in our non-Medical Distribution businesses. The Company believes that the aforementioned investments will position it to generate sustained annual double-digit earnings growth beyond 2020. Adjusted net income for 2020 is expected to be in a range of $0.50 to $0.601 per share.
| |
1. | On a continuing operations basis; based on foreign currency rates in effect December 31, 2019. |
Supplemental information related to our 2020 outlook can be found in the Investor Relations section of the Company website.
Although the Company does provide guidance for adjusted net income per share (which is a non-GAAP financial measure), it is not able to forecast the most directly comparable measure calculated and presented in accordance with GAAP without unreasonable effort. Certain elements of the composition of the GAAP amount are not predictable, making it impracticable for the Company to forecast. Such elements include, but are not limited to restructuring and acquisition charges. As a result, no GAAP guidance or reconciliation of the Company’s adjusted net income per share guidance is provided. For the same reasons, the Company is unable to assess the probable significance of the unavailable information, which could have a potentially significant impact on its future GAAP financial results. The outlook is based on certain assumptions that are subject to the risk factors discussed in the Company’s filings with the Securities and Exchange Commission (“SEC”).
Dividend Information
The Board of Directors approved a first quarter 2020 dividend payment of $0.0025 per share, payable on March 31, 2020, to shareholders of record as of March 16, 2020.
Investor Conference Call for 4th Quarter and Full Year 2019 Financial Results
Owens & Minor executives will host a conference call at 8:30 a.m. EST to discuss the results. Participants may access the call at 866-393-1604. The international dial-in number is 224-357-2191. A replay of the call will be available for one week by dialing 855-859-2056. The access code for the conference call, international dial-in and replay is 7046788. A webcast of the event will be available at www.owens-minor.com under the Investor Relations section.
Upcoming Investor Events
| |
• | The 2020 Annual Meeting of Shareholders of Owens & Minor, Inc. will be held at the corporate headquarters of the Company, 9120 Lockwood Boulevard, Mechanicsville, Virginia 23116, on Friday, May 1, 2020, at 9:00 a.m. EDT. |
| |
• | The Company will host an Investor Day on May 20, 2020 in New York. Registration details can be found at the following link: https://investors.owens-minor.com/event-registration. The presentation will be webcast live and archived on the Company’s website. |
Safe Harbor
This release is intended to be disclosure through methods reasonably designed to provide broad, non-exclusionary distribution to the public in compliance with the SEC's Fair Disclosure Regulation. This release contains certain ''forward-looking'' statements made pursuant to the Safe Harbor provisions of the Private Securities Litigation Reform Act of 1995. These statements include, but are not limited to, the statements in this release regarding our expectations with respect to our 2020 financial performance, earnings growth beyond 2020, the closing of the sale of the Company’s Movianto business, as well as other statements related to the Company’s expectations regarding the performance of its business and improvement of operational performance. Forward-looking statements involve known and unknown risks and uncertainties that may cause our actual results in future periods to differ materially from those projected or contemplated in the forward-looking statements. Investors should refer to Owens & Minor’s Annual Report on Form 10-K for the year ended December 31, 2018, filed with the SEC including the sections captioned “Cautionary Note Regarding Forward-Looking Statements” and “Item 1A. Risk Factors,” and subsequent annual reports on Form 10-K, quarterly reports on Form 10-Q and current reports on Form 8-K filed with or furnished to the SEC, for a discussion of certain known risk factors that could cause the Company’s actual results to differ materially from its current estimates. These filings are available at www.owens-minor.com. Given these risks and uncertainties, Owens & Minor can give no assurance that any forward-looking statements will, in fact, transpire and, therefore, cautions investors not to place undue reliance on them. Owens & Minor specifically disclaims any obligation to update or revise any forward-looking statements, whether as a result of new information, future developments or otherwise.
Owens & Minor uses its website, www.owens-minor.com, as a channel of distribution for material Company information, including news releases, investor presentations and financial information. This information is routinely posted and accessible under the Investor Relations section.
About Owens & Minor
Owens & Minor, Inc. (NYSE: OMI) is a global healthcare solutions company with integrated technologies, products, and services aligned to deliver significant and sustained value for healthcare providers and manufacturers across the continuum of care. With 17,000 dedicated teammates serving healthcare industry customers in 90 countries, Owens & Minor helps to reduce total costs across the supply chain by optimizing episode and point-of-care performance, freeing up capital and clinical resources, and managing contracts to optimize financial performance. A FORTUNE 500 company, Owens & Minor was founded in 1882 in Richmond, Virginia, where it remains headquartered today. The Company has distribution, production, customer service and sales facilities located across the Asia Pacific region, Europe, Latin America, and North America. For more information about Owens & Minor, visit owens-minor.com, follow @Owens_Minor on Twitter, and connect on LinkedIn at www.linkedin.com/company/owens-&-minor.
Contact
Chuck Graves, Director, Finance & Investor Relations, 804-723-7556, [email protected]
SOURCE: Owens & Minor
Page 4
Owens & Minor, Inc.
Consolidated Statements of Operations (unaudited)
(dollars in thousands, except per share data)
|
| | | | | | | | |
| | Three Months Ended December 31, |
| | 2019 | | 2018 |
Net revenue | | $ | 2,190,642 |
| | $ | 2,434,043 |
|
Cost of goods sold | | 1,905,911 |
| | 2,148,024 |
|
Gross margin | | 284,731 |
| | 286,019 |
|
Distribution, selling and administrative expenses | | 254,165 |
| | 263,455 |
|
Goodwill and intangible asset impairment charges | | — |
| | 248,498 |
|
Acquisition-related and exit and realignment charges | | 15,275 |
| | 13,381 |
|
Other operating expense (income), net | | 753 |
| | (1,304 | ) |
Operating income (loss) | | 14,538 |
| | (238,011 | ) |
Interest expense, net | | 22,557 |
| | 22,861 |
|
Other (income) expense, net | | (257 | ) | | 941 |
|
Loss before income taxes | | (7,762 | ) | | (261,813 | ) |
Income tax benefit | | (2,409 | ) | | (28,279 | ) |
Loss from continuing operations | | (5,353 | ) | | (233,534 | ) |
Loss from discontinued operations, net of tax | | (33,670 | ) | | (28,287 | ) |
Net loss | | $ | (39,023 | ) | | $ | (261,821 | ) |
| | | | |
Net loss from continuing operations per common share: basic and diluted | | $ | (0.09 | ) | | $ | (3.89 | ) |
Net loss from discontinued operations per common share: basic and diluted | | (0.56 | ) | | (0.48 | ) |
Net loss per common share: basic and diluted | | $ | (0.65 | ) | | $ | (4.37 | ) |
|
| | | | | | | | |
| | For the Years Ended December 31, |
| | 2019 | | 2018 |
Net revenue | | $ | 9,210,939 |
| | $ | 9,418,192 |
|
Cost of goods sold | | 8,082,448 |
| | 8,347,666 |
|
Gross margin | | 1,128,491 |
| | 1,070,526 |
|
Distribution, selling and administrative expenses | | 1,023,065 |
| | 952,865 |
|
Goodwill and intangible asset impairment charges | | — |
| | 413,945 |
|
Acquisition-related and exit and realignment charges | | 30,050 |
| | 59,101 |
|
Other operating expense (income), net | | 2,225 |
| | (3,039 | ) |
Operating income (loss) | | 73,151 |
| | (352,346 | ) |
Interest expense, net | | 98,113 |
| | 70,983 |
|
Other expense, net | | 3,757 |
| | 3,765 |
|
Loss from continuing operations before income taxes | | (28,719 | ) | | (427,094 | ) |
Income tax benefit | | (6,135 | ) | | (32,429 | ) |
Loss from continuing operations | | (22,584 | ) | | (394,665 | ) |
Loss from discontinued operations, net of tax | | (39,787 | ) | | (42,347 | ) |
Net loss | | $ | (62,371 | ) | | $ | (437,012 | ) |
| | | | |
Loss from continuing operations per common share: basic and diluted | | $ | (0.37 | ) | | $ | (6.58 | ) |
Loss from discontinued operations per common share: basic and diluted | | (0.66 | ) | | (0.70 | ) |
Net loss per common share: basic and diluted | | $ | (1.03 | ) | | $ | (7.28 | ) |
Page 5
Owens & Minor, Inc.
Condensed Consolidated Balance Sheets (unaudited)
(dollars in thousands)
|
| | | | | | | | |
| | December 31, 2019 | | December 31, 2018 |
| | | | |
Assets | | | | |
Current assets | | | | |
Cash and cash equivalents | | $ | 67,030 |
| | $ | 66,308 |
|
Accounts receivable, net | | 674,706 |
| | 756,687 |
|
Merchandise inventories | | 1,146,192 |
| | 1,273,726 |
|
Other current assets | | 79,372 |
| | 121,926 |
|
Current assets of discontinued operations | | 439,983 |
| | 319,930 |
|
Total current assets | | 2,407,283 |
| | 2,538,577 |
|
Property and equipment, net | | 315,427 |
| | 323,943 |
|
Operating lease assets | | 142,219 |
| | — |
|
Goodwill | | 393,181 |
| | 414,122 |
|
Intangible assets, net | | 285,018 |
| | 314,175 |
|
Other assets, net | | 99,956 |
| | 84,510 |
|
Other assets of discontinued operations | | — |
| | 98,461 |
|
Total assets | | $ | 3,643,084 |
| | $ | 3,773,788 |
|
Liabilities and equity | | | | |
Current liabilities | | | | |
Accounts payable | | $ | 808,035 |
| | $ | 1,065,197 |
|
Accrued payroll and related liabilities | | 53,584 |
| | 38,358 |
|
Other current liabilities | | 231,029 |
| | 178,930 |
|
Current liabilities of discontinued operations | | 323,511 |
| | 189,526 |
|
Total current liabilities | | 1,416,159 |
| | 1,472,011 |
|
Long-term debt, excluding current portion | | 1,508,415 |
| | 1,647,918 |
|
Operating lease liabilities, excluding current portion | | 117,080 |
| | — |
|
Deferred income taxes | | 40,550 |
| | 50,852 |
|
Other liabilities | | 98,726 |
| | 77,690 |
|
Other liabilities of discontinued operations | | — |
| | 6,898 |
|
Total liabilities | | 3,180,930 |
| | 3,255,369 |
|
Total equity | | 462,154 |
| | 518,419 |
|
Total liabilities and equity | | $ | 3,643,084 |
| | $ | 3,773,788 |
|
Page 6
Owens & Minor, Inc.
Consolidated Statements of Cash Flows (unaudited)
(dollars in thousands)
|
| | | | | | | | |
| | For the Years Ended December 31, |
| | 2019 | | 2018 |
| | | | |
Operating activities: | | | | |
Net loss | | $ | (62,371 | ) | | $ | (437,012 | ) |
Adjustments to reconcile net loss to cash provided by operating activities: | | | | |
Depreciation and amortization | | 116,678 |
| | 101,927 |
|
Share-based compensation expense | | 15,803 |
| | 16,376 |
|
Impairment charges | | 32,112 |
| | 439,613 |
|
Deferred income tax benefit | | (17,402 | ) | | (35,018 | ) |
Provision for losses on accounts receivable | | 12,914 |
| | 9,430 |
|
Changes in operating lease right-of-use assets and lease liabilities | | (2,599 | ) | | — |
|
Changes in operating assets and liabilities: | | | | |
Accounts receivable | | 63,526 |
| | 11,106 |
|
Merchandise inventories | | 127,921 |
| | (65,451 | ) |
Accounts payable | | (235,631 | ) | | 92,179 |
|
Net change in other assets and liabilities | | 104,801 |
| | (23,604 | ) |
Other, net | | 10,333 |
| | 6,043 |
|
Cash provided by operating activities | | 166,085 |
| | 115,589 |
|
Investing activities: | | | | |
Acquisitions, net of cash acquired | | — |
| | (751,834 | ) |
Additions to property and equipment | | (42,419 | ) | | (44,873 | ) |
Additions to computer software | | (9,809 | ) | | (20,812 | ) |
Proceeds from sale of property and equipment | | 331 |
| | 1,690 |
|
Cash used for investing activities | | (51,897 | ) | | (815,829 | ) |
Financing activities: | | | | |
Proceeds from issuance of debt | | — |
| | 695,750 |
|
(Repayments) borrowings from revolving credit facility | | (32,200 | ) | | 105,500 |
|
Repayment of debt | | (85,592 | ) | | (16,250 | ) |
Financing costs paid | | (4,313 | ) | | (28,512 | ) |
Cash dividends paid | | (5,226 | ) | | (48,200 | ) |
Other, net | | (2,866 | ) | | (7,217 | ) |
Cash (used for) provided by financing activities | | (130,197 | ) | | 701,071 |
|
Effect of exchange rate changes on cash and cash equivalents | | (2,671 | ) | | (1,986 | ) |
Net decrease in cash, cash equivalents and restricted cash | | (18,680 | ) | | (1,155 | ) |
Cash, cash equivalents and restricted cash at beginning of year | | 103,367 |
| | 104,522 |
|
Cash, cash equivalents and restricted cash at end of year | | $ | 84,687 |
| | $ | 103,367 |
|
Supplemental disclosure of cash flow information: | | | | |
Income taxes (received) paid, net of refunds | | $ | (6,198 | ) | | $ | 19,151 |
|
Interest paid | | $ | 95,413 |
| | $ | 68,585 |
|
Page 7
Owens & Minor, Inc.
Summary Segment Information (unaudited)
(dollars in thousands)
|
| | | | | | | | | | | | | |
| Three Months Ended December 31, |
| 2019 | | 2018 |
| | | % of | | | | % of |
| | | consolidated | | | | consolidated |
| Amount | | net revenue | | Amount | | net revenue |
Net revenue: | | | | | | | |
Segment net revenue | | | | | | | |
Global Solutions | $ | 1,938,420 |
| | 88.48 | % | | $ | 2,204,051 |
| | 90.55 | % |
Global Products | 363,169 |
| | 16.58 | % | | 360,552 |
| | 14.81 | % |
Total segment net revenue | 2,301,589 |
| | | | 2,564,603 |
| | |
Inter-segment net revenue | | | | | | | |
Global Products | (110,947 | ) | | (5.06 | )% | | (130,560 | ) | | (5.36 | )% |
Total inter-segment net revenue | (110,947 | ) | | | | (130,560 | ) | | |
Consolidated net revenue | $ | 2,190,642 |
| | 100.00 | % | | $ | 2,434,043 |
| | 100.00 | % |
| | | | | | | |
| | | % of segment | | | | % of segment |
Operating income (loss): | | | net revenue | | | | net revenue |
Global Solutions | $ | 19,300 |
| | 1.00 | % | | $ | 18,701 |
| | 0.85 | % |
Global Products | 22,484 |
| | 6.19 | % | | 14,337 |
| | 3.98 | % |
Inter-segment eliminations | (730 | ) | | | | 17 |
| | |
Goodwill and intangible asset impairment charges | — |
| | | | (248,498 | ) | | |
Intangible amortization | (10,614 | ) | | | | (10,036 | ) | | |
Acquisition-related and exit and realignment charges | (15,275 | ) | | | | (13,381 | ) | | |
Other (1) | (627 | ) | | | | 849 |
| | |
Consolidated operating income (loss) | $ | 14,538 |
| | 0.66 | % | | $ | (238,011 | ) | | (9.78 | )% |
| | | | | | | |
Depreciation and amortization: | | | | | | | |
Global Solutions | $ | 10,744 |
| | | | $ | 11,628 |
| | |
Global Products | 13,360 |
| | | | 12,085 |
| | |
Discontinued operations | 4,370 |
| | | | 4,618 |
| | |
Consolidated depreciation and amortization | $ | 28,474 |
| | | | $ | 28,331 |
| | |
| | | | | | | |
Capital expenditures: | | | | | | | |
Global Solutions | $ | 3,707 |
| | | | $ | 5,766 |
| | |
Global Products | 8,715 |
| | | | 9,007 |
| | |
Discontinued operations | 1,654 |
| | | | 3,606 |
| | |
Consolidated capital expenditures | $ | 14,076 |
| | | | $ | 18,379 |
| | |
Page 8
Owens & Minor, Inc.
Summary Segment Information (unaudited)
(dollars in thousands)
|
| | | | | | | | | | | | | |
| For the Years Ended December 31, |
| 2019 | | 2018 |
| | | % of | | | | % of |
| | | consolidated | | | | consolidated |
| Amount | | net revenue | | Amount | | net revenue |
Net revenue: | | | | | | | |
Segment net revenue | | | | | | | |
Global Solutions | $ | 8,243,867 |
| | 89.50 | % | | $ | 8,767,549 |
| | 93.09 | % |
Global Products | 1,433,977 |
| | 15.56 | % | | 1,111,322 |
| | 11.80 | % |
Total segment net revenue | 9,677,844 |
| | | | 9,878,871 |
| | |
Inter-segment net revenue | | | | | | | |
Global Products | (466,905 | ) | | (5.06 | )% | | (460,679 | ) | | (4.89 | )% |
Total inter-segment net revenue | (466,905 | ) | | | | (460,679 | ) | | |
Consolidated net revenue | $ | 9,210,939 |
| | 100.00 | % | | $ | 9,418,192 |
| | 100.00 | % |
| | | | | | | |
| | | % of segment | | | | % of segment |
Operating income (loss): | | | net revenue | | | | net revenue |
Global Solutions | $ | 83,592 |
| | 1.01 | % | | $ | 108,761 |
| | 1.24 | % |
Global Products | 65,054 |
| | 4.54 | % | | 75,688 |
| | 6.81 | % |
Inter-segment eliminations | 45 |
| |
| | (3,014 | ) | |
|
|
Goodwill and intangible asset impairment charges | — |
| | | | (413,945 | ) | | |
Intangible amortization | (44,009 | ) | | | | (35,132 | ) | | |
Acquisition-related and exit and realignment charges | (30,050 | ) | | | | (59,101 | ) | | |
Other (1) | (1,481 | ) | | | | (25,603 | ) | | |
Consolidated operating income (loss) | $ | 73,151 |
| | 0.79 | % | | $ | (352,346 | ) | | (3.74 | )% |
| | |
| | | |
|
Depreciation and amortization: | | | | | | | |
Global Solutions | $ | 42,444 |
| | | | $ | 45,182 |
| | |
Global Products | 54,302 |
| | | | 38,217 |
| | |
Discontinued operations | 19,932 |
| | | | 18,528 |
| | |
Consolidated depreciation and amortization | $ | 116,678 |
| | | | $ | 101,927 |
| | |
| | | | | | | |
Capital expenditures: | | | | | | | |
Global Solutions | $ | 10,987 |
| | | | $ | 38,169 |
| | |
Global Products | 22,289 |
| | | | 16,161 |
| | |
Discontinued operations | 18,952 |
| | | | 11,355 |
| | |
Consolidated capital expenditures | $ | 52,228 |
| | | | $ | 65,685 |
| | |
(1) 2019 and 2018 included interest cost and net actuarial losses related to the U.S. Retirement Plan as well as software as a service (SaaS) implementation costs associated with the upgrading of our global IT platforms in connection with the redesign of our global information system strategy. 2018 also includes the incremental charge to cost of goods sold from purchase accounting impacts related to the sale of acquired inventory that was written up to fair value.
Page 9
Owens & Minor, Inc.
Net Income (Loss) Per Common Share (unaudited)
(dollars in thousands, except per share data)
|
| | | | | | | | | | | | | | | |
| Three Months Ended December 31, | | For the Years Ended December 31, |
| 2019 | | 2018 | | 2019 | | 2018 |
Numerator: | | | | | | | |
Weighted average shares outstanding - basic and diluted | 60,088 |
| | 59,974 |
| | 60,574 |
| | 60,014 |
|
| | | | | | | |
Loss from continuing operations | $ | (5,353 | ) | | $ | (233,534 | ) | | $ | (22,584 | ) | | $ | (394,665 | ) |
Basic and diluted per share | $ | (0.09 | ) | | $ | (3.89 | ) | | $ | (0.37 | ) | | $ | (6.58 | ) |
| | | | | | | |
Loss from discontinued operations | $ | (33,670 | ) | | $ | (28,287 | ) | | $ | (39,787 | ) | | $ | (42,347 | ) |
Basic and diluted per share | $ | (0.56 | ) | | $ | (0.48 | ) | | $ | (0.66 | ) | | $ | (0.70 | ) |
| | | | | | | |
Net loss | $ | (39,023 | ) | | $ | (261,821 | ) | | $ | (62,371 | ) | | $ | (437,012 | ) |
Basic and diluted per share | $ | (0.65 | ) | | $ | (4.37 | ) | | $ | (1.03 | ) | | $ | (7.28 | ) |
Page 10
Owens & Minor, Inc.
GAAP/Non-GAAP Reconciliations (unaudited)
The following table provides a reconciliation of reported operating income (loss) and net income (loss) to non-GAAP measures used by management.
|
| | | | | | | | | | | | | | | | |
(dollars in thousands, except per share data) | Three Months Ended December 31, | | For the Years Ended December 31, |
| | 2019 | | 2018 | | 2019 | | 2018 |
Operating income (loss), as reported (GAAP) | | $ | 14,538 |
| | $ | (238,011 | ) | | $ | 73,151 |
| | $ | (352,346 | ) |
Intangible amortization (1) | | 10,614 |
| | 10,036 |
| | 44,009 |
| | 35,132 |
|
Goodwill and intangible asset impairment charges (2) | | — |
| | 248,498 |
| | — |
| | 413,945 |
|
Acquisition-related charges (3) | | 4,279 |
| | 4,274 |
| | 15,653 |
| | 45,036 |
|
Exit and realignment charges (4)
| | 10,996 |
| | 9,107 |
| | 14,397 |
| | 14,065 |
|
Fair value adjustments related to purchase accounting (5) | | — |
| | — |
| | — |
| | 27,088 |
|
Software as a Service implementation costs (6)
| | 1,359 |
| | 92 |
| | 4,408 |
| | 2,287 |
|
Other (7) | | (731 | ) | | (941 | ) | | (2,923 | ) | | (3,765 | ) |
Discontinued operations (8) | | 2,489 |
| | 658 |
| | 4,348 |
| | (4,669 | ) |
Operating income, adjusted (non-GAAP) (Adjusted Operated Income) | | $ | 43,544 |
| | $ | 33,713 |
| | $ | 153,043 |
| | $ | 176,773 |
|
| | | | | | | | |
Net loss as reported (GAAP) | | $ | (39,023 | ) | | $ | (261,821 | ) | | $ | (62,371 | ) | | $ | (437,012 | ) |
Intangible amortization (1) | | 10,614 |
| | 10,036 |
| | 44,009 |
| | 35,132 |
|
Income tax benefit (11) | | (2,782 | ) | | (672 | ) | | (10,556 | ) | | (7,677 | ) |
Goodwill and intangible asset impairment charges (2) | | — |
| | 248,498 |
| | — |
| | 413,945 |
|
Income tax benefit (11) | | — |
| | (30,669 | ) | | — |
| | (32,729 | ) |
Acquisition-related charges (3) | | 4,279 |
| | 4,274 |
| | 15,653 |
| | 45,036 |
|
Income tax benefit (11) | | (1,122 | ) | | (277 | ) | | (3,754 | ) | | (9,516 | ) |
Exit and realignment charges (4)
| | 10,996 |
| | 9,107 |
| | 14,397 |
| | 14,065 |
|
Income tax benefit (11) | | (2,882 | ) | | (682 | ) | | (3,453 | ) | | (3,563 | ) |
Fair value adjustments related to purchase accounting (5) | | — |
| | — |
| | — |
| | 27,088 |
|
Income tax benefit (11) | | — |
| | — |
| | — |
| | (5,696 | ) |
Software as a Service implementation costs (6)
| | 1,359 |
| | 92 |
| | 4,408 |
| | 2,287 |
|
Income tax benefit (11) | | (356 | ) | | (6 | ) | | (1,057 | ) | | (743 | ) |
(Gain) loss on extinguishment and modification of debt (9) | | (988 | ) | | — |
| | 830 |
| | — |
|
Income tax expense (11) | | 259 |
| | — |
| | (199 | ) | | — |
|
Tax adjustments (10) | | — |
| | — |
| | — |
| | (1,596 | ) |
Discontinued operations non-GAAP adjustments (8) | | 34,360 |
| | 27,403 |
| | 36,094 |
| | 31,394 |
|
Net income, adjusted (non-GAAP) (Adjusted Net Income) | | $ | 14,714 |
| | $ | 5,283 |
| | $ | 34,001 |
| | $ | 70,415 |
|
Page 11
Owens & Minor, Inc.
GAAP/Non-GAAP Reconciliations (unaudited)
The following table provides a reconciliation of diluted net income (loss) per common share to non-GAAP measures used by management.
|
| | | | | | | | | | | | | | | | |
(dollars in thousands, except per share data) | Three Months Ended December 31, | | For the Years Ended December 31, |
| | 2019 | | 2018 | | 2019 | | 2018 |
Net loss from continuing operations per diluted common share, as reported (GAAP) | | $ | (0.65 | ) | | $ | (4.37 | ) | | $ | (1.03 | ) | | $ | (7.28 | ) |
Intangible amortization (1) | | 0.13 |
| | 0.15 |
| | 0.55 |
| | 0.45 |
|
Goodwill and intangible asset impairment charges (2) | | — |
| | 3.65 |
| | — |
| | 6.38 |
|
Acquisition-related charges (3) | | 0.04 |
| | 0.06 |
| | 0.19 |
| | 0.58 |
|
Exit and realignment charges (4)
| | 0.14 |
| | 0.14 |
| | 0.18 |
| | 0.17 |
|
Fair value adjustments related to purchase accounting (5) | | — |
| | — |
| | — |
| | 0.33 |
|
Software as a Service implementation costs (6)
| | 0.02 |
| | — |
| | 0.06 |
| | 0.02 |
|
(Gain) loss on extinguishment and modification of debt (9) | | (0.01 | ) | | — |
| | 0.01 |
| | — |
|
Tax adjustments (10) | | — |
| | — |
| | — |
| | (0.02 | ) |
Discontinued operations (8) | | 0.57 |
| | 0.46 |
| | 0.60 |
| | 0.52 |
|
Net income per diluted common share, adjusted (non-GAAP) (Adjusted EPS) | | $ | 0.24 |
| | $ | 0.09 |
| | $ | 0.56 |
| | $ | 1.15 |
|
Impact of currency at 2018 foreign currency exchange rates | | 0.02 |
| | — |
| | 0.04 |
| | — |
|
Net income per diluted common share, on a constant currency basis(12) |
| $ | 0.26 |
| | $ | 0.09 |
| | $ | 0.60 |
| | $ | 1.15 |
|
The following items have been excluded in our non-GAAP financial measures:
(1) Intangible amortization in 2019 and 2018 includes amortization of intangible assets established during purchase accounting for business combinations. These amounts are highly dependent on the size and frequency of acquisitions and are being excluded to allow for a more consistent comparison with forecasted, current and historical results and the results of our peers.
(2) Impairment charges in 2018 resulted from our goodwill and intangible asset impairment testing performed as a result of a decline in market capitalization of the company and lower than projected financial results of certain reporting units due to customer losses and operational inefficiencies.
(3) Acquisition-related charges in 2019 and 2018 consisted primarily of transition and transaction costs for the Halyard acquisition.
(4) Exit and realignment charges in 2019 were associated with severance from reduction in force and other costs related to the reorganization of the U.S. commercial and operations and executive teams, along with facility closures in the U.S. and other IT restructuring charges. Amounts in 2018 were associated with severance from reduction in force and other employee costs associated with the establishment of our client engagement centers, the writedown of information system assets which are no longer used and other IT restructuring charges.
(5) Fair value adjustments related to purchase accounting in 2018 includes an incremental charge to cost of goods sold from purchase accounting impacts related to the sale of acquired inventory that was written up to fair value in connection with the Halyard acquisition.
(6) Software as a Service (SaaS) implementation costs in 2019 and 2018 were associated with significant global IT platforms in connection with the redesign of our global information system strategy.
(7) Other in 2019 and 2018 includes interest costs and net actuarial losses related to the U.S. Retirement Plan.
(8) Discontinued operations included in the reconciliation to Adjusted Operating Income includes operating income (loss) adjusted for non-GAAP items from our Movianto business. Discontinued operations non-GAAP adjustments included in the reconciliation to Adjusted Net Income and Adjusted EPS includes non-GAAP adjustments of $32.1 million in impairment charges and $2.3 million in the fourth quarter of 2019 and $4.0 million for the full year 2019 in other costs, primarily related to intangible amortization, from our Movianto business.
Page 12
Owens & Minor, Inc.
GAAP/Non-GAAP Reconciliations (unaudited)
(9) (Gain) loss on extinguishment and modification of debt consists of write-off of deferred financing costs associated with the revolving credit facility as a result of the Fourth Amendment to the Credit Agreement in February 2019 of $2.0 million and gain on extinguishment of debt related to the partial repurchase of our 2021 Notes in the fourth quarter of 2019 of $1.0 million and for the full year 2019 of $1.2 million, which are included in Other expense, net within the accompanying consolidated statements of operations.
(10) Tax adjustments are primarily associated with the benefits under the Tax Cuts and Jobs Act.
(11) These charges have been tax effected in the preceding table by determining the income tax rate depending on the amount of charges incurred in different tax jurisdictions and the deductibility of those charges for income tax purposes.
(12) Excludes the impact of translational currency, which assumes 2019 results at 2018 rates.
Use of Non-GAAP Measures
This earnings release contains financial measures that are not calculated in accordance with U.S. generally accepted accounting principles ("GAAP"). In general, the measures exclude items and charges that (i) management does not believe reflect Owens & Minor, Inc.'s (the "Company") core business and relate more to strategic, multi-year corporate activities; or (ii) relate to activities or actions that may have occurred over multiple or in prior periods without predictable trends. Management uses these non-GAAP financial measures internally to evaluate the Company's performance, evaluate the balance sheet, engage in financial and operational planning and determine incentive compensation.
Management provides these non-GAAP financial measures to investors as supplemental metrics to assist readers in assessing the effects of items and events on its financial and operating results and in comparing the Company's performance to that of its competitors. However, the non-GAAP financial measures used by the Company may be calculated differently from, and therefore may not be comparable to, similarly titled measures used by other companies.
The non-GAAP financial measures disclosed by the Company should not be considered a substitute for, or superior to, financial measures calculated in accordance with GAAP, and the financial results calculated in accordance with GAAP and reconciliations to those financial statements set forth above should be carefully evaluated.