nymt-20230222
0001273685false00012736852023-02-222023-02-220001273685nymt:CommonStockParValue001PerShareMember2023-02-222023-02-220001273685nymt:A8000SeriesDFixedToFloatingRateCumulativeRedeemablePreferredStockParValue001PerShare2500LiquidationPreferenceMember2023-02-222023-02-220001273685nymt:A7875SeriesEFixedToFloatingRateCumulativeRedeemablePreferredStockParValue001PerShare2500LiquidationPreferenceMember2023-02-222023-02-220001273685nymt:A6875SeriesFFixedToFloatingRateCumulativeRedeemablePreferredStockParValue001PerShare2500LiquidationPreferenceMember2023-02-222023-02-220001273685nymt:A7000SeriesGCumulativeRedeemablePreferredStockParValue001PerShare2500LiquidationPreferenceMember2023-02-222023-02-22

UNITED STATES
SECURITIES AND EXCHANGE COMMISSION
Washington, D.C. 20549

FORM 8-K

CURRENT REPORT
Pursuant to Section 13 or 15(d)
of the Securities Exchange Act of 1934

Date of Report (Date of earliest event reported): February 22, 2023

NEW YORK MORTGAGE TRUST, INC.
(Exact name of registrant as specified in its charter)
Maryland001-3221647-0934168
(State or other jurisdiction of incorporation)(Commission File Number)(IRS Employer Identification No.)

90 Park Avenue
New York, New York 10016
(Address and zip code of
principal executive offices)

Registrant’s telephone number, including area code: (212) 792-0107

Check the appropriate box below if the Form 8-K filing is intended to simultaneously satisfy the filing obligation of the registrant under any of the following provisions:

    Written communications pursuant to Rule 425 under the Securities Act (17 CFR 230.425)
    Soliciting material pursuant to Rule 14a-12 under the Exchange Act (17 CFR 240.14a-12)
    Pre-commencement communications pursuant to Rule 14d-2(b) under the Exchange Act (17 CFR 240.14d-2(b))
    Pre-commencement communications pursuant to Rule 13e-4(c) under the Exchange Act (17 CFR 240.13e-4(c))


Securities registered pursuant to Section 12(b) of the Act:
Title of Each ClassTrading Symbol(s)Name of Each Exchange on Which Registered
Common Stock, par value $0.01 per share NYMTNASDAQStock Market
8.000% Series D Fixed-to-Floating Rate Cumulative Redeemable Preferred Stock, par value $0.01 per share, $25.00 Liquidation PreferenceNYMTNNASDAQ Stock Market
7.875% Series E Fixed-to-Floating Rate Cumulative Redeemable Preferred Stock, par value $0.01 per share, $25.00 Liquidation PreferenceNYMTMNASDAQ Stock Market
6.875% Series F Fixed-to-Floating Rate Cumulative Redeemable Preferred Stock, par value $0.01 per share, $25.00 Liquidation PreferenceNYMTLNASDAQStock Market
7.000% Series G Cumulative Redeemable Preferred Stock, par value $0.01 per share, $25.00 Liquidation PreferenceNYMTZNASDAQStock Market

Indicate by check mark whether the registrant is an emerging growth company as defined in Rule 405 under the Securities Act (§230.405 of this chapter) or Rule 12b-2 under the Exchange Act (§240.12b-2 of this chapter).

Emerging Growth Company

If an emerging growth company, indicate by check mark if the registrant has elected not to use the extended transition period for complying with any new or revised financial accounting standards provided pursuant to Section 13(a) of the Exchange Act. ☐


Item 2.02.    Results of Operations and Financial Condition.

On February 22, 2023, New York Mortgage Trust, Inc. (the “Company”) issued a press release announcing its financial results for the three and twelve months ended December 31, 2022. A copy of the press release is furnished herewith as Exhibit 99.1 to this Current Report on Form 8-K and is incorporated herein by reference.

In addition, in conjunction with the press release announcing its financial results, the Company posted supplemental financial information on the “Events & Presentations” section of its website (www.nymtrust.com). Such supplemental financial information is furnished herewith as Exhibit 99.2 to this Current Report on Form 8-K and is incorporated herein by reference.

The information included in this Current Report on Form 8-K (including Exhibit 99.1 and Exhibit 99.2 attached hereto), shall not be deemed “filed” for the purposes of Section 18 of the Securities Exchange Act of 1934, as amended (the “Exchange Act”), or otherwise subject to the liabilities of that section, nor shall it be deemed incorporated by reference into any filing made by the Company under the Exchange Act or Securities Act of 1933, as amended, except as shall be expressly set forth by specific reference in such a filing.

Item 7.01.    Regulation FD Disclosure.

The disclosure contained in Item 2.02 is incorporated herein by reference.

Item 9.01.    Financial Statements and Exhibits.

(d) Exhibits. The following exhibits are being furnished herewith this Current Report on Form 8-K.

Exhibit No.Description
99.1
Press release dated as of February 22, 2023.
99.2
Fourth Quarter 2022 Supplemental Financial Information.
104Cover Page Interactive Data File-the cover page XBRL tags are embedded within the Inline XBRL document.
† Furnished herewith.


SIGNATURE

Pursuant to the requirements of the Securities Exchange Act of 1934, as amended, the registrant has duly caused this report to be signed on its behalf by the undersigned thereunto duly authorized.

NEW YORK MORTGAGE TRUST, INC.
(Registrant)
Date: February 22, 2023By:/s/ Kristine R. Nario-Eng
Kristine R. Nario-Eng
Chief Financial Officer


logoa25.jpg
New York Mortgage Trust Reports
Fourth Quarter and Full Year 2022 Results and Reverse Stock Split

NEW YORK, NY - February 22, 2023 (GLOBE NEWSWIRE) - New York Mortgage Trust, Inc. (Nasdaq: NYMT) (“NYMT,” the “Company,” “we,” “our” or “us”) today reported results for the three and twelve months ended December 31, 2022.

Summary of Fourth Quarter and Full Year 2022:
(dollar amounts in thousands, except per share data)
For the Three Months Ended December 31, 2022For the Twelve Months Ended December 31, 2022
Net loss attributable to Company's common stockholders$(48,076)$(340,577)
Net loss attributable to Company's common stockholders per share (basic)$(0.13)$(0.90)
Undepreciated loss (1)
$(46,116)$(261,578)
Undepreciated loss per common share (1)
$(0.12)$(0.69)
Comprehensive loss attributable to Company's common stockholders$(47,993)$(344,325)
Comprehensive loss attributable to Company's common stockholders per share (basic)$(0.13)$(0.91)
Yield on average interest earning assets (1) (2)
6.49 %6.66 %
Interest income$62,948 $258,388 
Interest expense$40,651 $129,419 
Net interest income$22,297 $128,969 
Net interest spread (1) (3)
1.11 %2.47 %
Book value per common share at the end of the period$3.32 $3.32 
Adjusted book value per common share at the end of the period (1)
$3.97 $3.97 
Economic return on book value (4)
(6.30)%(20.85)%
Economic return on adjusted book value (5)
(2.40)%(7.42)%
Dividends per common share$0.10 $0.40 

(1)Represents a non-GAAP financial measure. A reconciliation of the Company's non-GAAP financial measures to their most directly comparable GAAP measure is included below in "Reconciliation of Financial Information."
(2)Calculated as the quotient of our adjusted interest income and our average interest earning assets and excludes all Consolidated SLST assets other than those securities owned by the Company.
(3)Our calculation of net interest spread may not be comparable to similarly-titled measures of other companies who may use a different calculation.
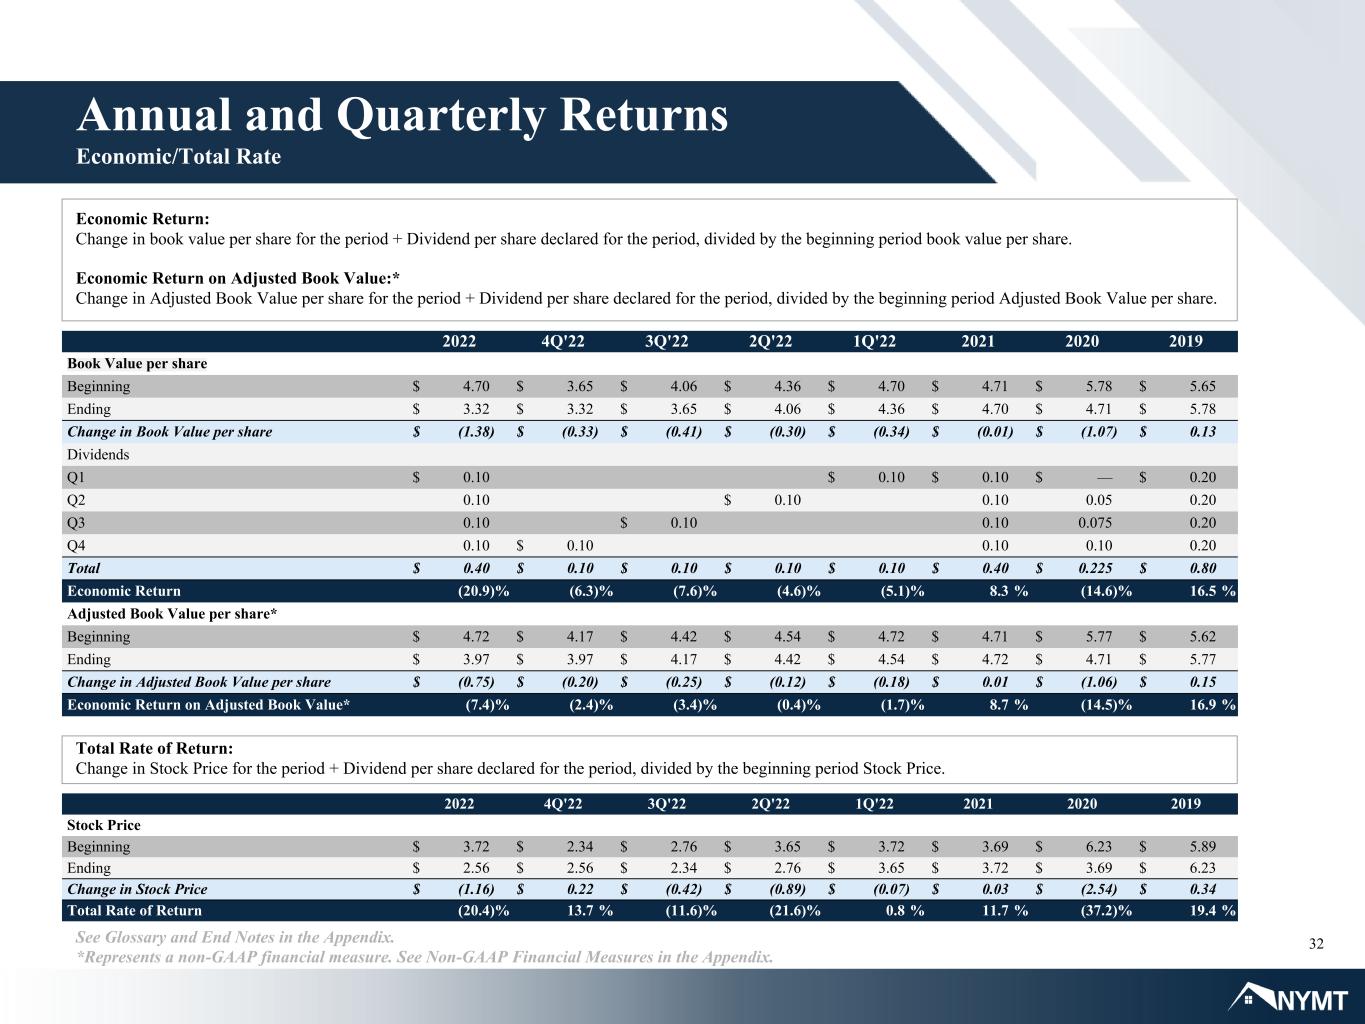
(4)Economic return on book value is based on the periodic change in GAAP book value per common share plus dividends declared per common share, if any, during the period.
(5)Economic return on adjusted book value is based on the periodic change in adjusted book value per common share, a non-GAAP financial measure, plus dividends declared per common share, if any, during the period.


Key Developments:

Fourth Quarter Investing Activities

Funded approximately $106.0 million of portfolio investments.

Repurchased $50.0 million par value of our residential loan securitization CDOs for approximately $46.5 million.

Received approximately $36.2 million in proceeds from redemptions of Mezzanine Lending investments.

Fourth Quarter Financing Activities

Completed a securitization of residential loans, resulting in approximately $232.0 million in net proceeds to the Company after deducting expenses associated with the transaction. The Company utilized the net proceeds to repay outstanding repurchase agreement financing related to residential loans.

Repurchased 8.4 million shares of common stock pursuant to a stock repurchase program for approximately $22.5 million at an average repurchase price of $2.69 per share.

Full Year 2022 Investing Activities

Purchased approximately $1.7 billion in residential loans and $112.9 million in single-family rental properties.

Sold investment securities for approximately $85.4 million and recognized a realized gain of approximately $18.3 million.

Funded approximately $199.9 million of multi-family joint venture equity investments and approximately $28.1 million of Mezzanine Lending investments. Received approximately $99.1 million in proceeds from redemptions of Mezzanine Lending investments.

Announced a repositioning of our business through the opportunistic disposition over time of our joint venture equity investments in multi-family properties.

A joint venture in which we held a common equity investment sold its multi-family apartment community for approximately $48.0 million. The sale generated a net gain attributable to the Company's common stockholders of approximately $14.4 million.

Full Year 2022 Financing Activities

Redeemed our Convertible Notes at maturity for $138.0 million.

Completed four securitizations of business purpose, performing and re-performing residential loans, resulting in approximately $970.0 million in net proceeds to the Company after deducting expenses associated with the transactions. The Company utilized the net proceeds to repay approximately $793.6 million on outstanding repurchase agreement financing related to residential loans.

Obtained approximately $1.6 billion of financing for residential loans through recourse and non-recourse repurchase agreements with new and existing counterparties.

Repurchased 16.6 million shares of common stock pursuant to a stock repurchase program for approximately $44.4 million at an average repurchase price of $2.67 per share.


Subsequent Developments:

On February 22, 2023, the Company announced that its Board of Directors approved a one-for-four reverse stock split of the Company's common stock.

On February 20, 2023, the Company's Board of Directors authorized an extension of our share repurchase program through March 31, 2024.

Repurchased $60.3 million par value of our residential loan securitization CDOs for approximately $58.7 million in February 2023.


Management Overview

Jason Serrano, Chief Executive Officer, commented: “Against retreating asset prices and increasing financing costs in the fourth quarter of 2022, the market presented a limited set of attractive investment opportunities. In light of the worsening economic backdrop and ongoing debate of either a ‘soft’ or ‘hard’ landing, we continued to solidify our funding sources and preserve dry powder. We anticipate a considerable pullback in consumer spending to lead the economic downturn. Therefore, we reduced risk and focused efforts on optimizing our capitalization and financing through stock and debt repurchases while strengthening our asset management platform.

As a result of actions taken to shorten the duration of our portfolio after the market disruptions in the first quarter of 2020 related to the pandemic, and more recently, decisions to limit investment activity, we believe we have cleared a path for aggressive portfolio growth in the near future. With catalysts to trigger a downturn now in view, we firmly see our differentiated, patient approach as a winning one, where our stockholders will benefit from a steadfast path to seeking value in a disrupted environment.”


Capital Allocation

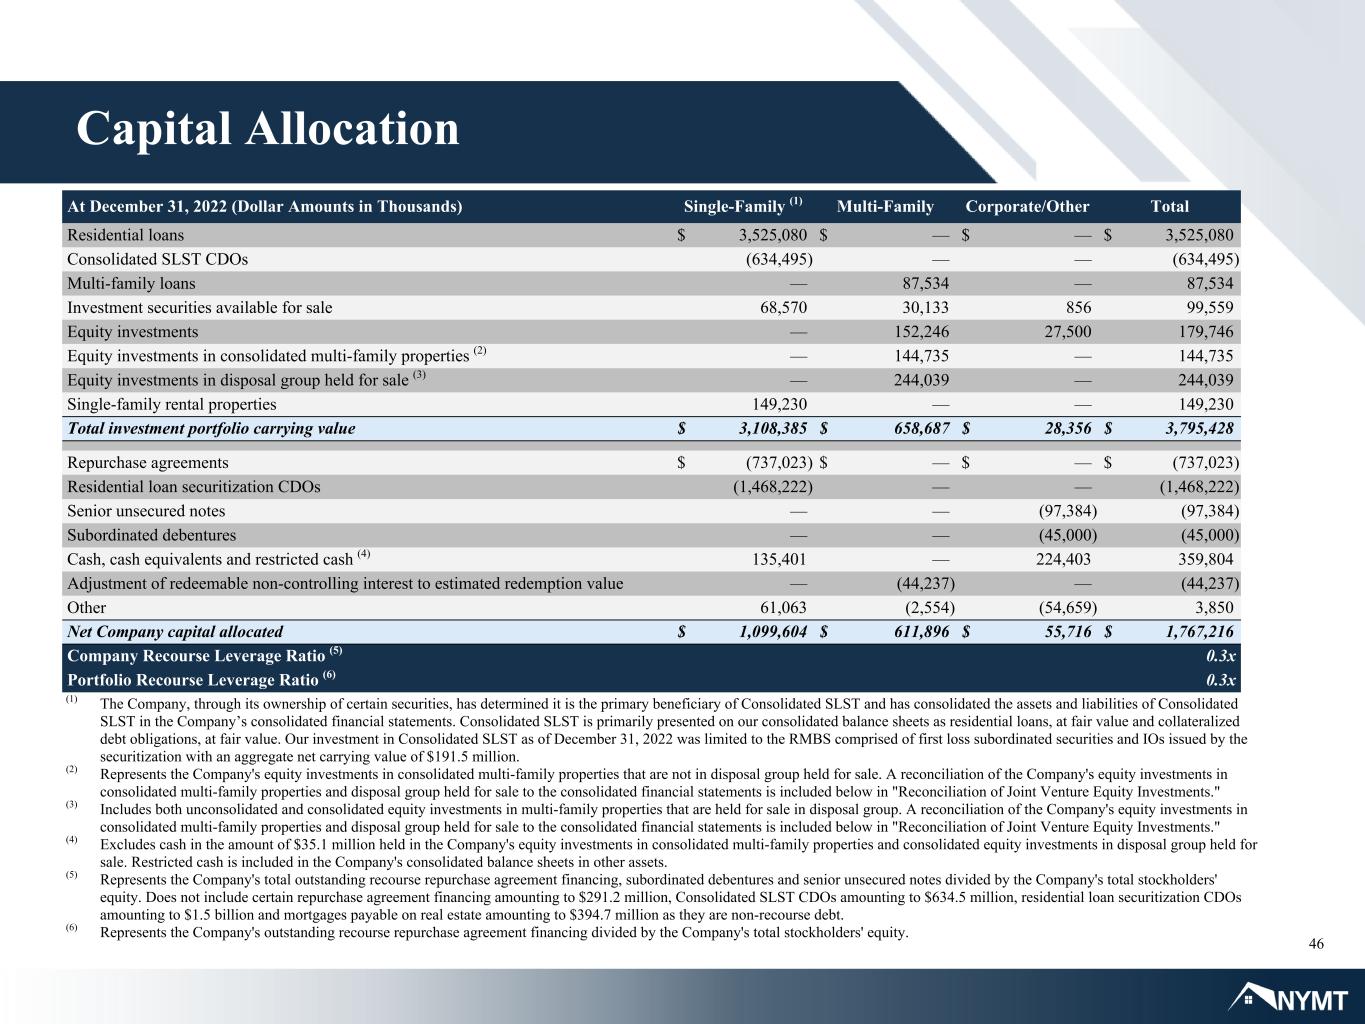
The following table sets forth, by investment category, our allocated capital at December 31, 2022 (dollar amounts in thousands):
 
Single-Family (1)
Multi-
Family
Corporate/OtherTotal
Residential loans$3,525,080 $— $— $3,525,080 
Consolidated SLST CDOs(634,495)— — (634,495)
Multi-family loans— 87,534 — 87,534 
Investment securities available for sale68,570 30,133 856 99,559 
Equity investments— 152,246 27,500 179,746 
Equity investments in consolidated multi-family properties (2)
— 144,735 — 144,735 
Equity investments in disposal group held for sale (3)
— 244,039 — 244,039 
Single-family rental properties149,230 — — 149,230 
Total investment portfolio carrying value3,108,385 658,687 28,356 3,795,428 
Liabilities:
Repurchase agreements
(737,023)— — (737,023)
Residential loan securitization CDOs(1,468,222)— — (1,468,222)
Senior unsecured notes— — (97,384)(97,384)
Subordinated debentures— — (45,000)(45,000)
Cash, cash equivalents and restricted cash (4)
135,401 — 224,403 359,804 
Adjustment of redeemable non-controlling interest to estimated redemption value— (44,237)— (44,237)
Other61,063 (2,554)(54,659)3,850 
Net Company capital allocated$1,099,604 $611,896 $55,716 $1,767,216 
Company Recourse Leverage Ratio (5)
0.3 x
Portfolio Recourse Leverage Ratio (6)
0.3 x

(1)The Company, through its ownership of certain securities, has determined it is the primary beneficiary of Consolidated SLST and has consolidated the assets and liabilities of Consolidated SLST in the Company’s consolidated financial statements. Consolidated SLST is primarily presented on our consolidated balance sheets as residential loans, at fair value and collateralized debt obligations, at fair value. Our investment in Consolidated SLST as of December 31, 2022 was limited to the RMBS comprised of first loss subordinated securities and IOs issued by the securitization with an aggregate net carrying value of $191.5 million.
(2)Represents the Company's equity investments in consolidated multi-family properties that are not in disposal group held for sale. See "Reconciliation of Financial Information" section below for a reconciliation of equity investments in consolidated multi-family properties and disposal group held for sale to the Company's consolidated financial statements.
(3)Includes both unconsolidated and consolidated equity investments in multi-family properties that are held for sale in disposal group. See "Reconciliation of Financial Information" section below for a reconciliation of equity investments in consolidated multi-family properties and disposal group held for sale to the Company's consolidated financial statements.
(4)Excludes cash in the amount of $35.1 million held in the Company's equity investments in consolidated multi-family properties and consolidated equity investments in disposal group held for sale. Restricted cash is included in the Company's accompanying consolidated balance sheets in other assets.
(5)Represents the Company's total outstanding recourse repurchase agreement financing, subordinated debentures and senior unsecured notes divided by the Company’s total stockholders’ equity. Does not include certain repurchase agreement financing amounting to $291.2 million, Consolidated SLST CDOs amounting to $634.5 million, residential loan securitization CDOs amounting to $1.5 billion and mortgages payable on real estate amounting to $394.7 million as they are non-recourse debt.
(6)Represents the Company's outstanding recourse repurchase agreement financing divided by the Company’s total stockholders’ equity.


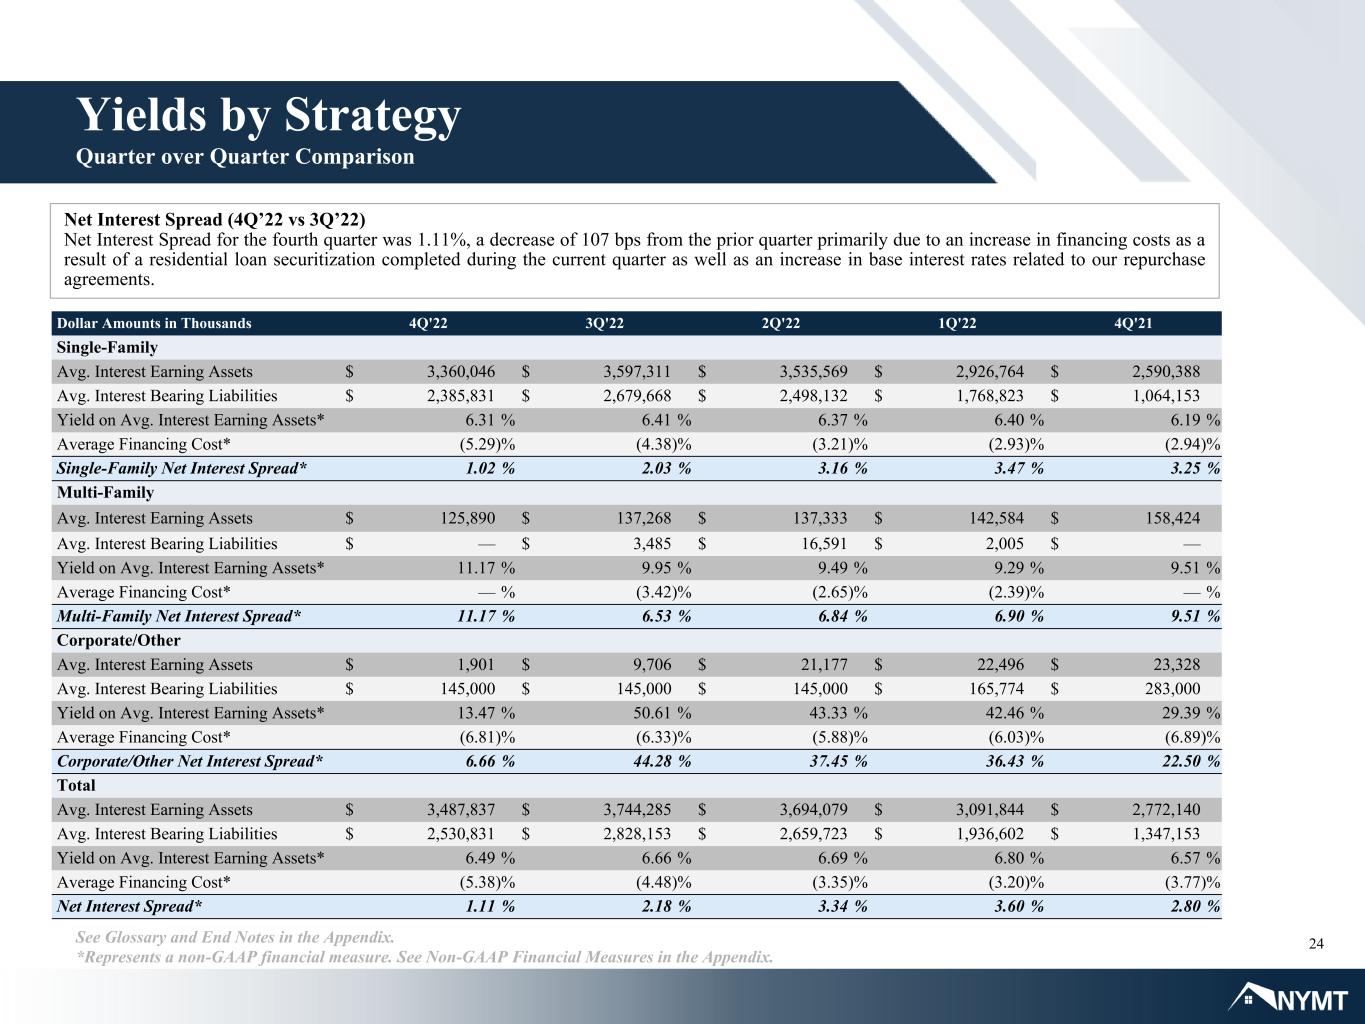
The following table sets forth certain information about our interest earning assets by category and their related adjusted interest income, adjusted interest expense, adjusted net interest income, yield on average interest earning assets, average financing cost and net interest spread for the three months ended December 31, 2022 (dollar amounts in thousands):

Three Months Ended December 31, 2022
 
Single-Family (8)
Multi-
Family
Corporate/OtherTotal
Adjusted Interest Income (1) (2)
$53,022 $3,514 $64 $56,600 
Adjusted Interest Expense (1)
(31,815)— (2,488)(34,303)
Adjusted Net Interest Income (1)
$21,207 $3,514 $(2,424)$22,297 
Average Interest Earning Assets (3)
$3,360,046 $125,890 $1,901 $3,487,837 
Average Interest Bearing Liabilities (4)
$2,385,831 $— $145,000 $2,530,831 
Yield on Average Interest Earning Assets (1) (5)
6.31 %11.17 %13.47 %6.49 %
Average Financing Cost (1) (6)
(5.29)%— (6.81)%(5.38)%
Net Interest Spread (1) (7)
1.02 %11.17 %6.66 %1.11 %
(1)Represents a non-GAAP financial measure. A reconciliation of the Company's non-GAAP financial measures to their most directly comparable GAAP measure is included below in "Reconciliation of Financial Information."
(2)Includes interest income earned on cash accounts held by the Company.
(3)Average Interest Earning Assets for the period include residential loans, multi-family loans and investment securities and exclude all Consolidated SLST assets other than those securities owned by the Company. Average Interest Earning Assets is calculated based on the daily average amortized cost for the period.
(4)Average Interest Bearing Liabilities for the period include repurchase agreements, residential loan securitization CDOs, senior unsecured notes and subordinated debentures and exclude Consolidated SLST CDOs and mortgages payable on real estate as the Company does not directly incur interest expense on these liabilities that are consolidated for GAAP purposes. Average Interest Bearing Liabilities is calculated based on the daily average outstanding balance for the period.
(5)Yield on Average Interest Earning Assets is calculated by dividing our annualized adjusted interest income relating to our portfolio of interest earning assets by our Average Interest Earning Assets for the respective periods.
(6)Average Financing Cost is calculated by dividing our annualized adjusted interest expense by our Average Interest Bearing Liabilities.
(7)Net Interest Spread is the difference between our Yield on Average Interest Earning Assets and our Average Financing Cost.
(8)The Company has determined it is the primary beneficiary of Consolidated SLST and has consolidated Consolidated SLST into the Company's consolidated financial statements. Our GAAP interest income includes interest income recognized on the underlying seasoned re-performing and non-performing residential loans held in Consolidated SLST. Our GAAP interest expense includes interest expense recognized on the Consolidated SLST CDOs that permanently finance the residential loans in Consolidated SLST and are not owned by the Company. We calculate adjusted interest income by reducing our GAAP interest income by the interest expense recognized on the Consolidated SLST CDOs and adjusted interest expense by excluding the interest expense recognized on the Consolidated SLST CDOs, thus only including the interest income earned by the SLST securities that are actually owned by the Company in adjusted net interest income.


Reverse Stock Split

On February 22, 2023, the Company announced that its Board of Directors approved a one-for-four reverse stock split of its issued, outstanding and authorized shares of common stock (the “Reverse Stock Split”). The Reverse Stock Split is expected to take effect as of 12:01 a.m., New York City time, on March 9, 2023 (the “Effective Time”). Accordingly, at the Effective Time, every four issued and outstanding shares of the Company’s common stock will be converted into one share of the Company’s common stock, with a proportionate reduction in the Company’s authorized shares of common stock, outstanding equity awards and number of shares remaining available for issuance under the Company’s 2017 Equity Incentive Plan. The par value of each share of common stock will remain unchanged. The Company’s common stock is expected to begin trading on the Nasdaq Global Select Market on a post-reverse stock split basis beginning on March 9, 2023, under a new CUSIP number: 649604840.

No fractional shares will be issued in connection with the Reverse Stock Split. Instead, each stockholder that would hold fractional shares as a result of the Reverse Stock Split will be entitled to receive, in lieu of such fractional shares, cash in an amount based on the closing price of the Company's common stock on the Nasdaq Global Select Market on March 8, 2023. The Reverse Stock Split will apply to all of the Company’s outstanding shares of common stock and therefore will not affect any stockholder’s ownership percentage of shares of the Company’s common stock, except for de minimis changes resulting from the payment of cash in lieu of fractional shares. Stockholders of record will be receiving information from American Stock Transfer & Trust Company, the Company’s transfer agent (“AST”), regarding their stock ownership following the Reverse Stock Split and, if applicable, payments of cash in lieu of fractional shares. Stockholders who hold their shares in brokerage accounts or in “street name” are not required to take any action in connection with the Reverse Stock Split.

Stock Repurchase Program

On February 20, 2023, the Company's Board of Directors authorized an extension of the previously announced share repurchase program under which the Company may repurchase up to $200.0 million of its common stock. The Company’s Board of Directors extended the stock repurchase plan expiration from March 31, 2023 to March 31, 2024. The stock repurchase program does not require the purchase of any minimum number of shares. The timing and extent to which the Company repurchases its shares will depend upon, among other things, market conditions, share price, liquidity, regulatory requirements and other factors, and repurchases may be commenced or suspended at any time without prior notice. Acquisitions under the share repurchase program may be made in the open market, through privately negotiated transactions or block trades or other means, in accordance with applicable securities laws.

The Company intends to only consider repurchasing shares of its common stock when the purchase price is less than the last publicly reported book value per common share and expects to fund the share repurchases from current liquidity.


Conference Call

On Thursday, February 23, 2023 at 9:00 a.m., Eastern Time, New York Mortgage Trust's executive management is scheduled to host a conference call and audio webcast to discuss the Company’s financial results for the three and twelve months ended December 31, 2022. To access the conference call, please pre-register at https://register.vevent.com/register/BI47914a4648d541298795ee61e00083f5. Registrants will receive confirmation with dial-in details. A live audio webcast of the conference call can be accessed via the Internet, on a listen-only basis, at the Investor Relations section of the Company's website at http://www.nymtrust.com. Please allow extra time, prior to the call, to visit the site and download the necessary software to listen to the Internet broadcast. A webcast replay link of the conference call will be available on the Investor Relations section of the Company’s website approximately two hours after the call and will be available for 12 months.

In connection with the release of these financial results, the Company will also post a supplemental financial presentation that will accompany the conference call on its website at http://www.nymtrust.com under the "Investors Events and Presentations" section. Full year 2022 financial and operating data can be viewed in the Company’s Annual Report on Form 10-K for the year ended December 31, 2022, which is expected to be filed with the Securities and Exchange Commission on or about February 24, 2023. A copy of the Form 10-K will be posted at the Company’s website as soon as reasonably practicable following its filing with the Securities and Exchange Commission.

About New York Mortgage Trust

New York Mortgage Trust, Inc. is a Maryland corporation that has elected to be taxed as a real estate investment trust (“REIT”) for federal income tax purposes. NYMT is an internally managed REIT in the business of acquiring, investing in, financing and managing primarily mortgage-related single-family and multi-family residential assets. For a list of defined terms used from time to time in this press release, see “Defined Terms” below.


Defined Terms

The following defines certain of the commonly used terms that may appear in this press release: “RMBS” refers to residential mortgage-backed securities backed by adjustable-rate, hybrid adjustable-rate, or fixed-rate residential loans; “Agency RMBS” refers to RMBS representing interests in or obligations backed by pools of residential loans guaranteed by a government sponsored enterprise (“GSE”), such as the Federal National Mortgage Association (“Fannie Mae”) or the Federal Home Loan Mortgage Corporation (“Freddie Mac”), or an agency of the U.S. government, such as the Government National Mortgage Association (“Ginnie Mae”); “ABS” refers to debt and/or equity tranches of securitizations backed by various asset classes including, but not limited to, automobiles, aircraft, credit cards, equipment, franchises, recreational vehicles and student loans; “non-Agency RMBS” refers to RMBS that are not guaranteed by any agency of the U.S. Government or any GSE; “IOs” refers collectively to interest only and inverse interest only mortgage-backed securities that represent the right to the interest component of the cash flow from a pool of mortgage loans; “POs” refers to mortgage-backed securities that represent the right to the principal component of the cash flow from a pool of mortgage loans; “CMBS” refers to commercial mortgage-backed securities comprised of commercial mortgage pass-through securities issued by a GSE, as well as PO, IO or mezzanine securities that represent the right to a specific component of the cash flow from a pool of commercial mortgage loans; “multi-family CMBS” refers to CMBS backed by commercial mortgage loans on multi-family properties; “CDO” refers to collateralized debt obligation and includes debt that permanently finances the residential loans held in Consolidated SLST, the Company's residential loans held in securitization trusts and a non-Agency RMBS re-securitization that we consolidate or consolidated in our financial statements in accordance with GAAP; “Consolidated SLST” refers to a Freddie Mac-sponsored residential loan securitization, comprised of seasoned re-performing and non-performing residential loans, of which we own the first loss subordinated securities and certain IOs, that we consolidate in our financial statements in accordance with GAAP; “Consolidated VIEs” refers to variable interest entities ("VIE") where the Company is the primary beneficiary, as it has both the power to direct the activities that most significantly impact the economic performance of the VIE and a right to receive benefits or absorb losses of the entity that could be potentially significant to the VIE and that we consolidate in our financial statements in accordance with GAAP; “Consolidated Real Estate VIEs” refers to Consolidated VIEs that own multi-family properties; “business purpose loans” refers to (i) short-term loans that are collateralized by residential properties and are made to investors who intend to rehabilitate and sell the residential property for a profit or (ii) loans that finance (or refinance) non-owner occupied residential properties that are rented to one or more tenants; “Mezzanine Lending” refers, collectively, to preferred equity and mezzanine loan investments; “Multi-Family” portfolio includes multi-family CMBS, preferred equity and mezzanine loan investments and certain equity investments that invest in multi-family assets, including joint venture equity investments; “Single-Family” portfolio includes residential loans, Agency RMBS, non-Agency RMBS and single-family rental properties; and “Other” portfolio includes ABS and equity investments in entities that invest in residential assets or originate residential loans.


Cautionary Statement Regarding Forward-Looking Statements

When used in this press release, in future filings with the Securities and Exchange Commission (the “SEC”) or in other written or oral communications, statements which are not historical in nature, including those containing words such as “will,” “believe,” “expect,” “anticipate,” “estimate,” “plan,” “continue,” “intend,” “could,” “would,” “should,” “may” or similar expressions, are intended to identify “forward-looking statements” within the meaning of Section 27A of the Securities Act of 1933, as amended, and Section 21E of the Securities Exchange Act of 1934, as amended (the “Exchange Act”), and, as such, may involve known and unknown risks, uncertainties and assumptions.

Forward-looking statements are based on estimates, projections, beliefs and assumptions of management of the Company at the time of such statements and are not guarantees of future performance. Forward-looking statements involve risks and uncertainties in predicting future results and conditions. Actual results and outcomes could differ materially from those projected in these forward-looking statements due to a variety of factors, including, without limitation: changes in the Company’s business and investment strategy; inflation and changes in interest rates and the fair market value of the Company’s assets, including negative changes resulting in margin calls relating to the financing of the Company’s assets; changes in credit spreads; changes in the long-term credit ratings of the U.S., Fannie Mae, Freddie Mac, and Ginnie Mae; general volatility of the markets in which the Company invests; changes in prepayment rates on the loans the Company owns or that underlie the Company’s investment securities; increased rates of default, delinquency or vacancy and/or decreased recovery rates on or at the Company’s assets; the Company’s ability to identify and acquire targeted assets, including assets in its investment pipeline; the Company's ability to dispose of assets from time to time on terms favorable to it, including the disposition over time of its joint venture equity investments; changes in relationships with the Company’s financing counterparties and the Company’s ability to borrow to finance its assets and the terms thereof; changes in the Company's relationships with and/or the performance of its operating partners; the Company’s ability to predict and control costs; changes in laws, regulations or policies affecting the Company’s business, including actions that may be taken to contain or address the impact of COVID-19 and variants; the Company’s ability to make distributions to its stockholders in the future; the Company’s ability to maintain its qualification as a REIT for federal tax purposes; the Company’s ability to maintain its exemption from registration under the Investment Company Act of 1940, as amended; and risks associated with investing in real estate assets, including changes in business conditions and the general economy, the availability of investment opportunities and the conditions in the market for Agency RMBS, non-Agency RMBS, ABS and CMBS securities, residential loans, structured multi-family investments and other mortgage-, residential housing- and credit-related assets.

These and other risks, uncertainties and factors, including the risk factors described in the Company’s reports filed with the SEC pursuant to the Exchange Act, could cause the Company’s actual results to differ materially from those projected in any forward-looking statements the Company makes. All forward-looking statements speak only as of the date on which they are made. New risks and uncertainties arise over time and it is not possible to predict those events or how they may affect the Company. Except as required by law, the Company is not obligated to, and does not intend to, update or revise any forward-looking statements, whether as a result of new information, future events or otherwise.

For Further Information

CONTACT: AT THE COMPANY    
Phone: 212-792-0107
Email: [email protected]


FINANCIAL TABLES FOLLOW


NEW YORK MORTGAGE TRUST, INC. AND SUBSIDIARIES
CONSOLIDATED BALANCE SHEETS
(Dollar amounts in thousands, except share data)
December 31, 2022December 31, 2021
(unaudited)
ASSETS
Residential loans, at fair value $3,525,080 $3,575,601 
Multi-family loans, at fair value87,534 120,021 
Investment securities available for sale, at fair value 99,559 200,844 
Equity investments, at fair value 179,746 239,631 
Cash and cash equivalents244,718 289,602 
Real estate, net692,968 1,017,583 
Assets of disposal group held for sale1,151,784 — 
Other assets259,356 215,019 
Total Assets (1)
$6,240,745 $5,658,301 
LIABILITIES AND EQUITY
Liabilities:
Repurchase agreements$737,023 $554,259 
Collateralized debt obligations ($634,495 at fair value and $1,468,222 at amortized cost, net as of December 31, 2022 and $839,419 at fair value and $682,802 at amortized cost, net as of December 31, 2021)
2,102,717 1,522,221 
Convertible notes— 137,898 
Senior unsecured notes97,384 96,704 
Subordinated debentures45,000 45,000 
Mortgages payable on real estate, net 394,707 709,356 
Liabilities of disposal group held for sale883,812 — 
Other liabilities 115,991 161,081 
Total liabilities (1)
4,376,634 3,226,519 
Commitments and Contingencies
Redeemable Non-Controlling Interest in Consolidated Variable Interest Entities63,803 66,392 
Stockholders' Equity:
Preferred stock, par value $0.01 per share, 31,500,000 and 29,500,000 shares authorized as of December 31, 2022 and December 31, 2021, respectively, 22,284,994 shares issued and outstanding as of December 31, 2022 and December 31, 2021 ($557,125 aggregate liquidation preference as of December 31, 2022 and December 31, 2021)
538,351 538,221 
Common stock, par value $0.01 per share, 800,000,000 shares authorized, 364,774,752 and 379,405,240 shares issued and outstanding as of December 31, 2022 and December 31, 2021, respectively
3,648 3,794 
Additional paid-in capital2,279,955 2,356,576 
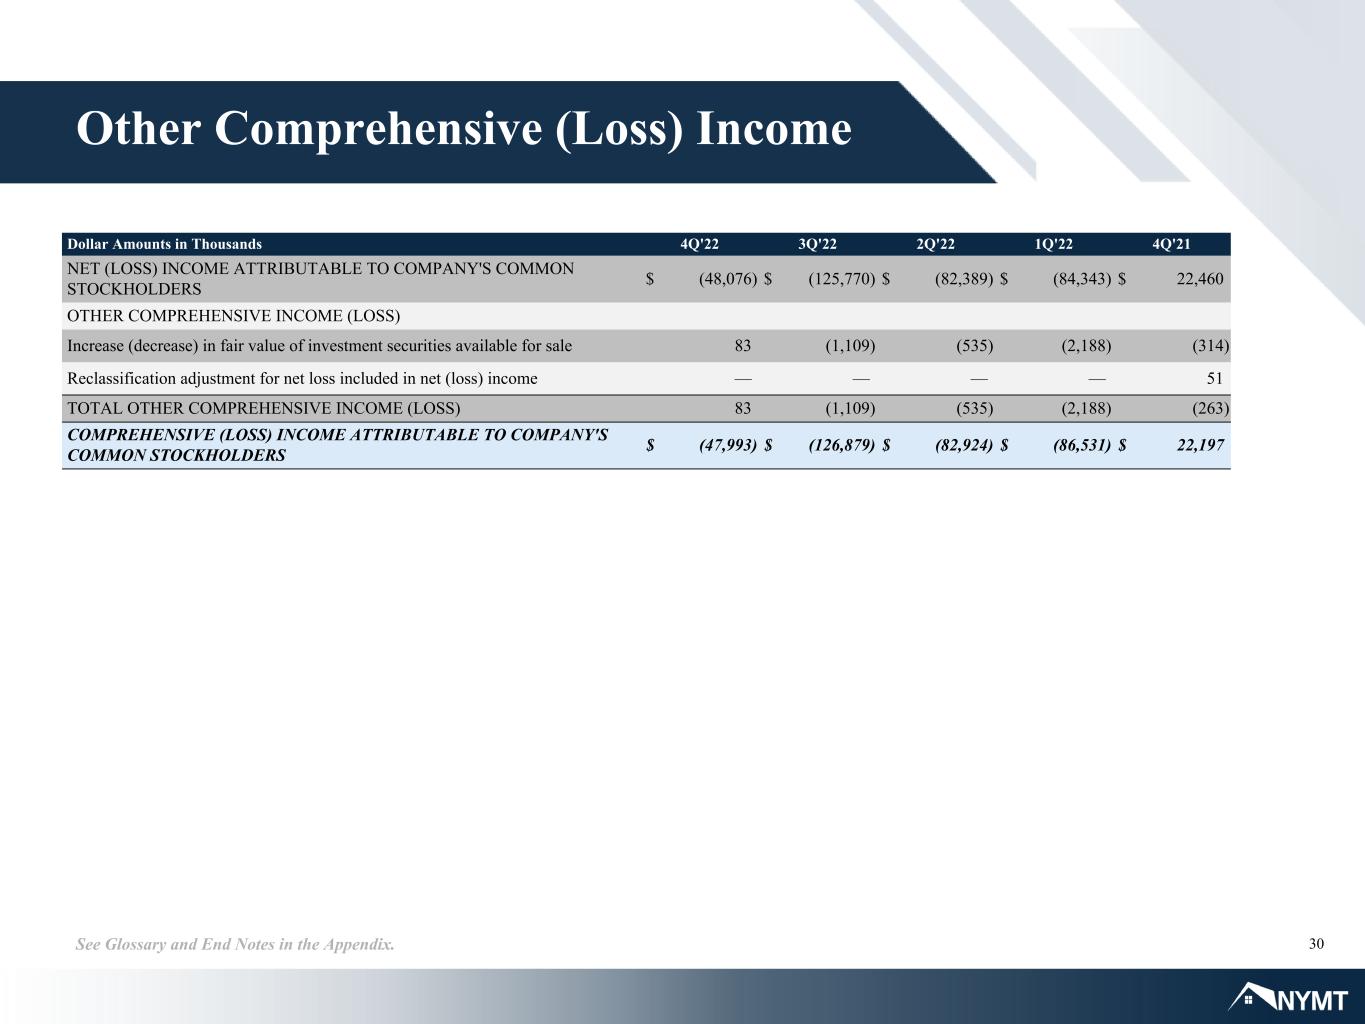
Accumulated other comprehensive (loss) income(1,970)1,778 
Accumulated deficit(1,052,768)(559,338)
Company's stockholders' equity1,767,216 2,341,031 
Non-controlling interests33,092 24,359 
Total equity1,800,308 2,365,390 
Total Liabilities and Equity$6,240,745 $5,658,301 
(1)Our consolidated balance sheets include assets and liabilities of consolidated variable interest entities ("VIEs") as the Company is the primary beneficiary of these VIEs. As of December 31, 2022 and December 31, 2021, assets of consolidated VIEs totaled $4,261,097 and $2,940,513, respectively, and the liabilities of consolidated VIEs totaled $3,403,257 and $2,235,665, respectively.


NEW YORK MORTGAGE TRUST, INC. AND SUBSIDIARIES
CONSOLIDATED STATEMENTS OF OPERATIONS
(Amounts in thousands, except per share data)
(unaudited)
For the Three Months Ended
December 31,
For the Twelve Months Ended
December 31,
2022202120222021
NET INTEREST INCOME:
Interest income$62,948 $52,318 $258,388 $206,866 
Interest expense40,651 19,468 129,419 79,284 
Total net interest income22,297 32,850 128,969 127,582 
NON-INTEREST INCOME (LOSS):
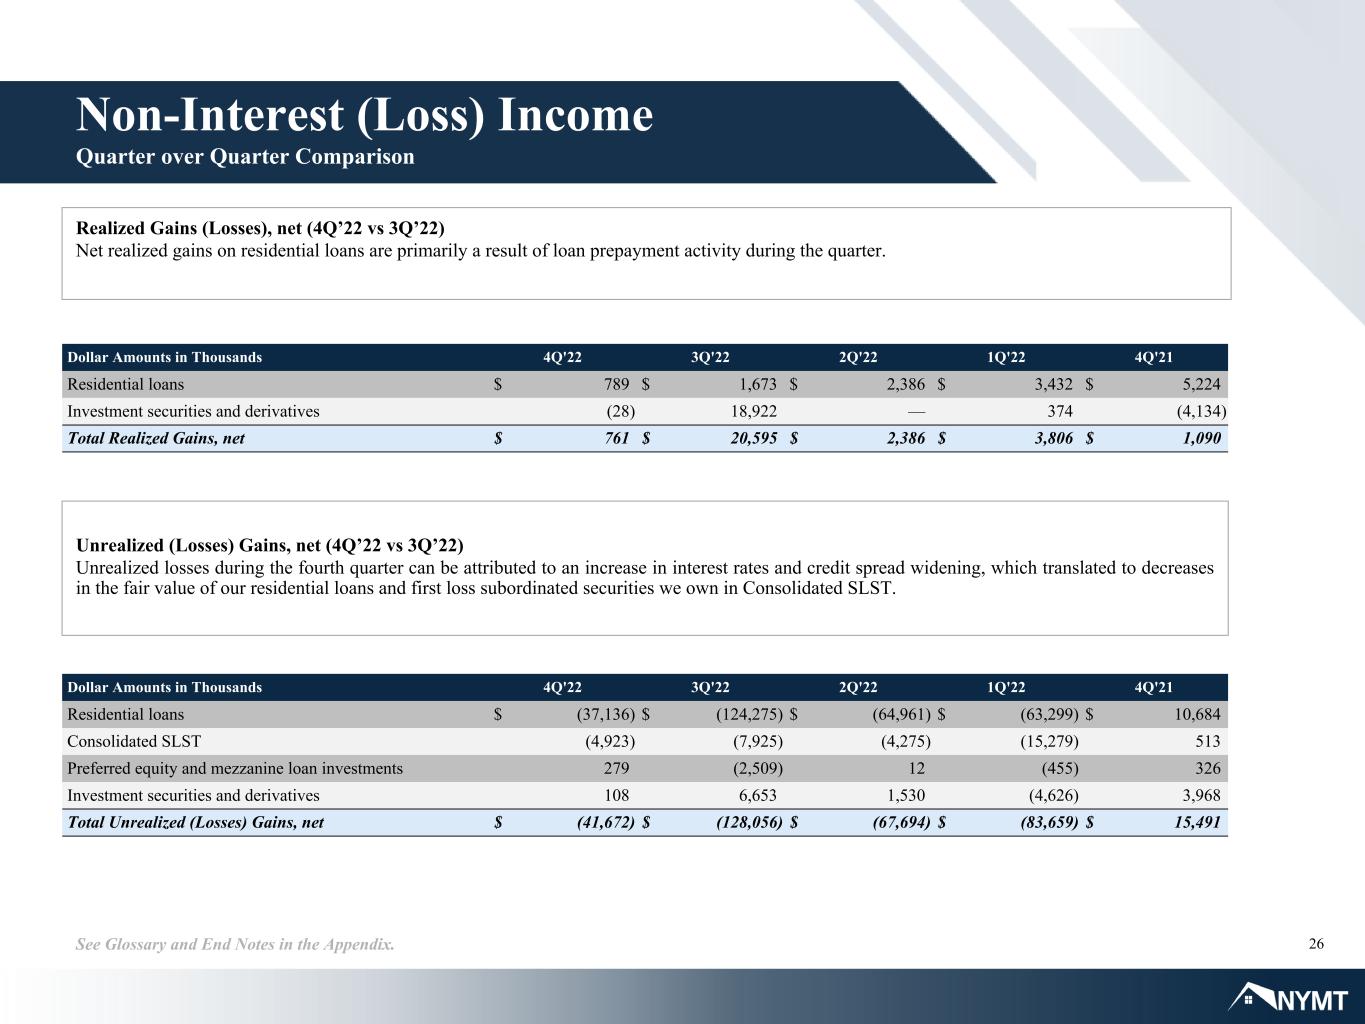
Realized gains, net761 1,090 27,549 21,451 
Unrealized (losses) gains, net(41,672)15,491 (321,081)95,649 
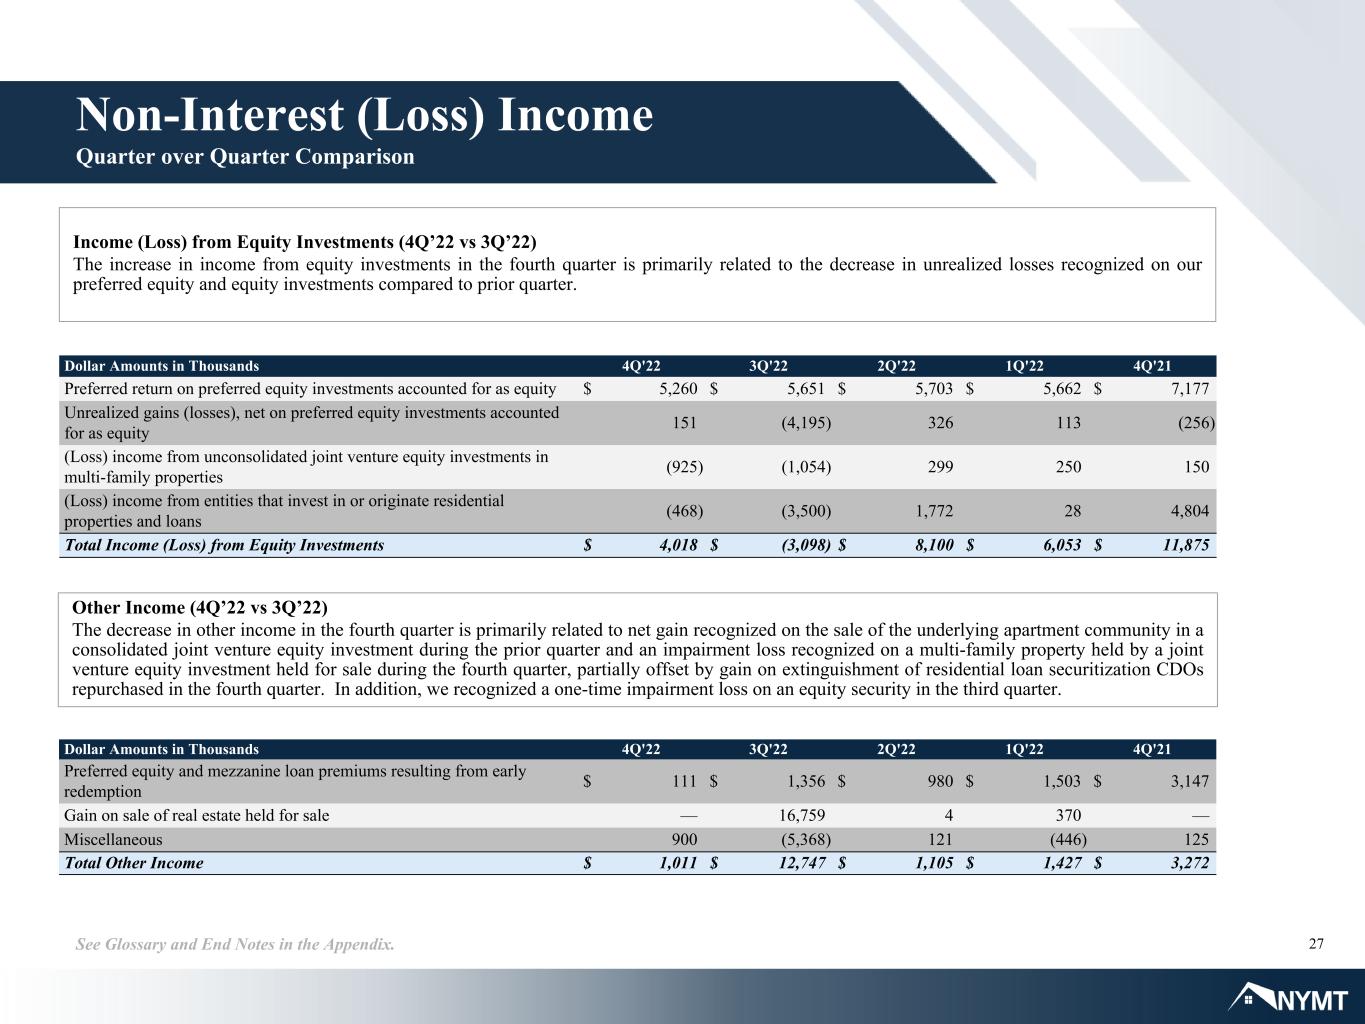
Income from equity investments4,018 11,875 15,074 33,896 
Other income1,011 3,272 16,289 5,515 
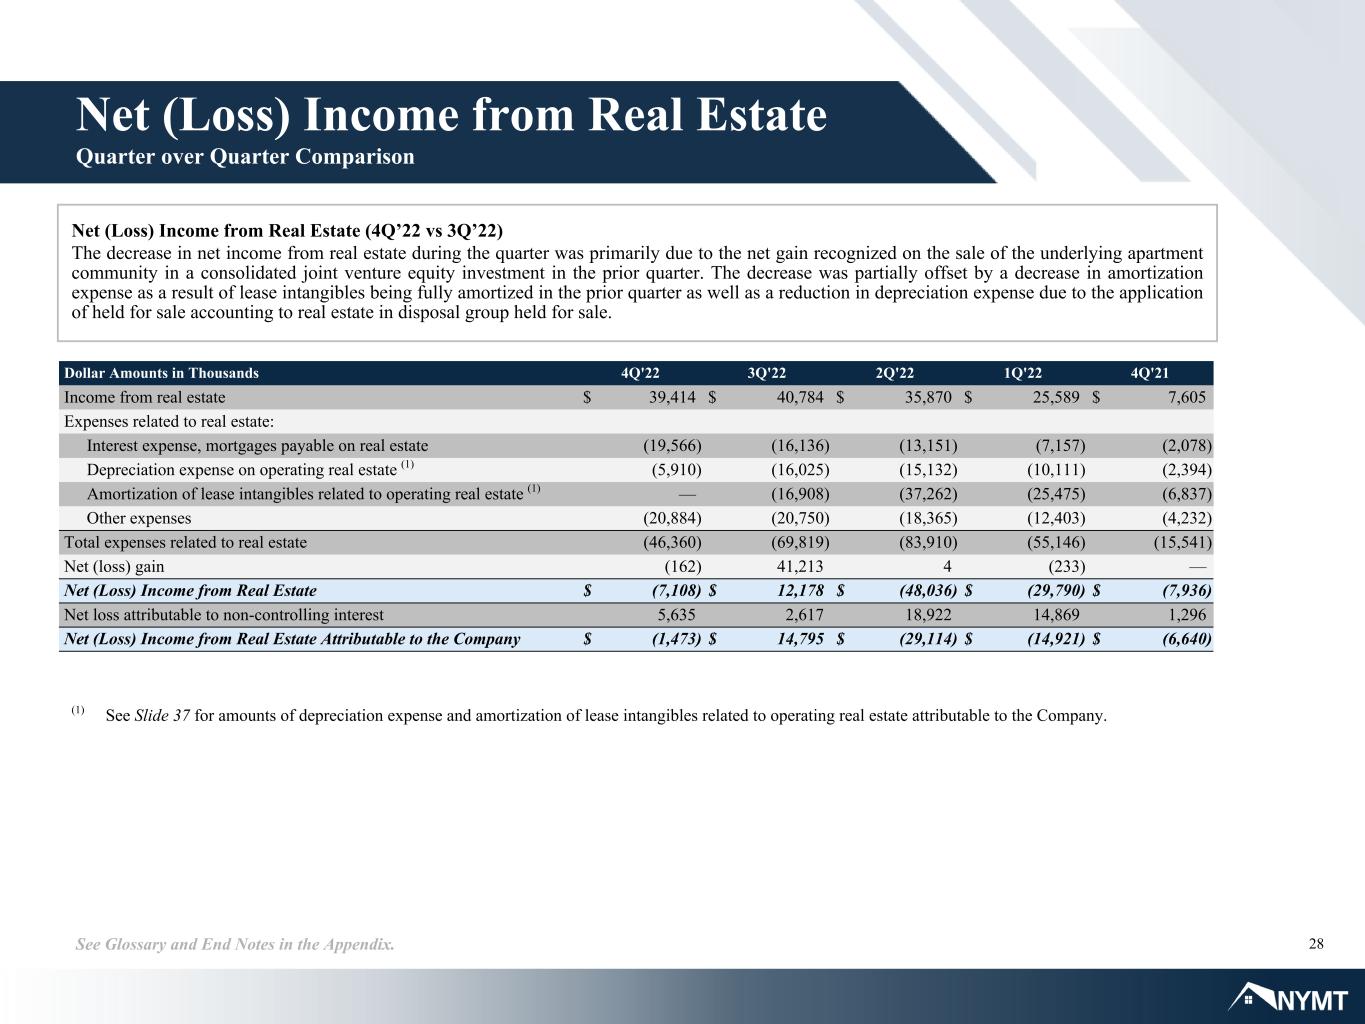
Income from real estate
Rental income35,514 6,980 126,293 14,303 
Other real estate income3,900 625 15,363 927 
Total income from real estate39,414 7,605 141,656 15,230 
Total non-interest income (loss) 3,532 39,333 (120,513)171,741 
GENERAL, ADMINISTRATIVE AND OPERATING EXPENSES:
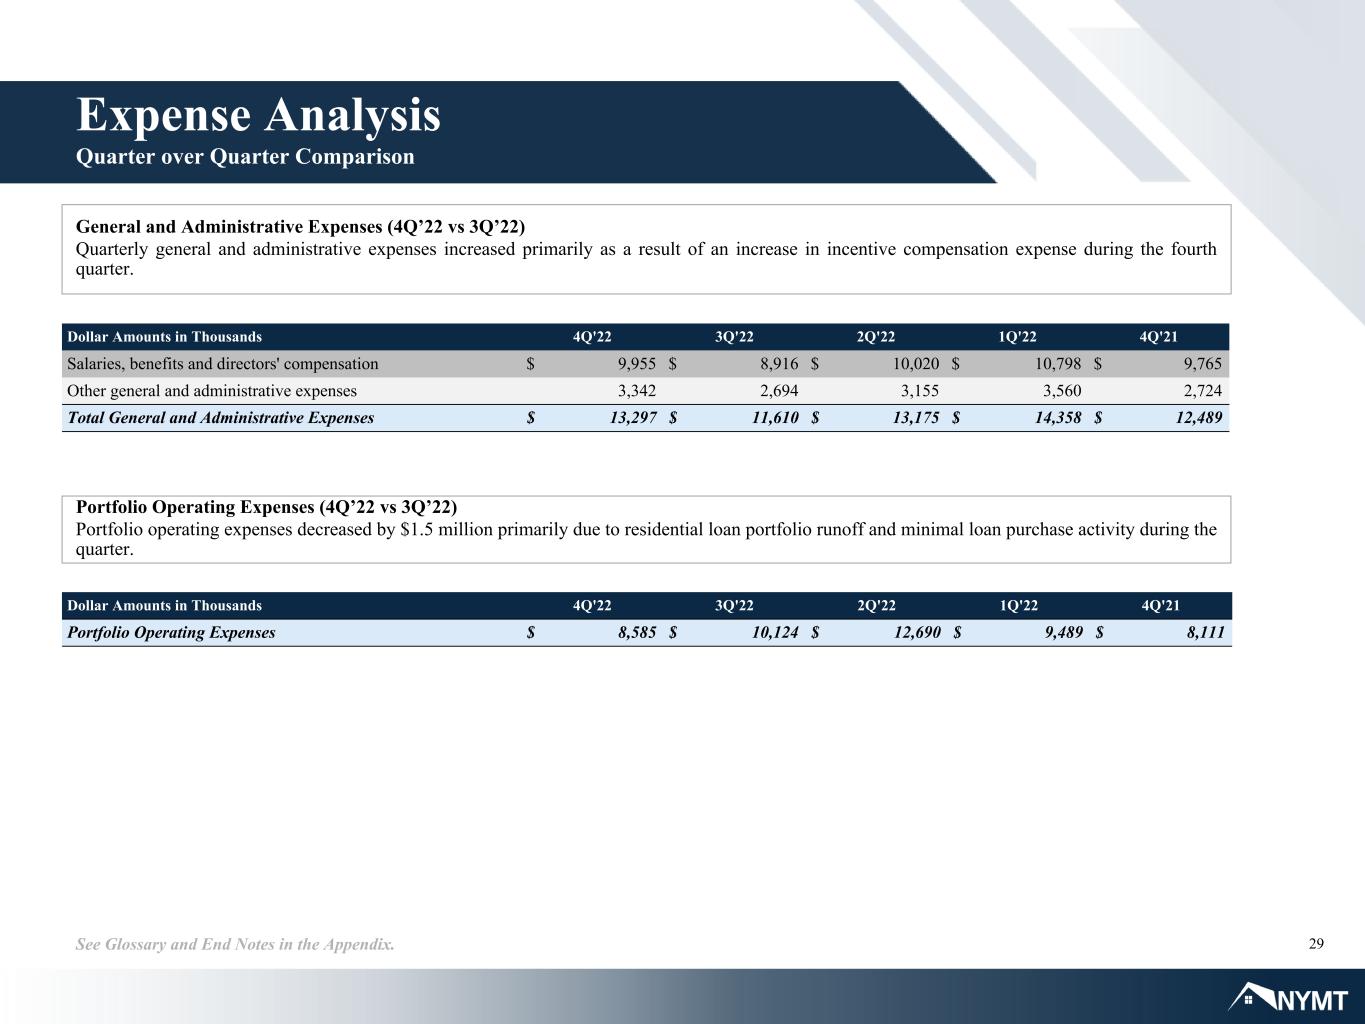
General and administrative expenses
13,297 12,489 52,440 48,908 
Portfolio operating expenses8,585 8,111 40,888 26,668 
Expenses related to real estate
Interest expense, mortgages payable on real estate19,566 2,078 56,011 3,964 
Depreciation and amortization5,910 9,231 126,824 19,250 
Other real estate expenses20,884 4,232 72,400 9,599 
Total expenses related to real estate46,360 15,541 255,235 32,813 
Total general, administrative and operating expenses
68,242 36,141 348,563 108,389 
(LOSS) INCOME FROM OPERATIONS BEFORE INCOME TAXES(42,413)36,042 (340,107)190,934 
Income tax expense804 1,162 542 2,458 
NET (LOSS) INCOME(43,217)34,880 (340,649)188,476 
Net loss attributable to non-controlling interests5,635 1,296 42,044 4,724 
NET (LOSS) INCOME ATTRIBUTABLE TO COMPANY(37,582)36,176 (298,605)193,200 
Preferred stock dividends(10,494)(10,994)(41,972)(42,859)
Preferred stock redemption charge— (2,722)— (6,165)
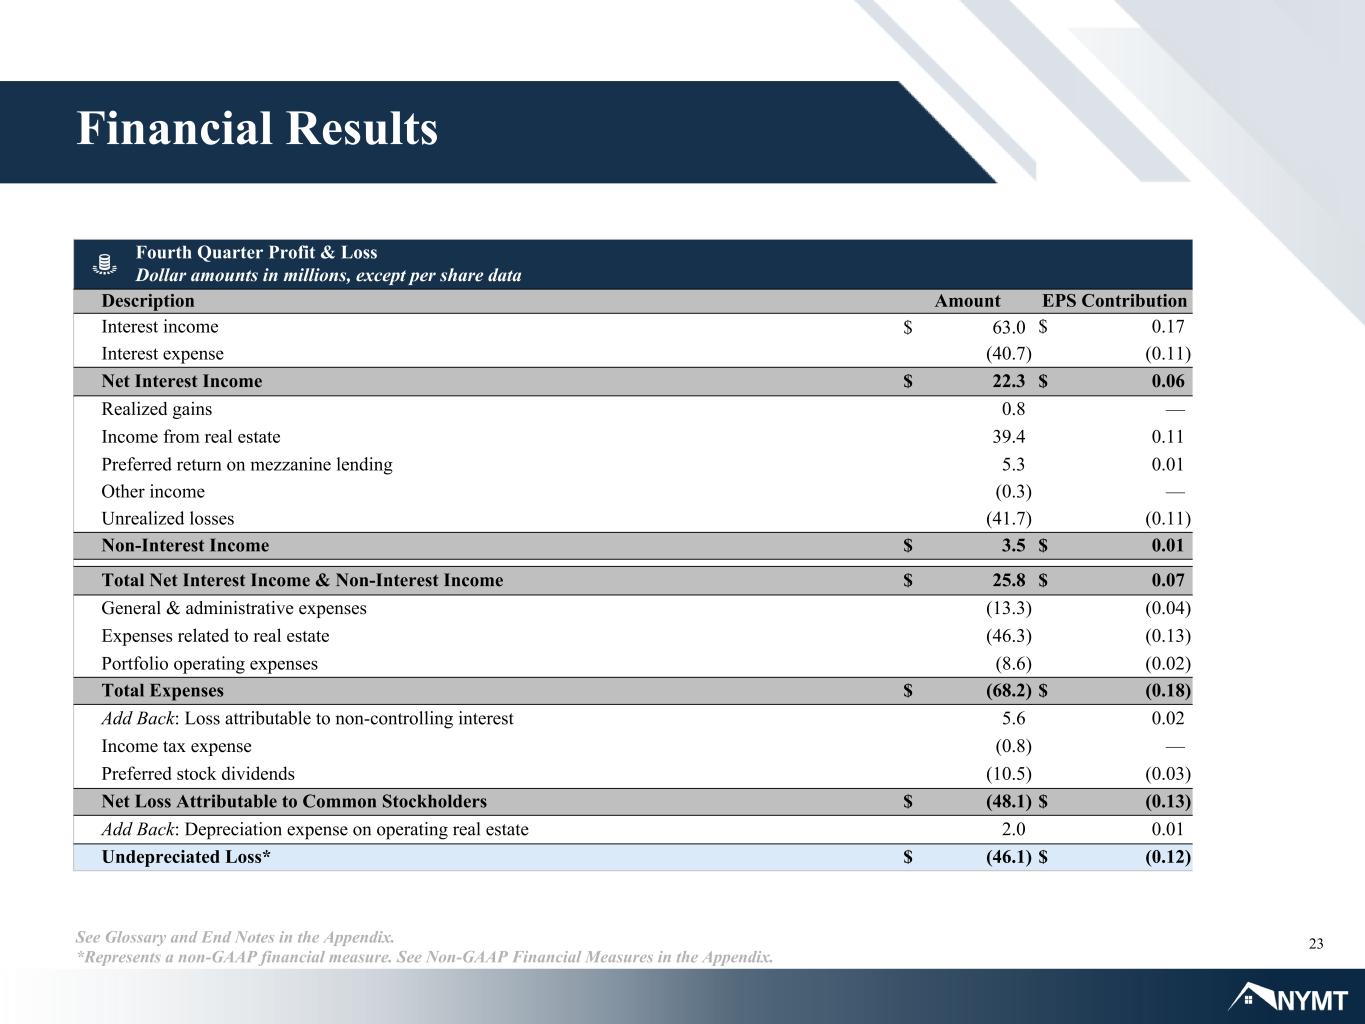
NET (LOSS) INCOME ATTRIBUTABLE TO COMPANY'S COMMON STOCKHOLDERS$(48,076)$22,460 $(340,577)$144,176 
Basic (loss) earnings per common share$(0.13)$0.06 $(0.90)$0.38 
Diluted (loss) earnings per common share$(0.13)$0.06 $(0.90)$0.38 
Weighted average shares outstanding-basic370,193 379,346 377,287 379,232 
Weighted average shares outstanding-diluted370,193 380,551 377,287 380,968 


NEW YORK MORTGAGE TRUST, INC. AND SUBSIDIARIES
SUMMARY OF QUARTERLY (LOSS) EARNINGS
(Dollar amounts in thousands, except per share data)
(unaudited)
For the Three Months Ended
December 31, 2022September 30, 2022June 30, 2022March 31, 2022December 31, 2021
Interest income$62,948 $68,920 $68,020 $58,501 $52,318 
Interest expense40,651 38,563 28,740 21,465 19,468 
Total net interest income22,297 30,357 39,280 37,036 32,850 
Total non-interest income (loss) 3,532 (57,028)(20,233)(46,784)39,333 
Total general, administrative and operating expenses68,242 91,553 109,775 78,993 36,141 
(Loss) income from operations before income taxes(42,413)(118,224)(90,728)(88,741)36,042 
Income tax expense (benefit) 804 (330)90 (22)1,162 
Net (loss) income(43,217)(117,894)(90,818)(88,719)34,880 
Net loss attributable to non-controlling interests5,635 2,617 18,922 14,869 1,296 
Net (loss) income attributable to Company(37,582)(115,277)(71,896)(73,850)36,176 
Preferred stock dividends(10,494)(10,493)(10,493)(10,493)(10,994)
Preferred stock redemption charge— — — — (2,722)
Net (loss) income attributable to Company's common stockholders(48,076)(125,770)(82,389)(84,343)22,460 
Basic (loss) earnings per common share$(0.13)$(0.33)$(0.22)$(0.22)$0.06 
Diluted (loss) earnings per common share$(0.13)$(0.33)$(0.22)$(0.22)$0.06 
Weighted average shares outstanding - basic
370,193 377,078 381,200 380,795 379,346 
Weighted average shares outstanding - diluted
370,193 377,078 381,200 380,795 380,551 
Yield on average interest earning assets (1)
6.49 %6.66 %6.69 %6.80 %6.57 %
Net interest spread (1)
1.11 %2.18 %3.34 %3.60 %2.80 %
Undepreciated (loss) earnings (1)
$(46,116)$(101,473)$(49,170)$(64,205)$31,045 
Undepreciated (loss) earnings per common share (1)
$(0.12)$(0.27)$(0.13)$(0.17)$0.08 
Book value per common share
$3.32 $3.65 $4.06 $4.36 $4.70 
Adjusted book value per common share (1)
$3.97 $4.17 $4.42 $4.54 $4.72 
Dividends declared per common share$0.10 $0.10 $0.10 $0.10 $0.10 
Dividends declared per preferred share on Series D Preferred Stock$0.50 $0.50 $0.50 $0.50 $0.50 
Dividends declared per preferred share on Series E Preferred Stock$0.49 $0.49 $0.49 $0.49 $0.49 
Dividends declared per preferred share on Series F Preferred Stock$0.43 $0.43 $0.43 $0.43 $0.43 
Dividends declared per preferred share on Series G Preferred Stock (2)
$0.44 $0.44 $0.44 $0.44 $0.25 
(1)Represents a non-GAAP financial measure. A reconciliation of the Company's non-GAAP financial measures to their most directly comparable GAAP measure is included below in "Reconciliation of Financial Information."
(2)For the three months ended December 31, 2021, dividends declared represent the cash dividend for the short initial dividend period that began on November 24, 2021 and ended on January 14, 2022.


Reconciliation of Financial Information

Non-GAAP Financial Measures

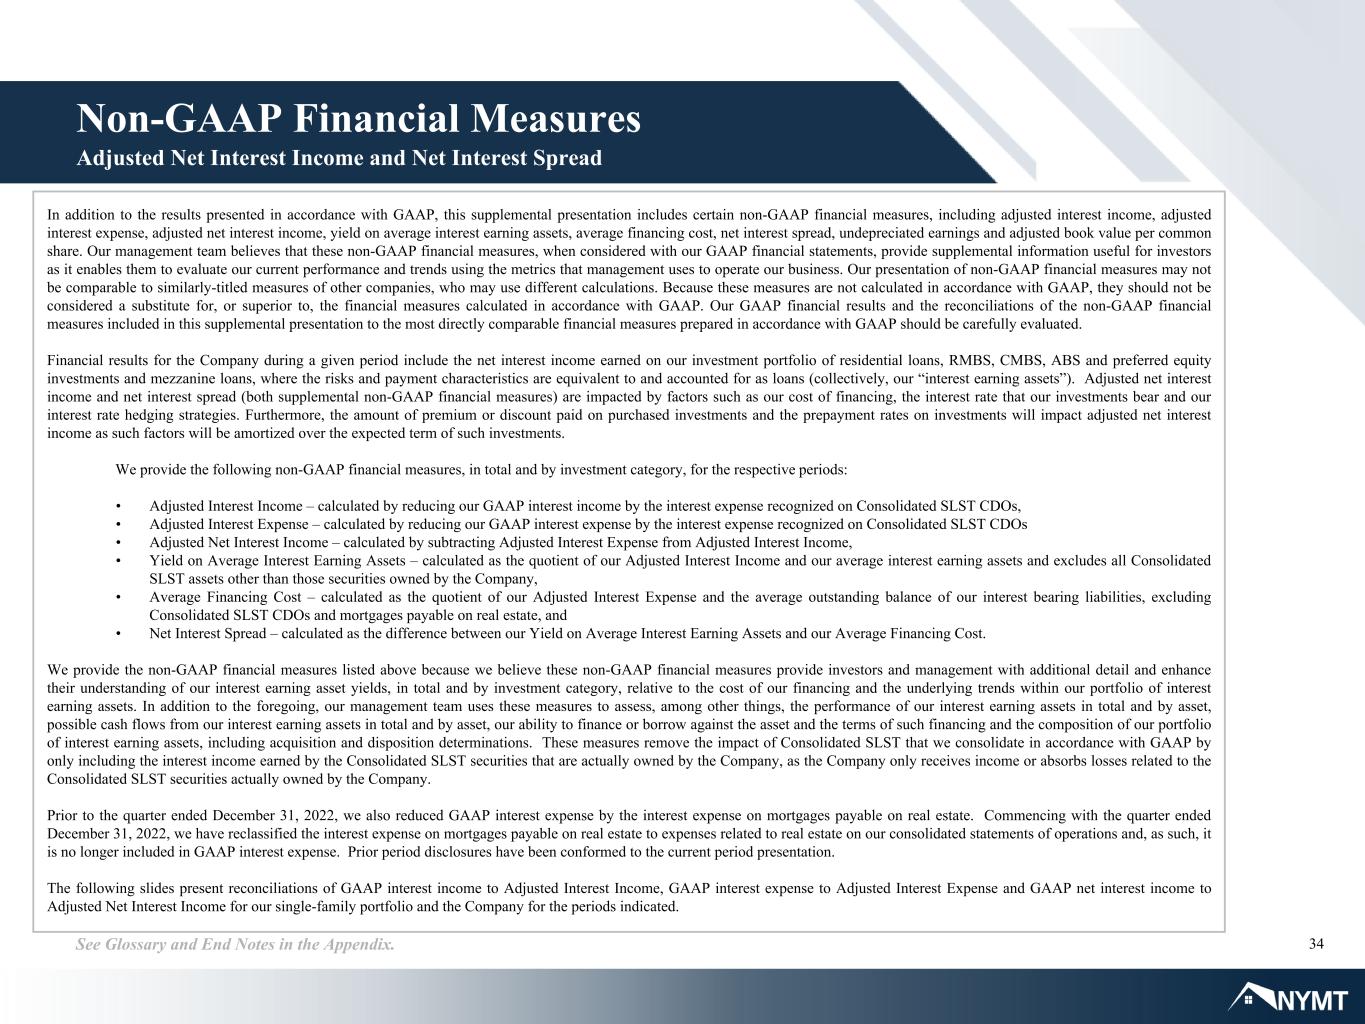
In addition to the results presented in accordance with GAAP, this press release includes certain non-GAAP financial measures, including adjusted interest income, adjusted interest expense, adjusted net interest income, yield on average interest earning assets, average financing cost, net interest spread, undepreciated earnings and adjusted book value per common share. Our management team believes that these non-GAAP financial measures, when considered with our GAAP financial statements, provide supplemental information useful for investors as it enables them to evaluate our current performance and trends using the metrics that management uses to operate our business. Our presentation of non-GAAP financial measures may not be comparable to similarly-titled measures of other companies, who may use different calculations. Because these measures are not calculated in accordance with GAAP, they should not be considered a substitute for, or superior to, the financial measures calculated in accordance with GAAP. Our GAAP financial results and the reconciliations of the non-GAAP financial measures included in this press release to the most directly comparable financial measures prepared in accordance with GAAP should be carefully evaluated.

Adjusted Net Interest Income and Net Interest Spread

Financial results for the Company during a given period include the net interest income earned on our investment portfolio of residential loans, RMBS, CMBS, ABS and preferred equity investments and mezzanine loans, where the risks and payment characteristics are equivalent to and accounted for as loans (collectively, our “interest earning assets”). Adjusted net interest income and net interest spread (both supplemental non-GAAP financial measures) are impacted by factors such as our cost of financing, the interest rate that our investments bear and our interest rate hedging strategies. Furthermore, the amount of premium or discount paid on purchased investments and the prepayment rates on investments will impact adjusted net interest income as such factors will be amortized over the expected term of such investments.

We provide the following non-GAAP financial measures, in total and by investment category, for the respective periods:

adjusted interest income – calculated by reducing our GAAP interest income by the interest expense recognized on Consolidated SLST CDOs,
adjusted interest expense – calculated by reducing our GAAP interest expense by the interest expense recognized on Consolidated SLST CDOs,
adjusted net interest income – calculated by subtracting adjusted interest expense from adjusted interest income,
yield on average interest earning assets – calculated as the quotient of our adjusted interest income and our average interest earning assets and excludes all Consolidated SLST assets other than those securities owned by the Company,
average financing cost – calculated as the quotient of our adjusted interest expense and the average outstanding balance of our interest bearing liabilities, excluding Consolidated SLST CDOs and mortgages payable on real estate, and
net interest spread – calculated as the difference between our yield on average interest earning assets and our average financing cost.


We provide the non-GAAP financial measures listed above because we believe these non-GAAP financial measures provide investors and management with additional detail and enhance their understanding of our interest earning asset yields, in total and by investment category, relative to the cost of our financing and the underlying trends within our portfolio of interest earning assets. In addition to the foregoing, our management team uses these measures to assess, among other things, the performance of our interest earning assets in total and by asset, possible cash flows from our interest earning assets in total and by asset, our ability to finance or borrow against the asset and the terms of such financing and the composition of our portfolio of interest earning assets, including acquisition and disposition determinations. These measures remove the impact of Consolidated SLST that we consolidate in accordance with GAAP by only including the interest income earned by the Consolidated SLST securities that are actually owned by the Company, as the Company only receives income or absorbs losses related to the Consolidated SLST securities actually owned by the Company.

Prior to the quarter ended December 31, 2022, we also reduced GAAP interest expense by the interest expense on mortgages payable on real estate. Commencing with the quarter ended December 31, 2022, we have reclassified the interest expense on mortgages payable on real estate to expenses related to real estate on our consolidated statements of operations and, as such, it is no longer included in GAAP interest expense. Prior period disclosures have been conformed to the current period presentation.
Our calculation of the non-GAAP financial measures presented below may not be comparable to similarly-titled measures of other companies who may use different calculations.
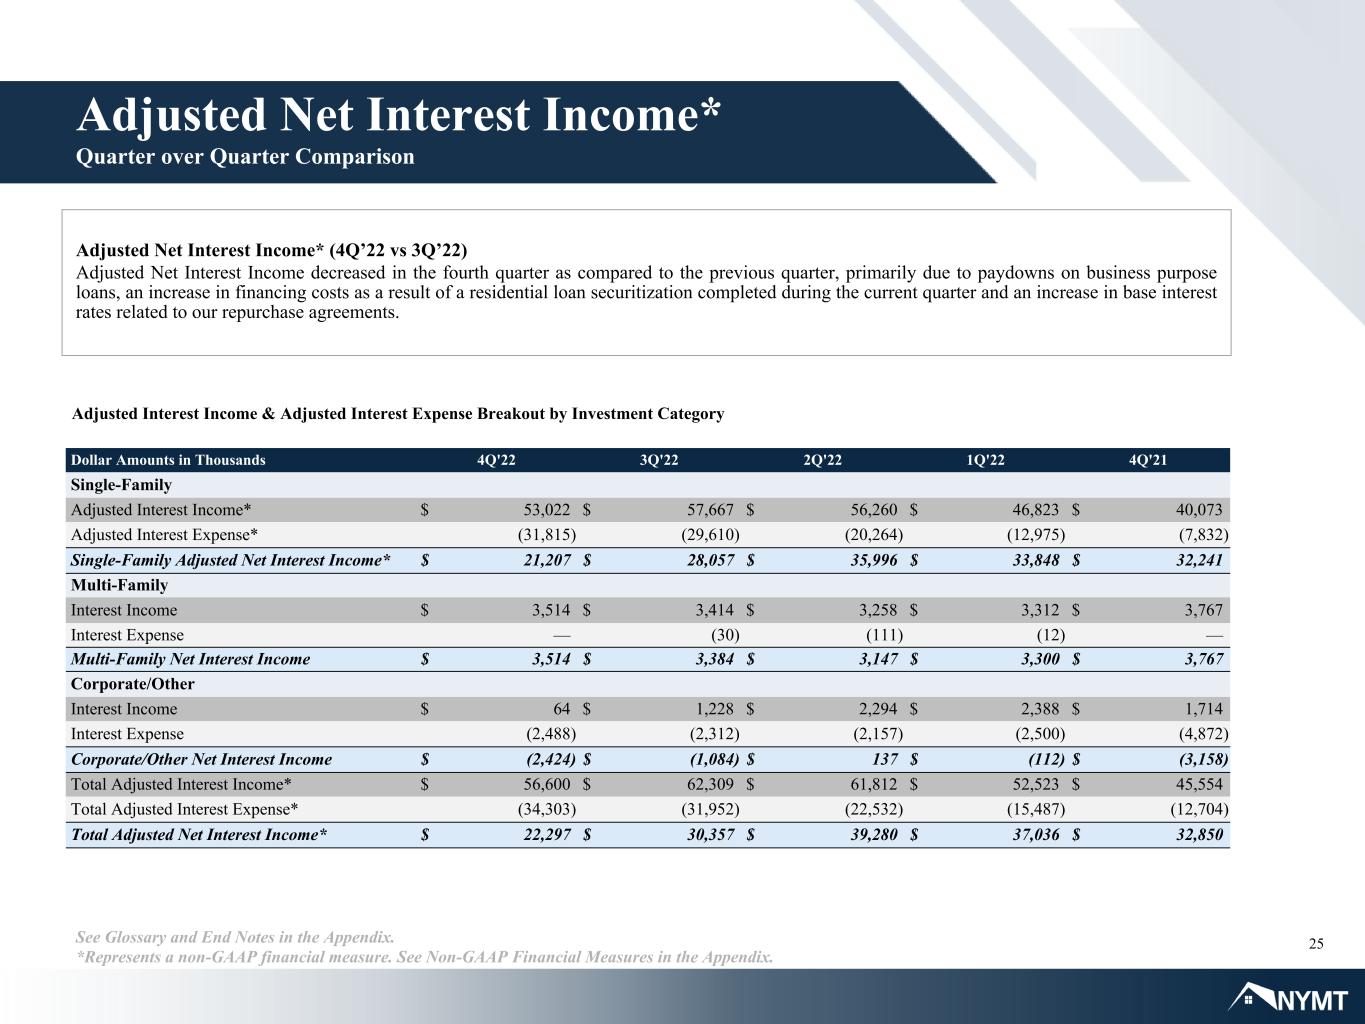
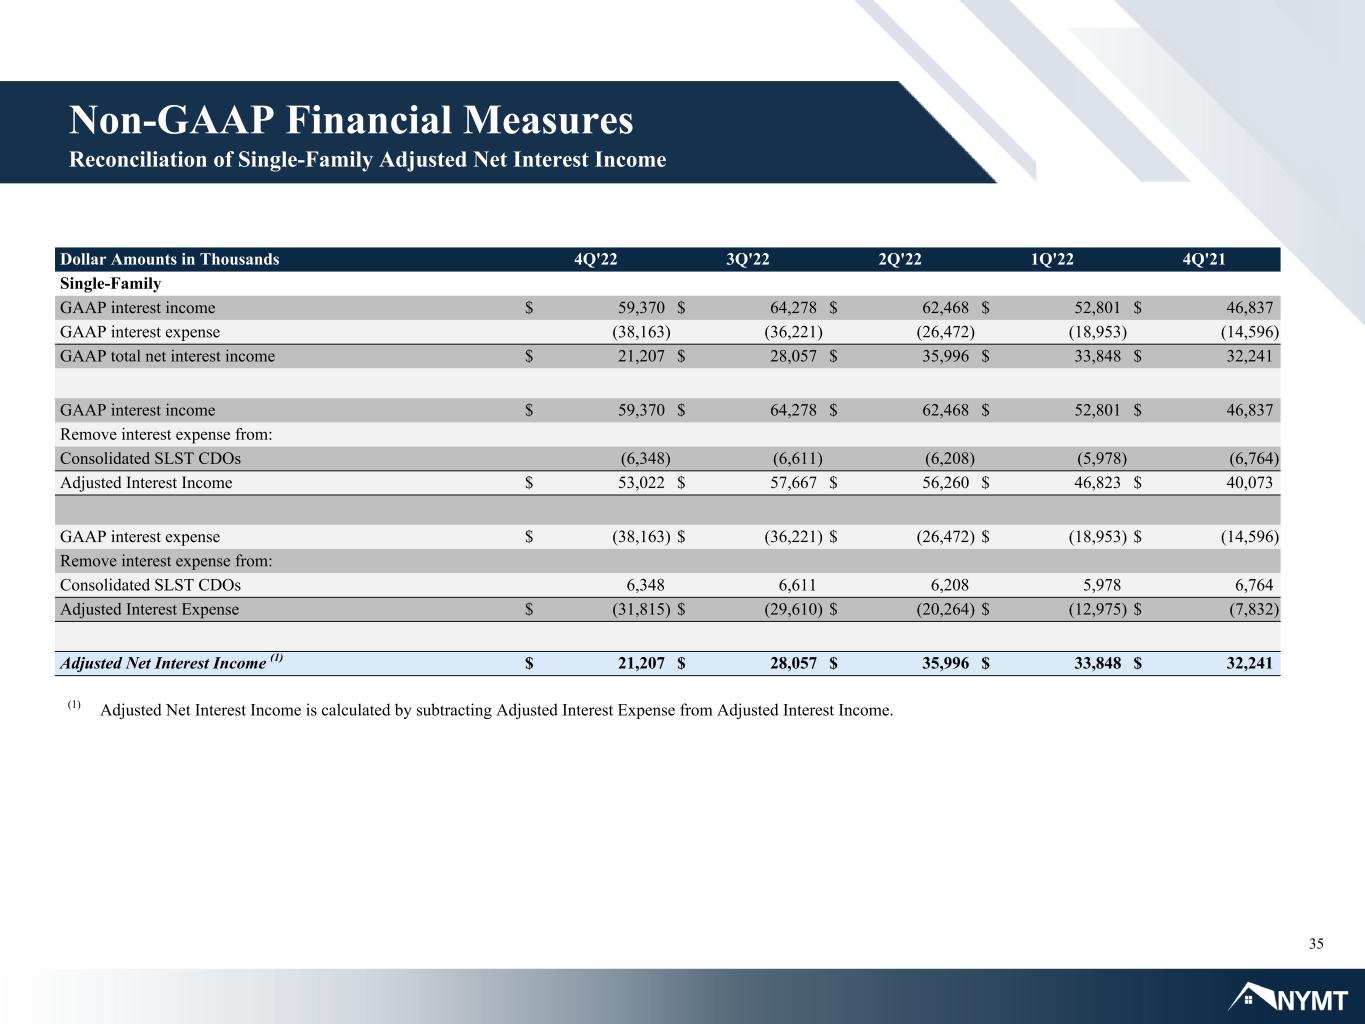
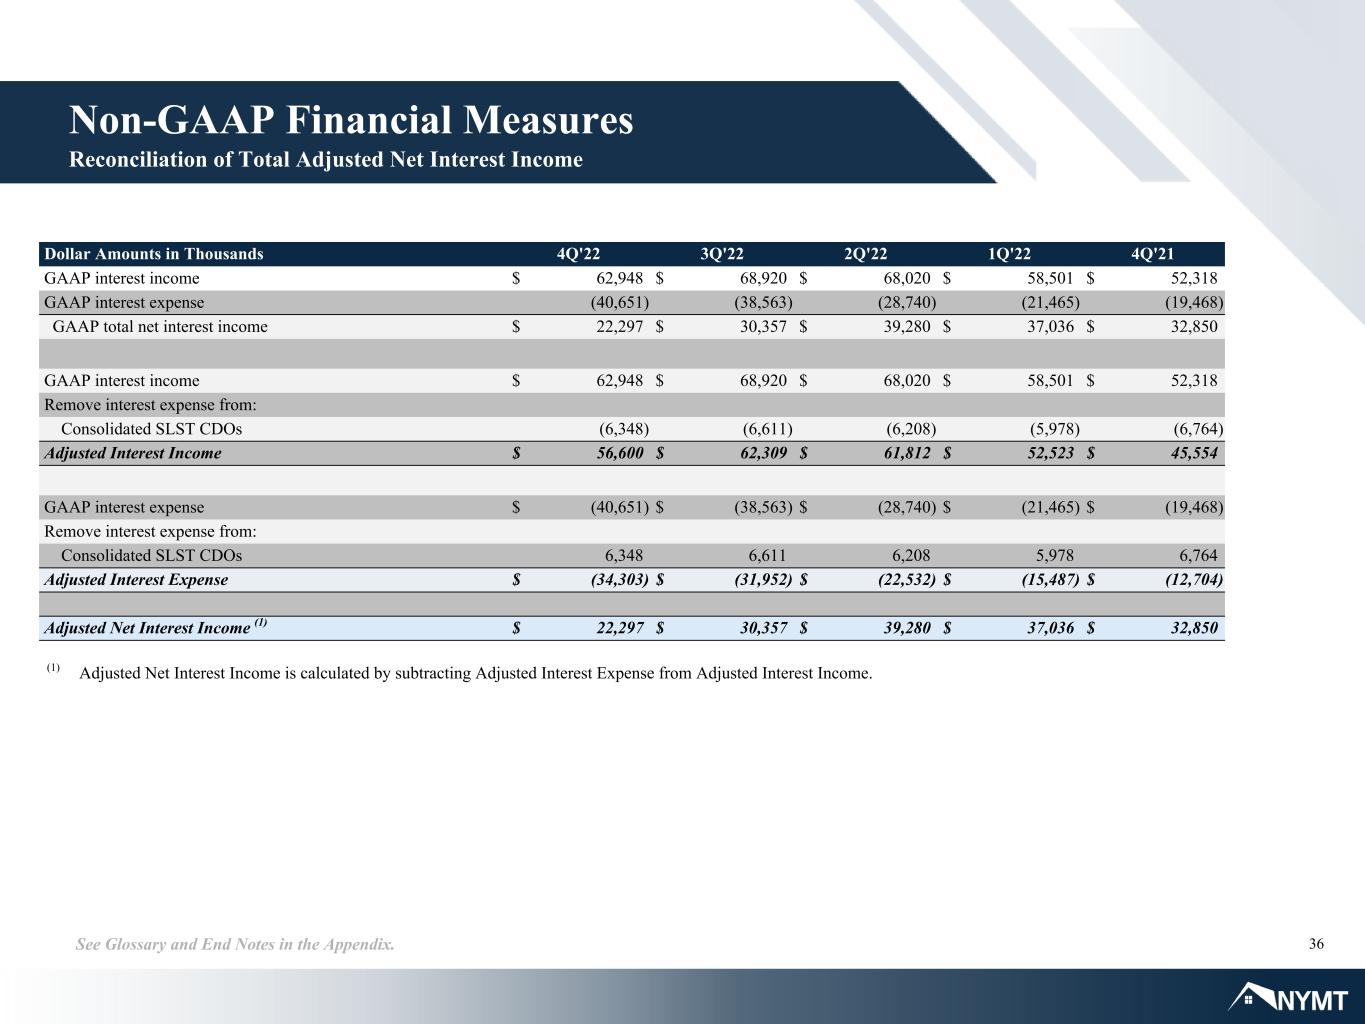
A reconciliation of GAAP interest income to adjusted interest income, GAAP interest expense to adjusted interest expense and GAAP total net interest income to adjusted net interest income for the three months ended as of the dates indicated is presented below (dollar amounts in thousands):
December 31, 2022
Single-FamilyMulti-FamilyCorporate/OtherTotal
GAAP interest income
$59,370 $3,514 $64 $62,948 
GAAP interest expense(38,163)— (2,488)(40,651)
GAAP total net interest income$21,207 $3,514 $(2,424)$22,297 
GAAP interest income$59,370 $3,514 $64 $62,948 
Remove interest expense from:
Consolidated SLST CDOs(6,348)— — (6,348)
Adjusted interest income$53,022 $3,514 $64 $56,600 
GAAP interest expense$(38,163)$— $(2,488)$(40,651)
Remove interest expense from:
Consolidated SLST CDOs6,348 — — 6,348 
Adjusted interest expense$(31,815)$— $(2,488)$(34,303)
Adjusted net interest income (1)
$21,207 $3,514 $(2,424)$22,297 


September 30, 2022
Single-FamilyMulti-FamilyCorporate/OtherTotal
GAAP interest income
$64,278 $3,414 $1,228 $68,920 
GAAP interest expense(36,221)(30)(2,312)(38,563)
GAAP total net interest income$28,057 $3,384 $(1,084)$30,357 
GAAP interest income$64,278 $3,414 $1,228 $68,920 
Remove interest expense from:
Consolidated SLST CDOs(6,611)— — (6,611)
Adjusted interest income$57,667 $3,414 $1,228 $62,309 
GAAP interest expense$(36,221)$(30)$(2,312)$(38,563)
Remove interest expense from:
Consolidated SLST CDOs6,611 — — 6,611 
Adjusted interest expense$(29,610)$(30)$(2,312)$(31,952)
Adjusted net interest income (1)
$28,057 $3,384 $(1,084)$30,357 

June 30, 2022
Single-FamilyMulti-FamilyCorporate/OtherTotal
GAAP interest income
$62,468 $3,258 $2,294 $68,020 
GAAP interest expense(26,472)(111)(2,157)(28,740)
GAAP total net interest income$35,996 $3,147 $137 $39,280 
GAAP interest income$62,468 $3,258 $2,294 $68,020 
Remove interest expense from:
Consolidated SLST CDOs(6,208)— — (6,208)
Adjusted interest income$56,260 $3,258 $2,294 $61,812 
GAAP interest expense$(26,472)$(111)$(2,157)$(28,740)
Remove interest expense from:
Consolidated SLST CDOs6,208 — — 6,208 
Adjusted interest expense$(20,264)$(111)$(2,157)$(22,532)
Adjusted net interest income (1)
$35,996 $3,147 $137 $39,280 


March 31, 2022
Single-FamilyMulti-FamilyCorporate/OtherTotal
GAAP interest income
$52,801 $3,312 $2,388 $58,501 
GAAP interest expense(18,953)(12)(2,500)(21,465)
GAAP total net interest income$33,848 $3,300 $(112)$37,036 
GAAP interest income$52,801 $3,312 $2,388 $58,501 
Remove interest expense from:
Consolidated SLST CDOs(5,978)— — (5,978)
Adjusted interest income$46,823 $3,312 $2,388 $52,523 
GAAP interest expense$(18,953)$(12)$(2,500)$(21,465)
Remove interest expense from:
Consolidated SLST CDOs5,978 — — 5,978 
Adjusted interest expense$(12,975)$(12)$(2,500)$(15,487)
Adjusted net interest income (1)
$33,848 $3,300 $(112)$37,036 

December 31, 2021
Single-FamilyMulti-FamilyCorporate/OtherTotal
GAAP interest income
$46,837 $3,767 $1,714 $52,318 
GAAP interest expense(14,596)— (4,872)(19,468)
GAAP total net interest income$32,241 $3,767 $(3,158)$32,850 
GAAP interest income$46,837 $3,767 $1,714 $52,318 
Remove interest expense from:
Consolidated SLST CDOs(6,764)— — (6,764)
Adjusted interest income$40,073 $3,767 $1,714 $45,554 
GAAP interest expense$(14,596)$— $(4,872)$(19,468)
Remove interest expense from:
Consolidated SLST CDOs6,764 — — 6,764 
Adjusted interest expense$(7,832)$— $(4,872)$(12,704)
Adjusted net interest income (1)
$32,241 $3,767 $(3,158)$32,850 

(1)Adjusted net interest income is calculated by subtracting adjusted interest expense from adjusted interest income.

Undepreciated (Loss) Earnings

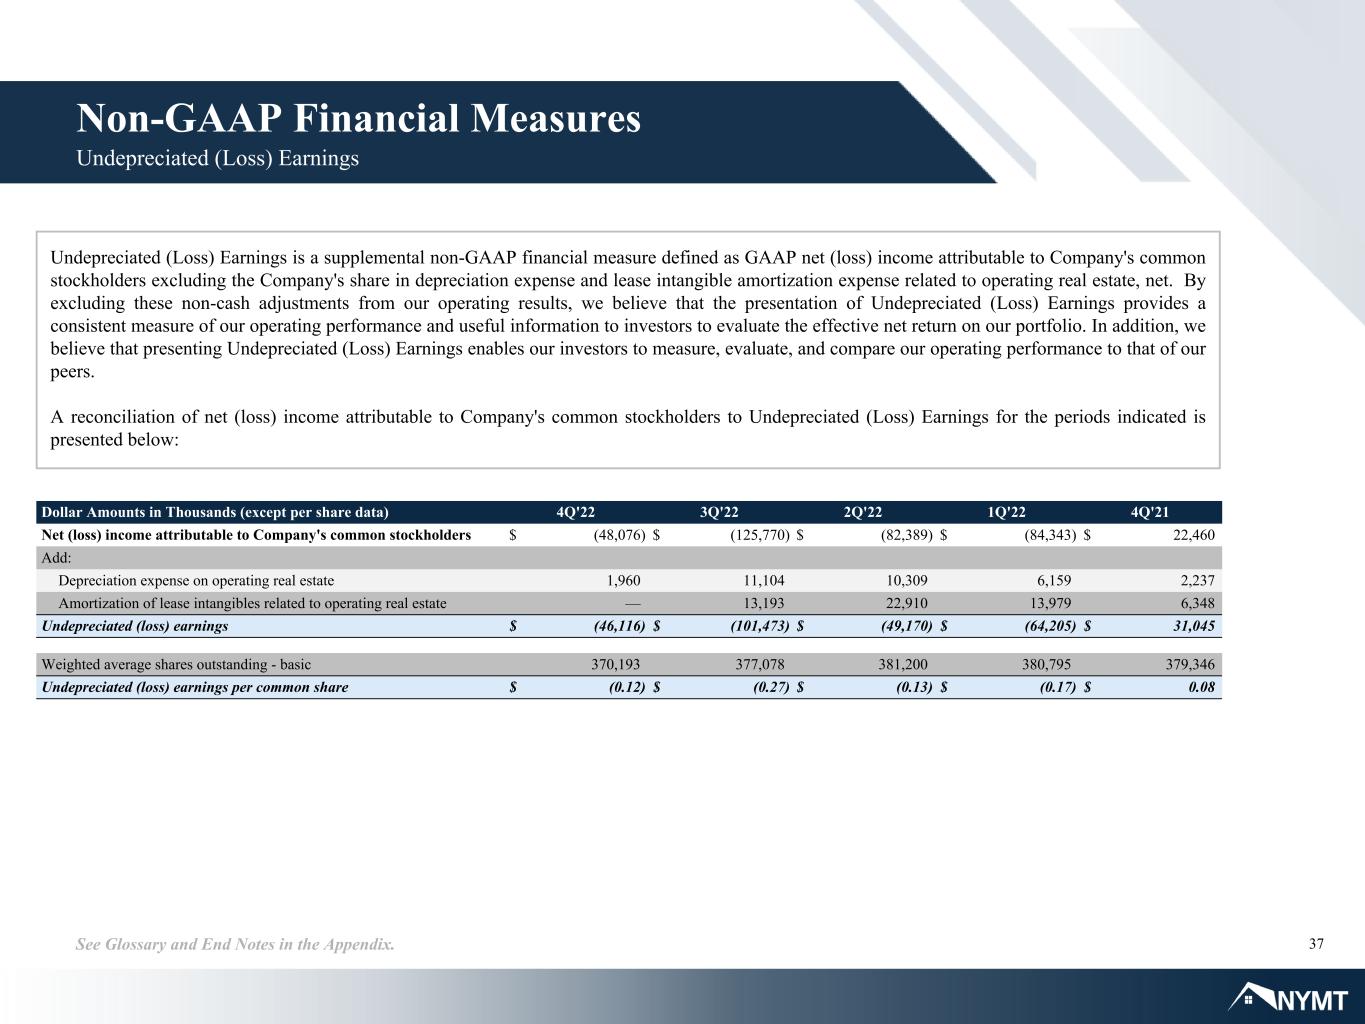
Undepreciated (loss) earnings is a supplemental non-GAAP financial measure defined as GAAP net (loss) income attributable to Company's common stockholders excluding the Company's share in depreciation expense and lease intangible amortization expense related to operating real estate, net. By excluding these non-cash adjustments from our operating results, we believe that the presentation of undepreciated (loss) earnings provides a consistent measure of our operating performance and useful information to investors to evaluate the effective net return on our portfolio. In addition, we believe that presenting undepreciated (loss) earnings enables our investors to measure, evaluate, and compare our operating performance to that of our peers.


A reconciliation of net (loss) income attributable to Company's common stockholders to undepreciated (loss) earnings for the respective periods ended is presented below (amounts in thousands, except per share data):
For the Three Months Ended
December 31, 2022September 30, 2022June 30, 2022March 31, 2022December 31, 2021
Net (loss) income attributable to Company's common stockholders$(48,076)$(125,770)$(82,389)$(84,343)$22,460 
Add:
Depreciation expense on operating real estate1,960 11,104 10,309 6,159 2,237 
Amortization of lease intangibles related to operating real estate— 13,193 22,910 13,979 6,348 
Undepreciated (loss) earnings$(46,116)$(101,473)$(49,170)$(64,205)$31,045 
Weighted average shares outstanding - basic370,193 377,078 381,200 380,795 379,346 
Undepreciated (loss) earnings per common share$(0.12)$(0.27)$(0.13)$(0.17)$0.08 


Adjusted Book Value Per Common Share

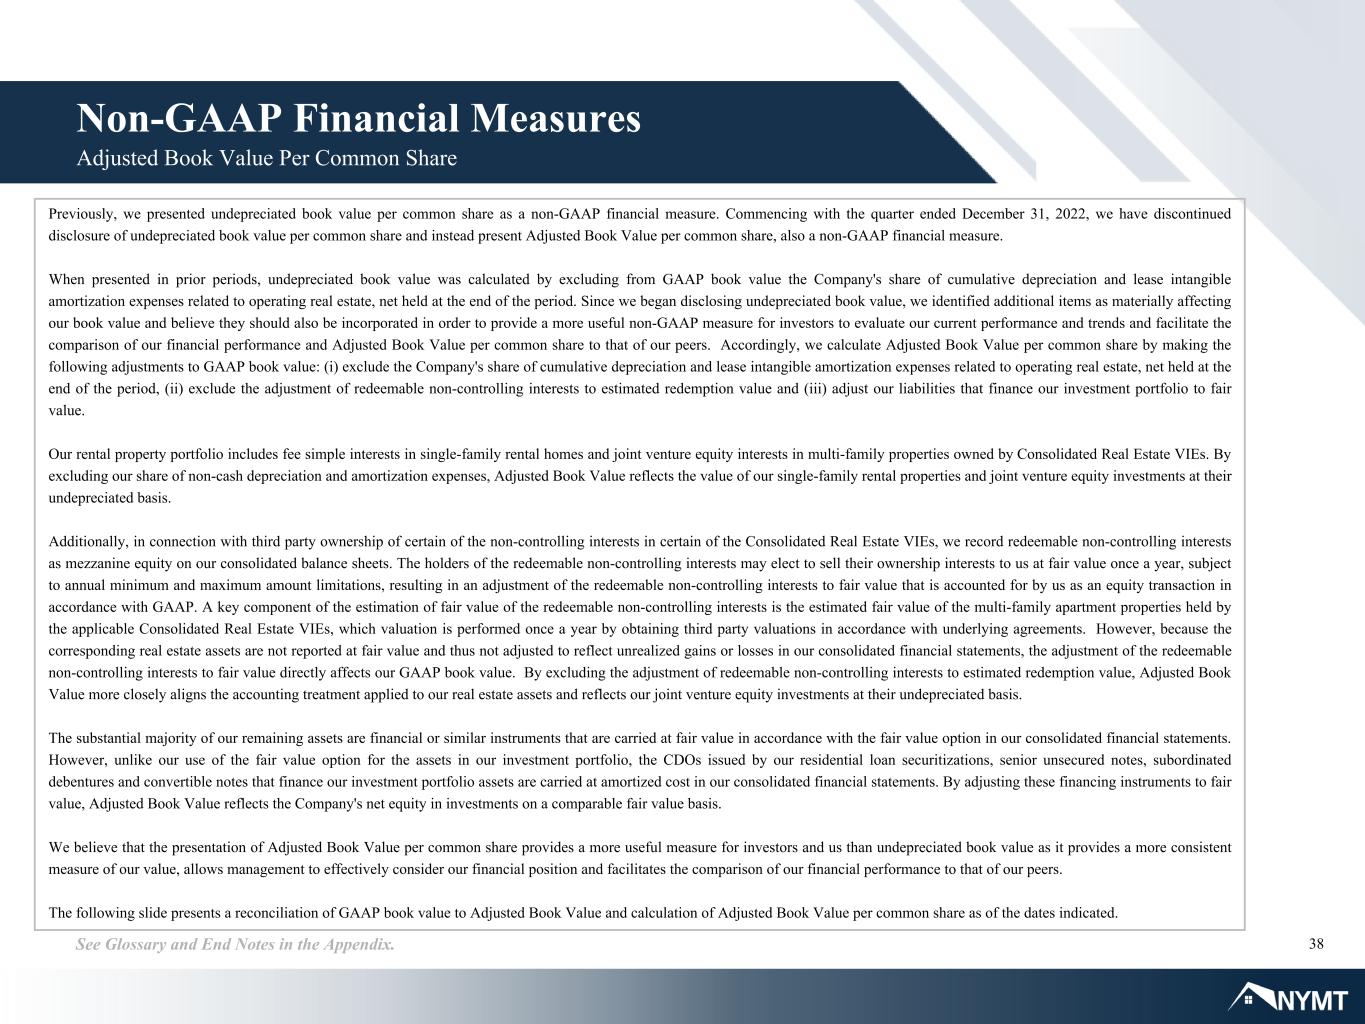
Previously, we presented undepreciated book value per common share as a non-GAAP financial measure. Commencing with the quarter ended December 31, 2022, we have discontinued disclosure of undepreciated book value per common share and instead present adjusted book value per common share, also a non-GAAP financial measure.

When presented in prior periods, undepreciated book value was calculated by excluding from GAAP book value the Company's share of cumulative depreciation and lease intangible amortization expenses related to operating real estate, net held at the end of the period. Since we began disclosing undepreciated book value, we identified additional items as materially affecting our book value and believe they should also be incorporated in order to provide a more useful non-GAAP measure for investors to evaluate our current performance and trends and facilitate the comparison of our financial performance and adjusted book value per common share to that of our peers. Accordingly, we calculate adjusted book value per common share by making the following adjustments to GAAP book value: (i) exclude the Company's share of cumulative depreciation and lease intangible amortization expenses related to operating real estate, net held at the end of the period, (ii) exclude the adjustment of redeemable non-controlling interests to estimated redemption value and (iii) adjust our liabilities that finance our investment portfolio to fair value.

Our rental property portfolio includes fee simple interests in single-family rental homes and joint venture equity interests in multi-family properties owned by Consolidated Real Estate VIEs. By excluding our share of non-cash depreciation and amortization expenses, adjusted book value reflects the value of our single-family rental properties and joint venture equity investments at their undepreciated basis.


Additionally, in connection with third party ownership of certain of the non-controlling interests in certain of the Consolidated Real Estate VIEs, we record redeemable non-controlling interests as mezzanine equity on our consolidated balance sheets. The holders of the redeemable non-controlling interests may elect to sell their ownership interests to us at fair value once a year, subject to annual minimum and maximum amount limitations, resulting in an adjustment of the redeemable non-controlling interests to fair value that is accounted for by us as an equity transaction in accordance with GAAP. A key component of the estimation of fair value of the redeemable non-controlling interests is the estimated fair value of the multi-family apartment properties held by the applicable Consolidated Real Estate VIEs, which valuation is performed once a year by obtaining third party valuations in accordance with underlying agreements. However, because the corresponding real estate assets are not reported at fair value and thus not adjusted to reflect unrealized gains or losses in our consolidated financial statements, the adjustment of the redeemable non-controlling interests to fair value directly affects our GAAP book value. By excluding the adjustment of redeemable non-controlling interests to estimated redemption value, adjusted book value more closely aligns the accounting treatment applied to our real estate assets and reflects our joint venture equity investments at their undepreciated basis.

The substantial majority of our remaining assets are financial or similar instruments that are carried at fair value in accordance with the fair value option in our consolidated financial statements. However, unlike our use of the fair value option for the assets in our investment portfolio, the CDOs issued by our residential loan securitizations, senior unsecured notes, subordinated debentures and convertible notes that finance our investment portfolio assets are carried at amortized cost in our consolidated financial statements. By adjusting these financing instruments to fair value, adjusted book value reflects the Company's net equity in investments on a comparable fair value basis.

We believe that the presentation of adjusted book value per common share provides a more useful measure for investors and us than undepreciated book value as it provides a more consistent measure of our value, allows management to effectively consider our financial position and facilitates the comparison of our financial performance to that of our peers.

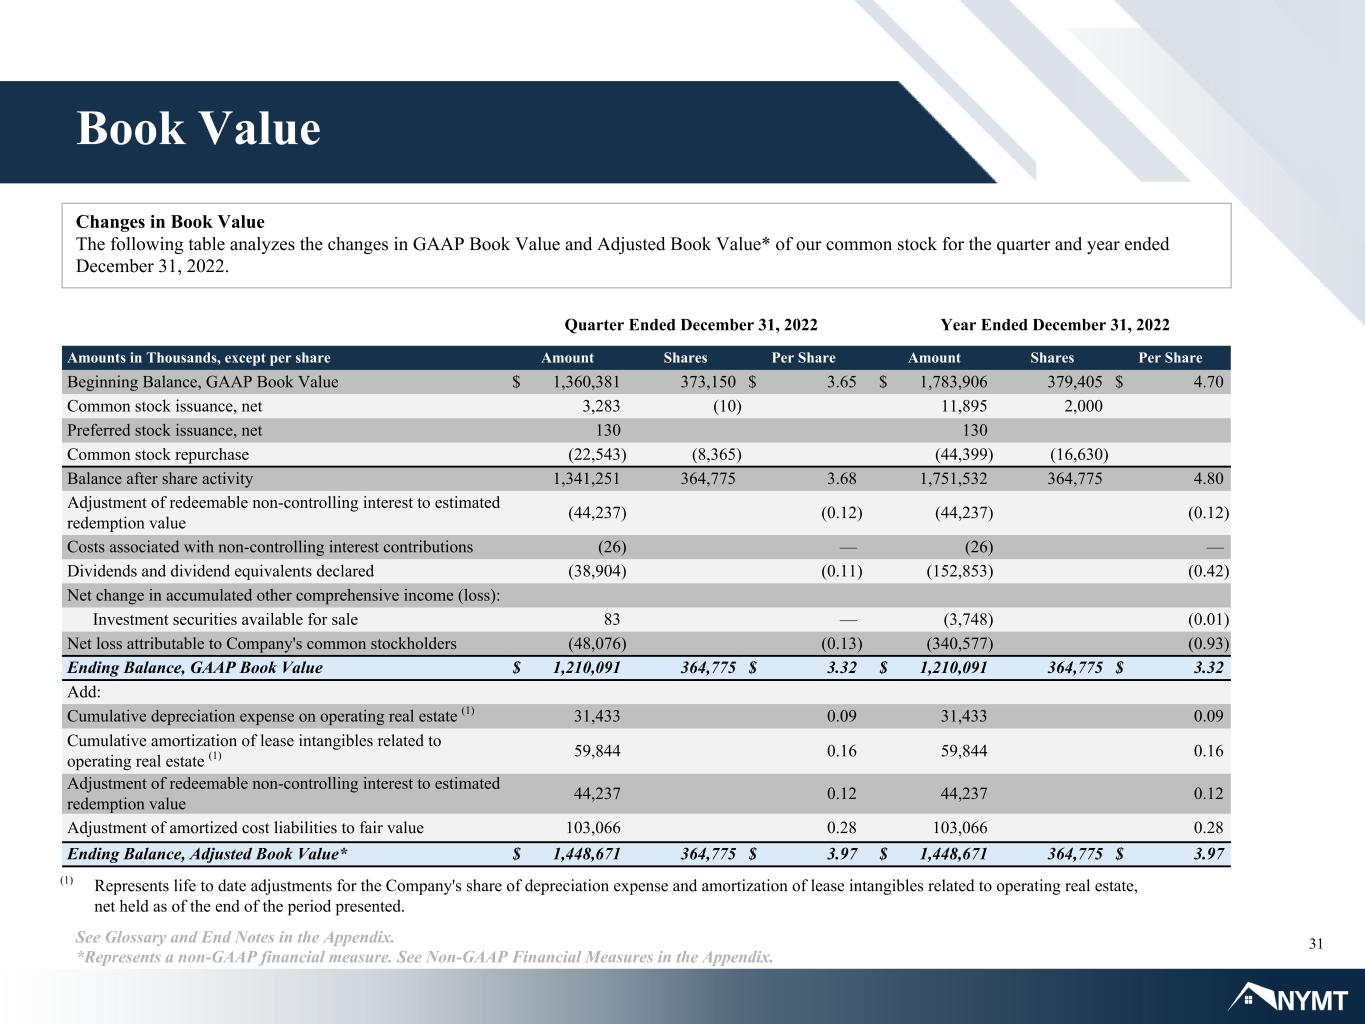
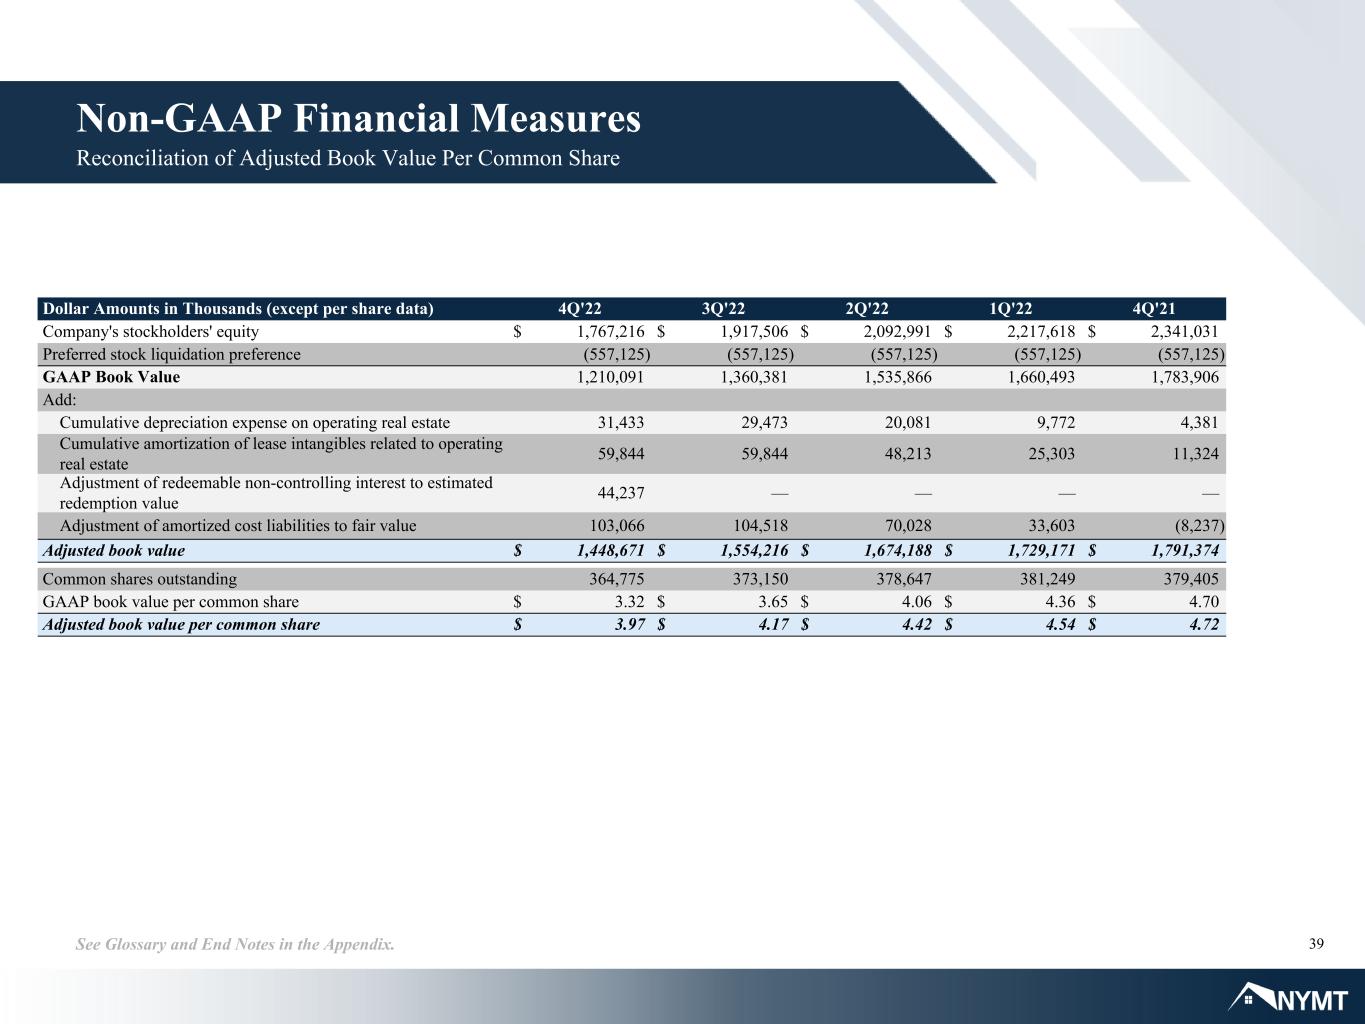
A reconciliation of GAAP book value to adjusted book value and calculation of adjusted book value per common share as of the dates indicated is presented below (amounts in thousands, except per share data):

December 31, 2022September 30, 2022June 30, 2022March 31, 2022December 31, 2021
Company's stockholders' equity$1,767,216 $1,917,506 $2,092,991 $2,217,618 $2,341,031 
Preferred stock liquidation preference(557,125)(557,125)(557,125)(557,125)(557,125)
GAAP book value1,210,091 1,360,381 1,535,866 1,660,493 1,783,906 
Add:
Cumulative depreciation expense on operating real estate31,433 29,473 20,081 9,772 4,381 
Cumulative amortization of lease intangibles related to operating real estate59,844 59,844 48,213 25,303 11,324 
Adjustment of redeemable non-controlling interest to estimated redemption value44,237 — — — — 
Adjustment of amortized cost liabilities to fair value103,066 104,518 70,028 33,603 (8,237)
Adjusted book value$1,448,671 $1,554,216 $1,674,188 $1,729,171 $1,791,374 
Common shares outstanding364,775 373,150 378,647 381,249 379,405 
GAAP book value per common share (1)
$3.32 $3.65 $4.06 $4.36 $4.70 
Adjusted book value per common share (2)
$3.97 $4.17 $4.42 $4.54 $4.72 

(1)GAAP book value per common share is calculated using the GAAP book value and the common shares outstanding for the periods indicated.
(2)Adjusted book value per common share is calculated using the adjusted book value and the common shares outstanding for the periods indicated.


Equity Investments in Multi-Family Entities

We own joint venture equity investments in entities that own multi-family properties. We determined that these joint venture entities are VIEs and that we are the primary beneficiary of all but two of these VIEs, resulting in consolidation of the VIEs where we are the primary beneficiary, including their assets, liabilities, income and expenses, in our consolidated financial statements with non-controlling interests for the third-party ownership of the joint ventures' membership interests. With respect to the two additional joint venture equity investments for which we determined that we are not the primary beneficiary, we record our equity investments at fair value.

In September 2022, the Company announced a repositioning of its business through the opportunistic disposition over time of the Company's joint venture equity investments in multi-family properties and reallocation of its capital away from such assets to its targeted assets. Accordingly, the Company determined that certain joint venture equity investments met the criteria to be classified as held for sale and transferred the assets and liabilities of the respective Consolidated VIEs and its unconsolidated multi-family joint venture equity investments to assets and liabilities of disposal group held for sale.

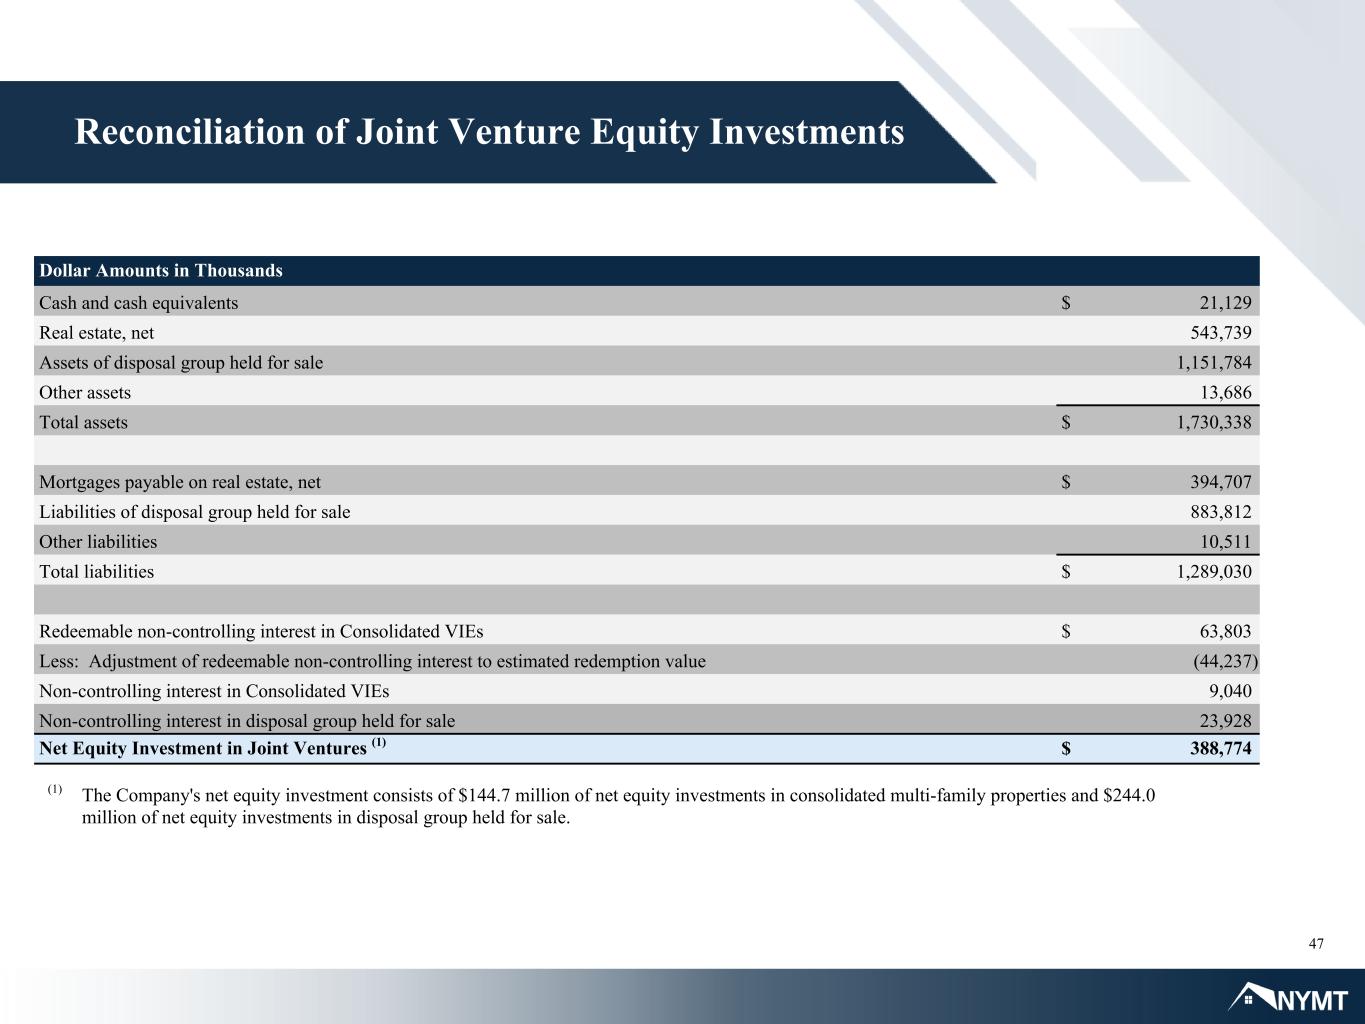
A reconciliation of our net equity investments in consolidated multi-family properties and disposal group held for sale to our consolidated financial statements as of December 31, 2022 is shown below (dollar amounts in thousands):

Cash and cash equivalents$21,129 
Real estate, net543,739 
Assets of disposal group held for sale1,151,784 
Other assets13,686 
Total assets$1,730,338 
Mortgages payable on real estate, net$394,707 
Liabilities of disposal group held for sale883,812 
Other liabilities10,511 
Total liabilities$1,289,030 
Redeemable non-controlling interest in Consolidated VIEs$63,803 
Less: Adjustment of redeemable non-controlling interest to estimated redemption value(44,237)
Non-controlling interest in Consolidated VIEs9,040 
Non-controlling interest in disposal group held for sale23,928 
Net equity investment (1)
$388,774 

(1)The Company's net equity investment as of December 31, 2022 consists of $144.7 million of net equity investments in consolidated multi-family properties and $244.0 million of net equity investments in disposal group held for sale.

    

New York Mortgage Trust 2022 Fourth Quarter Financial Summary


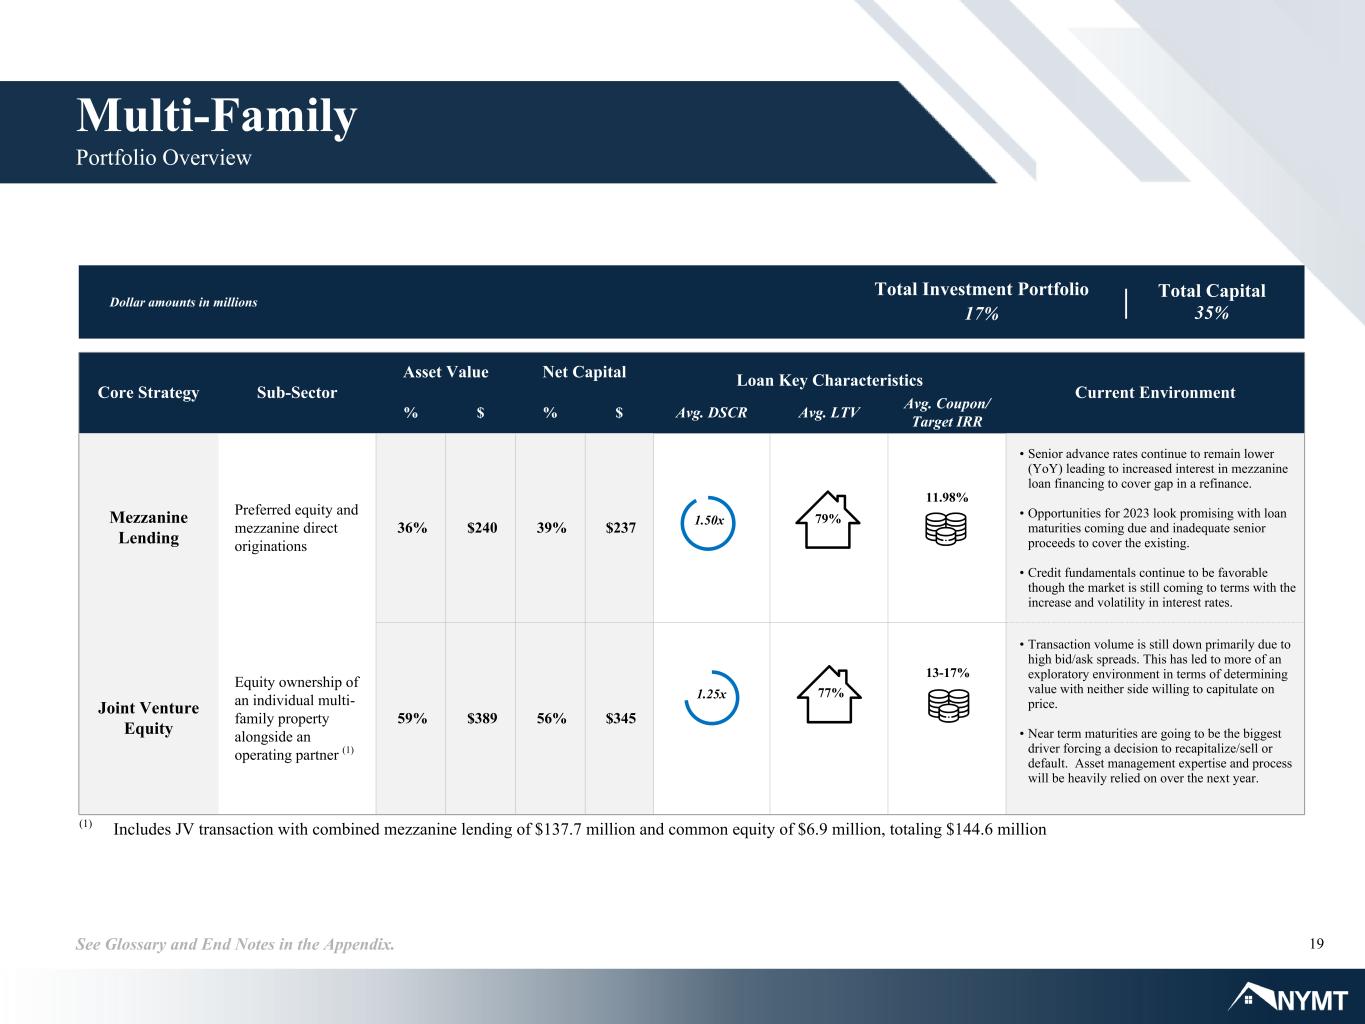
2See Glossary and End Notes in the Appendix. This presentation contains forward-looking statements within the meaning of the safe harbor provisions of the Private Securities Litigation Reform Act of 1995. Forward-looking statements are based on our beliefs, assumptions and expectations of our future performance, taking into account all information currently available to us. These beliefs, assumptions and expectations are subject to risks and uncertainties and can change as a result of many possible events or factors, not all of which are known to us. If a change occurs, our business, financial condition, liquidity and results of operations may vary materially from those expressed or implied in our forward-looking statements. The following factors are examples of those that could cause actual results to vary from our forward-looking statements: changes in our business and investment strategy; inflation and changes in interest rates and the fair market value of our assets, including negative changes resulting in margin calls relating to the financing of our assets; changes in credit spreads; changes in the long-term credit ratings of the U.S., Fannie Mae, Freddie Mac, and Ginnie Mae; general volatility of the markets in which we invest; changes in prepayment rates on the loans we own or that underlie our investment securities; increased rates of default, delinquency or vacancy and/or decreased recovery rates on or at our assets; our ability to identify and acquire our targeted assets, including assets in our investment pipeline; our ability to dispose of assets from time to time on terms favorable to us, including the disposition over time of our joint venture equity investments; changes in our relationships with our financing counterparties and our ability to borrow to finance our assets and the terms thereof; changes in our relationships with and/or the performance of our operating partners; our ability to predict and control costs; changes in laws, regulations or policies affecting our business, including actions that may be taken to contain or address the impact of COVID-19 and variants; our ability to make distributions to our stockholders in the future; our ability to maintain our qualification as a REIT for federal tax purposes; our ability to maintain our exemption from registration under the Investment Company Act of 1940, as amended; and the risks associated with investing in real estate assets, including changes in business conditions and the general economy, the availability of investment opportunities and the conditions in the market for Agency RMBS, non-Agency RMBS, ABS and CMBS securities, residential loans, structured multi-family investments and other mortgage-, residential housing- and credit-related assets. These and other risks, uncertainties and factors, including the risk factors described in our most recent Annual Report on Form 10-K, as updated and supplemented from time to time, and our subsequent Quarterly Reports on Form 10-Q and other information that we file from time to time with the U.S. Securities and Exchange Commission (“SEC”) under the Securities Exchange Act of 1934, as amended (the “Exchange Act”), could cause our actual results to differ materially from those projected in any forward-looking statements we make. All forward-looking statements speak only as of the date on which they are made. New risks and uncertainties arise over time and it is not possible to predict those events or how they may affect us. Except as required by law, we are not obligated to, and do not intend to, update or revise any forward-looking statements, whether as a result of new information, future events or otherwise. This presentation may not contain all of the information that is important to you. As a result, the information in this presentation should be read together with the information included in our most recent Annual Report on Form 10-K, as updated and supplemented from time to time, and our subsequent Quarterly Reports on Form 10-Q and other information that we file under the Exchange Act. References to “the Company,” “NYMT,” “we,” “us,” or “our” refer to New York Mortgage Trust, Inc., together with its consolidated subsidiaries, unless we specifically state otherwise or the context indicates otherwise. See glossary of defined terms and detailed end notes for additional important disclosures included at the end of this presentation. Fourth quarter and full year 2022 Financial Tables and related information can be viewed in the Company’s press release dated February 22, 2023 posted on the Company’s website at http://www.nymtrust.com under the “Investors — Events & Presentations” section. Forward Looking Statements


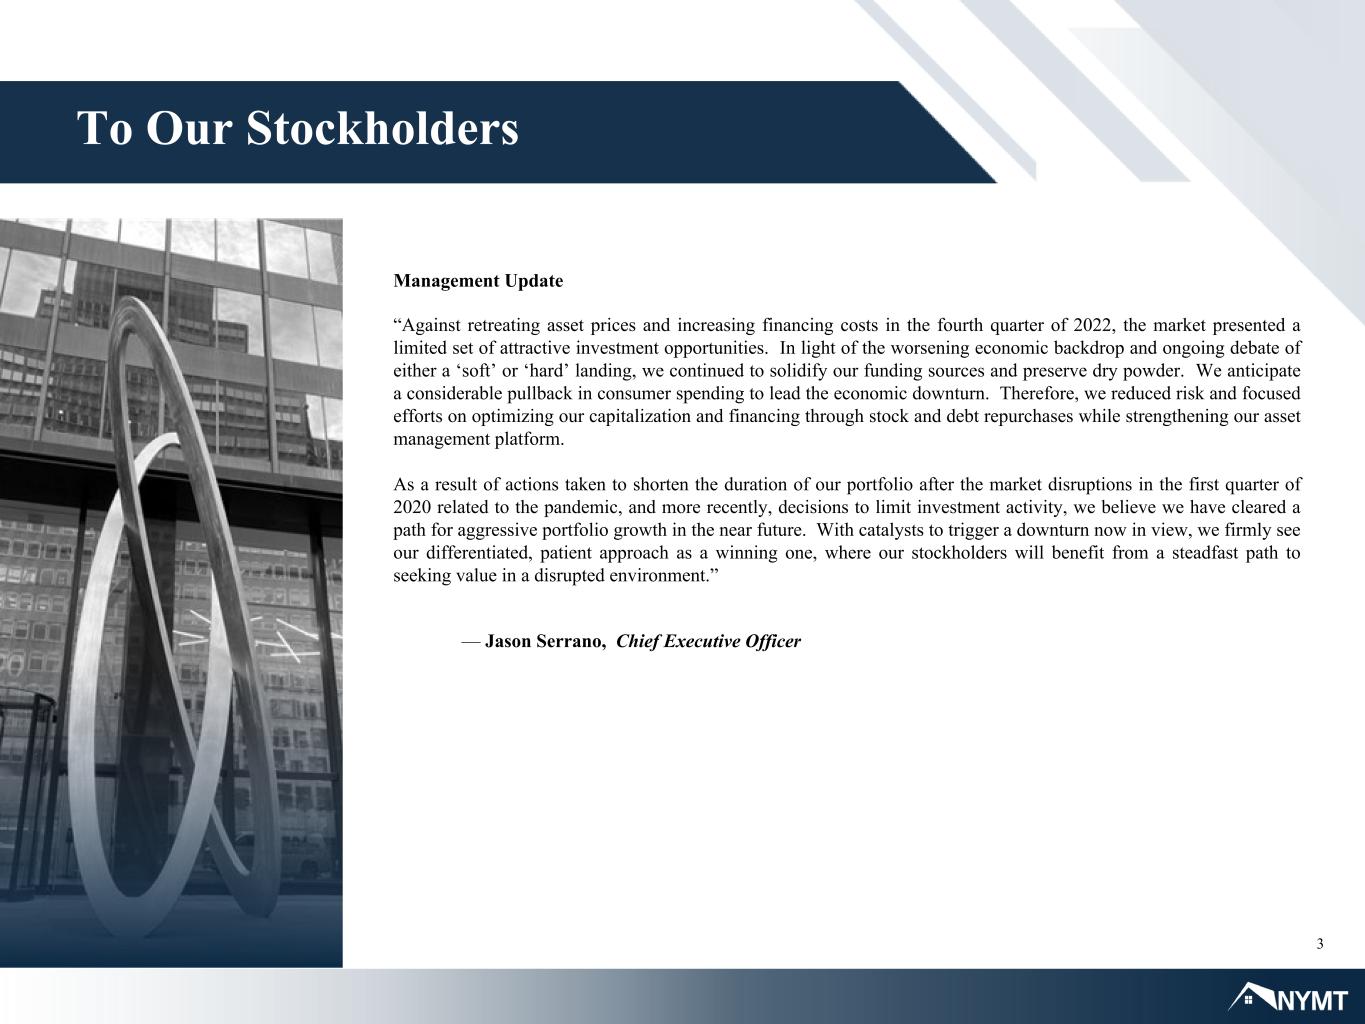
3 To Our Stockholders Management Update “Against retreating asset prices and increasing financing costs in the fourth quarter of 2022, the market presented a limited set of attractive investment opportunities. In light of the worsening economic backdrop and ongoing debate of either a ‘soft’ or ‘hard’ landing, we continued to solidify our funding sources and preserve dry powder. We anticipate a considerable pullback in consumer spending to lead the economic downturn. Therefore, we reduced risk and focused efforts on optimizing our capitalization and financing through stock and debt repurchases while strengthening our asset management platform. As a result of actions taken to shorten the duration of our portfolio after the market disruptions in the first quarter of 2020 related to the pandemic, and more recently, decisions to limit investment activity, we believe we have cleared a path for aggressive portfolio growth in the near future. With catalysts to trigger a downturn now in view, we firmly see our differentiated, patient approach as a winning one, where our stockholders will benefit from a steadfast path to seeking value in a disrupted environment.” — Jason Serrano, Chief Executive Officer


Company Overview Financial Summary Market & Strategy Update Quarterly Financial Information Appendix Non-GAAP Financial Measures Glossary End Notes Capital Allocation Reconciliation of Joint Venture Equity Investments Table of Contents


Company Overview


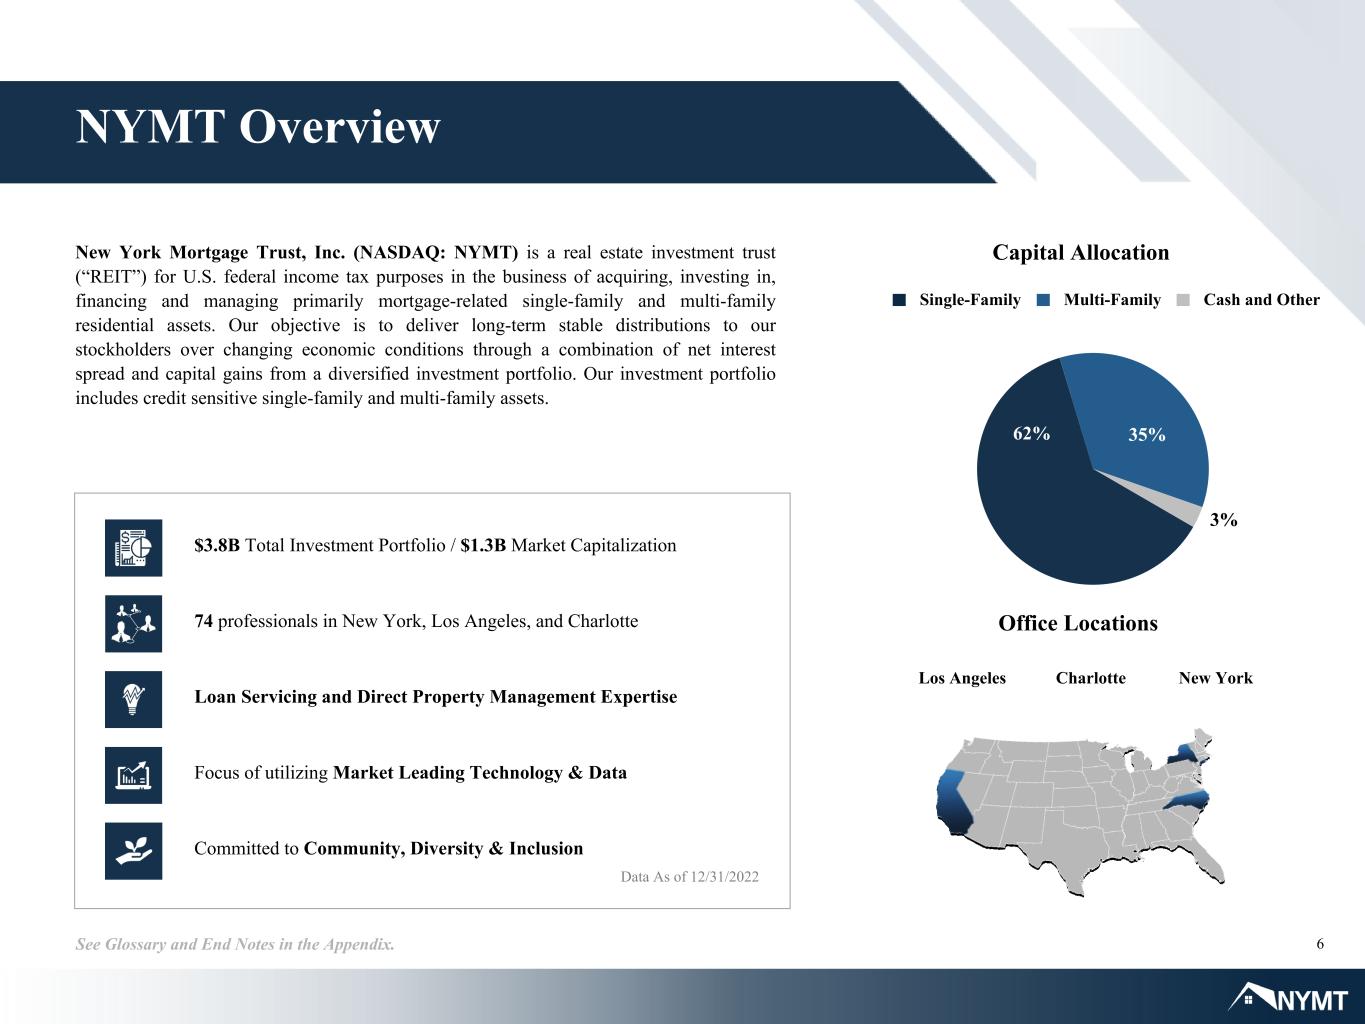
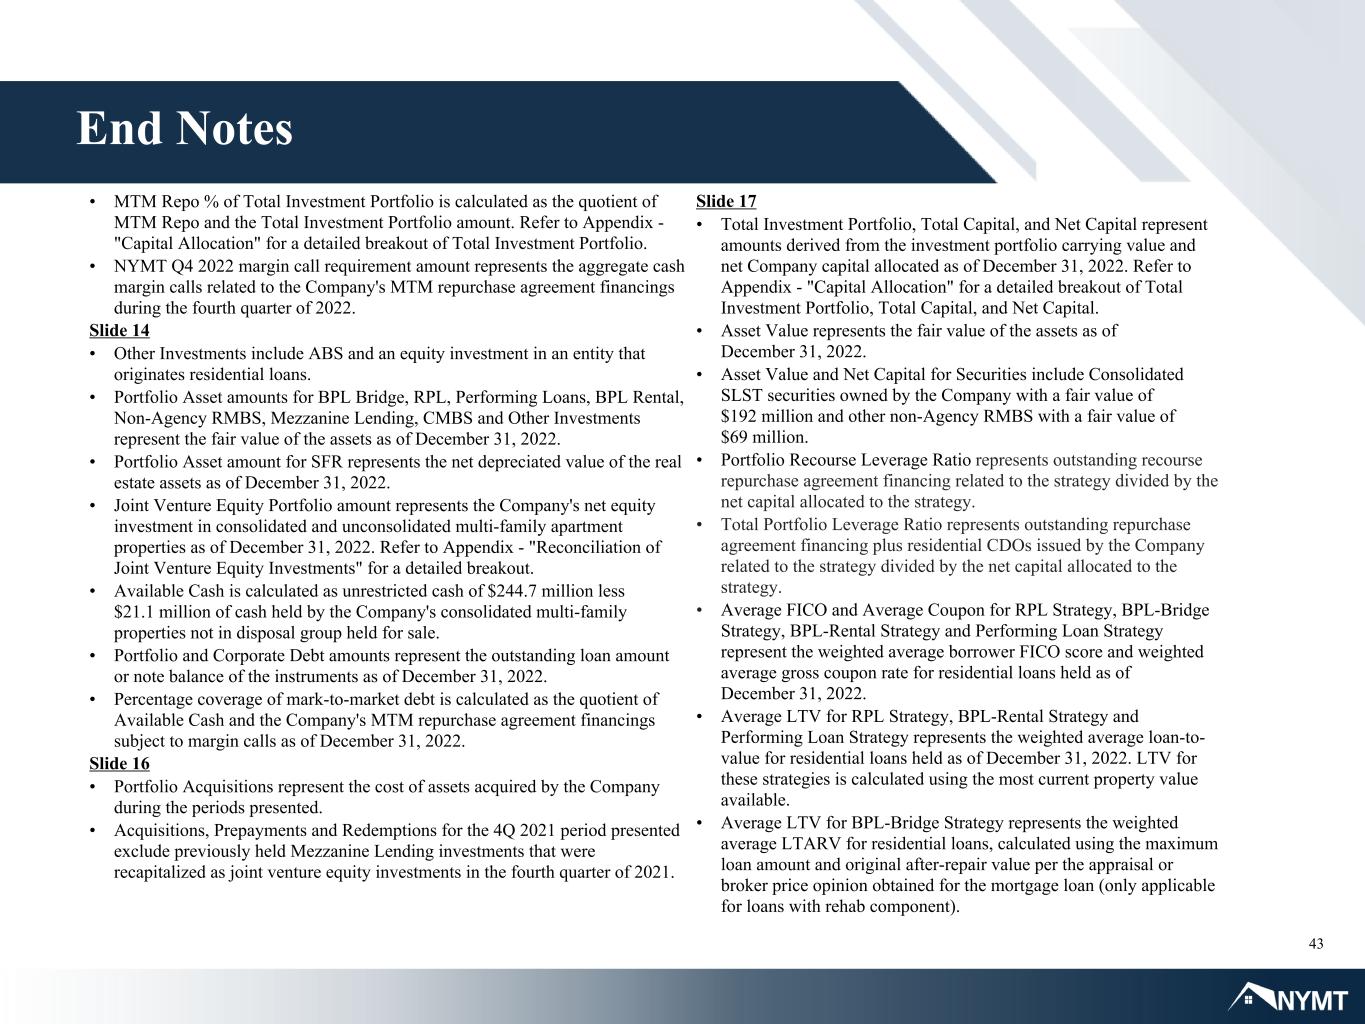
6See Glossary and End Notes in the Appendix. New York Mortgage Trust, Inc. (NASDAQ: NYMT) is a real estate investment trust (“REIT”) for U.S. federal income tax purposes in the business of acquiring, investing in, financing and managing primarily mortgage-related single-family and multi-family residential assets. Our objective is to deliver long-term stable distributions to our stockholders over changing economic conditions through a combination of net interest spread and capital gains from a diversified investment portfolio. Our investment portfolio includes credit sensitive single-family and multi-family assets. Data As of 12/31/2022 74 professionals in New York, Los Angeles, and Charlotte Focus of utilizing Market Leading Technology & Data Committed to Community, Diversity & Inclusion Loan Servicing and Direct Property Management Expertise $3.8B Total Investment Portfolio / $1.3B Market Capitalization NYMT Overview Charlotte New YorkLos Angeles Office Locations Capital Allocation Single-Family Multi-Family Cash and Other 62% 35% 3%


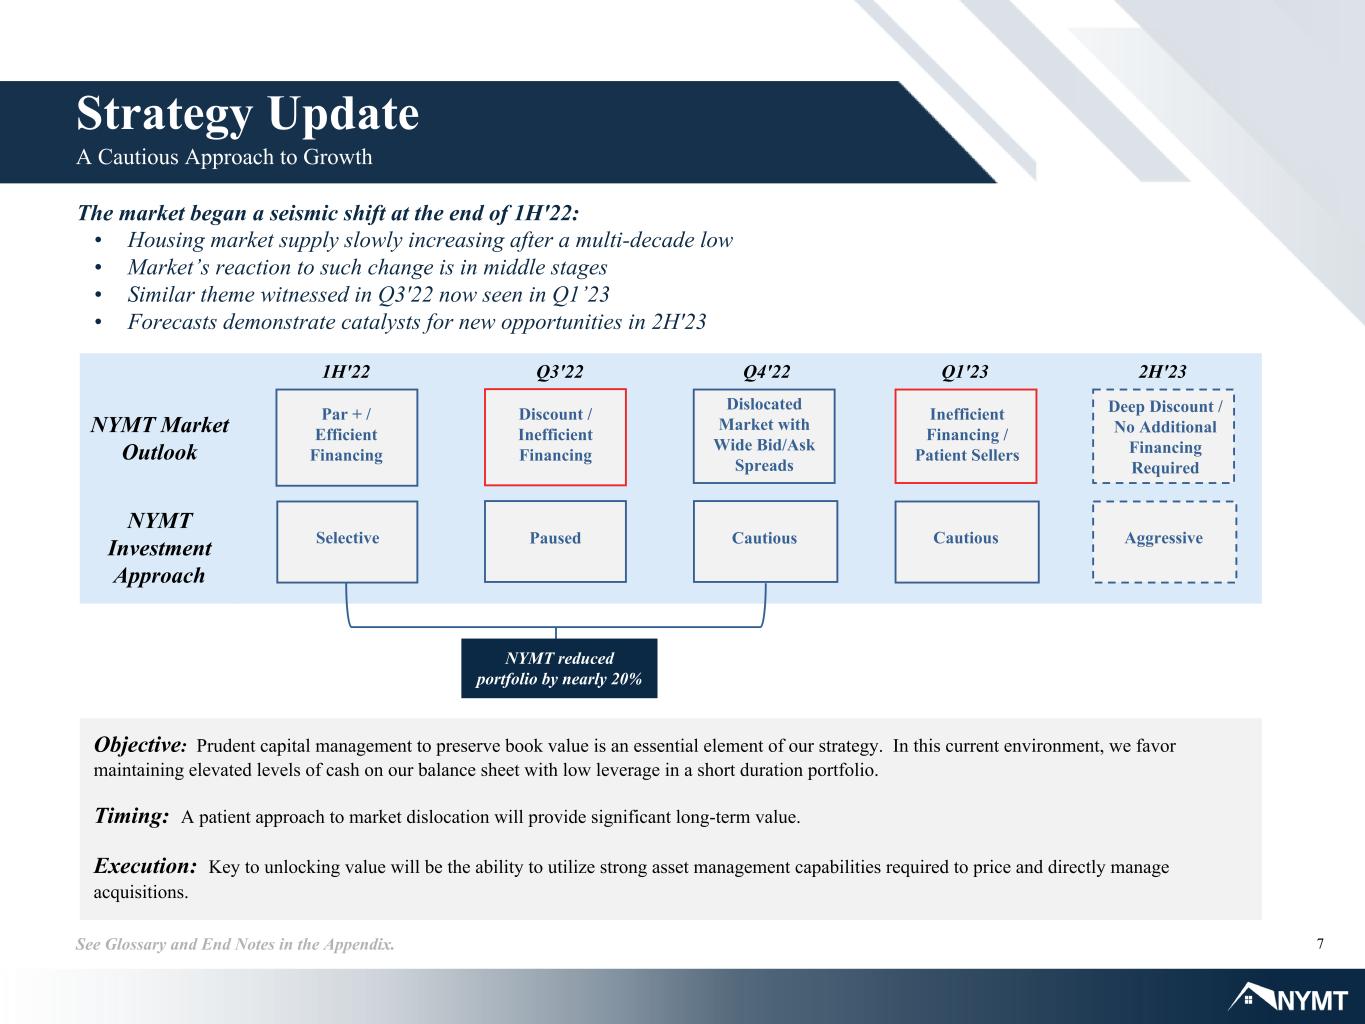
7See Glossary and End Notes in the Appendix. Strategy Update A Cautious Approach to Growth The market began a seismic shift at the end of 1H'22: • Housing market supply slowly increasing after a multi-decade low • Market’s reaction to such change is in middle stages • Similar theme witnessed in Q3'22 now seen in Q1’23 • Forecasts demonstrate catalysts for new opportunities in 2H'23 Objective: Prudent capital management to preserve book value is an essential element of our strategy. In this current environment, we favor maintaining elevated levels of cash on our balance sheet with low leverage in a short duration portfolio. Timing: A patient approach to market dislocation will provide significant long-term value. Execution: Key to unlocking value will be the ability to utilize strong asset management capabilities required to price and directly manage acquisitions. 1H'22 Q3'22 Q4'22 Q1'23 2H'23 NYMT Market Outlook NYMT Investment Approach Par + / Efficient Financing Discount / Inefficient Financing Selective Dislocated Market with Wide Bid/Ask Spreads Paused Cautious Inefficient Financing / Patient Sellers Cautious Deep Discount / No Additional Financing Required Aggressive NYMT reduced portfolio by nearly 20%


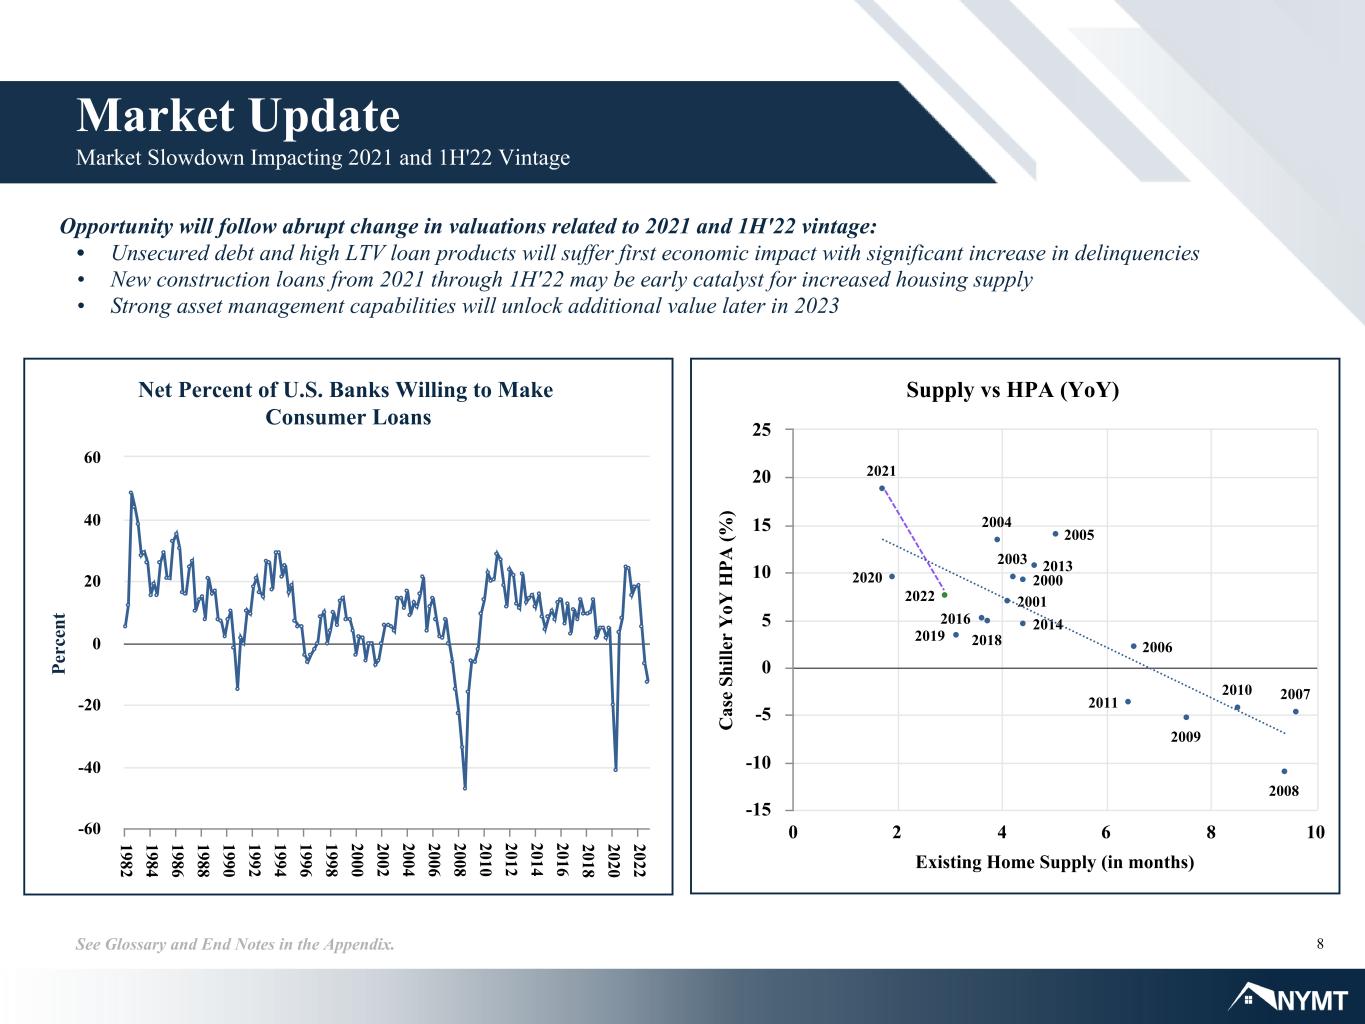
8See Glossary and End Notes in the Appendix. As of 9/30/2020 Market Update Market Slowdown Impacting 2021 and 1H'22 Vintage Existing Home Supply (in months) C as e Sh ill er Y oY H PA (% ) Supply vs HPA (YoY) 2022 2021 2020 2019 2018 2016 2014 2013 2011 2010 2009 2008 2007 2006 2005 2004 2003 2001 2000 0 2 4 6 8 10 -15 -10 -5 0 5 10 15 20 25 Pe rc en t Net Percent of U.S. Banks Willing to Make Consumer Loans 1982 1984 1986 1988 1990 1992 1994 1996 1998 2000 2002 2004 2006 2008 2010 2012 2014 2016 2018 2020 2022 -60 -40 -20 0 20 40 60 Opportunity will follow abrupt change in valuations related to 2021 and 1H'22 vintage: • Unsecured debt and high LTV loan products will suffer first economic impact with significant increase in delinquencies • New construction loans from 2021 through 1H'22 may be early catalyst for increased housing supply • Strong asset management capabilities will unlock additional value later in 2023


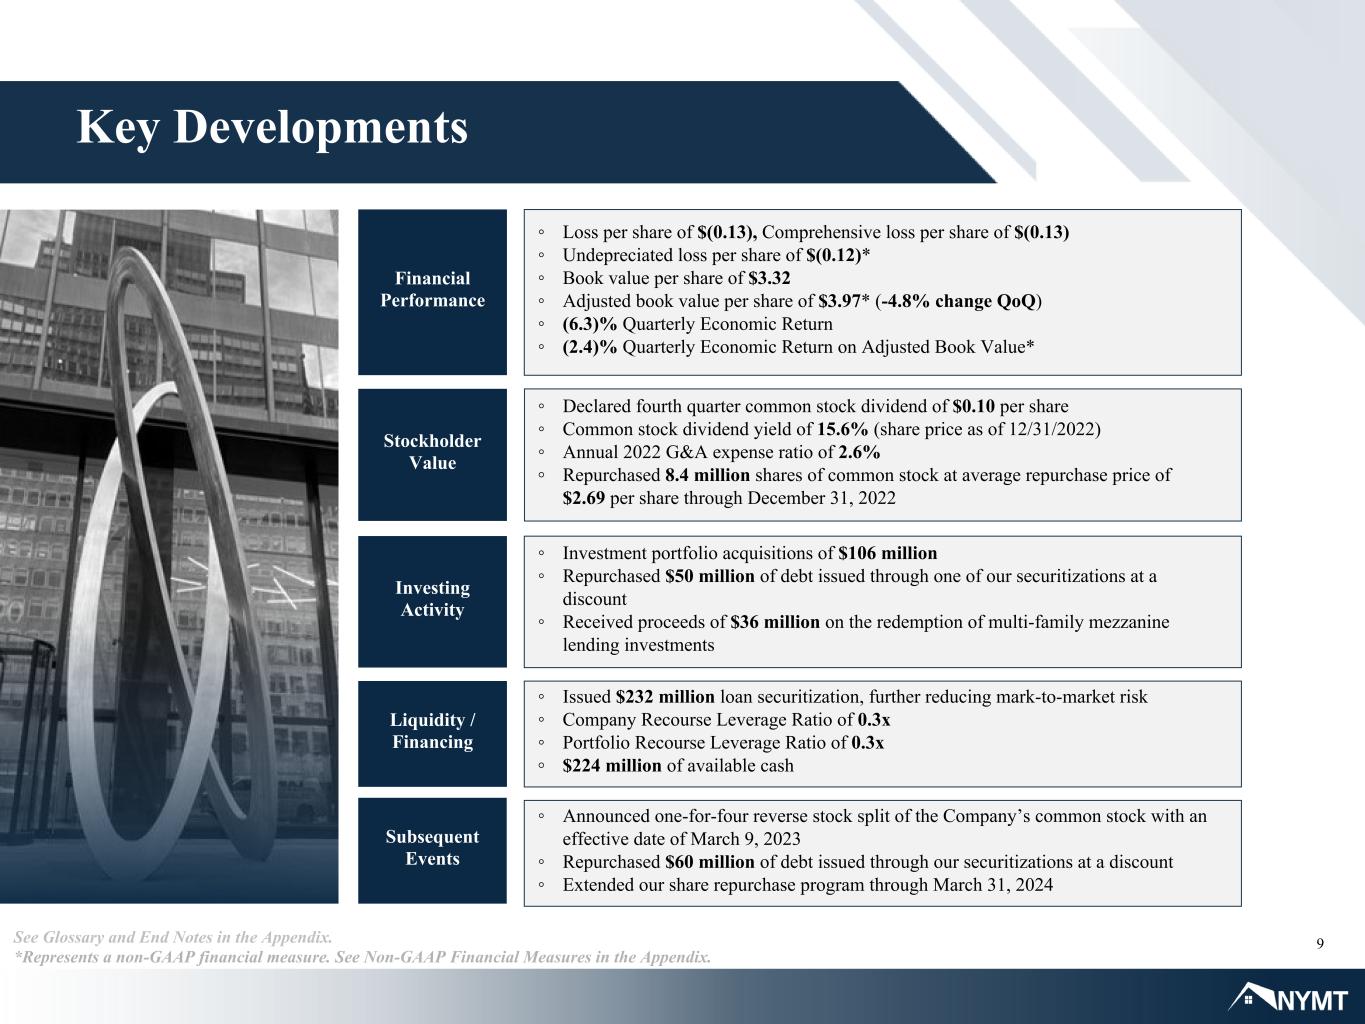
9 Key Developments See Glossary and End Notes in the Appendix. *Represents a non-GAAP financial measure. See Non-GAAP Financial Measures in the Appendix. Financial Performance ◦ Loss per share of $(0.13), Comprehensive loss per share of $(0.13) ◦ Undepreciated loss per share of $(0.12)* ◦ Book value per share of $3.32 ◦ Adjusted book value per share of $3.97* (-4.8% change QoQ) ◦ (6.3)% Quarterly Economic Return ◦ (2.4)% Quarterly Economic Return on Adjusted Book Value* Stockholder Value ◦ Declared fourth quarter common stock dividend of $0.10 per share ◦ Common stock dividend yield of 15.6% (share price as of 12/31/2022) ◦ Annual 2022 G&A expense ratio of 2.6% ◦ Repurchased 8.4 million shares of common stock at average repurchase price of $2.69 per share through December 31, 2022 Liquidity / Financing ◦ Investment portfolio acquisitions of $106 million ◦ Repurchased $50 million of debt issued through one of our securitizations at a discount ◦ Received proceeds of $36 million on the redemption of multi-family mezzanine lending investments ◦ Issued $232 million loan securitization, further reducing mark-to-market risk ◦ Company Recourse Leverage Ratio of 0.3x ◦ Portfolio Recourse Leverage Ratio of 0.3x ◦ $224 million of available cash Investing Activity Subsequent Events ◦ Announced one-for-four reverse stock split of the Company’s common stock with an effective date of March 9, 2023 ◦ Repurchased $60 million of debt issued through our securitizations at a discount ◦ Extended our share repurchase program through March 31, 2024


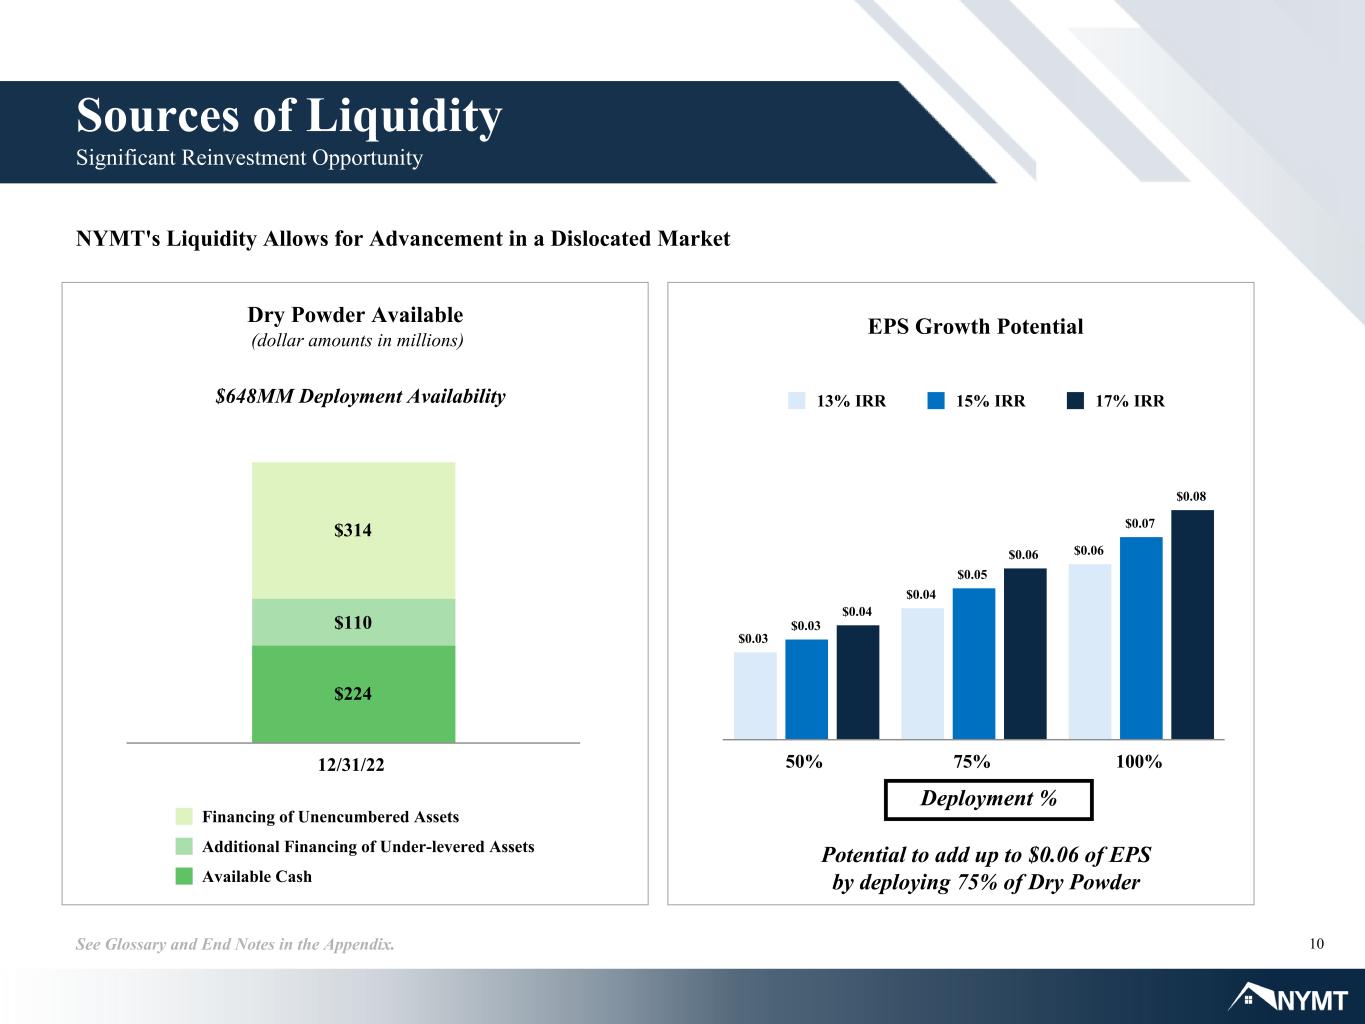
10See Glossary and End Notes in the Appendix. As of 9/30/2020 Sources of Liquidity Significant Reinvestment Opportunity $648MM Deployment Availability Dry Powder Available (dollar amounts in millions) NYMT's Liquidity Allows for Advancement in a Dislocated Market EPS Growth Potential Deployment % $0.03 $0.04 $0.06 $0.03 $0.05 $0.07 $0.04 $0.06 $0.08 13% IRR 15% IRR 17% IRR 50% 75% 100% $224 $110 $314 Financing of Unencumbered Assets Additional Financing of Under-levered Assets Available Cash 12/31/22 Potential to add up to $0.06 of EPS by deploying 75% of Dry Powder


Financial Summary Fourth Quarter 2022


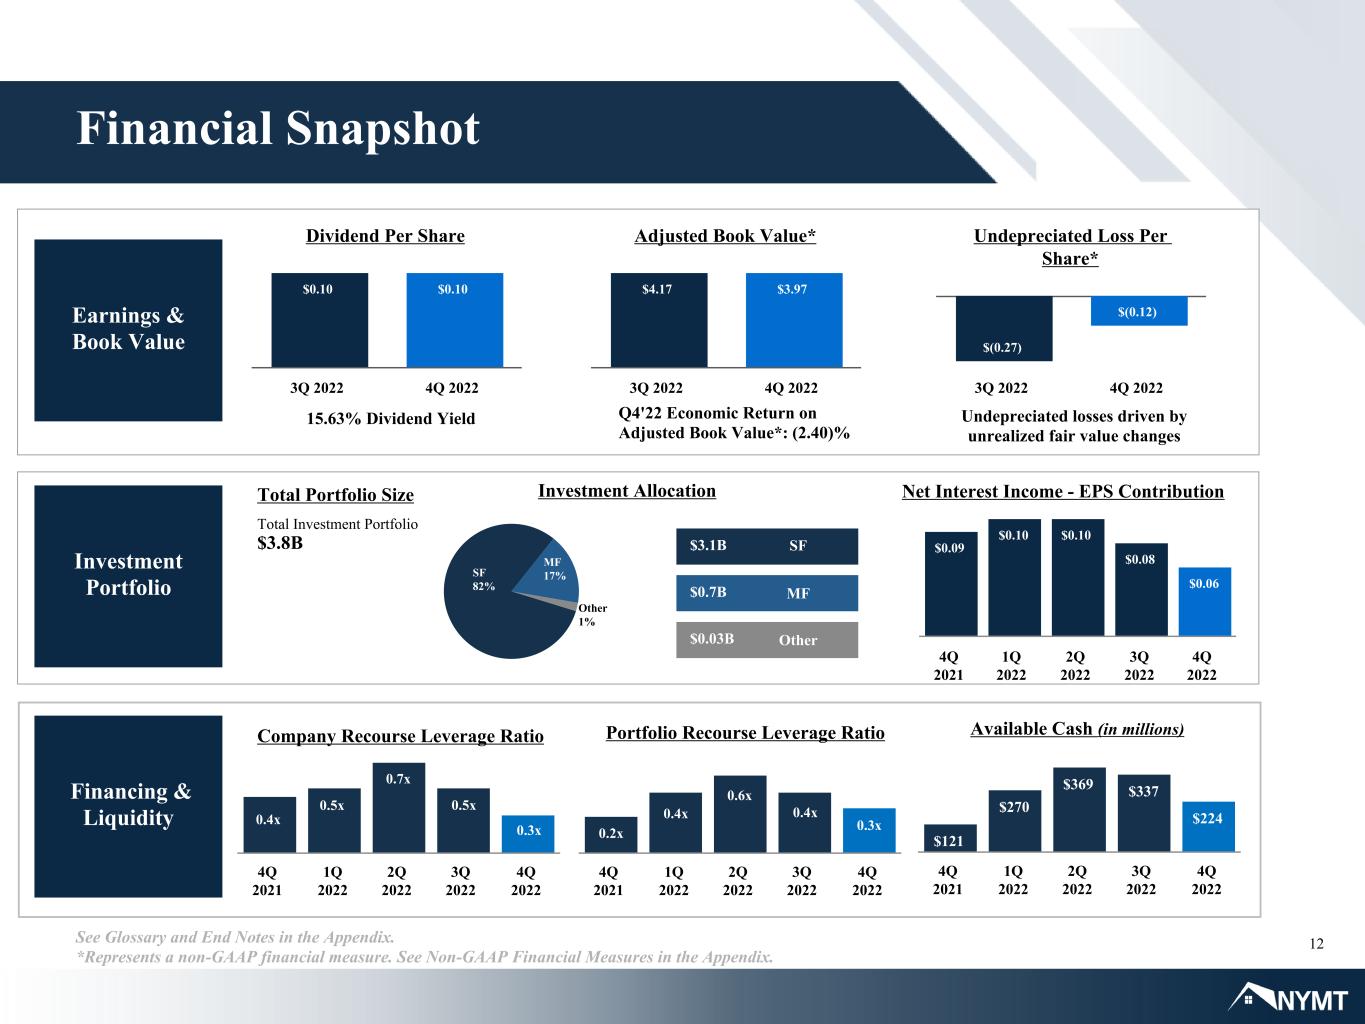
12See Glossary and End Notes in the Appendix. *Represents a non-GAAP financial measure. See Non-GAAP Financial Measures in the Appendix. Financial Snapshot Earnings & Book Value Investment Portfolio Total Portfolio Size Total Investment Portfolio $3.8B Financing & Liquidity Available Cash (in millions)Portfolio Recourse Leverage Ratio $0.03B $0.7B $3.1B Investment Allocation SF Credit 59% MF Credit 25% 0.3x SF 82% MF 17% Other 1% Company Recourse Leverage Ratio 1.5x 0.8x 0.5x 0.4x 0.3x SF MF Other 4Q 2021 1Q 2022 2Q 2022 3Q 2022 4Q 2022 4Q 2021 1Q 2022 2Q 2022 3Q 2022 4Q 2022 $121 $270 $369 $337 $224 4Q 2021 1Q 2022 2Q 2022 3Q 2022 4Q 2022 0.2x 0.4x 0.6x 0.4x 0.3x0.3x 0.4x 2.18%2.45% 2.80% 3.60% 3.34% 0.5x 0.7x 0.5x Q4'22 Economic Return on Adjusted Book Value*: (2.40)% 6.49% 6.57% 6.80% 6.69% 6.66%$0.09 $0.10 $0.10 $0.08 $0.06 4Q 2021 1Q 2022 2Q 2022 3Q 2022 4Q 2022 Net Interest Income - EPS Contribution Dividend Per Share $0.10 $0.10 3Q 2022 4Q 2022 Adjusted Book Value* $4.17 $3.97 3Q 2022 4Q 2022 Undepreciated Loss Per Share* $(0.27) $(0.12) 3Q 2022 4Q 2022 15.63% Dividend Yield Undepreciated losses driven by unrealized fair value changes


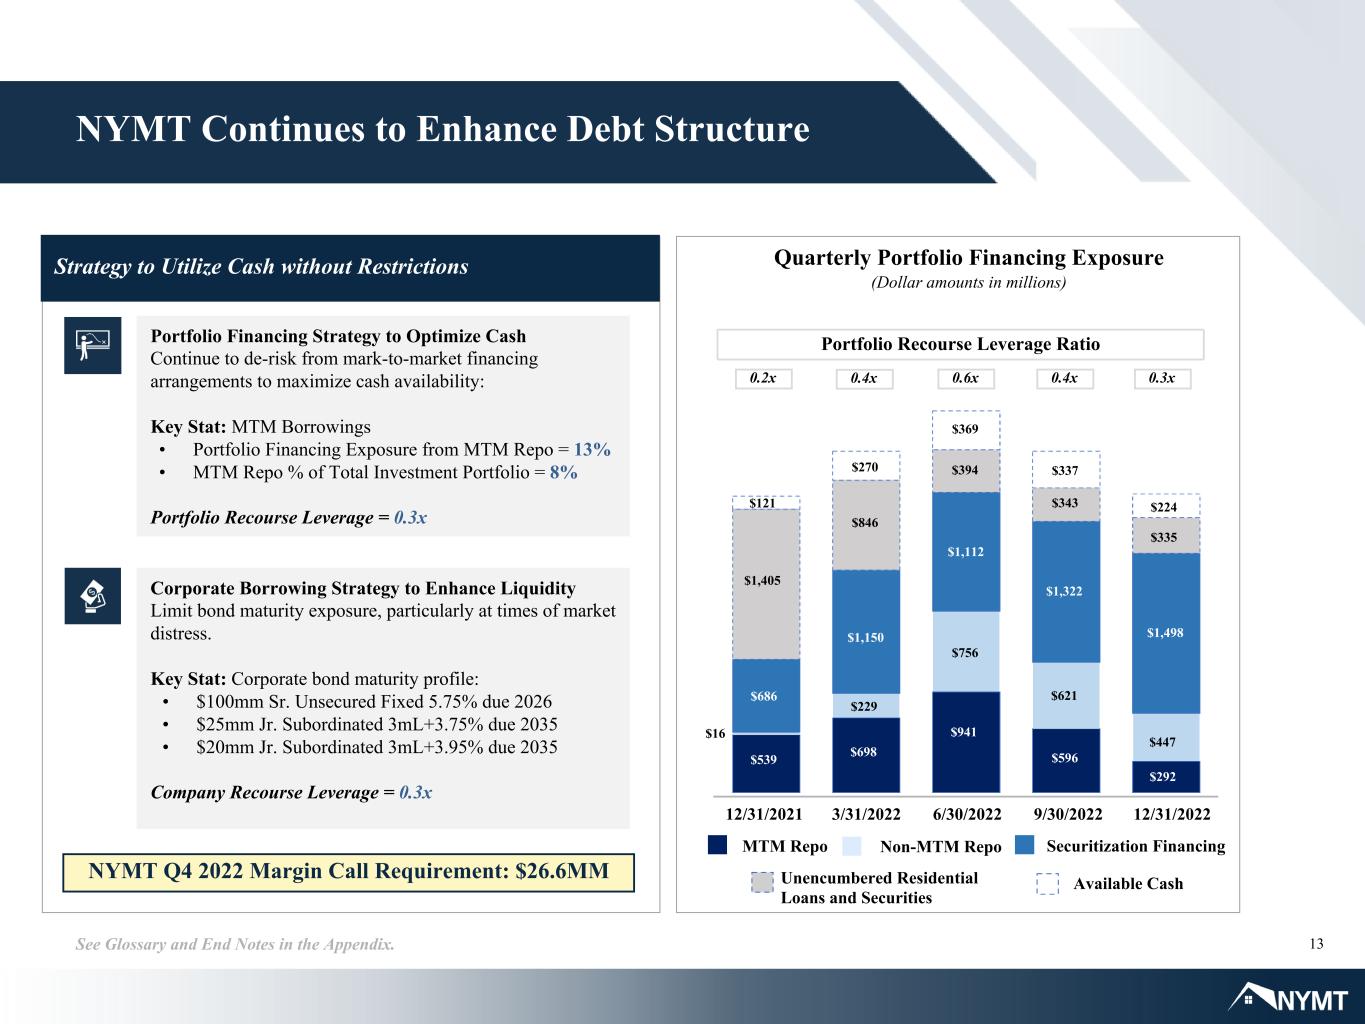
13See Glossary and End Notes in the Appendix. Strategy to Utilize Cash without Restrictions NYMT Continues to Enhance Debt Structure Portfolio Financing Strategy to Optimize Cash Continue to de-risk from mark-to-market financing arrangements to maximize cash availability: Key Stat: MTM Borrowings • Portfolio Financing Exposure from MTM Repo = 13% • MTM Repo % of Total Investment Portfolio = 8% Portfolio Recourse Leverage = 0.3x Corporate Borrowing Strategy to Enhance Liquidity Limit bond maturity exposure, particularly at times of market distress. Key Stat: Corporate bond maturity profile: • $100mm Sr. Unsecured Fixed 5.75% due 2026 • $25mm Jr. Subordinated 3mL+3.75% due 2035 • $20mm Jr. Subordinated 3mL+3.95% due 2035 Company Recourse Leverage = 0.3x Quarterly Portfolio Financing Exposure (Dollar amounts in millions) MTM Repo Securitization FinancingNon-MTM Repo Unencumbered Residential Loans and Securities Available Cash 12/31/2021 3/31/2022 6/30/2022 9/30/2022 12/31/2022 Portfolio Recourse Leverage Ratio 0.4x 0.6x 0.3x0.4x0.2x $756 $16 $394 $369 $1,322 $447 $846 $270 $1,405 $337 $335 $121 $1,150 $343 $1,498 $686 $698 $596 $292 $539 $941 $229 $1,112 $224 $621 NYMT Q4 2022 Margin Call Requirement: $26.6MM


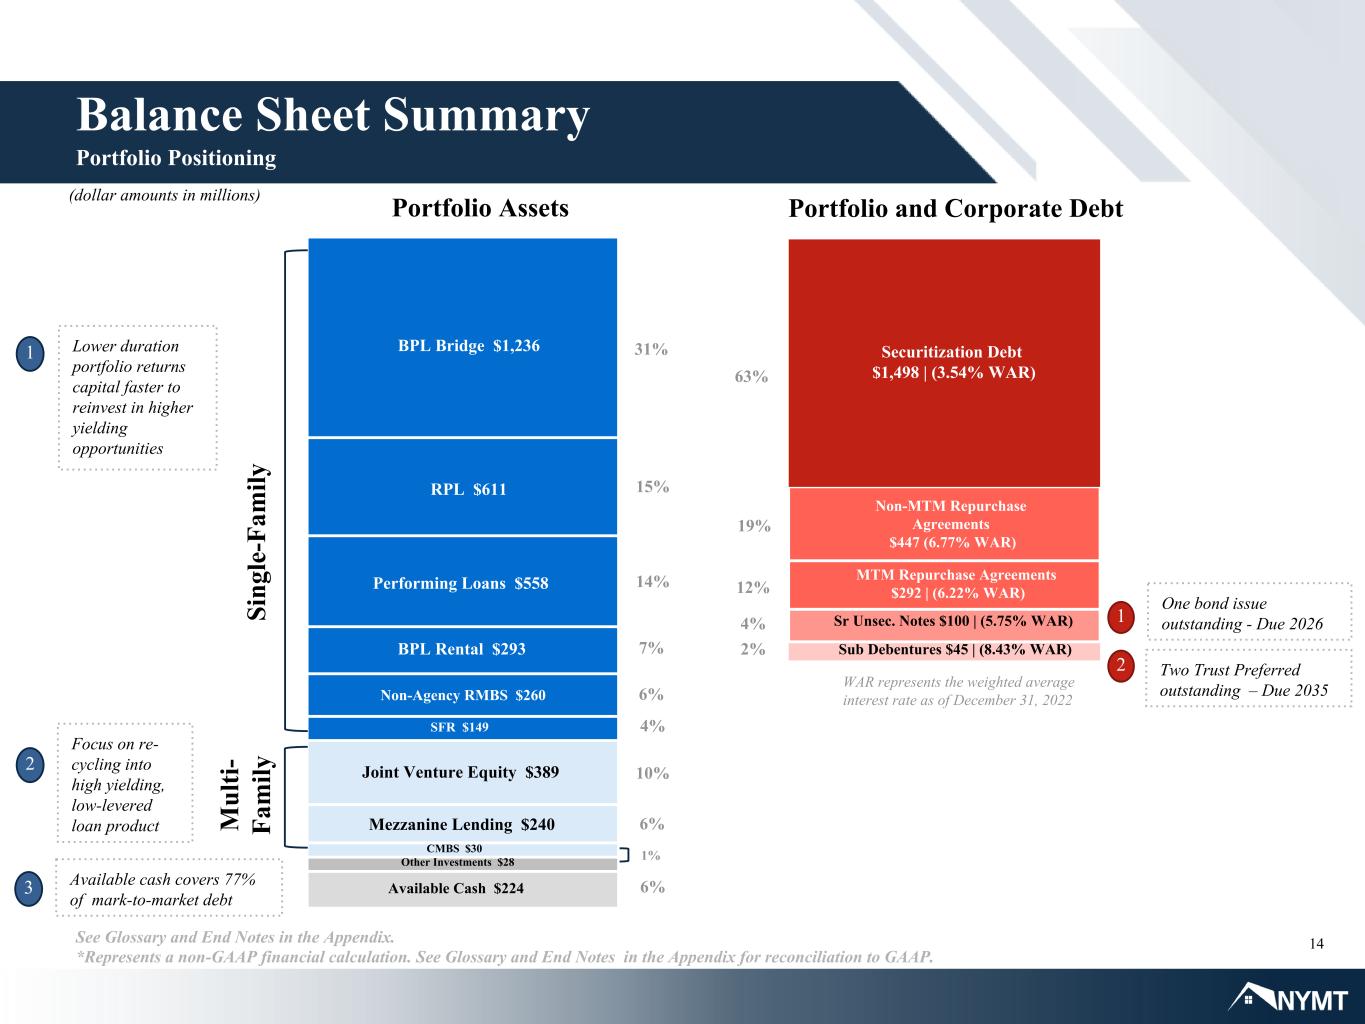
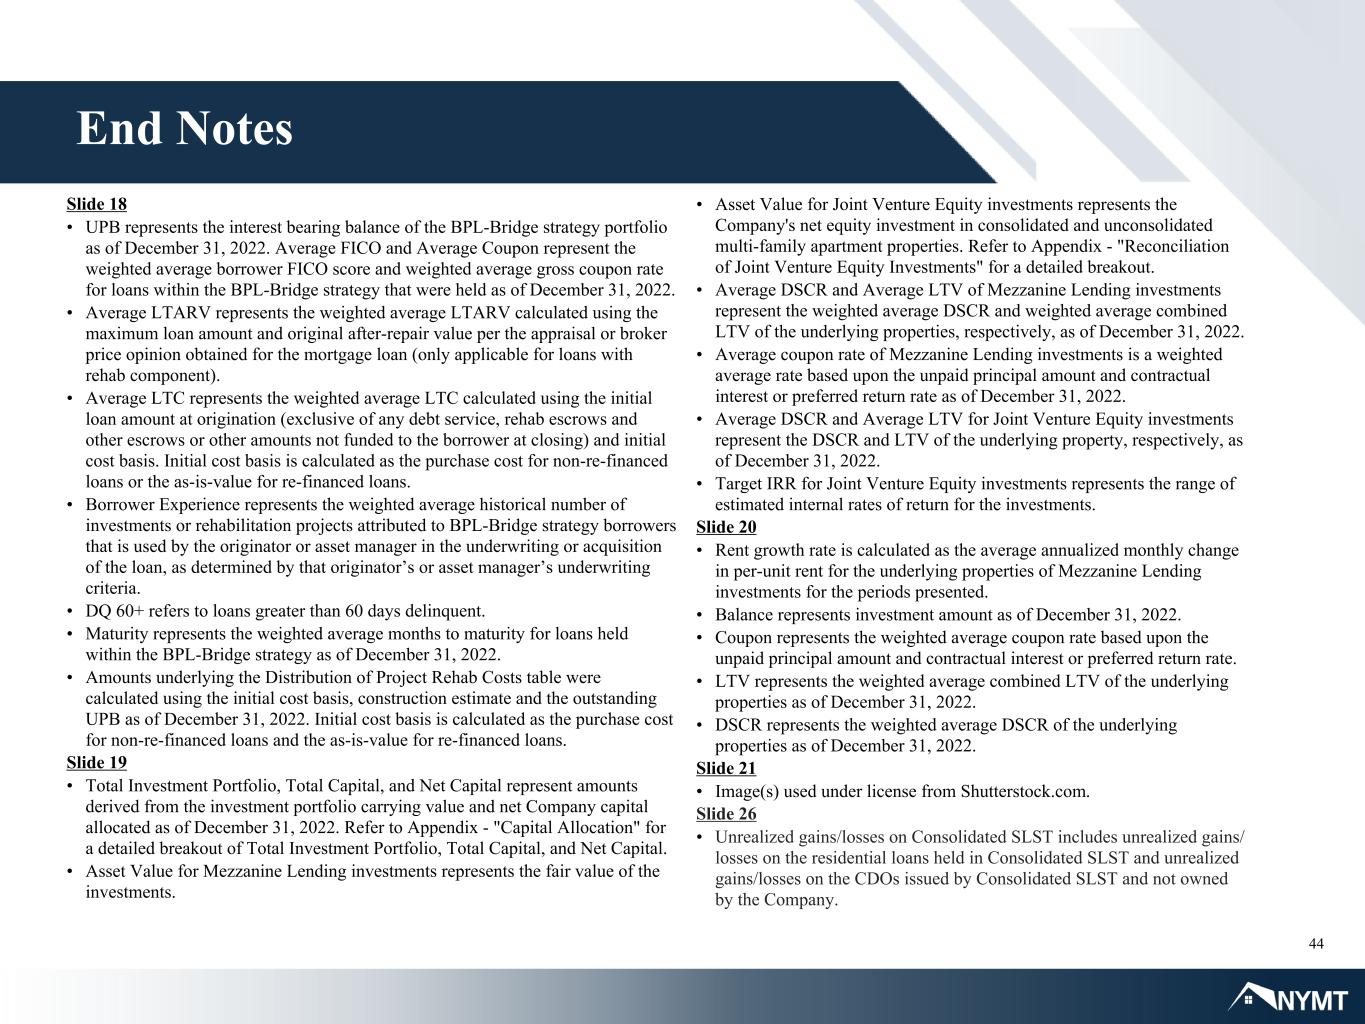
14See Glossary and End Notes in the Appendix. *Represents a non-GAAP financial calculation. See Glossary and End Notes in the Appendix for reconciliation to GAAP. Joint Venture Equity $389 RPL $611 Performing Loans $558 CMBS $30 15% Non-Agency RMBS $260 Mezzanine Lending $240 Si ng le -F am ily BPL Rental $293 SFR $149 Portfolio Assets Portfolio and Corporate Debt M ul ti- Fa m ily (dollar amounts in millions) Balance Sheet Summary Portfolio Positioning Other Investments $28 Available Cash $224 14% 7% 6% 4% 10% 6% 1 Lower duration portfolio returns capital faster to reinvest in higher yielding opportunities Focus on re- cycling into high yielding, low-levered loan product Available cash covers 77% of mark-to-market debt 63% Securitization Debt $1,498 | (3.54% WAR) 12% Sr Unsec. Notes $100 | (5.75% WAR)4% 2% Sub Debentures $45 | (8.43% WAR) 1 One bond issue outstanding - Due 2026 Two Trust Preferred outstanding – Due 2035 Non-MTM Repurchase Agreements $447 (6.77% WAR) MTM Repurchase Agreements $292 | (6.22% WAR) 19% 2 2 WAR represents the weighted average interest rate as of December 31, 2022 31%BPL Bridge $1,236 6% 1% 3


Market & Strategy Update


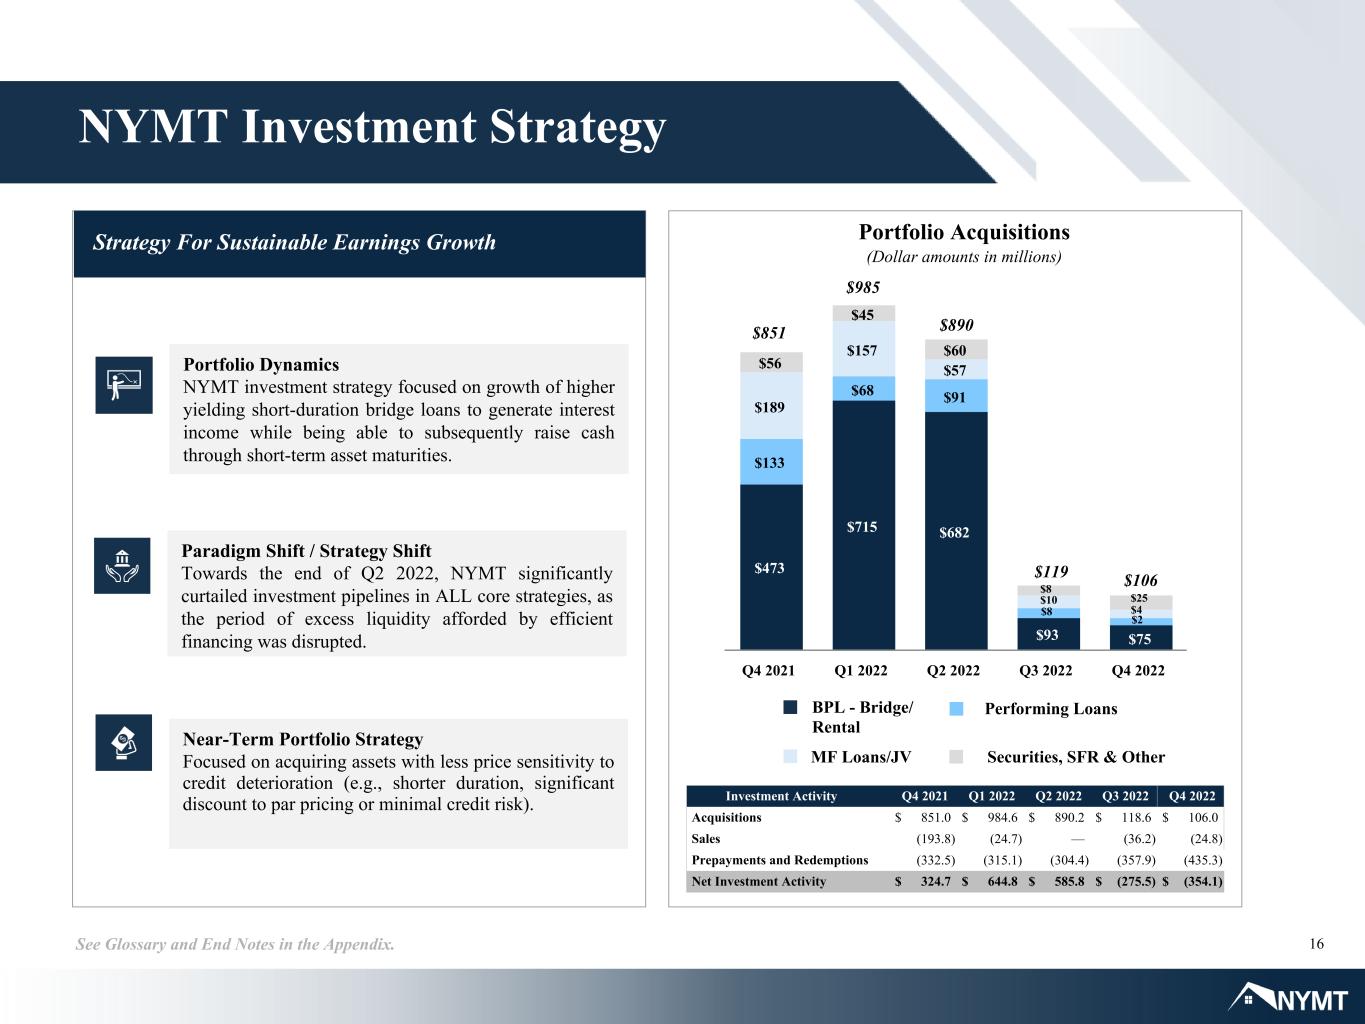
16See Glossary and End Notes in the Appendix. Strategy For Sustainable Earnings Growth NYMT Investment Strategy Portfolio Dynamics NYMT investment strategy focused on growth of higher yielding short-duration bridge loans to generate interest income while being able to subsequently raise cash through short-term asset maturities. Near-Term Portfolio Strategy Focused on acquiring assets with less price sensitivity to credit deterioration (e.g., shorter duration, significant discount to par pricing or minimal credit risk). Paradigm Shift / Strategy Shift Towards the end of Q2 2022, NYMT significantly curtailed investment pipelines in ALL core strategies, as the period of excess liquidity afforded by efficient financing was disrupted. Portfolio Acquisitions (Dollar amounts in millions) Performing LoansBPL - Bridge/ Rental MF Loans/JV $473 $715 $682 $93 $75 $133 $68 $91$189 $157 $57$56 $45 $60 Q4 2021 Q1 2022 Q2 2022 Q3 2022 Q4 2022 Securities, SFR & Other $851 $985 $119 $890 $106 Investment Activity Q4 2021 Q1 2022 Q2 2022 Q3 2022 Q4 2022 Acquisitions $ 851.0 $ 984.6 $ 890.2 $ 118.6 $ 106.0 Sales (193.8) (24.7) — (36.2) (24.8) Prepayments and Redemptions (332.5) (315.1) (304.4) (357.9) (435.3) Net Investment Activity $ 324.7 $ 644.8 $ 585.8 $ (275.5) $ (354.1) $8 $10 $8 $2 $4 $25


17See Glossary and End Notes in the Appendix. Single-Family Portfolio Overview Core Strategy Sub-Sector Asset Value Net Capital Portfolio Recourse Leverage Ratio Total Portfolio Leverage Ratio Loan Key Characteristics Current Environment % $ % $ Avg. FICO Avg. LTV Avg. Coupon BPL - Bridge • Bridge loans • Bridge w/Rehab loans 40% $1,236 48% $531 0.4x 1.6x • Supply of short duration bridge loans decreased as originators faced tighter credit standards and higher yield requirements from investors. Borrowers with bridge loans approaching maturity have fewer refinancing options. BPL - Rental • DSCR 9% $293 6% $64 0.1x 3.6x • Coupons in Q4 2022 rental property financing were elevated with higher securitization financing costs. Securitization markets improved in Q1 2023 as large asset managers have been active in allocating capital to non-Agency bonds. Performing Loan • S&D • Other 18% $558 10% $113 1.6x 4.1x • In a seasonal trend, number of Q4 2022 S&D loan auctions was elevated as originators tried to lower repo debt outstanding for new origination capacity in 2023. However, the percent of loans traded remained low, as bid prices continued to languish. RPL • Seasoned re- performing mortgage loans • Non-performing mortgage loans 20% $611 3% $32 0.0x 18.6x • RPL loans are now trading at prices lower than during the COVID-19 pandemic. After many years of strong home price gains, borrowers have built up large equity cushions to lower LTV and delinquencies remain manageable. • Cost of financing across repo and securitizations continues to be elevated. NYMT has securitized 99.5% of its RPL portfolio. Securities • Non-Agency (includes Consolidated SLST securities - $192MM) 8% $260 19% $211 0.2x 0.2x • Securitization volumes declined in 2022 with higher issuance costs and decline in mortgage origination volumes. Pricing has improved thus far in Q1 2023 with investors’ heightened pace of capital deployment. Dollar amounts in millions Total Investment Portfolio 82% Total Capital 62% 732 850 748 850 719 850 64% 69% 65% 3.88% 5.08% 8.46% 62% 4.93% 631 850


18See Glossary and End Notes in the Appendix. Single-Family Business Purpose Loan-Bridge Strategy NYMT Focus Expertise & Background ◦ Deep experience managing different whole loan strategies across the credit spectrum. ◦ Managed rehabilitation and sale of real estate-owned assets for over 10 years. NYMT Differentiation ◦ Source business purpose loans through flow and bulk trades with multiple originator, asset manager and broker-dealer relationships. ◦ We seek to differentiate ourselves through a combination of process efficiency, prudent credit underwriting and competitive loan pricing to stay active in the BPL sector. We leverage technology to optimize loan trading and other operational activity. Strategy & Initiatives ◦ Focus: – Markets with acute housing shortages – Borrowers with proven business plans – Low LTV – Low rehab requirements Loan Key Characteristics Avg. FICO Avg. Coupon Avg. LTARV Avg. LTC Loan Count: 1,964 UPB ($MM): $1,254 Borrower Experience DQ 60+ Maturity (months) 11.9 projects 13.5% 15.4 732 850 8.46% % o f B PL P or tf ol io Distribution of Project Rehab Costs 28% 16% 16% 10% 5% 4% 21% —% >0%-15% 16%-30% 31%-45% 46%-60% 61%-75% >75% 71%65% % of Initial Cost


19See Glossary and End Notes in the Appendix. Multi-Family Portfolio Overview Core Strategy Sub-Sector Asset Value Net Capital Loan Key Characteristics Current Environment % $ % $ Avg. DSCR Avg. LTV Avg. Coupon/ Target IRR Mezzanine Lending Preferred equity and mezzanine direct originations 36% $240 39% $237 • Senior advance rates continue to remain lower (YoY) leading to increased interest in mezzanine loan financing to cover gap in a refinance. • Opportunities for 2023 look promising with loan maturities coming due and inadequate senior proceeds to cover the existing. • Credit fundamentals continue to be favorable though the market is still coming to terms with the increase and volatility in interest rates. Joint Venture Equity Equity ownership of an individual multi- family property alongside an operating partner (1) 59% $389 56% $345 • Transaction volume is still down primarily due to high bid/ask spreads. This has led to more of an exploratory environment in terms of determining value with neither side willing to capitulate on price. • Near term maturities are going to be the biggest driver forcing a decision to recapitalize/sell or default. Asset management expertise and process will be heavily relied on over the next year. Dollar amounts in millions Total Investment Portfolio 17% Total Capital 35% 1.50x 1.25x 77% 79% 13-17% 11.98% (1) Includes JV transaction with combined mezzanine lending of $137.7 million and common equity of $6.9 million, totaling $144.6 million


20See Glossary and End Notes in the Appendix. Quarterly Update Loan Performance Update ◦ Four loans with outstanding UPB of $36 million paid off in the quarter at an average lifetime IRR to NYMT of 12.53% (1.51x multiple) including applicable minimum return multiple payment. ◦ As of December 31, 2022, only one loan within the Mezzanine Lending portfolio was delinquent and expected to pay off at par. Property Operating Update ◦ Portfolio occupancy of approximately 93% as of December 31, 2022. ◦ Rent growth rate of 8% in 2021. ◦ Rent growth rate of 11% in 2022. Mezzanine Portfolio Characteristics as of 12/31/2022 (Dollar amounts in millions) State Count Balance % Total Coupon LTV DSCR FL 5 $82.1 33.8% 12.6% 72% 1.35x TX 5 $43.1 17.7% 11.2% 84% 1.27x AL 2 $33.8 13.9% 12.3% 68% 2.23x UT 1 $20.6 8.5% 12.0% 67% N/A (1) TN 1 $13.7 5.7% 11.0% 93% 1.30x Other 9 $49.7 20.4% 11.7% 86% 1.72x Total/WA 23 $243.0 100.0% 12.0% 79% 1.50x Multi-Family Asset Class - Mezzanine Lending (1) Not applicable as the underlying property is under construction.


21 Current Focus New York Mortgage Trust 90 Park Avenue New York, New York 10016 Utilize a Strong Balance Sheet to Capture Opportunity: ◦ Maximize liquidity with low cost structure to afford greater flexibility ◦ Remain selective across the residential housing sector in anticipation of near-term market dislocation for superior total return opportunities ◦ Invest through the strength of our asset management platform to unlock value The Company is focused on opportunities in a market undergoing a landscape change. Success in this new environment may be achieved through organic creation of liquidity, tactical asset management and prudent liability management for book value protection.


Quarterly Financial Information


23See Glossary and End Notes in the Appendix. *Represents a non-GAAP financial measure. See Non-GAAP Financial Measures in the Appendix. Financial Results Fourth Quarter Profit & Loss Dollar amounts in millions, except per share data Description Amount EPS Contribution Interest income $ 63.0 $ 0.17 Interest expense (40.7) (0.11) Net Interest Income $ 22.3 $ 0.06 Realized gains 0.8 — Income from real estate 39.4 0.11 Preferred return on mezzanine lending 5.3 0.01 Other income (0.3) — Unrealized losses (41.7) (0.11) Non-Interest Income $ 3.5 $ 0.01 Total Net Interest Income & Non-Interest Income $ 25.8 $ 0.07 General & administrative expenses (13.3) (0.04) Expenses related to real estate (46.3) (0.13) Portfolio operating expenses (8.6) (0.02) Total Expenses $ (68.2) $ (0.18) Add Back: Loss attributable to non-controlling interest 5.6 0.02 Income tax expense (0.8) — Preferred stock dividends (10.5) (0.03) Net Loss Attributable to Common Stockholders $ (48.1) $ (0.13) Add Back: Depreciation expense on operating real estate 2.0 0.01 Undepreciated Loss* $ (46.1) $ (0.12)


24See Glossary and End Notes in the Appendix. *Represents a non-GAAP financial measure. See Non-GAAP Financial Measures in the Appendix. Yields by Strategy Quarter over Quarter Comparison Net Interest Spread (4Q’22 vs 3Q’22) Net Interest Spread for the fourth quarter was 1.11%, a decrease of 107 bps from the prior quarter primarily due to an increase in financing costs as a result of a residential loan securitization completed during the current quarter as well as an increase in base interest rates related to our repurchase agreements. Dollar Amounts in Thousands 4Q'22 3Q'22 2Q'22 1Q'22 4Q'21 Single-Family Avg. Interest Earning Assets $ 3,360,046 $ 3,597,311 $ 3,535,569 $ 2,926,764 $ 2,590,388 Avg. Interest Bearing Liabilities $ 2,385,831 $ 2,679,668 $ 2,498,132 $ 1,768,823 $ 1,064,153 Yield on Avg. Interest Earning Assets* 6.31 % 6.41 % 6.37 % 6.40 % 6.19 % Average Financing Cost* (5.29) % (4.38) % (3.21) % (2.93) % (2.94) % Single-Family Net Interest Spread* 1.02 % 2.03 % 3.16 % 3.47 % 3.25 % Multi-Family Avg. Interest Earning Assets $ 125,890 $ 137,268 $ 137,333 $ 142,584 $ 158,424 Avg. Interest Bearing Liabilities $ — $ 3,485 $ 16,591 $ 2,005 $ — Yield on Avg. Interest Earning Assets* 11.17 % 9.95 % 9.49 % 9.29 % 9.51 % Average Financing Cost* — % (3.42) % (2.65) % (2.39) % — % Multi-Family Net Interest Spread* 11.17 % 6.53 % 6.84 % 6.90 % 9.51 % Corporate/Other Avg. Interest Earning Assets $ 1,901 $ 9,706 $ 21,177 $ 22,496 $ 23,328 Avg. Interest Bearing Liabilities $ 145,000 $ 145,000 $ 145,000 $ 165,774 $ 283,000 Yield on Avg. Interest Earning Assets* 13.47 % 50.61 % 43.33 % 42.46 % 29.39 % Average Financing Cost* (6.81) % (6.33) % (5.88) % (6.03) % (6.89) % Corporate/Other Net Interest Spread* 6.66 % 44.28 % 37.45 % 36.43 % 22.50 % Total Avg. Interest Earning Assets $ 3,487,837 $ 3,744,285 $ 3,694,079 $ 3,091,844 $ 2,772,140 Avg. Interest Bearing Liabilities $ 2,530,831 $ 2,828,153 $ 2,659,723 $ 1,936,602 $ 1,347,153 Yield on Avg. Interest Earning Assets* 6.49 % 6.66 % 6.69 % 6.80 % 6.57 % Average Financing Cost* (5.38) % (4.48) % (3.35) % (3.20) % (3.77) % Net Interest Spread* 1.11 % 2.18 % 3.34 % 3.60 % 2.80 %


25See Glossary and End Notes in the Appendix. *Represents a non-GAAP financial measure. See Non-GAAP Financial Measures in the Appendix. Adjusted Net Interest Income* (4Q’22 vs 3Q’22) Adjusted Net Interest Income decreased in the fourth quarter as compared to the previous quarter, primarily due to paydowns on business purpose loans, an increase in financing costs as a result of a residential loan securitization completed during the current quarter and an increase in base interest rates related to our repurchase agreements. Adjusted Interest Income & Adjusted Interest Expense Breakout by Investment Category Adjusted Net Interest Income* Quarter over Quarter Comparison Dollar Amounts in Thousands 4Q'22 3Q'22 2Q'22 1Q'22 4Q'21 Single-Family Adjusted Interest Income* $ 53,022 $ 57,667 $ 56,260 $ 46,823 $ 40,073 Adjusted Interest Expense* (31,815) (29,610) (20,264) (12,975) (7,832) Single-Family Adjusted Net Interest Income* $ 21,207 $ 28,057 $ 35,996 $ 33,848 $ 32,241 Multi-Family Interest Income $ 3,514 $ 3,414 $ 3,258 $ 3,312 $ 3,767 Interest Expense — (30) (111) (12) — Multi-Family Net Interest Income $ 3,514 $ 3,384 $ 3,147 $ 3,300 $ 3,767 Corporate/Other Interest Income $ 64 $ 1,228 $ 2,294 $ 2,388 $ 1,714 Interest Expense (2,488) (2,312) (2,157) (2,500) (4,872) Corporate/Other Net Interest Income $ (2,424) $ (1,084) $ 137 $ (112) $ (3,158) Total Adjusted Interest Income* $ 56,600 $ 62,309 $ 61,812 $ 52,523 $ 45,554 Total Adjusted Interest Expense* (34,303) (31,952) (22,532) (15,487) (12,704) Total Adjusted Net Interest Income* $ 22,297 $ 30,357 $ 39,280 $ 37,036 $ 32,850


26See Glossary and End Notes in the Appendix. Non-Interest (Loss) Income Quarter over Quarter Comparison Realized Gains (Losses), net (4Q’22 vs 3Q’22) Net realized gains on residential loans are primarily a result of loan prepayment activity during the quarter. Unrealized (Losses) Gains, net (4Q’22 vs 3Q’22) Unrealized losses during the fourth quarter can be attributed to an increase in interest rates and credit spread widening, which translated to decreases in the fair value of our residential loans and first loss subordinated securities we own in Consolidated SLST. Dollar Amounts in Thousands 4Q'22 3Q'22 2Q'22 1Q'22 4Q'21 Residential loans $ 789 $ 1,673 $ 2,386 $ 3,432 $ 5,224 Investment securities and derivatives (28) 18,922 — 374 (4,134) Total Realized Gains, net $ 761 $ 20,595 $ 2,386 $ 3,806 $ 1,090 Dollar Amounts in Thousands 4Q'22 3Q'22 2Q'22 1Q'22 4Q'21 Residential loans $ (37,136) $ (124,275) $ (64,961) $ (63,299) $ 10,684 Consolidated SLST (4,923) (7,925) (4,275) (15,279) 513 Preferred equity and mezzanine loan investments 279 (2,509) 12 (455) 326 Investment securities and derivatives 108 6,653 1,530 (4,626) 3,968 Total Unrealized (Losses) Gains, net $ (41,672) $ (128,056) $ (67,694) $ (83,659) $ 15,491


27See Glossary and End Notes in the Appendix. Non-Interest (Loss) Income Quarter over Quarter Comparison Income (Loss) from Equity Investments (4Q’22 vs 3Q’22) The increase in income from equity investments in the fourth quarter is primarily related to the decrease in unrealized losses recognized on our preferred equity and equity investments compared to prior quarter. Dollar Amounts in Thousands 4Q'22 3Q'22 2Q'22 1Q'22 4Q'21 Preferred return on preferred equity investments accounted for as equity $ 5,260 $ 5,651 $ 5,703 $ 5,662 $ 7,177 Unrealized gains (losses), net on preferred equity investments accounted for as equity 151 (4,195) 326 113 (256) (Loss) income from unconsolidated joint venture equity investments in multi-family properties (925) (1,054) 299 250 150 (Loss) income from entities that invest in or originate residential properties and loans (468) (3,500) 1,772 28 4,804 Total Income (Loss) from Equity Investments $ 4,018 $ (3,098) $ 8,100 $ 6,053 $ 11,875 Dollar Amounts in Thousands 4Q'22 3Q'22 2Q'22 1Q'22 4Q'21 Preferred equity and mezzanine loan premiums resulting from early redemption $ 111 $ 1,356 $ 980 $ 1,503 $ 3,147 Gain on sale of real estate held for sale — 16,759 4 370 — Miscellaneous 900 (5,368) 121 (446) 125 Total Other Income $ 1,011 $ 12,747 $ 1,105 $ 1,427 $ 3,272 Other Income (4Q’22 vs 3Q’22) The decrease in other income in the fourth quarter is primarily related to net gain recognized on the sale of the underlying apartment community in a consolidated joint venture equity investment during the prior quarter and an impairment loss recognized on a multi-family property held by a joint venture equity investment held for sale during the fourth quarter, partially offset by gain on extinguishment of residential loan securitization CDOs repurchased in the fourth quarter. In addition, we recognized a one-time impairment loss on an equity security in the third quarter.


28See Glossary and End Notes in the Appendix. Net (Loss) Income from Real Estate Quarter over Quarter Comparison Dollar Amounts in Thousands 4Q'22 3Q'22 2Q'22 1Q'22 4Q'21 Income from real estate $ 39,414 $ 40,784 $ 35,870 $ 25,589 $ 7,605 Expenses related to real estate: Interest expense, mortgages payable on real estate (19,566) (16,136) (13,151) (7,157) (2,078) Depreciation expense on operating real estate (1) (5,910) (16,025) (15,132) (10,111) (2,394) Amortization of lease intangibles related to operating real estate (1) — (16,908) (37,262) (25,475) (6,837) Other expenses (20,884) (20,750) (18,365) (12,403) (4,232) Total expenses related to real estate (46,360) (69,819) (83,910) (55,146) (15,541) Net (loss) gain (162) 41,213 4 (233) — Net (Loss) Income from Real Estate $ (7,108) $ 12,178 $ (48,036) $ (29,790) $ (7,936) Net loss attributable to non-controlling interest 5,635 2,617 18,922 14,869 1,296 Net (Loss) Income from Real Estate Attributable to the Company $ (1,473) $ 14,795 $ (29,114) $ (14,921) $ (6,640) Net (Loss) Income from Real Estate (4Q’22 vs 3Q’22) The decrease in net income from real estate during the quarter was primarily due to the net gain recognized on the sale of the underlying apartment community in a consolidated joint venture equity investment in the prior quarter. The decrease was partially offset by a decrease in amortization expense as a result of lease intangibles being fully amortized in the prior quarter as well as a reduction in depreciation expense due to the application of held for sale accounting to real estate in disposal group held for sale. (1) See Slide 37 for amounts of depreciation expense and amortization of lease intangibles related to operating real estate attributable to the Company.


29See Glossary and End Notes in the Appendix. Expense Analysis Quarter over Quarter Comparison General and Administrative Expenses (4Q’22 vs 3Q’22) Quarterly general and administrative expenses increased primarily as a result of an increase in incentive compensation expense during the fourth quarter. Portfolio Operating Expenses (4Q’22 vs 3Q’22) Portfolio operating expenses decreased by $1.5 million primarily due to residential loan portfolio runoff and minimal loan purchase activity during the quarter. Dollar Amounts in Thousands 4Q'22 3Q'22 2Q'22 1Q'22 4Q'21 Portfolio Operating Expenses $ 8,585 $ 10,124 $ 12,690 $ 9,489 $ 8,111 Dollar Amounts in Thousands 4Q'22 3Q'22 2Q'22 1Q'22 4Q'21 Salaries, benefits and directors' compensation $ 9,955 $ 8,916 $ 10,020 $ 10,798 $ 9,765 Other general and administrative expenses 3,342 2,694 3,155 3,560 2,724 Total General and Administrative Expenses $ 13,297 $ 11,610 $ 13,175 $ 14,358 $ 12,489


30See Glossary and End Notes in the Appendix. Other Comprehensive (Loss) Income Dollar Amounts in Thousands 4Q'22 3Q'22 2Q'22 1Q'22 4Q'21 NET (LOSS) INCOME ATTRIBUTABLE TO COMPANY'S COMMON STOCKHOLDERS $ (48,076) $ (125,770) $ (82,389) $ (84,343) $ 22,460 OTHER COMPREHENSIVE INCOME (LOSS) Increase (decrease) in fair value of investment securities available for sale 83 (1,109) (535) (2,188) (314) Reclassification adjustment for net loss included in net (loss) income — — — — 51 TOTAL OTHER COMPREHENSIVE INCOME (LOSS) 83 (1,109) (535) (2,188) (263) COMPREHENSIVE (LOSS) INCOME ATTRIBUTABLE TO COMPANY'S COMMON STOCKHOLDERS $ (47,993) $ (126,879) $ (82,924) $ (86,531) $ 22,197


31See Glossary and End Notes in the Appendix. *Represents a non-GAAP financial measure. See Non-GAAP Financial Measures in the Appendix. Book Value Changes in Book Value The following table analyzes the changes in GAAP Book Value and Adjusted Book Value* of our common stock for the quarter and year ended December 31, 2022. Amounts in Thousands, except per share Amount Shares Per Share Amount Shares Per Share Beginning Balance, GAAP Book Value $ 1,360,381 373,150 $ 3.65 $ 1,783,906 379,405 $ 4.70 Common stock issuance, net 3,283 (10) 11,895 2,000 Preferred stock issuance, net 130 130 Common stock repurchase (22,543) (8,365) (44,399) (16,630) Balance after share activity 1,341,251 364,775 3.68 1,751,532 364,775 4.80 Adjustment of redeemable non-controlling interest to estimated redemption value (44,237) (0.12) (44,237) (0.12) Costs associated with non-controlling interest contributions (26) — (26) — Dividends and dividend equivalents declared (38,904) (0.11) (152,853) (0.42) Net change in accumulated other comprehensive income (loss): Investment securities available for sale 83 — (3,748) (0.01) Net loss attributable to Company's common stockholders (48,076) (0.13) (340,577) (0.93) Ending Balance, GAAP Book Value $ 1,210,091 364,775 $ 3.32 $ 1,210,091 364,775 $ 3.32 Add: Cumulative depreciation expense on operating real estate (1) 31,433 0.09 31,433 0.09 Cumulative amortization of lease intangibles related to operating real estate (1) 59,844 0.16 59,844 0.16 Adjustment of redeemable non-controlling interest to estimated redemption value 44,237 0.12 44,237 0.12 Adjustment of amortized cost liabilities to fair value 103,066 0.28 103,066 0.28 Ending Balance, Adjusted Book Value* $ 1,448,671 364,775 $ 3.97 $ 1,448,671 364,775 $ 3.97 Quarter Ended December 31, 2022 (1) Represents life to date adjustments for the Company's share of depreciation expense and amortization of lease intangibles related to operating real estate, net held as of the end of the period presented. Year Ended December 31, 2022


32See Glossary and End Notes in the Appendix. *Represents a non-GAAP financial measure. See Non-GAAP Financial Measures in the Appendix. Economic Return: Change in book value per share for the period + Dividend per share declared for the period, divided by the beginning period book value per share. Economic Return on Adjusted Book Value:* Change in Adjusted Book Value per share for the period + Dividend per share declared for the period, divided by the beginning period Adjusted Book Value per share. Total Rate of Return: Change in Stock Price for the period + Dividend per share declared for the period, divided by the beginning period Stock Price. Annual and Quarterly Returns Economic/Total Rate 2022 4Q'22 3Q'22 2Q'22 1Q'22 2021 2020 2019 Book Value per share Beginning $ 4.70 $ 3.65 $ 4.06 $ 4.36 $ 4.70 $ 4.71 $ 5.78 $ 5.65 Ending $ 3.32 $ 3.32 $ 3.65 $ 4.06 $ 4.36 $ 4.70 $ 4.71 $ 5.78 Change in Book Value per share $ (1.38) $ (0.33) $ (0.41) $ (0.30) $ (0.34) $ (0.01) $ (1.07) $ 0.13 Dividends Q1 $ 0.10 $ 0.10 $ 0.10 $ — $ 0.20 Q2 0.10 $ 0.10 0.10 0.05 0.20 Q3 0.10 $ 0.10 0.10 0.075 0.20 Q4 0.10 $ 0.10 0.10 0.10 0.20 Total $ 0.40 $ 0.10 $ 0.10 $ 0.10 $ 0.10 $ 0.40 $ 0.225 $ 0.80 Economic Return (20.9) % (6.3) % (7.6) % (4.6) % (5.1) % 8.3 % (14.6) % 16.5 % Adjusted Book Value per share* Beginning $ 4.72 $ 4.17 $ 4.42 $ 4.54 $ 4.72 $ 4.71 $ 5.77 $ 5.62 Ending $ 3.97 $ 3.97 $ 4.17 $ 4.42 $ 4.54 $ 4.72 $ 4.71 $ 5.77 Change in Adjusted Book Value per share $ (0.75) $ (0.20) $ (0.25) $ (0.12) $ (0.18) $ 0.01 $ (1.06) $ 0.15 Economic Return on Adjusted Book Value* (7.4) % (2.4) % (3.4) % (0.4) % (1.7) % 8.7 % (14.5) % 16.9 % 2022 4Q'22 3Q'22 2Q'22 1Q'22 2021 2020 2019 Stock Price Beginning $ 3.72 $ 2.34 $ 2.76 $ 3.65 $ 3.72 $ 3.69 $ 6.23 $ 5.89 Ending $ 2.56 $ 2.56 $ 2.34 $ 2.76 $ 3.65 $ 3.72 $ 3.69 $ 6.23 Change in Stock Price $ (1.16) $ 0.22 $ (0.42) $ (0.89) $ (0.07) $ 0.03 $ (2.54) $ 0.34 Total Rate of Return (20.4) % 13.7 % (11.6) % (21.6) % 0.8 % 11.7 % (37.2) % 19.4 %


Appendix


34See Glossary and End Notes in the Appendix. Non-GAAP Financial Measures Adjusted Net Interest Income and Net Interest Spread In addition to the results presented in accordance with GAAP, this supplemental presentation includes certain non-GAAP financial measures, including adjusted interest income, adjusted interest expense, adjusted net interest income, yield on average interest earning assets, average financing cost, net interest spread, undepreciated earnings and adjusted book value per common share. Our management team believes that these non-GAAP financial measures, when considered with our GAAP financial statements, provide supplemental information useful for investors as it enables them to evaluate our current performance and trends using the metrics that management uses to operate our business. Our presentation of non-GAAP financial measures may not be comparable to similarly-titled measures of other companies, who may use different calculations. Because these measures are not calculated in accordance with GAAP, they should not be considered a substitute for, or superior to, the financial measures calculated in accordance with GAAP. Our GAAP financial results and the reconciliations of the non-GAAP financial measures included in this supplemental presentation to the most directly comparable financial measures prepared in accordance with GAAP should be carefully evaluated. Financial results for the Company during a given period include the net interest income earned on our investment portfolio of residential loans, RMBS, CMBS, ABS and preferred equity investments and mezzanine loans, where the risks and payment characteristics are equivalent to and accounted for as loans (collectively, our “interest earning assets”). Adjusted net interest income and net interest spread (both supplemental non-GAAP financial measures) are impacted by factors such as our cost of financing, the interest rate that our investments bear and our interest rate hedging strategies. Furthermore, the amount of premium or discount paid on purchased investments and the prepayment rates on investments will impact adjusted net interest income as such factors will be amortized over the expected term of such investments. We provide the following non-GAAP financial measures, in total and by investment category, for the respective periods: • Adjusted Interest Income – calculated by reducing our GAAP interest income by the interest expense recognized on Consolidated SLST CDOs, • Adjusted Interest Expense – calculated by reducing our GAAP interest expense by the interest expense recognized on Consolidated SLST CDOs • Adjusted Net Interest Income – calculated by subtracting Adjusted Interest Expense from Adjusted Interest Income, • Yield on Average Interest Earning Assets – calculated as the quotient of our Adjusted Interest Income and our average interest earning assets and excludes all Consolidated SLST assets other than those securities owned by the Company, • Average Financing Cost – calculated as the quotient of our Adjusted Interest Expense and the average outstanding balance of our interest bearing liabilities, excluding Consolidated SLST CDOs and mortgages payable on real estate, and • Net Interest Spread – calculated as the difference between our Yield on Average Interest Earning Assets and our Average Financing Cost. We provide the non-GAAP financial measures listed above because we believe these non-GAAP financial measures provide investors and management with additional detail and enhance their understanding of our interest earning asset yields, in total and by investment category, relative to the cost of our financing and the underlying trends within our portfolio of interest earning assets. In addition to the foregoing, our management team uses these measures to assess, among other things, the performance of our interest earning assets in total and by asset, possible cash flows from our interest earning assets in total and by asset, our ability to finance or borrow against the asset and the terms of such financing and the composition of our portfolio of interest earning assets, including acquisition and disposition determinations. These measures remove the impact of Consolidated SLST that we consolidate in accordance with GAAP by only including the interest income earned by the Consolidated SLST securities that are actually owned by the Company, as the Company only receives income or absorbs losses related to the Consolidated SLST securities actually owned by the Company. Prior to the quarter ended December 31, 2022, we also reduced GAAP interest expense by the interest expense on mortgages payable on real estate. Commencing with the quarter ended December 31, 2022, we have reclassified the interest expense on mortgages payable on real estate to expenses related to real estate on our consolidated statements of operations and, as such, it is no longer included in GAAP interest expense. Prior period disclosures have been conformed to the current period presentation. The following slides present reconciliations of GAAP interest income to Adjusted Interest Income, GAAP interest expense to Adjusted Interest Expense and GAAP net interest income to Adjusted Net Interest Income for our single-family portfolio and the Company for the periods indicated.


35 Non-GAAP Financial Measures Reconciliation of Single-Family Adjusted Net Interest Income Dollar Amounts in Thousands 4Q'22 3Q'22 2Q'22 1Q'22 4Q'21 Single-Family GAAP interest income $ 59,370 $ 64,278 $ 62,468 $ 52,801 $ 46,837 GAAP interest expense (38,163) (36,221) (26,472) (18,953) (14,596) GAAP total net interest income $ 21,207 $ 28,057 $ 35,996 $ 33,848 $ 32,241 GAAP interest income $ 59,370 $ 64,278 $ 62,468 $ 52,801 $ 46,837 Remove interest expense from: Consolidated SLST CDOs (6,348) (6,611) (6,208) (5,978) (6,764) Adjusted Interest Income $ 53,022 $ 57,667 $ 56,260 $ 46,823 $ 40,073 GAAP interest expense $ (38,163) $ (36,221) $ (26,472) $ (18,953) $ (14,596) Remove interest expense from: Consolidated SLST CDOs 6,348 6,611 6,208 5,978 6,764 Adjusted Interest Expense $ (31,815) $ (29,610) $ (20,264) $ (12,975) $ (7,832) Adjusted Net Interest Income (1) $ 21,207 $ 28,057 $ 35,996 $ 33,848 $ 32,241 (1) Adjusted Net Interest Income is calculated by subtracting Adjusted Interest Expense from Adjusted Interest Income.


36See Glossary and End Notes in the Appendix. Dollar Amounts in Thousands 4Q'22 3Q'22 2Q'22 1Q'22 4Q'21 GAAP interest income $ 62,948 $ 68,920 $ 68,020 $ 58,501 $ 52,318 GAAP interest expense (40,651) (38,563) (28,740) (21,465) (19,468) GAAP total net interest income $ 22,297 $ 30,357 $ 39,280 $ 37,036 $ 32,850 GAAP interest income $ 62,948 $ 68,920 $ 68,020 $ 58,501 $ 52,318 Remove interest expense from: Consolidated SLST CDOs (6,348) (6,611) (6,208) (5,978) (6,764) Adjusted Interest Income $ 56,600 $ 62,309 $ 61,812 $ 52,523 $ 45,554 GAAP interest expense $ (40,651) $ (38,563) $ (28,740) $ (21,465) $ (19,468) Remove interest expense from: Consolidated SLST CDOs 6,348 6,611 6,208 5,978 6,764 Adjusted Interest Expense $ (34,303) $ (31,952) $ (22,532) $ (15,487) $ (12,704) Adjusted Net Interest Income (1) $ 22,297 $ 30,357 $ 39,280 $ 37,036 $ 32,850 Non-GAAP Financial Measures Reconciliation of Total Adjusted Net Interest Income (1) Adjusted Net Interest Income is calculated by subtracting Adjusted Interest Expense from Adjusted Interest Income.


37See Glossary and End Notes in the Appendix. Non-GAAP Financial Measures Undepreciated (Loss) Earnings Dollar Amounts in Thousands (except per share data) 4Q'22 3Q'22 2Q'22 1Q'22 4Q'21 Net (loss) income attributable to Company's common stockholders $ (48,076) $ (125,770) $ (82,389) $ (84,343) $ 22,460 Add: Depreciation expense on operating real estate 1,960 11,104 10,309 6,159 2,237 Amortization of lease intangibles related to operating real estate — 13,193 22,910 13,979 6,348 Undepreciated (loss) earnings $ (46,116) $ (101,473) $ (49,170) $ (64,205) $ 31,045 Weighted average shares outstanding - basic 370,193 377,078 381,200 380,795 379,346 Undepreciated (loss) earnings per common share $ (0.12) $ (0.27) $ (0.13) $ (0.17) $ 0.08 Undepreciated (Loss) Earnings is a supplemental non-GAAP financial measure defined as GAAP net (loss) income attributable to Company's common stockholders excluding the Company's share in depreciation expense and lease intangible amortization expense related to operating real estate, net. By excluding these non-cash adjustments from our operating results, we believe that the presentation of Undepreciated (Loss) Earnings provides a consistent measure of our operating performance and useful information to investors to evaluate the effective net return on our portfolio. In addition, we believe that presenting Undepreciated (Loss) Earnings enables our investors to measure, evaluate, and compare our operating performance to that of our peers. A reconciliation of net (loss) income attributable to Company's common stockholders to Undepreciated (Loss) Earnings for the periods indicated is presented below:


38See Glossary and End Notes in the Appendix. Non-GAAP Financial Measures Adjusted Book Value Per Common Share Previously, we presented undepreciated book value per common share as a non-GAAP financial measure. Commencing with the quarter ended December 31, 2022, we have discontinued disclosure of undepreciated book value per common share and instead present Adjusted Book Value per common share, also a non-GAAP financial measure. When presented in prior periods, undepreciated book value was calculated by excluding from GAAP book value the Company's share of cumulative depreciation and lease intangible amortization expenses related to operating real estate, net held at the end of the period. Since we began disclosing undepreciated book value, we identified additional items as materially affecting our book value and believe they should also be incorporated in order to provide a more useful non-GAAP measure for investors to evaluate our current performance and trends and facilitate the comparison of our financial performance and Adjusted Book Value per common share to that of our peers. Accordingly, we calculate Adjusted Book Value per common share by making the following adjustments to GAAP book value: (i) exclude the Company's share of cumulative depreciation and lease intangible amortization expenses related to operating real estate, net held at the end of the period, (ii) exclude the adjustment of redeemable non-controlling interests to estimated redemption value and (iii) adjust our liabilities that finance our investment portfolio to fair value. Our rental property portfolio includes fee simple interests in single-family rental homes and joint venture equity interests in multi-family properties owned by Consolidated Real Estate VIEs. By excluding our share of non-cash depreciation and amortization expenses, Adjusted Book Value reflects the value of our single-family rental properties and joint venture equity investments at their undepreciated basis. Additionally, in connection with third party ownership of certain of the non-controlling interests in certain of the Consolidated Real Estate VIEs, we record redeemable non-controlling interests as mezzanine equity on our consolidated balance sheets. The holders of the redeemable non-controlling interests may elect to sell their ownership interests to us at fair value once a year, subject to annual minimum and maximum amount limitations, resulting in an adjustment of the redeemable non-controlling interests to fair value that is accounted for by us as an equity transaction in accordance with GAAP. A key component of the estimation of fair value of the redeemable non-controlling interests is the estimated fair value of the multi-family apartment properties held by the applicable Consolidated Real Estate VIEs, which valuation is performed once a year by obtaining third party valuations in accordance with underlying agreements. However, because the corresponding real estate assets are not reported at fair value and thus not adjusted to reflect unrealized gains or losses in our consolidated financial statements, the adjustment of the redeemable non-controlling interests to fair value directly affects our GAAP book value. By excluding the adjustment of redeemable non-controlling interests to estimated redemption value, Adjusted Book Value more closely aligns the accounting treatment applied to our real estate assets and reflects our joint venture equity investments at their undepreciated basis. The substantial majority of our remaining assets are financial or similar instruments that are carried at fair value in accordance with the fair value option in our consolidated financial statements. However, unlike our use of the fair value option for the assets in our investment portfolio, the CDOs issued by our residential loan securitizations, senior unsecured notes, subordinated debentures and convertible notes that finance our investment portfolio assets are carried at amortized cost in our consolidated financial statements. By adjusting these financing instruments to fair value, Adjusted Book Value reflects the Company's net equity in investments on a comparable fair value basis. We believe that the presentation of Adjusted Book Value per common share provides a more useful measure for investors and us than undepreciated book value as it provides a more consistent measure of our value, allows management to effectively consider our financial position and facilitates the comparison of our financial performance to that of our peers. The following slide presents a reconciliation of GAAP book value to Adjusted Book Value and calculation of Adjusted Book Value per common share as of the dates indicated.


39See Glossary and End Notes in the Appendix. Non-GAAP Financial Measures Reconciliation of Adjusted Book Value Per Common Share Dollar Amounts in Thousands (except per share data) 4Q'22 3Q'22 2Q'22 1Q'22 4Q'21 Company's stockholders' equity $ 1,767,216 $ 1,917,506 $ 2,092,991 $ 2,217,618 $ 2,341,031 Preferred stock liquidation preference (557,125) (557,125) (557,125) (557,125) (557,125) GAAP Book Value 1,210,091 1,360,381 1,535,866 1,660,493 1,783,906 Add: Cumulative depreciation expense on operating real estate 31,433 29,473 20,081 9,772 4,381 Cumulative amortization of lease intangibles related to operating real estate 59,844 59,844 48,213 25,303 11,324 Adjustment of redeemable non-controlling interest to estimated redemption value 44,237 — — — — Adjustment of amortized cost liabilities to fair value 103,066 104,518 70,028 33,603 (8,237) Adjusted book value $ 1,448,671 $ 1,554,216 $ 1,674,188 $ 1,729,171 $ 1,791,374 Common shares outstanding 364,775 373,150 378,647 381,249 379,405 GAAP book value per common share $ 3.32 $ 3.65 $ 4.06 $ 4.36 $ 4.70 Adjusted book value per common share $ 3.97 $ 4.17 $ 4.42 $ 4.54 $ 4.72


40 The following defines certain of the commonly used terms in this presentation: "ABS" refers to asset-backed securities; "Adjusted Book Value" has the meaning set forth in "Non-GAAP Financial Measures—Adjusted Book Value Per Common Share"; "Adjusted Interest Income" has the meaning set forth in "Non-GAAP Financial Measures—Adjusted Net Interest Income and Net Interest Spread"; "Adjusted Interest Expense" has the meaning set forth in "Non-GAAP Financial Measures—Adjusted Net Interest Income and Net Interest Spread"; "Adjusted Net Interest Income" has the meaning set forth in "Non-GAAP Financial Measures—Adjusted Net Interest Income and Net Interest Spread"; "Agency" refers to CMBS or RMBS representing interests in or obligations backed by pools of mortgage loans issued and guaranteed by a government sponsored enterprise (“GSE”), such as the Federal National Mortgage Association (“Fannie Mae”) or the Federal Home Loan Mortgage Corporation (“Freddie Mac”), or an agency of the U.S. government, such as the Government National Mortgage Association (“Ginnie Mae”); "Average Financing Cost" has the meaning set forth in "Non-GAAP Financial Measures—Adjusted Net Interest Income and Net Interest Spread"; "Average Interest Earning Assets" include residential loans, multi-family loans and investment securities and exclude all Consolidated SLST assets other than those securities owned by the Company. Average Interest Earning Assets is calculated based on the daily average amortized cost; "Average Interest Bearing Liabilities" is calculated each quarter based on the daily average outstanding balance for the respective periods and include repurchase agreements, residential loan securitization CDOs, senior unsecured notes and subordinated debentures and exclude Consolidated SLST CDOs and mortgages payable on real estate as the Company does not directly incur interest expense on these liabilities that are consolidated for GAAP purposes; "BPL" refers to business purpose loans; "BPL-Bridge" refers to short-term business purpose loans collateralized by residential properties made to investors who intend to rehabilitate and sell the residential property for a profit; "BPL-Rental" refers to business purpose loans which finance (or refinance) non-owner occupied residential properties that are rented to one or more tenants; "Capital Allocation" refers to the net capital allocated (see Appendix - "Capital Allocation"); "CDO" or "collateralized debt obligation" includes debt that permanently finances the residential loans held in Consolidated SLST and the Company's residential loans held in securitization trusts that we consolidate or consolidated in our financial statements in accordance with GAAP; "CMBS" refers to commercial mortgage-backed securities comprised of commercial mortgage pass-through securities issued by a GSE, as well as PO, IO or mezzanine securities that represent the right to a specific component of the cash flow from a pool of commercial mortgage loans; "Company Recourse Leverage Ratio" represents total outstanding recourse repurchase agreement financing plus subordinated debentures, convertible notes and senior unsecured notes divided by the Company's total stockholders' equity. Does not include non-recourse repurchase agreement financing, collateralized debt obligations and mortgages payable on real estate as they are non-recourse debt to the Company; "Consolidated Real Estate VIEs" refers to Consolidated VIEs that own multi-family properties; "Consolidated SLST" refers to a Freddie Mac-sponsored residential mortgage loan securitization, comprised of seasoned re-performing and non-performing residential mortgage loans, of which we own the first loss subordinated securities and certain IOs, that we consolidate in our financial statements in accordance with GAAP; "Consolidated SLST CDOs" refers to the debt that permanently finances the residential mortgage loans held in Consolidated SLST that we consolidate in our financial statements in accordance with GAAP; "Consolidated VIEs" refers to variable interest entities (“VIEs”) where the Company is the primary beneficiary, as it has both the power to direct the activities that most significantly impact the economic performance of the VIE and a right to receive benefits or absorb losses of the entity that could be potentially significant to the VIE and that the Company consolidates in its consolidated financial statements in accordance with GAAP; "Corporate Debt" refers to subordinated debentures, convertible notes and senior unsecured notes, collectively; "DSCR" refers to debt service coverage ratio; Glossary


41 "Economic Return" is calculated based on the periodic change in GAAP book value per share plus dividends declared per common share during the respective period; "Economic Return on Adjusted Book Value" is calculated based on the periodic change in adjusted book value per common share, a supplemental non-GAAP measure, plus dividends declared per common share during the respective periods; "IOs" refers collectively to interest only and inverse interest only mortgage-backed securities that represent the right to the interest component of the cash flow from a pool of mortgage loans; "JV" refers to joint venture; "LTARV" refers to loan-to-after repair value ratio; "LTC" refers to loan-to-cost ratio; "LTV" refers to loan-to-value ratio; "Market Capitalization" is the outstanding shares of common stock and preferred stock multiplied by closing common stock and preferred stock market prices as of the date indicated; "Mezzanine Lending" refers to the Company's preferred equity in, and mezzanine loans to, entities that have multi-family real estate assets; "MF" refers to multi-family; "MTM" refers to mark-to-market; "Net Capital" refers to the net carrying value of assets and liabilities related to a strategy; "Net Interest Spread" has the meaning set forth in "Non-GAAP Financial Measures—Adjusted Net Interest Income and Net Interest Spread"; "non-Agency RMBS" refers to RMBS that are not guaranteed by any agency of the U.S. Government or GSE; "POs" refers to mortgage-backed securities that represent the right to the principal component of the cash flow from a pool of mortgage loans; "Portfolio Recourse Leverage Ratio" represents outstanding recourse repurchase agreement financing divided by the Company's total stockholders' equity; "RMBS" refers to residential mortgage-backed securities backed by adjustable-rate, hybrid adjustable-rate, or fixed-rate residential loans; "ROE" refers to return on equity; "RPL" refers to pools of seasoned re-performing, non-performing and other delinquent mortgage loans secured by first liens on one- to four-family properties; "S&D" refers to scratch and dent mortgage loans secured by a mortgage lien on a one- to four- family residential property intended by the originator to conform with Fannie Mae, Freddie Mac or other conduit standards but did not meet the originally intended origination guidelines due to errors in relevant documentation, credit underwriting of the borrower, consumer disclosures or other applicable requirements; "SF" refers to single-family; "SFR" refers to single-family rental properties; "Total Investment Portfolio" refers to the carrying value of investments actually owned by the Company (see Appendix – “Capital Allocation”); "Total Portfolio Leverage Ratio" represents outstanding repurchase agreement financing plus residential CDOs issued by the Company related to the strategy divided by the Net Capital allocated to the strategy; "Total Rate of Return" is calculated based on the change in price of the Company's common stock plus dividends declared per common share during the respective period; "Undepreciated Earnings (Loss)" has the meaning set forth in "Non-GAAP Financial Measures—Undepreciated (Loss) Earnings"; "UPB" refers to unpaid principal balance; "WA" refers to weighted average; "WAR" refers to weighted average interest rate as of the end of the period; and "Yield on Average Interest Earning Assets" has the meaning set forth in "Non-GAAP Financial Measures—Adjusted Net Interest Income and Net Interest Spread". Glossary


42 End Notes Slide 1 • Image(s) used under license from Shutterstock.com. Slide 6 • Refer to Appendix - "Capital Allocation" for a detailed breakout of Capital Allocation and Total Investment Portfolio. Slide 7 • Reduction of NYMT portfolio represents the change in Total Investment Portfolio carrying value from June 30, 2022 to December 31, 2022 (see Appendix – “Capital Allocation”). Slide 8 • Net Percent of U.S. Banks Willing to Make Consumer Loans for periods presented sourced from the Federal Reserve. • Case Shiller YoY HPA (%) and Existing Home Supply (in months) sourced from Bloomberg. Slide 9 • Available cash is calculated as unrestricted cash of $244.7 million less $21.1 million of cash held by the Company's consolidated multi-family properties not in disposal group held for sale. • Amount of repurchased debt issued through securitizations represents the par value of the securities at the time of repurchase. Slide 10 • Additional financing of under-levered assets represents the estimated additional financing available for encumbered residential loans and investment securities under the Company's current repurchase agreements as of December 31, 2022. • Financing of unencumbered assets represents the estimated available repurchase agreement and revolver securitization financings for the Company's residential loans, investment securities and single-family rental properties as of December 31, 2022. • Available cash is calculated as unrestricted cash of $244.7 million less $21.1 million of cash held by the Company's consolidated multi-family properties not in disposal group held for sale. • EPS Growth Potential amounts represent incremental earnings per share on future "Dry Powder" deployment, which is calculated as the product of the various hypothetical IRR for new investment levels, the deployment percentage, and the deployment availability as of December 31, 2022. These projections are based on management's current views and estimates, and the actual results may vary materially. See "Forward Looking Statements" at the beginning of this presentation for more information on forward looking statements. Slide 12 • Dividend yield calculated based on share price of the Company's common stock as of December 31, 2022. • Total Portfolio Size and Investment Allocation of the investment portfolio represent investment portfolio carrying value as of December 31, 2022 (see Appendix – “Capital Allocation”). • EPS Contribution amounts are calculated as the quotient of net interest income and the weighted average shares outstanding for the periods indicated. • Available Cash represents cash and cash equivalents at quarter-end for each of the periods indicated less: a) cash required to redeem Corporate Debt maturing within the next 30 days and b) cash held by the Company's consolidated multi-family properties. Slide 13 • MTM Repo includes repurchase agreement financing subject to margin calls. • Non-MTM Repo includes repurchase agreement financing not subject to margin calls. • Securitization Financing includes residential loan securitizations. MTM Repo, Non-MTM Repo and Securitization Financing amounts represent the outstanding loan amount or note balance. • Available Cash represents cash and cash equivalents at quarter-end for each of the periods indicated less: a) cash required to redeem Corporate Debt maturing within the next 30 days and b) cash held by the Company's consolidated multi-family properties. • Portfolio financing exposure from MTM repo is calculated as the quotient of MTM repo and the sum of MTM Repo, Non-MTM Repo and Securitization Financing.


43 End Notes • MTM Repo % of Total Investment Portfolio is calculated as the quotient of MTM Repo and the Total Investment Portfolio amount. Refer to Appendix - "Capital Allocation" for a detailed breakout of Total Investment Portfolio. • NYMT Q4 2022 margin call requirement amount represents the aggregate cash margin calls related to the Company's MTM repurchase agreement financings during the fourth quarter of 2022. Slide 14 • Other Investments include ABS and an equity investment in an entity that originates residential loans. • Portfolio Asset amounts for BPL Bridge, RPL, Performing Loans, BPL Rental, Non-Agency RMBS, Mezzanine Lending, CMBS and Other Investments represent the fair value of the assets as of December 31, 2022. • Portfolio Asset amount for SFR represents the net depreciated value of the real estate assets as of December 31, 2022. • Joint Venture Equity Portfolio amount represents the Company's net equity investment in consolidated and unconsolidated multi-family apartment properties as of December 31, 2022. Refer to Appendix - "Reconciliation of Joint Venture Equity Investments" for a detailed breakout. • Available Cash is calculated as unrestricted cash of $244.7 million less $21.1 million of cash held by the Company's consolidated multi-family properties not in disposal group held for sale. • Portfolio and Corporate Debt amounts represent the outstanding loan amount or note balance of the instruments as of December 31, 2022. • Percentage coverage of mark-to-market debt is calculated as the quotient of Available Cash and the Company's MTM repurchase agreement financings subject to margin calls as of December 31, 2022. Slide 16 • Portfolio Acquisitions represent the cost of assets acquired by the Company during the periods presented. • Acquisitions, Prepayments and Redemptions for the 4Q 2021 period presented exclude previously held Mezzanine Lending investments that were recapitalized as joint venture equity investments in the fourth quarter of 2021. Slide 17 • Total Investment Portfolio, Total Capital, and Net Capital represent amounts derived from the investment portfolio carrying value and net Company capital allocated as of December 31, 2022. Refer to Appendix - "Capital Allocation" for a detailed breakout of Total Investment Portfolio, Total Capital, and Net Capital. • Asset Value represents the fair value of the assets as of December 31, 2022. • Asset Value and Net Capital for Securities include Consolidated SLST securities owned by the Company with a fair value of $192 million and other non-Agency RMBS with a fair value of $69 million. • Portfolio Recourse Leverage Ratio represents outstanding recourse repurchase agreement financing related to the strategy divided by the net capital allocated to the strategy. • Total Portfolio Leverage Ratio represents outstanding repurchase agreement financing plus residential CDOs issued by the Company related to the strategy divided by the net capital allocated to the strategy. • Average FICO and Average Coupon for RPL Strategy, BPL-Bridge Strategy, BPL-Rental Strategy and Performing Loan Strategy represent the weighted average borrower FICO score and weighted average gross coupon rate for residential loans held as of December 31, 2022. • Average LTV for RPL Strategy, BPL-Rental Strategy and Performing Loan Strategy represents the weighted average loan-to- value for residential loans held as of December 31, 2022. LTV for these strategies is calculated using the most current property value available. • Average LTV for BPL-Bridge Strategy represents the weighted average LTARV for residential loans, calculated using the maximum loan amount and original after-repair value per the appraisal or broker price opinion obtained for the mortgage loan (only applicable for loans with rehab component).


44 End Notes Slide 18 • UPB represents the interest bearing balance of the BPL-Bridge strategy portfolio as of December 31, 2022. Average FICO and Average Coupon represent the weighted average borrower FICO score and weighted average gross coupon rate for loans within the BPL-Bridge strategy that were held as of December 31, 2022. • Average LTARV represents the weighted average LTARV calculated using the maximum loan amount and original after-repair value per the appraisal or broker price opinion obtained for the mortgage loan (only applicable for loans with rehab component). • Average LTC represents the weighted average LTC calculated using the initial loan amount at origination (exclusive of any debt service, rehab escrows and other escrows or other amounts not funded to the borrower at closing) and initial cost basis. Initial cost basis is calculated as the purchase cost for non-re-financed loans or the as-is-value for re-financed loans. • Borrower Experience represents the weighted average historical number of investments or rehabilitation projects attributed to BPL-Bridge strategy borrowers that is used by the originator or asset manager in the underwriting or acquisition of the loan, as determined by that originator’s or asset manager’s underwriting criteria. • DQ 60+ refers to loans greater than 60 days delinquent. • Maturity represents the weighted average months to maturity for loans held within the BPL-Bridge strategy as of December 31, 2022. • Amounts underlying the Distribution of Project Rehab Costs table were calculated using the initial cost basis, construction estimate and the outstanding UPB as of December 31, 2022. Initial cost basis is calculated as the purchase cost for non-re-financed loans and the as-is-value for re-financed loans. Slide 19 • Total Investment Portfolio, Total Capital, and Net Capital represent amounts derived from the investment portfolio carrying value and net Company capital allocated as of December 31, 2022. Refer to Appendix - "Capital Allocation" for a detailed breakout of Total Investment Portfolio, Total Capital, and Net Capital. • Asset Value for Mezzanine Lending investments represents the fair value of the investments. • Asset Value for Joint Venture Equity investments represents the Company's net equity investment in consolidated and unconsolidated multi-family apartment properties. Refer to Appendix - "Reconciliation of Joint Venture Equity Investments" for a detailed breakout. • Average DSCR and Average LTV of Mezzanine Lending investments represent the weighted average DSCR and weighted average combined LTV of the underlying properties, respectively, as of December 31, 2022. • Average coupon rate of Mezzanine Lending investments is a weighted average rate based upon the unpaid principal amount and contractual interest or preferred return rate as of December 31, 2022. • Average DSCR and Average LTV for Joint Venture Equity investments represent the DSCR and LTV of the underlying property, respectively, as of December 31, 2022. • Target IRR for Joint Venture Equity investments represents the range of estimated internal rates of return for the investments. Slide 20 • Rent growth rate is calculated as the average annualized monthly change in per-unit rent for the underlying properties of Mezzanine Lending investments for the periods presented. • Balance represents investment amount as of December 31, 2022. • Coupon represents the weighted average coupon rate based upon the unpaid principal amount and contractual interest or preferred return rate. • LTV represents the weighted average combined LTV of the underlying properties as of December 31, 2022. • DSCR represents the weighted average DSCR of the underlying properties as of December 31, 2022. Slide 21 • Image(s) used under license from Shutterstock.com. Slide 26 • Unrealized gains/losses on Consolidated SLST includes unrealized gains/ losses on the residential loans held in Consolidated SLST and unrealized gains/losses on the CDOs issued by Consolidated SLST and not owned by the Company.


45 End Notes Slide 31 • Outstanding shares used to calculate book value per common share and Adjusted Book Value per common share for the quarter ended December 31, 2022 are 364,774,752. • Common stock issuance, net includes amortization of stock based compensation. Slide 48 • Image(s) used under license from Shutterstock.com.


46 (1) The Company, through its ownership of certain securities, has determined it is the primary beneficiary of Consolidated SLST and has consolidated the assets and liabilities of Consolidated SLST in the Company’s consolidated financial statements. Consolidated SLST is primarily presented on our consolidated balance sheets as residential loans, at fair value and collateralized debt obligations, at fair value. Our investment in Consolidated SLST as of December 31, 2022 was limited to the RMBS comprised of first loss subordinated securities and IOs issued by the securitization with an aggregate net carrying value of $191.5 million. (2) Represents the Company's equity investments in consolidated multi-family properties that are not in disposal group held for sale. A reconciliation of the Company's equity investments in consolidated multi-family properties and disposal group held for sale to the consolidated financial statements is included below in "Reconciliation of Joint Venture Equity Investments." (3) Includes both unconsolidated and consolidated equity investments in multi-family properties that are held for sale in disposal group. A reconciliation of the Company's equity investments in consolidated multi-family properties and disposal group held for sale to the consolidated financial statements is included below in "Reconciliation of Joint Venture Equity Investments." (4) Excludes cash in the amount of $35.1 million held in the Company's equity investments in consolidated multi-family properties and consolidated equity investments in disposal group held for sale. Restricted cash is included in the Company's consolidated balance sheets in other assets. (5) Represents the Company's total outstanding recourse repurchase agreement financing, subordinated debentures and senior unsecured notes divided by the Company's total stockholders' equity. Does not include certain repurchase agreement financing amounting to $291.2 million, Consolidated SLST CDOs amounting to $634.5 million, residential loan securitization CDOs amounting to $1.5 billion and mortgages payable on real estate amounting to $394.7 million as they are non-recourse debt. (6) Represents the Company's outstanding recourse repurchase agreement financing divided by the Company's total stockholders' equity. Capital Allocation At December 31, 2022 (Dollar Amounts in Thousands) Single-Family (1) Multi-Family Corporate/Other Total Residential loans $ 3,525,080 $ — $ — $ 3,525,080 Consolidated SLST CDOs (634,495) — — (634,495) Multi-family loans — 87,534 — 87,534 Investment securities available for sale 68,570 30,133 856 99,559 Equity investments — 152,246 27,500 179,746 Equity investments in consolidated multi-family properties (2) — 144,735 — 144,735 Equity investments in disposal group held for sale (3) — 244,039 — 244,039 Single-family rental properties 149,230 — — 149,230 Total investment portfolio carrying value $ 3,108,385 $ 658,687 $ 28,356 $ 3,795,428 Repurchase agreements $ (737,023) $ — $ — $ (737,023) Residential loan securitization CDOs (1,468,222) — — (1,468,222) Senior unsecured notes — — (97,384) (97,384) Subordinated debentures — — (45,000) (45,000) Cash, cash equivalents and restricted cash (4) 135,401 — 224,403 359,804 Adjustment of redeemable non-controlling interest to estimated redemption value — (44,237) — (44,237) Other 61,063 (2,554) (54,659) 3,850 Net Company capital allocated $ 1,099,604 $ 611,896 $ 55,716 $ 1,767,216 Company Recourse Leverage Ratio (5) 0.3x Portfolio Recourse Leverage Ratio (6) 0.3x


47 Reconciliation of Joint Venture Equity Investments Dollar Amounts in Thousands Cash and cash equivalents $ 21,129 Real estate, net 543,739 Assets of disposal group held for sale 1,151,784 Other assets 13,686 Total assets $ 1,730,338 Mortgages payable on real estate, net $ 394,707 Liabilities of disposal group held for sale 883,812 Other liabilities 10,511 Total liabilities $ 1,289,030 Redeemable non-controlling interest in Consolidated VIEs $ 63,803 Less: Adjustment of redeemable non-controlling interest to estimated redemption value (44,237) Non-controlling interest in Consolidated VIEs 9,040 Non-controlling interest in disposal group held for sale 23,928 Net Equity Investment in Joint Ventures (1) $ 388,774 (1) The Company's net equity investment consists of $144.7 million of net equity investments in consolidated multi-family properties and $244.0 million of net equity investments in disposal group held for sale.

 
Thank You From all of us at NYMT