Exhibit 99.1

New
York Mortgage Trust Reports
Fourth
Quarter and Full Year 2019 Results
NEW YORK, NY - February 24, 2020 (GLOBE
NEWSWIRE) - New York Mortgage Trust, Inc. (Nasdaq: NYMT) (“NYMT,” the “Company,” “we,” “our”
or “us”) today reported results for the three and twelve months ended December 31, 2019.
Summary of Fourth Quarter and Full Year 2019:
(dollar amounts in thousands, except per share data)
| |
For the Three
Months Ended
December 31,
2019 |
|
|
For the Twelve
Months Ended
December 31,
2019 |
|
| Net income attributable to Company's common stockholders |
$ |
55,308 |
|
$ |
144,835 |
|
| Net income attributable to Company's common stockholders per share (basic) |
$ |
0.20 |
|
$ |
0.65 |
|
| Net interest income |
$ |
43,999 |
|
$ |
127,864 |
|
| Net interest margin |
2.90 |
% |
2.48 |
% |
| Comprehensive income attributable to Company's common stockholders |
$ |
58,524 |
|
$ |
192,102 |
|
| Comprehensive income attributable to Company's common stockholders per share (basic) |
$ |
0.21 |
|
$ |
0.87 |
|
| Book value per share at the end of the period |
$ |
5.78 |
|
$ |
5.78 |
|
| Economic return on book value (1) |
3.64 |
% |
16.46 |
% |
| Dividends per share |
$ |
0.20 |
|
$ |
0.80 |
|
| (1) | Economic return on book value is based on the periodic change in GAAP book value per share plus dividends declared per common
share during the respective period. |
Key Developments:
Fourth Quarter
2019
| • | Issued 28,750,000 shares of common stock through an underwritten public offering, resulting in
net proceeds of $172.2 million. |
| | | |
| • | Issued 6,900,000 shares of our 7.875% Series E Fixed-to-Floating Rate Cumulative Redeemable Preferred
Stock (“Series E Preferred Stock”) in an underwritten public offering, resulting in net proceeds of $166.7 million. |
| | | |
| • | Acquired approximately $1.04 billion of mortgage-related and residential housing-related assets. |
Full Year 2019
| • | Issued 132,940,000 shares of common stock collectively through six underwritten public offerings,
resulting in total net proceeds of approximately $790.8 million. |
| | | |
| • | Issued 6,900,000 shares of Series E Preferred Stock through an underwritten public offering and
1,972,888 shares of preferred stock under our "at-the-market" preferred equity offering program, resulting in total net
proceeds to us of approximately $166.7 million and $48.4 million, respectively. |
| | | |
| • | Acquired approximately $2.4 billion of mortgage-related, residential housing-related and other credit assets. |
Subsequent Developments:
On January 10,
2020, the Company issued 34,500,000 shares of its common stock through an underwritten public offering at a public offering
price of $6.09 per share, resulting in total net proceeds to the Company of approximately $206.7 million after
deducting underwriting discounts and commissions and estimated offering expenses.
On February 13,
2020, the Company issued 50,600,000 shares of its common stock through an underwritten public offering at a public offering
price of $6.13 per share, resulting in total net proceeds to the Company of approximately $305.3 million after deducting
underwriting discounts and commissions and estimated offering expenses.
Management Overview
Steven Mumma, Chairman
and Chief Executive Officer, commented: “During a year in which the Company nearly doubled its equity market capitalization
and investment portfolio, the steady and disciplined execution of the Company’s credit-focused investment strategy by its
team of professionals has produced impressive results. The Company finished the year on a strong note, generating $0.20 per share
of GAAP earnings and $0.21 per share of comprehensive income for the fourth quarter of 2019. For the full year, the Company earned
$0.65 per share in GAAP earnings, while posting comprehensive income of $0.87 per share, equivalent to 109% of common share dividends
declared during the year. The Company’s financial performance generated economic returns of 3.6% and 16.5% for the fourth
quarter and full year 2019, respectively. Over the last three years, the Company has delivered an average annual economic return
of 12%.
The Company continued
to opportunistically access the capital markets through equity issuances during the fourth quarter and full year 2019, raising
approximately $339 million and $957 million, respectively. In fact, during 2019 alone, the Company’s capital markets’
activity contributed approximately $29 million of accretion to book value. Subsequent to the year end, the Company completed two
successful raises adding another $512 million in common stock to bring our total equity market capitalization to approximately
$2.9 billion.”
Jason Serrano, President, added: “NYMT’s core operating
model centers around efficiency and flexibility. The Company’s growth within the Multi-Family and Single-Family strategies
was achieved through adherence to these principles. The Company adopts a total return approach and targets investments that will
add additional value to our existing portfolio of diverse income-producing assets. By broadening our sources of income through
recurring gains and new opportunities that the market may offer, the Company will continue to drive earnings while reducing expense
levels on a relative basis. Therefore, the Company will continue to focus on new, niche subsectors to drive total returns and mitigate
against the potential volatility associated with high leverage.
To provide a deeper
understanding of our efforts to deliver exceptional value to our shareholders, we are pleased to announce the release of a new
supplemental investor presentation intended to complement the Company’s earnings calls."
In connection with
the release of the Company’s financial results, the Company will post a supplemental financial presentation on its website
at www.nymtrust.com under "Events and Presentations." Management intends to utilize this supplemental presentation
as a discussion guide for the Company’s fourth quarter conference call on Tuesday,
February 25, 2020.
Capital Allocation
The following
tables set forth our allocated capital by investment category at December 31, 2019, our interest income and interest
expense by investment category, and the average yield, average portfolio debt cost, and portfolio net interest
margin for our average interest earning assets (by investment category) for the three months ended December 31, 2019
(dollar amounts in thousands):
| | |
Agency | | |
Single-Family
Credit (1) | | |
Multi-Family
Credit (1) | | |
Other | | |
Total | |
| Investment securities, available for sale, at fair value | |
$ | 973,835 | | |
$ | 715,314 | | |
$ | 267,777 | | |
$ | 49,214 | | |
$ | 2,006,140 | |
| Distressed and other residential mortgage loans, at fair value | |
| — | | |
| 1,429,754 | | |
| — | | |
| — | | |
| 1,429,754 | |
| Distressed and other residential mortgage loans, net | |
| — | | |
| 202,756 | | |
| — | | |
| — | | |
| 202,756 | |
| Residential collateralized debt obligations | |
| — | | |
| (40,429 | ) | |
| — | | |
| — | | |
| (40,429 | ) |
| Investments in unconsolidated entities | |
| — | | |
| 65,573 | | |
| 124,392 | | |
| — | | |
| 189,965 | |
| Preferred equity and mezzanine loan investments | |
| — | | |
| — | | |
| 180,045 | | |
| — | | |
| 180,045 | |
| Multi-family loans held in securitization trusts, at fair value | |
| 88,359 | | |
| — | | |
| 17,728,387 | | |
| — | | |
| 17,816,746 | |
| Multi-family collateralized debt obligations, at fair value | |
| — | | |
| — | | |
| (16,724,451 | ) | |
| — | | |
| (16,724,451 | ) |
| Residential mortgage loans held in securitization trust, at fair value | |
| 26,239 | | |
| 1,302,647 | | |
| — | | |
| — | | |
| 1,328,886 | |
| Residential collateralized debt obligations, at fair value | |
| — | | |
| (1,052,829 | ) | |
| — | | |
| — | | |
| (1,052,829 | ) |
| Other investments (2) | |
| — | | |
| 3,119 | | |
| 14,464 | | |
| — | | |
| 17,583 | |
| Carrying value | |
$ | 1,088,433 | | |
$ | 2,625,905 | | |
$ | 1,590,614 | | |
$ | 49,214 | | |
$ | 5,354,166 | |
| Liabilities: | |
| | | |
| | | |
| | | |
| | | |
| | |
| Repurchase agreements | |
| (945,926 | ) | |
| (1,347,600 | ) | |
| (811,890 | ) | |
| — | | |
| (3,105,416 | ) |
| Subordinated debentures | |
| — | | |
| — | | |
| — | | |
| (45,000 | ) | |
| (45,000 | ) |
| Convertible notes | |
| — | | |
| — | | |
| — | | |
| (132,955 | ) | |
| (132,955 | ) |
| Hedges (net) (3) | |
| 15,878 | | |
| — | | |
| — | | |
| — | | |
| 15,878 | |
| Cash and restricted cash (4) | |
| 9,738 | | |
| 44,604 | | |
| 4,152 | | |
| 63,118 | | |
| 121,612 | |
| Goodwill | |
| — | | |
| — | | |
| — | | |
| 25,222 | | |
| 25,222 | |
| Other | |
| (1,449 | ) | |
| 54,895 | | |
| (10,123 | ) | |
| (71,801 | ) | |
| (28,478 | ) |
| Net capital allocated | |
$ | 166,674 | | |
$ | 1,377,804 | | |
$ | 772,753 | | |
$ | (112,202 | ) | |
$ | 2,205,029 | |
| | |
| | | |
| | | |
| | | |
| | | |
| | |
| Total debt leverage ratio (5) | |
| | | |
| | | |
| | | |
| | | |
| 1.5 | |
| Portfolio leverage ratio (6) | |
| | | |
| | | |
| | | |
| | | |
| 1.4 | |
| | |
| | | |
| | | |
| | | |
| | | |
| | |
| Net Interest Income - Three Months Ended December 31, 2019: | |
| | | |
| | | |
| | | |
| | | |
| | |
| Interest Income (7) | |
$ | 6,799 | | |
$ | 30,098 | | |
$ | 33,498 | | |
$ | 1,345 | | |
$ | 71,740 | |
| Interest Expense | |
| (5,428 | ) | |
| (11,531 | ) | |
| (7,384 | ) | |
| (3,398 | ) | |
| (27,741 | ) |
| Net Interest Income (Expense) | |
$ | 1,371 | | |
$ | 18,567 | | |
$ | 26,114 | | |
$ | (2,053 | ) | |
$ | 43,999 | |
| | |
| | | |
| | | |
| | | |
| | | |
| | |
| Portfolio Net Interest Margin - Three Months Ended December 31, 2019: | |
| | | |
| | | |
| | | |
| | | |
| | |
| Average Interest Earning Assets (8) (9) | |
$ | 1,100,787 | | |
$ | 2,347,406 | | |
$ | 1,169,134 | | |
$ | 49,498 | | |
$ | 4,666,825 | |
| Average Yield on Interest Earning
Assets (10) | |
| 2.47 | % | |
| 5.13 | % | |
| 11.46 | % | |
| 10.87 | % | |
| 6.15 | % |
| Average Portfolio Debt Cost (11) | |
| (2.42 | )% | |
| (3.60 | )% | |
| (3.62 | )% | |
| — | | |
| (3.25 | )% |
| Portfolio Net Interest Margin (12) | |
| 0.05 | % | |
| 1.53 | % | |
| 7.84 | % | |
| 10.87 | % | |
| 2.90 | % |
| (1) | The
Company, through its ownership of certain securities, has determined it is the primary
beneficiary of the Consolidated K-Series and Consolidated SLST and has consolidated both
into the Company’s consolidated financial statements. Interest
income amounts represent interest income earned by securities that are actually owned
by the Company. A reconciliation of net interest income from the Single-Family and Multi-Family
Credit portfolio is included below in “Additional Information.” |
| | |
| (2) | Includes
real estate under development in the amount of $14.5 million, other loan investments
in the amount of $2.4 million and deferred interest related to residential mortgage loans
held in securitization trust, at fair value of $0.7 million, all of which are included
in the Company’s accompanying consolidated balance sheets in receivables and other
assets. |
| | |
| (3) | Includes
derivative liabilities of $29.0 million netted against a $44.8 million variation
margin. |
| | |
| (4) | Restricted
cash is included in the Company's accompanying consolidated balance sheets in receivables
and other assets. |
| | |
| (5) | Represents total debt divided by the
Company’s total stockholders' equity. Total debt does not include Multi-family CDOs amounting to $16.7 billion, SLST
CDOs amounting to $1.1 billion and Residential CDOs amounting to $40.4 million that are consolidated in the Company's
financial statements as they are non-recourse debt for which the Company has no obligation. |
| | |
| (6) | Represents
repurchase agreement borrowings divided by the Company's total stockholders' equity. |
| | |
| (7) | Includes
interest income earned on cash accounts held by the Company. |
| | |
| (8) | Average
Interest Earning Assets for the periods indicated exclude all Consolidated SLST and Consolidated
K-Series assets other than those securities actually owned by the Company. |
| | |
| (9) | Average
Interest Earning Assets is calculated each quarter based on daily average amortized cost
for the respective periods. |
| | |
| (10) | Average
Yield on Interest Earning Assets was calculated by dividing our annualized interest income by our Average Interest Earning Assets
for the respective periods. |
| | |
| (11) | Average
Portfolio Debt Cost was calculated by dividing our annualized interest expense by our average
interest bearing liabilities, excluding our subordinated debentures and convertible notes,
which generated interest expense of approximately $0.7 million and $2.7 million, respectively. |
| | |
| (12) | Portfolio
Net Interest Margin is the difference between our Average Yield on Interest
Earning Assets and our Average Portfolio Debt Cost, excluding the weighted average cost of
subordinated debentures and convertible notes. |
Conference Call
On Tuesday, February
25, 2020 at 9:00 a.m., Eastern Time, New York Mortgage Trust's executive management is scheduled to host a conference call and
audio webcast to discuss the Company’s financial results for the three and twelve months ended December 31, 2019. The
conference call dial-in number is (877) 312-8806. The replay will be available until Tuesday, March 3, 2020 and can be accessed
by dialing (855) 859-2056 and entering passcode 8298881. A live audio webcast of the conference call can be accessed via the Internet,
on a listen-only basis, at the Company's website at http://www.nymtrust.com. Please allow extra time, prior to the call,
to visit the site and download the necessary software to listen to the Internet broadcast.
In connection
with the release of these financial results, the Company will also post a supplemental financial presentation that will
accompany the conference call, on its website at www.nymtrust.com under "Events and Presentations." Full year 2019
financial and operating data can be viewed in the Company’s Annual Report on Form 10-K for the year ended
December 31, 2019, which is expected to be filed with the Securities and Exchange Commission on or about February 28,
2020. A copy of the Form 10-K will be posted at the Company’s website as soon as reasonably practicable following its
filing with the Securities and Exchange Commission.
About New York Mortgage Trust
New York Mortgage
Trust, Inc. is a Maryland corporation that has elected to be taxed as a real estate investment trust for federal income tax
purposes (“REIT”). NYMT is an internally managed REIT in the business of acquiring, investing in, financing and
managing mortgage-related and residential housing-related assets and targets structured multi-family property investments
such as multi-family CMBS and preferred equity in, and mezzanine loans to, owners of multi-family properties, residential
mortgage loans (including distressed residential mortgage loans, non-QM loans, second mortgage loans and other residential
mortgage loans), non-Agency RMBS, Agency RMBS, Agency CMBS and other mortgage-related, residential housing-related and
credit-related assets. For a list of defined terms used from time to time in this press release, see “Defined
Terms” below.
Defined Terms
The following
defines certain of the commonly used terms that may appear in this press release: “RMBS” refers to residential
mortgage-backed securities comprised of adjustable-rate, hybrid adjustable-rate, fixed-rate, interest only and inverse
interest only, and principal only securities; “Agency RMBS” refers to RMBS representing interests in or
obligations backed by pools of mortgage loans guaranteed by a government sponsored enterprise (“GSE”), such as
the Federal National Mortgage Association (“Fannie Mae”) or the Federal Home Loan Mortgage Corporation
(“Freddie Mac”), or an agency of the U.S. government, such as the Government National Mortgage Association
(“Ginnie Mae”); “ABS” refers to debt and/or equity tranches of securitizations backed by various
asset classes including, but not limited to, automobiles, aircraft, credit cards, equipment, franchises, recreational
vehicles and student loans; “non-Agency RMBS” refers to RMBS that are not guaranteed by any agency of the U.S.
Government or any GSE; “Agency ARMs” refers to Agency RMBS comprised of adjustable-rate and hybrid
adjustable-rate RMBS; “Agency fixed-rate RMBS” refers to Agency RMBS comprised of fixed-rate RMBS;
“IOs” refers collectively to interest only and inverse interest only mortgage-backed securities that represent
the right to the interest component of the cash flow from a pool of mortgage loans; “POs” refers to
mortgage-backed securities that represent the right to the principal component of the cash flow from a pool of mortgage
loans; “ARMs” refers to adjustable-rate residential mortgage loans; “residential securitized loans”
refers to prime credit quality ARMs held in securitization trusts; “distressed residential mortgage loans” refers
to pools of re-performing, non-performing, and other delinquent mortgage loans secured by first liens on one- to four-family
properties; “CMBS” refers to commercial mortgage-backed securities comprised of commercial mortgage pass-through
securities, as well as PO, IO or mezzanine securities that represent the right to a specific component of the cash flow from
a pool of commercial mortgage loans; “Agency CMBS” refers to CMBS representing interests in or obligations backed
by pools of multi-family mortgage loans guaranteed by Freddie Mac; “multi-family CMBS” refers to CMBS backed by
commercial mortgage loans on multi-family properties; “multi-family securitized loans” refers to the commercial
mortgage loans included in the Consolidated K-Series; “CDO” refers to collateralized debt obligation;
“Consolidated K-Series” refers to certain Freddie Mac-sponsored multi-family loan K-Series securitizations, of
which we, or one of our special purpose entities, own the first loss PO securities and certain IO and/or senior or mezzanine
securities issued by them, that we consolidate in our financial statements in accordance with GAAP; “Consolidated
SLST” refers to a Freddie Mac-sponsored residential mortgage loan securitization, comprised of seasoned re-performing
and non-performing residential mortgage loans, of which we own the first loss subordinated securities and certain IOs and
senior securities that we consolidate in our financial statements in accordance with GAAP; “Multi-Family CDOs”
refers to the debt that permanently finances the multi-family mortgage loans held by the Consolidated K-Series that we
consolidate in our financial statements in accordance with GAAP; “SLST CDOs” refers to the debt that permanently
finances the residential mortgage loans held in Consolidated SLST that we consolidate in our financial statements in
accordance with GAAP; “Residential CDOs” refers to the debt that permanently finances our residential mortgage
loans held in securitization trusts, net that we consolidate in our financial statements in accordance with GAAP;
“Agency” portfolio includes Agency RMBS and Agency CMBS; “Multi-Family Credit” portfolio includes
multi-family CMBS, preferred equity and mezzanine loan investments and certain investments in unconsolidated entities that
invest in multi-family credit assets; and “Single-Family Credit” portfolio includes distressed and other
residential mortgage loans at fair value, distressed and other residential mortgage loans at carrying value, non-Agency RMBS,
mortgage loans held for sale, mortgage loans held for investment and certain investments in unconsolidated entities that
invest in single-family residential assets.
Additional Information
We determined that the Consolidated K-Series were variable interest
entities and that we are the primary beneficiary of the Consolidated K-Series. As a result, we are required to consolidate the
Consolidated K-Series’ underlying multi-family loans including their liabilities, income and expenses in our consolidated
financial statements. Also, in the fourth quarter of 2019, the Company invested in first loss subordinated securities and certain
IOs and senior securities issued by a Freddie Mac-sponsored residential mortgage loan securitization, which we refer to as Consolidated
SLST. We determined that Consolidated SLST is a variable interest entity and that we are the primary beneficiary of Consolidated
SLST. In accordance with GAAP, the Company has consolidated the underlying seasoned re-performing and non-performing residential
mortgage loans of Consolidated SLST including its liabilities, income and expenses in our consolidated financial statements. We
have elected the fair value option on the assets and liabilities held within the Consolidated K-Series and Consolidated SLST, which
requires that changes in valuations in the assets and liabilities of the Consolidated K-Series and Consolidated SLST be reflected
in our consolidated statements of operations.
A reconciliation of
our net interest income generated by our Multi-family Credit portfolio to our consolidated financial statements for the
three months ended December 31, 2019 is set forth below (dollar amounts in thousands):
| | |
For the Three Months
Ended December 31,
2019 | |
| Interest income, multi-family loans held in securitization trusts | |
$ | 150,483 | |
| Interest income, investment securities, available for sale (1) | |
| 2,865 | |
| Interest income, preferred equity and mezzanine loan investments | |
| 5,239 | |
| Interest expense, multi-family collateralized debt obligations | |
| (125,089 | ) |
| Interest income, Multi-Family Credit, net | |
| 33,498 | |
| Interest expense, repurchase agreements | |
| (7,384 | ) |
| Net interest income, Multi-Family Credit | |
$ | 26,114 | |
| (1) | Included in the Company’s accompanying consolidated statements of operations in interest
income, investment securities and other interest earning assets. |
A reconciliation of
our net interest income generated by our Single-Family Credit portfolio to our consolidated financial statements for
the three months ended December 31, 2019 is set forth below (dollar amounts in thousands):
| | |
For the Three Months
Ended December 31,
2019 | |
| Interest income, distressed and other residential mortgage loans | |
$ | 24,751 | |
| Interest income, investment securities, available for sale (1) | |
| 8,292 | |
| Interest expense, SLST CDOs (2) | |
| (2,945 | ) |
| Interest income, Single-Family Credit, net | |
| 30,098 | |
| Interest expense, repurchase agreements | |
| (11,260 | ) |
| Interest expense, Residential CDOs (2) | |
| (271 | ) |
| Net interest income, Single-Family Credit | |
$ | 18,567 | |
| (1) | Included in the Company’s accompanying consolidated statements of operations in interest
income, investment securities and other interest earning assets. |
| (2) | Included in the Company’s accompanying consolidated statements of operations in interest
expense, residential collateralized debt obligations. |
Cautionary Statement Regarding Forward-Looking
Statements
When used in this
press release, in future filings with the Securities and Exchange Commission (“SEC”) or in other written or oral communications,
statements which are not historical in nature, including those containing words such as “believe,” “expect,”
“anticipate,” “estimate,” “plan,” “continue,” “intend,” “should,”
“would,” “could,” “goal,” “objective,” “will,” “may” or
similar expressions, are intended to identify “forward-looking statements” within the meaning of Section 27A of the
Securities Act of 1933, as amended, and Section 21E of the Securities Exchange Act of 1934, as amended ("Exchange Act"),
and, as such, may involve known and unknown risks, uncertainties and assumptions.
Forward-looking
statements are based on the Company’s beliefs, assumptions and expectations of its future performance, taking into account
all information currently available to it. These beliefs, assumptions and expectations are subject to risks and uncertainties and
can change as a result of many possible events or factors, not all of which are known to the Company. If a change occurs, the Company’s
business, financial condition, liquidity and results of operations may vary materially from those expressed in its forward-looking
statements. The following factors are examples of those that could cause actual results to vary from the Company’s forward-looking
statements: changes in interest rates and the market value of the Company’s assets; changes in credit spreads; changes in
the long-term credit ratings of the U.S., Fannie Mae, Freddie Mac, and Ginnie Mae; market volatility; changes in prepayment rates
on the loans the Company owns or that underlie the Company’s investment securities; increased rates of default and/or decreased
recovery rates on the Company's assets; the Company's ability to identify and acquire its targeted assets, including assets in
its investment pipeline; the Company’s ability to borrow to finance its assets and the terms thereof; changes in governmental
laws, regulations or policies affecting the Company’s business; the Company’s ability to maintain its qualification
as a REIT for federal tax purposes; the Company’s ability to maintain its exemption from registration under the Investment
Company Act of 1940, as amended; and risks associated with investing in real estate assets, including changes in business conditions
and the general economy. These and other risks, uncertainties and factors, including the risk factors described in the Company’s
reports filed with the SEC pursuant to the Exchange Act, could cause the Company’s actual results to differ materially from
those projected in any forward-looking statements it makes. All forward-looking statements speak only as of the date on which they
are made. New risks and uncertainties arise over time and it is not possible to predict those events or how they may affect the
Company. Except as required by law, the Company is not obligated to, and does not intend to, update or revise any forward-looking
statements, whether as a result of new information, future events or otherwise.
For Further Information
CONTACT: AT THE COMPANY
Kristine R. Nario-Eng
Chief Financial Officer
Phone: (646) 216-2363
Email: [email protected]
Mari Nitta
Investor Relations Associate
Phone: (646) 795-4066
Email: [email protected]
FINANCIAL TABLES FOLLOW
NEW YORK MORTGAGE TRUST, INC. AND SUBSIDIARIES
CONSOLIDATED BALANCE SHEETS
(Dollar amounts in thousands, except
share data)
| | |
December 31,
2019 | |
December 31,
2018 | |
| | |
| (unaudited) | |
| | |
| ASSETS | |
| | |
| | |
| Investment securities, available for sale, at fair value | |
$ | 2,006,140 | |
$ | 1,512,252 | |
| Distressed and other residential mortgage loans, at fair value | |
| 1,429,754 | |
| 737,523 | |
| Distressed and other residential mortgage loans, net | |
| 202,756 | |
| 285,261 | |
| Investments in unconsolidated entities | |
| 189,965 | |
| 73,466 | |
| Preferred equity and mezzanine loan investments | |
| 180,045 | |
| 165,555 | |
| Multi-family loans held in securitization trusts, at fair value | |
| 17,816,746 | |
| 11,679,847 | |
| Residential mortgage loans held in securitization trust, at fair value | |
| 1,328,886 | |
| — | |
| Derivative assets | |
| 15,878 | |
| 10,263 | |
| Cash and cash equivalents | |
| 118,763 | |
| 103,724 | |
| Real estate held for sale in consolidated variable interest entities | |
| — | |
| 29,704 | |
| Goodwill | |
| 25,222 | |
| 25,222 | |
| Receivables and other assets | |
| 169,214 | |
| 114,821 | |
| Total Assets (1) | |
$ | 23,483,369 | |
$ | 14,737,638 | |
| LIABILITIES AND STOCKHOLDERS' EQUITY | |
| | |
| | |
| Liabilities: | |
| | |
| | |
| Repurchase agreements | |
$ | 3,105,416 | |
$ | 2,131,505 | |
| Multi-family collateralized debt obligations, at fair value | |
| 16,724,451 | |
| 11,022,248 | |
| Residential collateralized debt obligations, at fair value | |
| 1,052,829 | |
| — | |
| Residential collateralized debt obligations | |
| 40,429 | |
| 53,040 | |
| Convertible notes | |
| 132,955 | |
| 130,762 | |
| Subordinated debentures | |
| 45,000 | |
| 45,000 | |
| Mortgages and notes payable in consolidated variable interest entities | |
| — | |
| 31,227 | |
| Securitized debt | |
| — | |
| 42,335 | |
| Accrued expenses and other liabilities | |
| 177,260 | |
| 101,228 | |
| Total liabilities (1) | |
| 21,278,340 | |
| 13,557,345 | |
| Commitments and Contingencies | |
| | |
| | |
| Stockholders' Equity: | |
| | |
| | |
| Preferred stock, par value $0.01 per share, 30,900,000 shares authorized, 20,872,888 and 12,000,000 shares issued and outstanding, respectively ($521,822,200 and $300,000,000 aggregate liquidation preference, respectively) | |
| 504,765 | |
| 289,755 | |
| Common stock, par value $0.01 per share, 800,000,000 shares authorized, 291,371,039 and 155,589,528 shares issued and outstanding, respectively | |
| 2,914 | |
| 1,556 | |
| Additional paid-in capital | |
| 1,821,785 | |
| 1,013,391 | |
| Accumulated other comprehensive income (loss) | |
| 25,132 | |
| (22,135 | ) |
| Accumulated deficit | |
| (148,863 | ) |
| (103,178 | ) |
| Company's stockholders' equity | |
| 2,205,733 | |
| 1,179,389 | |
| Non-controlling interest in consolidated variable interest entities | |
| (704 | ) |
| 904 | |
| Total equity | |
| 2,205,029 | |
| 1,180,293 | |
| Total Liabilities and Stockholders' Equity | |
$ | 23,483,369 | |
$ | 14,737,638 | |
| (1) | Our consolidated balance sheets include assets and liabilities of consolidated variable interest
entities ("VIEs") as the Company is the primary beneficiary of these VIEs. As of December 31, 2019 and December 31,
2018, assets of consolidated VIEs totaled $19,270,384 and $11,984,374, respectively, and the liabilities of consolidated VIEs totaled
$17,878,314 and $11,191,736, respectively. |
NEW YORK MORTGAGE TRUST, INC. AND SUBSIDIARIES
CONSOLIDATED STATEMENTS OF OPERATIONS
(Dollar amounts in thousands, except
per share data)
(unaudited)
| | |
For the Three Months Ended
December 31, | |
For the Years Ended
December 31, | |
| | |
2019 | |
2018 | |
2019 | |
2018 | |
| INTEREST INCOME: | |
| | |
| | |
| | |
| | |
| Investment securities and other interest earning assets | |
$ | 19,299 | |
$ | 12,395 | |
$ | 67,472 | |
$ | 47,482 | |
| Distressed and other residential mortgage loans | |
| 24,751 | |
| 9,154 | |
| 71,017 | |
| 28,569 | |
| Preferred equity and mezzanine loan investments | |
| 5,239 | |
| 5,854 | |
| 20,899 | |
| 21,036 | |
| Multi-family loans held in securitization trusts | |
| 150,483 | |
| 101,533 | |
| 535,226 | |
| 358,712 | |
| Total interest income | |
| 199,772 | |
| 128,936 | |
| 694,614 | |
| 455,799 | |
| | |
| | |
| | |
| | |
| | |
| INTEREST EXPENSE: | |
| | |
| | |
| | |
| | |
| Repurchase agreements and other interest bearing liabilities | |
| 24,072 | |
| 13,376 | |
| 90,821 | |
| 44,050 | |
| Residential collateralized debt obligations | |
| 3,216 | |
| 431 | |
| 4,379 | |
| 1,779 | |
| Multi-family collateralized debt obligations | |
| 125,089 | |
| 88,792 | |
| 457,130 | |
| 313,102 | |
| Convertible notes | |
| 2,716 | |
| 2,673 | |
| 10,813 | |
| 10,643 | |
| Subordinated debentures | |
| 680 | |
| 721 | |
| 2,865 | |
| 2,743 | |
| Securitized debt | |
| — | |
| 1,070 | |
| 742 | |
| 4,754 | |
| Total interest expense | |
| 155,773 | |
| 107,063 | |
| 566,750 | |
| 377,071 | |
| | |
| | |
| | |
| | |
| | |
| NET INTEREST INCOME | |
| 43,999 | |
| 21,873 | |
| 127,864 | |
| 78,728 | |
| | |
| | |
| | |
| | |
| | |
| NON-INTEREST INCOME: | |
| | |
| | |
| | |
| | |
| Recovery of (provision for) loan losses | |
| 175 | |
| (2,492 | ) |
| 2,780 | |
| (1,257 | ) |
| Realized gains (losses), net | |
| 86 | |
| (548 | ) |
| 32,642 | |
| (7,775 | ) |
| Unrealized gains (losses), net | |
| 21,940 | |
| (4,736 | ) |
| 35,837 | |
| 52,781 | |
| Loss on extinguishment of debt | |
| — | |
| — | |
| (2,857 | ) |
| — | |
| Income from real estate held for sale in consolidated variable interest entities | |
| — | |
| 1,404 | |
| 215 | |
| 6,163 | |
| Other income | |
| 11,425 | |
| 7,589 | |
| 25,831 | |
| 16,568 | |
| Total non-interest income | |
| 33,626 | |
| 1,217 | |
| 94,448 | |
| 66,480 | |
| | |
| | |
| | |
| | |
| | |
| GENERAL, ADMINISTRATIVE AND OPERATING EXPENSES: | |
| | |
| | |
| | |
| | |
| General and administrative expenses | |
| 9,327 | |
| 6,740 | |
| 35,131 | |
| 22,868 | |
| Base management and incentive fees | |
| — | |
| 2,880 | |
| 1,235 | |
| 5,366 | |
| Expenses related to distressed and other residential mortgage loans | |
| 3,182 | |
| 3,377 | |
| 12,987 | |
| 8,908 | |
| Expenses related to real estate held for sale in consolidated variable interest entities | |
| — | |
| 1,094 | |
| 482 | |
| 4,328 | |
| Total general, administrative and operating expenses | |
| 12,509 | |
| 14,091 | |
| 49,835 | |
| 41,470 | |
| | |
| | |
| | |
| | |
| | |
| INCOME FROM OPERATIONS BEFORE INCOME TAXES | |
| 65,116 | |
| 8,999 | |
| 172,477 | |
| 103,738 | |
| Income tax benefit | |
| (172 | ) |
| (511 | ) |
| (419 | ) |
| (1,057 | ) |
| NET INCOME | |
| 65,288 | |
| 9,510 | |
| 172,896 | |
| 104,795 | |
| Net loss (income) attributable to non-controlling interest in consolidated variable interest entities | |
| 195 | |
| 91 | |
| 840 | |
| (1,909 | ) |
| NET INCOME ATTRIBUTABLE TO COMPANY | |
| 65,483 | |
| 9,601 | |
| 173,736 | |
| 102,886 | |
| Preferred stock dividends | |
| (10,175 | ) |
| (5,925 | ) |
| (28,901 | ) |
| (23,700 | ) |
| NET INCOME ATTRIBUTABLE TO COMPANY'S COMMON STOCKHOLDERS | |
$ | 55,308 | |
$ | 3,676 | |
$ | 144,835 | |
$ | 79,186 | |
| | |
| | |
| | |
| | |
| | |
| Basic earnings per common share | |
$ | 0.20 | |
$ | 0.02 | |
$ | 0.65 | |
$ | 0.62 | |
| Diluted earnings per common share | |
$ | 0.20 | |
$ | 0.02 | |
$ | 0.64 | |
$ | 0.61 | |
| Weighted average shares outstanding-basic | |
| 275,121 | |
| 148,871 | |
| 221,380 | |
| 127,243 | |
| Weighted average shares outstanding-diluted | |
| 296,347 | |
| 149,590 | |
| 242,596 | |
| 147,450 | |
NEW YORK MORTGAGE TRUST, INC. AND SUBSIDIARIES
SUMMARY OF QUARTERLY EARNINGS
(Dollar amounts in thousands, except
per share data)
(unaudited)
| | |
For the Three Months Ended | |
| | |
December 31,
2019 | | |
September 30,
2019 | | |
June 30,
2019 | | |
March 31,
2019 | | |
December 31,
2018 | |
| Net interest income | |
$ | 43,999 | | |
$ | 31,971 | | |
$ | 25,691 | | |
$ | 26,203 | | |
$ | 21,873 | |
| Total non-interest income | |
| 33,626 | | |
| 21,396 | | |
| 8,561 | | |
| 30,865 | | |
| 1,217 | |
| Total general, administrative and operating expenses | |
| 12,509 | | |
| 12,288 | | |
| 12,394 | | |
| 12,644 | | |
| 14,091 | |
| Income from operations before income taxes | |
| 65,116 | | |
| 41,079 | | |
| 21,858 | | |
| 44,424 | | |
| 8,999 | |
| Income tax (benefit) expense | |
| (172 | ) | |
| (187 | ) | |
| (134 | ) | |
| 74 | | |
| (511 | ) |
| Net income | |
| 65,288 | | |
| 41,266 | | |
| 21,992 | | |
| 44,350 | | |
| 9,510 | |
| Net loss (income) attributable to non-controlling interest in consolidated variable interest entities | |
| 195 | | |
| 113 | | |
| 743 | | |
| (211 | ) | |
| 91 | |
| Net income attributable to Company | |
| 65,483 | | |
| 41,379 | | |
| 22,735 | | |
| 44,139 | | |
| 9,601 | |
| Preferred stock dividends | |
| (10,175 | ) | |
| (6,544 | ) | |
| (6,257 | ) | |
| (5,925 | ) | |
| (5,925 | ) |
| Net income attributable to Company's common stockholders | |
| 55,308 | | |
| 34,835 | | |
| 16,478 | | |
| 38,214 | | |
| 3,676 | |
| Basic earnings per common share | |
$ | 0.20 | | |
$ | 0.15 | | |
$ | 0.08 | | |
$ | 0.22 | | |
$ | 0.02 | |
| Diluted earnings per common share | |
$ | 0.20 | | |
$ | 0.15 | | |
$ | 0.08 | | |
$ | 0.21 | | |
$ | 0.02 | |
| Weighted average shares outstanding - basic | |
| 275,121 | | |
| 234,043 | | |
| 200,691 | | |
| 174,421 | | |
| 148,871 | |
| Weighted average shares outstanding - diluted | |
| 296,347 | | |
| 255,537 | | |
| 202,398 | | |
| 194,970 | | |
| 149,590 | |
| | |
| | | |
| | | |
| | | |
| | | |
| | |
| Book value per common share | |
$ | 5.78 | | |
$ | 5.77 | | |
$ | 5.75 | | |
$ | 5.75 | | |
$ | 5.65 | |
| Dividends declared per common share | |
$ | 0.20 | | |
$ | 0.20 | | |
$ | 0.20 | | |
$ | 0.20 | | |
$ | 0.20 | |
| Dividends declared per preferred share on Series B Preferred Stock | |
$ | 0.48 | | |
$ | 0.48 | | |
$ | 0.48 | | |
$ | 0.48 | | |
$ | 0.48 | |
| Dividends declared per preferred share on Series C Preferred Stock | |
$ | 0.49 | | |
$ | 0.49 | | |
$ | 0.49 | | |
$ | 0.49 | | |
$ | 0.49 | |
| Dividends declared per preferred share on Series D Preferred Stock | |
$ | 0.50 | | |
$ | 0.50 | | |
$ | 0.50 | | |
$ | 0.50 | | |
$ | 0.50 | |
| Dividends declared per preferred share on Series E Preferred Stock | |
$ | 0.48 | | |
$ | — | | |
$ | — | | |
$ | — | | |
$ | — | |
Exhibit 99.2

New York Mortgage Trust 2019 Fourth Quarter and Full Year Financial Summary
2 Forward Looking Statements This presentation contains forward - looking statements within the meaning of the safe harbor provisions of the Private Securities Litigation Reform Act of 1995 . Forward - looking statements are based on our beliefs, assumptions and expectations of our future performance, taking into account all information currently available to us . These beliefs, assumptions and expectations are subject to risks and uncertainties and can change as a result of many possible events or factors, not all of which are known to us . If a change occurs, our business, financial condition, liquidity and results of operations may vary materially from those expressed or implied in our forward - looking statements . The following factors are examples of those that could cause actual results to vary from our forward - looking statements : changes in interest rates and the market value of our securities ; changes in credit spreads ; the impact of the downgrade of the long - term credit ratings of the U . S . , Fannie Mae, Freddie Mac, and Ginnie Mae ; market volatility ; changes in the prepayment rates on the mortgage loans underlying our investment securities ; increased rates of default and/or decreased recovery rates on our assets ; our ability to borrow to finance our assets ; changes in government regulations affecting our business ; our ability to maintain qualification as a real estate investment trust (“REIT”) for federal tax purposes ; ability to maintain our exemption from registration under the Investment Company Act of 1940 ; and risks associated with investing in real estate assets, including changes in business conditions and the general economy . These and other risks, uncertainties and factors, including the risk factors described in our most recent Annual Report on Form 10 - K, as updated and supplemented from time to time, and our subsequent Quarterly Reports on Form 10 - Q and other information that we file from time to time with the U . S . Securities and Exchange Commission (“SEC”) under the Securities Exchange Act of 1934 , as amended (the “Exchange Act”), could cause our actual results to differ materially from those projected in any forward - looking statements we make . All forward - looking statements speak only as of the date on which they are made . Except as required by law, we are not obligated to, and do not intend to, update or revise any forward - looking statements, whether as a result of new information, future events or otherwise . This presentation may not contain all of the information that is important to you . As a result, the information in this presentation should be read together with the information included in our most recent Annual Report on Form 10 - K, as updated and supplemented from time to time, and our subsequent Quarterly Reports on Form 10 - Q and other information that we file under the Exchange Act . References to “the Company,” “NYMT,” “we,” “us,” or “our” refer to New York Mortgage Trust, Inc . , together with its consolidated subsidiaries, unless we specifically state otherwise or the context indicates otherwise . See glossary of defined terms and detailed end notes for additional important disclosures included at the end of this presentation . Fourth quarter and full year 2019 Financial Tables can be viewed in the Company’s press release dated February 24 , 2020 posted on the Company’s website at http : //www . nymtrust . com under the “Events and Presentations” section .

3 Management Steven Mumma Chairman and CEO Jason Serrano President “During a year in which the Company nearly doubled its equity market capitalization and investment portfolio, the steady and disciplined execution of the Company’s credit - focused investment strategy by its team of professionals has produced impressive results . The Company finished the year on a strong note, generating $ 0 . 20 per share of GAAP earnings and $ 0 . 21 per share of comprehensive income for the fourth quarter of 2019 . For the full year, the Company earned $ 0 . 65 per share in GAAP earnings, while posting comprehensive income of $ 0 . 87 per share, equivalent to 109 % of common share dividends declared during the year . The Company’s financial performance generated economic returns of 3 . 6 % and 16 . 5 % for the fourth quarter and full year 2019 , respectively . Over the last three years, the Company has delivered an average annual economic return of 12 % . ” “NYMT’s core operating model centers around efficiency and flexibility . The Company’s growth within the Multi - Family and Single - Family strategies was achieved through adherence to these principles . The Company adopts a total return approach and targets investments that will add additional value to our existing portfolio of diverse income - producing assets . By broadening our sources of income through recurring gains and new opportunities that the market may offer, the Company will continue to drive earnings while reducing expense levels on a relative basis . Therefore, the Company will continue to focus on new, niche subsectors to drive total returns and mitigate against the potential volatility associated with high leverage . ”
Table of Contents Company Overview Financial Summary Market Update Strategy Updates 2020 Developments Quarterly Comparative Financial Information Appendix Glossary End Notes Capital Allocation Reconciliation of Net Interest Income

Company Overview
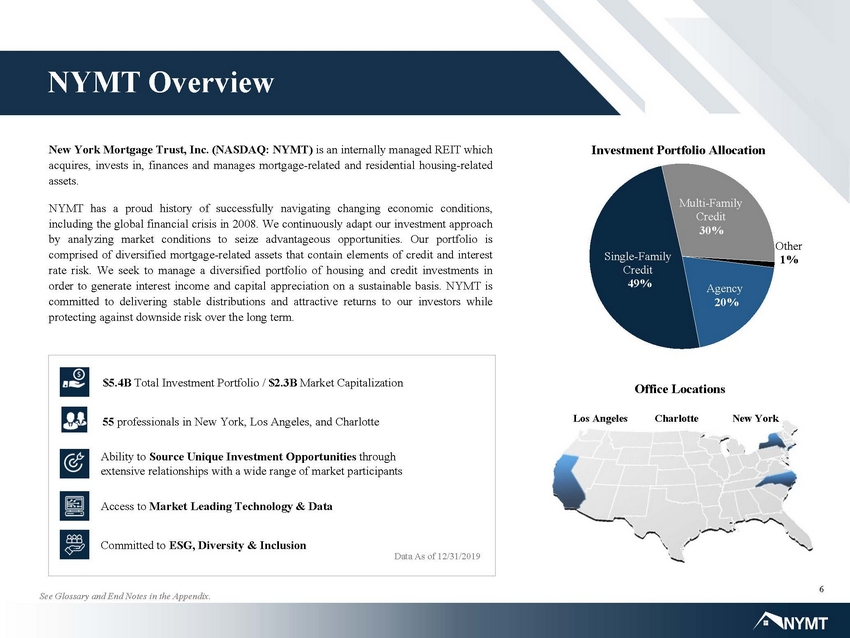
6 NYMT Overview 55 professionals in New York, Los Angeles, and Charlotte Access to Market Leading Technology & Data Committed to ESG, Diversity & Inclusion Ability to Source Unique Investment Opportunities through extensive relationships with a wide range of market participants $5.4B Total Investment Portfolio / $2.3B Market Capitalization Charlotte New York Los Angeles Investment Portfolio Allocation Office Locations Data As of 12/31/2019 Agency 20% Single - Family Credit 49% Multi - Family Credit 30% Other 1% New York Mortgage Trust, Inc . (NASDAQ : NYMT) is an internally managed REIT which acquires, invests in, finances and manages mortgage - related and residential housing - related assets . NYMT has a proud history of successfully navigating changing economic conditions, including the global financial crisis in 2008 . We continuously adapt our investment approach by analyzing market conditions to seize advantageous opportunities . Our portfolio is comprised of diversified mortgage - related assets that contain elements of credit and interest rate risk . We seek to manage a diversified portfolio of housing and credit investments in order to generate interest income and capital appreciation on a sustainable basis . NYMT is committed to delivering stable distributions and attractive returns to our investors while protecting against downside risk over the long term . See Glossary and End Notes in the Appendix.
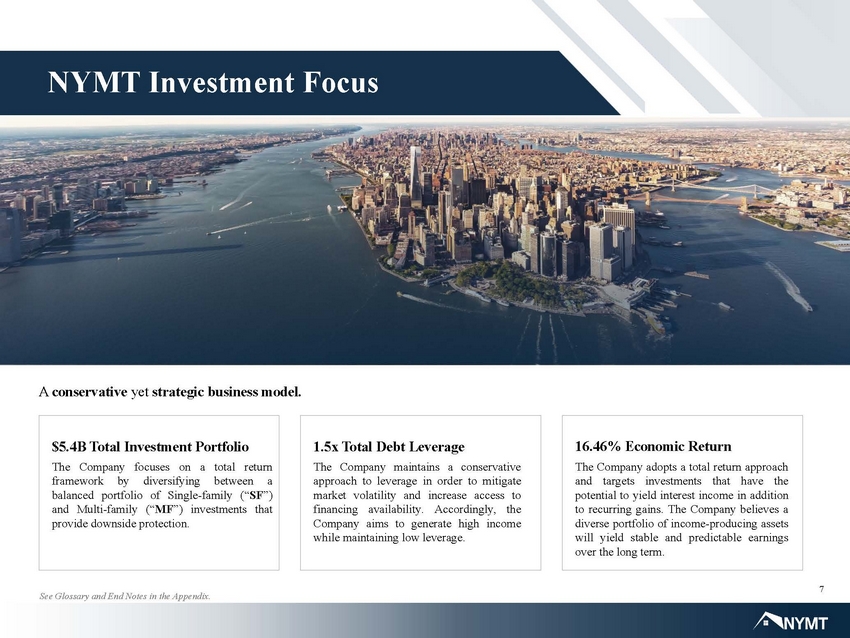
7 NYMT Investment Focus A conservative yet strategic business model. The Company focuses on a total return framework by diversifying between a balanced portfolio of S ingle - family (“ SF ”) and Multi - family (“ MF ”) investments that provide downside protection . $5.4B Total Investment Portfolio The Company maintains a conservative approach to leverage in order to mitigate market volatility and increase access to financing availability . Accordingly, the Company aims to generate high income while maintaining low leverage . 1.5x Total Debt Leverage The Company adopts a total return approach and targets investments that have the potential to yield interest income in addition to recurring gains . The Company believes a diverse portfolio of income - producing assets will yield stable and predictable earnings over the long term . 16.46% Economic Return See Glossary and End Notes in the Appendix.
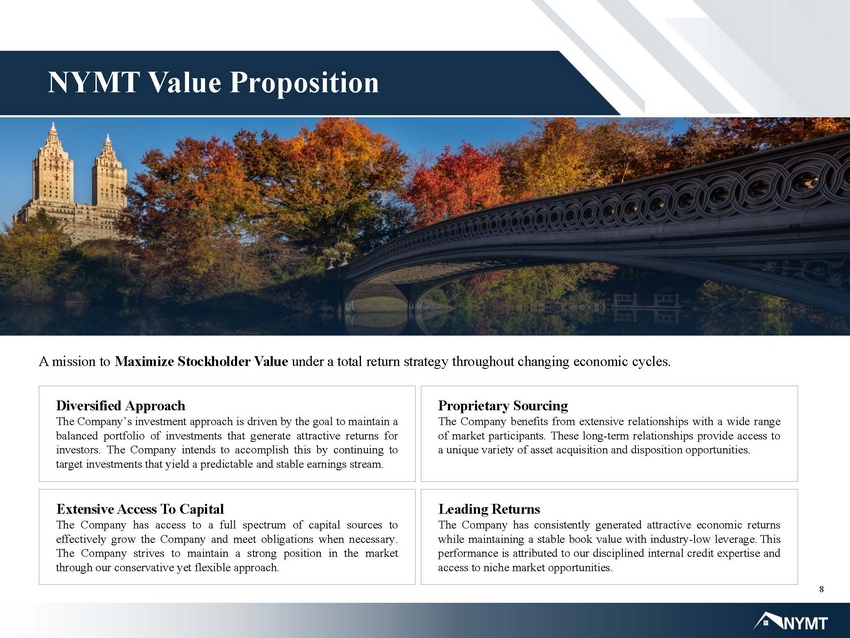
8 NYMT Value Proposition A mission to Maximize Stockholder Value under a total return strategy throughout changing economic cycles. Extensive Access To Capital The Company has access to a full spectrum of capital sources to effectively grow the Company and meet obligations when necessary . The Company strives to maintain a strong position in the market through our conservative yet flexible approach . Leading Returns The Company has consistently generated attractive economic returns while maintaining a stable book value with industry - low leverage . This performance is attributed to our disciplined internal credit expertise and access to niche market opportunities . Diversified Approach The Company’s investment approach is driven by the goal to maintain a balanced portfolio of investments that generate attractive returns for investors . The Company intends to accomplish this by continuing to target investments that yield a predictable and stable earnings stream . Proprietary Sourcing The Company benefits from extensive relationships with a wide range of market participants . These long - term relationships provide access to a unique variety of asset acquisition and disposition opportunities .
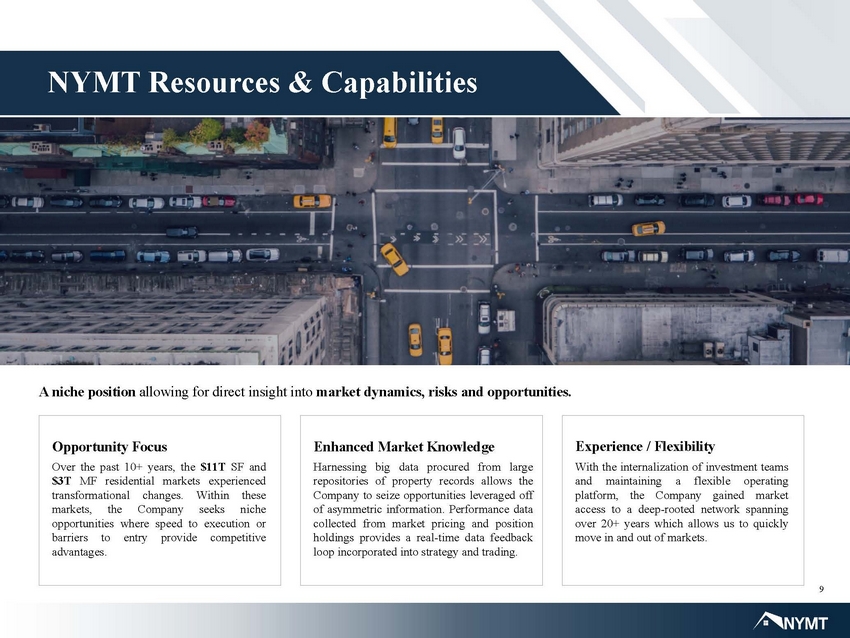
9 NYMT Resources & Capabilities A niche position allowing for direct insight into market dynamics, risks and opportunities. Over the past 10 + years, the $ 11 T SF and $ 3 T MF residential markets experienced transformational changes . Within these markets, the Company seeks niche opportunities where speed to execution or barriers to entry provide competitive advantages . Opportunity Focus Harnessing big data procured from large repositories of property records allows the Company to seize opportunities leveraged off of asymmetric information . Performance data collected from market pricing and position holdings provides a real - time data feedback loop incorporated into strategy and trading . Enhanced Market Knowledge With the internalization of investment teams and maintaining a flexible operating platform, the Company gained market access to a deep - rooted network spanning over 20 + years which allows us to quickly move in and out of markets . Experience / Flexibility
Financial Summary Fourth Quarter & Full Year 2019
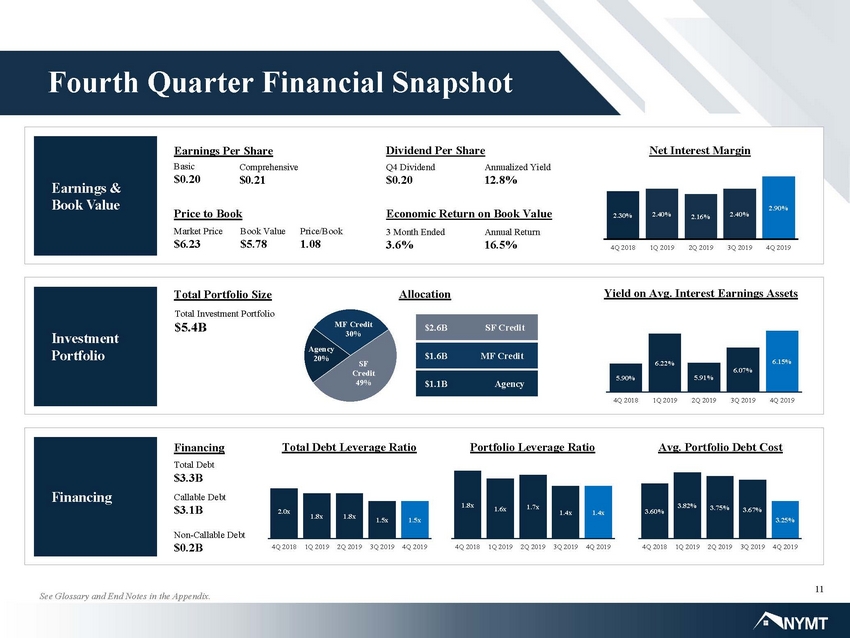
11 Fourth Quarter Financial Snapshot Earnings & Book Value Earnings Per Share Basic $0.20 Comprehensive $0.21 Price to Book Market Price $6.23 Book Value $5.78 Price/Book 1.08 Dividend Per Share Q4 Dividend $0.20 Annualized Yield 12.8% Economic Return on Book Value 3 Month Ended 3.6% Annual Return 16.5% Investment Portfolio Total Investment Portfolio $5.4B Financing Financing Total Debt $3.3B Callable Debt $3.1B 2.30% 2.40% 2.16% 2.40% 2.90% 4Q 2018 1Q 2019 2Q 2019 3Q 2019 4Q 2019 5.90% 6.22% 5.91% 6.07% 6.15% 4Q 2018 1Q 2019 2Q 2019 3Q 2019 4Q 2019 Total Debt Leverage Ratio 2.0x 1.8 x 1.8 x 1.5 x 1.5 x 4Q 2018 1Q 2019 2Q 2019 3Q 2019 4Q 2019 Avg. Portfolio Debt Cost 3.60% 3.82% 3.75% 3.67% 3.25% 4Q 2018 1Q 2019 2Q 2019 3Q 2019 4Q 2019 Portfolio Leverage Ratio 1.8x 1.6 x 1.7 x 1.4 x 1.4x 4Q 2018 1Q 2019 2Q 2019 3Q 2019 4Q 2019 Agency 20% MF Credit 30% SF Credit 49% Allocation $1.1B Agency $1.6B MF Credit $2.6B SF Credit Non - Callable Debt $0.2B Net Interest Margin Yield on Avg. Interest Earnings Assets Total Portfolio Size See Glossary and End Notes in the Appendix.
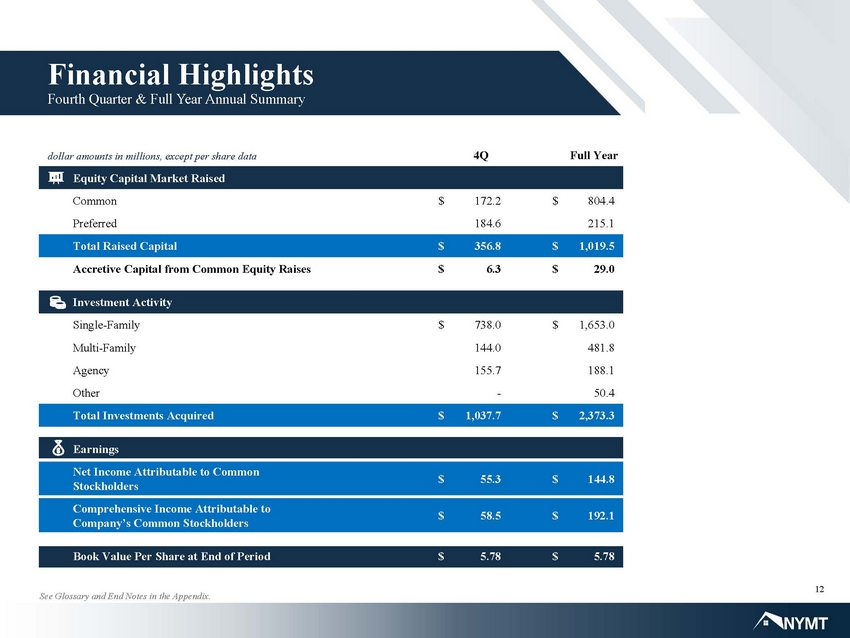
12 dollar amounts in millions, except per share data 4Q Equity Capital Market Raised Common $ 172.2 $ 804.4 Preferred 184.6 215.1 Total Raised Capital $ 356.8 $ 1,019.5 Accretive Capital from Common Equity Raises $ 6.3 $ 29.0 Investment Activity Single - Family $ 738.0 $ 1,653.0 Multi - Family 144.0 481.8 Agency 155.7 188.1 Other - 50.4 Total Investments Acquired $ 1,037.7 $ 2,373.3 Earnings Net Income Attributable to Common Stockholders $ 55.3 $ 144.8 Comprehensive Income Attributable to Company’s Common Stockholders $ 58.5 $ 192.1 Book Value Per Share at End of Period $ 5.78 $ 5.78 Full Year Financial Highlights Fourth Quarter & Full Year Annual Summary See Glossary and End Notes in the Appendix.
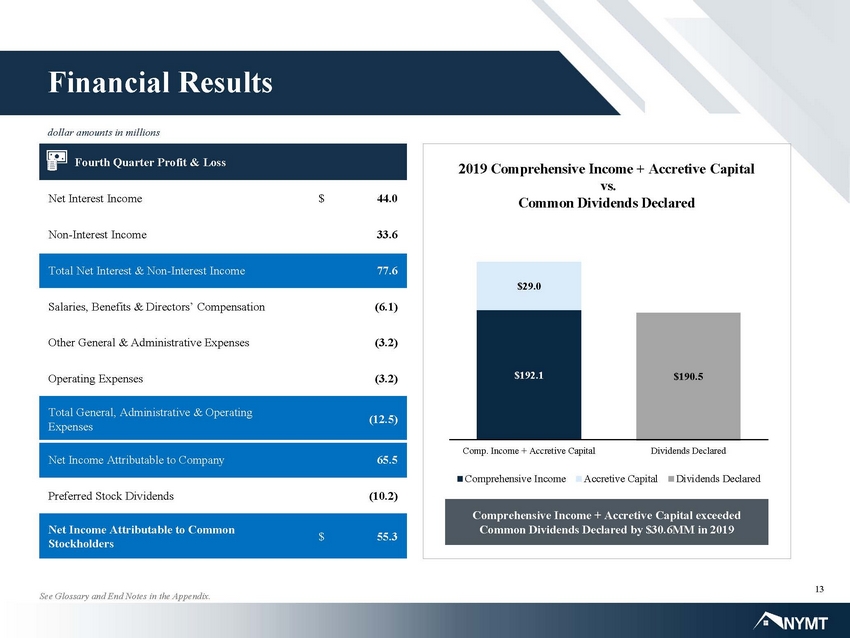
13 Fourth Quarter Profit & Loss Net Interest Income $ 44.0 Non - Interest Income 33.6 Total Net Interest & Non - Interest Income 77.6 Salaries, Benefits & Directors’ Compensation (6.1) Other General & Administrative Expenses (3.2) Operating Expenses (3.2) Total General, Administrative & Operating Expenses (12.5) Net Income Attributable to Company 65.5 Preferred Stock Dividends (10.2) Net Income Attributable to Common Stockholders $ 55.3 Comprehensive Income + Accretive Capital exceeded Common Dividends Declared by $30.6MM in 2019 dollar amounts in millions 2019 Comprehensive Income + Accretive Capital vs. Common Dividends Declared See Glossary and End Notes in the Appendix. Financial Results 0 0.5 1 1.5 2 2.5 3 3.5 4 4.5 5 Comprehensive Income Accretive Capital Dividends Declared Comprehensive Income Accretive Capital Dividends Declared $192.1 $29.0 $ 190.5 Comp. Income + Accretive Capital Dividends Declared
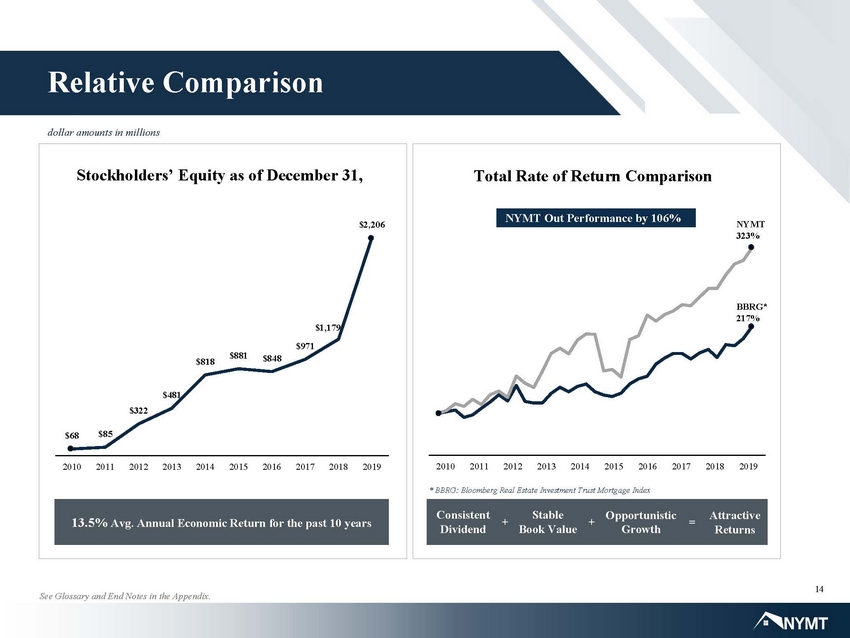
14 13.5% Avg. Annual Economic Return for the past 10 years Relative Comparison Total Rate of Return Comparison $ 68 $85 $ 322 $ 481 $ 818 $ 881 $848 $971 $1,179 $2,206 2010 2011 2012 2013 2014 2015 2016 2017 2018 2019 Stockholders’ Equity as of December 31, Consistent Dividend Stable Book Value Opportunistic Growth Attractive Returns + = + NYMT Out Performance by 106% See Glossary and End Notes in the Appendix. * BBRG: Bloomberg Real Estate Investment Trust Mortgage Index 85.3 322.0 480.7 817.9 880.5 851.2 976.0 500.0 2010 2011 2012 2013 2014 2015 2016 2017 2018 2019 NYMT 323% BBRG* 217% dollar amounts in millions
Market Update
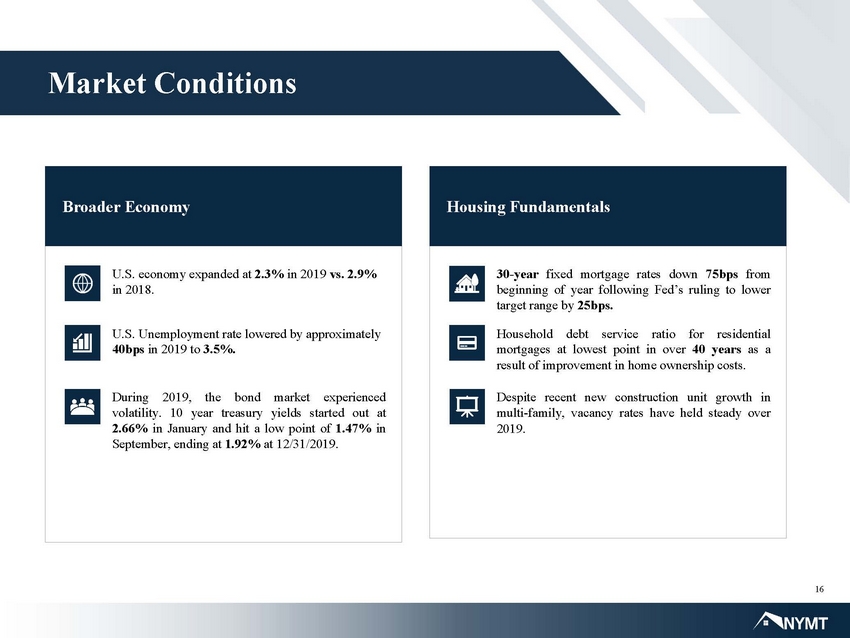
16 U.S. economy expanded at 2.3% in 2019 vs. 2.9% in 2018. U.S. Unemployment rate lowered by approximately 40bps in 2019 to 3.5%. During 2019 , the bond market experienced volatility . 10 year treasury yields started out at 2 . 66 % in January and hit a low point of 1 . 47 % in September, ending at 1 . 92 % at 12 / 31 / 2019 . Housing Fundamentals Broader Economy Market Conditions 30 - year fixed mortgage rates down 75 bps from beginning of year following Fed’s ruling to lower target range by 25 bps . Household debt service ratio for residential mortgages at lowest point in over 40 years as a result of improvement in home ownership costs . Despite recent new construction unit growth in multi - family, vacancy rates have held steady over 2019 .

Strategy Updates
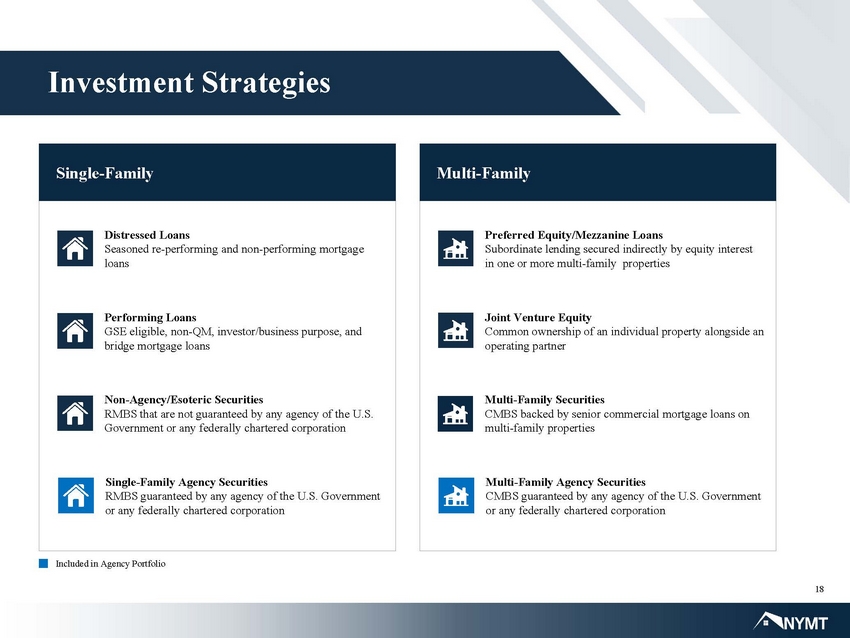
18 Investment Strategies Included in Agency Portfolio Single - Family Distressed Loans Seasoned re - performing and non - performing mortgage loans Single - Family Agency Securities RMBS guaranteed by any agency of the U.S. Government or any federally chartered corporation Performing Loans GSE eligible, non - QM, investor/business purpose, and bridge mortgage loans Non - Agency/Esoteric Securities RMBS that are not guaranteed by any agency of the U.S. Government or any federally chartered corporation Multi - Family Preferred Equity/Mezzanine Loans Subordinate lending secured indirectly by equity interest in one or more multi - family properties Multi - Family Agency Securities CMBS guaranteed by any agency of the U.S. Government or any federally chartered corporation Joint Venture Equity Common ownership of an individual property alongside an operating partner Multi - Family Securities CMBS backed by senior commercial mortgage loans on multi - family properties
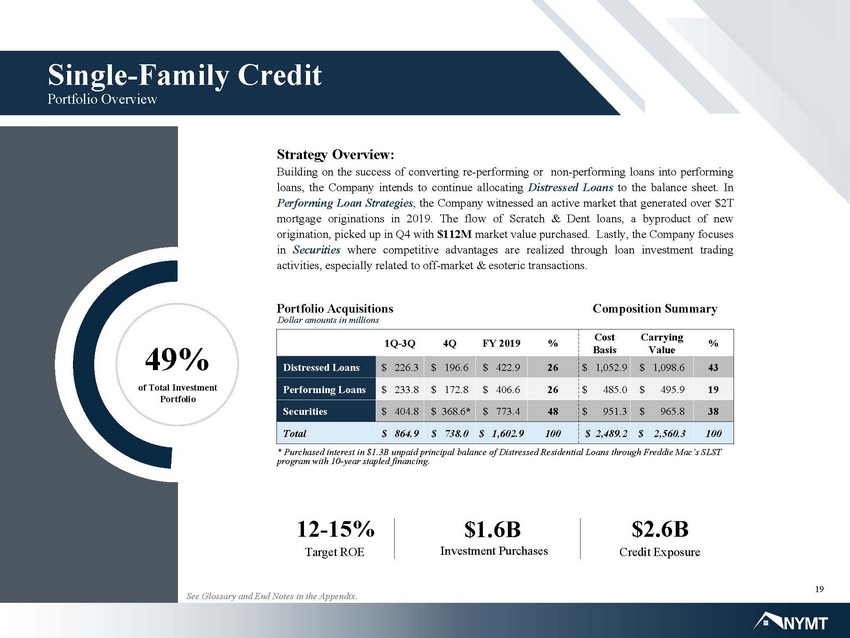
19 Single - Family Credit Portfolio Overview * Purchased interest in $1.3B unpaid principal balance of Distressed Residential Loans through Freddie Mac’s SLST program with 10 - year stapled financing. Dollar amounts in millions 12 - 15% Target ROE $1.6B Investment Purchases $2.6B Credit Exposure 1Q - 3Q 4Q FY 2019 % Cost Basis Carrying Value % Distressed Loans $ 226.3 $ 196.6 $ 422.9 26 $ 1,052.9 $ 1,098.6 43 Performing Loans $ 233.8 $ 172.8 $ 406.6 26 $ 485.0 $ 495.9 19 Securities $ 404.8 $ 368.6 * $ 773.4 48 $ 951.3 $ 965.8 38 Total $ 864.9 $ 738.0 $ 1,602.9 100 $ 2,489.2 $ 2,560.3 100 Strategy Overview : ADSFASDFSDAFAS Building on the success of converting re - performing or non - performing loans into performing loans, the Company intends to continue allocating Distressed Loans to the balance sheet . In Performing Loan Strategies , the Company witnessed an active market that generated over $ 2 T mortgage originations in 2019 . The flow of Scratch & Dent loans, a byproduct of new origination, picked up in Q 4 with $ 112 M market value purchased . Lastly, the Company focuses in Securities where competitive advantages are realized through loan investment trading activities, especially related to off - market & esoteric transactions . 49% of Total Investment Portfolio See Glossary and End Notes in the Appendix. Portfolio Acquisitions Composition Summary
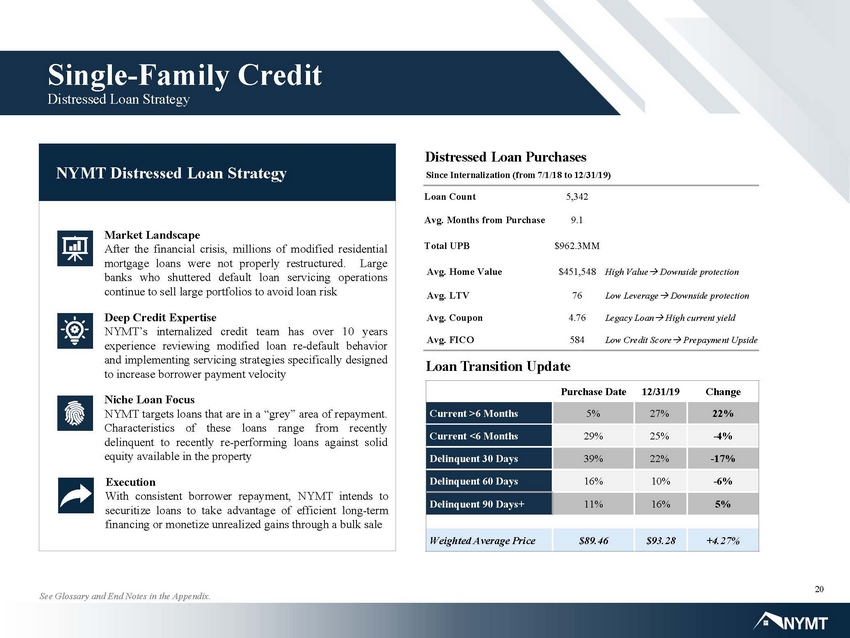
20 Single - Family Credit Distressed Loan Strategy NYMT Distressed Loan Strategy Market Landscape After the financial crisis, millions of modified residential mortgage loans were not properly restructured . Large banks who shuttered default loan servicing operations continue to sell large portfolios to avoid loan risk Execution With consistent borrower repayment, NYMT intends to securitize loans to take advantage of efficient long - term financing or monetize unrealized gains through a bulk sale Deep Credit Expertise NYMT’s internalized credit team has over 10 years experience reviewing modified loan re - default behavior and implementing servicing strategies specifically designed to increase borrower payment velocity Niche Loan Focus NYMT targets loans that are in a “grey” area of repayment . Characteristics of these loans range from recently delinquent to recently re - performing loans against solid equity available in the property Loan Transition Update Purchase Date 12/31/19 Change Current >6 Months 5% 27% 22% Current <6 Months 29% 25% - 4% Delinquent 30 Days 39% 22% - 17% Delinquent 60 Days 16% 10% - 6% Delinquent 90 Days+ 11% 16% 5% Weighted Average Price $89.46 $93.28 +4.27% Distressed Loan Purchases Since Internalization (from 7/1/18 to 12/31/19) Loan Count 5,342 Avg. Months from Purchase 9.1 Total UPB $962.3MM Avg. Home Value $451,548 High Value Downside protection Avg. LTV 76 Low Leverage Downside protection Avg. Coupon 4.76 Legacy Loan High current yield Avg. FICO 584 Low Credit Score Prepayment Upside See Glossary and End Notes in the Appendix.
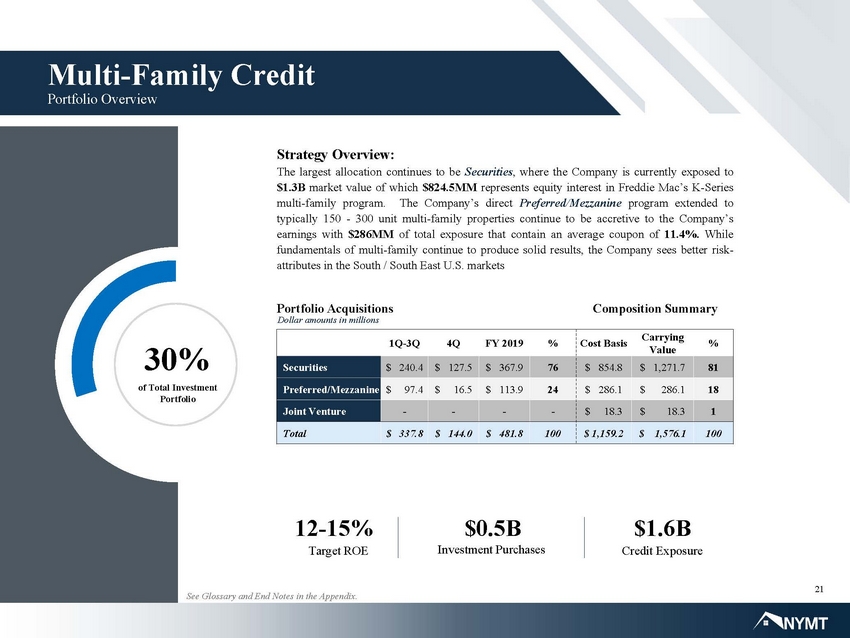
21 Multi - Family Credit Portfolio Overview 30% Dollar amounts in millions 12 - 15% Target ROE $0.5B Investment Purchases $1.6B Credit Exposure Strategy Overview : ADSFASDFSDAFAS The largest allocation continues to be Securities , where the Company is currently exposed to $ 1 . 3 B market value of which $ 824 . 5 MM represents equity interest in Freddie Mac’s K - Series multi - family program . The Company’s direct Preferred/Mezzanine program extended to typically 150 - 300 unit multi - family properties continue to be accretive to the Company’s earnings with $ 286 MM of total exposure that contain an average coupon of 11 . 4 % . While fundamentals of multi - family continue to produce solid results, the Company sees better risk - attributes in the South / South East U . S . markets 1Q - 3Q 4Q FY 2019 % Cost Basis Carrying Value % Securities $ 240.4 $ 127.5 $ 367.9 76 $ 854.8 $ 1,271.7 81 Preferred/Mezzanine $ 97.4 $ 16.5 $ 113.9 24 $ 286.1 $ 286.1 18 Joint Venture - - - - $ 18.3 $ 18.3 1 Total $ 337.8 $ 144.0 $ 481.8 100 $ 1,159.2 $ 1,576.1 100 of Total Investment Portfolio See Glossary and End Notes in the Appendix. Portfolio Acquisitions Composition Summary
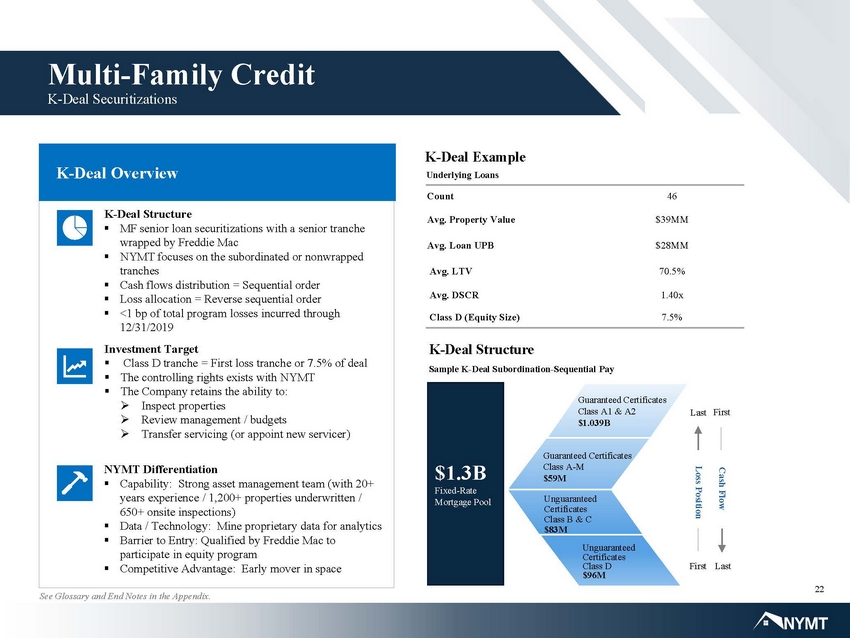
22 K - Deal Overview K - Deal Example Count 46 Avg. Property Value $39MM Avg. Loan UPB $28MM Avg. LTV 70.5% Avg. DSCR 1.40x Class D (Equity Size) 7.5% K - Deal Structure K - Deal Structure ▪ MF senior loan securitizations with a senior tranche wrapped by Freddie Mac ▪ NYMT focuses on the subordinated or nonwrapped tranches ▪ Cash flows distribution = Sequential order ▪ Loss allocation = Reverse sequential order ▪ <1 bp of total program losses incurred through 12/31/2019 Investment Target ▪ Class D tranche = First loss tranche or 7.5% of deal ▪ The controlling rights exists with NYMT ▪ The Company retains the ability to: » Inspect properties » Review management / budgets » Transfer servicing (or appoint new servicer) NYMT Differentiation ▪ Capability: Strong asset management team (with 20+ years experience / 1,200+ properties underwritten / 650+ onsite inspections) ▪ Data / Technology: Mine proprietary data for analytics ▪ Barrier to Entry: Qualified by Freddie Mac to participate in equity program ▪ Competitive Advantage: Early mover in space Multi - Family Credit K - Deal Securitizations Sample K - Deal Subordination - Sequential Pay $1.3B Fixed - Rate Mortgage Pool Guaranteed Certificates Class A1 & A2 $1.039B Guaranteed Certificates Class A - M $59M Unguaranteed Certificates Class B & C $83M Unguaranteed Certificates Class D $96M Underlying Loans First Last Cash Flow Last First Loss Position See Glossary and End Notes in the Appendix.
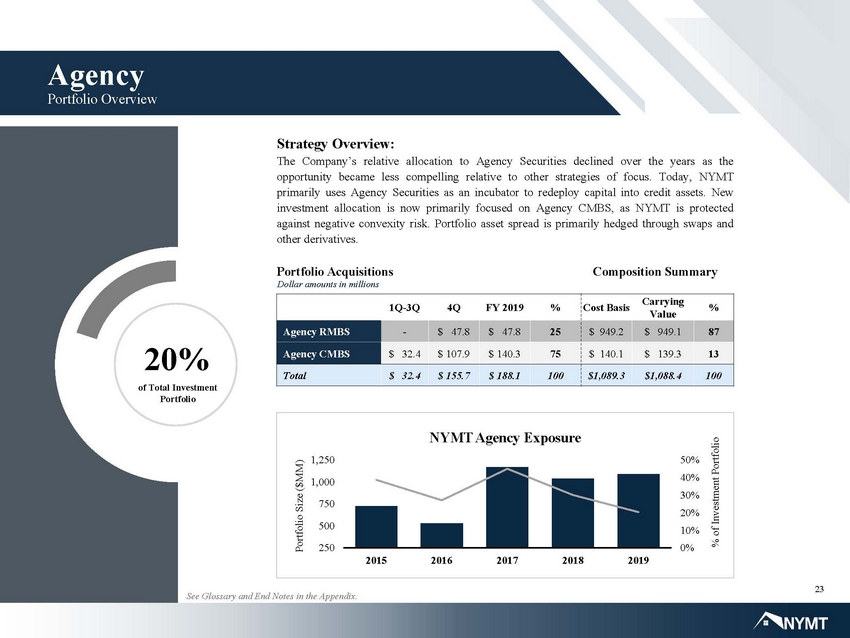
23 Agency Portfolio Overview Strategy Overview : ADSFASDFSDAFAS The Company’s relative allocation to Agency Securities declined over the years as the opportunity became less compelling relative to other strategies of focus . Today, NYMT primarily uses Agency Securities as an incubator to redeploy capital into credit assets . New investment allocation is now primarily focused on Agency CMBS, as NYMT is protected against negative convexity risk . Portfolio asset spread is primarily hedged through swaps and other derivatives . 1Q - 3Q 4Q FY 2019 % Cost Basis Carrying Value % Agency RMBS - $ 47.8 $ 47.8 25 $ 949.2 $ 949.1 87 Agency CMBS $ 32.4 $ 107.9 $ 140.3 75 $ 140.1 $ 139.3 13 Total $ 32.4 $ 155.7 $ 188.1 100 $1,089.3 $1,088.4 100 Dollar amounts in millions 0% 10% 20% 30% 40% 50% 250 500 750 1,000 1,250 2015 2016 2017 2018 2019 % of Investment Portfolio Portfolio Size ($MM) NYMT Agency Exposure 20% of Total Investment Portfolio Portfolio Acquisitions Composition Summary See Glossary and End Notes in the Appendix.
2020 Developments
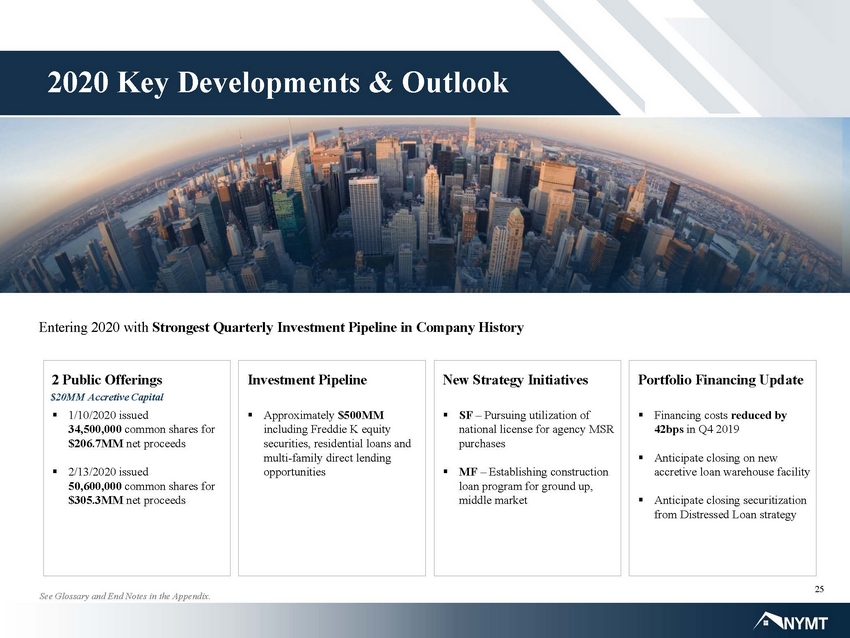
25 ▪ 1/10/2020 issued 34,500,000 common shares for $206.7MM net proceeds ▪ 2/13/2020 issued 50,600,000 common shares for $305.3MM net proceeds 2 Public Offerings $20MM Accretive Capital ▪ Approximately $ 500 MM including Freddie K equity securities, residential loans and multi - family direct lending opportunities Investment Pipeline ▪ SF – Pursuing utilization of national license for agency MSR purchases ▪ MF – Establishing construction loan program for ground up, middle market New Strategy Initiatives ▪ Financing costs reduced by 42bps in Q4 2019 ▪ Anticipate closing on new accretive loan warehouse facility ▪ Anticipate closing securitization from Distressed Loan strategy Portfolio Financing Update 2020 Key Developments & Outlook Entering 2020 with Strongest Quarterly Investment Pipeline in Company History See Glossary and End Notes in the Appendix.
Quarterly Comparative Financial Information
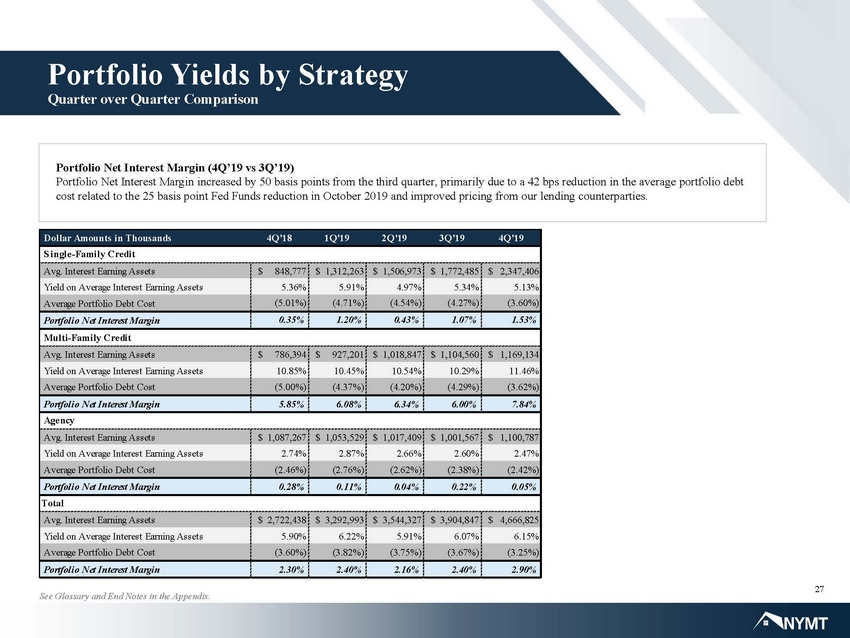
27 Portfolio Yields by Strategy Quarter over Quarter Comparison Portfolio Net Interest Margin (4Q’19 vs 3Q’19) Portfolio Net Interest Margin increased by 50 basis points from the third quarter, primarily due to a 42 bps reduction in the av erage portfolio debt cost related to the 25 basis point Fed Funds reduction in October 2019 and improved pricing from our lending counterparties. Dollar Amounts in Thousands 4Q'18 1Q'19 2Q'19 3Q'19 4Q'19 Avg. Interest Earning Assets $ 848,777 $ 1,312,263 $ 1,506,973 $ 1,772,485 $ 2,347,406 Yield on Average Interest Earning Assets 5.36% 5.91% 4.97% 5.34% 5.13% Average Portfolio Debt Cost (5.01%) (4.71%) (4.54%) (4.27%) (3.60%) Portfolio Net Interest Margin 0.35% 1.20% 0.43% 1.07% 1.53% Avg. Interest Earning Assets $ 786,394 $ 927,201 $ 1,018,847 $ 1,104,560 $ 1,169,134 Yield on Average Interest Earning Assets 10.85% 10.45% 10.54% 10.29% 11.46% Average Portfolio Debt Cost (5.00%) (4.37%) (4.20%) (4.29%) (3.62%) Portfolio Net Interest Margin 5.85% 6.08% 6.34% 6.00% 7.84% Avg. Interest Earning Assets $ 1,087,267 $ 1,053,529 $ 1,017,409 $ 1,001,567 $ 1,100,787 Yield on Average Interest Earning Assets 2.74% 2.87% 2.66% 2.60% 2.47% Average Portfolio Debt Cost (2.46%) (2.76%) (2.62%) (2.38%) (2.42%) Portfolio Net Interest Margin 0.28% 0.11% 0.04% 0.22% 0.05% Avg. Interest Earning Assets $ 2,722,438 $ 3,292,993 $ 3,544,327 $ 3,904,847 $ 4,666,825 Yield on Average Interest Earning Assets 5.90% 6.22% 5.91% 6.07% 6.15% Average Portfolio Debt Cost (3.60%) (3.82%) (3.75%) (3.67%) (3.25%) Portfolio Net Interest Margin 2.30% 2.40% 2.16% 2.40% 2.90% Total Single-Family Credit Multi-Family Credit Agency See Glossary and End Notes in the Appendix.
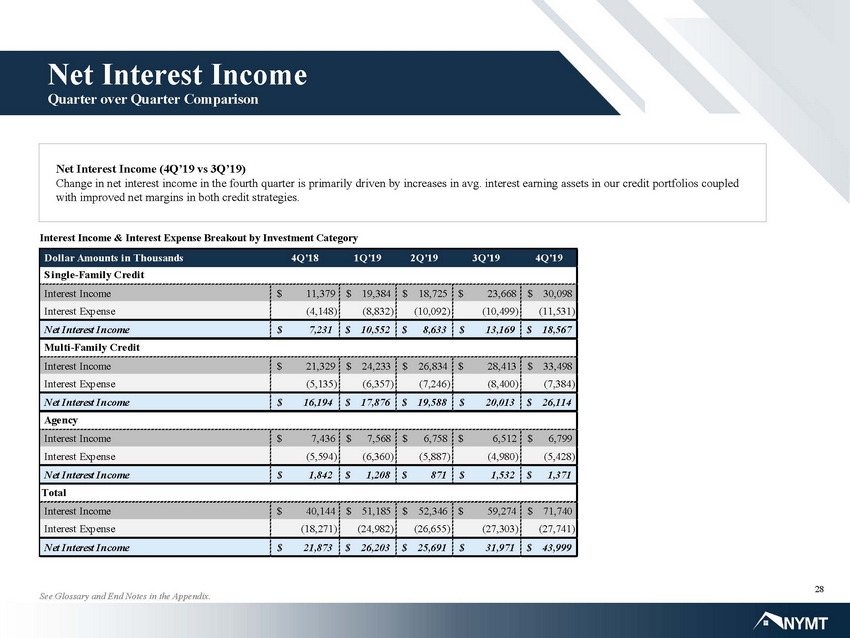
28 Net Interest Income (4Q’19 vs 3Q’19) Change in net interest income in the fourth quarter is primarily driven by increases in avg. interest earning assets in our c red it portfolios coupled with improved net margins in both credit strategies. Dollar Amounts in Thousands 4Q'18 1Q'19 2Q'19 3Q'19 4Q'19 Interest Income $ 11,379 $ 19,384 $ 18,725 $ 23,668 $ 30,098 Interest Expense (4,148) (8,832) (10,092) (10,499) (11,531) Net Interest Income $ 7,231 $ 10,552 $ 8,633 $ 13,169 $ 18,567 Interest Income $ 21,329 $ 24,233 $ 26,834 $ 28,413 $ 33,498 Interest Expense (5,135) (6,357) (7,246) (8,400) (7,384) Net Interest Income $ 16,194 $ 17,876 $ 19,588 $ 20,013 $ 26,114 Interest Income $ 7,436 $ 7,568 $ 6,758 $ 6,512 $ 6,799 Interest Expense (5,594) (6,360) (5,887) (4,980) (5,428) Net Interest Income $ 1,842 $ 1,208 $ 871 $ 1,532 $ 1,371 Interest Income $ 40,144 $ 51,185 $ 52,346 $ 59,274 $ 71,740 Interest Expense (18,271) (24,982) (26,655) (27,303) (27,741) Net Interest Income $ 21,873 $ 26,203 $ 25,691 $ 31,971 $ 43,999 Total Multi-Family Credit Single-Family Credit Agency Interest Income & Interest Expense Breakout by Investment Category Net Interest Income Quarter over Quarter Comparison See Glossary and End Notes in the Appendix.
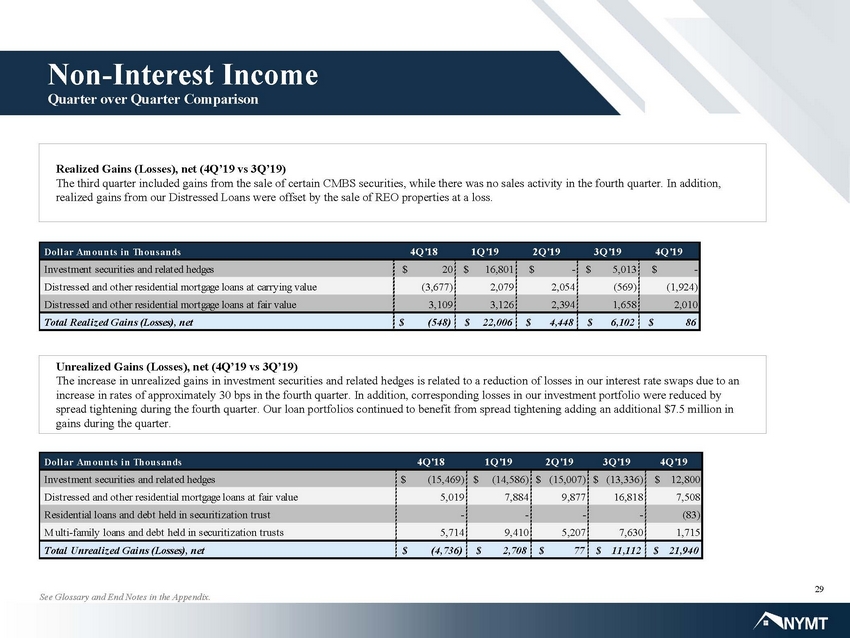
29 Non - Interest Income Quarter over Quarter Comparison Realized Gains (Losses), net (4Q’19 vs 3Q’19) The third quarter included gains from the sale of certain CMBS securities, while there was no sales activity in the fourth qu art er . In addition, realized gains from our Distressed Loans were offset by the sale of REO properties at a loss. Dollar Amounts in Thousands 4Q'18 1Q'19 2Q'19 3Q'19 4Q'19 Investment securities and related hedges $ (15,469) $ (14,586) $ (15,007) $ (13,336) $ 12,800 Distressed and other residential mortgage loans at fair value 5,019 7,884 9,877 16,818 7,508 Residential loans and debt held in securitization trust - - - - (83) Multi-family loans and debt held in securitization trusts 5,714 9,410 5,207 7,630 1,715 Total Unrealized Gains (Losses), net $ (4,736) $ 2,708 $ 77 $ 11,112 $ 21,940 Dollar Amounts in Thousands 4Q'18 1Q'19 2Q'19 3Q'19 4Q'19 Investment securities and related hedges $ 20 $ 16,801 $ - $ 5,013 $ - Distressed and other residential mortgage loans at carrying value (3,677) 2,079 2,054 (569) (1,924) Distressed and other residential mortgage loans at fair value 3,109 3,126 2,394 1,658 2,010 Total Realized Gains (Losses), net $ (548) $ 22,006 $ 4,448 $ 6,102 $ 86 Unrealized Gains (Losses), net (4Q’19 vs 3Q’19) The increase in unrealized gains in investment securities and related hedges is related to a reduction of losses in our inter est rate swaps due to an increase in rates of approximately 30 bps in the fourth quarter. In addition, corresponding losses in our investment portfoli o w ere reduced by spread tightening during the fourth quarter. Our loan portfolios continued to benefit from spread tightening adding an additi ona l $7.5 million in gains during the quarter. See Glossary and End Notes in the Appendix.
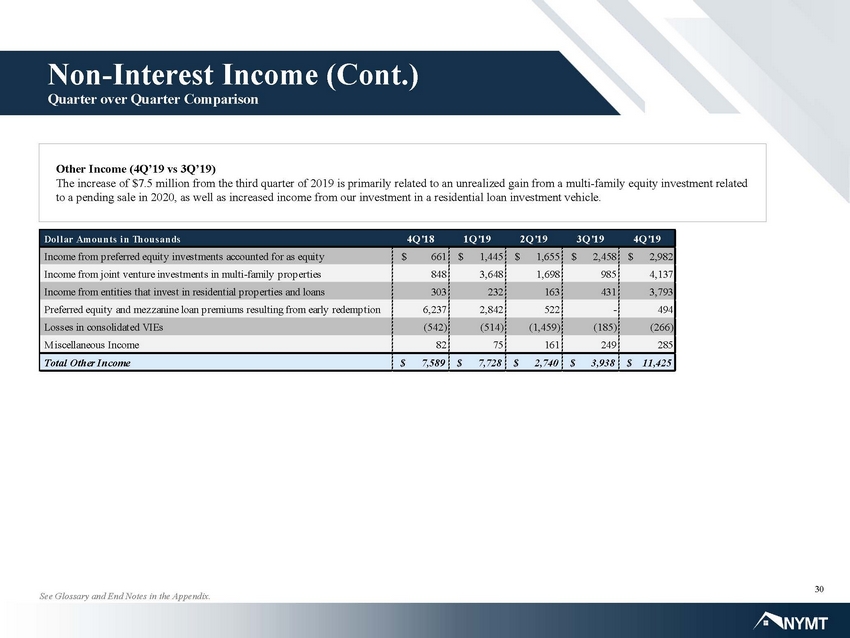
30 Non - Interest Income (Cont.) Quarter over Quarter Comparison Other Income (4Q’19 vs 3Q’19) The increase of $7.5 million from the third quarter of 2019 is primarily related to an unrealized gain from a multi - family equit y investment related to a pending sale in 2020, as well as increased income from our investment in a residential loan investment vehicle. See Glossary and End Notes in the Appendix. Dollar Amounts in Thousands 4Q'18 1Q'19 2Q'19 3Q'19 4Q'19 Income from preferred equity investments accounted for as equity $ 661 $ 1,445 $ 1,655 $ 2,458 $ 2,982 Income from joint venture investments in multi-family properties 848 3,648 1,698 985 4,137 Income from entities that invest in residential properties and loans 303 232 163 431 3,793 Preferred equity and mezzanine loan premiums resulting from early redemption 6,237 2,842 522 - 494 Losses in consolidated VIEs (542) (514) (1,459) (185) (266) Miscellaneous Income 82 75 161 249 285 Total Other Income $ 7,589 $ 7,728 $ 2,740 $ 3,938 $ 11,425
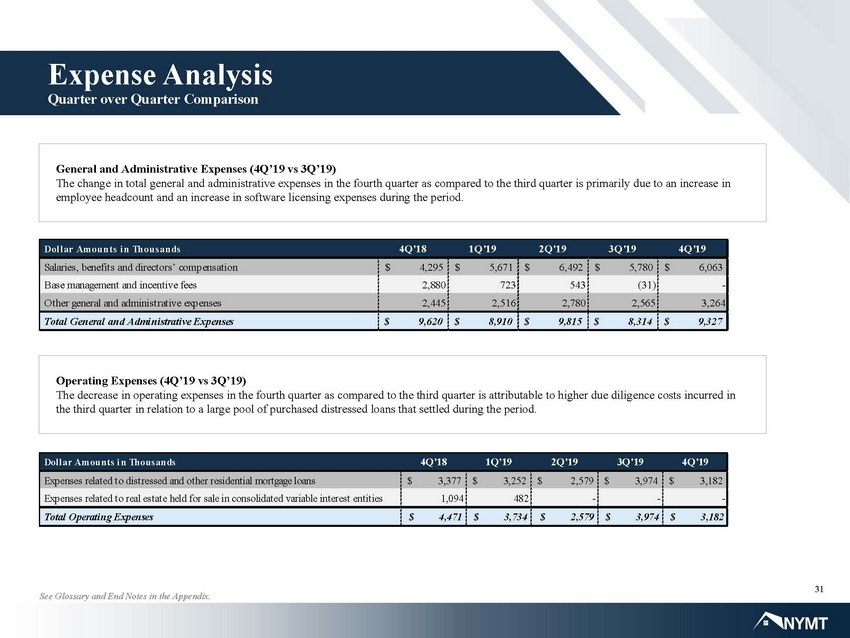
31 Expense Analysis Quarter over Quarter Comparison General and Administrative Expenses (4Q’19 vs 3Q’19) The change in total general and administrative expenses in the fourth quarter as compared to the third quarter is primarily d ue to an increase in employee headcount and an increase in software licensing expenses during the period. Operating Expenses (4Q’19 vs 3Q’19) The decrease in operating expenses in the fourth quarter as compared to the third quarter is attributable to higher due dilig enc e costs incurred in the third quarter in relation to a large pool of purchased distressed loans that settled during the period. See Glossary and End Notes in the Appendix. Dollar Amounts in Thousands 4Q'18 1Q'19 2Q'19 3Q'19 4Q'19 Salaries, benefits and directors’ compensation $ 4,295 $ 5,671 $ 6,492 $ 5,780 $ 6,063 Base management and incentive fees 2,880 723 543 (31) - Other general and administrative expenses 2,445 2,516 2,780 2,565 3,264 Total General and Administrative Expenses $ 9,620 $ 8,910 $ 9,815 $ 8,314 $ 9,327 Dollar Amounts in Thousands 4Q'18 1Q'19 2Q'19 3Q'19 4Q'19 Expenses related to distressed and other residential mortgage loans $ 3,377 $ 3,252 $ 2,579 $ 3,974 $ 3,182 Expenses related to real estate held for sale in consolidated variable interest entities 1,094 482 - - - Total Operating Expenses $ 4,471 $ 3,734 $ 2,579 $ 3,974 $ 3,182
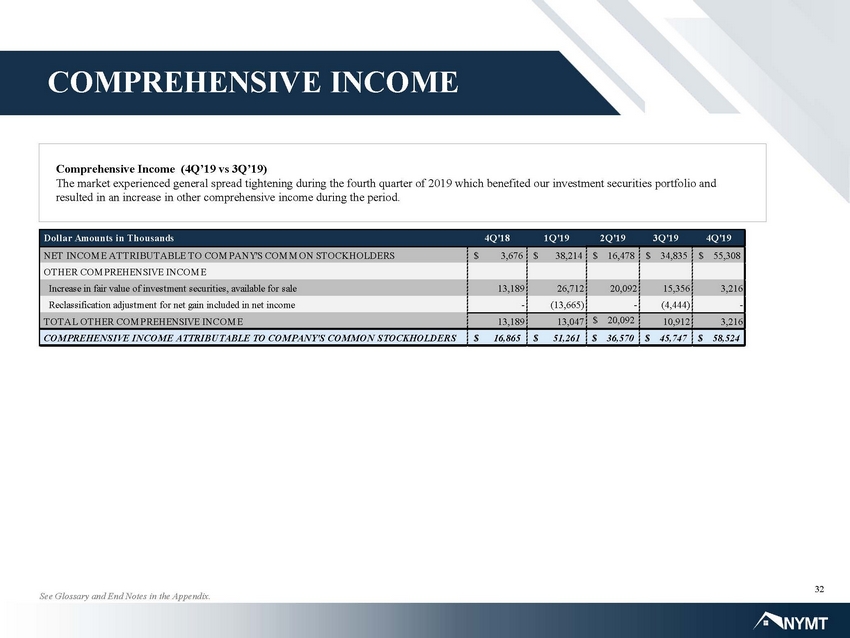
32 COMPREHENSIVE INCOME Comprehensive Income (4Q’19 vs 3Q’19) The market experienced general spread tightening during the fourth quarter of 2019 which benefited our investment securities por tfolio and resulted in an increase in other comprehensive income during the period. See Glossary and End Notes in the Appendix. Dollar Amounts in Thousands 4Q'18 1Q'19 2Q'19 3Q'19 4Q'19 NET INCOME ATTRIBUTABLE TO COMPANY'S COMMON STOCKHOLDERS $ 3,676 $ 38,214 $ 16,478 $ 34,835 $ 55,308 OTHER COMPREHENSIVE INCOME Increase in fair value of investment securities, available for sale 13,189 26,712 20,092 15,356 3,216 Reclassification adjustment for net gain included in net income - (13,665) - (4,444) - TOTAL OTHER COMPREHENSIVE INCOME 13,189 13,047 $ 20,092 10,912 3,216 COMPREHENSIVE INCOME ATTRIBUTABLE TO COMPANY'S COMMON STOCKHOLDERS $ 16,865 $ 51,261 $ 36,570 $ 45,747 $ 58,524
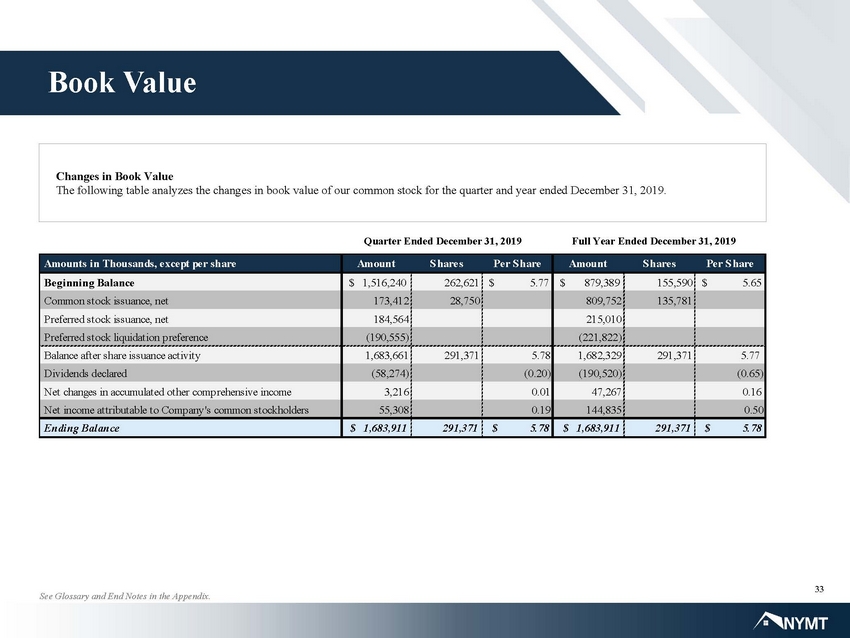
33 Book Value Changes in Book Value The following table analyzes the changes in book value of our common stock for the quarter and year ended December 31, 2019. Quarter Ended December 31, 2019 Full Year Ended December 31, 2019 See Glossary and End Notes in the Appendix. Amounts in Thousands, except per share Amount Shares Per Share Amount Shares Per Share Beginning Balance $ 1,516,240 262,621 $ 5.77 $ 879,389 155,590 $ 5.65 Common stock issuance, net 173,412 28,750 809,752 135,781 Preferred stock issuance, net 184,564 215,010 Preferred stock liquidation preference (190,555) (221,822) Balance after share issuance activity 1,683,661 291,371 5.78 1,682,329 291,371 5.77 Dividends declared (58,274) (0.20) (190,520) (0.65) Net changes in accumulated other comprehensive income 3,216 0.01 47,267 0.16 Net income attributable to Company's common stockholders 55,308 0.19 144,835 0.50 Ending Balance $ 1,683,911 291,371 $ 5.78 $ 1,683,911 291,371 $ 5.78
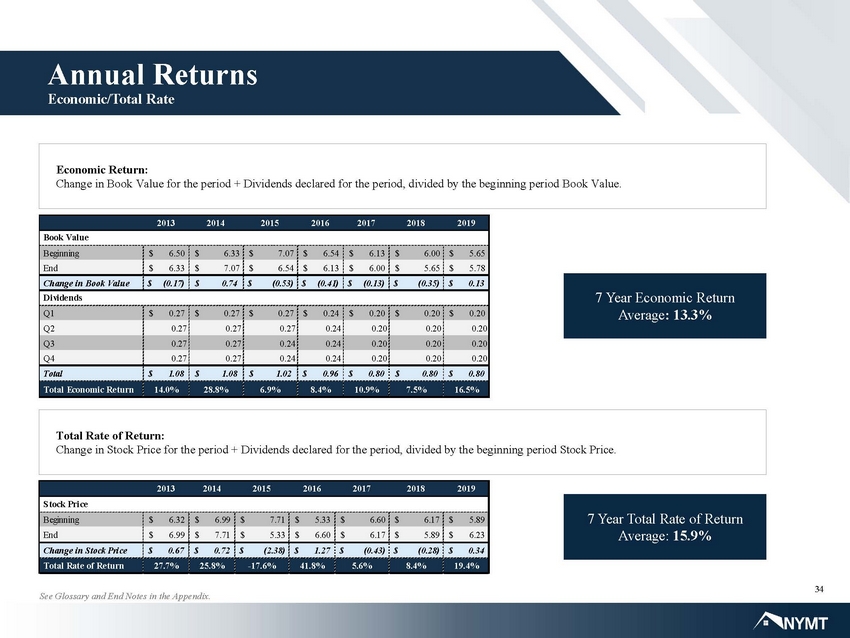
34 Economic Return: Change in Book Value for the period + Dividends declared for the period, divided by the beginning period Book Value. Total Rate of Return: Change in Stock Price for the period + Dividends declared for the period, divided by the beginning period Stock Price. Annual Returns Economic/Total Rate 2013 2014 2015 2016 2017 2018 2019 Beginning $ 6.50 $ 6.33 $ 7.07 $ 6.54 $ 6.13 $ 6.00 $ 5.65 End $ 6.33 $ 7.07 $ 6.54 $ 6.13 $ 6.00 $ 5.65 $ 5.78 Change in Book Value $ (0.17) $ 0.74 $ (0.53) $ (0.41) $ (0.13) $ (0.35) $ 0.13 Q1 $ 0.27 $ 0.27 $ 0.27 $ 0.24 $ 0.20 $ 0.20 $ 0.20 Q2 0.27 0.27 0.27 0.24 0.20 0.20 0.20 Q3 0.27 0.27 0.24 0.24 0.20 0.20 0.20 Q4 0.27 0.27 0.24 0.24 0.20 0.20 0.20 Total $ 1.08 $ 1.08 $ 1.02 $ 0.96 $ 0.80 $ 0.80 $ 0.80 Total Economic Return 14.0% 28.8% 6.9% 8.4% 10.9% 7.5% 16.5% Book Value Dividends 2013 2014 2015 2016 2017 2018 2019 Beginning $ 6.32 $ 6.99 $ 7.71 $ 5.33 $ 6.60 $ 6.17 $ 5.89 End $ 6.99 $ 7.71 $ 5.33 $ 6.60 $ 6.17 $ 5.89 $ 6.23 Change in Stock Price $ 0.67 $ 0.72 $ (2.38) $ 1.27 $ (0.43) $ (0.28) $ 0.34 Total Rate of Return 27.7% 25.8% -17.6% 41.8% 5.6% 8.4% 19.4% Stock Price 7 Year Economic Return Average : 13.3% 7 Year Total Rate of Return Average: 15.9% See Glossary and End Notes in the Appendix.
Appendix
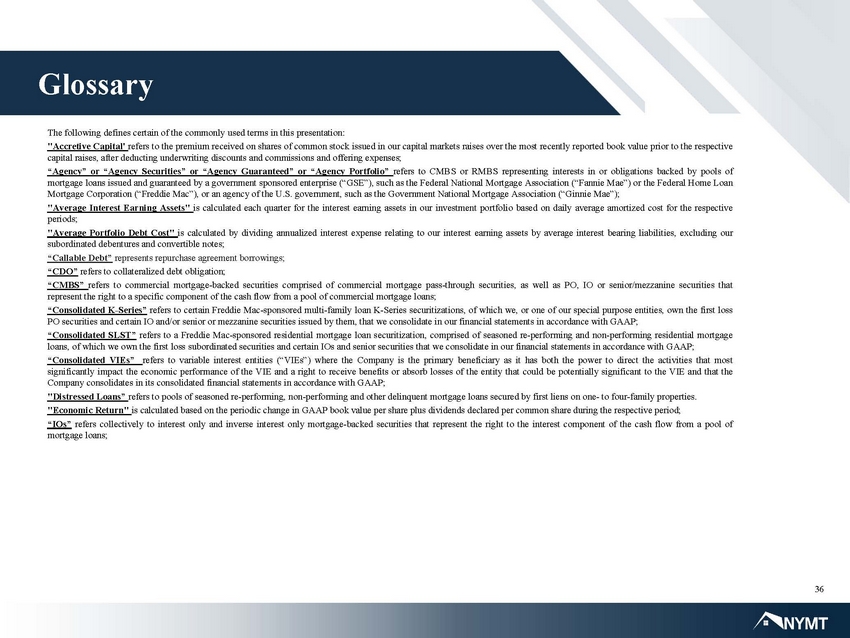
36 The following defines certain of the commonly used terms in this presentation : "Accretive Capital' refers to the premium received on shares of common stock issued in our capital markets raises over the most recently reported book value prior to the respective capital raises, after deducting underwriting discounts and commissions and offering expenses ; “Agency” or “Agency Securities” or “Agency Guaranteed” or “Agency Portfolio” refers to CMBS or RMBS representing interests in or obligations backed by pools of mortgage loans issued and guaranteed by a government sponsored enterprise (“GSE”), such as the Federal National Mortgage Association (“Fannie Mae”) or the Federal Home Loan Mortgage Corporation (“Freddie Mac”), or an agency of the U . S . government, such as the Government National Mortgage Association (“Ginnie Mae”) ; "Average Interest Earning Assets" is calculated each quarter for the interest earning assets in our investment portfolio based on daily average amortized cost for the respective periods ; "Average Portfolio Debt Cost" is calculated by dividing annualized interest expense relating to our interest earning assets by average interest bearing liabilities, excluding our subordinated debentures and convertible notes ; “Callable Debt” represents repurchase agreement borrowings ; “CDO” refers to collateralized debt obligation ; “CMBS” refers to commercial mortgage - backed securities comprised of commercial mortgage pass - through securities, as well as PO, IO or senior/mezzanine securities that represent the right to a specific component of the cash flow from a pool of commercial mortgage loans ; “Consolidated K - Series” refers to certain Freddie Mac - sponsored multi - family loan K - Series securitizations, of which we, or one of our special purpose entities, own the first loss PO securities and certain IO and/or senior or mezzanine securities issued by them, that we consolidate in our financial statements in accordance with GAAP ; “Consolidated SLST” refers to a Freddie Mac - sponsored residential mortgage loan securitization, comprised of seasoned re - performing and non - performing residential mortgage loans, of which we own the first loss subordinated securities and certain IOs and senior securities that we consolidate in our financial statements in accordance with GAAP ; “Consolidated VIEs” refers to variable interest entities (“VIEs”) where the Company is the primary beneficiary as it has both the power to direct the activities that most significantly impact the economic performance of the VIE and a right to receive benefits or absorb losses of the entity that could be potentially significant to the VIE and that the Company consolidates in its consolidated financial statements in accordance with GAAP ; "Distressed Loans” refers to pools of seasoned re - performing, non - performing and other delinquent mortgage loans secured by first liens on one - to four - family properties . "Economic Return" is calculated based on the periodic change in GAAP book value per share plus dividends declared per common share during the respective period ; “IOs” refers collectively to interest only and inverse interest only mortgage - backed securities that represent the right to the interest component of the cash flow from a pool of mortgage loans ; Glossary
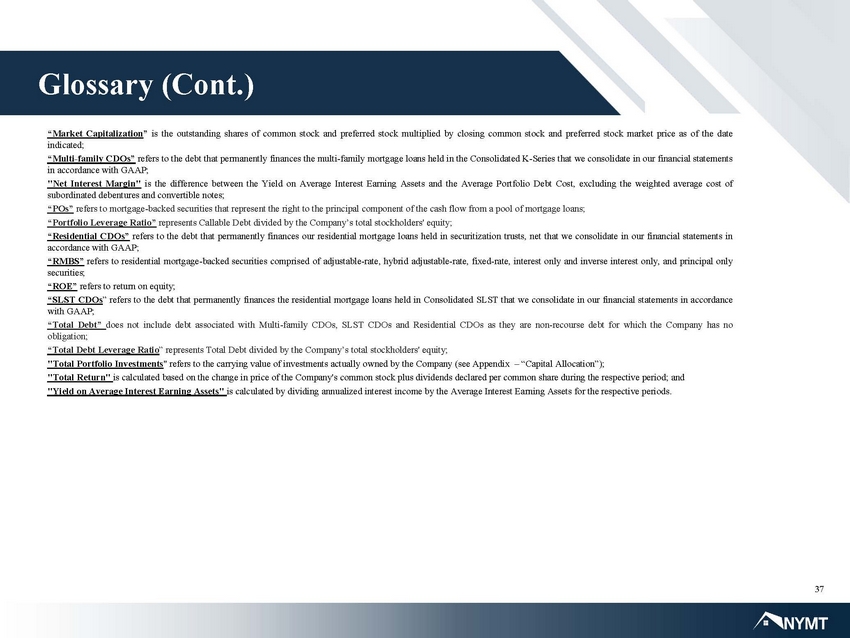
37 “Market Capitalization ” is the outstanding shares of common stock and preferred stock multiplied by closing common stock and preferred stock market price as of the date indicated ; “Multi - family CDOs” refers to the debt that permanently finances the multi - family mortgage loans held in the Consolidated K - Series that we consolidate in our financial statements in accordance with GAAP ; "Net Interest Margin" is the difference between the Yield on Average Interest Earning Assets and the Average Portfolio Debt Cost, excluding the weighted average cost of subordinated debentures and convertible notes ; “POs” refers to mortgage - backed securities that represent the right to the principal component of the cash flow from a pool of mortgage loans ; “Portfolio Leverage Ratio” represents Callable Debt divided by the Company’s total stockholders' equity ; “Residential CDOs” refers to the debt that permanently finances our residential mortgage loans held in securitization trusts, net that we consolidate in our financial statements in accordance with GAAP ; “RMBS” refers to residential mortgage - backed securities comprised of adjustable - rate, hybrid adjustable - rate, fixed - rate, interest only and inverse interest only, and principal only securities ; “ROE” refers to return on equity ; “SLST CDOs ” refers to the debt that permanently finances the residential mortgage loans held in Consolidated SLST that we consolidate in our financial statements in accordance with GAAP ; “Total Debt” does not include debt associated with Multi - family CDOs, SLST CDOs and Residential CDOs as they are non - recourse debt for which the Company has no obligation ; “Total Debt Leverage Ratio ” represents Total Debt divided by the Company’s total stockholders' equity ; "Total Portfolio Investments " refers to the carrying value of investments actually owned by the Company (see Appendix – “Capital Allocation”) ; "Total Return" is calculated based on the change in price of the Company's common stock plus dividends declared per common share during the respective period ; and "Yield on Average Interest Earning Assets" is calculated by dividing annualized interest income by the Average Interest Earning Assets for the respective periods . Glossary (Cont.)
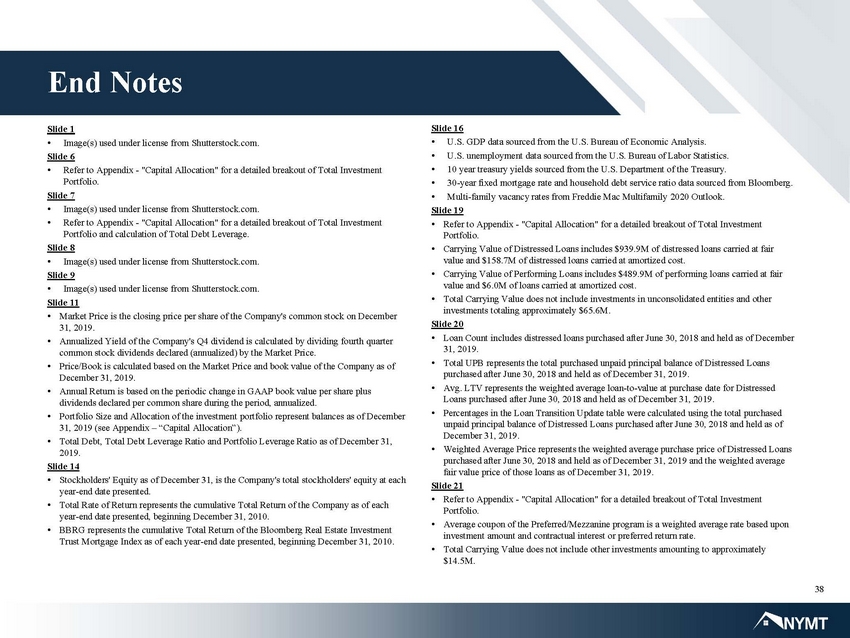
38 End Notes Slide 1 • Image(s) used under license from Shutterstock.com. Slide 6 • Refer to Appendix - "Capital Allocation" for a detailed breakout of Total Investment Portfolio. Slide 7 • Image(s) used under license from Shutterstock.com. • Refer to Appendix - "Capital Allocation" for a detailed breakout of Total Investment Portfolio and calculation of Total Debt Leverage. Slide 8 • Image(s) used under license from Shutterstock.com. Slide 9 • Image(s) used under license from Shutterstock.com. Slide 11 • Market Price is the closing price per share of the Company's common stock on December 31, 2019. • Annualized Yield of the Company's Q4 dividend is calculated by dividing fourth quarter common stock dividends declared (annualized) by the Market Price. • Price/Book is calculated based on the Market Price and book value of the Company as of December 31, 2019. • Annual Return is based on the periodic change in GAAP book value per share plus dividends declared per common share during the period, annualized. • Portfolio Size and Allocation of the investment portfolio represent balances as of December 31, 2019 (see Appendix – “Capital Allocation”). • Total Debt, Total Debt Leverage Ratio and Portfolio Leverage Ratio as of December 31, 2019. Slide 14 • Stockholders' Equity as of December 31, is the Company's total stockholders' equity at each year - end date presented. • Total Rate of Return represents the cumulative Total Return of the Company as of each year - end date presented, beginning December 31, 2010. • BBRG represents the cumulative Total Return of the Bloomberg Real Estate Investment Trust Mortgage Index as of each year - end date presented, beginning December 31, 2010. Slide 16 • U.S. GDP data sourced from the U.S. Bureau of Economic Analysis. • U.S. unemployment data sourced from the U.S. Bureau of Labor Statistics. • 10 year treasury yields sourced from the U.S. Department of the Treasury. • 30 - year fixed mortgage rate and household debt service ratio data sourced from Bloomberg. • Multi - family vacancy rates from Freddie Mac Multifamily 2020 Outlook. Slide 19 • Refer to Appendix - "Capital Allocation" for a detailed breakout of Total Investment Portfolio. • Carrying Value of Distressed Loans includes $939.9M of distressed loans carried at fair value and $158.7M of distressed loans carried at amortized cost. • Carrying Value of Performing Loans includes $489.9M of performing loans carried at fair value and $6.0M of loans carried at amortized cost. • Total Carrying Value does not include investments in unconsolidated entities and other investments totaling approximately $65.6M. Slide 20 • Loan Count includes distressed loans purchased after June 30, 2018 and held as of December 31, 2019. • Total UPB represents the total purchased unpaid principal balance of Distressed Loans purchased after June 30, 2018 and held as of December 31, 2019. • Avg. LTV represents the weighted average loan - to - value at purchase date for Distressed Loans purchased after June 30, 2018 and held as of December 31, 2019. • Percentages in the Loan Transition Update table were calculated using the total purchased unpaid principal balance of Distressed Loans purchased after June 30, 2018 and held as of December 31, 2019. • Weighted Average Price represents the weighted average purchase price of Distressed Loans purchased after June 30, 2018 and held as of December 31, 2019 and the weighted average fair value price of those loans as of December 31, 2019. Slide 21 • Refer to Appendix - "Capital Allocation" for a detailed breakout of Total Investment Portfolio. • Average coupon of the Preferred/Mezzanine program is a weighted average rate based upon investment amount and contractual interest or preferred return rate. • Total Carrying Value does not include other investments amounting to approximately $14.5M.
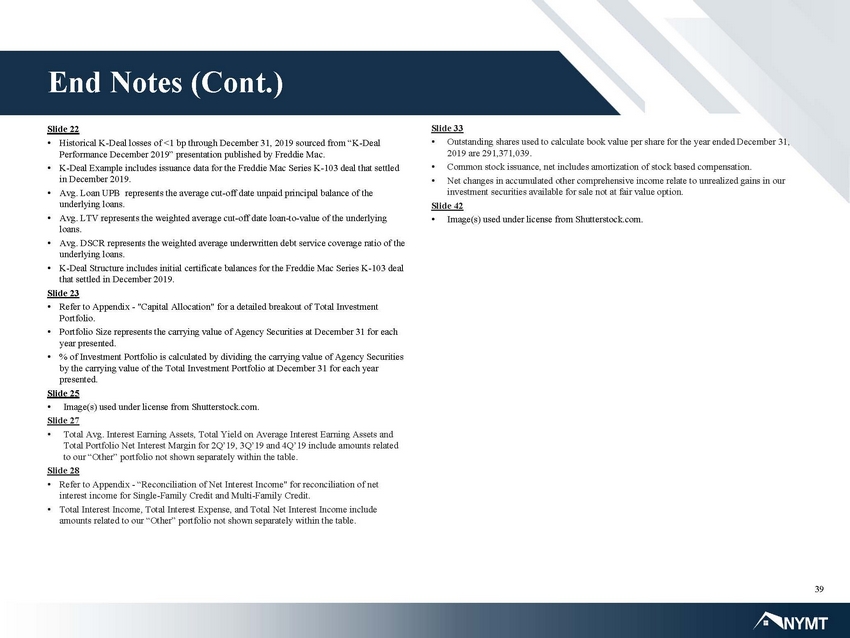
39 End Notes (Cont.) Slide 22 • Historical K - Deal losses of <1 bp through December 31, 2019 sourced from “K - Deal Performance December 2019” presentation published by Freddie Mac. • K - Deal Example includes issuance data for the Freddie Mac Series K - 103 deal that settled in December 2019. • Avg. Loan UPB represents the average cut - off date unpaid principal balance of the underlying loans. • Avg. LTV represents the weighted average cut - off date loan - to - value of the underlying loans. • Avg. DSCR represents the weighted average underwritten debt service coverage ratio of the underlying loans. • K - Deal Structure includes initial certificate balances for the Freddie Mac Series K - 103 deal that settled in December 2019. Slide 23 • Refer to Appendix - "Capital Allocation" for a detailed breakout of Total Investment Portfolio. • Portfolio Size represents the carrying value of Agency Securities at December 31 for each year presented. • % of Investment Portfolio is calculated by dividing the carrying value of Agency Securities by the carrying value of the Total Investment Portfolio at December 31 for each year presented. Slide 25 • Image(s) used under license from Shutterstock.com. Slide 27 • Total Avg. Interest Earning Assets, Total Yield on Average Interest Earning Assets and Total Portfolio Net Interest Margin for 2Q’19, 3Q’19 and 4Q’19 include amounts related to our “Other” portfolio not shown separately within the table. Slide 28 • Refer to Appendix - “Reconciliation of Net Interest Income" for reconciliation of net interest income for Single - Family Credit and Multi - Family Credit. • Total Interest Income, Total Interest Expense, and Total Net Interest Income include amounts related to our “Other” portfolio not shown separately within the table. Slide 33 • Outstanding shares used to calculate book value per share for the year ended December 31, 2019 are 291,371,039. • Common stock issuance, net includes amortization of stock based compensation. • Net changes in accumulated other comprehensive income relate to unrealized gains in our investment securities available for sale not at fair value option. Slide 42 • Image(s) used under license from Shutterstock.com.
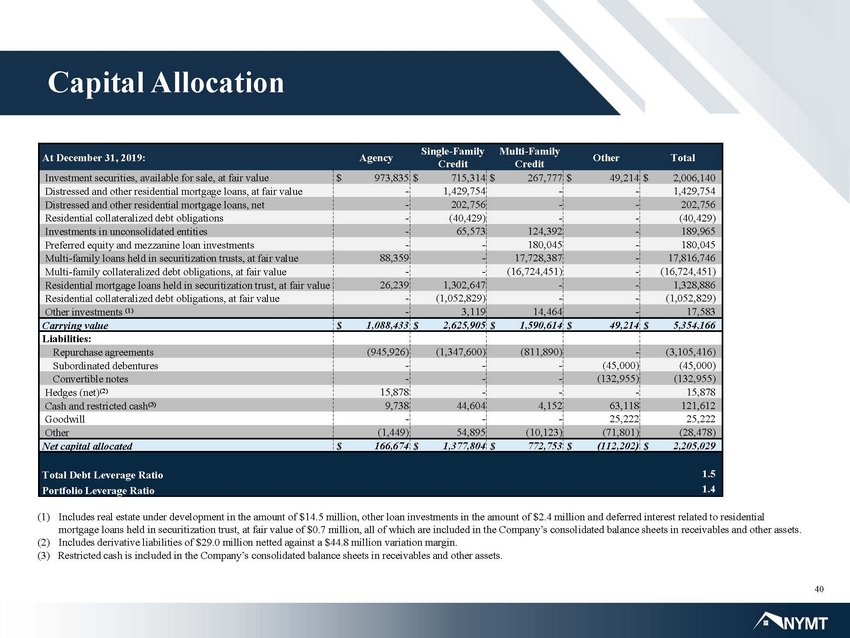
40 At December 31, 2019: Agency Single - Family Credit Multi - Family Credit Other Total Investment securities, available for sale, at fair value $ 973,835 $ 715,314 $ 267,777 $ 49,214 $ 2,006,140 Distressed and other residential mortgage loans, at fair value - 1,429,754 - - 1,429,754 Distressed and other residential mortgage loans, net - 202,756 - - 202,756 Residential collateralized debt obligations - (40,429) - - (40,429) Investments in unconsolidated entities - 65,573 124,392 - 189,965 Preferred equity and mezzanine loan investments - - 180,045 - 180,045 Multi - family loans held in securitization trusts, at fair value 88,359 - 17,728,387 - 17,816,746 Multi - family collateralized debt obligations, at fair value - - (16,724,451) - (16,724,451) Residential mortgage loans held in securitization trust, at fair value 26,239 1,302,647 - - 1,328,886 Residential collateralized debt obligations, at fair value - (1,052,829) - - (1,052,829) Other investments (1) - 3,119 14,464 - 17,583 Carrying value $ 1,088,433 $ 2,625,905 $ 1,590,614 $ 49,214 $ 5,354,166 Liabilities: Repurchase agreements (945,926) (1,347,600) (811,890) - (3,105,416) Subordinated debentures - - - (45,000) (45,000) Convertible notes - - - (132,955) (132,955) Hedges (net) (2) 15,878 - - - 15,878 Cash and restricted cash (3) 9,738 44,604 4,152 63,118 121,612 Goodwill - - - 25,222 25,222 Other (1,449) 54,895 (10,123) (71,801) (28,478) Net capital allocated $ 166,674 $ 1,377,804 $ 772,753 $ (112,202) $ 2,205,029 Total Debt Leverage Ratio 1.5 Portfolio Leverage Ratio 1.4 Capital Allocation (1) Includes real estate under development in the amount of $14.5 million, other loan investments in the amount of $2.4 million a nd deferred interest related to residential mortgage loans held in securitization trust, at fair value of $0.7 million, all of which are included in the Company’s consol ida ted balance sheets in receivables and other assets. (2) Includes derivative liabilities of $29.0 million netted against a $44.8 million variation margin. (3) Restricted cash is included in the Company’s consolidated balance sheets in receivables and other assets.
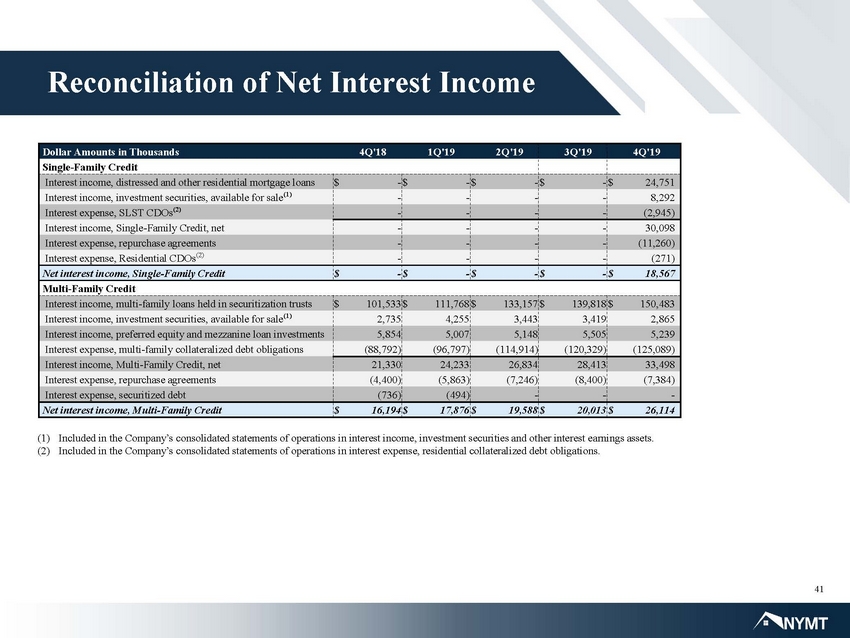
41 Dollar Amounts in Thousands 4Q'18 1Q'19 2Q'19 3Q'19 4Q'19 Single - Family Credit Interest income, distressed and other residential mortgage loans $ - $ - $ - $ - $ 24,751 Interest income, investment securities, available for sale (1) - - - - 8,292 Interest expense, SLST CDOs (2) - - - - (2,945) Interest income, Single - Family Credit, net - - - - 30,098 Interest expense, repurchase agreements - - - - (11,260) Interest expense, Residential CDOs (2) - - - - (271) Net interest income, Single - Family Credit $ - $ - $ - $ - $ 18,567 Multi - Family Credit Interest income, multi - family loans held in securitization trusts $ 101,533 $ 111,768 $ 133,157 $ 139,818 $ 150,483 Interest income, investment securities, available for sale (1) 2,735 4,255 3,443 3,419 2,865 Interest income, preferred equity and mezzanine loan investments 5,854 5,007 5,148 5,505 5,239 Interest expense, multi - family collateralized debt obligations (88,792) (96,797) (114,914) (120,329) (125,089) Interest income, Multi - Family Credit, net 21,330 24,233 26,834 28,413 33,498 Interest expense, repurchase agreements (4,400) (5,863) (7,246) (8,400) (7,384) Interest expense, securitized debt (736) (494) - - - Net interest income, Multi - Family Credit $ 16,194 $ 17,876 $ 19,588 $ 20,013 $ 26,114 Reconciliation of Net Interest Income (1) Included in the Company’s consolidated statements of operations in interest income, investment securities and other interest ear nings assets. (2) Included in the Company’s consolidated statements of operations in interest expense, residential collateralized debt obligati ons .

Thank You From all of us at NYMT