Farmer Mac Reports 2022 Results
- Announces 16% Dividend Increase -
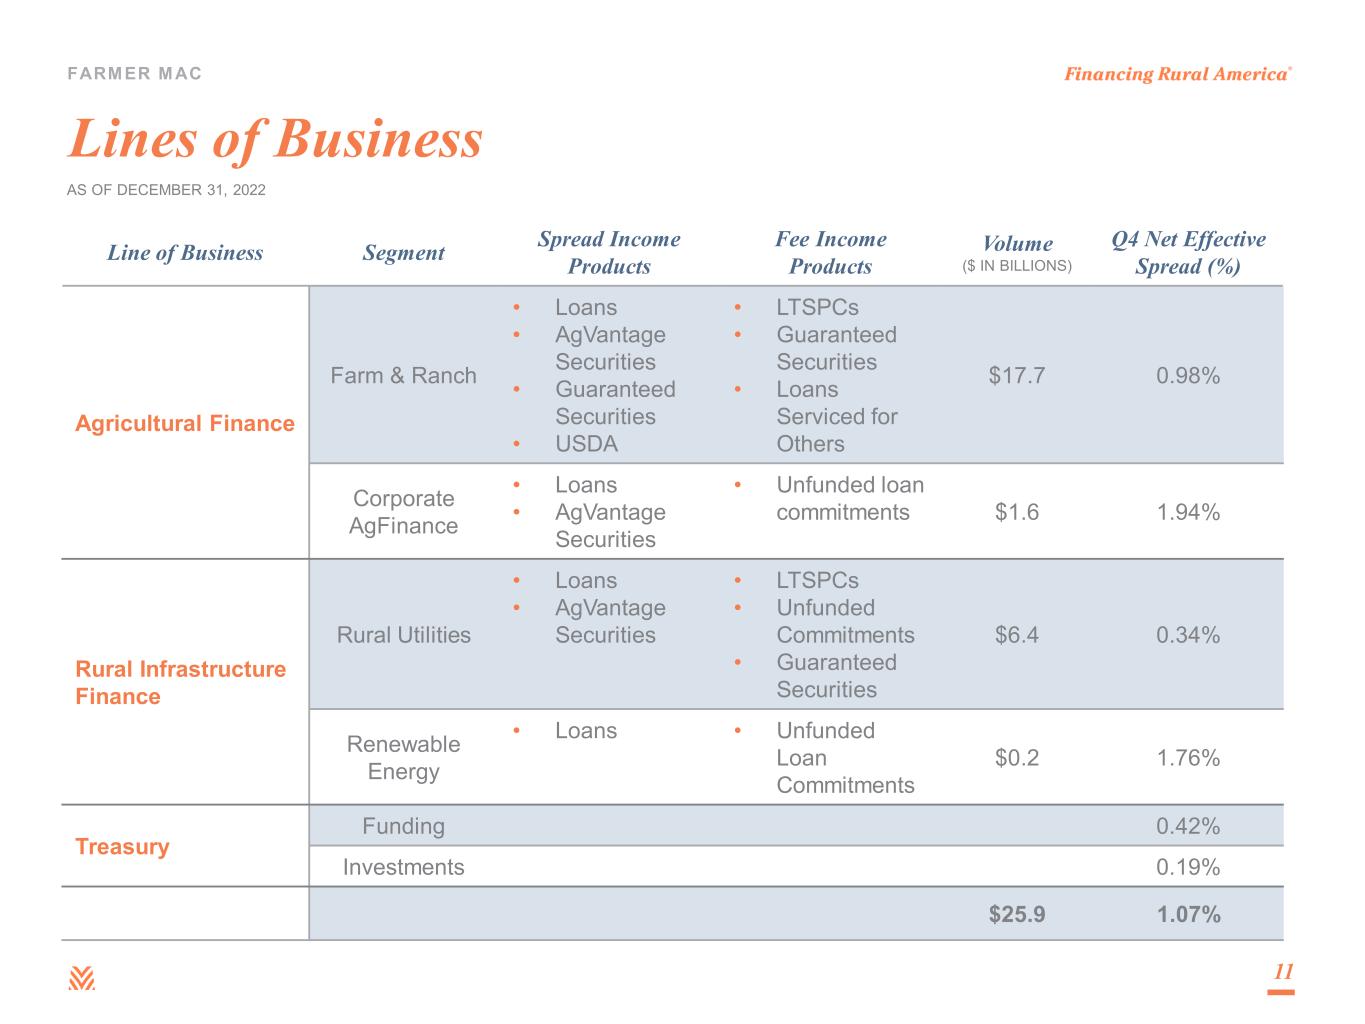
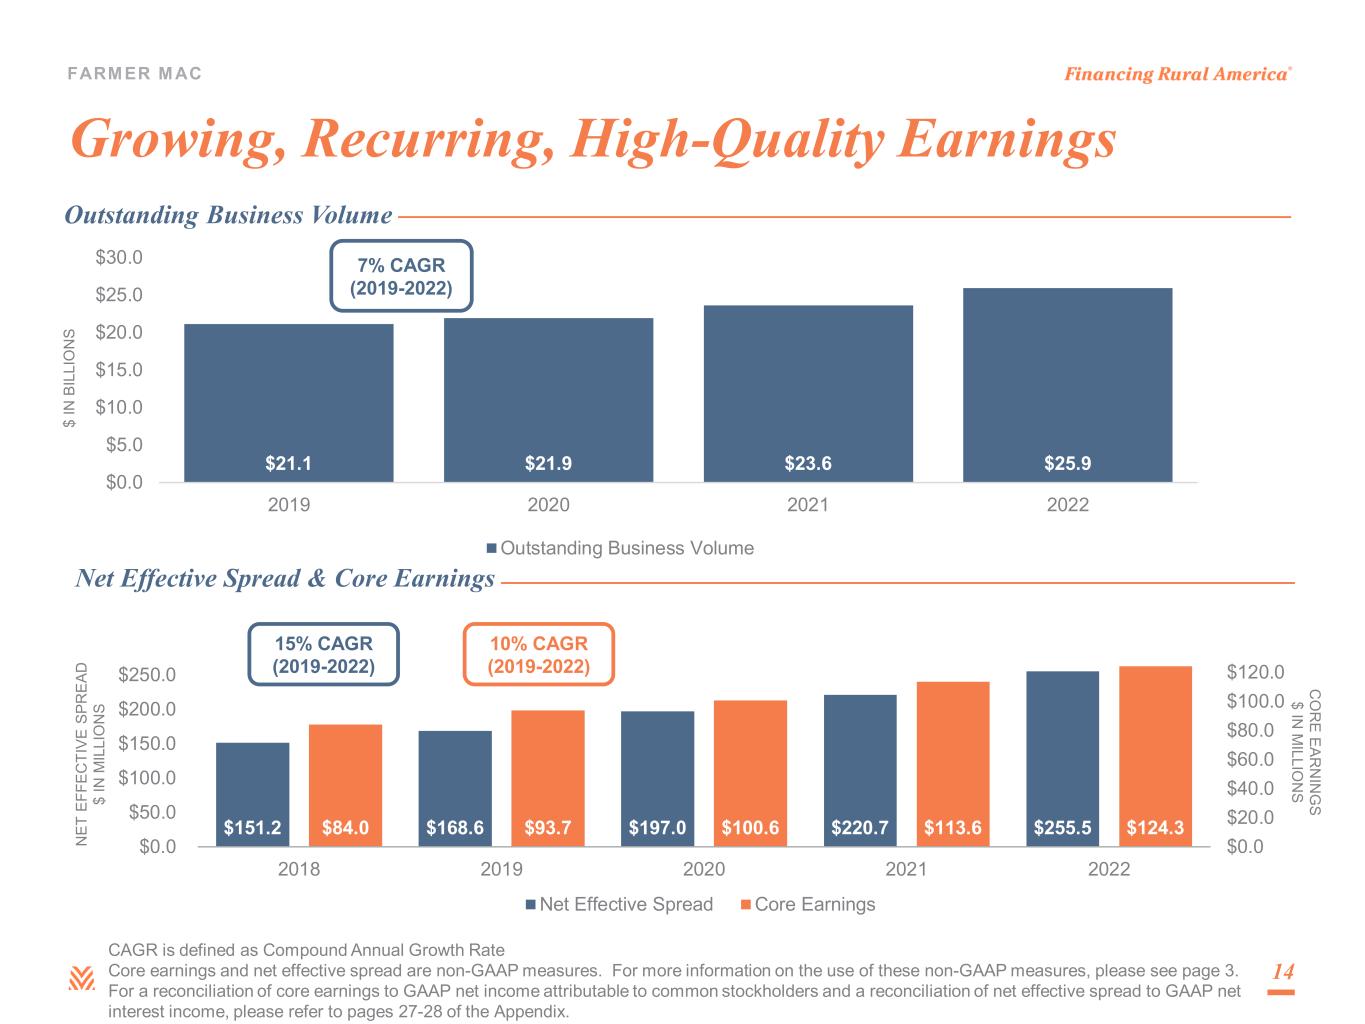
- Outstanding Business Volume of $25.9 Billion -
WASHINGTON, D.C., February 24, 2023 — The Federal Agricultural Mortgage Corporation (Farmer Mac; NYSE: AGM and AGM.A), the nation's secondary market provider that increases the accessibility of financing for American agriculture and rural infrastructure, today announced its results for the fiscal quarter and year ended December 31, 2022.
“Farmer Mac finished 2022 with record financial results because of the solid execution across our growing organization of the strategic initiatives we have put in place over the last several years to build a more diversified business platform,” said President and Chief Executive Officer Brad Nordholm. “We’re focused on our mission of supporting American agriculture and rural infrastructure, and the strong alignment of purpose throughout our organization and customers coupled with our disciplined approach, continue to provide strength and resilience in what has been a volatile operating environment.”
Full Year 2022 and Recent Highlights
•Added $9.0 billion of gross business volume, resulting in net growth of $2.3 billion
•Net interest income grew 22% year-over-year to $270.9 million
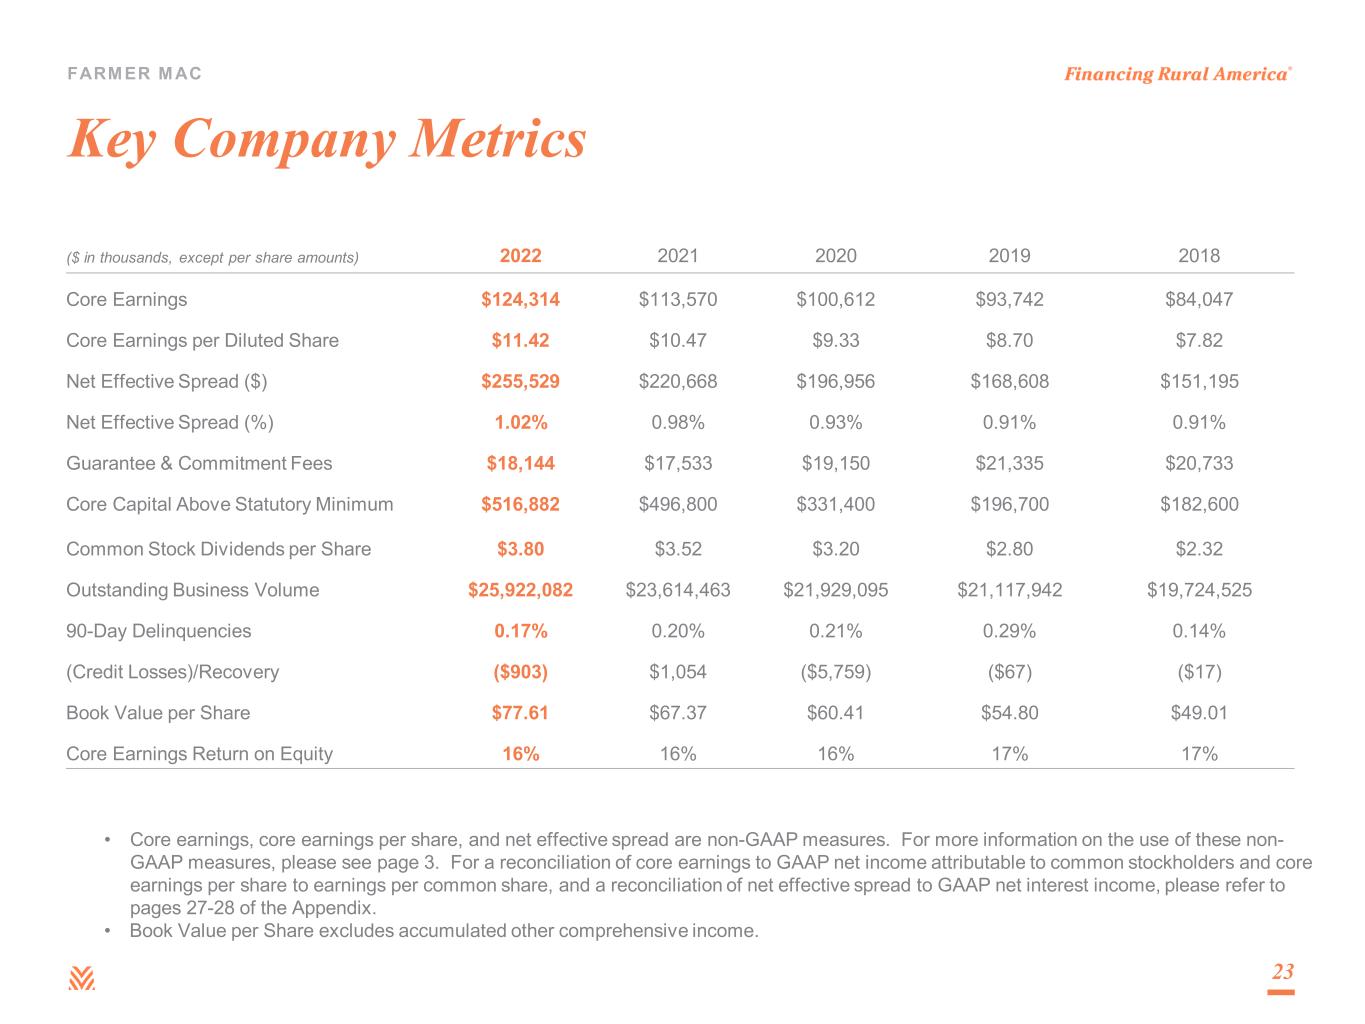
•Net effective spread1 increased 16% from the prior-year period to a record $255.5 million
•Net income attributable to common stockholders increased 36% year-over-year to $151.0 million
•Record core earnings1 of $124.3 million, or $11.42 per diluted common share, reflecting 9% growth year-over-year
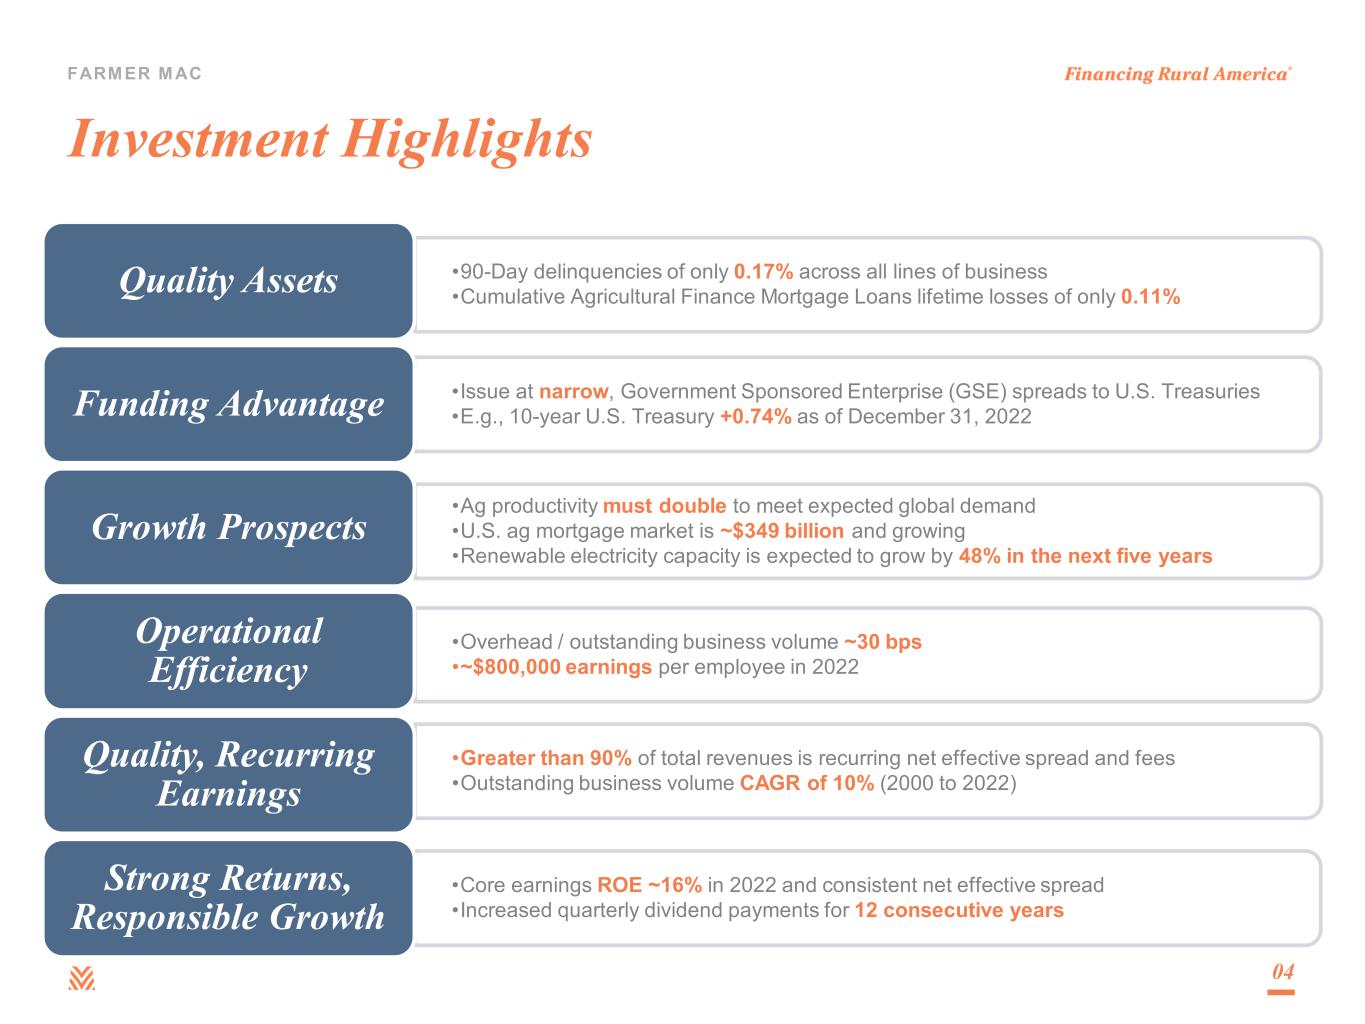
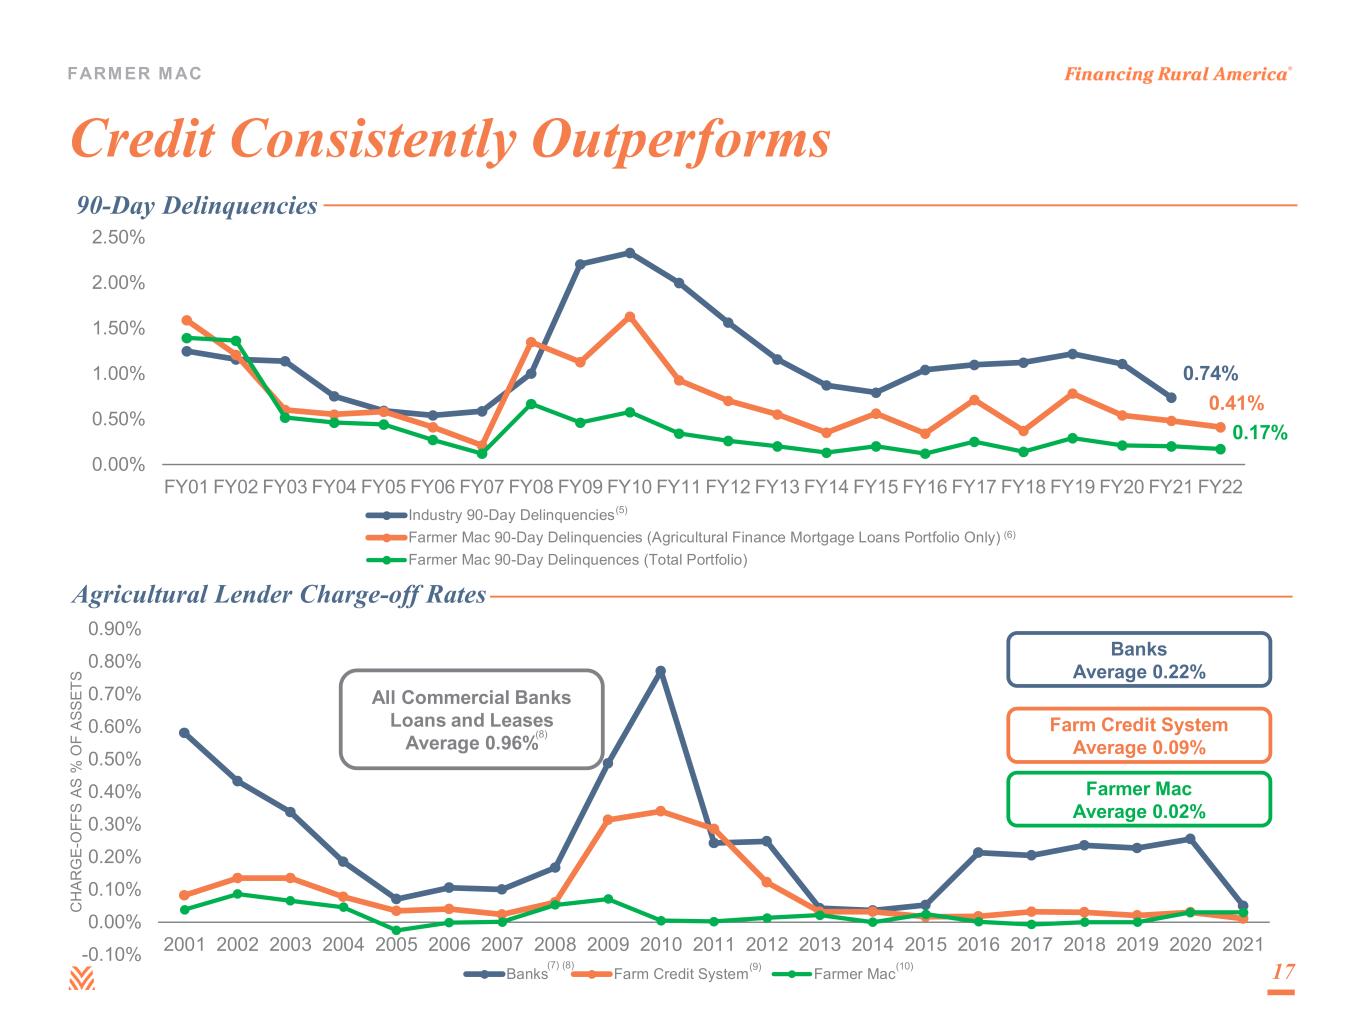
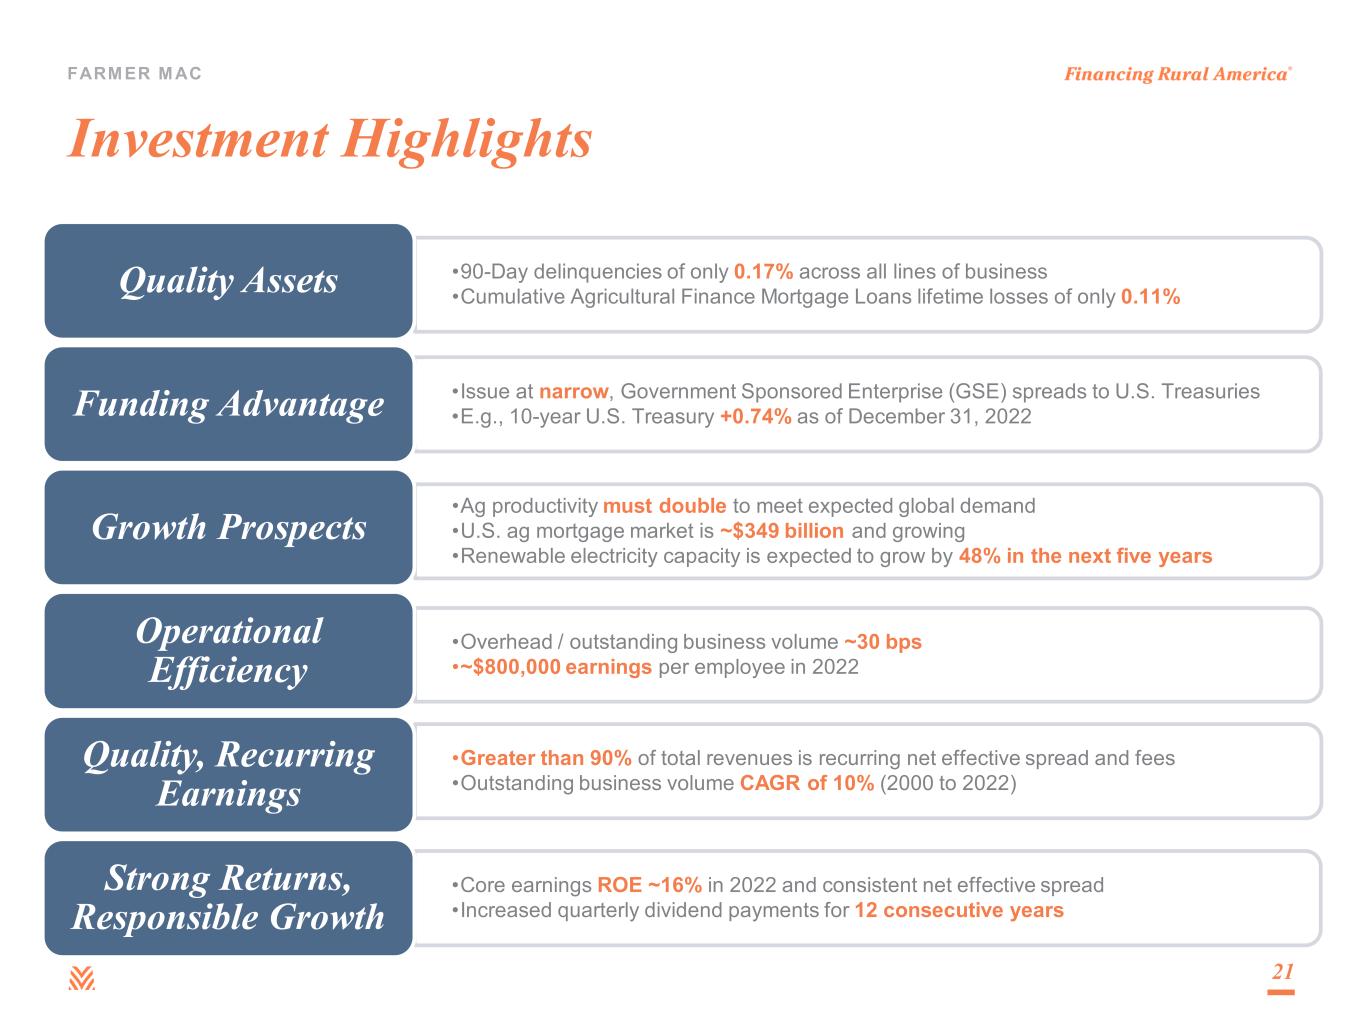
•90-day delinquencies were 0.17% across the entire $25.9 billion portfolio as of year-end
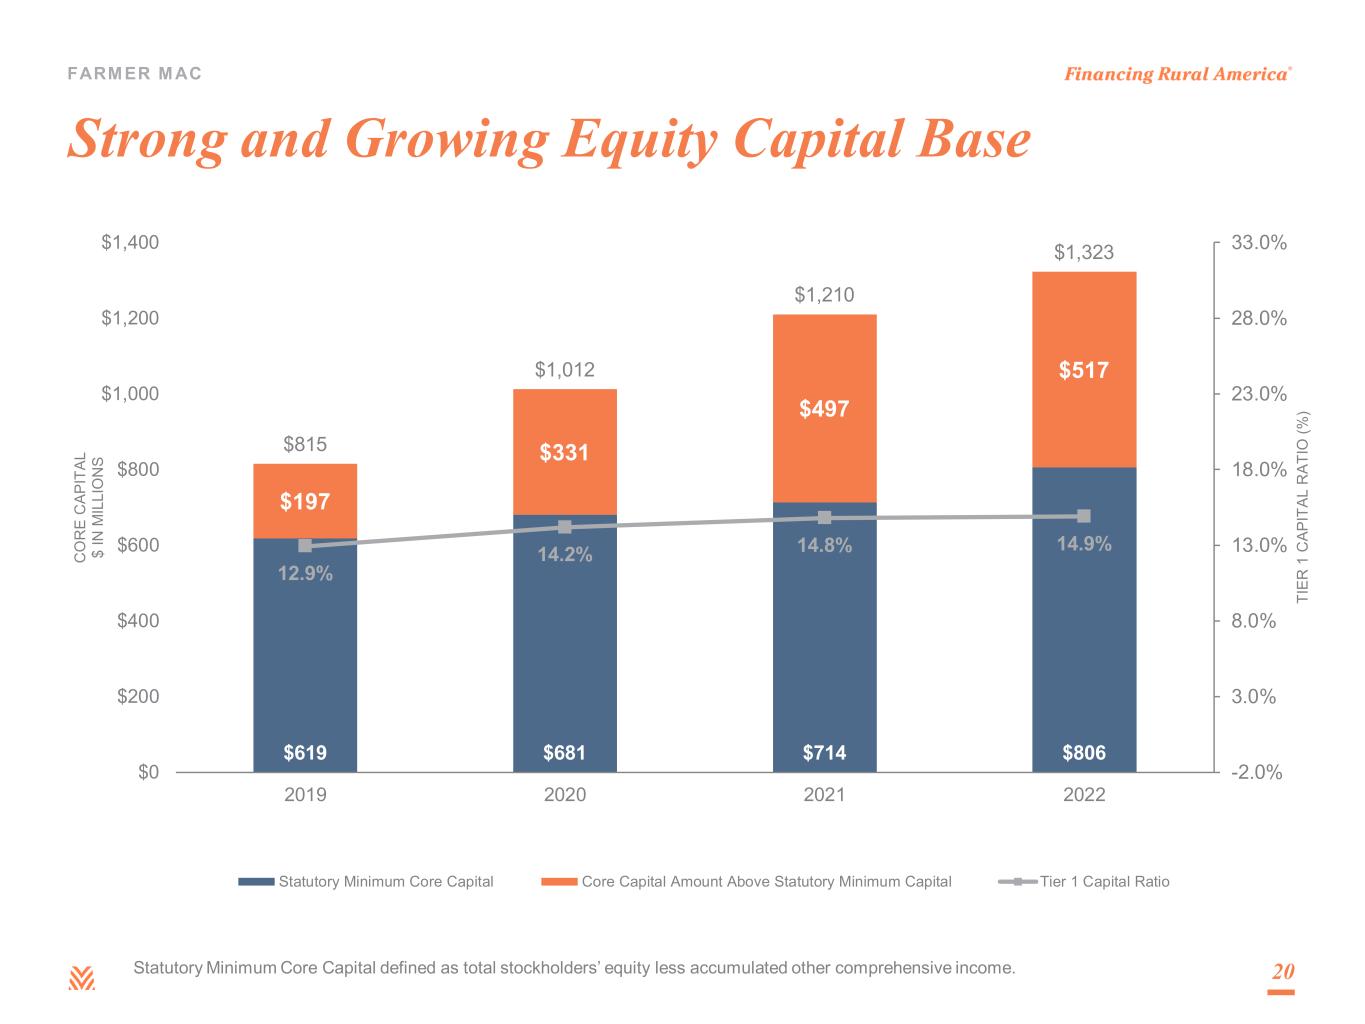
•Maintained strong capital position with total core capital of $1.3 billion, exceeding statutory requirement by 64% and a Tier 1 Capital Ratio of 14.9% as of year-end
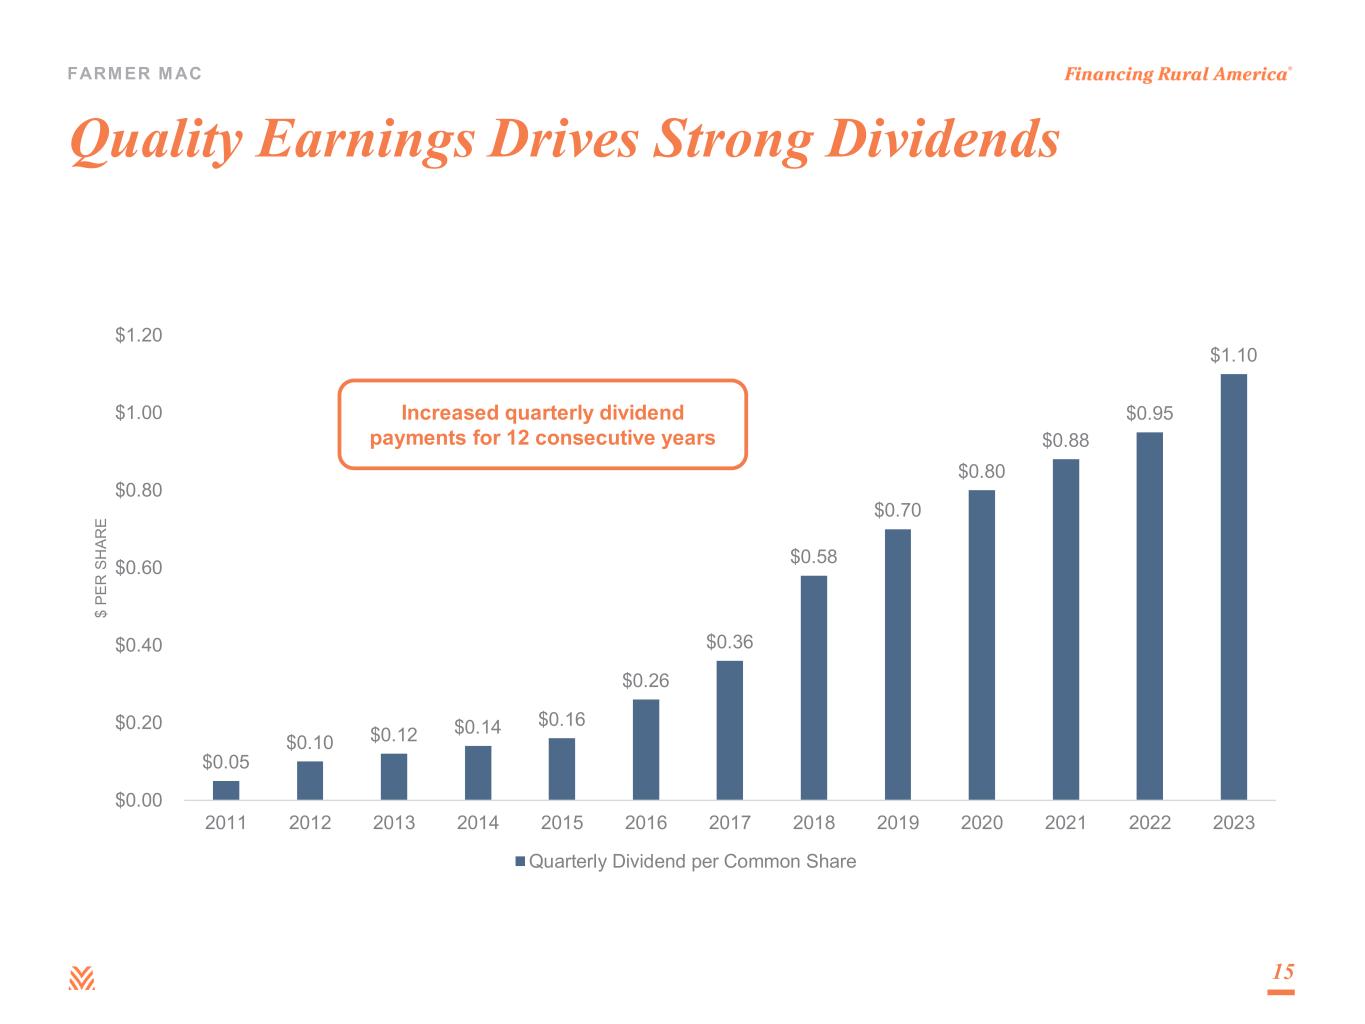
•On February 22, 2023, Farmer Mac's Board of Directors raised the quarterly dividend on common stock by 16% to $1.10 per share, the twelfth consecutive annual increase
| $ in thousands, except per share amounts | Quarter Ended | Year Ended | ||||||||||||||||||
| Dec. 31, 2022 | Dec. 31, 2021 | YoY % Change | Dec. 31, 2022 | Dec. 31, 2021 | % Change | |||||||||||||||
| Net Change in Business Volume | $595,444 | $495,672 | N/A | $2,307,619 | $1,690,368 | N/A | ||||||||||||||
| Net Interest Income (GAAP) | $73,635 | $53,836 | 37% | $270,940 | $221,951 | 22% | ||||||||||||||
| Net Effective Spread (Non-GAAP) | $71,103 | $54,333 | 31% | $255,529 | $220,668 | 16% | ||||||||||||||
| Diluted EPS (GAAP) | $3.36 | $2.49 | 35% | $13.87 | $10.27 | 35% | ||||||||||||||
| Core EPS (Non-GAAP) | $3.16 | $2.76 | 14% | $11.42 | $10.47 | 9% | ||||||||||||||
1 Non-GAAP Measure
1
Dividends
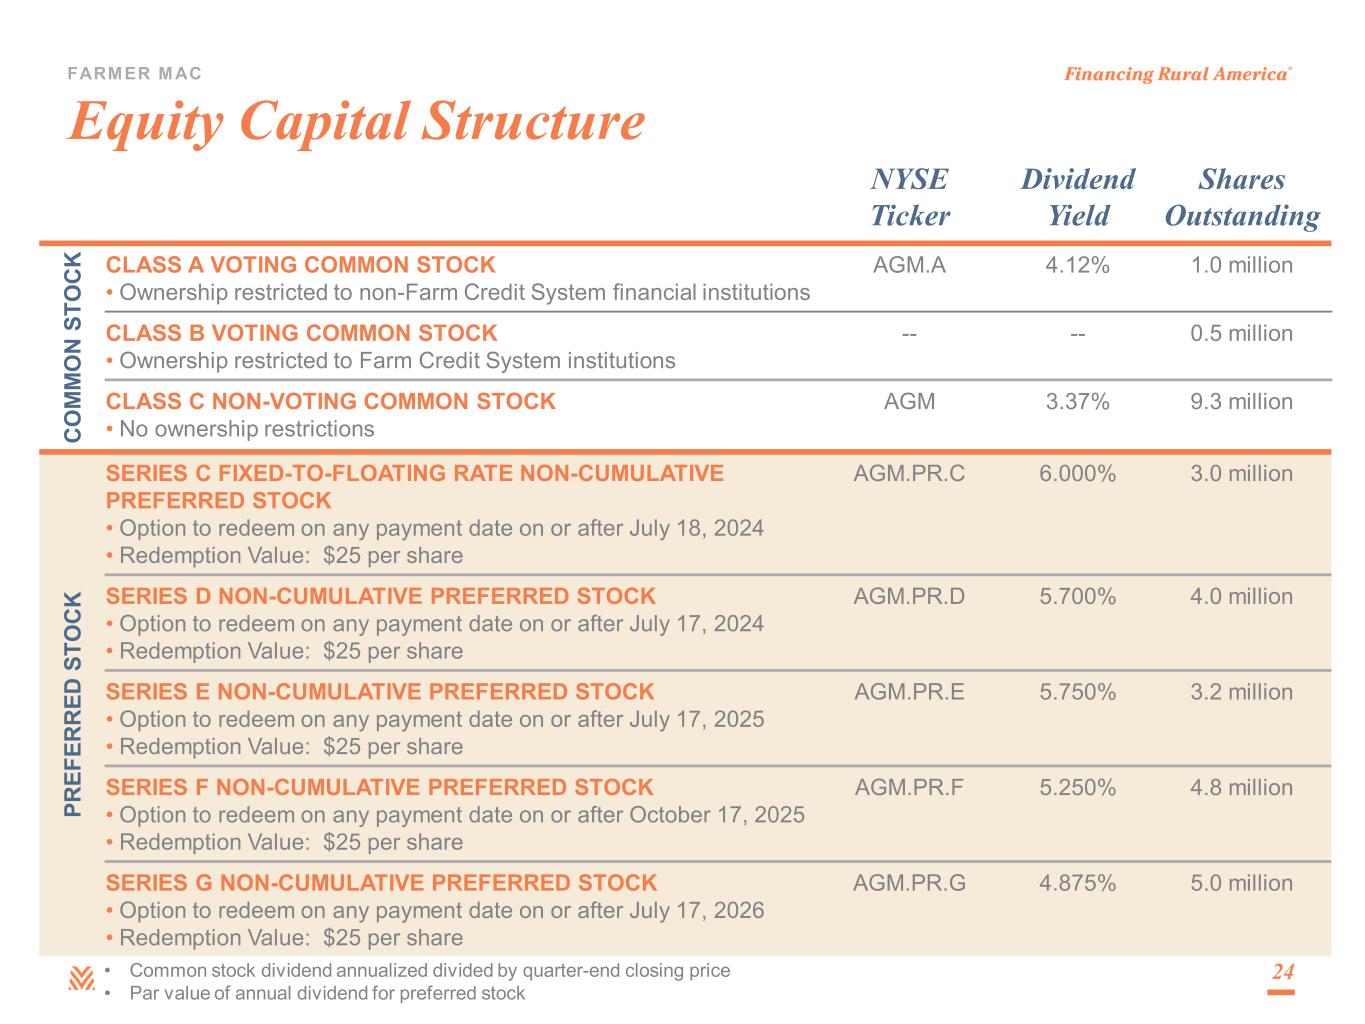
On February 22, 2023, Farmer Mac's Board of Directors declared a quarterly dividend of $1.10 per share on all three classes of common stock - Class A voting common stock (NYSE: AGM.A), Class B voting common stock (not listed on any exchange), and Class C non-voting common stock (NYSE; AGM). This quarterly dividend, which represents an increase of 16% in Farmer Mac's quarterly dividend rate on a year-over-year basis, will be payable on March 31, 2023 to holders of record of common stock as of March 16, 2023. This is the twelfth consecutive year that Farmer Mac has increased its quarterly common stock dividend, and this increase is supported by Farmer Mac's earnings potential and overall capital position.
Farmer Mac's Board of Directors also declared a dividend on each of Farmer Mac's five classes of preferred stock. The quarterly dividend of $0.375 per share of 6.000% Fixed-to-Floating Rate Non-Cumulative Preferred Stock, Series C (NYSE: AGM.PR.C), $0.35625 per share of 5.700% Non-Cumulative Preferred Stock, Series D (NYSE: AGM.PR.D), $0.359375 per share of 5.750% Non-Cumulative Preferred Stock, Series E (NYSE: AGM.PR.E), $0.328125 per share of 5.250% Non-Cumulative Preferred Stock, Series F (NYSE: AGM.PR.F), and $0.3046875 per share of 4.875% Non-Cumulative Preferred Stock, Series G (AGM.PR.G), is for the period from but not including January 17, 2023 to and including April 17, 2023. The preferred dividends will be payable on April 17, 2023 to holders of record as of April 3, 2023.
Earnings Conference Call Information
The conference call to discuss Farmer Mac's fourth quarter and full year 2022 financial results will be held beginning at 8:30 a.m. eastern time on Friday, February 24, 2023, and can be accessed by telephone or live webcast as follows:
Telephone (Domestic): (888) 346-2616
Telephone (International): (412) 902-4254
Webcast: https://www.farmermac.com/investors/events-presentations/
When dialing in to the call, please ask for the "Farmer Mac Earnings Conference Call." The call can be heard live and will also be available for replay on Farmer Mac’s website for two weeks following the conclusion of the call.
More complete information about Farmer Mac's performance for 2022 is in Farmer Mac's Annual Report on Form 10-K for the year ended December 31, 2022 filed today with the SEC.
2
Use of Non-GAAP Measures
In the accompanying analysis of its financial information, Farmer Mac uses the following non-GAAP measures: "core earnings," "core earnings per share," and "net effective spread." Farmer Mac uses these non-GAAP measures to measure corporate economic performance and develop financial plans because, in management's view, they are useful alternative measures in understanding Farmer Mac's economic performance, transaction economics, and business trends. The non-GAAP financial measures that Farmer Mac uses may not be comparable to similarly labeled non-GAAP financial measures disclosed by other companies. Farmer Mac's disclosure of these non-GAAP measures is intended to be supplemental in nature and is not meant to be considered in isolation from, as a substitute for, or as more important than, the related financial information prepared in accordance with GAAP.
The main difference between core earnings and core earnings per share (non-GAAP measures) and net income attributable to common stockholders and earnings per common share (GAAP measures) is that those non-GAAP measures exclude the effects of fair value fluctuations. These fluctuations are not expected to have a cumulative net impact on Farmer Mac's financial condition or results of operations reported in accordance with GAAP if the related financial instruments are held to maturity, as is expected. Another difference is that these two non-GAAP measures exclude specified infrequent or unusual transactions that we believe are not indicative of future operating results and that may not reflect the trends and economic financial performance of Farmer Mac's core business.
Farmer Mac uses net effective spread to measure the net spread Farmer Mac earns between its interest-earning assets and the related net funding costs of these assets. As further explained below, net effective spread differs from net interest income and net interest yield by excluding certain items from net interest income and net interest yield and including certain other items that net interest income and net interest yield do not contain.
Farmer Mac excludes from net effective spread the interest income and interest expense associated with the consolidated trusts and the average balance of the loans underlying these trusts to reflect management's view that the net interest income Farmer Mac earns on the related Farmer Mac Guaranteed Securities owned by third parties is effectively a guarantee fee. Accordingly, the excluded interest income and interest expense associated with consolidated trusts is reclassified to guarantee and commitment fees in determining Farmer Mac's core earnings. Farmer Mac also excludes from net effective spread the fair value changes of financial derivatives and the corresponding assets or liabilities designated in fair value hedge accounting relationships because they are not expected to have an economic effect on Farmer Mac's financial performance, as we expect to hold the financial derivatives and corresponding hedged items to maturity.
Net effective spread also differs from net interest income and net interest yield because it includes the accrual of income and expense related to the contractual amounts due on financial derivatives that are not designated in hedge accounting relationships ("undesignated financial derivatives"). Farmer Mac uses interest rate swaps to manage its interest rate risk exposure by synthetically modifying the interest rate reset or maturity characteristics of certain assets and liabilities. The accrual of the contractual amounts due on interest rate swaps designated in hedge accounting relationships is included as an adjustment to the yield or cost of the hedged item and is included in net interest income. For undesignated financial derivatives, Farmer Mac records the income or expense related to the accrual of the contractual amounts due in "Gains on financial derivatives" on the consolidated statements of operations. However, the accrual of the contractual amounts due for undesignated financial derivatives are included in Farmer Mac's calculation of net effective spread.
3
Net effective spread also differs from net interest income and net interest yield because it includes the net effects of terminations or net settlements on financial derivatives, which consist of: (1) the net effects of cash settlements on agency forward contracts on the debt of other GSEs and U.S. Treasury security futures that we use as short-term economic hedges on the issuance of debt; and (2) the net effects of initial cash payments that Farmer Mac receives upon the inception of certain swaps. The inclusion of these items in net effective spread is intended to reflect our view of the complete net spread between an asset and all of its related funding, including any associated derivatives, whether or not they are designated in a hedge accounting relationship.
More information about Farmer Mac’s use of non-GAAP measures is available in "Management's Discussion and Analysis of Financial Condition and Results of Operations—Results of Operations" in Farmer Mac's Annual Report on Form 10-K for the year ended December 31, 2022, filed today with the SEC. For a reconciliation of Farmer Mac's net income attributable to common stockholders to core earnings and of earnings per common share to core earnings per share, and net interest income and net interest yield to net effective spread, see "Reconciliations" below.
Forward-Looking Statements
Management's expectations for Farmer Mac's future necessarily involve assumptions and estimates and the evaluation of risks and uncertainties. Various factors or events, both known and unknown, could cause Farmer Mac's actual results to differ materially from the expectations as expressed or implied by the forward-looking statements in this release, including uncertainties about:
•the availability to Farmer Mac of debt and equity financing and, if available, the reasonableness of rates and terms;
•legislative or regulatory developments that could affect Farmer Mac, its sources of business, or agricultural or rural infrastructure industries;
•fluctuations in the fair value of assets held by Farmer Mac and its subsidiaries;
•the level of lender interest in Farmer Mac's products and the secondary market provided by Farmer Mac;
•the general rate of growth in agricultural mortgage and rural infrastructure indebtedness;
•the effect of economic conditions stemming from disruptive global events or otherwise on agricultural mortgage or rural infrastructure lending, borrower repayment capacity, or collateral values, including rapid inflation, fluctuations in interest rates, changes in U.S. trade policies, fluctuations in export demand for U.S. agricultural products, supply chain disruptions, increases in input costs, labor availability, and volatility in commodity prices;
•the degree to which Farmer Mac is exposed to interest rate risk resulting from fluctuations in Farmer Mac's borrowing costs relative to market indexes;
•developments in the financial markets, including possible investor, analyst, and rating agency reactions to events involving government-sponsored enterprises, including Farmer Mac;
•the effects of the Federal Reserve’s efforts to achieve monetary policy normalization and slow inflation; and
•other factors that could hinder agricultural mortgage lending or borrower repayment capacity, including the effects of severe weather and drought, climate change, or fluctuations in agricultural real estate values.
Other risk factors are discussed in "Risk Factors" in Part I, Item 1A in Farmer Mac's Annual Report on Form 10-K for the year ended December 31, 2022, as filed today with the SEC. Considering these potential risks and uncertainties, no undue reliance should be placed on any forward-looking statements
4
expressed in this release. The forward-looking statements contained in this release represent management's expectations as of the date of this release. Farmer Mac undertakes no obligation to release publicly the results of revisions to any forward-looking statements included in this release to reflect new information or any future events or circumstances, except as otherwise required by applicable law. The information in this release is not necessarily indicative of future results.
About Farmer Mac
Farmer Mac is a vital part of the agricultural credit markets and was created to increase access to and reduce the cost of credit for the benefit of American agricultural and rural communities. As the nation’s secondary market for agricultural credit, we provide financial solutions to a broad spectrum of the agricultural community, including agricultural lenders, agribusinesses, and other institutions that can benefit from access to flexible, low-cost financing and risk management tools. Farmer Mac's customers benefit from our low cost of funds, low overhead costs, and high operational efficiency. More information about Farmer Mac (including the Annual Report on Form 10-K referenced above) is available on Farmer Mac's website at www.farmermac.com.
CONTACT: Jalpa Nazareth, Investor Relations
Megan Murray-Pelaez, Media Inquiries
(202) 872-7700
* * * *
5
FEDERAL AGRICULTURAL MORTGAGE CORPORATION AND SUBSIDIARIES
CONSOLIDATED BALANCE SHEETS
(unaudited)
| As of | |||||||||||
| December 31, 2022 | December 31, 2021 | ||||||||||
| (in thousands) | |||||||||||
| Assets: | |||||||||||
| Cash and cash equivalents | $ | 861,002 | $ | 908,785 | |||||||
| Investment securities: | |||||||||||
| Available-for-sale, at fair value (amortized cost of $4,769,426 and $3,834,714, respectively) | 4,579,564 | 3,836,391 | |||||||||
| Held-to-maturity, at amortized cost | 45,032 | 44,970 | |||||||||
| Other investments | 3,672 | 1,229 | |||||||||
| Total Investment Securities | 4,628,268 | 3,882,590 | |||||||||
| Farmer Mac Guaranteed Securities: | |||||||||||
| Available-for-sale, at fair value (amortized cost of $8,019,495 and $6,135,807, respectively) | 7,607,226 | 6,328,559 | |||||||||
| Held-to-maturity, at amortized cost | 1,021,154 | 2,033,239 | |||||||||
| Total Farmer Mac Guaranteed Securities | 8,628,380 | 8,361,798 | |||||||||
| USDA Securities: | |||||||||||
| Trading, at fair value | 1,767 | 4,401 | |||||||||
| Held-to-maturity, at amortized cost | 2,409,834 | 2,436,331 | |||||||||
| Total USDA Securities | 2,411,601 | 2,440,732 | |||||||||
| Loans: | |||||||||||
| Loans held for investment, at amortized cost | 9,011,820 | 8,314,096 | |||||||||
| Loans held for investment in consolidated trusts, at amortized cost | 1,211,576 | 948,623 | |||||||||
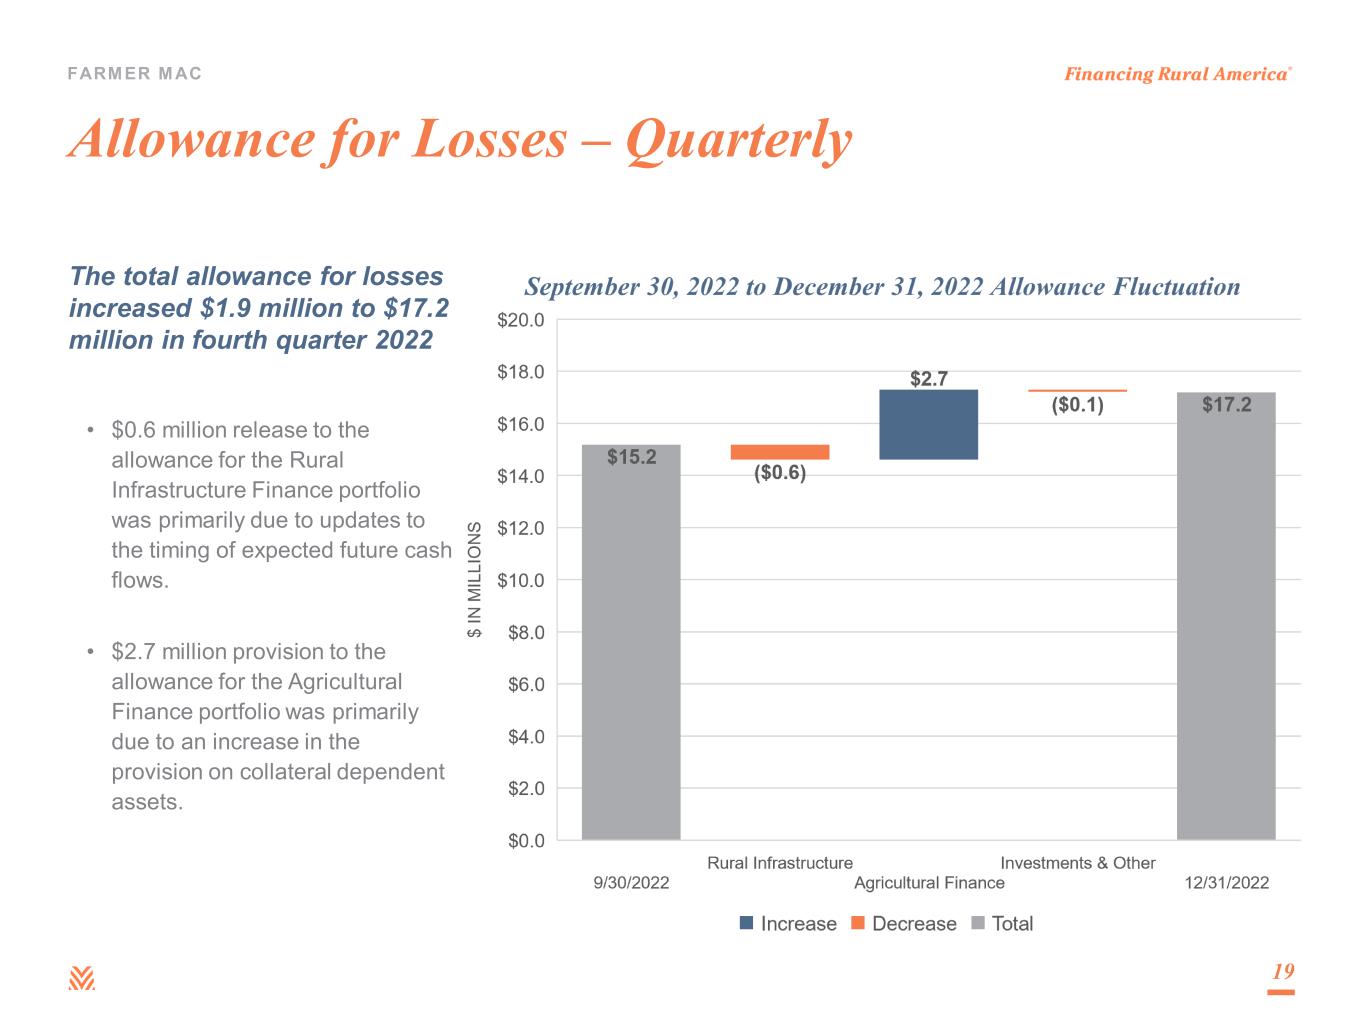
| Allowance for losses | (15,089) | (14,041) | |||||||||
| Total loans, net of allowance | 10,208,307 | 9,248,678 | |||||||||
| Financial derivatives, at fair value | 37,409 | 6,081 | |||||||||
| Accrued interest receivable (includes $12,514 and $10,418, respectively, related to consolidated trusts) | 229,061 | 165,604 | |||||||||
| Guarantee and commitment fees receivable | 47,151 | 45,538 | |||||||||
| Deferred tax asset, net | 18,004 | 15,869 | |||||||||
| Prepaid expenses and other assets | 263,927 | 45,334 | |||||||||
| Total Assets | $ | 27,333,110 | $ | 25,121,009 | |||||||
| Liabilities and Equity: | |||||||||||
| Liabilities: | |||||||||||
| Notes payable | $ | 24,469,113 | $ | 22,713,771 | |||||||
| Debt securities of consolidated trusts held by third parties | 1,181,948 | 981,379 | |||||||||
| Financial derivatives, at fair value | 175,326 | 35,554 | |||||||||
| Accrued interest payable (includes $8,081 and $9,619, respectively, related to consolidated trusts) | 117,887 | 59,003 | |||||||||
| Guarantee and commitment obligation | 46,582 | 43,926 | |||||||||
| Accounts payable and accrued expenses | 68,863 | 71,726 | |||||||||
| Reserve for losses | 1,433 | 1,950 | |||||||||
| Total Liabilities | 26,061,152 | 23,907,309 | |||||||||
| Commitments and Contingencies | |||||||||||
| Equity: | |||||||||||
| Preferred stock: | |||||||||||
| Series C, par value $25 per share, 3,000,000 shares authorized, issued and outstanding | 73,382 | 73,382 | |||||||||
| Series D, par value $25 per share, 4,000,000 shares authorized, issued and outstanding | 96,659 | 96,659 | |||||||||
Series E, par value $25 per share, 3,180,000 shares authorized, issued and outstanding | 77,003 | 77,003 | |||||||||
| Series F, par value $25 per share, 4,800,000 shares authorized, issued and outstanding | 116,160 | 116,160 | |||||||||
| Series G, par value $25 per share, 5,000,000 shares authorized, issued and outstanding | 121,327 | 121,327 | |||||||||
| Common stock: | |||||||||||
| Class A Voting, $1 par value, no maximum authorization, 1,030,780 shares outstanding | 1,031 | 1,031 | |||||||||
| Class B Voting, $1 par value, no maximum authorization, 500,301 shares outstanding | 500 | 500 | |||||||||
| Class C Non-Voting, $1 par value, no maximum authorization, 9,270,265 shares and 9,235,205 shares outstanding, respectively | 9,270 | 9,235 | |||||||||
| Additional paid-in capital | 128,939 | 125,993 | |||||||||
| Accumulated other comprehensive (loss)/income, net of tax | (50,843) | 3,853 | |||||||||
| Retained earnings | 698,530 | 588,557 | |||||||||
| Total Equity | 1,271,958 | 1,213,700 | |||||||||
| Total Liabilities and Equity | $ | 27,333,110 | $ | 25,121,009 | |||||||
6
FEDERAL AGRICULTURAL MORTGAGE CORPORATION AND SUBSIDIARIES
CONSOLIDATED STATEMENTS OF OPERATIONS
(unaudited)
| For the Three Months Ended | For the Year Ended | ||||||||||||||||||||||
| December 31, 2022 | December 31, 2021 | December 31, 2022 | December 31, 2021 | ||||||||||||||||||||
| (in thousands, except per share amounts) | |||||||||||||||||||||||
| Interest income: | |||||||||||||||||||||||
| Investments and cash equivalents | $ | 44,162 | $ | 4,553 | $ | 82,659 | $ | 18,660 | |||||||||||||||
| Farmer Mac Guaranteed Securities and USDA Securities | 114,538 | 36,747 | 283,769 | 164,723 | |||||||||||||||||||
| Loans | 109,027 | 60,951 | 350,420 | 242,582 | |||||||||||||||||||
| Total interest income | 267,727 | 102,251 | 716,848 | 425,965 | |||||||||||||||||||
| Total interest expense | 194,092 | 48,415 | 445,908 | 204,014 | |||||||||||||||||||
| Net interest income | 73,635 | 53,836 | 270,940 | 221,951 | |||||||||||||||||||
| (Provision for)/release of losses | (2,022) | 1,378 | (1,323) | 860 | |||||||||||||||||||
| Net interest income after (provision for)/release of losses | 71,613 | 55,214 | 269,617 | 222,811 | |||||||||||||||||||
| Non-interest income/(expense): | |||||||||||||||||||||||
| Guarantee and commitment fees | 3,489 | 3,487 | 13,040 | 12,669 | |||||||||||||||||||
| Gains/(losses) on financial derivatives | 1,080 | (2,257) | 22,631 | 324 | |||||||||||||||||||
| Gains on sale of mortgage loans | — | 6,539 | — | 6,539 | |||||||||||||||||||
| Gains/(losses) on trading securities | 24 | (77) | (51) | (115) | |||||||||||||||||||
| Gains on sale of available-for-sale investment securities | — | — | — | 253 | |||||||||||||||||||
| Release of reserve for losses | 77 | 50 | 517 | 1,327 | |||||||||||||||||||
| Other income | 746 | 469 | 2,551 | 2,069 | |||||||||||||||||||
| Non-interest income | 5,416 | 8,211 | 38,688 | 23,066 | |||||||||||||||||||
| Operating expenses: | |||||||||||||||||||||||
| Compensation and employee benefits | 12,105 | 11,246 | 48,766 | 42,847 | |||||||||||||||||||
| General and administrative | 8,055 | 8,492 | 29,772 | 27,507 | |||||||||||||||||||
| Regulatory fees | 832 | 812 | 3,269 | 3,062 | |||||||||||||||||||
| Real estate owned operating costs, net | 819 | — | 819 | — | |||||||||||||||||||
| Operating expenses | 21,811 | 20,550 | 82,626 | 73,416 | |||||||||||||||||||
| Income before income taxes | 55,218 | 42,875 | 225,679 | 172,461 | |||||||||||||||||||
| Income tax expense | 11,800 | 9,022 | 47,535 | 36,372 | |||||||||||||||||||
| Net income | 43,418 | 33,853 | 178,144 | 136,089 | |||||||||||||||||||
| Preferred stock dividends | (6,791) | (6,792) | (27,165) | (24,677) | |||||||||||||||||||
| Net income attributable to common stockholders | $ | 36,627 | $ | 27,061 | $ | 150,979 | $ | 111,412 | |||||||||||||||
| Earnings per common share: | |||||||||||||||||||||||
| Basic earnings per common share | $ | 3.39 | $ | 2.52 | $ | 14.00 | $ | 10.36 | |||||||||||||||
| Diluted earnings per common share | $ | 3.36 | $ | 2.49 | $ | 13.87 | $ | 10.27 | |||||||||||||||
7
Reconciliations
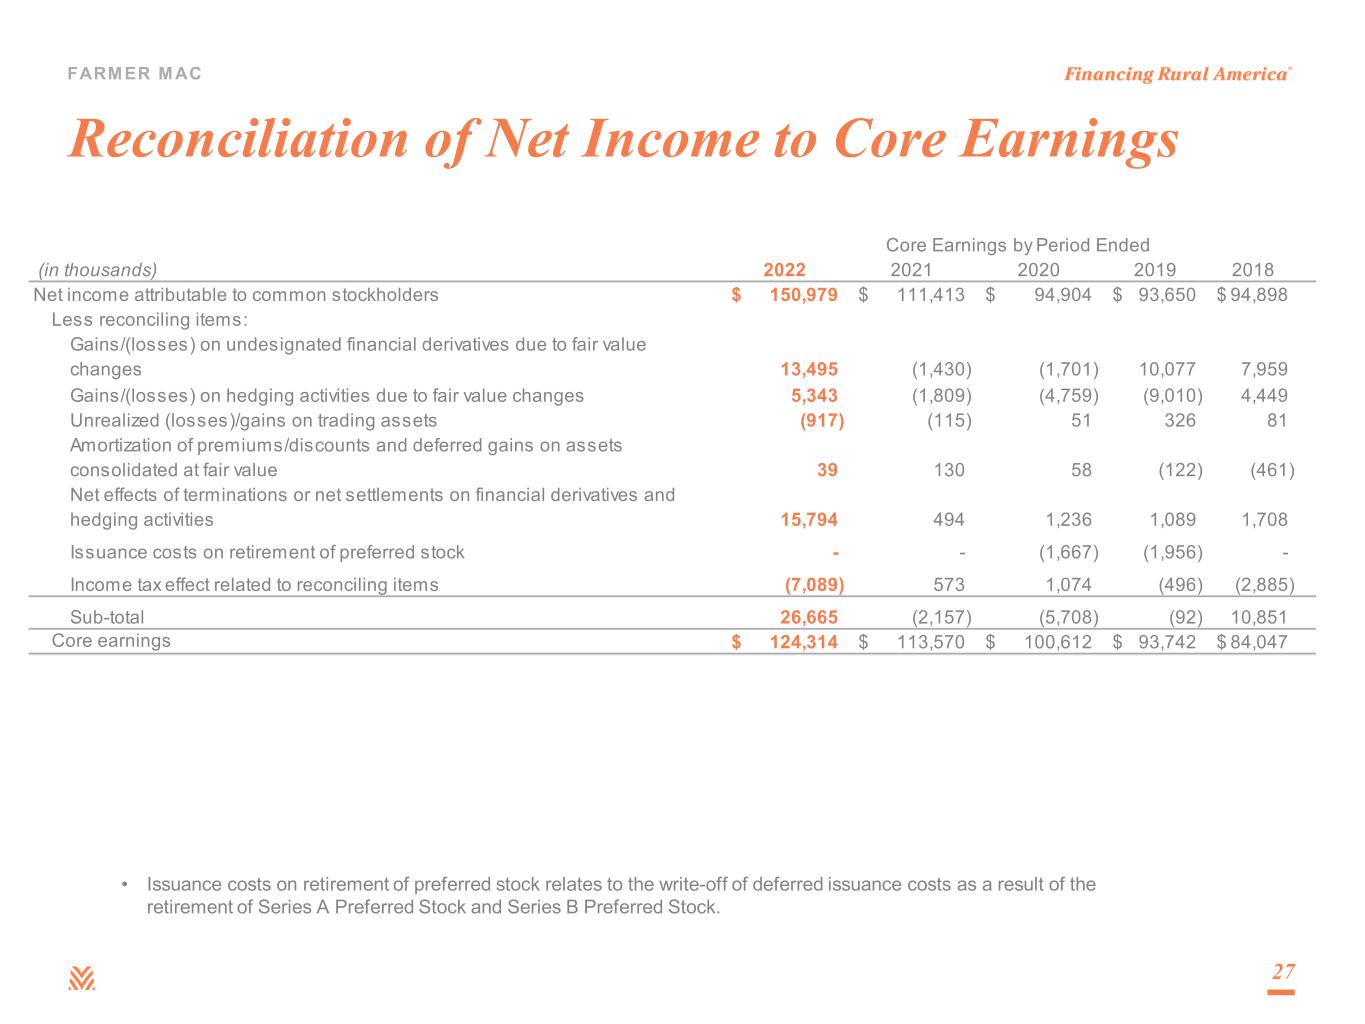
Reconciliations of Farmer Mac's net income attributable to common stockholders to core earnings and core earnings per share are presented in the following tables along with information about the composition of core earnings for the periods indicated:
| Reconciliation of Net Income Attributable to Common Stockholders to Core Earnings | |||||||||||||||||
| For the Three Months Ended | |||||||||||||||||
| December 31, 2022 | September 30, 2022 | December 31, 2021 | |||||||||||||||
| (in thousands, except per share amounts) | |||||||||||||||||
| Net income attributable to common stockholders | $ | 36,627 | $ | 34,627 | $ | 27,061 | |||||||||||
| Less reconciling items: | |||||||||||||||||
| Gains/(losses) on undesignated financial derivatives due to fair value changes | 1,596 | 6,441 | (1,242) | ||||||||||||||
| Losses on hedging activities due to fair value changes | (148) | (624) | (2,079) | ||||||||||||||
| Unrealized gains/(losses) on trading assets | 31 | (757) | (76) | ||||||||||||||
| Net effects of amortization of premiums/discounts and deferred gains on assets consolidated at fair value | 57 | 24 | 71 | ||||||||||||||
| Net effects of terminations or net settlements on financial derivatives | 1,268 | (3,522) | (429) | ||||||||||||||
| Income tax effect related to reconciling items | (590) | (327) | 789 | ||||||||||||||
| Sub-total | 2,214 | 1,235 | (2,966) | ||||||||||||||
| Core earnings | $ | 34,413 | $ | 33,392 | $ | 30,027 | |||||||||||
| Composition of Core Earnings: | |||||||||||||||||
| Revenues: | |||||||||||||||||
Net effective spread(1) | $ | 71,103 | $ | 65,641 | $ | 54,333 | |||||||||||
Guarantee and commitment fees(2) | 4,677 | 4,201 | 4,637 | ||||||||||||||
| Gains on sale of mortgage loans | — | — | 6,539 | ||||||||||||||
Other(3) | 390 | 473 | 241 | ||||||||||||||
| Total revenues | 76,170 | 70,315 | 65,750 | ||||||||||||||
| Credit related expense (GAAP): | |||||||||||||||||
| Provision for/(release of) losses | 1,945 | 450 | (1,428) | ||||||||||||||
| REO operating expenses | 819 | — | — | ||||||||||||||
| Total credit related expense | 2,764 | 450 | (1,428) | ||||||||||||||
| Operating expenses (GAAP): | |||||||||||||||||
| Compensation and employee benefits | 12,105 | 11,648 | 11,246 | ||||||||||||||
| General and administrative | 8,055 | 6,919 | 8,492 | ||||||||||||||
| Regulatory fees | 832 | 812 | 812 | ||||||||||||||
| Total operating expenses | 20,992 | 19,379 | 20,550 | ||||||||||||||
| Net earnings | 52,414 | 50,486 | 46,628 | ||||||||||||||
Income tax expense(4) | 11,210 | 10,303 | 9,809 | ||||||||||||||
| Preferred stock dividends (GAAP) | 6,791 | 6,791 | 6,792 | ||||||||||||||
| Core earnings | $ | 34,413 | $ | 33,392 | $ | 30,027 | |||||||||||
| Core earnings per share: | |||||||||||||||||
| Basic | $ | 3.19 | $ | 3.09 | $ | 2.79 | |||||||||||
| Diluted | $ | 3.16 | $ | 3.07 | $ | 2.76 | |||||||||||
(1)Net effective spread is a non-GAAP measure. See "Use of Non-GAAP Measures" above for an explanation of net effective spread. See below for a reconciliation of net interest income to net effective spread.
(2)Includes interest income and interest expense related to consolidated trusts owned by third parties reclassified from net interest income to guarantee and commitment fees to reflect management's view that the net interest income Farmer Mac earns is effectively a guarantee fee on the consolidated Farmer Mac Guaranteed Securities.
8
(3)Reflects reconciling adjustments for the reclassification to exclude expenses related to interest rate swaps not designated as hedges and terminations or net settlements on financial derivatives, and reconciling adjustments to exclude fair value adjustments on financial derivatives and trading assets and the recognition of deferred gains over the estimated lives of certain Farmer Mac Guaranteed Securities and USDA Securities.
(4)Includes the tax impact of non-GAAP reconciling items between net income attributable to common stockholders and core earnings.
| Reconciliation of Net Income Attributable to Common Stockholders to Core Earnings | |||||||||||
| For the Year Ended | |||||||||||
| December 31, 2022 | December 31, 2021 | ||||||||||
| (in thousands, except per share amounts) | |||||||||||
| Net income attributable to common stockholders | $ | 150,979 | $ | 111,412 | |||||||
| Less reconciling items: | |||||||||||
| Gains/(losses) on undesignated financial derivatives due to fair value changes | 13,495 | (1,431) | |||||||||
| Gains/(losses) on hedging activities due to fair value changes | 5,343 | (1,810) | |||||||||
| Unrealized losses on trading assets | (917) | (115) | |||||||||
| Net effects of amortization of premiums/discounts and deferred gains on assets consolidated at fair value | 39 | 130 | |||||||||
| Net effects of terminations or net settlements on financial derivatives | 15,794 | 494 | |||||||||
| Income tax effect related to reconciling items | (7,089) | 574 | |||||||||
| Sub-total | 26,665 | (2,158) | |||||||||
| Core earnings | $ | 124,314 | $ | 113,570 | |||||||
| Composition of Core Earnings: | |||||||||||
| Revenues: | |||||||||||
Net effective spread(1) | $ | 255,529 | $ | 220,668 | |||||||
Guarantee and commitment fees(2) | 18,144 | 17,533 | |||||||||
| Gains on sale of mortgage loans | — | 6,539 | |||||||||
Other(3) | 1,684 | 1,680 | |||||||||
| Total revenues | 275,357 | 246,420 | |||||||||
| Credit related expense (GAAP): | |||||||||||
| Provision for/(release of) losses | 806 | (2,187) | |||||||||
| REO operating expenses | 819 | — | |||||||||
| Total credit related expense | 1,625 | (2,187) | |||||||||
| Operating expenses (GAAP): | |||||||||||
| Compensation and employee benefits | 48,766 | 42,847 | |||||||||
| General and administrative | 29,772 | 27,507 | |||||||||
| Regulatory fees | 3,269 | 3,062 | |||||||||
| Total operating expenses | 81,807 | 73,416 | |||||||||
| Net earnings | 191,925 | 175,191 | |||||||||
Income tax expense(4) | 40,446 | 36,944 | |||||||||
| Preferred stock dividends (GAAP) | 27,165 | 24,677 | |||||||||
| Core earnings | $ | 124,314 | $ | 113,570 | |||||||
| Core earnings per share: | |||||||||||
| Basic | $ | 11.52 | $ | 10.56 | |||||||
| Diluted | $ | 11.42 | $ | 10.47 | |||||||
(1)Net effective spread is a non-GAAP measure. See "Use of Non-GAAP Measures" above for an explanation of net effective spread. See below for a reconciliation of net interest income to net effective spread.
(2)Includes interest income and interest expense related to consolidated trusts owned by third parties reclassified from net interest income to guarantee and commitment fees to reflect management's view that the net interest income Farmer Mac earns is effectively a guarantee fee on the consolidated Farmer Mac Guaranteed Securities.
(3)Reflects reconciling adjustments for the reclassification to exclude expenses related to interest rate swaps not designated as hedges and terminations or net settlements on financial derivatives, and reconciling adjustments to exclude fair value adjustments on financial derivatives and trading assets and the recognition of deferred gains over the estimated lives of certain Farmer Mac Guaranteed Securities and USDA Securities.
(4)Includes the tax impact of non-GAAP reconciling items between net income attributable to common stockholders and core earnings.
9
| Reconciliation of GAAP Basic Earnings Per Share to Core Earnings Basic Earnings Per Share | |||||||||||||||||||||||||||||
| For the Three Months Ended | For the Year Ended | ||||||||||||||||||||||||||||
| December 31, 2022 | September 30, 2022 | December 31, 2021 | December 31, 2022 | December 31, 2021 | |||||||||||||||||||||||||
| (in thousands, except per share amounts) | |||||||||||||||||||||||||||||
| GAAP - Basic EPS | $ | 3.39 | $ | 3.21 | $ | 2.52 | $ | 14.00 | $ | 10.36 | |||||||||||||||||||
| Less reconciling items: | |||||||||||||||||||||||||||||
| Gains/(losses) on undesignated financial derivatives due to fair value changes | 0.15 | 0.60 | (0.11) | 1.25 | (0.13) | ||||||||||||||||||||||||
| (Losses)/gains on hedging activities due to fair value changes | (0.01) | (0.06) | (0.19) | 0.50 | (0.17) | ||||||||||||||||||||||||
| Unrealized losses on trading securities | 0.01 | (0.07) | (0.01) | (0.08) | (0.01) | ||||||||||||||||||||||||
| Net effects of amortization of premiums/discounts and deferred gains on assets consolidated at fair value | 0.01 | — | 0.01 | — | 0.01 | ||||||||||||||||||||||||
| Net effects of terminations or net settlements on financial derivatives | 0.11 | (0.32) | (0.04) | 1.47 | 0.04 | ||||||||||||||||||||||||
| Income tax effect related to reconciling items | (0.07) | (0.03) | 0.07 | (0.66) | 0.06 | ||||||||||||||||||||||||
| Sub-total | 0.20 | 0.12 | (0.27) | 2.48 | (0.20) | ||||||||||||||||||||||||
| Core Earnings - Basic EPS | $ | 3.19 | $ | 3.09 | $ | 2.79 | $ | 11.52 | $ | 10.56 | |||||||||||||||||||
| Shares used in per share calculation (GAAP and Core Earnings) | 10,801 | 10,799 | 10,766 | 10,791 | 10,758 | ||||||||||||||||||||||||
| Reconciliation of GAAP Diluted Earnings Per Share to Core Earnings Diluted Earnings Per Share | |||||||||||||||||||||||||||||
| For the Three Months Ended | For the Year Ended | ||||||||||||||||||||||||||||
| December 31, 2022 | September 30, 2022 | December 31, 2021 | December 31, 2022 | December 31, 2021 | |||||||||||||||||||||||||
| (in thousands, except per share amounts) | |||||||||||||||||||||||||||||
| GAAP - Diluted EPS | $ | 3.36 | $ | 3.18 | $ | 2.49 | $ | 13.87 | $ | 10.27 | |||||||||||||||||||
| Less reconciling items: | |||||||||||||||||||||||||||||
| Gains/(losses) on undesignated financial derivatives due to fair value changes | 0.15 | 0.59 | (0.11) | 1.24 | (0.13) | ||||||||||||||||||||||||
| (Losses)/gains on hedging activities due to fair value changes | (0.01) | (0.06) | (0.19) | 0.49 | (0.17) | ||||||||||||||||||||||||
| Unrealized losses on trading securities | 0.01 | (0.07) | (0.01) | (0.08) | (0.01) | ||||||||||||||||||||||||
| Net effects of amortization of premiums/discounts and deferred gains on assets consolidated at fair value | 0.01 | — | 0.01 | — | 0.01 | ||||||||||||||||||||||||
| Net effects of terminations or net settlements on financial derivatives | 0.11 | (0.32) | (0.04) | 1.45 | 0.05 | ||||||||||||||||||||||||
| Income tax effect related to reconciling items | (0.07) | (0.03) | 0.07 | (0.65) | 0.05 | ||||||||||||||||||||||||
| Sub-total | 0.20 | 0.11 | (0.27) | 2.45 | (0.20) | ||||||||||||||||||||||||
| Core Earnings - Diluted EPS | $ | 3.16 | $ | 3.07 | $ | 2.76 | $ | 11.42 | $ | 10.47 | |||||||||||||||||||
| Shares used in per share calculation (GAAP and Core Earnings) | 10,894 | 10.874 | 10,877 | 10,883 | 10,846 | ||||||||||||||||||||||||
10
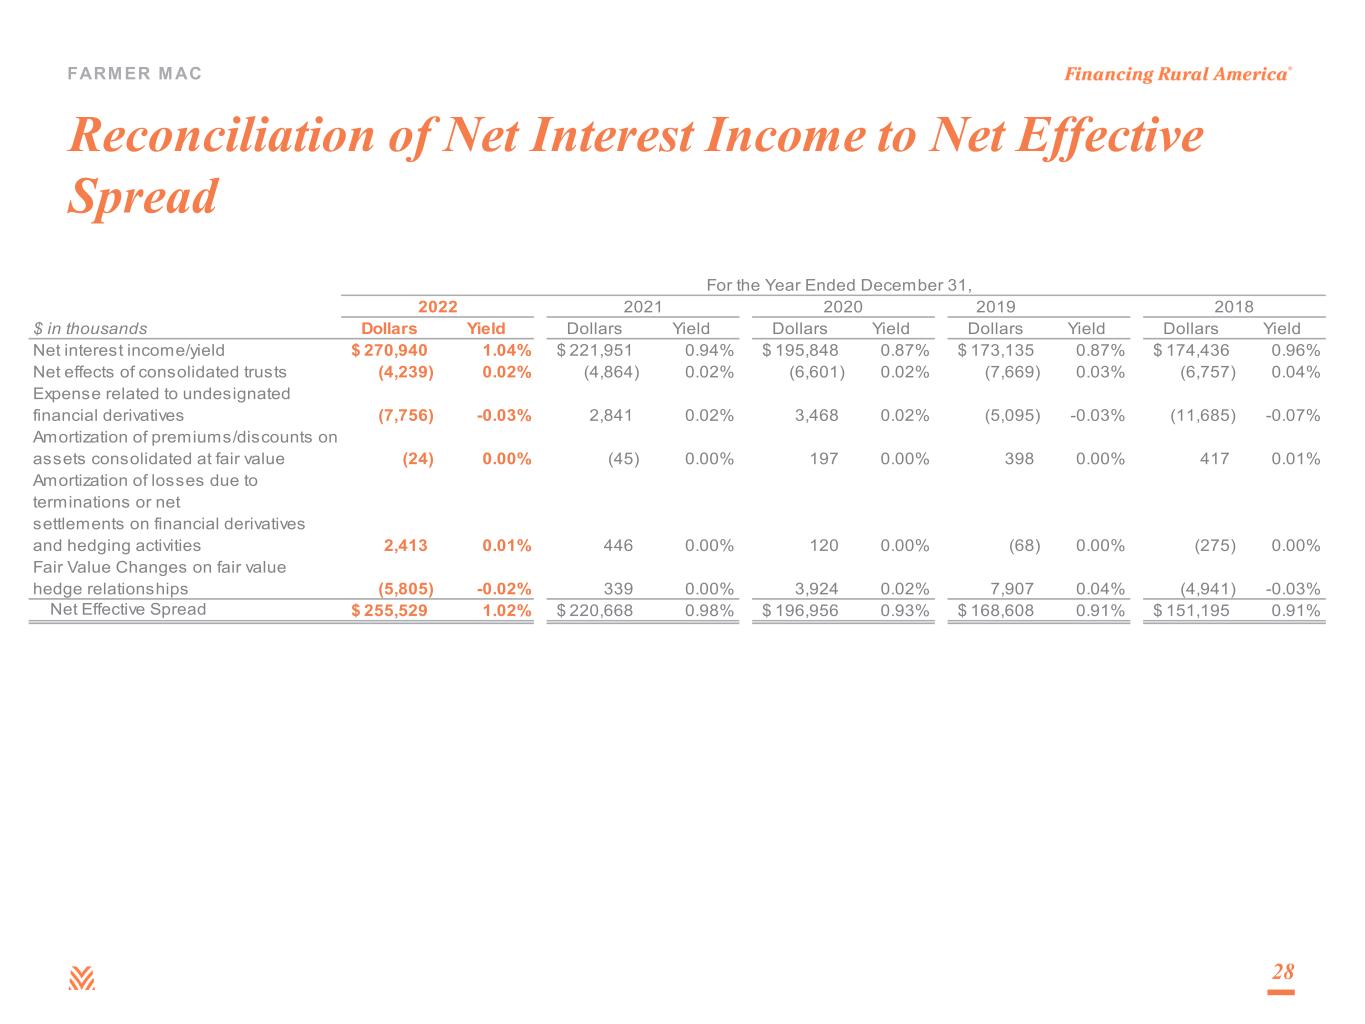
The following table presents a reconciliation of net interest income and net yield to net effective spread for the periods indicated:
| Reconciliation of GAAP Net Interest Income/Yield to Net Effective Spread | |||||||||||||||||||||||||||||||||||||||||||||||||||||||||||
| For the Three Months Ended | For the Year Ended | ||||||||||||||||||||||||||||||||||||||||||||||||||||||||||
| December 31, 2022 | September 30, 2022 | December 31, 2021 | December 31, 2022 | December 31, 2021 | |||||||||||||||||||||||||||||||||||||||||||||||||||||||
| Dollars | Yield | Dollars | Yield | Dollars | Yield | Dollars | Yield | Dollars | Yield | ||||||||||||||||||||||||||||||||||||||||||||||||||
| (dollars in thousands) | |||||||||||||||||||||||||||||||||||||||||||||||||||||||||||
| Net interest income/yield | $ | 73,635 | 1.08 | % | $ | 67,853 | 1.04 | % | $ | 53,836 | 0.89 | % | $ | 270,940 | 1.04 | % | $ | 221,951 | 0.94 | % | |||||||||||||||||||||||||||||||||||||||
| Net effects of consolidated trusts | (1,195) | 0.02 | % | (843) | 0.02 | % | (1,151) | 0.02 | % | (4,239) | 0.02 | % | (4,864) | 0.02 | % | ||||||||||||||||||||||||||||||||||||||||||||
| Expense related to undesignated financial derivatives | (2,122) | (0.03) | % | (2,613) | (0.05) | % | (313) | — | % | (7,756) | (0.03) | % | 2,841 | 0.01 | % | ||||||||||||||||||||||||||||||||||||||||||||
| Amortization of premiums/discounts on assets consolidated at fair value | (53) | — | % | (21) | — | % | (10) | — | % | (24) | — | % | (45) | — | % | ||||||||||||||||||||||||||||||||||||||||||||
| Amortization of losses due to terminations or net settlements on financial derivatives | 688 | — | % | 640 | 0.01 | % | 200 | — | % | 2,413 | 0.01 | % | 446 | — | % | ||||||||||||||||||||||||||||||||||||||||||||
| Fair value changes on fair value hedge relationships | 150 | — | % | 625 | 0.01 | % | 1,771 | 0.03 | % | (5,805) | (0.02) | % | 339 | 0.01 | % | ||||||||||||||||||||||||||||||||||||||||||||
| Net effective spread | $ | 71,103 | 1.07 | % | $ | 65,641 | 1.03 | % | $ | 54,333 | 0.94 | % | $ | 255,529 | 1.02 | % | $ | 220,668 | 0.98 | % | |||||||||||||||||||||||||||||||||||||||
11
The following table presents core earnings for Farmer Mac's reportable operating segments and a reconciliation to consolidated net income for the three months ended December 31, 2022:
| Core Earnings by Business Segment | |||||||||||||||||||||||||||||||||||||||||||||||||||||
For the Three Months Ended December 31, 2022 | |||||||||||||||||||||||||||||||||||||||||||||||||||||
| Agricultural Finance | Rural Infrastructure | Treasury | Corporate | ||||||||||||||||||||||||||||||||||||||||||||||||||
| Farm & Ranch | Corporate AgFinance | Rural Utilities | Renewable Energy | Funding | Investments | Reconciling Adjustments | Consolidated Net Income | ||||||||||||||||||||||||||||||||||||||||||||||
| (in thousands) | |||||||||||||||||||||||||||||||||||||||||||||||||||||
| Net interest income | $ | 34,021 | $ | 7,471 | $ | 4,957 | $ | 935 | $ | 28,940 | $ | (2,689) | $ | — | $ | — | $ | 73,635 | |||||||||||||||||||||||||||||||||||
Less: reconciling adjustments(1)(2)(3) | (1,251) | — | 3 | — | (1,284) | — | — | 2,532 | — | ||||||||||||||||||||||||||||||||||||||||||||
| Net effective spread | 32,770 | 7,471 | 4,960 | 935 | 27,656 | (2,689) | — | 2,532 | — | ||||||||||||||||||||||||||||||||||||||||||||
| Guarantee and commitment fees | 4,331 | 31 | 309 | 6 | — | — | — | (1,188) | 3,489 | ||||||||||||||||||||||||||||||||||||||||||||
Other income/(expense)(3) | 390 | — | — | — | — | — | — | 1,460 | 1,850 | ||||||||||||||||||||||||||||||||||||||||||||
| Total revenues | 37,491 | 7,502 | 5,269 | 941 | 27,656 | (2,689) | — | 2,804 | 78,974 | ||||||||||||||||||||||||||||||||||||||||||||
| (Provision for)/release of losses | (1,903) | (638) | 824 | (310) | — | 5 | — | — | (2,022) | ||||||||||||||||||||||||||||||||||||||||||||
| (Provision for)/release of reserve for losses | (77) | — | 154 | — | — | — | — | — | 77 | ||||||||||||||||||||||||||||||||||||||||||||
| Operating expenses | (819) | — | — | — | — | — | (20,992) | — | (21,811) | ||||||||||||||||||||||||||||||||||||||||||||
| Total non-interest expense | (896) | — | 154 | — | — | — | (20,992) | — | (21,734) | ||||||||||||||||||||||||||||||||||||||||||||
| Core earnings before income taxes | 34,692 | 6,864 | 6,247 | 631 | 27,656 | (2,684) | (20,992) | 2,804 | (4) | 55,218 | |||||||||||||||||||||||||||||||||||||||||||
| Income tax (expense)/benefit | (7,286) | (1,441) | (1,312) | (133) | (5,808) | 564 | 4,206 | (590) | (11,800) | ||||||||||||||||||||||||||||||||||||||||||||
| Core earnings before preferred stock dividends | 27,406 | 5,423 | 4,935 | 498 | 21,848 | (2,120) | (16,786) | 2,214 | (4) | 43,418 | |||||||||||||||||||||||||||||||||||||||||||
| Preferred stock dividends | — | — | — | — | — | — | (6,791) | — | (6,791) | ||||||||||||||||||||||||||||||||||||||||||||
| Segment core earnings/(losses) | $ | 27,406 | $ | 5,423 | $ | 4,935 | $ | 498 | $ | 21,848 | $ | (2,120) | $ | (23,577) | $ | 2,214 | (4) | $ | 36,627 | ||||||||||||||||||||||||||||||||||
| Total Assets | $ | 14,623,596 | $ | 1,541,151 | $ | 5,867,517 | $ | 219,609 | $ | — | $ | 4,806,010 | $ | 275,227 | $ | — | $ | 27,333,110 | |||||||||||||||||||||||||||||||||||
| Total on- and off-balance sheet program assets at principal balance | $ | 17,728,792 | $ | 1,603,507 | $ | 6,359,613 | $ | 230,170 | $ | — | $ | — | $ | — | $ | — | $ | 25,922,082 | |||||||||||||||||||||||||||||||||||
(1)Includes the amortization of premiums and discounts on assets consolidated at fair value, originally included in interest income, to reflect core earnings amounts.
(2)Includes the reclassification of interest income and interest expense from consolidated trusts owned by third parties to guarantee and commitment fees, to reflect management's view that the net interest income Farmer Mac earns is effectively a guarantee fee.
(3)Includes the reclassification of interest expense related to interest rate swaps not designated as hedges, which are included in "Gains on financial derivatives" on the consolidated financial statements, to determine the effective funding cost for each operating segment.
(4)Net adjustments to reconcile to the corresponding income measures: core earnings before income taxes reconciled to income before income taxes; core earnings before preferred stock dividends reconciled to net income; and segment core earnings reconciled to net income attributable to common stockholders.
12
Supplemental Information
The following table sets forth information about outstanding volume in each of Farmer Mac's lines of business as of the dates indicated:
| Outstanding Business Volume | ||||||||||||||||||||
| On or Off Balance Sheet | As of December 31, | |||||||||||||||||||
| 2022 | 2021 | |||||||||||||||||||
| (in thousands) | ||||||||||||||||||||
| Agricultural Finance: | ||||||||||||||||||||
| Farm & Ranch: | ||||||||||||||||||||
| Loans | On-balance sheet | $ | 5,150,750 | $ | 4,775,070 | |||||||||||||||
| Loans held in consolidated trusts: | ||||||||||||||||||||
Beneficial interests owned by third-party investors (Pass-Through)(1) | On-balance sheet | 914,918 | 948,623 | |||||||||||||||||
Beneficial interests owned by third-party investors (Structured)(1) | On-balance sheet | 296,658 | — | |||||||||||||||||
IO-FMGS(2) | On-balance sheet | 10,622 | 12,297 | |||||||||||||||||
| USDA Securities | On-balance sheet | 2,407,302 | 2,445,806 | |||||||||||||||||
AgVantage Securities(1) | On-balance sheet | 5,605,000 | 4,725,000 | |||||||||||||||||
| LTSPCs and unfunded commitments | Off-balance sheet | 2,822,309 | 2,587,154 | |||||||||||||||||
Other Farmer Mac Guaranteed Securities(3) | Off-balance sheet | 500,953 | 578,358 | |||||||||||||||||
| Loans serviced for others | Off-balance sheet | 20,280 | 22,331 | |||||||||||||||||
| Total Farm & Ranch | $ | 17,728,792 | $ | 16,094,639 | ||||||||||||||||
| Corporate AgFinance: | ||||||||||||||||||||
| Loans | On-balance sheet | $ | 1,166,253 | $ | 1,123,300 | |||||||||||||||
AgVantage Securities(1) | On-balance sheet | 359,600 | 367,464 | |||||||||||||||||
| Unfunded commitments | Off-balance sheet | 77,654 | 47,070 | |||||||||||||||||
| Total Corporate AgFinance | $ | 1,603,507 | $ | 1,537,834 | ||||||||||||||||
| Total Agricultural Finance | $ | 19,332,299 | $ | 17,632,473 | ||||||||||||||||
| Rural Infrastructure Finance: | ||||||||||||||||||||
| Rural Utilities: | ||||||||||||||||||||
| Loans | On-balance sheet | $ | 2,801,696 | $ | 2,302,373 | |||||||||||||||
AgVantage Securities(1) | On-balance sheet | 3,044,156 | 3,033,262 | |||||||||||||||||
| LTSPCs and unfunded commitments | Off-balance sheet | 512,592 | 556,837 | |||||||||||||||||
Other Farmer Mac Guaranteed Securities(3) | Off-balance sheet | 1,169 | 2,755 | |||||||||||||||||
| Total Rural Utilities | $ | 6,359,613 | $ | 5,895,227 | ||||||||||||||||
| Renewable Energy: | ||||||||||||||||||||
| Loans | On-balance sheet | $ | 219,570 | $ | 86,763 | |||||||||||||||
| Unfunded commitments | Off-balance sheet | 10,600 | — | |||||||||||||||||
| Total Renewable Energy | $ | 230,170 | $ | 86,763 | ||||||||||||||||
| Total Rural Infrastructure Finance | $ | 6,589,783 | $ | 5,981,990 | ||||||||||||||||
| Total | $ | 25,922,082 | $ | 23,614,463 | ||||||||||||||||
(1)A Farmer Mac Guaranteed Security.
(2)An interest-only Farmer Mac Guaranteed Security retained as part of a structured securitization.
(3)Other categories of Farmer Mac Guaranteed Securities that were sold by Farmer Mac to third parties
13
The following table presents the quarterly net effective spread (a non-GAAP measure) by segment:
Net Effective Spread(1) | |||||||||||||||||||||||||||||||||||||||||||||||||||||||||||||||||||||||||||||||||||
| Agricultural Finance | Rural Infrastructure Finance | Treasury | |||||||||||||||||||||||||||||||||||||||||||||||||||||||||||||||||||||||||||||||||
| Farm & Ranch | Corporate AgFinance | Rural Utilities | Renewable Energy | Funding | Investments | Net Effective Spread | |||||||||||||||||||||||||||||||||||||||||||||||||||||||||||||||||||||||||||||
| Dollars | Yield | Dollars | Yield | Dollars | Yield | Dollars | Yield | Dollars | Yield | Dollars | Yield | Dollars | Yield | ||||||||||||||||||||||||||||||||||||||||||||||||||||||||||||||||||||||
| (dollars in thousands) | |||||||||||||||||||||||||||||||||||||||||||||||||||||||||||||||||||||||||||||||||||
| For the quarter ended: | |||||||||||||||||||||||||||||||||||||||||||||||||||||||||||||||||||||||||||||||||||
December 31, 2022(2) | $ | 32,770 | 0.98 | % | $ | 7,471 | 1.94 | % | $ | 4,960 | 0.34 | % | $ | 935 | 1.76 | % | $ | 27,656 | 0.42 | % | $ | (2,689) | 0.19 | % | $ | 71,103 | 1.07 | % | |||||||||||||||||||||||||||||||||||||||||||||||||||||||
| September 30, 2022 | 33,343 | 1.04 | % | 7,600 | 1.99 | % | 4,220 | 0.30 | % | 705 | 1.97 | % | 22,564 | 0.36 | % | (2,791) | (0.21) | % | 65,641 | 1.03 | % | ||||||||||||||||||||||||||||||||||||||||||||||||||||||||||||||
| June 30, 2022 | 32,590 | 1.05 | % | 6,929 | 1.87 | % | 3,733 | 0.27 | % | 468 | 1.78 | % | 18,508 | 0.30 | % | (1,282) | (0.10) | % | 60,946 | 0.99 | % | ||||||||||||||||||||||||||||||||||||||||||||||||||||||||||||||
| March 31, 2022 | 30,354 | 1.02 | % | 7,209 | 1.96 | % | 3,159 | 0.23 | % | 375 | 1.69 | % | 16,738 | 0.28 | % | 4 | — | % | 57,839 | 0.97 | % | ||||||||||||||||||||||||||||||||||||||||||||||||||||||||||||||
| December 31, 2021 | 28,998 | 0.99 | % | 6,321 | 1.84 | % | 2,521 | 0.19 | % | 356 | 1.53 | % | 15,979 | 0.28 | % | 158 | 0.01 | % | 54,333 | 0.94 | % | ||||||||||||||||||||||||||||||||||||||||||||||||||||||||||||||
| September 30, 2021 | 28,914 | 1.06 | % | 7,163 | 1.80 | % | 2,067 | 0.16 | % | 236 | 1.09 | % | 17,386 | 0.31 | % | 159 | 0.01 | % | 55,925 | 0.99 | % | ||||||||||||||||||||||||||||||||||||||||||||||||||||||||||||||
| June 30, 2021 | 29,163 | 1.06 | % | 6,676 | 1.65 | % | 1,759 | 0.14 | % | 378 | 1.80 | % | 18,449 | 0.33 | % | 126 | 0.01 | % | 56,551 | 1.01 | % | ||||||||||||||||||||||||||||||||||||||||||||||||||||||||||||||
| March 31, 2021 | 26,461 | 0.98 | % | 6,921 | 1.67 | % | 1,720 | 0.14 | % | 249 | 1.28 | % | 18,394 | 0.33 | % | 114 | 0.01 | % | 53,859 | 0.97 | % | ||||||||||||||||||||||||||||||||||||||||||||||||||||||||||||||
| December 31, 2020 | 25,596 | 0.95 | % | 6,237 | 1.53 | % | 1,838 | 0.15 | % | 123 | 1.20 | % | 20,585 | 0.37 | % | 143 | 0.01 | % | 54,522 | 0.98 | % | ||||||||||||||||||||||||||||||||||||||||||||||||||||||||||||||
(1)Farmer Mac excludes the Corporate segment in the presentation above because the segment does not have any interest-earning assets.
(2)See above for a reconciliation of GAAP net interest income by line of business to net effective spread by line of business for the three months ended December 31, 2022.
14
The following table presents quarterly core earnings reconciled to net income attributable to common stockholders:
| Core Earnings by Quarter Ended | |||||||||||||||||||||||||||||||||||||||||||||||||||||
| December 2022 | September 2022 | June 2022 | March 2022 | December 2021 | September 2021 | June 2021 | March 2021 | December 2020 | |||||||||||||||||||||||||||||||||||||||||||||
| (in thousands) | |||||||||||||||||||||||||||||||||||||||||||||||||||||
| Revenues: | |||||||||||||||||||||||||||||||||||||||||||||||||||||
| Net effective spread | $ | 71,103 | $ | 65,641 | $ | 60,946 | $ | 57,839 | $ | 54,333 | $ | 55,925 | $ | 56,551 | $ | 53,859 | $ | 54,522 | |||||||||||||||||||||||||||||||||||
| Guarantee and commitment fees | 4,677 | 4,201 | 4,709 | 4,557 | 4,637 | 4,322 | 4,334 | 4,240 | 4,652 | ||||||||||||||||||||||||||||||||||||||||||||
| Gains on sale of mortgage loans | — | — | — | — | 6,539 | — | — | — | — | ||||||||||||||||||||||||||||||||||||||||||||
| Other | 390 | 473 | 307 | 514 | 241 | 687 | 301 | 451 | 512 | ||||||||||||||||||||||||||||||||||||||||||||
| Total revenues | 76,170 | 70,315 | 65,962 | 62,910 | 65,750 | 60,934 | 61,186 | 58,550 | 59,686 | ||||||||||||||||||||||||||||||||||||||||||||
| Credit related expense/(income): | |||||||||||||||||||||||||||||||||||||||||||||||||||||
| Provision for/(release of) losses | 1,945 | 450 | (1,535) | (54) | (1,428) | 255 | (983) | (31) | 2,973 | ||||||||||||||||||||||||||||||||||||||||||||
| REO operating expenses | 819 | — | — | — | — | — | — | — | — | ||||||||||||||||||||||||||||||||||||||||||||
| Losses on sale of REO | — | — | — | — | — | — | — | — | 22 | ||||||||||||||||||||||||||||||||||||||||||||
| Total credit related expense/(income) | 2,764 | 450 | (1,535) | (54) | (1,428) | 255 | (983) | (31) | 2,995 | ||||||||||||||||||||||||||||||||||||||||||||
| Operating expenses: | |||||||||||||||||||||||||||||||||||||||||||||||||||||
| Compensation and employee benefits | 12,105 | 11,648 | 11,715 | 13,298 | 11,246 | 10,027 | 9,779 | 11,795 | 9,497 | ||||||||||||||||||||||||||||||||||||||||||||
| General and administrative | 8,055 | 6,919 | 7,520 | 7,278 | 8,492 | 6,330 | 6,349 | 6,336 | 6,274 | ||||||||||||||||||||||||||||||||||||||||||||
| Regulatory fees | 832 | 812 | 813 | 812 | 812 | 750 | 750 | 750 | 750 | ||||||||||||||||||||||||||||||||||||||||||||
| Total operating expenses | 20,992 | 19,379 | 20,048 | 21,388 | 20,550 | 17,107 | 16,878 | 18,881 | 16,521 | ||||||||||||||||||||||||||||||||||||||||||||
| Net earnings | 52,414 | 50,486 | 47,449 | 41,576 | 46,628 | 43,572 | 45,291 | 39,700 | 40,170 | ||||||||||||||||||||||||||||||||||||||||||||
| Income tax expense | 11,210 | 10,303 | 9,909 | 9,024 | 9,809 | 9,152 | 9,463 | 8,520 | 8,470 | ||||||||||||||||||||||||||||||||||||||||||||
| Preferred stock dividends | 6,791 | 6,791 | 6,792 | 6,791 | 6,792 | 6,774 | 5,842 | 5,269 | 5,269 | ||||||||||||||||||||||||||||||||||||||||||||
| Core earnings | $ | 34,413 | $ | 33,392 | $ | 30,748 | $ | 25,761 | $ | 30,027 | $ | 27,646 | $ | 29,986 | $ | 25,911 | $ | 26,431 | |||||||||||||||||||||||||||||||||||
| Reconciling items: | |||||||||||||||||||||||||||||||||||||||||||||||||||||
| Gains/(losses) on undesignated financial derivatives due to fair value changes | $ | 1,596 | $ | 6,441 | $ | 2,846 | $ | 2,612 | $ | (1,242) | $ | (405) | $ | (3,020) | $ | 3,236 | $ | (3,005) | |||||||||||||||||||||||||||||||||||
| (Losses)/gains on hedging activities due to fair value changes | (148) | (624) | 428 | 5,687 | (2,079) | 1,818 | (5,866) | 4,317 | 7,954 | ||||||||||||||||||||||||||||||||||||||||||||
| Unrealized gains/(losses) on trading assets | 31 | (757) | (285) | 94 | (76) | 36 | (61) | (14) | 223 | ||||||||||||||||||||||||||||||||||||||||||||
| Net effects of amortization of premiums/discounts and deferred gains on assets consolidated at fair value | 57 | 24 | (62) | 20 | 71 | 23 | 20 | 16 | (77) | ||||||||||||||||||||||||||||||||||||||||||||
| Net effects of terminations or net settlements on financial derivatives | 1,268 | (3,522) | 2,536 | 15,512 | (429) | (351) | 109 | 1,165 | 1,583 | ||||||||||||||||||||||||||||||||||||||||||||
| Income tax effect related to reconciling items | (590) | (327) | (1,148) | (5,024) | 789 | (236) | 1,852 | (1,831) | (1,403) | ||||||||||||||||||||||||||||||||||||||||||||
| Net income attributable to common stockholders | $ | 36,627 | $ | 34,627 | $ | 35,063 | $ | 44,662 | $ | 27,061 | $ | 28,531 | $ | 23,020 | $ | 32,800 | $ | 31,706 | |||||||||||||||||||||||||||||||||||
15