ai-202102230001577526false00015775262021-02-232021-02-23
UNITED STATES
SECURITIES AND EXCHANGE COMMISSION
WASHINGTON, D.C. 20549
FORM 8-K
CURRENT REPORT
Pursuant to Section 13 or 15(d) of the Securities Exchange Act of 1934
Date of Report (Date of earliest event reported): February 23, 2021
C3.AI, INC.
(Exact name of Registrant as Specified in Its Charter)
Delaware
(State or Other Jurisdiction
of Incorporation)
1300 Seaport Blvd, Suite 500
Redwood City, CA
(Address of Principal Executive Offices)
001-39744
(Commission File Number)
26-3999357
(IRS Employer Identification No.)
94063
(Zip Code)
(650) 503-2200
(Registrant's Telephone Number, Including Area Code)
Not Applicable
(Former Name or Former Address, if Changed Since Last Report)
Check the appropriate box below if the Form 8-K filing is intended to simultaneously satisfy the filing obligation of the registrant under any of the following provisions (see General Instruction A.2. below):
☐ Written communications pursuant to Rule 425 under the Securities Act (17 CFR 230.425)
☐ Soliciting material pursuant to Rule 14a-12 under the Exchange Act (17 CFR 240.14a-12)
☐ Pre-commencement communications pursuant to Rule 14d-2(b) under the Exchange Act (17 CFR 240.14d-2(b))
☐ Pre-commencement communications pursuant to Rule 13e-4(c) under the Exchange Act (17 CFR 240.13e-4(c))
Securities registered pursuant to Section 12(b) of the Act:
| | | | | | | | | | | | | | |
| Title of each class | | Trading Symbol(s) | | Name of each exchange on
which registered |
Class A Common Stock, $0.001
par value per share | | AI | | The New York Stock
Exchange |
Indicate by check mark whether the registrant is an emerging growth company as defined in Rule 405 of the Securities Act of 1933 (§230.405 of this chapter) or Rule 12b-2 of the Securities Exchange Act of 1934 (§240.12b-2 of this chapter).
Emerging growth company ☒
If an emerging growth company, indicate by check mark if the registrant has elected not to use the extended transition period for complying with any new or revised financial accounting standards provided pursuant to Section 13(a) of the Exchange Act. ☐
Item 2.02 Results of Operations and Financial Condition.
On March 1, 2021, C3.ai, Inc. (the “Company”) issued a press release announcing its financial results for the fiscal third quarter ended January 31, 2021. A copy of the press release is attached hereto as Exhibit 99.1 and is incorporated herein by reference.
The information contained in this Item 2.02 and Item 9.01 in this Current Report on Form 8-K, including the accompanying Exhibit 99.1 hereto, shall not be deemed “filed” for purposes of Section 18 of the Securities Exchange Act of 1934, as amended (the “Exchange Act”), or otherwise subject to the liabilities of that section, nor shall it be deemed incorporated by reference in any filing made by the Company under the Securities Act of 1933, as amended, or the Exchange Act, regardless of any general incorporation language in such filings, unless expressly incorporated by specific reference in such filing.
Item 5.02 Departure of Directors or Certain Officers; Election of Directors; Appointment of Certain Officers; Compensatory Arrangements of Certain Officers.
On February 23, 2021, the board of directors (the “Board”) of the Company approved an increase in the total authorized number of members of the Board by one (1) to eleven (11) directors and elected Jim Hagemann Snabe to fill the newly-created vacancy, effective immediately. Mr. Snabe was elected as a Class III director with a term expiring at the Company’s 2023 annual meeting of stockholders.
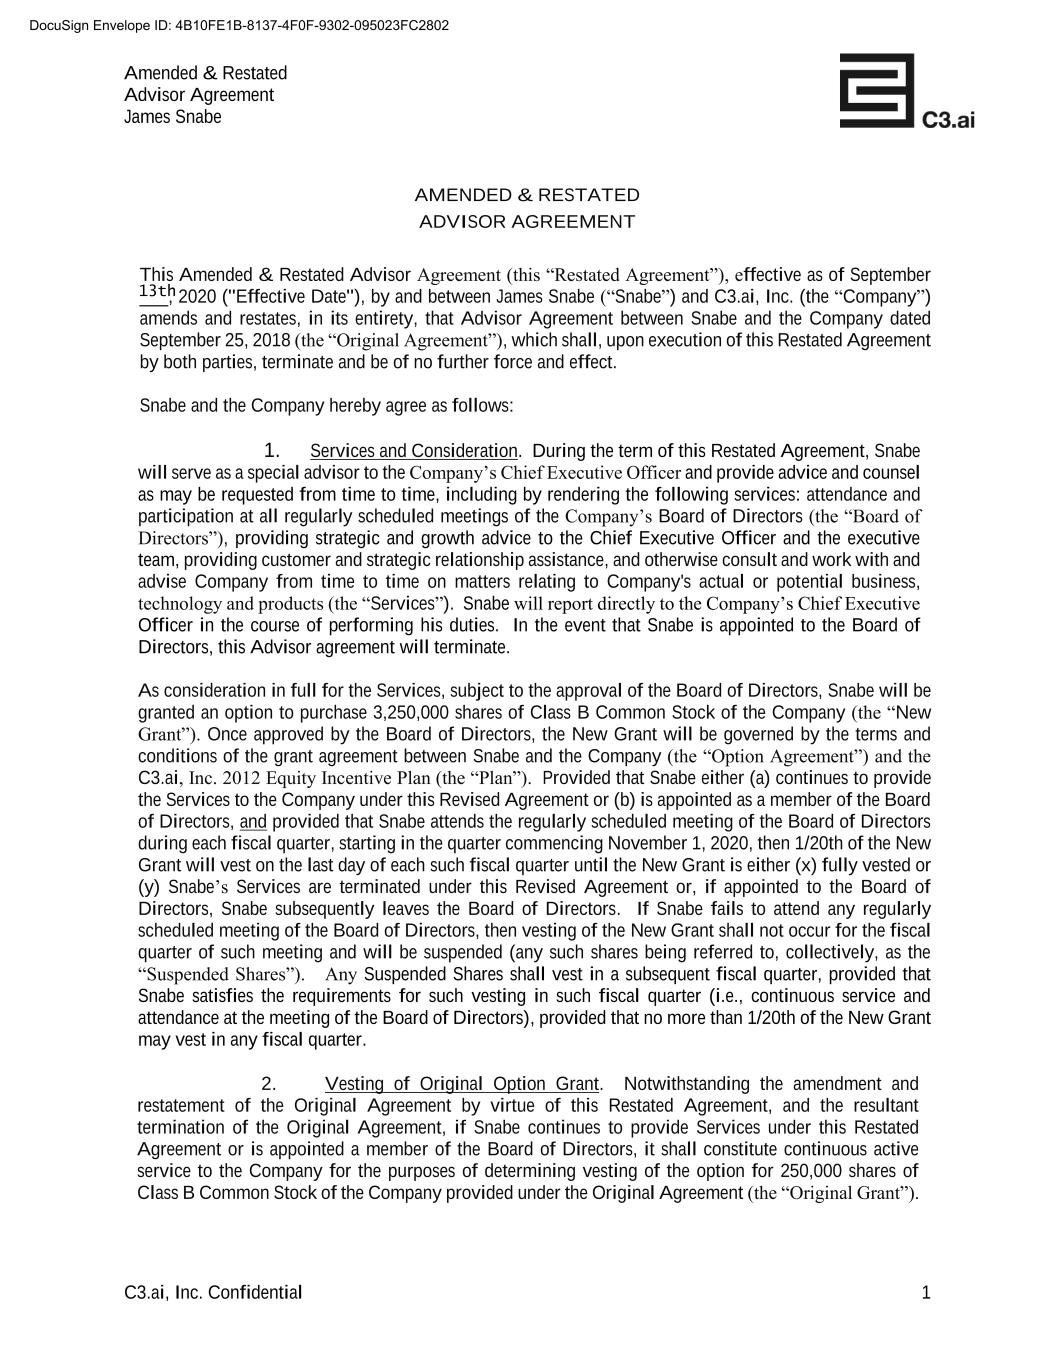
Prior to his election as a member of the Board, Mr. Snabe served as a senior advisor to the Company’s Chief Executive Officer from September 2020, pursuant to an Amended and Restated Advisor Agreement, dated September 13, 2020 (the “Advisor Agreement”). Pursuant to the Advisor Agreement, the Board granted Mr. Snabe a non-qualified stock option to purchase 541,667 shares (after giving effect to the six-for-one reverse stock split of the Company’s common and preferred stock that became effective on November 25, 2020 (the “Stock Split”)). Five percent of the shares subject to the option vest on the last day of each fiscal quarter starting in the quarter commencing November 1, 2020 until the shares subject to the option are fully vested or Mr. Snabe ceases to be a member of the Board, provided, however, that if Mr. Snabe fails to attend any regularly scheduled meeting of the Board during a quarter, then vesting for such quarter shall not occur and will be suspended (any such shares are being referred to, collectively, as the “Suspended Shares”). Any Suspended Shares shall vest in a subsequent quarter, provided that Mr. Snabe satisfies the requirements for vesting in such fiscal quarter, provided that no more than 5% of the total shares subject to the option may vest in any fiscal quarter. The option also vests in full upon a change of control (as defined in the option agreement with Mr. Snabe). The option has an exercise price of $11.16 per share. The foregoing description of the Advisor Agreement does not purport to be complete and is qualified in its entirety by reference to the full text of the Advisor Agreement, a copy of which is filed as Exhibit 10.1 to this Current Report on Form 8-K and incorporated herein by reference.
In addition, Mr. Snabe served as an advisor to the Company from September 2018 to September 2020. As consideration for such services, the Board granted Mr. Snabe a non-qualified stock option to purchase 41,667 shares (after giving effect to the Stock Split). The shares subject to the option vest in equal monthly installments over the five-year period following the vesting commencement date of September 25, 2018, subject to Mr. Snabe’s continuous service with the Company as of each such vesting date. The option has an exercise price of $3.90 per share.
Mr. Snabe previously served as Co-Chief Executive Officer of SAP AG, a technology company, from February 2010 to May 2014, and as a member of the SAP AG supervisory board from May 2014 to May
2018. Mr. Snabe currently serves as Chairman of the Supervisory Board of Siemens AG, an industrial technology company, and of A.P. Møller - Mærsk A/S, a shipping and transportation company. Mr. Snabe also serves as Vice Chairman of Supervisory Board of Allianz SE, a financial services company, and as a member of the Board of Trustees of the World Economic Forum, a non-profit organization.
There is no arrangement or understanding between Mr. Snabe and any other persons pursuant to which he was elected as a director. Mr. Snabe has no direct or indirect material interest in any transaction required to be disclosed by the Company pursuant to Item 404(a) of Regulation S-K.
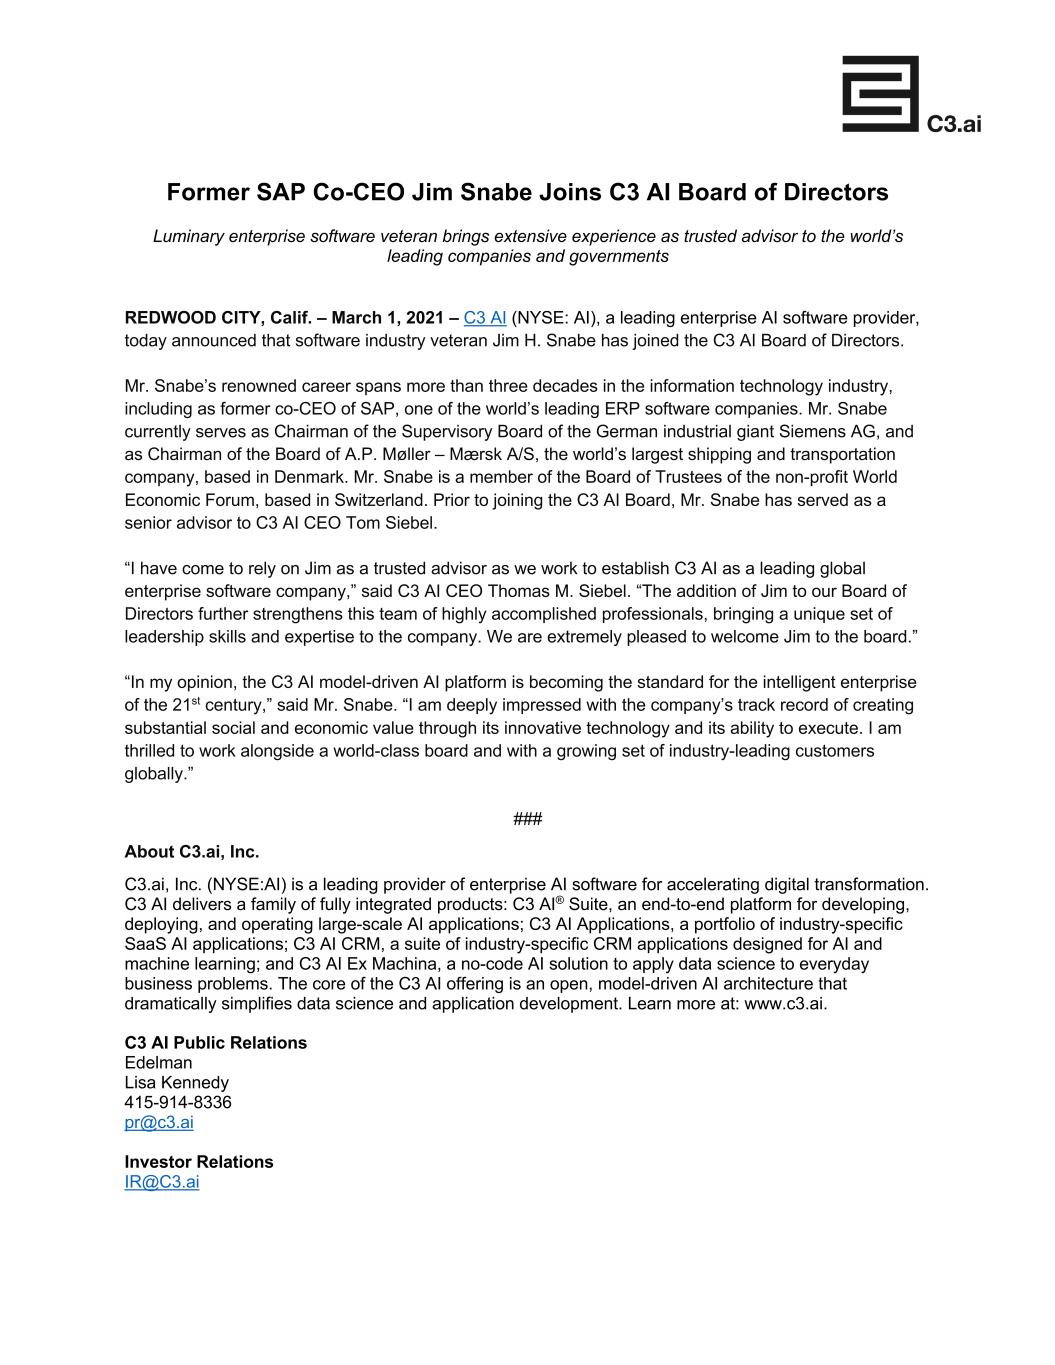
On March 1, 2021, the Company issued a press release announcing Mr. Snabe’s election to the Board. A copy of the press release is attached hereto as Exhibit 99.2 and is incorporated herein by reference.
Item 9.01 Financial Statements and Exhibits.
(d) Exhibits.
| | | | | | | | |
| Exhibit No. | | Description |
| | Amended and Restated Advisor Agreement dated September 13, 2020 by and between Jim Hagemann Snabe and the Company. |
| | Press Release dated March 1, 2021. |
| | Press Release dated March 1, 2021 |
SIGNATURES
Pursuant to the requirements of the Securities Exchange Act of 1934, as amended, the Registrant has duly caused this report to be signed on its behalf by the undersigned hereunto duly authorized.
| | | | | | | | |
| C3.ai, Inc. |
| | |
| Dated: March 1, 2021 | | |
| By: | /s/ Thomas M. Siebel |
| | Thomas M. Siebel |
| | Chief Executive Officer and Chairman of the Board of Directors |
C3 AI Announces Third Quarter Fiscal 2021 Results
Total Revenue of $49.1 million, increased 19% year over year;
Subscription Revenue of $42.7 million, increased 23% year over year
REDWOOD CITY, Calif. - March 1, 2021 - C3.ai, Inc. (NYSE: AI), a leading provider of enterprise AI applications software, today announced results for its fiscal third quarter ended January 31, 2021.
“We continue to establish our leadership as the only enterprise AI software pure play," said CEO Thomas M. Siebel. “This is a large and rapidly growing market; we continue to innovate; we continue to expand our market-partner ecosystem and associated distribution capacity; and we continue to demonstrate technology leadership. I believe that we are increasingly well-positioned to establish a global market leadership position in enterprise AI software.”
Third Quarter Financial Highlights
•Revenue: Total revenue for the quarter was $49.1 million, up from $41.3 million one year ago, an increase of 19% year over year.
•Subscription revenue: Subscription revenue for the quarter was $42.7 million, up from $34.6 million one year ago, an increase of 23% year over year. Subscription revenue increased to 87% of total revenue, up from 84% of total revenue one year ago.
•Professional Services revenue: Professional Services revenue for the quarter was $6.4 million compared to $6.7 million one year ago, a 4% decrease. Year over year, professional services revenue decreased from 16% to 13% of total revenue.
•Gross Margin and non-GAAP Gross Margin: Gross margin for the quarter was $36.9 million, or 75%, compared to $30.4 million, or 74% one year ago, an increase of 22% year over year. Non-GAAP gross margin was $37.3 million, or 76%, an increase from $30.5 million, or 74% one year ago, an increase of 22% year over year.
•Loss from Operations and Non-GAAP Loss from Operations: Loss from operations for the quarter was $18.5 million, compared to $10.4 million one year ago. Non-GAAP operating loss for the third quarter was $11.9 million, compared to $8.4 million one year ago.
Recent Business Highlights
•The C3 AI Digital Transformation footprint in Oil & Gas, Manufacturing, Financial Services, Aerospace, Utilities, and Energy Sustainability continues to expand with new enterprise production deployments at Shell, the US Air Force, US Army, New York Power Authority, ConEd, Bank of America, and Johnson Controls.
•C3 AI significantly expanded its market-partner ecosystem to broaden its distribution and service network globally. In addition to expanding its market partnership activities with Microsoft, Baker Hughes, and ENGIE, C3 AI extended our relationship with Raytheon to serve the defense and intelligence communities; with FIS, a global financial services software company, to serve the banking and financial services industries; and with Infor to serve the global ERP market.
•C3 AI demonstrated continued product leadership in enterprise AI. In the third quarter, the company released C3 AI v7.17, offering significant functional enhancements, performance improvements, and a new Integrated Development Suite (IDS) to accelerate AI application development. In partnership with Microsoft and Adobe, C3 AI announced the availability of C3 AI CRM, a family of industry-specific AI-enabled CRM applications. In addition, C3 AI released C3 AI Ex Machina, a mass-market, cloud-native, low-code/no-code application that enables the democratization of data science.
•The US Patent Office awarded C3 AI an important patent titled, “Systems, methods, and devices for an enterprise AI application development platform” (No.10,817,530). This patent secures the fundamental concepts of applying a model-driven software architecture for enterprise AI applications as C3 AI intellectual property.
•C3 AI expanded its investments and market penetration in the increasingly critical climate and energy sustainability market. In partnership with Shell, Microsoft, and Baker Hughes, C3 AI formed the Open Energy AI Initiative, an open marketplace for C3 AI energy applications. C3 AI increased its investment in the C3.ai Digital Transformation Institute (DTI), funding seminal AI COVID research and issuing a new call for papers to fund innovative research in applying AI and digital transformation to energy and climate security.
•C3 AI expanded the company’s leadership with the addition of Jim Snabe, former co-CEO of SAP, to its Board of Directors. In addition, C3 AI enhanced its global advisory board with the additions of Sajid Javid, Member of Parliament and former Home Secretary and former Chancellor of the Exchequer in the UK; former U.S. Assistant Secretary of the Navy, Admiral Dennis McGinn; former Deputy Director of the NSA, Rick Ledgett; former President of SAP, Franck Cohen and former President and COO of Alteryx, George Mathew.
Financial Outlook:
Our guidance includes GAAP and non-GAAP financial measures.
The following table summarizes our guidance for the fourth quarter of fiscal 2021 and full-year fiscal 2021:
| | | | | | | | | | | |
| (in millions) | Fourth Quarter Fiscal 2021 Guidance | | Full Year Fiscal 2021 Guidance |
| Total revenue | $50.0 - $51.0 | | $180.9 - $181.9 |
| Non-GAAP loss from operations | ($28.0) - ($27.0) | | ($50.1) - ($49.1) |
Historically, the difference between GAAP and non-GAAP measures has been limited to stock-based compensation expense. Beginning with guidance for the fourth quarter of fiscal 2021 and full-year fiscal 2021, and in future periods, the difference between GAAP and non-GAAP measures will include stock-based compensation and employer payroll tax expense related to employee stock-based compensation.
A reconciliation of non-GAAP guidance measures to corresponding GAAP measures is not available on a forward-looking basis without unreasonable effort due to the uncertainty regarding, and the potential variability of, expenses that may be incurred in the future. Stock-based compensation expense-related charges, including employer payroll tax-related items on employee stock transactions, are impacted by the timing of employee stock transactions, the future fair market value of our common stock, and our future hiring and retention needs, all of which are difficult to predict and subject to constant change. We have provided a reconciliation of GAAP to non-GAAP financial measures in the financial statement tables for our historical non-GAAP results included in this press release. Our fiscal year ends April 30, and numbers are rounded for presentation purposes.
Conference Call Details
| | | | | |
| What: | C3 AI Third Quarter Fiscal 2021 Financial Results Conference Call |
| When: | Monday, March 1, 2021 |
| Time: | 2:00 p.m. PT / 5:00 p.m. ET |
| Live Call: | (833) 979-2768, Domestic |
| (236) 714-2883, International |
| Conference ID: 4668908 |
| Webcast: | https://event.on24.com/wcc/r/3015157/885F1E2FD850F2DBC977CC64443C1836 (live and replay) |
Investor Presentation Details
An investor presentation providing additional information and analysis can be found at our investor relations page at ir.c3.ai.
Statement Regarding Use of non-GAAP Financial Measures
We report the following non-GAAP financial measures, which have not been prepared in accordance with generally accepted accounting principles in the United States (GAAP), in addition to, and not as a substitute for, or superior to, financial measures calculated in accordance with GAAP.
•Non-GAAP gross profit, non-GAAP gross margin, and non-GAAP loss from operations. Our non-GAAP gross profit, non-GAAP gross margin, and non-GAAP loss from operations measures exclude the effect of stock-based compensation expense-related charges. We believe the presentation of operating results that exclude these non-cash items provides useful supplemental information to investors and facilitates the analysis of our operating results and comparison of operating results across reporting periods.
We use these non-GAAP financial measures internally for financial and operational decision-making purposes and as a means to evaluate period-to-period comparisons. Non-GAAP financial measures are not meant to be considered in isolation or as a substitute for comparable GAAP financial measures and should be read only in conjunction with our condensed consolidated financial statements prepared in accordance with GAAP. Our presentation of non-GAAP financial measures may not be comparable to similar measures used by other companies. We encourage investors to carefully consider our results under GAAP, as well as our supplemental non-GAAP information and the reconciliation between these presentations, to more fully understand our business. Please see the tables included at the end of this release for the reconciliation of GAAP to non-GAAP results.
Use of Forward-Looking Statements
This press release contains forward-looking statements within the meaning of the Private Securities Litigation Reform Act of 1995. All statements contained in this press release other than statements of historical facts, including our market leadership position, plans to license certain technologies, financial outlook, our business strategies, plans, and objectives for future operations, are forward-looking statements. The words “anticipate,” “believe,” “continue,” “estimate,” “expect,” “intend,” “may,” “will” and similar expressions are intended to identify forward-looking statements. We have based these forward-looking statements largely on our current expectations and projections about future events and trends that we believe may affect our financial condition, results of operations, business strategy, short-term and long-term business operations and objectives, and financial needs. These forward-looking statements are subject to a number of risks and uncertainties. Some of these risks are described in greater detail in our filings with the Securities and Exchange Commission (the “SEC”), including our final prospectus filed on December 9, 2020, although new and unanticipated risks may arise. The future events and trends discussed in this press release may not occur and actual results could differ materially and adversely from those anticipated or implied in the forward-looking statements. Although we believe that the expectations reflected in the forward-looking statements are reasonable, we cannot guarantee future results, levels of activity, performance, achievements, or events and circumstances reflected in the forward-looking statements will occur. Except to the extent required by law, we do not undertake to update any of these forward-looking statements after the date of this press release to conform these statements to actual results or revised expectations.
About C3.ai, Inc.
C3.ai, Inc. (NYSE:AI) is a leading provider of enterprise AI software for accelerating digital transformation. C3 AI delivers a family of fully integrated products: C3 AI® Suite, an end-to-end platform for developing, deploying, and operating large-scale AI applications; C3 AI Applications, a portfolio of industry-specific SaaS AI applications; C3 AI CRM, a suite of industry-specific CRM applications designed for AI and machine learning; and C3 AI Ex Machina, a no-code AI solution to apply data science to everyday business problems. The core of the C3 AI offering is an open, model-driven AI architecture that dramatically simplifies data science and application development. Learn more at: www.c3.ai.
Investor Contact
Press Contact
Lisa Kennedy
(415) 914-8336
Source: C3.ai, Inc.
C3.AI, INC.
CONDENSED CONSOLIDATED STATEMENTS OF OPERATIONS
(In thousands, except per share data)
(unaudited)
| | | | | | | | | | | | | | | | | | | | | | | |
| Three Months Ended January 31, | | Nine Months Ended January 31, |
| 2021 | | 2020 | | 2021 | | 2020 |
| Revenue | | | | | | | |
| Subscription(1) | $ | 42,699 | | | $ | 34,629 | | | $ | 114,248 | | | $ | 98,627 | |
| Professional services(2) | 6,410 | | | 6,654 | | | 16,685 | | | 16,421 | |
| Total revenue | 49,109 | | | 41,283 | | | 130,933 | | | 115,048 | |
| Cost of revenue | | | | | | | |
| Subscription | 7,023 | | | 8,862 | | | 22,694 | | | 23,493 | |
| Professional services | 5,203 | | | 2,069 | | | 10,113 | | | 5,785 | |
| Total cost of revenue | 12,226 | | | 10,931 | | | 32,807 | | | 29,278 | |
| Gross profit | 36,883 | | | 30,352 | | | 98,126 | | | 85,770 | |
| Operating expenses | | | | | | | |
| Sales and marketing | 28,450 | | | 23,162 | | | 64,898 | | | 60,385 | |
| Research and development | 18,748 | | | 12,331 | | | 48,145 | | | 47,122 | |
| General and administrative | 8,184 | | | 5,291 | | | 21,433 | | | 19,541 | |
| Total operating expenses | 55,382 | | | 40,784 | | | 134,476 | | | 127,048 | |
| Loss from operations | (18,499) | | | (10,432) | | | (36,350) | | | (41,278) | |
| Interest income | 129 | | | 1,136 | | | 997 | | | 3,115 | |
| Other (expense) income, net | 1,721 | | | (402) | | | 4,163 | | | (498) | |
| Net loss before provision for income taxes | (16,649) | | | (9,698) | | | (31,190) | | | (38,661) | |
| Provision for income taxes | 203 | | | 98 | | | 456 | | | 283 | |
| Net loss | $ | (16,852) | | | $ | (9,796) | | | $ | (31,646) | | | $ | (38,944) | |
| Net loss attributable to Class A common shareholders, basic and diluted | $ | (0.23) | | | $ | (0.27) | | | $ | (0.64) | | | $ | (1.11) | |
| Net loss attributable to Class A-1 common shareholders, basic and diluted | $ | (0.10) | | | $ | (0.27) | | | $ | (0.52) | | | $ | (1.11) | |
| Net loss attributable to Class B common shareholders, basic and diluted | $ | (0.13) | | | $ | — | | | $ | (0.12) | | | $ | — | |
| Weighted-average shares used in computing net loss per share attributable to Class A common stockholders, basic and diluted | 68,648,229 | | | 30,132,463 | | | 43,480,533 | | | 28,478,395 | |
| Weighted-average shares used in computing net loss per share attributable to Class A-1 common stockholders, basic and diluted | 6,666,665 | | | 6,666,666 | | | 6,666,665 | | | 6,666,666 | |
| Weighted-average shares used in computing net loss per share attributable to Class B common stockholders, basic and diluted | 3,499,992 | | | — | | | 3,499,992 | | | — | |
(1) Including related party revenue of $7,951, $9,865, $21,571 and $30,560 for the three and nine months ended January 31, 2021 and 2020, respectively.
(2) Including related party revenue of $0, $112, $0 and $210 for the three and nine months ended January 31, 2021 and 2020, respectively.
C3.AI, INC.
CONDENSED CONSOLIDATED BALANCE SHEETS
(In thousands, except for share and per share data)
(unaudited)
| | | | | | | | | | | |
| January 31, | | April 30, |
| 2021 | | 2020 |
| Assets | | | |
| Current assets | | | |
| Cash and cash equivalents | $ | 960,122 | | | $ | 33,104 | |
| Short-term investments | 162,880 | | | 211,874 | |
Accounts receivable, net of allowance of $762 and $755 as of January 31, 2021 and April 30, 2020, respectively(1) | 30,231 | | | 30,827 | |
| Prepaid expenses and other current assets | 13,503 | | | 5,400 | |
| Total current assets | 1,166,736 | | | 281,205 | |
| Property and equipment, net | 6,844 | | | 8,723 | |
| Goodwill | 625 | | | 625 | |
| Long-term investments | — | | | 725 | |
| Other assets, non-current | 10,369 | | | 13,830 | |
| Total assets | $ | 1,184,574 | | | $ | 305,108 | |
| Liabilities, redeemable convertible preferred stock, redeemable convertible Class A-1 common stock and stockholders’ (deficit) equity | | | |
| Current liabilities | | | |
| Accounts payable | $ | 12,608 | | | $ | 4,726 | |
| Accrued compensation and employee benefits | 17,996 | | | 13,693 | |
Deferred revenue, current(2) | 59,950 | | | 53,537 | |
| Accrued and other current liabilities | 13,544 | | | 9,083 | |
| Total current liabilities | 104,098 | | | 81,039 | |
| Deferred revenue, non-current | 2,360 | | | 6,758 | |
| Other long-term liabilities | 4,004 | | | 6,001 | |
| Total liabilities | 110,462 | | | 93,798 | |
| Commitments and contingencies | | | |
| Redeemable convertible preferred stock, $0.001 par value. No shares and 233,107,379 shares authorized as of January 31, 2021 and April 30, 2020, respectively; no shares and 37,128,768 shares issued and outstanding as of January 31, 2021 and April 30, 2020, respectively; Liquidation preference of $376,178 as of April 30, 2020. | — | | | 375,207 | |
| Redeemable convertible class A-1 common stock, $0.001 par value. No shares and 6,666,667 shares authorized as of January 31, 2021 and April 30, 2020, respectively; no shares and 6,666,665 shares issued and outstanding as of January 31, 2021 and April 30, 2020, respectively; Liquidation preference of $18,800 as of April 30, 2020 | — | | | 18,800 | |
| Stockholders’ (deficit) equity | | | |
| Class A common stock, $0.001 par value. 1,000,000,000 and 390,000,000 shares authorized as of January 31, 2021 and April 30, 2020, respectively; 97,431,675 and 31,210,159 shares issued and outstanding as of January 31, 2021 and April 30, 2020 respectively | 98 | | | 31 | |
| Class B common stock, $0.001 par value; 3,500,000 and 21,000,000 shares authorized as of January 31, 2021 and April 30, 2020, respectively; 3,499,992 and no shares issued and outstanding as of January 31, 2021 and April 30, 2020, respectively | 3 | | | — | |
| Additional paid-in capital | 1,399,281 | | | 110,485 | |
| Accumulated other comprehensive income | 13 | | | 424 | |
| Accumulated deficit | (325,283) | | | (293,637) | |
| Total stockholders’ (deficit) equity | 1,074,112 | | | (182,697) | |
| Total liabilities, redeemable convertible preferred stock, redeemable convertible Class A-1 common stock and stockholders’ (deficit) equity | $ | 1,184,574 | | | $ | 305,108 | |
(1) Including amounts from a related party of $1,030 and $250 as of January 31, 2021 and April 30, 2020, respectively.
(2) Including amounts from a related party of $9,358 and $1,499 as of January 31, 2021 and April 30, 2020, respectively.
C3.AI, INC.
CONDENSED CONSOLIDATED STATEMENTS OF CASH FLOWS
(In thousands)
(unaudited)
| | | | | | | | | | | |
| Nine Months Ended January 31, |
| 2021 | | 2020 |
| Cash flows from operating activities: | | | |
| Net loss | $ | (31,646) | | | $ | (38,944) | |
| Adjustments to reconcile net loss to net cash used in operating activities | | | |
| Depreciation and amortization | 3,189 | | | 566 | |
| Non-cash operating lease cost | 2,474 | | | 2,267 | |
| Stock-based compensation expense | 14,270 | | | 5,424 | |
| Other | (115) | | | (324) | |
| Changes in operating assets and liabilities | | | |
| Accounts receivable(1) | 588 | | | 33,744 | |
| Prepaid expenses, other current assets and other assets | (6,931) | | | (6,928) | |
| Accounts payable | 7,447 | | | (917) | |
| Accrued compensation and employee benefits | 4,303 | | | 1,081 | |
| Lease liability | (2,636) | | | (2,344) | |
| Other liabilities | 1,213 | | | (397) | |
| Deferred revenue(2) | 2,016 | | | (20,335) | |
| Net cash used in operating activities | (5,828) | | | (27,107) | |
| Cash flows from investing activities: | | | |
| Purchase of property and equipment | (1,166) | | | (1,629) | |
| Capitalized software development costs | — | | | (581) | |
| Proceeds from sale of non-marketable equity security | 725 | | | — | |
| Purchase of investments | (232,287) | | | (197,067) | |
| Maturity and sale of investments | 280,997 | | | 58,625 | |
| Net cash provided by (used in) investing activities | 48,269 | | | (140,652) | |
| Cash flows from financing activities: | | | |
| Proceeds from initial public offering and private placements, net of underwriting discounts | 851,859 | | | — | |
| Proceeds from repayment of shareholder loan | 26,003 | | | — | |
| Proceeds from issuance of Series G, net of issuance costs | — | | | 25,333 | |
| Proceeds from issuance of Series H, net of issuance costs | — | | | 49,836 | |
| Repurchase of common stock and options in tender offer | — | | | (3,548) | |
| Payment of deferred offering costs | (6,710) | | | — | |
| Proceeds from issuance of common stock | — | | | 44,028 | |
| Proceeds from exercise of Class A common stock options | 13,825 | | | 3,846 | |
| Net cash provided by financing activities | 884,977 | | | 119,495 | |
| Net increase (decrease) in cash, cash equivalents and restricted cash | 927,418 | | | (48,264) | |
| Cash, cash equivalents and restricted cash at beginning of period | 33,604 | | | 99,107 | |
| Cash, cash equivalents and restricted cash at end of period | $ | 961,022 | | | $ | 50,843 | |
| Cash and cash equivalents | $ | 960,122 | | | $ | 50,343 | |
| Restricted cash included in other assets | 900 | | | 500 | |
| Total cash, cash equivalents and restricted cash | $ | 961,022 | | | $ | 50,843 | |
| Supplemental disclosures of cash flow information—cash paid for income taxes | $ | 435 | | | $ | 541 | |
| Supplemental disclosure of non-cash investing and financing activities: | | | |
| Purchases of property and equipment included in accounts payable and accrued liabilities | $ | 349 | | | $ | — | |
| Deferred offering costs included in accounts payable and accrued liabilities | $ | 503 | | | $ | — | |
| Vesting of early exercised stock options | $ | 2,073 | | | $ | 427 | |
(1) Including changes in related party balances of $(780) and $19,826 for the nine months ended January 31, 2021 and 2020, respectively.
(2) Including changes in related party balances of $7,859 and $(8,596) for the nine months ended January 31, 2021 and 2020, respectively.
C3.AI, INC.
RECONCILIATION OF GAAP TO NON-GAAP FINANCIAL MEASURES
(In thousands, except percentages)
(unaudited)
| | | | | | | | | | | | | | | | | | | | | | | |
| Three Months Ended January 31, | | Nine Months Ended January 31, |
| 2021 | | 2020 | | 2021 | | 2020 |
| Gross profit on a GAAP basis | $ | 36,883 | | | $ | 30,352 | | | $ | 98,126 | | | $ | 85,770 | |
| Stock-based compensation expense(1) | 378 | | | 134 | | | 858 | | | 339 | |
| Gross profit on a non-GAAP basis | $ | 37,261 | | | $ | 30,486 | | | $ | 98,984 | | | $ | 86,109 | |
| | | | | | | |
| | | | | | | |
| Gross margin on a GAAP basis | 75 | % | | 74 | % | | 75 | % | | 75 | % |
| Gross margin on a non-GAAP basis | 76 | % | | 74 | % | | 76 | % | | 75 | % |
| | | | | | | |
| Loss from operations on a GAAP basis | $ | (18,499) | | | $ | (10,432) | | | $ | (36,350) | | | $ | (41,278) | |
| Stock-based compensation expense(1) | 6,589 | | | 2,061 | | | 14,270 | | | 5,424 | |
| Loss from operations on a non-GAAP basis | $ | (11,910) | | | $ | (8,371) | | | $ | (22,080) | | | $ | (35,854) | |
(1)Stock-based compensation expense for gross profits and gross margin includes costs of subscription and cost of professional services as follows. Stock-based compensation expense for loss from operations includes total stock-based compensation expense as follows:
| | | | | | | | | | | | | | | | | | | | | | | |
| Three Months Ended January 31, | | Nine Months Ended January 31, |
| 2021 | | 2020 | | 2021 | | 2020 |
| | | | | |
| Cost of subscription | $ | 214 | | | $ | 104 | | | $ | 557 | | | $ | 246 | |
| Cost of professional services | 164 | | | 30 | | | 301 | | | 93 | |
| Sales and marketing | 2,790 | | | 613 | | | 5,835 | | | 1,894 | |
| Research and development | 846 | | | 308 | | | 1,952 | | | 910 | |
| General and administrative | 2,575 | | | 1,006 | | | 5,625 | | | 2,281 | |
| Total stock-based compensation expense | $ | 6,589 | | | $ | 2,061 | | | $ | 14,270 | | | $ | 5,424 | |