0000903419false00009034192022-04-272022-04-27

United States

Securities And Exchange Commission
Washington, DC 20549

FORM 8-K

Current Report Pursuant to
Section 13 or 15(d) of the
Securities Exchange Act of 1934

Date of report (Date of earliest event reported): April 27, 2022

Alerus Financial Corporation
(Exact Name of Registrant as Specified in Charter)

Delaware

001-39036

45-0375407

(State or Other Jurisdiction of Incorporation)

(Commission File Number)

(IRS Employer Identification No.)

401 Demers Avenue
Grand Forks, North Dakota 58201
(Address of Principal Executive Offices) (Zip Code)

Registrant's telephone number, including area code: (701) 795-3200

N/A

(Former Name or Former Address, if Changed Since Last Report.)

Check the appropriate box below if the Form 8-K filing is intended to simultaneously satisfy the filing obligation of the registrant under any of the following provisions (see General Instruction A.2. below):

Written communications pursuant to Rule 425 under the Securities Act (17 CFR 230.425)

Soliciting material pursuant to Rule 14a-12 under the Exchange Act (17 CFR 240.14a-12)

Pre-commencement communications pursuant to Rule 14d-2(b) under the Exchange
Act (17 CFR 240.14d-2(b))

Pre-commencement communications pursuant to Rule 13e-4(c) under the Exchange
Act (17 CFR 240.13e-4(c))

Securities registered pursuant to Section 12(b) of the Act:

Title of each class

Trading symbol

Name of each exchange on which registered

Common Stock, $1.00 par value per share

ALRS

The Nasdaq Stock Market LLC

Indicate by check mark whether the registrant is an emerging growth company as defined in Rule 405 of the Securities Act of 1933 (§ 230.405 of this chapter) or Rule 12b–2 of the Securities Exchange Act of 1934 (§ 240.12b–2 of this chapter).

Emerging growth company

If an emerging growth company, indicate by check mark if the registrant has elected not to use the extended transition period for complying with any new or revised financial accounting standards provided pursuant to Section 13(a) of the Exchange Act. 

Item 2.02.     Results of Operations and Financial Condition.

On April 27, 2022, Alerus Financial Corporation (the “Company”) issued a press release announcing its financial results for the three months ended March 31, 2022. A copy of the press release is attached as Exhibit 99.1 to this Form 8-K and is incorporated herein by reference.

The information in Item 2.02 of this Current Report on Form 8-K, and the related Exhibit 99.1, attached hereto is being “furnished” and will not, except to the extent required by applicable law or regulation, be deemed “filed” by the Company for purposes of Section 18 of the Securities Exchange Act of 1934, as amended (the “Exchange Act”), or otherwise subject to the liabilities of that section, nor will any of such information or exhibits be deemed incorporated by reference to any filing under the Securities Act of 1933, as amended, or the Exchange Act, except as may be expressly set forth by specific reference in such filing.

Item 7.01.     Regulation FD Disclosure.

On April 27, 2022, the Company posted a presentation to the Company’s investor relations website, located at investors.alerus.com. The presentation is also attached hereto as Exhibit 99.2.

The information in Item 7.01 of this Current Report on Form 8-K, and the related Exhibit 99.2, attached hereto is being “furnished” and will not, except to the extent required by applicable law or regulation, be deemed “filed” by the Company for purposes of Section 18 of the Exchange Act, or otherwise subject to the liabilities of that section, nor will any of such information or exhibits be deemed incorporated by reference to any filing under the Securities Act of 1933, as amended, or the Exchange Act, except as may be expressly set forth by specific reference in such filing.

Item 9.01.     Financial Statements and Exhibits.

(d)  Exhibits

Exhibit No.


Description

99.1

Press Release of Alerus Financial Corporation, dated April 27, 2022

99.2

104

Investor Presentation of Alerus Financial Corporation

Cover Page Interactive Data File (embedded within the Inline XBLR document)

SIGNATURES

Pursuant to the requirements of the Securities Exchange Act of 1934, the registrant has duly caused this report to be signed on its behalf by the undersigned hereunto duly authorized.

Date: April 27, 2022

Alerus Financial Corporation

By:

/s/ Katie A. Lorenson

Name:

Katie A. Lorenson

Title:

President and Chief Executive Officer

Exhibit 99.1

Graphic

FOR RELEASE (04.27.2022)

Alan A. Villalon, Chief Financial Officer

952.417.3733 (Office)

ALERUS FINANCIAL CORPORATION REPORTS

FIRST QUARTER 2022 NET INCOME OF $10.2 MILLION

GRAND FORKS, N.D. (April 27, 2022) – Alerus Financial Corporation (Nasdaq: ALRS) reported net income of $10.2 million for the first quarter of 2022, or $0.57 per diluted common share, compared to net income of $12.7 million, or $0.72 per diluted common share, for the fourth quarter of 2021, and net income of $15.2 million, or $0.86 per diluted common share, for the first quarter of 2021.

CEO Comments

President and Chief Executive Officer Katie Lorenson said, “Alerus entered the new year with upward momentum and finished the quarter strong, producing net income of $10.2 million and return on average tangible common equity of 14.72%. We had strong production in our business and consumer segments, focused on serving our clients holistically with our diverse product offerings. Mortgage application volume remained steady, however, the lack of housing inventory put pressure on origination volume. Credit quality remains pristine with another quarter of net recoveries and continued low levels of non-performing loans. Our company continues to achieve sound expense management, despite the pressure on wages and continued investment in talent. We successfully attracted a five-person commercial real estate team, specializing in financing local, regional and national development and commercial construction projects. We believe this team will further enhance our expertise in the commercial banking space and our growing brand and presence in the Twin Cities. We believe our ability to execute talent lift-outs, acquisitions and continued, strong organic performance will create continued value for our shareholders.”

Quarterly Highlights

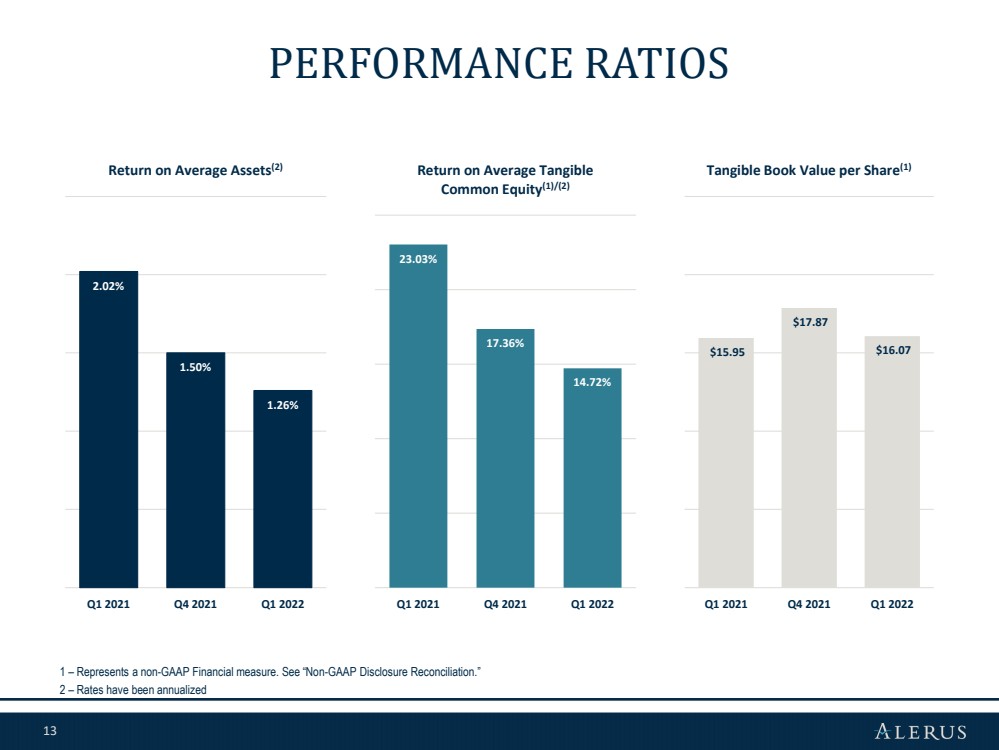
Return on average total assets of 1.26%, compared to 1.50% for the fourth quarter of 2021
Return on average common equity of 11.78%, compared to 14.12% for the fourth quarter of 2021
Return on average tangible common equity(1) of 14.72%, compared to 17.36% for the fourth quarter of 2021
Net interest margin (tax-equivalent) was 2.83%, compared to 2.84% for the fourth quarter of 2021
Allowance for loan losses to total loans was 1.74%, compared to 1.80% as of December 31, 2021
Efficiency ratio(1) of 72.25%, compared to 71.06% for the fourth quarter of 2021
Noninterest income for the first quarter of 2022 was 57.62% of total revenue, compared to 59.67% for the fourth quarter of 2021
Mortgage originations totaled $186.8 million, a 47.7% decrease from the fourth quarter of 2021
Loans held for sale decreased $24.6 million, or 53.0%, since December 31, 2021
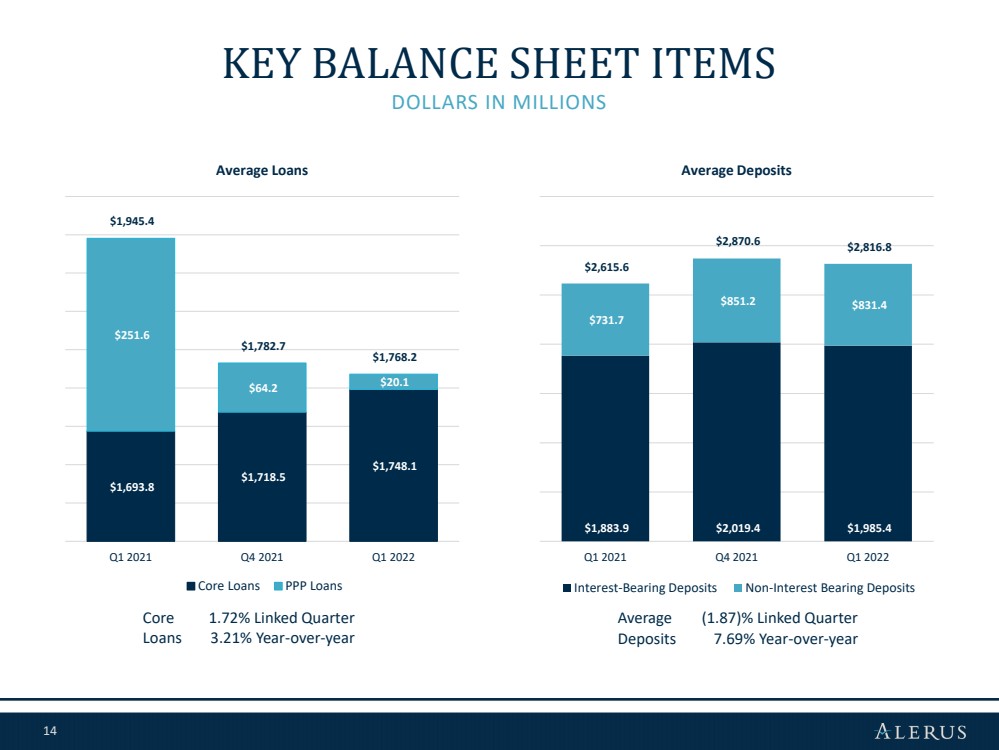
Loans held for investment increased $60.0 million, or 3.4%, since December 31, 2021; excluding Paycheck Protection Program, or PPP loans, loans held for investment increased $80.5 million, or 4.7%, since December 31, 2021
Deposits decreased $28.3 million, or 1.0%, since December 31, 2021
(1)Represents a non-GAAP financial measure. See “Non-GAAP to GAAP Reconciliations and Calculation of Non-GAAP Financial Measures.”


Selected Financial Data (unaudited)

As of and for the

Three months ended

March 31, 

December 31, 

March 31, 

(dollars and shares in thousands, except per share data)


2022


2021


2021


Performance Ratios


Return on average total assets


1.26

%  


1.50

%  


2.02

%  

Return on average common equity


11.78

%  


14.12

%  


18.46

%  

Return on average tangible common equity (1)


14.72

%  


17.36

%  


23.03

%  

Noninterest income as a % of revenue


57.62

%  


59.67

%  


64.97

%  

Net interest margin (tax-equivalent)


2.83

%  


2.84

%  


3.12

%  

Efficiency ratio (1)


72.25

%  


71.06

%  


66.43

%  

Net charge-offs/(recoveries) to average loans

(0.03)

%  


(0.22)

%  


0.10

%  

Dividend payout ratio


28.07

%  


22.22

%  


17.44

%  

Per Common Share


Earnings per common share - basic

$

0.58

$

0.73

$

0.87

Earnings per common share - diluted

$

0.57

$

0.72

$

0.86

Dividends declared per common share

$

0.16

$

0.16

$

0.15

Book value per common share

$

19.00

$

20.88

$

19.15

Tangible book value per common share (1)

$

16.07

$

17.87

$

15.95

Average common shares outstanding - basic


17,244


17,210


17,145

Average common shares outstanding - diluted


17,500


17,480


17,465

Other Data


Retirement and benefit services assets under administration/management

$

35,333,131

$

36,732,938

$

34,774,650

Wealth management assets under administration/management

$

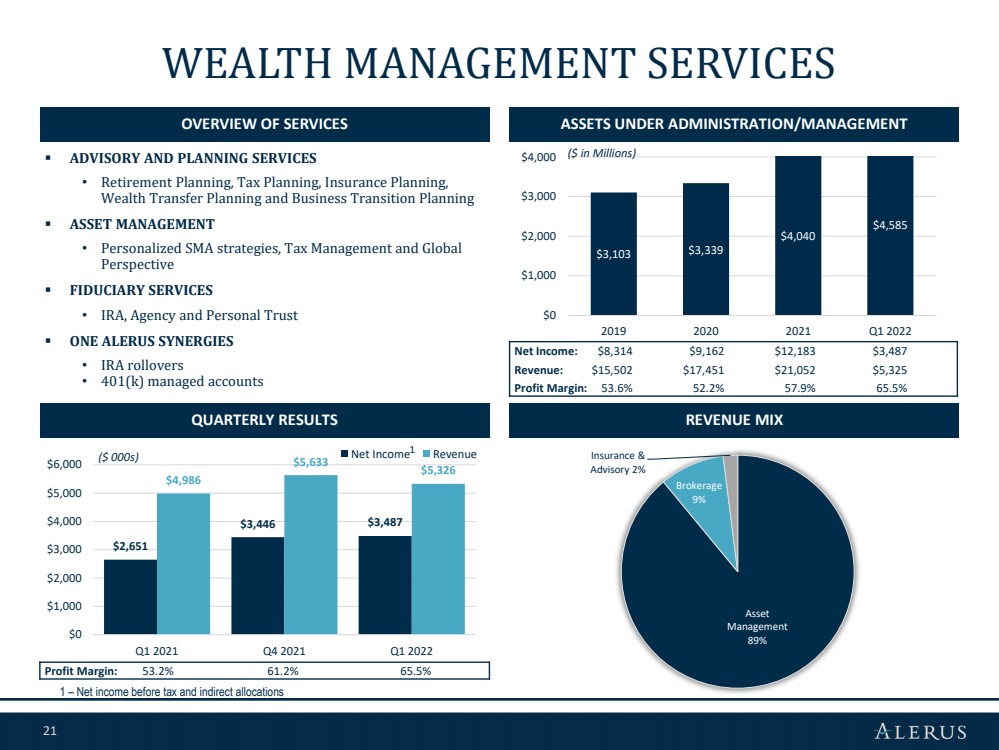
4,584,856

$

4,039,931

$

3,357,530

Mortgage originations

$

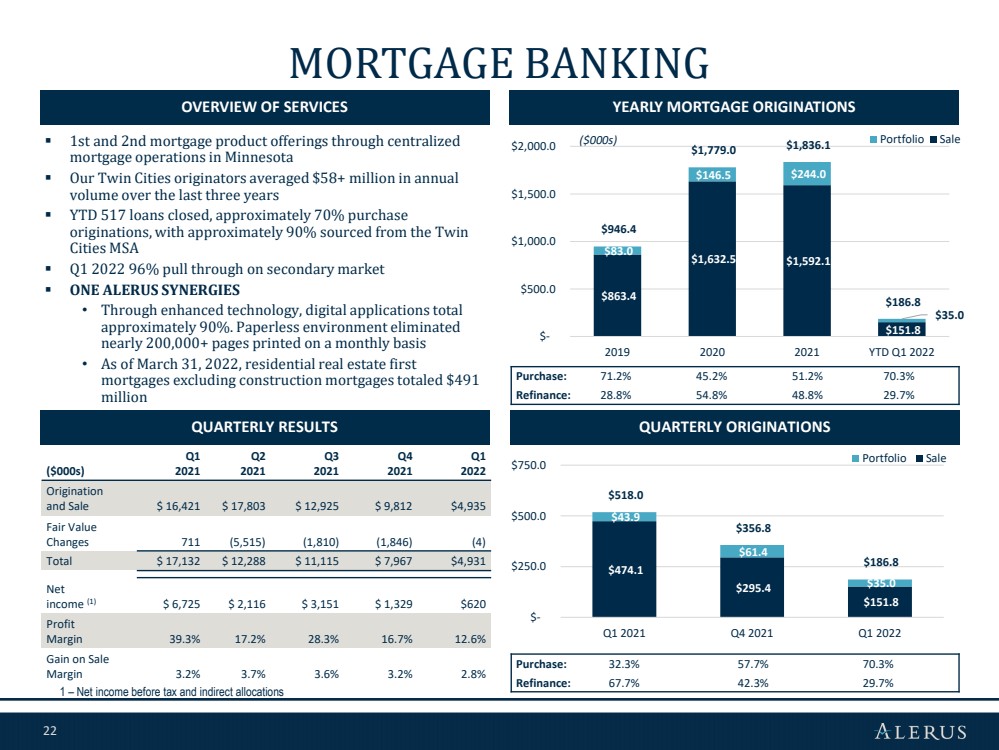
186,762

$

356,821

$

518,014

(1)Represents a non-GAAP financial measure. See “Non-GAAP to GAAP Reconciliations and Calculation of Non-GAAP Financial Measures.”

Results of Operations

Net Interest Income

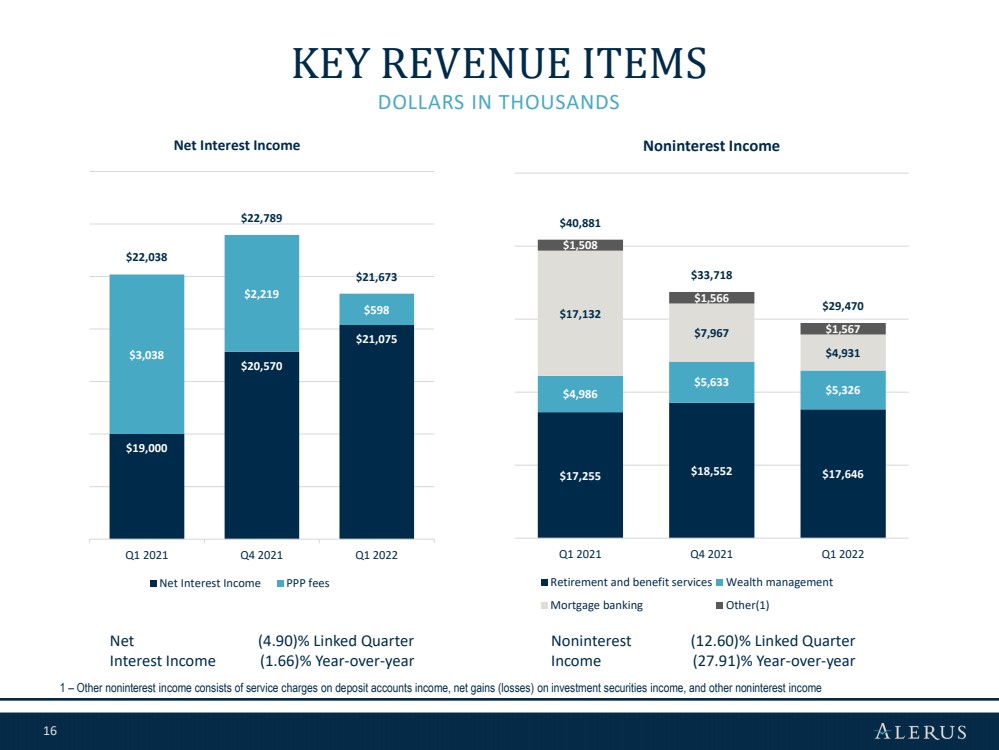
Net interest income for the first quarter of 2022 was $21.7 million, a $1.1 million, or 4.9%, decrease from the fourth quarter of 2021. Net interest income decreased $365 thousand, or 1.7%, from $22.0 million for the first quarter of 2021. The linked quarter decrease in net interest income was primarily driven by a $2.1 million decrease in interest income from loans, the largest component of which was a $1.6 million decrease in interest and loan fees recognized on PPP loans. This decrease was partially offset by a $971 thousand increase in interest income from investment securities. During the first quarter of 2022, average interest earning assets decreased $73.2 million, primarily due to decreases of $126.9 million in interest-bearing deposits with banks and $14.4 million in average loans. If PPP loans were excluded, average loans would have increased $29.7 million. Partially offsetting these decreases, was a $96.9 million increase in average investment securities as a result of a change in our balance sheet mix.

Net interest margin (tax-equivalent), a non-GAAP financial measure, was 2.83% for the first quarter of 2022, a modest 1 basis point decrease from 2.84% for the fourth quarter of 2021, and a 29 basis point decrease from 3.12% in the first quarter of 2021. If PPP loans were excluded, net interest margin was 2.77% for the first quarter of 2022, a 15 basis point increase from 2.62% for the fourth quarter of 2021, and a 12 basis point decrease from 2.89% in the first quarter of 2021.

Noninterest Income

Noninterest income for the first quarter of 2022 was $29.5 million, a $4.2 million, or 12.6%, decrease from the fourth quarter of 2021. The linked quarter decrease was primarily a result of decreases of $3.0 million in mortgage banking revenue, $906 thousand in retirement and benefit services revenue and $307 thousand in wealth management revenue. Mortgage banking revenue decreased primarily as a result of a $170.1 million decrease in mortgage originations. Retirement and benefit services revenue decreased primarily as a result of decreases of $533 thousand in non-asset based fees and $372 thousand in asset based fees. These decreases were primarily a result of a seasonal reduction of $255 thousand in ESOP fees, a $236 thousand decrease in plan document fees, and a $1.4 billion, or 3.8%, decrease in assets under administration/management. Wealth management revenue decreased primarily due to a $115 thousand decrease in fee revenue from dimension accounts.

Noninterest income for the first quarter of 2022 decreased $11.4 million, or 27.9%, from $40.9 million in the first quarter of 2021. The year over year decrease was primarily due to a $12.2 million decrease in mortgage banking revenue, a result of a $331.3

2


million, or 63.9%, decrease in mortgage originations. The decrease in mortgage originations also resulted in a gain on sale margin decrease of 37 basis points to 2.80% for the first quarter of 2022. This decrease was partially offset by increases of $391 thousand in retirement and benefit services revenue and $340 thousand in wealth management revenue. Retirement and benefit services revenue increased primarily due to a $588 thousand increase in non-asset based fees, partially offset by a $196 thousand decrease in asset based fees. Wealth management fees increased as a result of increases of $209 thousand in fee revenue earned from dimension accounts and $280 thousand in revenue earned from blueprint accounts.

Noninterest Expense

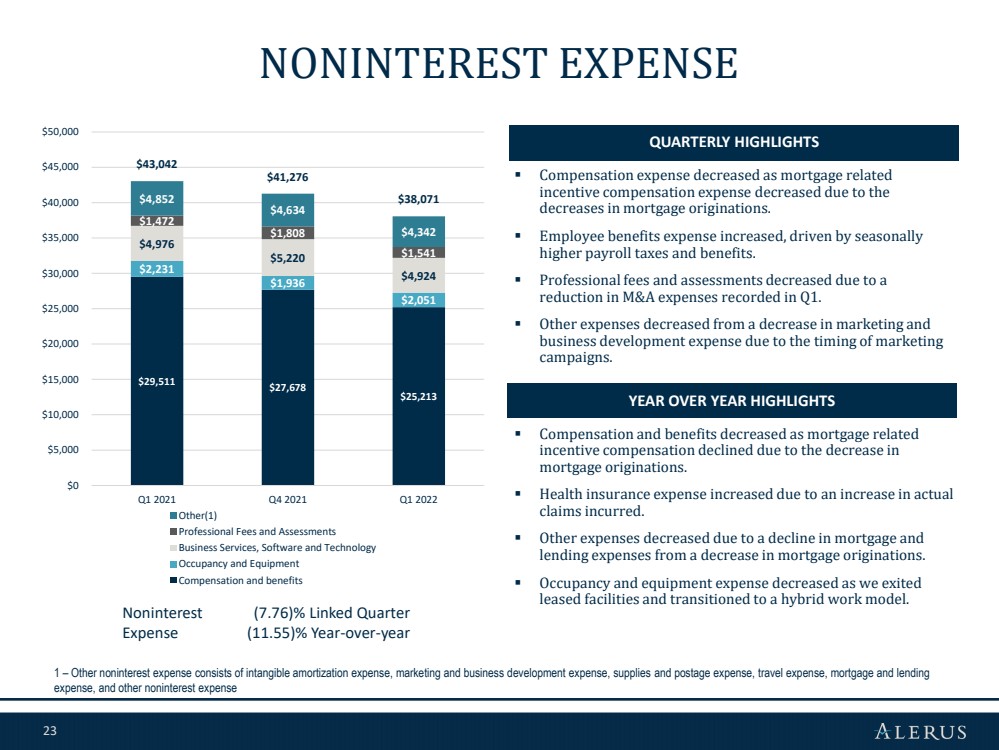
Noninterest expense for the first quarter of 2022 was $38.1 million, a decrease of $3.2 million, or 7.8%, compared to the fourth quarter of 2021. The decrease in noninterest expense was primarily driven by decreases of $3.0 million in compensation expense, $296 thousand in business services, software and technology expense, $272 thousand in marketing and business development expense, and $267 thousand in professional fees and assessments. The decrease in compensation expense was primarily due to a decrease in mortgage related compensation and incentives.

Noninterest expense for the first quarter of 2022 decreased $5.0 million, or 11.5%, from $43.0 million in the first quarter of 2021. The year over year decrease was primarily driven by decreases of $4.6 million in compensation expense and $646 thousand in mortgage and lending expenses. Partially offsetting these decreases were increases of $349 thousand in employee and benefits expense and $153 thousand in travel expenses. The decreases in compensation expense and mortgage and lending expenses were primarily due to the decrease in mortgage originations as previously stated. Employee taxes and benefits expense increased primarily due to an increase in group insurance.

Financial Condition

Total assets were $3.3 billion as of March 31, 2022, a decrease of $56.5 million, or 1.7%, from December 31, 2021. The overall change in assets included decreases of $109.5 million in cash and cash equivalents, $11.9 million in investment securities held-to-maturity, and $24.6 million in loans held for sale. Partially offsetting these decreases, was an increase in assets due to a $60.0 million increase in loans held for investment and a $12.7 million increase in investments available-for-sale. If PPP loans were excluded, loans held for investment would have increased $80.5 million, or 4.7%, from December 31, 2021.

Loans

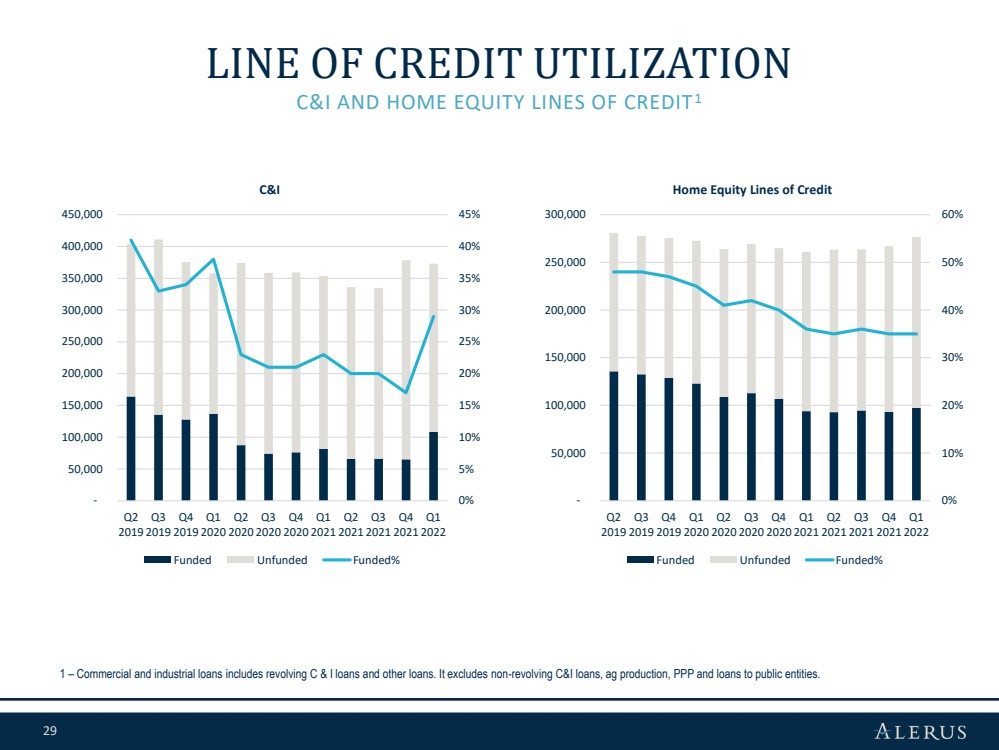
Total loans were $1.8 billion as of March 31, 2022, an increase of $60.0 million, or 3.4%, from December 31, 2021. This increase was primarily a result of increases of $30.7 million in commercial and industrial loans, $3.3 million in commercial real estate loans, and $25.1 million in consumer loans. If PPP loans were excluded, commercial and industrial loans increased $51.1 million, or 12.7%, from December 31, 2021, primarily as a result of increased credit line utilization.

3


The following table presents the composition of our loan portfolio as of the dates indicated:

March 31, 

December 31, 

September 30, 

June 30, 

March 31, 

(dollars in thousands)


2022

2021

2021

2021

2021

Commercial


Commercial and industrial (1)

$

467,449

$

436,761

$

506,599

$

572,734

$

678,029

Real estate construction


41,604


40,619


37,751


36,549


40,473

Commercial real estate


602,158


598,893


573,518


567,987


569,451

Total commercial


1,111,211


1,076,273


1,117,868


1,177,270


1,287,953

Consumer


Residential real estate first mortgage


522,489


510,716


501,339


470,822


454,958

Residential real estate junior lien


130,604


125,668


130,243


130,180


130,299

Other revolving and installment


53,738


45,363


50,936


57,040


64,135

Total consumer


706,831


681,747


682,518


658,042


649,392

Total loans

$

1,818,042

$

1,758,020

$

1,800,386

$

1,835,312

$

1,937,345


(1)Includes PPP loans of $13.1 million at March 31, 2022, $33.6 million at December 31, 2021, $103.5 million at September 30, 2021, $165.0 million at June 30, 2021 and $256.8 million at March 31, 2021.

Deposits

Total deposits were $2.9 billion as of March 31, 2022, a decrease of $28.3 million, or 1.0%, from December 31, 2021. Interest-bearing deposits increased $79.0 million, while noninterest-bearing deposits decreased $107.3 million in the first quarter of 2022. The increase in interest-bearing deposits included increases of $45.7 million in interest-bearing demand deposits, $39.6 million in money market accounts, and $2.5 million in savings accounts, partially offset by an $8.7 million decrease in time deposits. Synergistic deposits decreased $26.1 million from December 31, 2021. Excluding synergistic deposits, commercial transaction deposits decreased $16.7 million, or 1.3%, partially offset by a $21.7 million increase in consumer transaction deposits. Noninterest-bearing deposits as a percentage of total deposits was 28.8% as of March 31, 2022, compared to 32.1% as of December 31, 2021.

The following table presents the composition of our deposit portfolio as of the dates indicated:

March 31, 

December 31, 

September 30, 

June 30, 

March 31, 

(dollars in thousands)


2022


2021


2021


2021


2021

Noninterest-bearing demand

$

831,558

$

938,840

$

797,062

$

758,820

$

775,434

Interest-bearing


Interest-bearing demand


760,321


714,669


673,916


736,043


674,466

Savings accounts


99,299


96,825


92,632


89,437


87,492

Money market savings


976,905


937,305


924,678


920,831


967,273

Time deposits


224,184


232,912


224,800


205,809


212,908

Total interest-bearing


2,060,709


1,981,711


1,916,026


1,952,120


1,942,139

Total deposits

$

2,892,267

$

2,920,551

$

2,713,088

$

2,710,940

$

2,717,573

Asset Quality

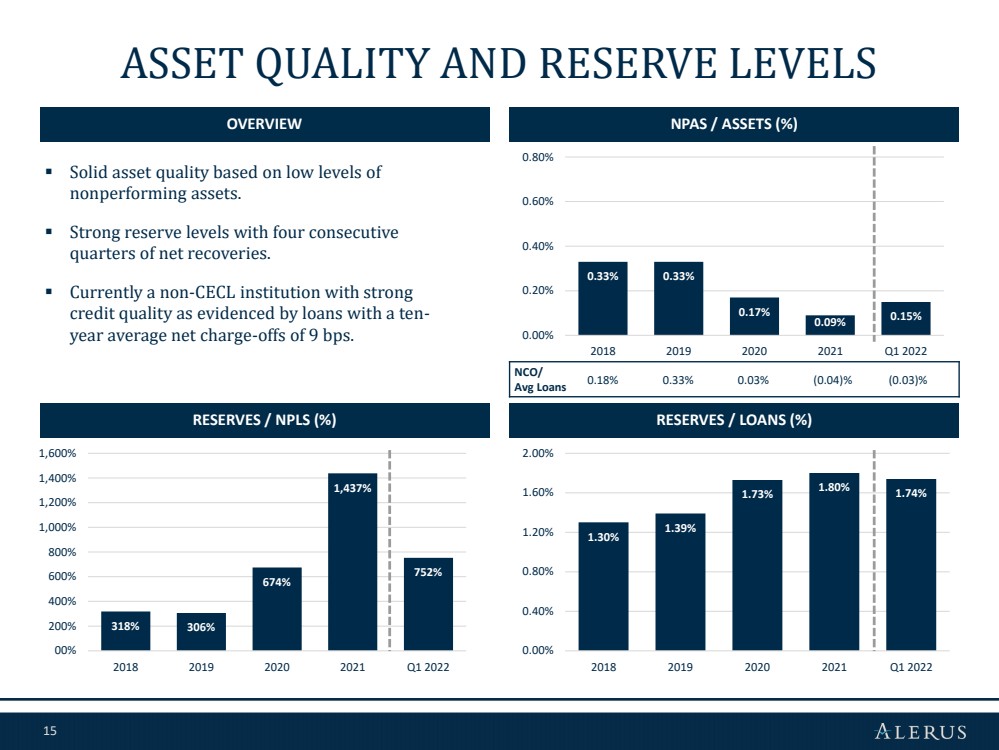
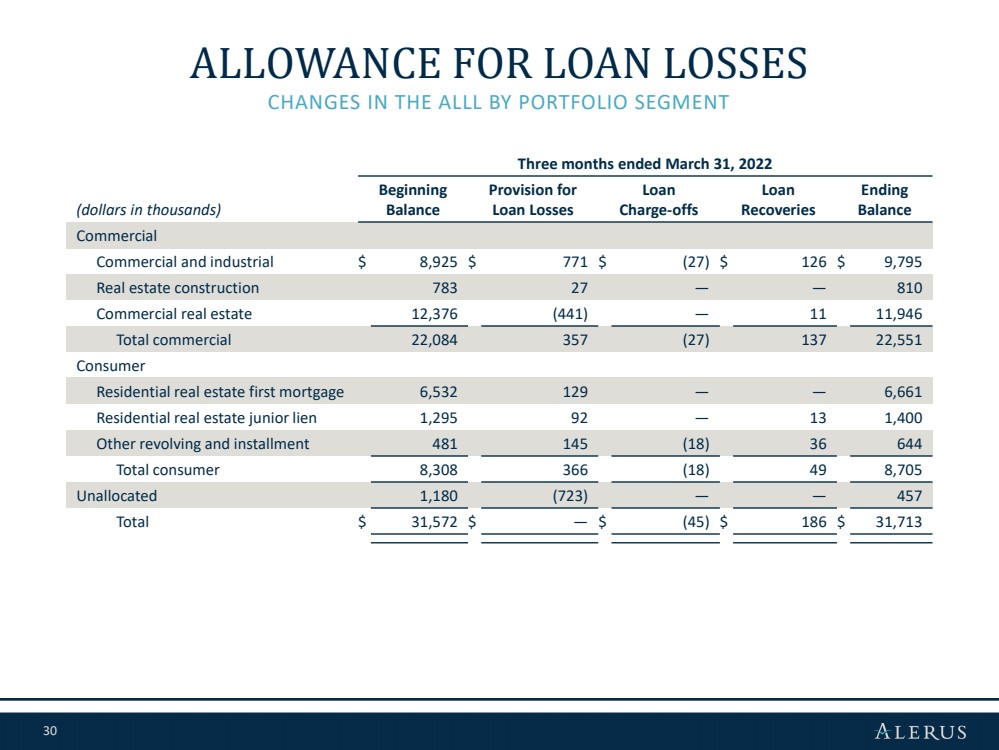
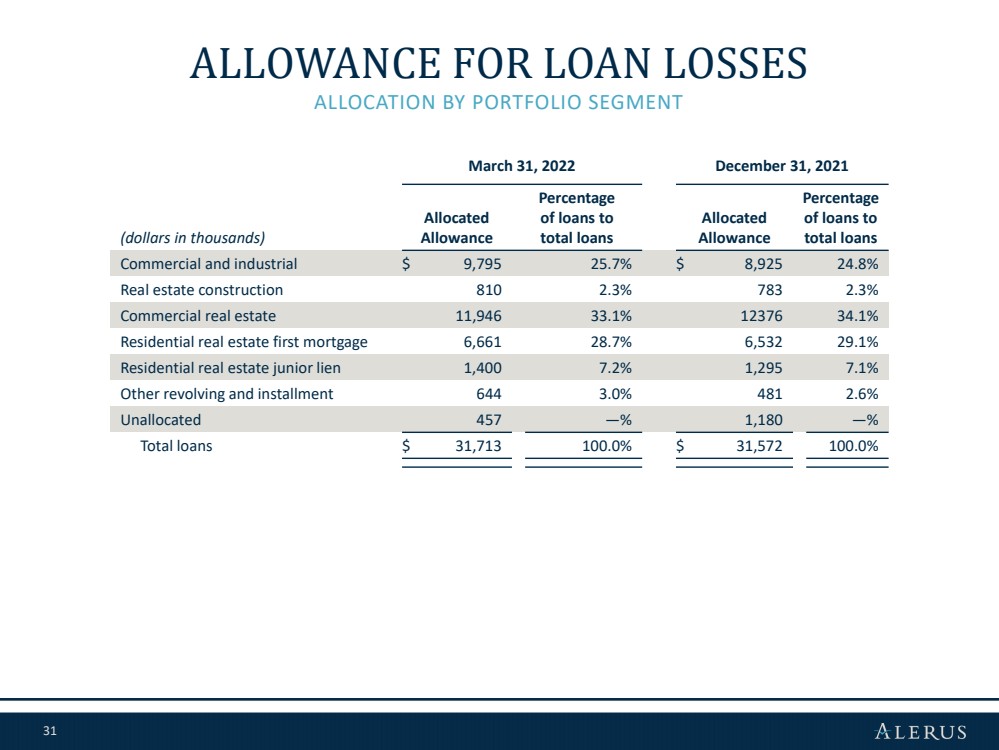
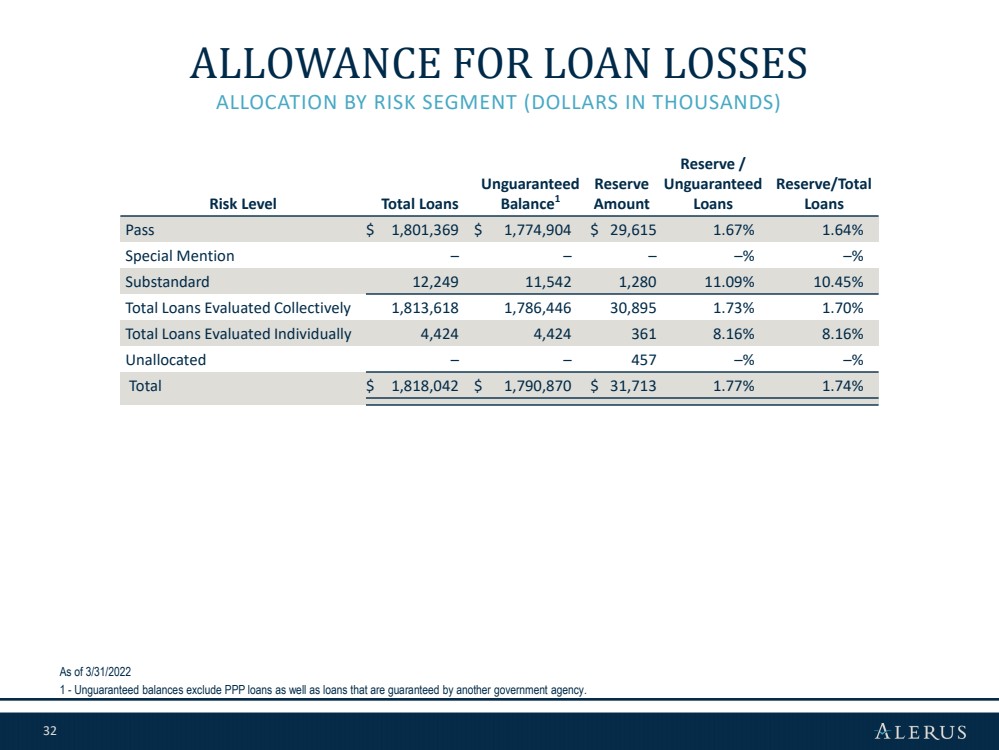
Total nonperforming assets were $5.1 million as of March 31, 2022, an increase of $2.0 million, or 64.8%, from December 31, 2021. As of March 31, 2022, the allowance for loan losses was $31.7 million, or 1.74% of total loans, compared to $31.6 million, or 1.80% of total loans, as of December 31, 2021. Excluding PPP loans, the ratio of allowance for loan losses to total loans was 1.76% at March 31, 2022, compared to 1.83% as of December 31, 2021.

4


The following table presents selected asset quality data as of and for the periods indicated:

As of and for the three months ended

March 31, 

December 31, 

September 30, 

June 30, 

March 31, 

(dollars in thousands)


2022


2021


2021


2021


2021


Nonaccrual loans

$

4,069

$

2,076

$

6,229

$

6,960

$

4,756

Accruing loans 90+ days past due


146


121


Total nonperforming loans


4,215


2,197


6,229


6,960


4,756

OREO and repossessed assets


865


885


862


858


139

Total nonperforming assets

$

5,080

$

3,082

$

7,091

$

7,818

$

4,895

Net charge-offs/(recoveries)

(141)

(1,006)

(302)

(6)

488

Net charge-offs/(recoveries) to average loans

(0.03)

%  

(0.22)

%  

(0.06)

%  

%  

0.10

%  

Nonperforming loans to total loans

0.23

%  

0.12

%  

0.35

%  

0.38

%  

0.25

%  

Nonperforming assets to total assets

0.15

%  

0.09

%  

0.22

%  

0.25

%  

0.16

%  

Allowance for loan losses to total loans

1.74

%  

1.80

%  

1.78

%  

1.84

%  

1.74

%  

Allowance for loan losses to nonperforming loans

752

%  

1,437

%  

515

%  

485

%  

710

%  

For the first quarter of 2022, we had net recoveries of $141 thousand compared to net recoveries of $1.0 million for the fourth quarter of 2021 and $488 thousand of net charge-offs for the first quarter of 2021.

There was no provision expense recorded for the first quarter of 2022, compared to a $1.5 million reversal of provision expense in the fourth quarter of 2021, and no provision expense in the first quarter of 2021. Management saw modest net recoveries in the first quarter of 2022 which supported the determination that no additional provision expense should be recognized.

Capital

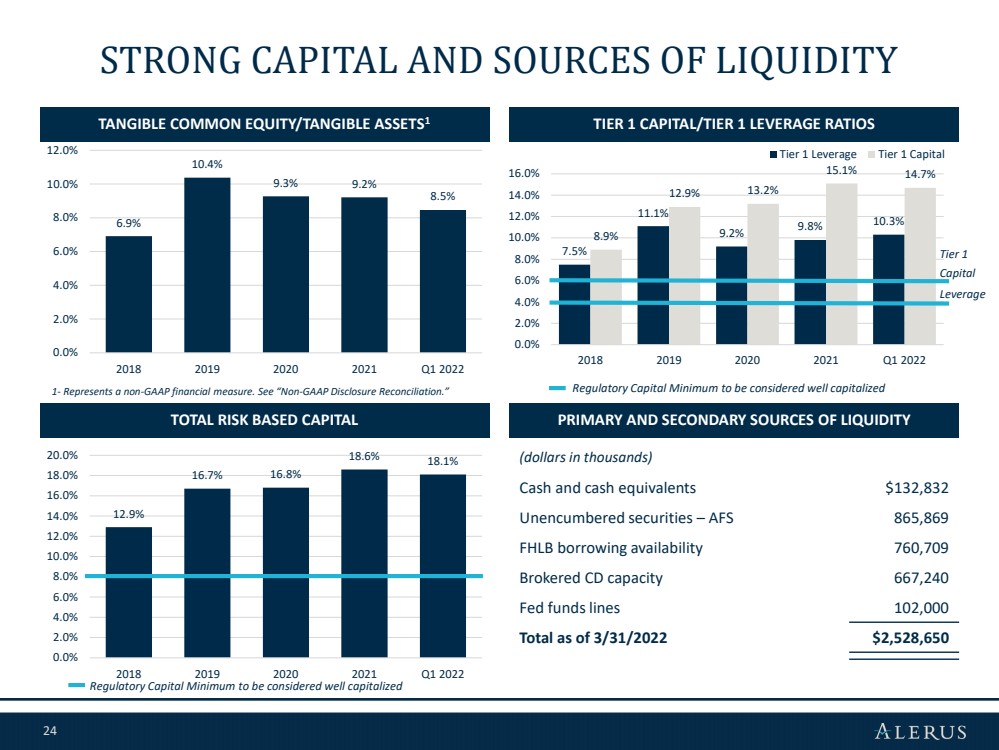
Total stockholders’ equity was $328.5 million as of March 31, 2022, a decrease of $30.9 million, or 8.6%, from December 31, 2021. The decrease in stockholders’ equity was primarily due to a $38.1 million decrease in other comprehensive income, a result of rising interest rates that resulted in a lower fair value on our investment securities available-for-sale. Management expects that we could see a continued decline in other comprehensive income if the Federal Reserve continues to raise interest rates. Tangible book value per common share, a non-GAAP financial measure, decreased to $16.07 as of March 31, 2022, from $17.87 as of December 31, 2021. Tangible common equity to tangible assets, a non-GAAP financial measure, decreased to 8.46% as of March 31, 2022, from 9.21% as of December 31, 2021.

The following table presents our capital ratios as of the dates indicated:


March 31, 


December 31, 


March 31, 


2022


2021


2021

Capital Ratios(1)

Alerus Financial Corporation Consolidated

Common equity tier 1 capital to risk weighted assets

14.27

%  

14.65

%  

13.48

%  

Tier 1 capital to risk weighted assets

14.66

%  

15.06

%  

13.88

%  

Total capital to risk weighted assets

18.12

%  

18.64

%  

17.54

%  

Tier 1 capital to average assets

10.30

%  

9.79

%  

9.59

%  

Tangible common equity / tangible assets (2)


8.46

%  


9.21

%  


8.86

%  

Alerus Financial, N.A.

Common equity tier 1 capital to risk weighted assets

13.52

%  

13.87

%  

12.80

%  

Tier 1 capital to risk weighted assets

13.52

%  

13.87

%  

12.80

%  

Total capital to risk weighted assets

14.77

%  

15.12

%  

14.06

%  

Tier 1 capital to average assets

9.50

%  

9.01

%  

8.85

%  

(1)Capital ratios for the current quarter are to be considered preliminary until the Call Report for Alerus Financial, N.A. is filed.
(2)Represents a non-GAAP financial measure. See “Non-GAAP to GAAP Reconciliations and Calculation of Non-GAAP Financial Measures.”

Metro Phoenix Bank Acquisition

On December 8, 2021, the Company announced the signing of a definitive agreement and plan of merger to acquire MPB BHC, Inc. (“MPHX”) (OTCPK: MPHX), the bank holding company for Metro Phoenix Bank, the largest full-service community bank headquartered in Phoenix. The proposed acquisition would be the Company’s twenty-fifth since 2000 and would significantly increase

5


the Alerus presence in Arizona. If the transaction is consummated, Alerus will have the fifth largest deposit market share in the Phoenix metropolitan statistical area (MSA) among community banks. On a pro forma basis, Alerus will operate three branch locations in Arizona (Phoenix, Scottsdale and Mesa). The combined company’s Arizona operation will have approximately $439 million in total loans and approximately $483 million in total deposits.

The agreement and plan merger was approved by the boards of directors of Alerus and MPHX. Completion of the merger is subject to customary closing conditions, including receipt of required regulatory approvals and the approval by the shareholders of MPHX at a special shareholders’ meeting, which is scheduled for April 29, 2022. The transaction has been subject to regulatory delays but is expected to close in the second quarter of 2022. Alerus currently intends to merge Metro Phoenix Bank into Alerus Financial, N.A. following the closing of the holding company merger.

Conference Call

The Company will host a conference call at 9:00 a.m. Central Time on Thursday, April 28, 2022, to discuss its financial results. The call can be accessed via telephone at (844) 200-6205, using access code 164479. A recording of the call and transcript will be available on the Company’s investor relations website at investors.alerus.com following the call.

About Alerus Financial Corporation

Alerus Financial Corporation is a diversified financial services company headquartered in Grand Forks, ND. Through its subsidiary, Alerus Financial, N.A., Alerus provides innovative and comprehensive financial solutions to business and consumer clients through four distinct business segments—banking, retirement and benefit services, wealth management, and mortgage. Alerus provides clients with a primary point of contact to help fully understand the unique needs and delivery channel preferences of each client. Clients are provided with competitive products, valuable insight and sound advice supported by digital solutions designed to meet the clients’ needs. Alerus Financial banking and wealth management offices are located in Grand Forks and Fargo, ND, the Minneapolis-St. Paul, MN metropolitan area, and Scottsdale and Mesa, AZ. Alerus Retirement and Benefits plan administration offices are located in St. Paul, MN, East Lansing, MI, and Littleton, CO.

Non-GAAP Financial Measures

Some of the financial measures included in this press release are not measures of financial performance recognized by U.S. Generally Accepted Accounting Principles, or GAAP. These non-GAAP financial measures include the ratio of tangible common equity to tangible assets, tangible common equity per share, return on average tangible common equity, net interest margin (tax-equivalent), and the efficiency ratio. Management uses these non-GAAP financial measures in its analysis of its performance, and believes financial analysts and investors frequently use these measures, and other similar measures, to evaluate capital adequacy and financial performance. Reconciliations of non-GAAP disclosures used in this press release to the comparable GAAP measures are provided in the accompanying tables. Management, banking regulators, many financial analysts and other investors use these measures in conjunction with more traditional bank capital ratios to compare the capital adequacy of banking organizations with significant amounts of goodwill or other intangible assets, which typically stem from the use of the purchase accounting method of accounting for mergers and acquisitions.

These non-GAAP financial measures should not be considered in isolation or as a substitute for total stockholders’ equity, total assets, book value per share, return on average assets, return on average equity, or any other measure calculated in accordance with GAAP. Moreover, the manner in which we calculate these non-GAAP financial measures may differ from that of other companies reporting measures with similar names.

Forward-Looking Statements

This press release contains “forward-looking statements” within the meaning of the safe harbor provisions of the U.S. Private Securities Litigation Reform Act of 1995. Forward-looking statements include, without limitation, statements concerning plans, estimates, calculations, forecasts and projections with respect to the anticipated future performance of Alerus Financial Corporation. These statements are often, but not always, identified by words such as “may”, “might”, “should”, “could”, “predict”, “potential”, “believe”, “expect”, “continue”, “will”, “anticipate”, “seek”, “estimate”, “intend”, “plan”, “projection”, “would”, “annualized”, “target” and “outlook”, or the negative version of those words or other comparable words of a future or forward-looking nature. Examples of forward-looking statements include, among others, statements we make regarding our projected growth, anticipated future financial performance, financial condition, credit quality, management’s long-term performance goals and the future plans and prospects of Alerus Financial Corporation.

6


Forward-looking statements are neither historical facts nor assurances of future performance. Instead, they are based only on our current beliefs, expectations and assumptions regarding the future of our business, future plans and strategies, projections, anticipated events and trends, the economy and other future conditions. Because forward-looking statements relate to the future, they are subject to inherent uncertainties, risks and changes in circumstances that are difficult to predict and many of which are outside of our control. Our actual results and financial condition may differ materially from those indicated in the forward-looking statements. Therefore, you should not rely on any of these forward-looking statements. Important factors that could cause our actual results and financial condition to differ materially from those indicated in the forward-looking statements include, among others, the following: the negative effects of the ongoing COVID-19 pandemic, including its effects on the economic environment, our clients, and our operations, including due to supply chain disruptions, as well as any changes to federal, state, or local government laws, regulations, or orders in response to the pandemic; our ability to successfully manage credit risk and maintain an adequate level of allowance for loan losses; new or revised accounting standards, including as a result of the implementation of the new Current Expected Credit Loss Standard; business and economic conditions generally and in the financial services industry, nationally and within our market areas, including rising rates of inflation; the overall health of the local and national real estate market; concentrations within our loan portfolio; the level of nonperforming assets on our balance sheet; our ability to implement our organic and acquisition growth strategies; the impact of economic or market conditions on our fee-based services; our ability to continue to grow our retirement and benefit services business; our ability to continue to originate a sufficient volume of residential mortgages; the occurrence of fraudulent activity, breaches or failures of our information security controls or cybersecurity-related incidents; interruptions involving our information technology and telecommunications systems or third-party servicers; potential losses incurred in connection with mortgage loan repurchases; the composition of our executive management team and our ability to attract and retain key personnel; rapid technological change in the financial services industry; increased competition in the financial services industry from non-banks such as credit unions and other Fintech companies; our ability to successfully manage liquidity risk, especially in light of recent excess liquidity at the Bank; the effectiveness of our risk management framework; the commencement and outcome of litigation and other legal proceedings and regulatory actions against us or to which we may become subject; potential impairment to the goodwill we recorded in connection with our past acquisitions; the extensive regulatory framework that applies to us; the impact of recent and future legislative and regulatory changes; interest rate risks associated with our business, including the effects of anticipated rate increases by the Federal Reserve; fluctuations in the values of the securities held in our securities portfolio; governmental monetary, trade and fiscal policies; severe weather, natural disasters, widespread disease or pandemics, such as the COVID-19 global pandemic, acts of war or terrorism, including the Russian invasion of Ukraine, or other adverse external events; any material weaknesses in our internal control over financial reporting; developments and uncertainty related to the future use and availability of some reference rates, such as the London Interbank Offered Rate, as well as other alternative rates; changes to U.S. or state tax laws, regulations and guidance, including recent proposals to increase the federal corporate tax rate; talent and labor shortages and employee turnover; possible federal mask and vaccine mandates; our success at managing the risks involved in the foregoing items; and any other risks described in the “Risk Factors” sections of the reports filed by Alerus Financial Corporation with the Securities and Exchange Commission.

Any forward-looking statement made by us in this press release is based only on information currently available to us and speaks only as of the date on which it is made. We undertake no obligation to publicly update any forward-looking statement, whether written or oral, that may be made from time to time, whether as a result of new information, future developments or otherwise.

7


Alerus Financial Corporation and Subsidiaries

Consolidated Balance Sheets

(dollars in thousands, except share and per share data)


March 31, 


December 31, 


2022


2021

Assets


(Unaudited)


(Audited)

Cash and cash equivalents

$

132,832

$

242,311

Investment securities


Available-for-sale, at fair value


866,333


853,649

Held-to-maturity, at carrying value


340,150


352,061

Loans held for sale


21,864


46,490

Loans


1,818,042


1,758,020

Allowance for loan losses


(31,713)


(31,572)

Net loans


1,786,329


1,726,448

Land, premises and equipment, net


17,619


18,370

Operating lease right-of-use assets


3,360


3,727

Accrued interest receivable


8,516


8,537

Bank-owned life insurance


33,358


33,156

Goodwill


31,490


31,490

Other intangible assets


19,197


20,250

Servicing rights


1,771


1,880

Deferred income taxes, net


23,517


11,614

Other assets


49,863


42,708

Total assets

$

3,336,199

$

3,392,691

Liabilities and Stockholders’ Equity


Deposits


Noninterest-bearing

$

831,558

$

938,840

Interest-bearing


2,060,709


1,981,711

Total deposits


2,892,267


2,920,551

Long-term debt


58,902


58,933

Operating lease liabilities


3,850


4,275

Accrued expenses and other liabilities


52,675


49,529

Total liabilities


3,007,694


3,033,288

Stockholders’ equity


Preferred stock, $1 par value, 2,000,000 shares authorized: 0 issued and outstanding

Common stock, $1 par value, 30,000,000 shares authorized: 17,288,575 and 17,212,588 issued and outstanding


17,289


17,213

Additional paid-in capital


92,573


92,878

Retained earnings


260,967


253,567

Accumulated other comprehensive income (loss)


(42,324)


(4,255)

Total stockholders’ equity


328,505


359,403

Total liabilities and stockholders’ equity

$

3,336,199

$

3,392,691

8


Alerus Financial Corporation and Subsidiaries

Consolidated Statements of Income

(dollars and shares in thousands, except per share data)

Three months ended

March 31, 

December 31, 

March 31, 


2022


2021


2021

Interest Income

(Unaudited)

(Unaudited)

(Unaudited)

Loans, including fees

$

17,292

$

19,354

$

20,567

Investment securities


Taxable


5,440


4,454


2,401

Exempt from federal income taxes


216


231


236

Other


116


166


117

Total interest income


23,064


24,205


23,321

Interest Expense


Deposits


829


880


995

Long-term debt


562


536


288

Total interest expense


1,391


1,416


1,283

Net interest income


21,673


22,789


22,038

Provision for loan losses


(1,500)


Net interest income after provision for loan losses


21,673


24,289


22,038

Noninterest Income


Retirement and benefit services


17,646


18,552


17,255

Wealth management


5,326


5,633


4,986

Mortgage banking


4,931


7,967


17,132

Service charges on deposit accounts


363


370


338

Net gains (losses) on investment securities


114

Other


1,204


1,196


1,056

Total noninterest income


29,470


33,718


40,881

Noninterest Expense


Compensation


19,051


22,088


23,698

Employee taxes and benefits


6,162


5,590


5,813

Occupancy and equipment expense


2,051


1,936


2,231

Business services, software and technology expense


4,924


5,220


4,976

Intangible amortization expense


1,053


1,053


1,151

Professional fees and assessments


1,541


1,808


1,472

Marketing and business development


600


872


676

Supplies and postage


646


778


531

Travel


179


206


26

Mortgage and lending expenses


686


488


1,332

Other


1,178


1,237


1,136

Total noninterest expense


38,071


41,276


43,042

Income before income taxes


13,072


16,731


19,877

Income tax expense


2,888


4,026


4,662

Net income

$

10,184

$

12,705

$

15,215

Per Common Share Data

Earnings per common share

$

0.58

$

0.73

$

0.87

Diluted earnings per common share

$

0.57

$

0.72

$

0.86

Dividends declared per common share

$

0.16

$

0.16

$

0.15

Average common shares outstanding


17,244


17,210


17,145

Diluted average common shares outstanding


17,500


17,480


17,465

9


Alerus Financial Corporation and Subsidiaries

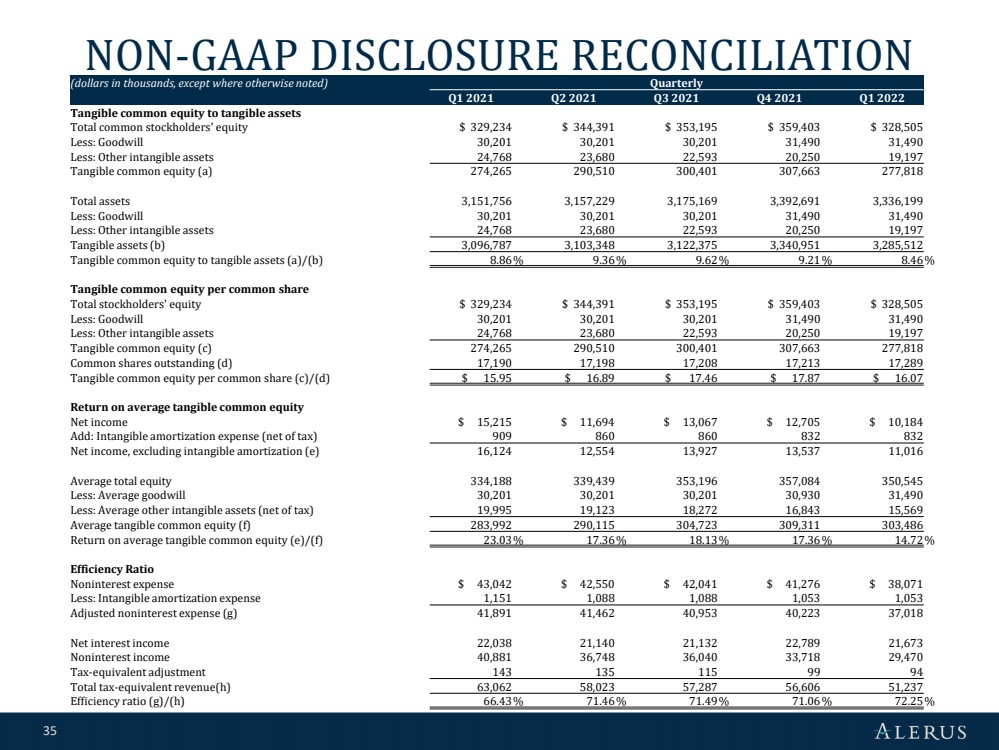
Non-GAAP to GAAP Reconciliations and Calculation of Non-GAAP Financial Measures (unaudited)

(dollars and shares in thousands, except per share data)


March 31, 

December 31, 

March 31, 


2022


2021


2021

Tangible Common Equity to Tangible Assets


Total common stockholders’ equity

$

328,505

$

359,403

$

329,234

Less: Goodwill


31,490


31,490


30,201

Less: Other intangible assets


19,197


20,250


24,768

Tangible common equity (a)


277,818


307,663


274,265

Total assets


3,336,199


3,392,691


3,151,756

Less: Goodwill


31,490


31,490


30,201

Less: Other intangible assets


19,197


20,250


24,768

Tangible assets (b)


3,285,512


3,340,951


3,096,787

Tangible common equity to tangible assets (a)/(b)


8.46

%  


9.21

%  


8.86

%  

Tangible Book Value Per Common Share

Total common stockholders’ equity

$

328,505

$

359,403

$

329,234

Less: Goodwill


31,490


31,490

30,201

Less: Other intangible assets


19,197


20,250


24,768

Tangible common equity (c)


277,818


307,663


274,265

Total common shares issued and outstanding (d)


17,289


17,213


17,190

Tangible book value per common share (c)/(d)

$

16.07

$

17.87

$

15.95

Three months ended

March 31, 

December 31, 

March 31, 

2022


2021


2021

Return on Average Tangible Common Equity

Net income

$

10,184

$

12,705

$

15,215

Add: Intangible amortization expense (net of tax)


832


832


909

Net income, excluding intangible amortization (e)


11,016


13,537


16,124

Average total equity


350,545


357,084


334,188

Less: Average goodwill


31,490


30,930


30,201

Less: Average other intangible assets (net of tax)


15,569


16,843


19,995

Average tangible common equity (f)


303,486


309,311


283,992

Return on average tangible common equity (e)/(f)


14.72

%  


17.36

%  


23.03

%  

Efficiency Ratio


Noninterest expense

$

38,071

$

41,276

$

43,042

Less: Intangible amortization expense


1,053


1,053


1,151

Adjusted noninterest expense (g)


37,018


40,223


41,891

Net interest income


21,673


22,789


22,038

Noninterest income


29,470


33,718


40,881

Tax-equivalent adjustment


94


99


143

Total tax-equivalent revenue (h)


51,237


56,606


63,062

Efficiency ratio (g)/(h)


72.25

%  


71.06

%  


66.43

%  

10


Alerus Financial Corporation and Subsidiaries

Analysis of Average Balances, Yields, and Rates (unaudited)

(dollars in thousands)

Three months ended

March 31, 2022

December 31, 2021

March 31, 2021

Average

Average

Average

Average

Yield/

Average

Yield/

Average

Yield/


Balance


Rate


Balance


Rate


Balance


Rate

Interest Earning Assets

Interest-bearing deposits with banks

$

105,726

0.18

%  

$

232,650

0.16

%

$

184,376


0.12

%

Investment securities (1)


1,216,256

1.90

%  


1,119,370

1.68

%


662,413


1.65

%

Loans held for sale


24,656

2.57

%  


53,357

2.33

%


82,249


2.13

%

Loans


Commercial:


Commercial and industrial


434,656

4.68

%  


471,262

5.61

%


674,935


4.72

%

Real estate construction


41,139

3.89

%  


41,573

3.89

%


45,264


4.22

%

Commercial real estate


601,024

3.64

%  


587,542

3.90

%


560,986


3.79

%

Total commercial


1,076,819

4.07

%  


1,100,377

4.63

%


1,281,185


4.30

%

Consumer


Residential real estate first mortgage


514,724

3.49

%  


504,997

3.30

%


457,882


3.76

%

Residential real estate junior lien


125,997

4.45

%  


129,238

4.52

%


137,745


4.86

%

Other revolving and installment


50,686

4.38

%  


48,045

4.53

%


68,625


4.38

%

Total consumer


691,407

3.73

%  


682,280

3.62

%


664,252


4.05

%

Total loans (1)


1,768,226

3.94

%  


1,782,657

4.25

%


1,945,437


4.21

%

Federal Reserve/FHLB stock


6,486

4.38

%  


6,496

4.34

%


5,780


4.49

%

Total interest earning assets


3,121,350

3.01

%  


3,194,530

3.02

%


2,880,255


3.30

%

Noninterest earning assets

165,459

159,370

167,006

Total assets

$

3,286,809


$

3,353,900


$

3,047,261


Interest-Bearing Liabilities


Interest-bearing demand deposits

$

714,472

0.12

%  

$

754,432

0.13

%

$

642,832


0.16

%

Money market and savings deposits


1,043,430

0.14

%  


1,039,492

0.14

%


1,030,348


0.16

%

Time deposits


227,485

0.44

%  


225,497

0.46

%


210,719


0.66

%

Fed funds purchased


%  


%


%

Long-term debt


58,908

3.87

%  


58,938

3.61

%


25,677


4.55

%

Total interest-bearing liabilities


2,044,295

0.28

%  


2,078,359

0.27

%


1,909,576


0.27

%

Noninterest-Bearing Liabilities and Stockholders' Equity

Noninterest-bearing deposits


831,441


851,210


731,680


Other noninterest-bearing liabilities

60,528

67,247

71,817

Stockholders’ equity


350,545


357,084


334,188


Total liabilities and stockholders’ equity

$

3,286,809


$

3,353,900


$

3,047,261


Net interest rate spread


2.73

%  


2.75

%


3.03

%

Net interest margin, tax-equivalent (1)


2.83

%  


2.84

%


3.12

%


(1)Taxable-equivalent adjustment was calculated utilizing a marginal income tax rate of 21.0%.

11

Exhibit 99.2

GRAPHIC

INVESTOR PRESENTATION APRIL 2022 Alerus

GRAPHIC

1 Forward - Looking Statements This presentation contains “forward - looking statements” within the meaning of the safe harbor provisions of the U .. S .. Private Securities Litigation Reform Act of 1995 .. Forward - looking statements include, without limitation, statements concerning plans, estimates, calculations, forecasts and projections with respect to the anticipated future performance of Alerus Financial Corporation .. These statements are often, but not always, identified by words such as “may”, “might”, “should”, “could”, “predict”, “potential”, “believe”, “expect”, “continue”, “will”, “anticipate”, “seek”, “estimate”, “intend”, “plan”, “projection”, “would”, “annualized”, “target” and “outlook”, or the negative version of those words or other comparable words of a future or forward - looking nature .. Examples of forward - looking statements include, among others, statements we make regarding our projected growth, anticipated future financial performance, financial condition, credit quality, management’s long - term performance goals and the future plans and prospects of Alerus Financial Corporation .. Forward - looking statements are neither historical facts nor assurances of future performance .. Instead, they are based only on our current beliefs, expectations and assumptions regarding the future of our business, future plans and strategies, projections, anticipated events and trends, the economy and other future conditions .. Because forward - looking statements relate to the future, they are subject to inherent uncertainties, risks and changes in circumstances that are difficult to predict and many of which are outside of our control .. Our actual results and financial condition may differ materially from those indicated in the forward - looking statements .. Therefore, you should not rely on any of these forward - looking statements .. Important factors that could cause our actual results and financial condition to differ materially from those indicated in the forward - looking statements include, among others, the following : the negative effects of the ongoing COVID - 19 pandemic, including its effects on the economic environment, our clients and our operations including due to supply chain disruptions, as well as any changes to federal, state or local government laws, regulations or orders in connection with the pandemic ; our ability to successfully manage credit risk and maintain an adequate level of allowance for loan losses ; new or revised accounting standards, including as a result of the future implementation of the new Current Expected Credit Loss Standard ; business and economic conditions generally and in the financial services industry, nationally and within our market areas , including rising rates of inflation ; the overall health of the local and national real estate market ; concentrations within our loan portfolio ; the level of nonperforming assets on our balance sheet ; our ability to implement our organic and acquisition growth strategies ; the impact of economic or market conditions on our fee - based services ; our ability to continue to grow our retirement and benefit services business ; our ability to continue to originate a sufficient volume of residential mortgages ; the occurrence of fraudulent activity, breaches or failures of our information security controls or cybersecurity related incidents ; interruptions involving our information technology and telecommunications systems or third - party servicers ; potential losses incurred in connection with mortgage loan repurchases ; the composition of our executive management team and our ability to attract and retain key personnel ; rapid technological change in the financial services industry ; increased competition in the financial services industry , from non - banks such as credit unions and other Fintech companies ; our ability to successfully manage liquidity risk , especially in light of recent excess liquidity at the Bank ; the effectiveness of our risk management framework ; the commencement and outcome of litigation and other legal proceedings and regulatory actions against us or to which we may become subject ; potential impairment to the goodwill we recorded in connection with our past acquisitions ; the extensive regulatory framework that applies to us ; the impact of recent and future legislative and regulatory changes ; interest rate risks associated with our business , including the effects of anticipated rate increases by the Federal Reserve ; fluctuations in the values of the securities held in our securities portfolio ; governmental monetary, trade and fiscal policies ; severe weather, natural disasters, widespread disease or pandemics, such as the COVID - 19 global pandemic, acts of war or terrorism , including the Russian invasion of Ukraine, or other adverse external events ; any material weaknesses in our internal control over financial reporting ; developments and uncertainty related to the future use and availability of some reference rates, such as the London Interbank Offered Rate, as well as other alternative rates ; changes to U .. S .. or state tax laws, regulations and guidance, including recent proposals to increase the federal corporate tax rate ; the impact of inflation and anticipated interest rate increases ; talent and labor shortages and employee turnover ; possible federal mask and vaccine mandates ; our success at managing the risks involved in the foregoing items ; and any other risks described in the “Risk Factors” sections of the reports filed by Alerus Financial Corporation with the Securities and Exchange Commission .. Any forward - looking statement made by us in this presentation is based only on information currently available to us and speaks only as of the date on which it is made .. We undertake no obligation to publicly update any forward - looking statement, whether written or oral, that may be made from time to time, whether as a result of new information, future developments or otherwise .. Non - GAAP Financial Measures This presentation includes certain ratios and amounts that do not conform to U .. S .. Generally Accepted Accounting Principles, or GAAP .. Management uses certain non - GAAP financial measures to evaluate financial performance and business trends from period to period and believes that disclosure of these non - GAAP financial measures will help investors, rating agencies and analysts evaluate the financial performance and condition of Alerus Financial Corporation .. This presentation includes a reconciliation of each non - GAAP financial measure to the most comparable GAAP equivalent .. Miscellaneous Except as otherwise indicated, this presentation speaks as of the date hereof .. The delivery of this presentation shall not, under any circumstances, create any implication that there has been no change in the affairs of Alerus Financial Corporation after the date hereof .. Certain of the information contained herein may be derived from information provided by industry sources .. We believe that such information is accurate and that the sources from which it has been obtained are reliable .. We cannot guarantee the accuracy of such information, however, and we have not independently verified such information .. DISCLAIMERS

GRAPHIC

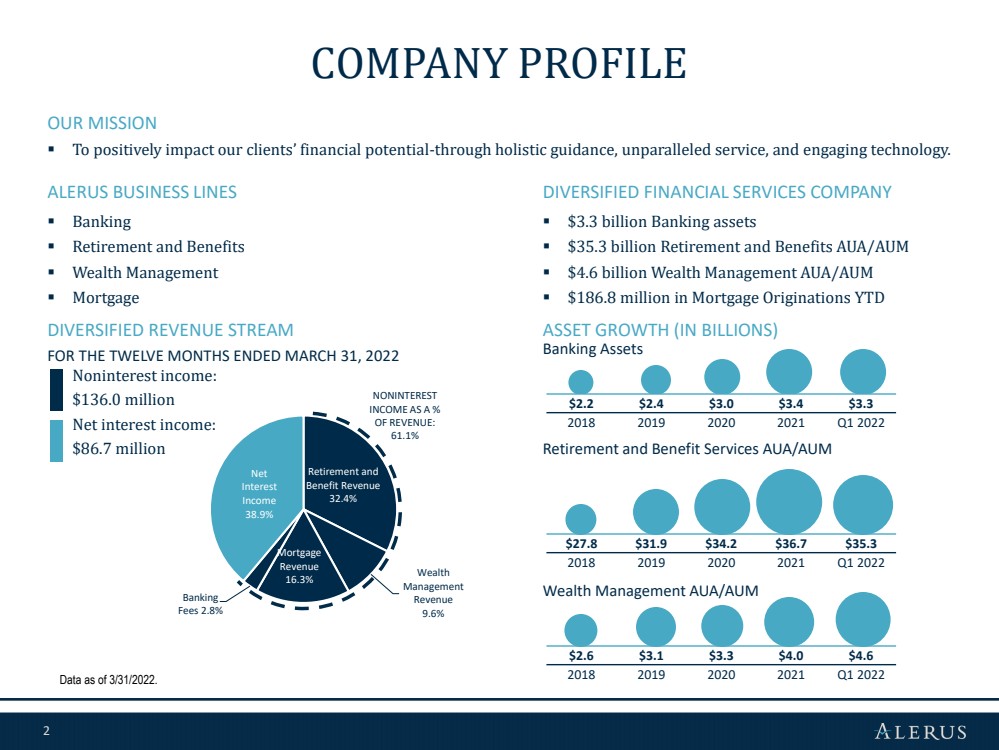
2 Retirement and Benefit Revenue 32.4% Wealth Management Revenue 9.6% Mortgage Revenue 16.3% Banking Fees 2.8% Net Interest Income 38.9% FOR THE TWELVE MONTHS ENDED MARCH 31, 2022 Noninterest income: $136.0 million Net interest income: $86.7 million $27.8 $31.9 $34.2 $36.7 $35.3 2018 2019 2020 2021 Q1 2022 OUR MISSION ▪ To positively impact our clients’ financial potential - through holistic guidance, unparalleled service, and engaging technology. COMPANY PROFILE Data as of 3/31/2022. DIVERSIFIED REVENUE STREAM ASSET GROWTH (IN BILLIONS) Banking Assets Retirement and Benefit Services AUA/AUM Wealth Management AUA/AUM $2.6 $3.1 $3.3 $4.0 $4.6 2018 2019 2020 2021 Q1 2022 NONINTEREST INCOME AS A % OF REVENUE: 61.1% DIVERSIFIED FINANCIAL SERVICES COMPANY ▪ $3.3 billion Banking assets ▪ $35.3 billion Retirement and Benefits AUA/AUM ▪ $4.6 billion Wealth Management AUA/AUM ▪ $186.8 million in Mortgage Originations YTD ALERUS BUSINESS LINES ▪ Banking ▪ Retirement and Benefits ▪ Wealth Management ▪ Mortgage $2.2 $2.4 $3.0 $3.4 $3.3 2018 2019 2020 2021 Q1 2022

GRAPHIC

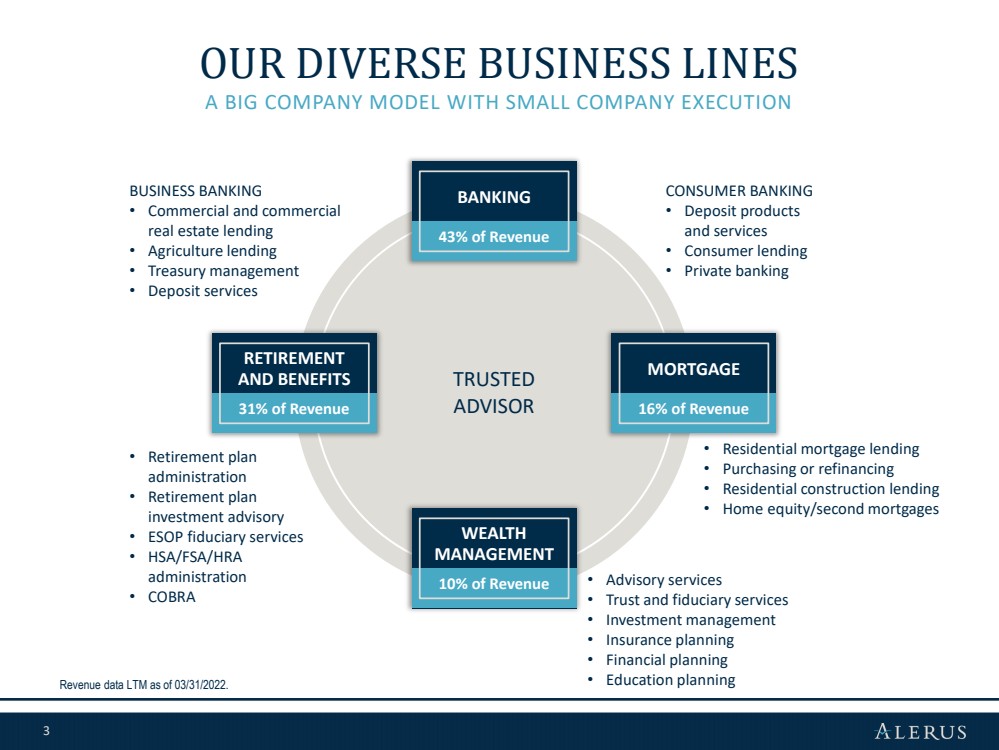
3 A BIG COMPANY MODEL WITH SMALL COMPANY EXECUTION OUR DIVERSE BUSINESS LINES Revenue data LTM as of 03/31/2022. TRUSTED ADVISOR BANKING WEALTH MANAGEMENT • Residential mortgage lending • Purchasing or refinancing • Residential construction lending • Home equity/second mortgages • Advisory services • Trust and fiduciary services • Investment management • Insurance planning • Financial planning • Education planning • Retirement plan administration • Retirement plan investment advisory • ESOP fiduciary services • HSA/FSA/HRA administration • COBRA BUSINESS BANKING • Commercial and commercial real estate lending • Agriculture lending • Treasury management • Deposit services CONSUMER BANKING • Deposit products and services • Consumer lending • Private banking MORTGAGE RETIREMENT AND BENEFITS 31% of Revenue 16% of Revenue 10% of Revenue 43% of Revenue

GRAPHIC

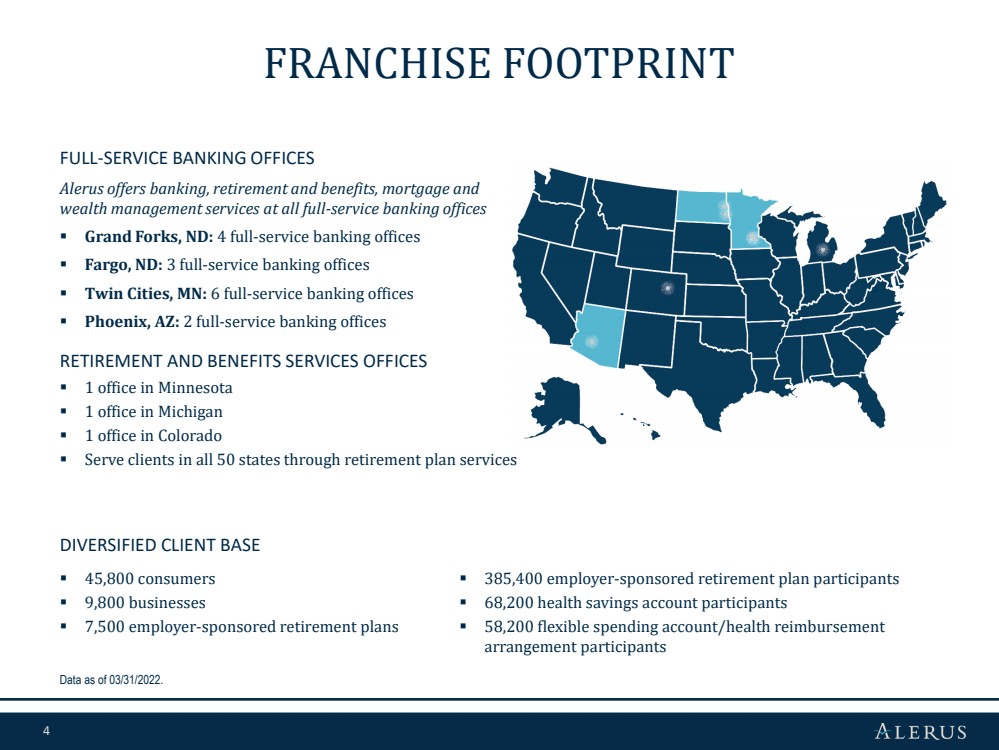
4 FRANCHISE FOOTPRINT FULL - SERVICE BANKING OFFICES Alerus offers banking, retirement and benefits, mortgage and wealth management services at all full - service banking offices ▪ Grand Forks, ND: 4 full - service banking offices ▪ Fargo, ND: 3 full - service banking offices ▪ Twin Cities, MN: 6 full - service banking offices ▪ Phoenix, AZ: 2 full - service banking offices RETIREMENT AND BENEFITS SERVICES OFFICES ▪ 1 office in Minnesota ▪ 1 office in Michigan ▪ 1 office in Colorado ▪ Serve clients in all 50 states through retirement plan services DIVERSIFIED CLIENT BASE ▪ 45,800 consumers ▪ 9,800 businesses ▪ 7,500 employer - sponsored retirement plans Data as of 03/31/2022. ▪ 385,400 employer - sponsored retirement plan participants ▪ 68,200 health savings account participants ▪ 58,200 flexible spending account/health reimbursement arrangement participants

GRAPHIC

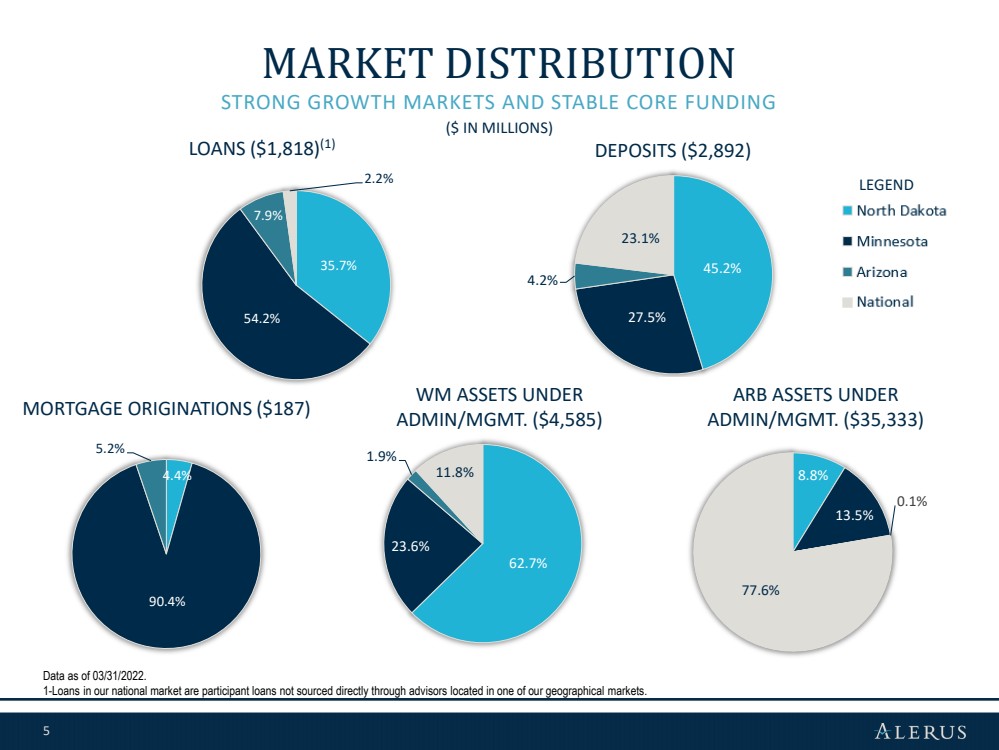
5 4.4% 90.4% 5.2% 45.2% 27.5% 4.2% 23.1% 35.7% 54.2% 7.9% 2.2% STRONG GROWTH MARKETS AND STABLE CORE FUNDING MARKET DISTRIBUTION DEPOSITS ($2,892) LOANS ($ 1,818 ) (1) ARB ASSETS UNDER ADMIN/MGMT. ($35,333) WM ASSETS UNDER ADMIN/MGMT. ($ 4,585 ) MORTGAGE ORIGINATIONS ($187) ($ IN MILLIONS) Data as of 03/31/2022. 1 - Loans in our national market are participant loans not sourced directly through advisors located in one of our geographical m a rkets. LEGEND 8.8% 13.5% 0.1% 77.6% 62.7% 23.6% 1.9% 11.8%

GRAPHIC

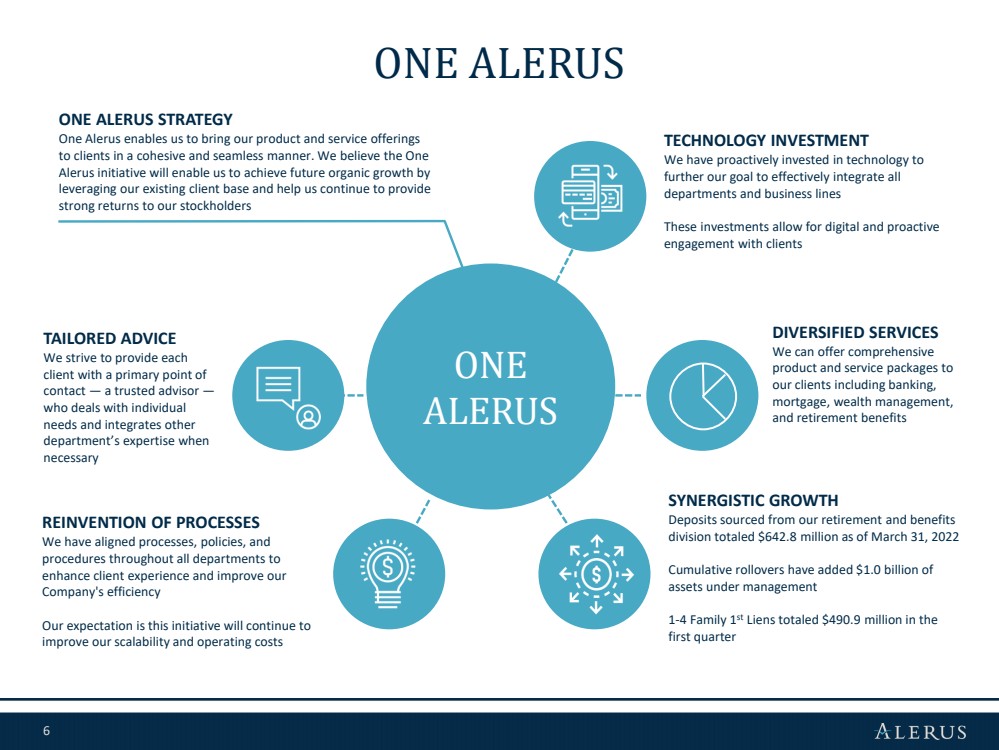
6 ONE ALERUS REINVENTION OF PROCESSES We have aligned processes, policies, and procedures throughout all departments to enhance client experience and improve our Company's efficiency Our expectation is this initiative will continue to improve our scalability and operating costs TAILORED ADVICE We strive to provide each client with a primary point of contact — a trusted advisor — who deals with individual needs and integrates other department’s expertise when necessary SYNERGISTIC GROWTH Deposits sourced from our retirement and benefits division totaled $642.8 million as of March 31, 2022 Cumulative rollovers have added $1.0 billion of assets under management 1 - 4 Family 1 st Liens totaled $490.9 million in the first quarter TECHNOLOGY INVESTMENT We have proactively invested in technology to further our goal to effectively integrate all departments and business lines These investments allow for digital and proactive engagement with clients DIVERSIFIED SERVICES We can offer comprehensive product and service packages to our clients including banking, mortgage, wealth management, and retirement benefits ONE ALERUS STRATEGY One Alerus enables us to bring our product and service offerings to clients in a cohesive and seamless manner. We believe the One Alerus initiative will enable us to achieve future organic growth by leveraging our existing client base and help us continue to provide strong returns to our stockholders ONE ALERUS

GRAPHIC

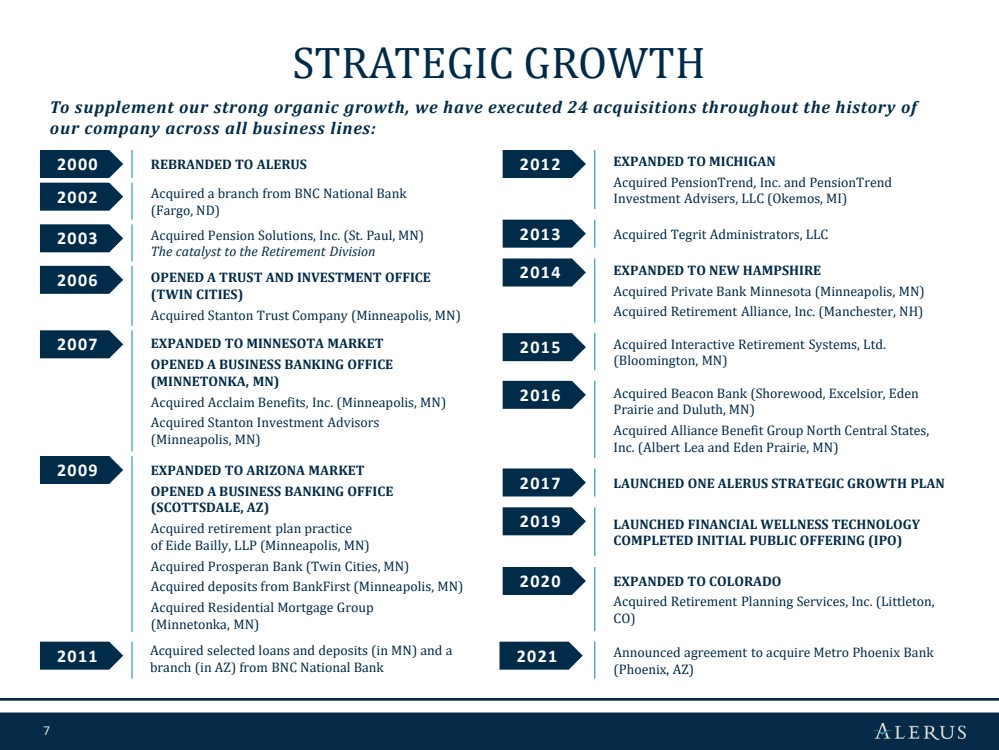
7 EXPANDED TO COLORADO Acquired Retirement Planning Services, Inc. (Littleton, CO) To supplement our strong organic growth, we have executed 24 acquisitions throughout the history of our company across all business lines: STRATEGIC GROWTH 2000 2002 2003 2006 2007 2019 2009 2016 2015 2014 2013 2012 2011 REBRANDED TO ALERUS Acquired a branch from BNC National Bank (Fargo, ND) Acquired Pension Solutions, Inc. (St. Paul, MN) The catalyst to the Retirement Division OPENED A TRUST AND INVESTMENT OFFICE (TWIN CITIES) Acquired Stanton Trust Company (Minneapolis, MN) EXPANDED TO MINNESOTA MARKET OPENED A BUSINESS BANKING OFFICE (MINNETONKA, MN) Acquired Acclaim Benefits, Inc. (Minneapolis, MN) Acquired Stanton Investment Advisors (Minneapolis, MN) EXPANDED TO ARIZONA MARKET OPENED A BUSINESS BANKING OFFICE (SCOTTSDALE, AZ) Acquired retirement plan practice of Eide Bailly, LLP (Minneapolis, MN) Acquired Prosperan Bank (Twin Cities, MN) Acquired deposits from BankFirst (Minneapolis, MN) Acquired Residential Mortgage Group (Minnetonka, MN) Acquired selected loans and deposits (in MN) and a branch (in AZ) from BN C National Bank EXPANDED TO MICHIGAN Acquired PensionTrend, Inc. and PensionTrend Investment Advisers, LLC (Okemos, MI) Acquired Tegrit Administrators, LLC EXPANDED TO NEW HAMPSHIRE Acquired Private Bank Minnesota (Minneapolis, MN) Acquired Retirement Alliance, Inc. (Manchester, NH) Acquired Interactive Retirement Systems, Ltd. (Bloomington, MN) Acquired Beacon Bank (Shorewood, Excelsior, Eden Prairie and Duluth, MN) Acquired Alliance Benefit Group North Central States, Inc. (Albert Lea and Eden Prairie, MN) LAUNCHED FINANCIAL WELLNESS TECHNOLOGY COMPLETED INITIAL PUBLIC OFFERING (IPO) 2017 LAUNCHED ONE ALERUS STRATEGIC GROWTH PLAN 2020 2021 Announced agreement to acquire Metro Phoenix Bank (Phoenix, AZ)

GRAPHIC

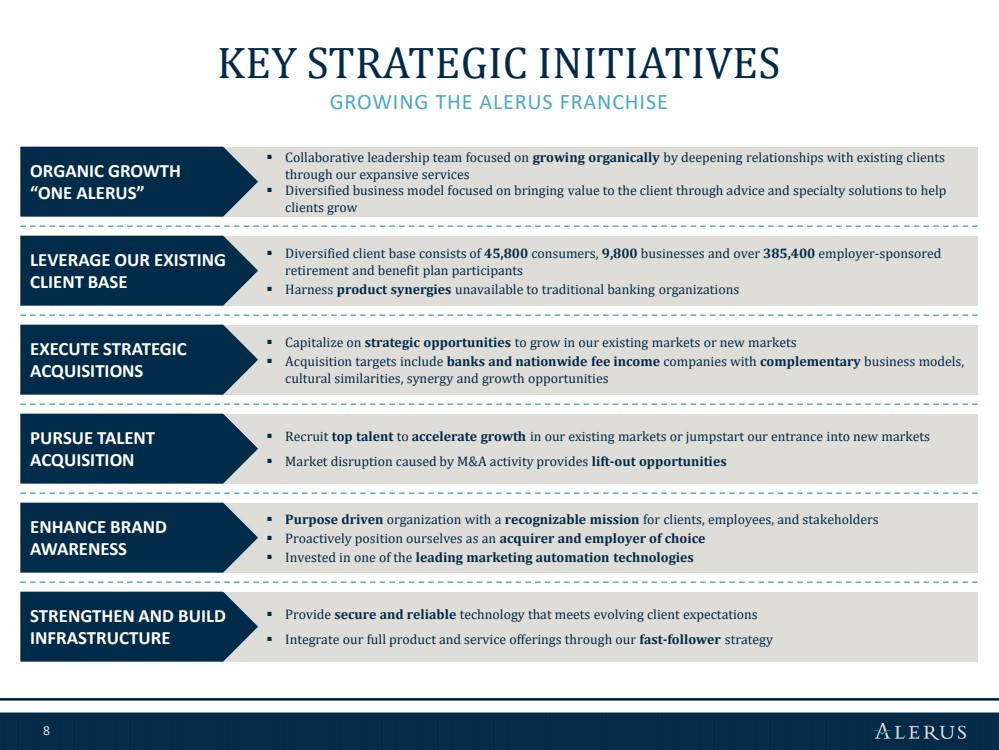
8 ▪ Diversified client base consists of 45,800 consumers, 9,800 businesses and over 385,400 employer - sponsored retirement and benefit plan participants ▪ Harness product synergies unavailable to traditional banking organizations ▪ Capitalize on strategic opportunities to grow in our existing markets or new markets ▪ Acquisition targets include banks and nationwide fee income companies with complementary business models, cultural similarities, synergy and growth opportunities ▪ Recruit top talent to accelerate growth in our existing markets or jumpstart our entrance into new markets ▪ Market disruption caused by M&A activity provides lift - out opportunities ▪ Purpose driven organization with a recognizable mission for clients, employees, and stakeholders ▪ Proactively position ourselves as an acquirer and employer of choice ▪ Invested in one of the leading marketing automation technologies ▪ Provide secure and reliable technology that meets evolving client expectations ▪ Integrate our full product and service offerings through our fast - follower strategy KEY STRATEGIC INITIATIVES GROWING THE ALERUS FRANCHISE LEVERAGE OUR EXISTING CLIENT BASE EXECUTE STRATEGIC ACQUISITIONS PURSUE TALENT ACQUISITION ENHANCE BRAND AWARENESS STRENGTHEN AND BUILD INFRASTRUCTURE ▪ Collaborative leadership team focused on growing organically by deepening relationships with existing clients through our expansive services ▪ Diversified business model focused on bringing value to the client through advice and specialty solutions to help clients grow ORGANIC GROWTH “ONE ALERUS”

GRAPHIC

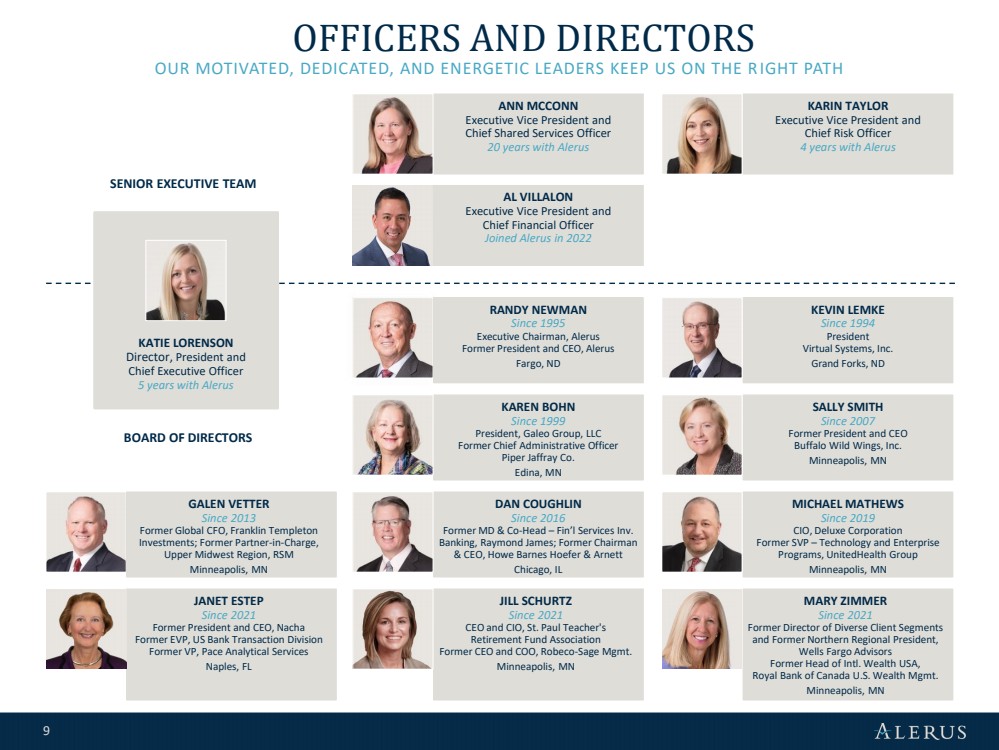
9 OFFICERS AND DIRECTORS OUR MOTIVATED, DEDICATED, AND ENERGETIC LEADERS KEEP US ON THE R IGHT PATH DAN COUGHLIN Since 2016 Former MD & Co - Head – Fin’l Services Inv. Banking, Raymond James; Former Chairman & CEO, Howe Barnes Hoefer & Arnett Chicago, IL MICHAEL MATHEWS Since 2019 CIO, Deluxe Corporation Former SVP – Technology and Enterprise Programs, UnitedHealth Group Minneapolis, MN ANN MCCONN Executive Vice President and Chief Shared Services Officer 20 years with Alerus KARIN TAYLOR Executive Vice President and Chief Risk Officer 4 years with Alerus KEVIN LEMKE Since 1994 President Virtual Systems, Inc. Grand Forks, ND KAREN BOHN Since 1999 President, Galeo Group, LLC Former Chief Administrative Officer Piper Jaffray Co. Edina, MN SALLY SMITH Since 2007 Former President and CEO Buffalo Wild Wings, Inc. Minneapolis, MN GALEN VETTER Since 2013 Former Global CFO, Franklin Templeton Investments; Former Partner - in - Charge, Upper Midwest Region, RSM Minneapolis, MN JILL SCHURTZ Since 2021 CEO and CIO, St. Paul Teacher's Retirement Fund Association Former CEO and COO, Robeco - Sage Mgmt. Minneapolis, MN MARY ZIMMER Since 2021 Former Director of Diverse Client Segments and Former Northern Regional President, Wells Fargo Advisors Former Head of Intl. Wealth USA, Royal Bank of Canada U.S. Wealth Mgmt. Minneapolis, MN SENIOR EXECUTIVE TEAM BOARD OF DIRECTORS JANET ESTEP Since 2021 Former President and CEO, Nacha Former EVP, US Bank Transaction Division Former VP, Pace Analytical Services Naples, FL RANDY NEWMAN Since 1995 Executive Chairman, Alerus Former President and CEO, Alerus Fargo, ND KATIE LORENSON Director, President and Chief Executive Officer 5 years with Alerus AL VILLALON Executive Vice President and Chief Financial Officer Joined Alerus in 2022

GRAPHIC

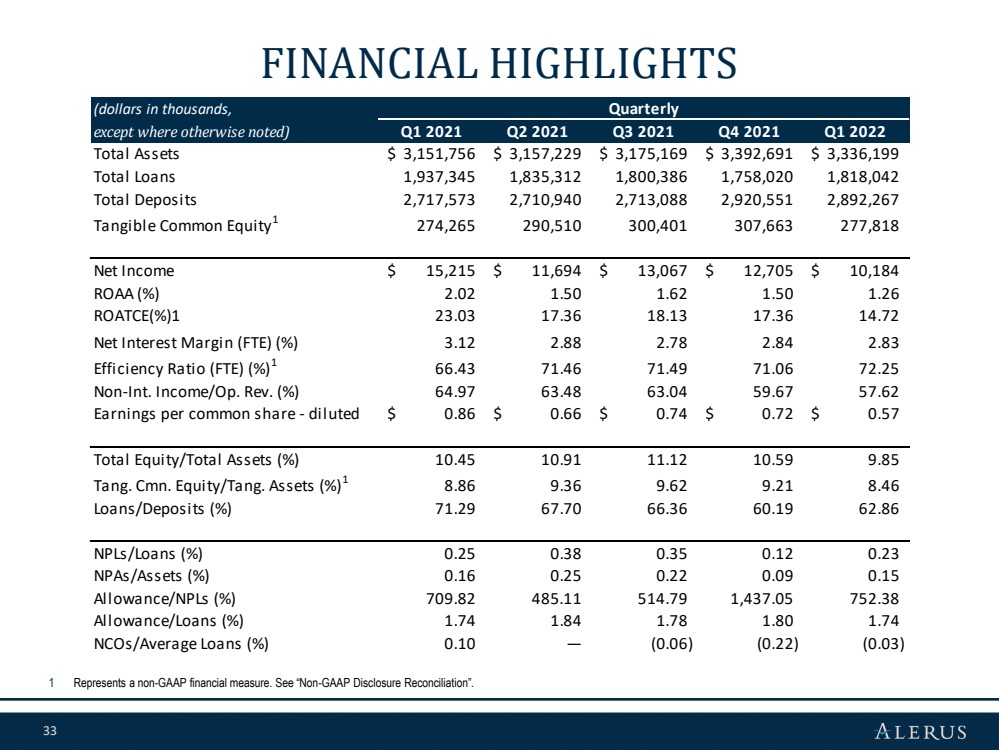
10 FIRST QUARTER HIGHLIGHTS

GRAPHIC

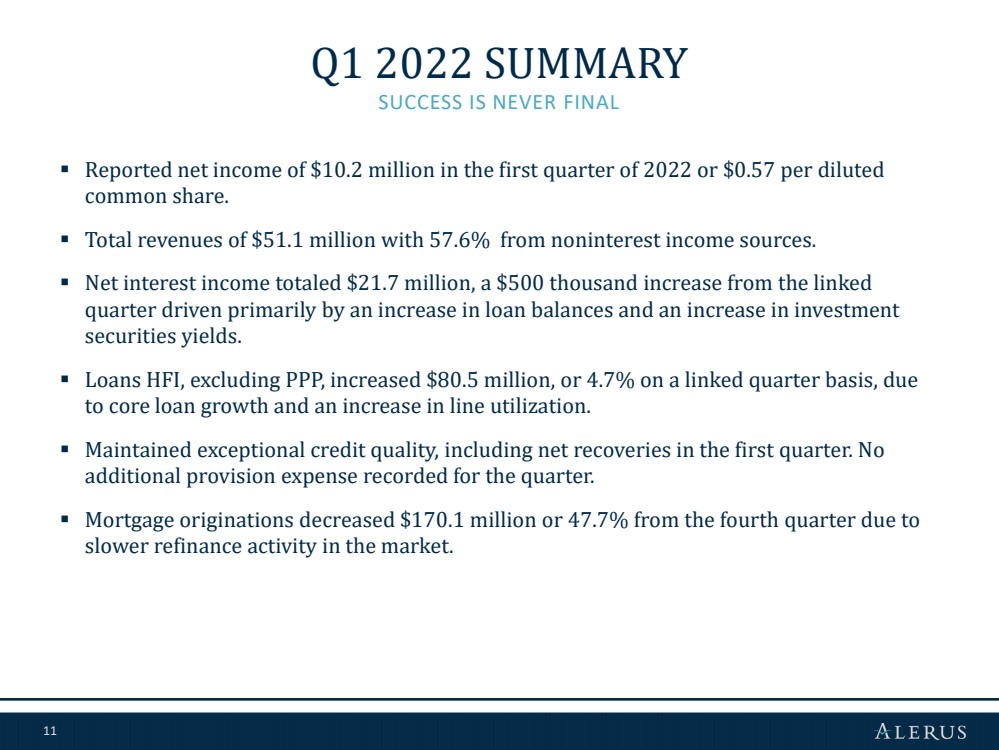
11 ▪ Reported net income of $10.2 million in the first quarter of 2022 or $0.57 per diluted common share. ▪ Total revenues of $51.1 million with 57.6% from noninterest income sources. ▪ Net interest income totaled $21.7 million, a $500 thousand increase from the linked quarter driven primarily by an increase in loan balances and an increase in investment securities yields. ▪ Loans HFI, excluding PPP, increased $80.5 million, or 4.7% on a linked quarter basis, due to core loan growth and an increase in line utilization. ▪ Maintained exceptional credit quality, including net recoveries in the first quarter. No additional provision expense recorded for the quarter. ▪ Mortgage originations decreased $170.1 million or 47.7% from the fourth quarter due to slower refinance activity in the market. SUCCESS IS NEVER FINAL Q1 2022 SUMMARY

GRAPHIC

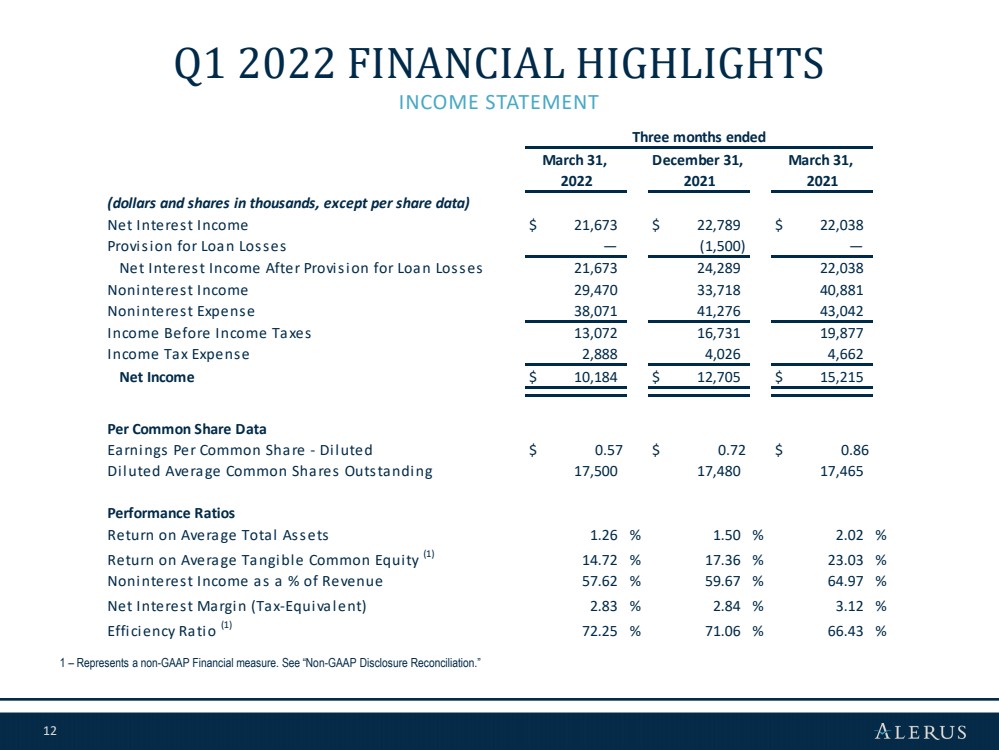
12 INCOME STATEMENT Q1 2022 FINANCIAL HIGHLIGHTS 1 – Represents a non - GAAP Financial measure. See “Non - GAAP Disclosure Reconciliation.” (dollars and shares in thousands, except per share data) Net Interest Income $ 21,673 $ 22,789 $ 22,038 Provision for Loan Losses — (1,500) — Net Interest Income After Provision for Loan Losses 21,673 24,289 22,038 Noninterest Income 29,470 33,718 40,881 Noninterest Expense 38,071 41,276 43,042 Income Before Income Taxes 13,072 16,731 19,877 Income Tax Expense 2,888 4,026 4,662 Net Income $ 10,184 $ 12,705 $ 15,215 Per Common Share Data Earnings Per Common Share - Diluted $ 0.57 $ 0.72 $ 0.86 Diluted Average Common Shares Outstanding 17,500 17,480 17,465 Performance Ratios Return on Average Total Assets 1.26 % 1.50 % 2.02 % Return on Average Tangible Common Equity (1) 14.72 % 17.36 % 23.03 % Noninterest Income as a % of Revenue 57.62 % 59.67 % 64.97 % Net Interest Margin (Tax-Equivalent) 2.83 % 2.84 % 3.12 % Efficiency Ratio (1) 72.25 % 71.06 % 66.43 % Three months ended 2022 March 31, December 31, 2021 March 31, 2021

GRAPHIC

13 PERFORMANCE RATIOS 1 – Represents a non - GAAP Financial measure. See “Non - GAAP Disclosure Reconciliation.” 2 – Rates have been annualized 2.02% 1.50% 1.26% Q1 2021 Q4 2021 Q1 2022 Return on Average Assets (2) 23.03% 17.36% 14.72% Q1 2021 Q4 2021 Q1 2022 Return on Average Tangible Common Equity (1)/(2) $15.95 $17.87 $16.07 Q1 2021 Q4 2021 Q1 2022 Tangible Book Value per Share (1)

GRAPHIC

14 KEY BALANCE SHEET ITEMS DOLLARS IN MILLIONS $1,693.8 $1,718.5 $1,748.1 $251.6 $64.2 $20.1 $1,945.4 $1,782.7 $1,768.2 Q1 2021 Q4 2021 Q1 2022 Average Loans Core Loans PPP Loans $1,883.9 $2,019.4 $1,985.4 $731.7 $851.2 $831.4 $2,615.6 $2,870.6 $2,816.8 Q1 2021 Q4 2021 Q1 2022 Average Deposits Interest-Bearing Deposits Non-Interest Bearing Deposits Core 1.72% Linked Quarter Loans 3.21% Year - over - year Average (1.87)% Linked Quarter Deposits 7.69% Year - over - year

GRAPHIC

15 1.30% 1.39% 1.73% 1.80% 1.74% 0.00% 0.40% 0.80% 1.20% 1.60% 2.00% 2018 2019 2020 2021 Q1 2022 0.33% 0.33% 0.17% 0.09% 0.15% 0.00% 0.20% 0.40% 0.60% 0.80% 2018 2019 2020 2021 Q1 2022 318% 306% 674% 1,437% 752% 00% 200% 400% 600% 800% 1,000% 1,200% 1,400% 1,600% 2018 2019 2020 2021 Q1 2022 ASSET QUALITY AND RESERVE LEVELS OVERVIEW NPAS / ASSETS (%) RESERVES / LOANS (%) RESERVES / NPLS (%) ▪ Solid asset quality based on low levels of nonperforming assets. ▪ Strong reserve levels with four consecutive quarters of net recoveries. ▪ Currently a non - CECL institution with strong credit quality as evidenced by loans with a ten - year average net charge - offs of 9 bps. NCO/ Avg Loans 0.18% 0.33% 0.03% (0.04)% (0.03)%

GRAPHIC

16 KEY REVENUE ITEMS DOLLARS IN THOUSANDS 1 – Other noninterest income consists of service charges on deposit accounts income, net gains (losses) on investment securities income, and other noninterest income $19,000 $20,570 $21,075 $3,038 $2,219 $598 $22,038 $22,789 $21,673 $17,000 $18,000 $19,000 $20,000 $21,000 $22,000 $23,000 $24,000 Q1 2021 Q4 2021 Q1 2022 Net Interest Income Net Interest Income PPP fees $17,255 $18,552 $17,646 $4,986 $5,633 $5,326 $17,132 $7,967 $4,931 $1,508 $1,566 $1,567 $40,881 $33,718 $29,470 Q1 2021 Q4 2021 Q1 2022 Noninterest Income Retirement and benefit services Wealth management Mortgage banking Other(1) Net (4.90)% Linked Quarter Interest Income (1.66)% Year - over - year Noninterest (12.60)% Linked Quarter Income (27.91)% Year - over - year

GRAPHIC

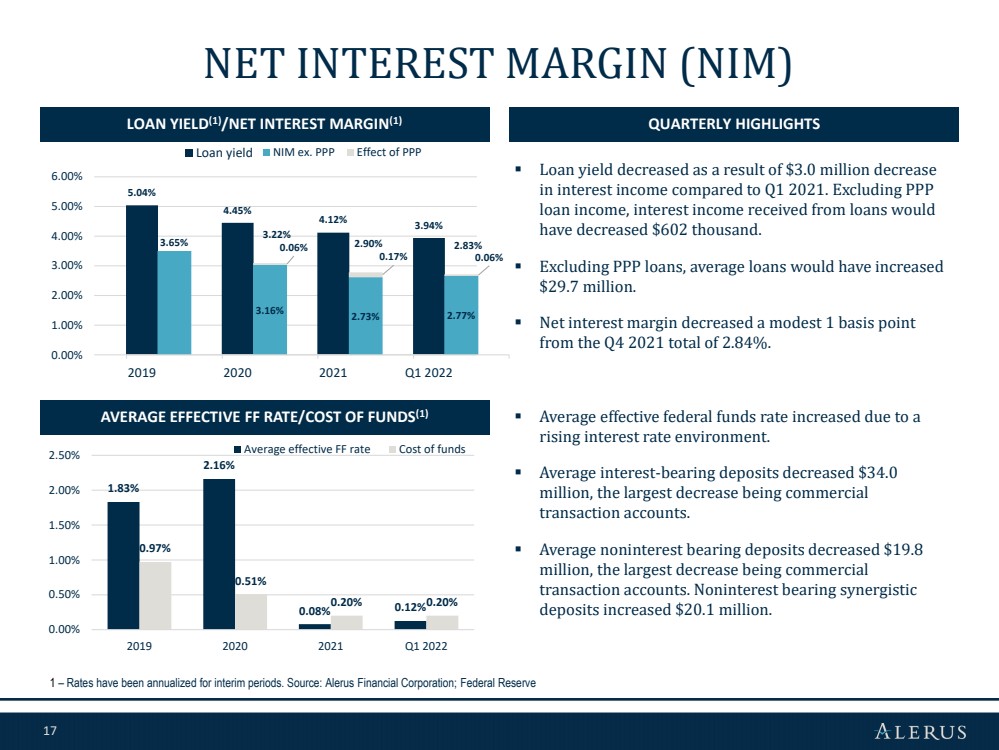
17 NET INTEREST MARGIN (NIM) LOAN YIELD (1) /N ET INTEREST MARGIN (1) QUARTERLY HIGHLIGHTS AVERAGE EFFECTIVE FF RATE/COST OF FUNDS (1) 1 – Rates have been annualized for interim periods. Source: Alerus Financial Corporation; Federal Reserve 1.83% 2.16% 0.08% 0.12% 0.97% 0.51% 0.20% 0.20% 0.00% 0.50% 1.00% 1.50% 2.00% 2.50% 2019 2020 2021 Q1 2022 Average effective FF rate Cost of funds 5.04% 4.45% 4.12% 3.94% 0.00% 1.00% 2.00% 3.00% 4.00% 5.00% 6.00% 2019 2020 2021 Q1 2022 Loan yield 3.65% 3.16% 2.73% 2.77% 0.06% 0.17% 0.06% 3.22% 2.90% 2.83% NIM ex. PPP Effect of PPP ▪ Loan yield decreased as a result of $3.0 million decrease in interest income compared to Q1 2021. Excluding PPP loan income, interest income received from loans would have decreased $602 thousand. ▪ Excluding PPP loans, average loans would have increased $29.7 million. ▪ Net interest margin decreased a modest 1 basis point from the Q4 2021 total of 2.84%. ▪ Average effective federal funds rate increased due to a rising interest rate environment. ▪ Average interest - bearing deposits decreased $34.0 million, the largest decrease being commercial transaction accounts. ▪ Average noninterest bearing deposits decreased $19.8 million, the largest decrease being commercial transaction accounts. Noninterest bearing synergistic deposits increased $20.1 million.

GRAPHIC

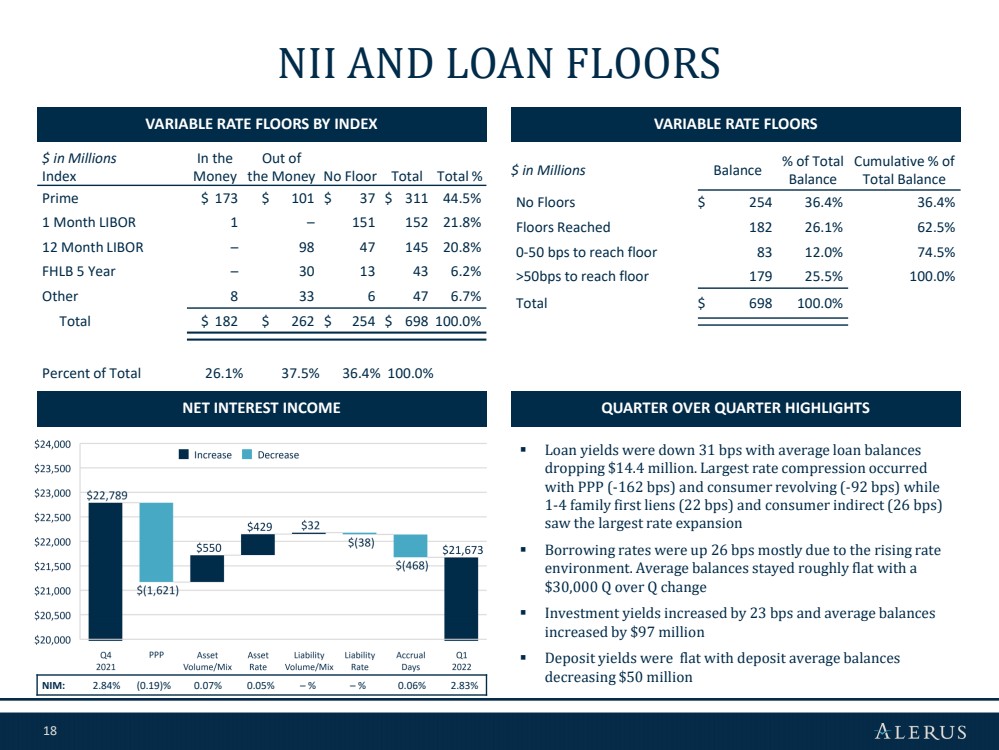
18 NII AND LOAN FLOORS VARIABLE RATE FLOORS BY INDEX VARIABLE RATE FLOORS QUARTER OVER QUARTER HIGHLIGHTS $ in Millions Balance % of Total Balance Cumulative % of Total Balance No Floors $ 254 36.4% 36.4% Floors Reached 182 26.1% 62.5% 0 - 50 bps to reach floor 83 12.0% 74.5% >50bps to reach floor 179 25.5% 100.0% Total $ 698 100.0% $ in Millions Index In the Money Out of the Money No Floor Total Total % Prime $ 173 $ 101 $ 37 $ 311 44.5% 1 Month LIBOR 1 – 151 152 21.8% 12 Month LIBOR – 98 47 145 20.8% FHLB 5 Year – 30 13 43 6.2 % Other 8 33 6 47 6.7% Total $ 182 $ 262 $ 254 $ 698 100.0 % Percent of Total 26.1% 37.5% 36.4% 100.0% NET INTEREST INCOME ▪ Loan yields were down 31 bps with average loan balances dropping $14.4 million. Largest rate compression occurred with PPP ( - 162 bps) and consumer revolving ( - 92 bps) while 1 - 4 family first liens (22 bps) and consumer indirect (26 bps) saw the largest rate expansion ▪ Borrowing rates were up 26 bps mostly due to the rising rate environment. Average balances stayed roughly flat with a $30,000 Q over Q change ▪ Investment yields increased by 23 bps and average balances increased by $97 million ▪ Deposit yields were flat with deposit average balances decreasing $50 million NIM: 2.84% (0.19)% 0.07% 0.05% – % – % 0.06% 2.83%

GRAPHIC

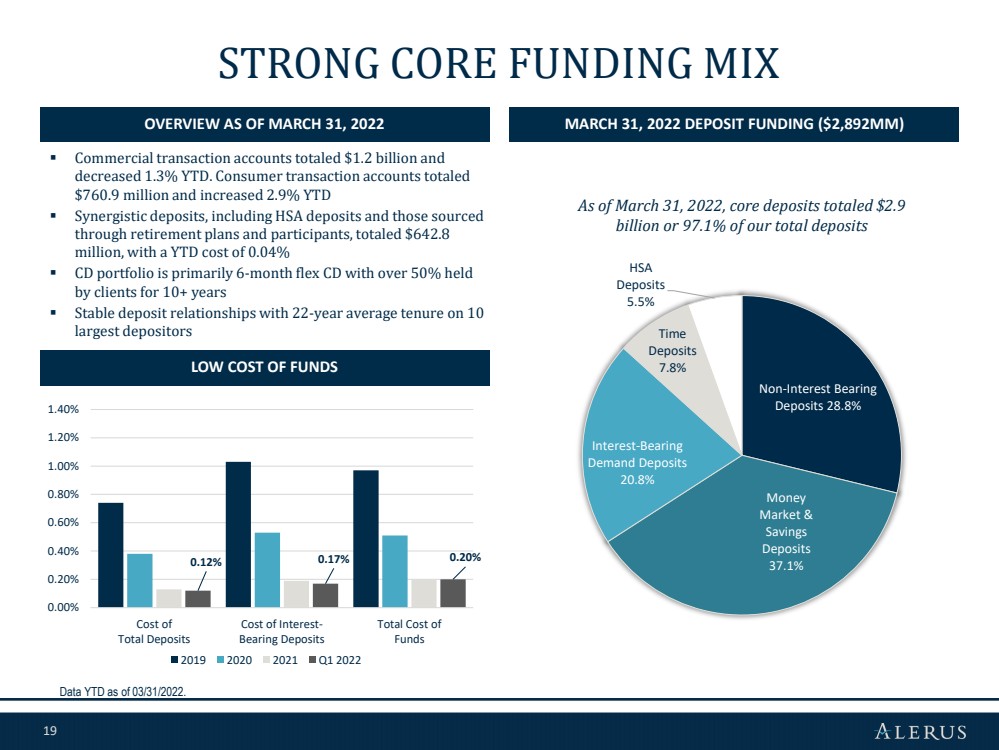
19 STRONG CORE FUNDING MIX ▪ Commercial transaction accounts totaled $1.2 billion and decreased 1.3% YTD. Consumer transaction accounts totaled $760.9 million and increased 2.9% YTD ▪ Synergistic deposits, including HSA deposits and those sourced through retirement plans and participants, totaled $642.8 million, with a YTD cost of 0.04% ▪ CD portfolio is primarily 6 - month flex CD with over 50% held by clients for 10+ years ▪ Stable deposit relationships with 22 - year average tenure on 10 largest depositors As of March 31, 2022, core deposits totaled $2.9 billion or 97.1% of our total deposits OVERVIEW AS OF MARCH 31, 2022 MARCH 31, 2022 DEPOSIT FUNDING ($ 2,892MM ) LOW COST OF FUNDS Data YTD as of 03/31/2022. 0.12% 0.17% 0.20% 0.00% 0.20% 0.40% 0.60% 0.80% 1.00% 1.20% 1.40% Cost of Total Deposits Cost of Interest- Bearing Deposits Total Cost of Funds 2019 2020 2021 Q1 2022 Non - Interest Bearing Deposits 28.8% Money Market & Savings Deposits 37.1% Interest - Bearing Demand Deposits 20.8% Time Deposits 7.8% HSA Deposits 5.5%

GRAPHIC

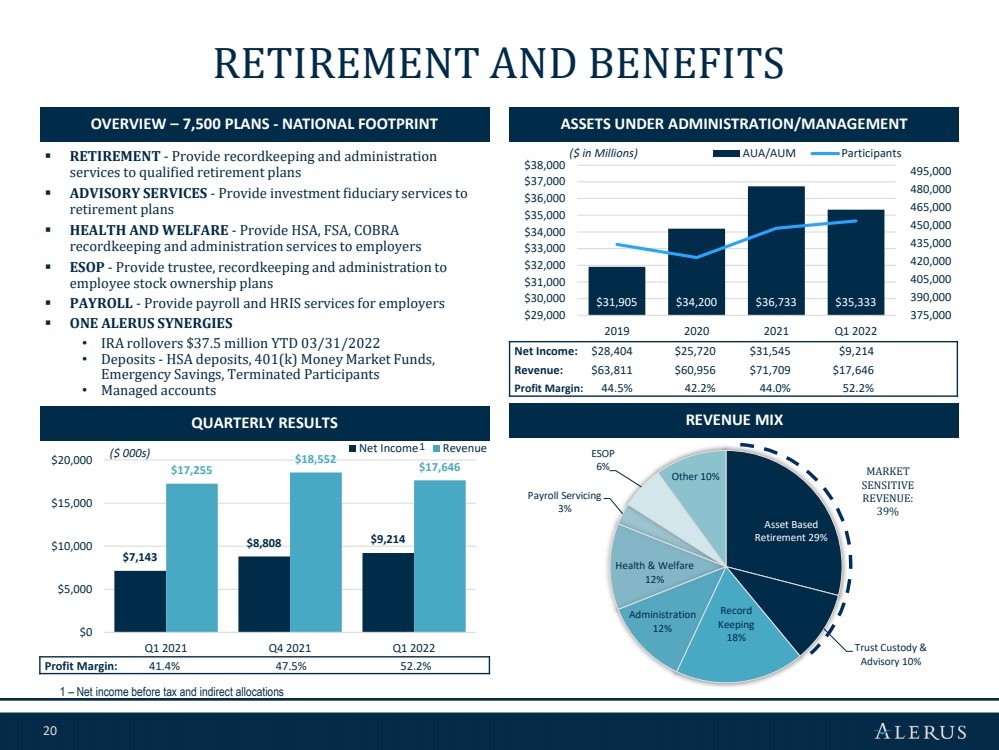
20 $31,905 $34,200 $36,733 $35,333 375,000 390,000 405,000 420,000 435,000 450,000 465,000 480,000 495,000 $29,000 $30,000 $31,000 $32,000 $33,000 $34,000 $35,000 $36,000 $37,000 $38,000 2019 2020 2021 Q1 2022 AUA/AUM Participants Asset Based Retirement 29% Trust Custody & Advisory 10% Record Keeping 18% Administration 12% Health & Welfare 12% Payroll Servicing 3% ESOP 6% Other 10% $7,143 $8,808 $9,214 $17,255 $18,552 $17,646 $0 $5,000 $10,000 $15,000 $20,000 Q1 2021 Q4 2021 Q1 2022 Net Income Revenue RETIREMENT AND BENEFITS OVERVIEW – 7,500 PLANS - NATIONAL FOOTPRINT ASSETS UNDER ADMINISTRATION/MANAGEMENT REVENUE MIX MARKET SENSITIVE REVENUE: 39% ▪ RETIREMENT - Provide recordkeeping and administration services to qualified retirement plans ▪ ADVISORY SERVICES - Provide investment fiduciary services to retirement plans ▪ HEALTH AND WELFARE - Provide HSA, FSA, COBRA recordkeeping and administration services to employers ▪ ESOP - Provide trustee, recordkeeping and administration to employee stock ownership plans ▪ PAYROLL - Provide payroll and HRIS services for employers ▪ ONE ALERUS SYNERGIES • IRA rollovers $37.5 million YTD 03/31/2022 • Deposits - HSA deposits, 401(k) Money Market Funds, Emergency Savings, Terminated Participants • Managed accounts ($ in Millions) QUARTERLY RESULTS ($ 000s) 1 1 – Net income before tax and indirect allocations Net Income: $28,404 $25,720 $31,545 $9,214 Revenue: $63,811 $60,956 $71,709 $17,646 Profit Margin: 44.5% 42.2% 44.0% 52.2% Profit Margin: 41.4% 47.5% 52.2%

GRAPHIC

21 $2,651 $3,446 $3,487 $4,986 $5,633 $5,326 $0 $1,000 $2,000 $3,000 $4,000 $5,000 $6,000 Q1 2021 Q4 2021 Q1 2022 Net Income Revenue $3,103 $3,339 $4,040 $4,585 $0 $1,000 $2,000 $3,000 $4,000 2019 2020 2021 Q1 2022 ▪ ADVISORY AND PLANNING SERVICES • Retirement Planning, Tax Planning, Insurance Planning, Wealth Transfer Planning and Business Transition Planning ▪ ASSET MANAGEMENT • Personalized SMA strategies, Tax Management and Global Perspective ▪ FIDUCIARY SERVICES • IRA, Agency and Personal Trust ▪ ONE ALERUS SYNERGIES • IRA rollovers • 401(k) managed accounts WEALTH MANAGEMENT SERVICES OVERVIEW OF SERVICES ASSETS UNDER ADMINISTRATION/MANAGEMENT REVENUE MIX ($ in Millions) QUARTERLY RESULTS 1 ($ 000s) 1 – Net income before tax and indirect allocations Asset Management 89% Brokerage 9% Insurance & Advisory 2% Net Income: $8,314 $9,162 $12,183 $3,487 Revenue: $15,502 $17,451 $21,052 $5,325 Profit Margin: 53.6% 52.2% 57.9% 65.5% Profit Margin: 53.2% 61.2% 65.5%

GRAPHIC

22 $863.4 $1,632.5 $1,592.1 $151.8 $83.0 $146.5 $244.0 $35.0 $946.4 $1,779.0 $1,836.1 $186.8 $- $500.0 $1,000.0 $1,500.0 $2,000.0 2019 2020 2021 YTD Q1 2022 Portfolio Sale MORTGAGE BANKING OVERVIEW OF SERVICES YEARLY MORTGAGE ORIGINATIONS ($000s) QUARTERLY RESULT S ▪ 1st and 2nd mortgage product offerings through centralized mortgage operations in Minnesota ▪ Our Twin Cities originators averaged $58+ million in annual volume over the last three years ▪ YTD 517 loans closed, approximately 70% purchase originations, with approximately 90% sourced from the Twin Cities MSA ▪ Q1 2022 96% pull through on secondary market ▪ ONE ALERUS SYNERGIES • Through enhanced technology, digital applications total approximately 90%. Paperless environment eliminated nearly 200,000+ pages printed on a monthly basis • As of March 31, 2022, residential real estate first mortgages excluding construction mortgages totaled $491 million ($000s) Q1 2021 Q2 2021 Q3 2021 Q4 2021 Q1 2022 Origination and Sale $ 16,421 $ 17,803 $ 12,925 $ 9,812 $4,935 Fair Value Changes 711 (5,515) (1,810) (1,846) (4) Total $ 17,132 $ 12,288 $ 11,115 $ 7,967 $4,931 Net income (1) $ 6,725 $ 2,116 $ 3,151 $ 1,329 $620 Profit Margin 39.3% 17.2% 28.3% 16.7% 12.6% Gain on Sale Margin 3.2% 3.7% 3.6% 3.2% 2.8% QUARTERLY ORIGINATIONS $474.1 $295.4 $151.8 $43.9 $61.4 $35.0 $518.0 $356.8 $186.8 $- $250.0 $500.0 $750.0 Q1 2021 Q4 2021 Q1 2022 Portfolio Sale 1 – Net income before tax and indirect allocations Purchase: 71.2% 45.2% 51.2% 70.3% Refinance: 28.8% 54.8% 48.8% 29.7% Purchase: 32.3% 57.7% 70.3% Refinance: 67.7% 42.3% 29.7%

GRAPHIC

23 NONINTEREST EXPENSE 1 – Other noninterest expense consists of intangible amortization expense, marketing and business development expense, supplies and postage expense, travel expense, mortgage and lending expense, and other noninterest expense QUARTERLY HIGHLIGHTS $29,511 $27,678 $25,213 $2,231 $1,936 $2,051 $4,976 $5,220 $4,924 $1,472 $1,808 $1,541 $4,852 $4,634 $4,342 $43,042 $41,276 $38,071 $0 $5,000 $10,000 $15,000 $20,000 $25,000 $30,000 $35,000 $40,000 $45,000 $50,000 Q1 2021 Q4 2021 Q1 2022 Other(1) Professional Fees and Assessments Business Services, Software and Technology Occupancy and Equipment Compensation and benefits YEAR OVER YEAR HIGHLIGHTS ▪ Compensation expense decreased as mortgage related incentive compensation expense decreased due to the decreases in mortgage originations. ▪ Employee benefits expense increased, driven by seasonally higher payroll taxes and benefits. ▪ Professional fees and assessments decreased due to a reduction in M&A expenses recorded in Q1. ▪ Other expenses decreased from a decrease in marketing and business development expense due to the timing of marketing campaigns. ▪ Compensation and benefits decreased as mortgage related incentive compensation declined due to the decrease in mortgage originations. ▪ Health insurance expense increased due to an increase in actual claims incurred. ▪ Other expenses decreased due to a decline in mortgage and lending expenses from a decrease in mortgage originations. ▪ Occupancy and equipment expense decreased as we exited leased facilities and transitioned to a hybrid work model. Noninterest (7.76)% Linked Quarter Expense (11.55)% Year - over - year

GRAPHIC

24 12.9% 16.7% 16.8% 18.6% 18.1% 0.0% 2.0% 4.0% 6.0% 8.0% 10.0% 12.0% 14.0% 16.0% 18.0% 20.0% 2018 2019 2020 2021 Q1 2022 7.5% 11.1% 9.2% 9.8% 10.3% 8.9% 12.9% 13.2% 15.1% 14.7% 0.0% 2.0% 4.0% 6.0% 8.0% 10.0% 12.0% 14.0% 16.0% 2018 2019 2020 2021 Q1 2022 Tier 1 Leverage Tier 1 Capital STRONG CAPITAL AND SOURCES OF LIQUIDITY TANGIBLE COMMON EQUITY/TANGIBLE ASSETS 1 TIER 1 CAPITAL/TIER 1 LEVERAGE RATIOS PRIMARY AND SECONDARY SOURCES OF LIQUIDITY TOTAL RISK BASED CAPITAL Regulatory Capital Minimum to be considered well capitalized (dollars in thousands) Cash and cash equivalents $132,832 Unencumbered securities – AFS 865,869 FHLB borrowing availability 760,709 Brokered CD capacity 667,240 Fed funds lines 102,000 Total as of 3/31/2022 $2,528,650 Tier 1 Capital Leverage 1 - Represents a non - GAAP financial measure. See “Non - GAAP Disclosure Reconciliation.” Regulatory Capital Minimum to be considered well capitalized 6.9% 10.4% 9.3% 9.2% 8.5% 0.0% 2.0% 4.0% 6.0% 8.0% 10.0% 12.0% 2018 2019 2020 2021 Q1 2022

GRAPHIC

25 APPENDIX

GRAPHIC

26 BY OUTSTANDING BALANCES WELL DIVERSIFIED LOAN PORTFOLIO As of 03/31/2022 1 - 4 Residential 1st 26% 1 - 4 Residential Construction 2% 1 - 4 Residential Jr Lien 2% HELOC 6% RE Loans to be Sold 1% C&I 23% PPP 1% Ag Production 1% Other CRE 16% Owner Occupied CRE 11% Ag Land 2% Multifamily 4% Retail Indirect 1% Other Consumer 2% RE Construction 2%

GRAPHIC

27 SUMMARY BY INDUSTRY TYPE TOTAL COMMITMENT COMMERCIAL & INDUSTRIAL 1 1 – Commercial and industrial loans includes C & I, loans to public entities, and other loans. It excludes PPP and ag production loans “Other” includes to the following industries (1) Nonclassifiable establishments, (2) Management of Companies and Enterprises, (3 ) Administrative and Support and Waste Management and Remediation Services, (4) Accommodation and Food Services, (5) Educational Services, (6) Other Services (except Public Administration), (7) Information , ( 8) Arts, Entertainment, and Recreation, (9) Agriculture Forestry, Fishing, and Hunting, (10) Public Administration), (11) Mining Quarrying, and Oil and Gas Extraction, and (12) Utilities “Other Retail Trade” includes the following sub - industries within Retail Trade: (1) Miscellaneous Store Retailers, (2) Furniture and Home Furnishings Stores, (3) Sporting Goods, Hobby, Musical Instrument, and Book Stores, (4) Clothing and Clothing Accessories Stores, and (5) General Merchandise Stores Transportation and Warehousing 4% Health Care and Social Assistance 7% Professional, Scientific and Technical Services 6% Manufacturing 12% Real Estate and Rental and Leasing 8% Wholesale Trade 9% Construction 13% Finance and Insurance 13% Other 10% Motor Vehicle and Parts Dealers 9% Food and Beverage Stores 1% Electronics and Appliance Stores 3% Health and Personal Care Services 1% Gasoline Stations 1% Building Material and Garden Equipment and Supplies Dealers 1% Nonstore Retailers 1% Other Retail Trade 1% Retail Trade 18%

GRAPHIC

28 LOANS SECURED BY REAL ESTATE TOTAL COMMITMENT COMMERCIAL REAL ESTATE 1 1 – Loans secured by commercial real estate include multifamily loans, ag land, other CRE, owner occupied CRE, and ag production Portfolio Avg FICO Avg LTV Serviced 762 65% Non - Serviced 779 25% Junior 756 78% HELOC 796 64% TOTAL COMMITMENT RESIDENTIAL REAL ESTATE Office 21% Retail 14% Warehouse 18% Manufacturing 1% Residential Development 1% Commercial Development 1% Mixed Residential/Commercial 1% Mixed Commercial 4% Apartments 14% Hotel 1% Medical or Nursing Facilities 7% Commercial/Land Development 13% Ag Land 4% Serviced 54% 1 - 4 1st Non - Serviced 3% 1 - 4 Family Jr Liens 3% 1 - 4 Family Revolving 32% 1 - 4 Family Construction 6% Held for Sale 2%

GRAPHIC

29 LINE OF CREDIT UTILIZATION C&I AND HOME EQUITY LINES OF CREDIT 1 1 – Commercial and industrial loans includes revolving C & I loans and other loans. It excludes non - revolving C&I loans, ag prod uction, PPP and loans to public entities. 0% 10% 20% 30% 40% 50% 60% - 50,000 100,000 150,000 200,000 250,000 300,000 Q2 2019 Q3 2019 Q4 2019 Q1 2020 Q2 2020 Q3 2020 Q4 2020 Q1 2021 Q2 2021 Q3 2021 Q4 2021 Q1 2022 Home Equity Lines of Credit Funded Unfunded Funded% 0% 5% 10% 15% 20% 25% 30% 35% 40% 45% - 50,000 100,000 150,000 200,000 250,000 300,000 350,000 400,000 450,000 Q2 2019 Q3 2019 Q4 2019 Q1 2020 Q2 2020 Q3 2020 Q4 2020 Q1 2021 Q2 2021 Q3 2021 Q4 2021 Q1 2022 C&I Funded Unfunded Funded%

GRAPHIC

30 CHANGES IN THE ALLL BY PORTFOLIO SEGMENT ALLOWANCE FOR LOAN LOSSES Three months ended March 31, 2022 (dollars in thousands) Beginning Balance Provision for Loan Losses Loan Charge - offs Loan Recoveries Ending Balance Commercial Commercial and industrial $ 8,925 $ 771 $ (27) $ 126 $ 9,795 Real estate construction 783 27 — — 810 Commercial real estate 12,376 (441) — 11 11,946 Total commercial 22,084 357 (27) 137 22,551 Consumer Residential real estate first mortgage 6,532 129 — — 6,661 Residential real estate junior lien 1,295 92 — 13 1,400 Other revolving and installment 481 145 (18) 36 644 Total consumer 8,308 366 (18) 49 8,705 Unallocated 1,180 (723) — — 457 Total $ 31,572 $ — $ (45) $ 186 $ 31,713

GRAPHIC

31 ALLOCATION BY PORTFOLIO SEGMENT ALLOWANCE FOR LOAN LOSSES March 31, 2022 December 31, 2021 (dollars in thousands) Allocated Allowance Percentage of loans to total loans Allocated Allowance Percentage of loans to total loans Commercial and industrial $ 9,795 25.7% $ 8,925 24.8% Real estate construction 810 2.3% 783 2.3% Commercial real estate 11,946 33.1% 12376 34.1% Residential real estate first mortgage 6,661 28.7% 6,532 29.1% Residential real estate junior lien 1,400 7.2% 1,295 7.1% Other revolving and installment 644 3.0% 481 2.6% Unallocated 457 — % 1,180 — % Total loans $ 31,713 100.0% $ 31,572 100.0%

GRAPHIC

32 Risk Level Total Loans Unguaranteed Balance 1 Reserve Amount Reserve / Unguaranteed Loans Reserve/Total Loans Pass $ 1,801,369 $ 1,774,904 $ 29,615 1.67% 1.64% Special Mention – – – – % – % Substandard 12,249 11,542 1,280 11.09% 10.45% Total Loans Evaluated Collectively 1,813,618 1,786,446 30,895 1.73% 1.70% Total Loans Evaluated Individually 4,424 4,424 361 8.16% 8.16% Unallocated – – 457 – % – % Total $ 1,818,042 $ 1,790,870 $ 31,713 1.77% 1.74% ALLOCATION BY RISK SEGMENT (DOLLARS IN THOUSANDS) ALLOWANCE FOR LOAN LOSSES As of 3/31/2022 1 - Unguaranteed balances exclude PPP loans as well as loans that are guaranteed by another government agency.

GRAPHIC

33 FINANCIAL HIGHLIGHTS 1 Represents a non - GAAP financial measure. See “Non - GAAP Disclosure Reconciliation”. (dollars in thousands, except where otherwise noted) Q1 2021 Q2 2021 Q3 2021 Q4 2021 Q1 2022 Total Assets 3,151,756 $ 3,157,229 $ 3,175,169 $ 3,392,691 $ 3,336,199 $ Total Loans 1,937,345 1,835,312 1,800,386 1,758,020 1,818,042 Total Deposits 2,717,573 2,710,940 2,713,088 2,920,551 2,892,267 Tangible Common Equity 1 274,265 290,510 300,401 307,663 277,818 Net Income 15,215 $ 11,694 $ 13,067 $ 12,705 $ 10,184 $ ROAA (%) 2.02 1.50 1.62 1.50 1.26 ROATCE(%)1 23.03 17.36 18.13 17.36 14.72 Net Interest Margin (FTE) (%) 3.12 2.88 2.78 2.84 2.83 Efficiency Ratio (FTE) (%) 1 66.43 71.46 71.49 71.06 72.25 Non-Int. Income/Op. Rev. (%) 64.97 63.48 63.04 59.67 57.62 Earnings per common share - diluted 0.86 $ 0.66 $ 0.74 $ 0.72 $ 0.57 $ Total Equity/Total Assets (%) 10.45 10.91 11.12 10.59 9.85 Tang. Cmn. Equity/Tang. Assets (%) 1 8.86 9.36 9.62 9.21 8.46 Loans/Deposits (%) 71.29 67.70 66.36 60.19 62.86 NPLs/Loans (%) 0.25 0.38 0.35 0.12 0.23 NPAs/Assets (%) 0.16 0.25 0.22 0.09 0.15 Allowance/NPLs (%) 709.82 485.11 514.79 1,437.05 752.38 Allowance/Loans (%) 1.74 1.84 1.78 1.80 1.74 NCOs/Average Loans (%) 0.10 — (0.06) (0.22) (0.03) Quarterly

GRAPHIC

34 FINANCIAL HIGHLIGHTS 1 Represents a non - GAAP financial measure. See “Non - GAAP Disclosure Reconciliation”. (dollars in thousands, 17-'21 except where otherwise noted) 2017 2018 2019 2020 2021 CAGR Total Assets 2,136,081 $ 2,179,070 $ 2,356,878 $ 3,013,771 $ 3,392,691 $ 12.3% Total Loans 1,574,474 1,701,850 1,721,279 1,979,375 1,758,020 2.8% Total Deposits 1,834,962 1,775,096 1,971,316 2,571,993 2,920,551 12.3% Tangible Common Equity 1 125,154 147,152 240,008 274,043 307,663 25.2% Net Income 15,001 $ 25,866 $ 29,540 $ 44,675 $ 52,681 $ 36.9% ROAA (%) 0.75 1.21 1.34 1.61 1.66 ROATCE(%) 1 18.04 21.02 17.46 17.74 18.89 Net Interest Margin (FTE) (%) 3.74 3.84 3.65 3.22 2.90 Efficiency Ratio (FTE) (%) 1 75.36 73.80 73.22 68.40 70.02 Non-Int. Income/Op. Rev. (%) 60.36 57.73 60.50 64.05 62.86 Earnings per common share - diluted 1.07 1.84 1.91 2.52 2.97 Total Equity/Total Assets (%) 8.41 9.04 12.12 10.96 10.59 Tang. Cmn. Equity/Tang. Assets (%) 1 6.01 6.91 10.38 9.27 9.21 Loans/Deposits (%) 85.80 95.87 87.32 76.96 60.19 NPLs/Loans (%) 0.37 0.41 0.45 0.26 0.12 NPAs/Assets (%) 0.30 0.33 0.33 0.17 0.09 Allowance/NPLs (%) 282.04 318.45 305.66 674.13 1,437.05 Allowance/Loans (%) 1.05 1.30 1.39 1.73 1.80 NCOs/Average Loans (%) 0.16 0.18 0.33 0.03 (0.04) Annual

GRAPHIC

35 NON - GAAP DISCLOSURE RECONCILIATION (dollars in thousands, except where otherwise noted) Quarterly Q1 2021 Q2 2021 Q3 2021 Q4 2021 Q1 2022 Tangible common equity to tangible assets Total common stockholders' equity $ 329,234 $ 344,391 $ 353,195 $ 359,403 $ 328,505 Less: Goodwill 30,201 30,201 30,201 31,490 31,490 Less: Other intangible assets 24,768 23,680 22,593 20,250 19,197 Tangible common equity (a) 274,265 290,510 300,401 307,663 277,818 Total assets 3,151,756 3,157,229 3,175,169 3,392,691 3,336,199 Less: Goodwill 30,201 30,201 30,201 31,490 31,490 Less: Other intangible assets 24,768 23,680 22,593 20,250 19,197 Tangible assets (b) 3,096,787 3,103,348 3,122,375 3,340,951 3,285,512 Tangible common equity to tangible assets (a)/(b) 8.86 % 9.36 % 9.62 % 9.21 % 8.46 % Tangible common equity per common share Total stockholders' equity $ 329,234 $ 344,391 $ 353,195 $ 359,403 $ 328,505 Less: Goodwill 30,201 30,201 30,201 31,490 31,490 Less: Other intangible assets 24,768 23,680 22,593 20,250 19,197 Tangible common equity (c) 274,265 290,510 300,401 307,663 277,818 Common shares outstanding (d) 17,190 17,198 17,208 17,213 17,289 Tangible common equity per common share (c)/(d) $ 15.95 $ 16.89 $ 17.46 $ 17.87 $ 16.07 Return on average tangible common equity Net income $ 15,215 $ 11,694 $ 13,067 $ 12,705 $ 10,184 Add: Intangible amortization expense (net of tax) 909 860 860 832 832 Net income, excluding intangible amortization (e) 16,124 12,554 13,927 13,537 11,016 Average total equity 334,188 339,439 353,196 357,084 350,545 Less: Average goodwill 30,201 30,201 30,201 30,930 31,490 Less: Average other intangible assets (net of tax) 19,995 19,123 18,272 16,843 15,569 Average tangible common equity (f) 283,992 290,115 304,723 309,311 303,486 Return on average tangible common equity (e)/(f) 23.03 % 17.36 % 18.13 % 17.36 % 14.72 % Efficiency Ratio Noninterest expense $ 43,042 $ 42,550 $ 42,041 $ 41,276 $ 38,071 Less: Intangible amortization expense 1,151 1,088 1,088 1,053 1,053 Adjusted noninterest expense (g) 41,891 41,462 40,953 40,223 37,018 Net interest income 22,038 21,140 21,132 22,789 21,673 Noninterest income 40,881 36,748 36,040 33,718 29,470 Tax - equivalent adjustment 143 135 115 99 94 Total tax - equivalent revenue(h) 63,062 58,023 57,287 56,606 51,237 Efficiency ratio (g)/(h) 66.43 % 71.46 % 71.49 % 71.06 % 72.25 %

GRAPHIC

36 NON - GAAP DISCLOSURE RECONCILIATION (dollars in thousands, except where otherwise noted ) Annual 2017 2018 2019 2020 2021 Tangible common equity to tangible assets Total common stockholders' equity $ 179,594 $ 196,954 $ 285,728 $ 330,163 $ 359,403 Less: Goodwill 27,329 27,329 27,329 30,201 31,490 Less: Other intangible assets 27,111 22,473 18,391 25,919 20,250 Tangible common equity (a) 125,154 147,152 240,008 274,043 307,663 Total assets 2,136,081 2,179,070 2,356,878 3,013,771 3,392,691 Less: Goodwill 27,329 27,329 27,329 30,201 31,490 Less: Other intangible assets 27,111 22,473 18,391 25,919 20,250 Tangible assets (b) 2,081,641 2,129,268 2,311,158 2,957,651 3,340,951 Tangible common equity to tangible assets (a)/(b) 6.01 % 6.91 % 10.38 % 9.27 % 9.21 % Tangible common equity per common share Total stockholders' equity $ 179,594 $ 196,954 $ 285,728 $ 330,163 $ 359,403 Less: Goodwill 27,329 27,329 27,329 30,201 31,490 Less: Other intangible assets 27,111 22,473 18,391 25,919 20,250 Tangible common equity (c) 125,154 147,152 240,008 274,043 307,663 Common shares outstanding (d) 13,699 13,775 17,050 17,125 17,213 Tangible common equity per common share (c)/(d) $ 9.14 $ 10.68 $ 14.08 $ 16.00 $ 17.87 Return on average tangible common equity Net income $ 15,001 $ 25,866 $ 29,540 $ 44,675 $ 52,681 Add: Intangible amortization expense (net of tax) 3,655 3,664 3,224 3,129 3,460 Remeasurement due to tax reform 4,818 — — — — Net income, excluding intangible amortization (e) 23,474 29,530 32,764 47,804 56,141 Average total equity 176,779 187,341 231,084 310,208 346,059 Less: Average goodwill 27,329 27,329 27,329 27,439 30,385 Less: Average other intangible assets (net of tax) 19,358 19,522 16,101 13,309 18,548 Average tangible common equity (f) 130,092 140,490 187,654 269,460 297,126 Return on average tangible common equity (e)/(f) 18.04 % 21.02 % 17.46 % 17.74 % 18.89 % Efficiency Ratio Noninterest expense $ 134,920 $ 136,325 $ 142,537 $ 163,799 $ 168,909 Less: Intangible amortization expense 5,623 4,638 4,081 3,961 4,380 Adjusted noninterest expense (g) 129,297 131,687 138,456 159,838 164,529 Net interest income 67,670 75,224 74,551 83,846 87,099 Noninterest income 103,045 102,749 114,194 149,371 147,387 Tax equivalent adjustment 865 462 347 455 492 Total tax equivalent revenue (h) 171,580 178,435 189,092 233,672 234,978 Efficiency ratio (g)/(h) 75.36 % 73.80 % 73.22 % 68.40 % 70.02 %