Exhibit 99.1
FOR RELEASE (10.28.2020) | Katie A. Lorenson, Chief Financial Officer 952.417.3725 (Office) |

ALERUS FINANCIAL CORPORATION REPORTS
THIRD QUARTER 2020 NET INCOME OF $17.7 MILLION
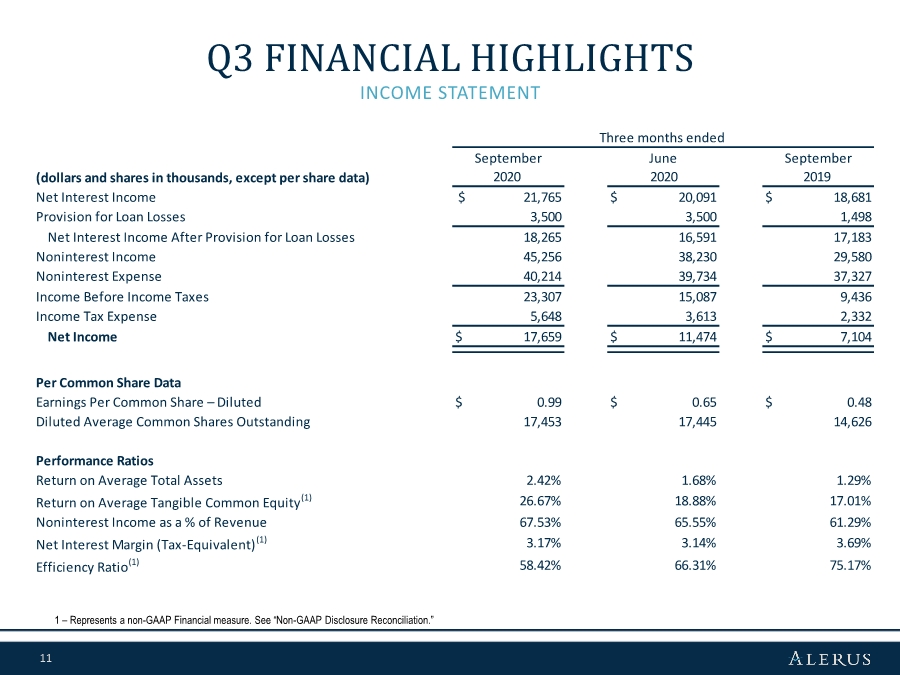
GRAND FORKS, N.D. (October 28, 2020) – Alerus Financial Corporation (Nasdaq: ALRS) reported net income of $17.7 million for the third quarter of 2020, or $0.99 per diluted common share, compared to net income of $11.5 million, or $0.65 per diluted common share, for the second quarter of 2020, and net income of $7.1 million, or $0.48 per diluted common share, for the third quarter of 2019.
CEO Comments
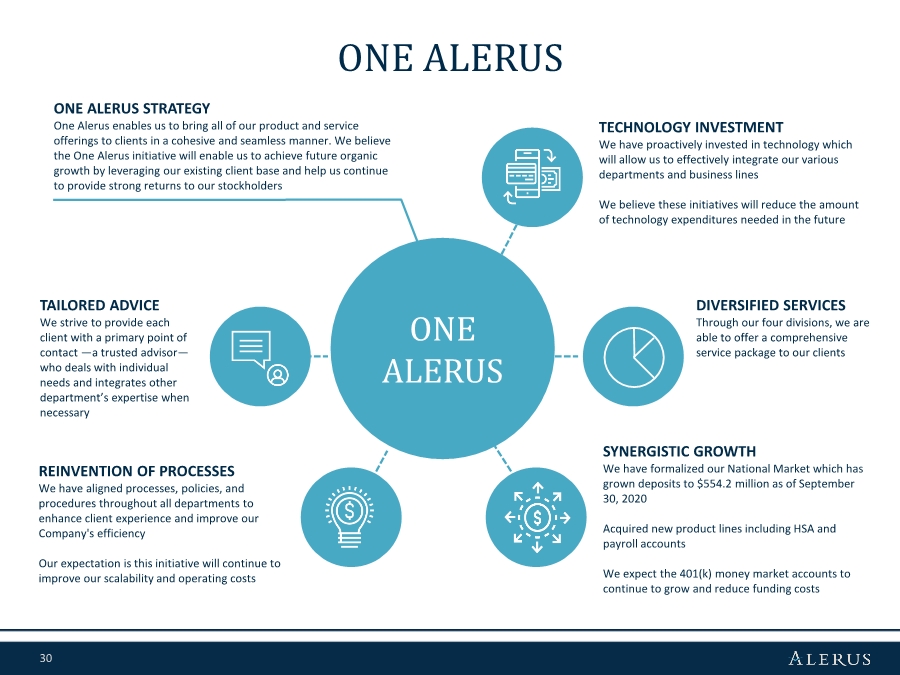
Chairman, President, and Chief Executive Officer Randy Newman said, “We are proud to report record quarterly net income of $17.7 million. Despite the uncertain economic environment and ongoing pandemic, our diversified business model demonstrates its value to stockholders as we delivered incredible financial performance throughout 2020. Our “One Alerus” approach to serving clients holistically through advisors and digitally through technology resulted in record levels of mortgage originations and expansions of relationships across our lines of business.
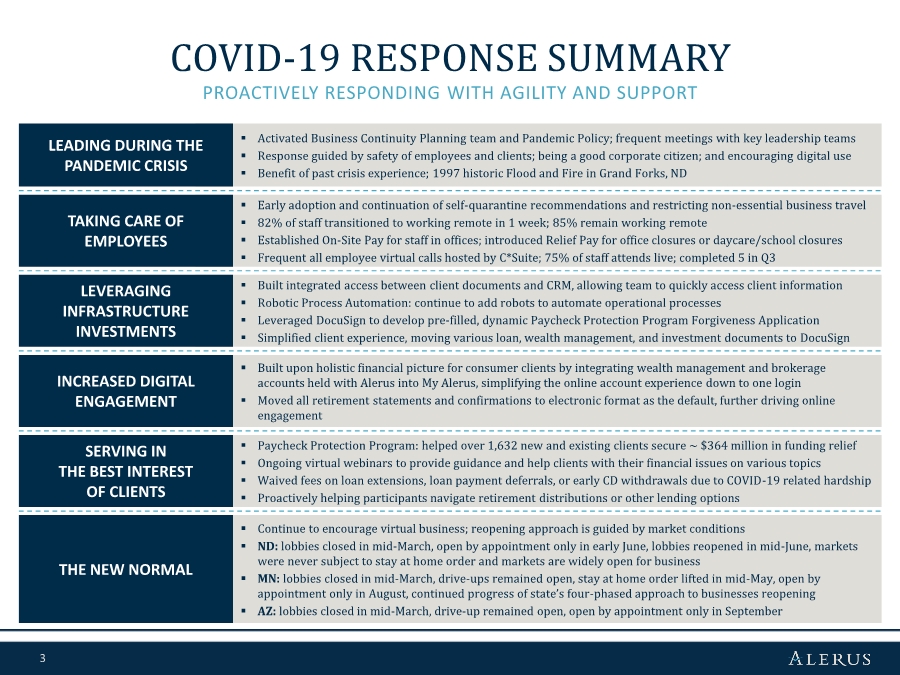
We believe we continue to be agile in our response to the novel coronavirus, or COVID-19 pandemic, by focusing on the health and well-being of our team members and communities, and helping clients during a difficult economic environment. The strength and stability of our balance sheet uniquely positioned our Company to perform well in challenging economic environments. We have a diversified loan portfolio, strong credit quality metrics, and robust levels of loan loss reserves at 1.83% of total loans, excluding Paycheck Protection Program, or PPP, loans. These balance sheet attributes, supported by a diversified business model which generates high levels of revenue despite the low rate environment is proving to be resilient in challenging and uncertain times. These fundamentals paired with the dedication of our team and technology investments are paving our path forward.”
Quarterly Highlights
| ◾ | Return on average assets of 2.42%, compared to 1.68% for the second quarter of 2020 |
| ◾ | Return on average tangible common equity(1) of 26.67%, compared to 18.88% for the second quarter of 2020 |
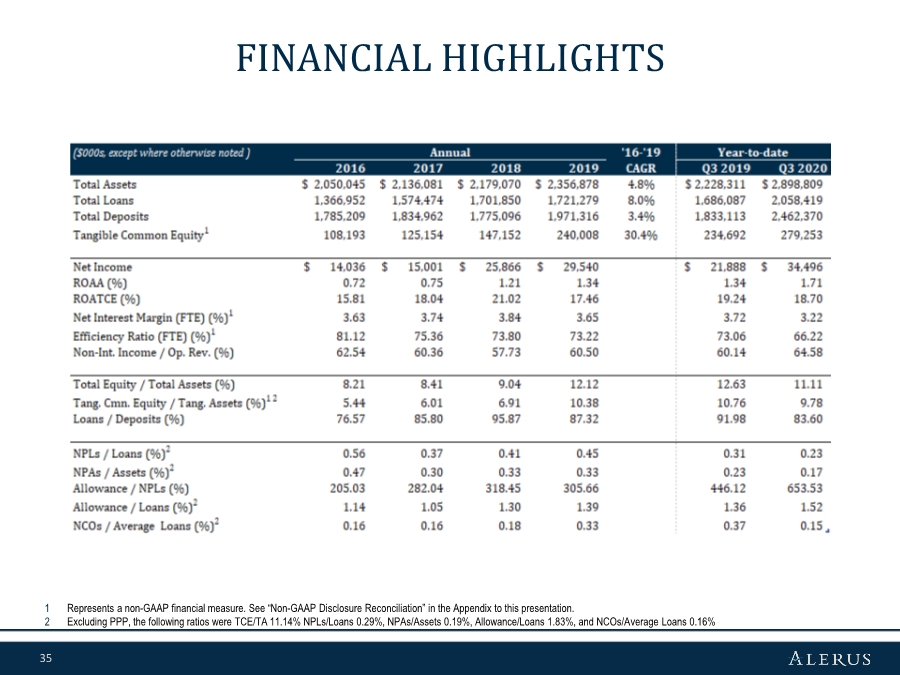
| ◾ | Net interest margin (tax-equivalent)(1) was 3.17%, compared to 3.14% for the second quarter of 2020 |
| ◾ | Allowance for loan losses to total loans, excluding PPP loans, was 1.83%, compared to 1.62% as of June 30, 2020 |
| ◾ | Efficiency ratio(1) of 58.42%, compared to 66.31% for the second quarter of 2020 |
| ◾ | Noninterest income as a percentage of total revenue was 67.53%, compared to 65.55% for the second quarter of 2020 |
| ◾ | Mortgage originations totaled $511.6 million, an 18.5% increase from the second quarter of 2020 |
| ◾ | Loans held for investment increased $337.1 million, or 19.6%, from the fourth quarter of 2019 |
| ◾ | Deposits increased $491.1 million, or 24.9%, from the fourth quarter of 2019 |
| (1) | Represents a non-GAAP financial measure. See “Non-GAAP to GAAP Reconciliations and Calculation of Non-GAAP Financial Measures.” |
Selected Financial Data (unaudited)
| | As of and for the | | |||||||||||||
| | Three months ended | | Nine months ended | | |||||||||||
| | September 30, | | June 30, | | September 30, | | September 30, | | September 30, | | |||||
(dollars and shares in thousands, except per share data) |
| 2020 |
| 2020 |
| 2019 |
| 2020 |
| 2019 |
| |||||
Performance Ratios | |
|
| |
|
| |
|
| |
|
| |
|
| |
Return on average total assets | |
| 2.42 | % |
| 1.68 | % |
| 1.29 | % |
| 1.71 | % |
| 1.34 | % |
Return on average common equity | |
| 22.31 | % |
| 15.30 | % |
| 12.42 | % |
| 15.17 | % |
| 13.74 | % |
Return on average tangible common equity (1) | |
| 26.67 | % |
| 18.88 | % |
| 17.01 | % |
| 18.70 | % |
| 19.24 | % |
Noninterest income as a % of revenue | |
| 67.53 | % |
| 65.55 | % |
| 61.29 | % |
| 64.58 | % |
| 60.14 | % |
Net interest margin (tax-equivalent) (1) | |
| 3.17 | % |
| 3.14 | % |
| 3.69 | % |
| 3.22 | % |
| 3.72 | % |
Efficiency ratio (1) | |
| 58.42 | % |
| 66.31 | % |
| 75.17 | % |
| 66.22 | % |
| 73.06 | % |
Net charge-offs/(recoveries) to average loans | | | (0.11) | % |
| 0.66 | % |
| (0.06) | % |
| 0.15 | % |
| 0.37 | % |
Dividend payout ratio | |
| 15.15 | % |
| 23.08 | % |
| 29.17 | % | | 23.20 | % | | 28.19 | % |
Per Common Share | |
|
| |
|
| |
|
| |
|
| |
|
| |
Earnings per common share - basic (2) | | $ | 1.01 | | $ | 0.66 | | $ | 0.49 | | $ | 1.98 | | $ | 1.53 | |
Earnings per common share - diluted (2) | | $ | 0.99 | | $ | 0.65 | | $ | 0.48 | | $ | 1.94 | | $ | 1.49 | |
Dividends declared per common share | | $ | 0.15 | | $ | 0.15 | | $ | 0.14 | | $ | 0.45 | | $ | 0.42 | |
Tangible book value per common share (1) | | $ | 16.31 | | $ | 15.30 | | $ | 13.77 | | | | | | | |
Average common shares outstanding - basic | |
| 17,121 | |
| 17,111 | |
| 14,274 | |
| 17,101 | |
| 13,957 | |
Average common shares outstanding - diluted | |
| 17,453 | |
| 17,445 | |
| 14,626 | |
| 17,435 | |
| 14,317 | |
Other Data | |
|
| |
|
| |
|
| | | | | | | |
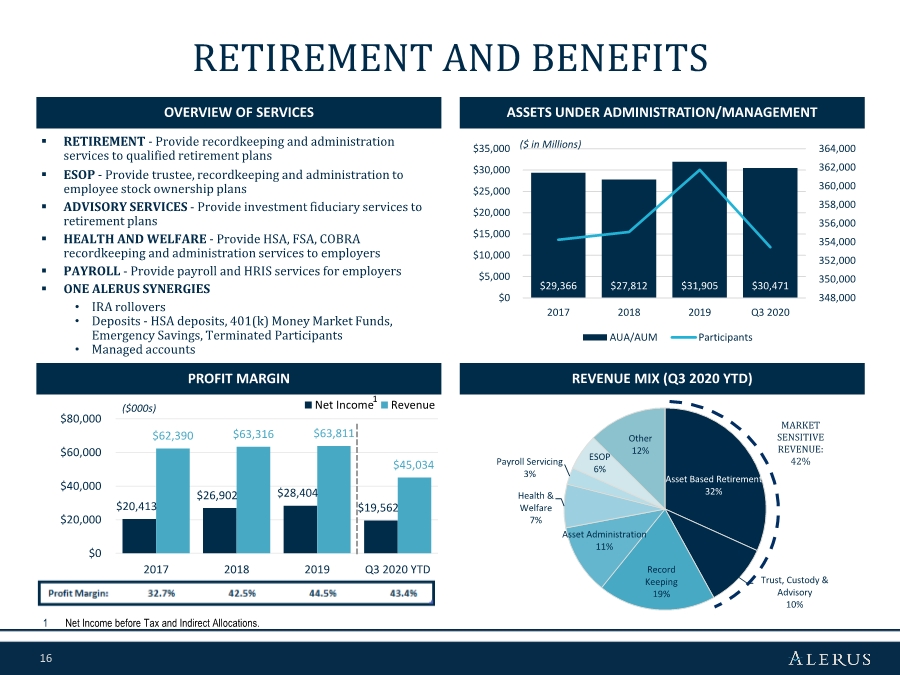
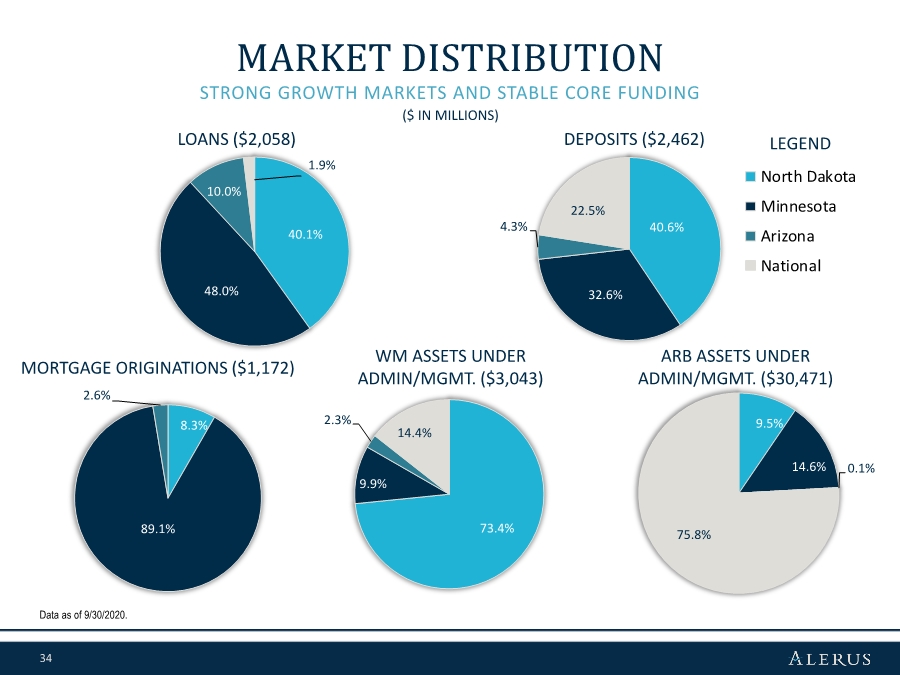
Retirement and benefit services assets under administration/management | | $ | 30,470,645 | | $ | 30,093,095 | | $ | 30,661,226 | | | | | | | |
Wealth management assets under administration/management | |
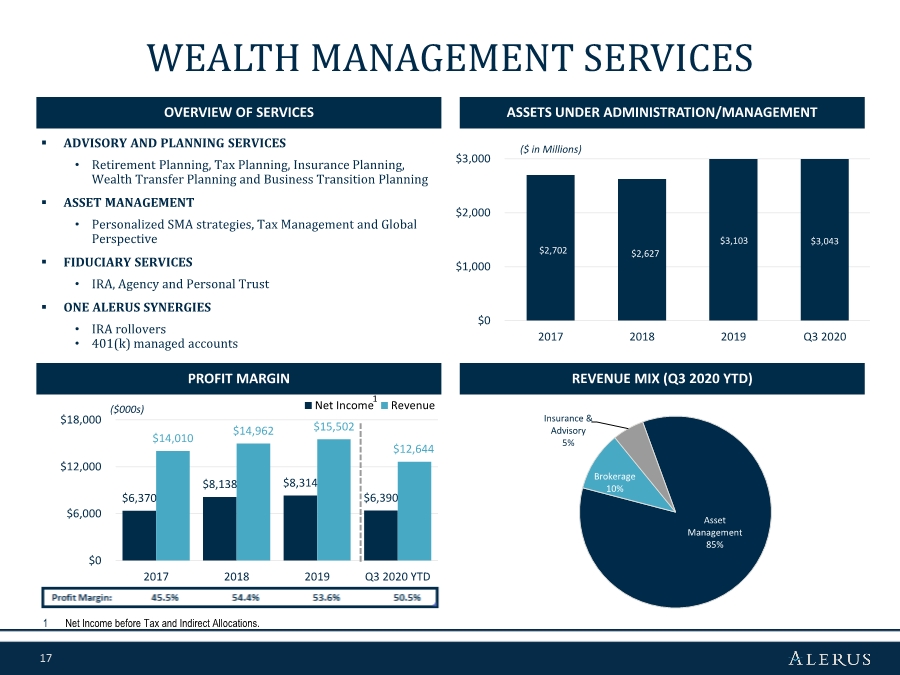
| 3,043,173 | | | 2,957,213 | | | 2,765,459 | |
| | | | | |
Mortgage originations | |
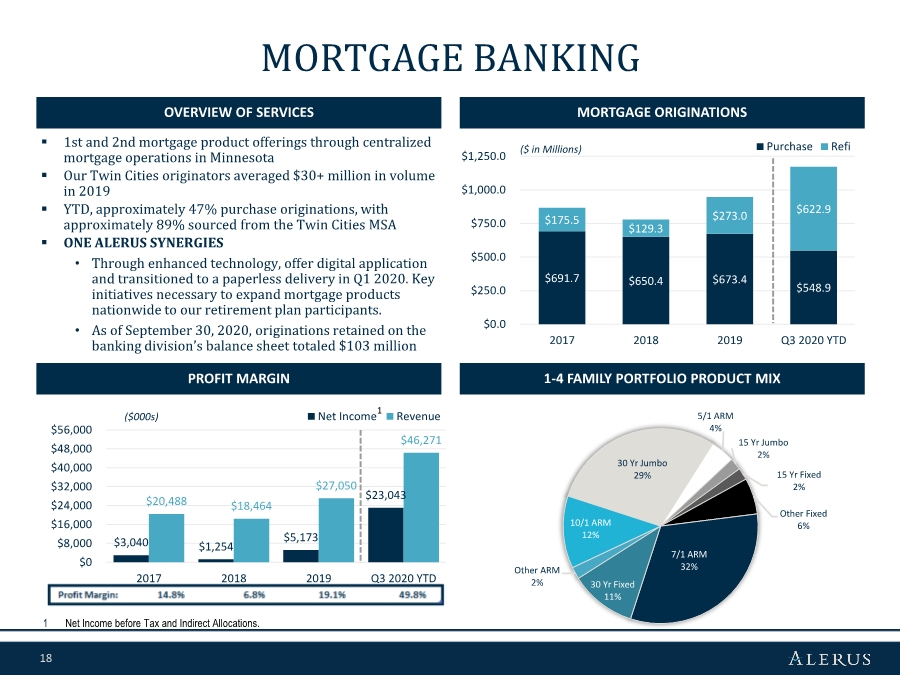
| 511,605 | | | 431,638 | | | 313,527 | | $ | 1,171,811 | | $ | 685,178 | |
Results of Operations
Net Interest Income
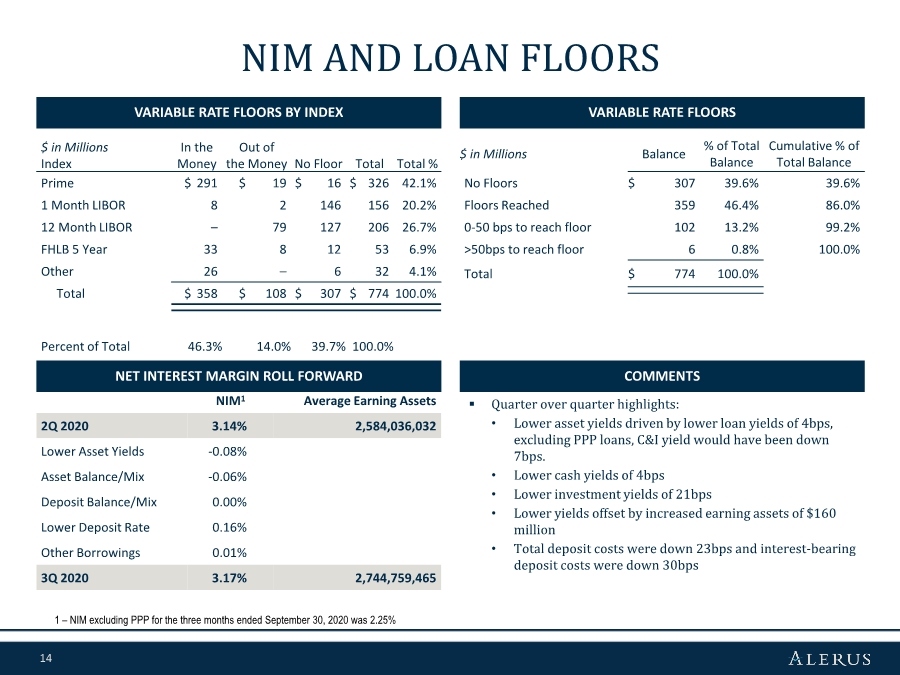
Net interest income for the third quarter of 2020 was $21.8 million, an increase of $1.7 million, or 8.3%, from $20.1 million for the second quarter of 2020. The increase was primarily driven by a decrease of $875 thousand in interest expense on deposits, an increase of $590 thousand in interest income from loans, and a $207 thousand increase in interest income from investment securities. The decrease in interest expense on deposits was primarily a result of a 25 basis point decrease in the cost of interest-bearing deposits, partially offset by a $119.6 million increase in average interest-bearing deposit balances. The increase in interest income from loans was primarily driven by a $74.3 million increase in average balance of PPP loans offset by a 4 basis point decrease in average yield. Interest and fees recognized on PPP loans totaled $3.2 million in the third quarter, an increase of $1.1 million from the second quarter. The increase in interest income from investment securities was primarily a result of a $74.5 million increase in average balances partially offset by a 21 basis point decrease in the average yield.
Compared to the third quarter of 2019, net interest income for the third quarter of 2020 increased $3.1 million, or 16.5%, primarily due to a $2.4 million decrease in interest expense and a $664 thousand increase in interest income. The decrease in interest expense was primarily due to an 84 basis point decrease in the average rate paid on interest-bearing liabilities. The increase in interest income was primarily due to a $674 thousand increase in interest income from investment securities driven by a $186.1 million increase in average balances partially offset by a 39 basis point decrease in the average yield.
Net Interest Margin (Tax-Equivalent)
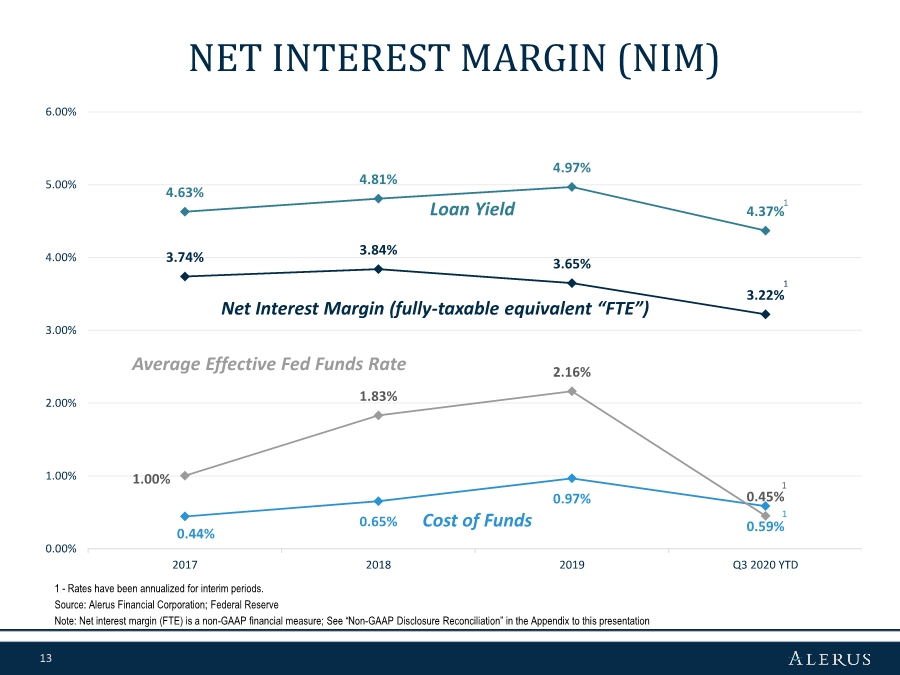
Net interest margin (tax-equivalent), a non-GAAP financial measure, increased to 3.17% for the third quarter of 2020, compared with 3.14% for the second quarter of 2020. The increase in net interest margin was primarily due to a 26 basis point decrease in the average rate on total interest-bearing liabilities partially offset by a 14 basis point decrease in the average earning asset yield. The decrease in the average rate on total interest-bearing liabilities was primarily due to a 35 basis point decrease in the average rate on money market and savings deposits and a 32 basis point decrease in the average rate on time deposits. The decrease in average earning asset yield was due to the continued low interest rate environment and a change in balance sheet mix.
Compared to the third quarter of 2019, net interest margin (tax-equivalent) for the third quarter of 2020 decreased 52 basis points from 3.69%. This decrease was the combined result of sustained lower interest rates and balance sheet mix. The average yield
2
on interest earning assets decreased 112 basis points on an average balance increase of $727.6 million, or 36.1%. The average rate paid on interest-bearing liabilities decreased 84 basis points on an average balance increase of $407.9 million, or 29.0%.
Noninterest Income
Noninterest income for the third quarter of 2020 was $45.3 million, a $7.0 million, or 18.4%, increase from the second quarter of 2020. The increase was primarily driven by a $4.7 million increase in mortgage banking revenue, a $1.4 million increase in retirement and benefit services revenue, and a $374 thousand increase in wealth management revenue. The increase in mortgage banking revenue was primarily due to an $80.0 million increase in mortgage originations along with a 38 basis point increase in the gain on sale margin. The increase in retirement and benefit services revenue was primarily due to a $712 thousand increase in asset based revenue as a result of an increase in the average balance of assets under administration/management. In addition, the second quarter of 2020 included a downward adjustment to revenue sharing of $660 thousand.
Noninterest income for the third quarter of 2020 increased $15.7 million, or 53.0%, from $29.6 million in the third quarter of 2019. Mortgage banking revenue increased $14.1 million as mortgage originations increased from $313.5 million in the third quarter of 2019 to $511.6 million in the third quarter of 2020, and the gain on sale margin increased 75 basis points. In addition, the unrealized gain from the change in fair value of secondary market derivatives increased $5.2 million. Gains on investment securities were $1.4 million during the third quarter of 2020, compared to $48 thousand during the third quarter of 2019.
Noninterest Expense
Noninterest expense for the third quarter of 2020 was $40.2 million, an increase of $480 thousand, or 1.2%, compared to the second quarter of 2020. The increase was due to increases of $1.5 million in compensation expense, $380 thousand in marketing and business development expense and $286 thousand in employee taxes and benefits, partially offset by decreases of $968 thousand in other noninterest expense and $428 thousand in supplies and postage expenses. The increase in compensation expense was primarily driven by an increase in mortgage originations. Marketing and business development expense increased due to seasonally higher advertising expenses. Other noninterest expense decreased primarily due to a $990 thousand decrease in the provision for unused commitments. Supplies and postage expenses decreased due to the transition from paper statements to E-statements for the retirement and benefit services segment.
Compared to the third quarter of 2019, noninterest expense for the third quarter of 2020 increased $2.9 million, or 7.7%, from $37.3 million. The increase was attributable to increases of $2.7 million in compensation expense, $480 thousand in mortgage and lending expense, and $433 thousand in employee taxes and benefits, partially offset by decreases of $409 thousand in travel expense and $384 thousand in supplies and postage expense. The increases in compensation expense and mortgage and lending expense were primarily the result of higher mortgage originations.
Financial Condition
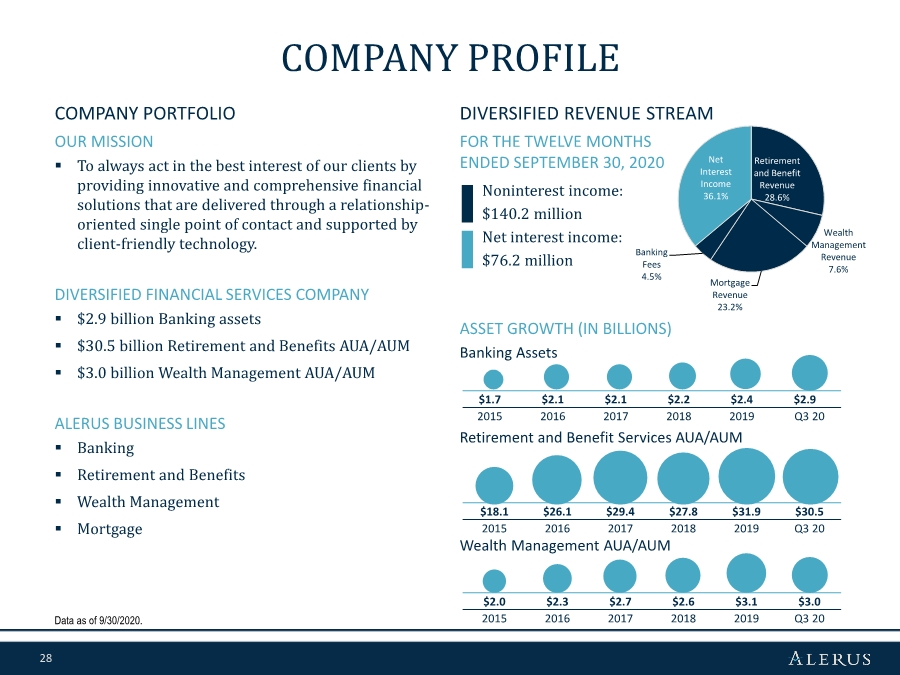
Total assets were $2.9 billion as of September 30, 2020, an increase of $541.9 million, or 23.0%, from December 31, 2019. The increase in total assets included increases of $337.1 million in loans, $185.1 million in available-for-sale investment securities, $64.5 million in loans held for sale, and $15.3 million in other assets.
Loans
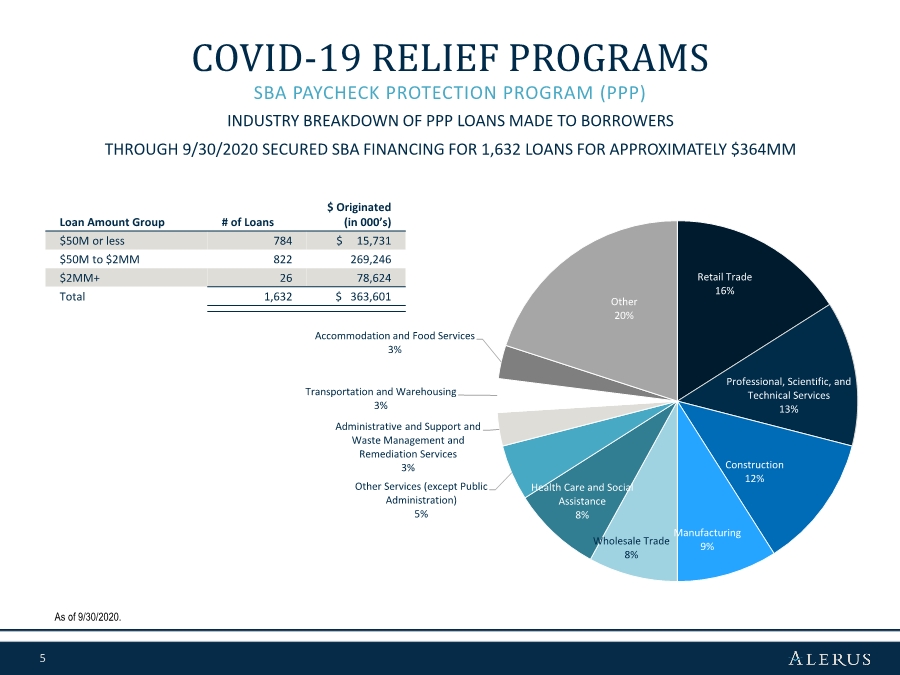
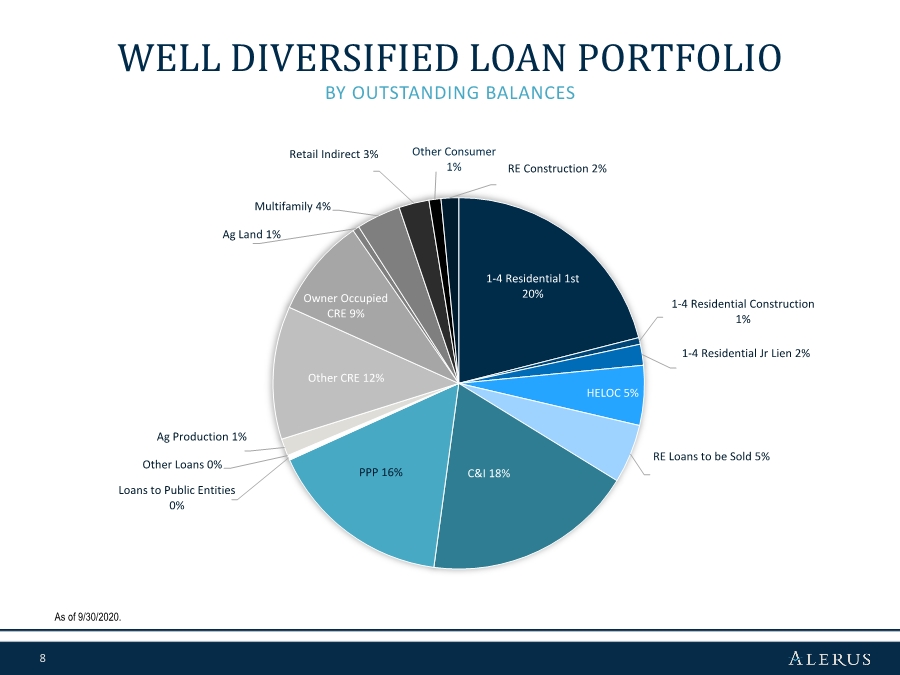
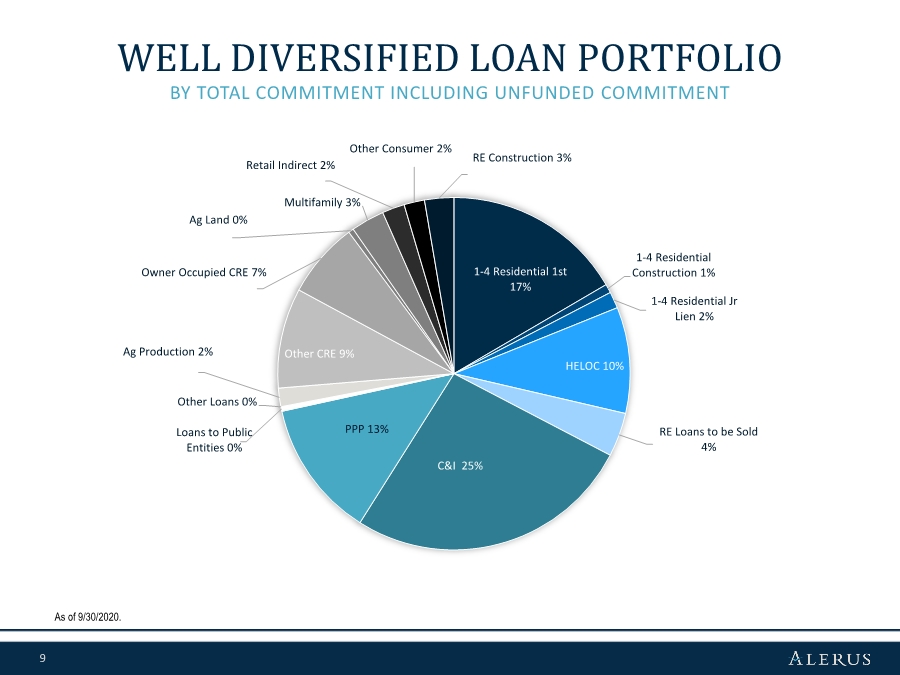
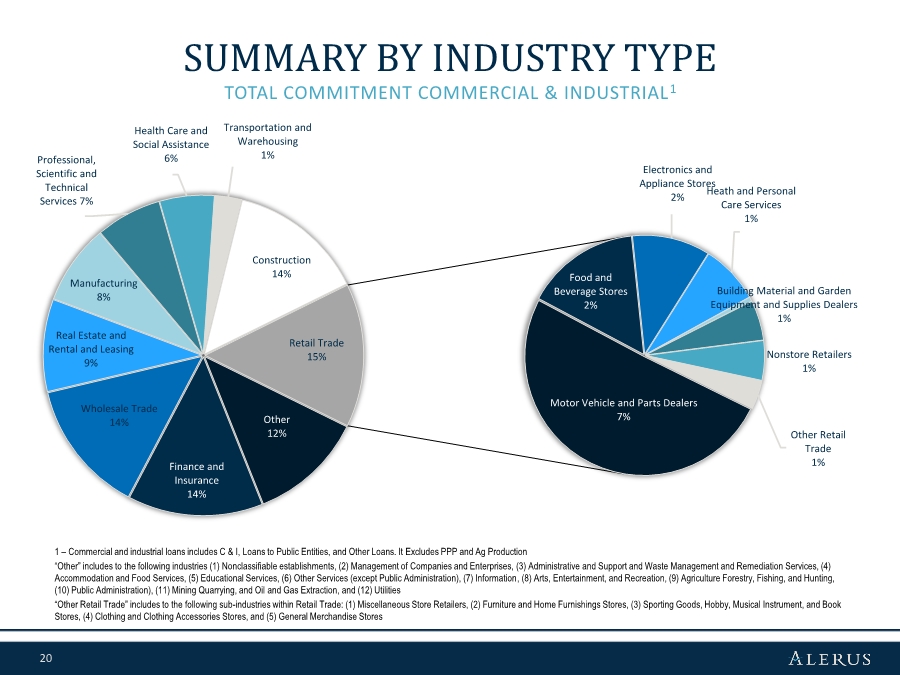
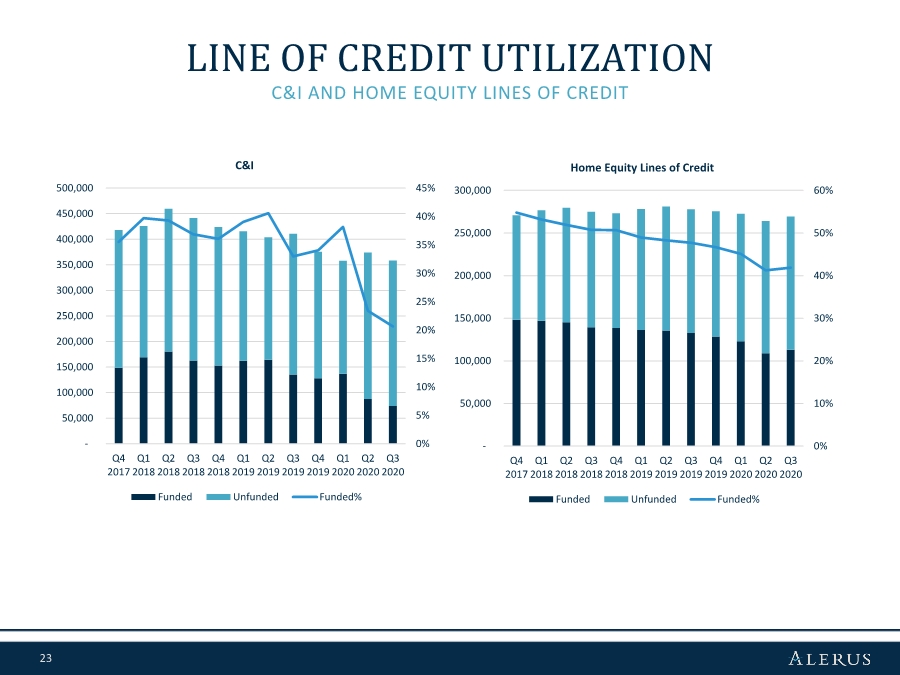
Total loans were $2.06 billion as of September 30, 2020, an increase of $337.1 million, or 19.6%, from December 31, 2019. The increase was primarily due to increases of $309.9 million in commercial and industrial loans and $40.5 million in our commercial real estate loan portfolio, partially offset by a $20.1 million decrease in our consumer loan portfolio. The increase in commercial and industrial loans was due to an increase of $348.9 million in net PPP loans, offset by a 7.64% decrease in operating line utilization, or a $64.6 million decrease in funded balances.
3
The following table presents the composition of our loan portfolio as of the dates indicated:
| | | | | | | | | | | |||||
| | September 30, | | June 30, | | March 31, | | December 31, | | September 30, | |||||
(dollars in thousands) |
| 2020 | | 2020 | | 2020 | | 2019 | | 2019 | |||||
Commercial |
| |
|
| |
|
| |
|
| |
|
| |
|
Commercial and industrial (1) | | $ | 789,036 | | $ | 794,204 | | $ | 502,637 | | $ | 479,144 | | $ | 485,183 |
Real estate construction | |
| 33,169 | |
| 31,344 | |
| 25,487 | |
| 26,378 | |
| 21,674 |
Commercial real estate | |
| 535,216 | |
| 519,104 | |
| 522,106 | |
| 494,703 | |
| 444,600 |
Total commercial | |
| 1,357,421 | |
| 1,344,652 | |
| 1,050,230 | |
| 1,000,225 | |
| 951,457 |
Consumer | |
|
| |
|
| |
|
| |
|
| |
|
|
Residential real estate first mortgage | |
| 469,050 | |
| 456,737 | |
| 457,895 | |
| 457,155 | |
| 459,763 |
Residential real estate junior lien | |
| 152,487 | |
| 154,351 | |
| 170,538 | |
| 177,373 | |
| 182,516 |
Other revolving and installment | |
| 79,461 | |
| 78,457 | |
| 79,614 | |
| 86,526 | |
| 92,351 |
Total consumer | |
| 700,998 | |
| 689,545 | |
| 708,047 | |
| 721,054 | |
| 734,630 |
Total loans | | $ | 2,058,419 | | $ | 2,034,197 | | $ | 1,758,277 | | $ | 1,721,279 | | $ | 1,686,087 |
| (1) | Includes PPP loans of $348.9 million at September 30, 2020 and $347.3 million at June 30, 2020. |
Deposits
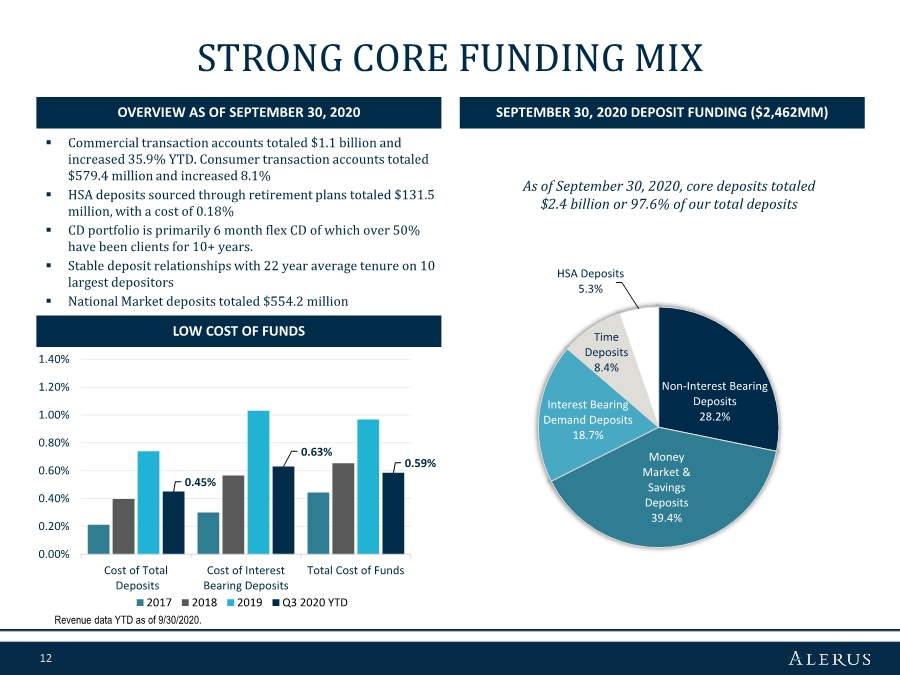
Total deposits were $2.46 billion as of September 30, 2020, an increase of $491.1 million, or 24.9%, from December 31, 2019. Interest-bearing deposits increased $375.3 million while non-interest bearing deposits increased $115.7 million. Key drivers of the increase in deposits included deposits from new and existing PPP loan clients, inflows from government stimulus programs and higher depositor balances due to the uncertain economic environment and financial markets. The increase in interest-bearing deposits included a $128.8 million increase in synergistic deposits from our retirement and benefit services and wealth management segments. In addition, health savings account deposits were $131.5 million as of September 30, 2020, an increase of $11.8 million, or 9.9%, from December 31, 2019. Commercial transaction deposits increased $292.6 million, or 35.9%, while consumer transaction deposits increased $43.3 million, or 8.1%, since December 31, 2019. Noninterest-bearing deposits as a percentage of total deposits were 28.2% and 29.3% as of September 30, 2020 and December 31, 2019, respectively.
The following table presents the composition of our deposit portfolio as of the dates indicated:
| | September 30, | | June 30, | | March 31, | | December 31, | | September 30, | |||||
(dollars in thousands) |
| 2020 |
| 2020 |
| 2020 |
| 2019 |
| 2019 | |||||
Noninterest-bearing demand | | $ | 693,450 | | $ | 700,892 | | $ | 608,559 | | $ | 577,704 | | $ | 537,951 |
Interest-bearing | |
|
| |
|
| |
|
| |
|
| |
|
|
Interest-bearing demand | |
| 590,366 | |
| 579,840 | |
| 477,752 | |
| 458,689 | |
| 424,249 |
Savings accounts | |
| 78,659 | |
| 75,973 | |
| 60,181 | |
| 55,777 | |
| 55,513 |
Money market savings | |
| 892,473 | |
| 892,717 | |
| 773,652 | |
| 683,064 | |
| 622,647 |
Time deposits | |
| 207,422 | |
| 203,731 | |
| 201,370 | |
| 196,082 | |
| 192,753 |
Total interest-bearing | |
| 1,768,920 | |
| 1,752,261 | |
| 1,512,955 | |
| 1,393,612 | |
| 1,295,162 |
Total deposits | | $ | 2,462,370 | | $ | 2,453,153 | | $ | 2,121,514 | | $ | 1,971,316 | | $ | 1,833,113 |
Asset Quality
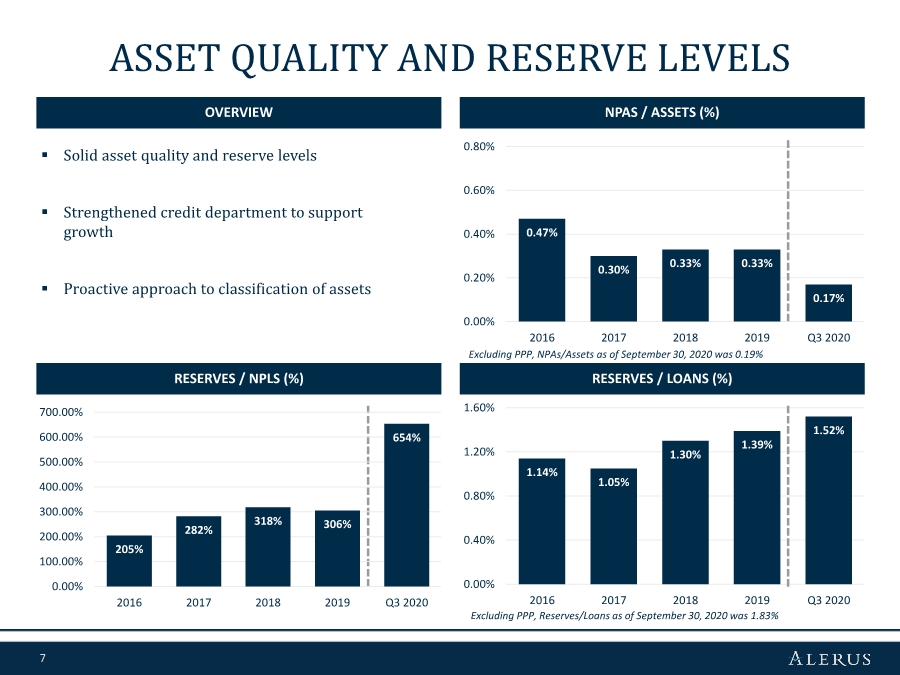
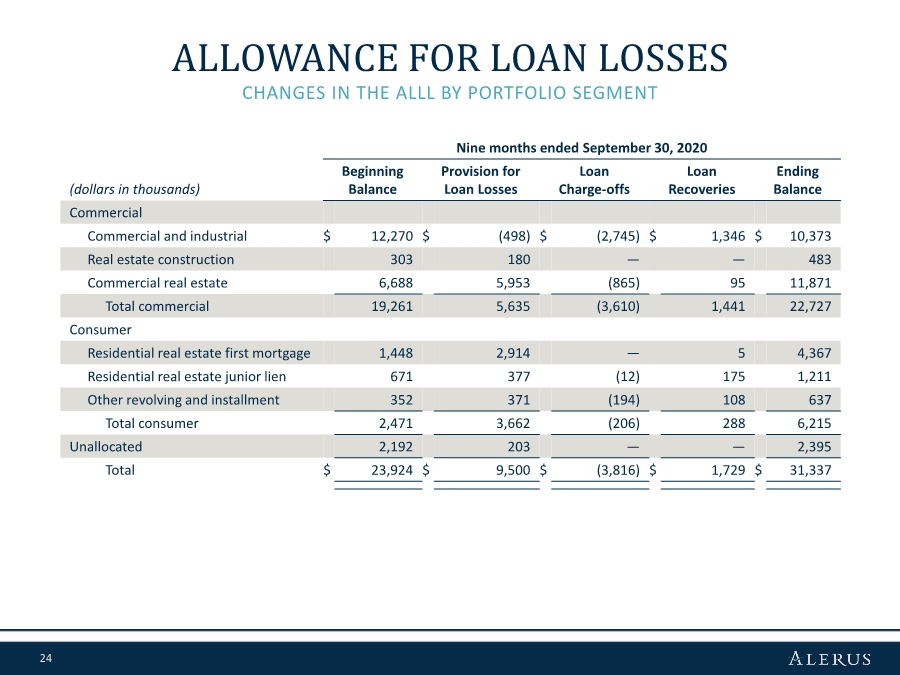
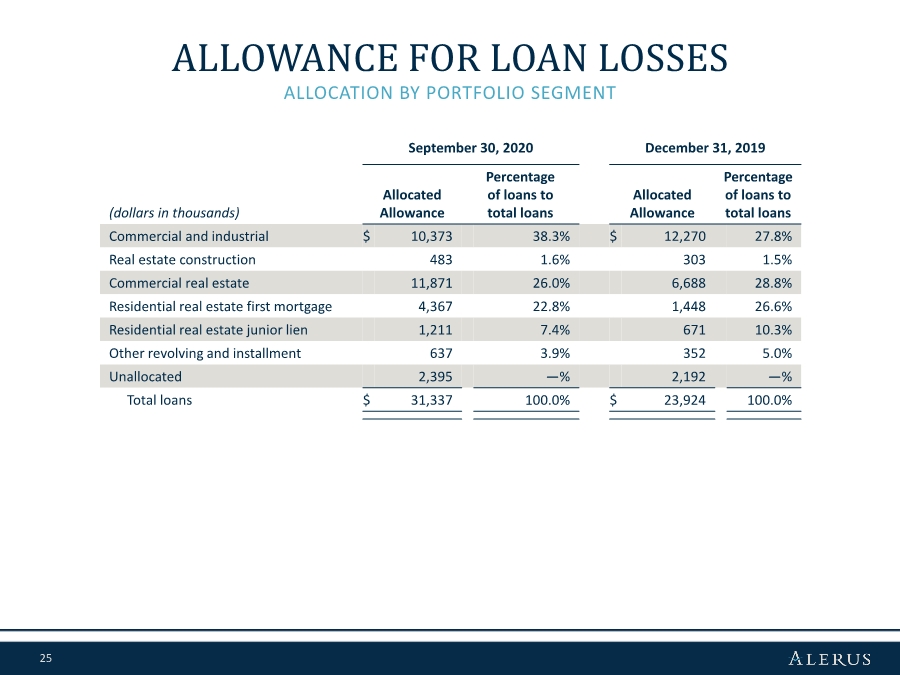
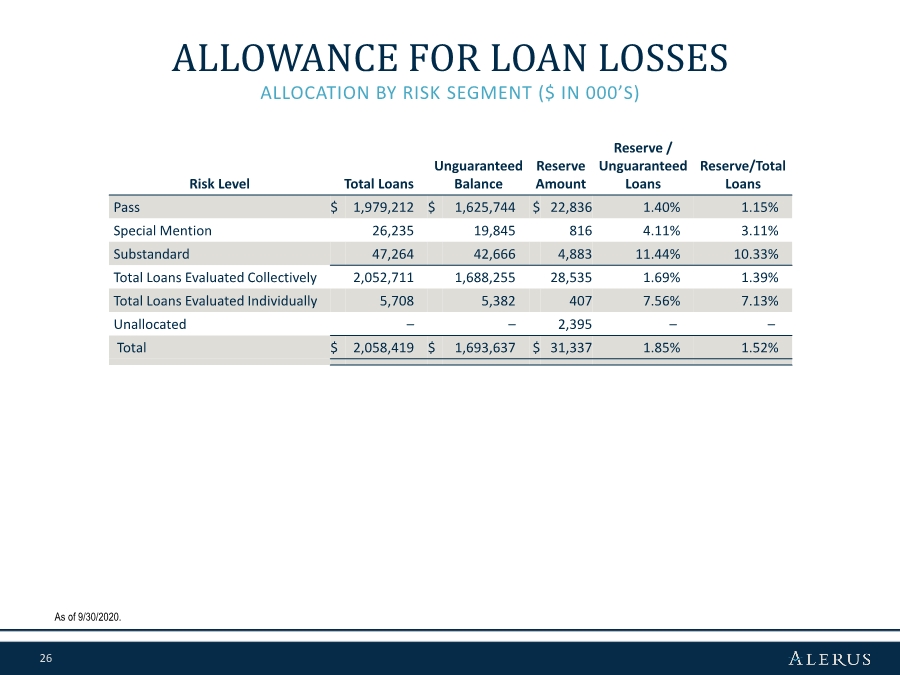
Total nonperforming assets were $5.0 million as of September 30, 2020, a decrease of $3.0 million, or 38.7%, from December 31, 2019. As of September 30, 2020, the allowance for loan losses was $31.3 million, or 1.52% of total loans, compared to $23.9 million, or 1.39% of total loans, as of December 31, 2019. Excluding PPP loans, the ratio of allowance for loan losses to total loans increased 44 basis points to 1.83% as of September 30, 2020, compared to 1.39% as of December 31, 2019.
4
The following table presents selected asset quality data as of and for the periods indicated:
| | As of and for the three months ended | | |||||||||||||
| | September 30, | | June 30, | | March 31, | | December 31, | | September 30, | | |||||
(dollars in thousands) |
| 2020 |
| 2020 |
| 2020 |
| 2019 |
| 2019 |
| |||||
Nonaccrual loans | | $ | 4,795 | | $ | 5,328 | | $ | 6,959 | | $ | 7,379 | | $ | 5,107 | |
Accruing loans 90+ days past due | |
| — | |
| — | | | 11 | |
| 448 | |
| 45 | |
Total nonperforming loans | |
| 4,795 | |
| 5,328 | |
| 6,970 | |
| 7,827 | |
| 5,152 | |
OREO and repossessed assets | |
| 10 | |
| 26 | |
| 209 | |
| 8 | |
| 84 | |
Total nonperforming assets | | $ | 4,805 | | $ | 5,354 | | $ | 7,179 | | $ | 7,835 | | $ | 5,236 | |
Net charge-offs/(recoveries) | | | (581) | | | 3,264 | | | (595) | | | 857 | | | (240) | |
Net charge-offs/(recoveries) to average loans | | | (0.11) | % | | 0.66 | % | | (0.14) | % | | 0.20 | % | | (0.06) | % |
Nonperforming loans to total loans | | | 0.23 | % | | 0.26 | % | | 0.40 | % | | 0.45 | % | | 0.31 | % |
Nonperforming assets to total assets | | | 0.17 | % | | 0.19 | % | | 0.29 | % | | 0.33 | % | | 0.23 | % |
Allowance for loan losses to total loans | | | 1.52 | % | | 1.34 | % | | 1.54 | % | | 1.39 | % | | 1.36 | % |
Allowance for loan losses to nonperforming loans | | | 654 | % | | 512 | % | | 388 | % | | 306 | % | | 446 | % |
For the third quarter of 2020, we had net recoveries of $581 thousand compared to net charge-offs of $3.3 million for the second quarter of 2020 and $240 thousand of net recoveries for the third quarter of 2019.
The provision for loan losses for the third quarter of 2020 was $3.5 million, which was the same amount as the second quarter of 2020 and an increase of $2.0 million from the third quarter of 2019. The increase in provision expense was due to allocations of reserves for the economic uncertainties related to COVID-19, which increased the allowance for loan losses balance by $7.4 million to $31.3 million at September 30, 2020, a 31.0% increase from December 31, 2019.
The ratio of nonperforming loans to total loans at September 30, 2020 was 0.23%, and if PPP loans were excluded, this ratio would have been 0.28%. Nonperforming assets as a percentage of total assets was 0.17% at September 30, 2020. Excluding PPP loans, nonperforming assets as a percentage of total assets would have been 0.19% at September 30, 2020.
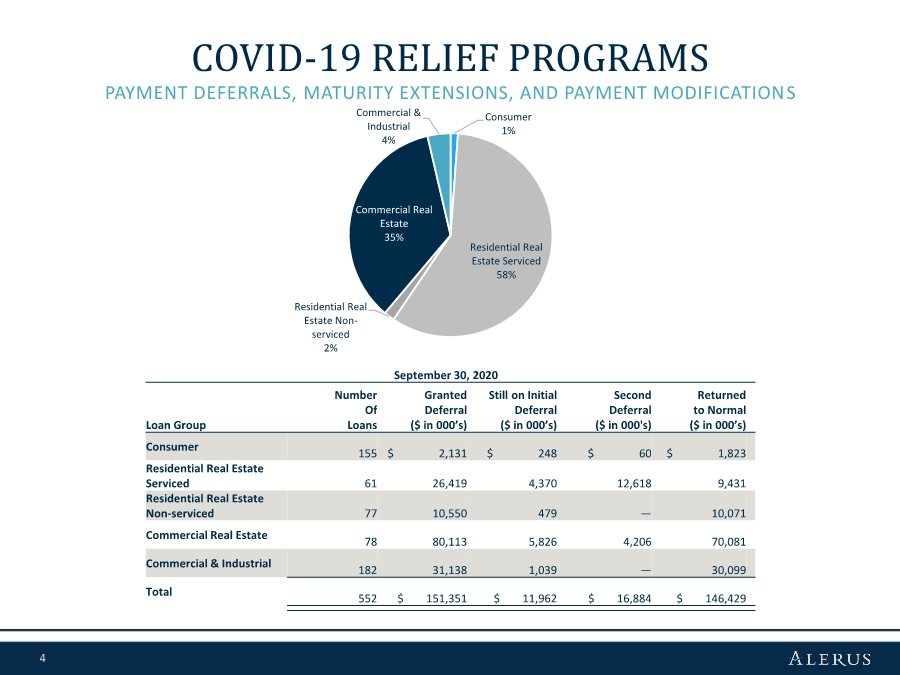
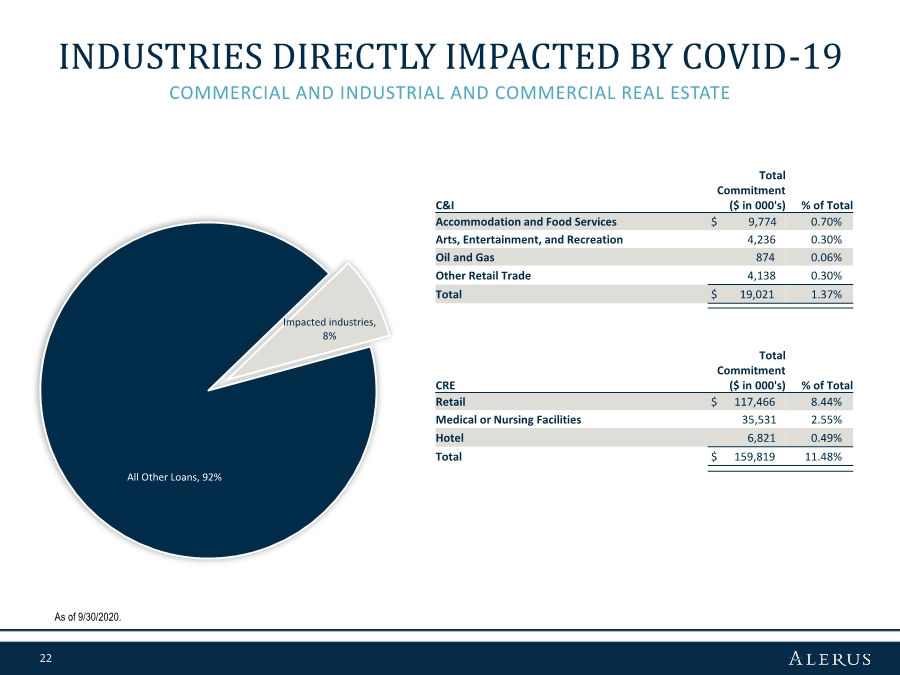
As of September 30, 2020, we had entered into principal and interest deferrals of 552 loans representing $151.4 million in principal balances, since the beginning of the pandemic. Of those loans, 27 loans with a total outstanding principal balance of $16.9 million, have been granted second deferrals, 56 loans with a total outstanding principal balance of $12.0 million remain on the first deferral and the remaining loans have been returned to a normal payment status. All of these loan modifications were accounted for in accordance with the Interagency Statement on Loan Modifications and Reporting for Financial Institutions as issued on April 7, 2020, or have been evaluated under existing accounting policies, and are not considered troubled debt restructurings.
Capital
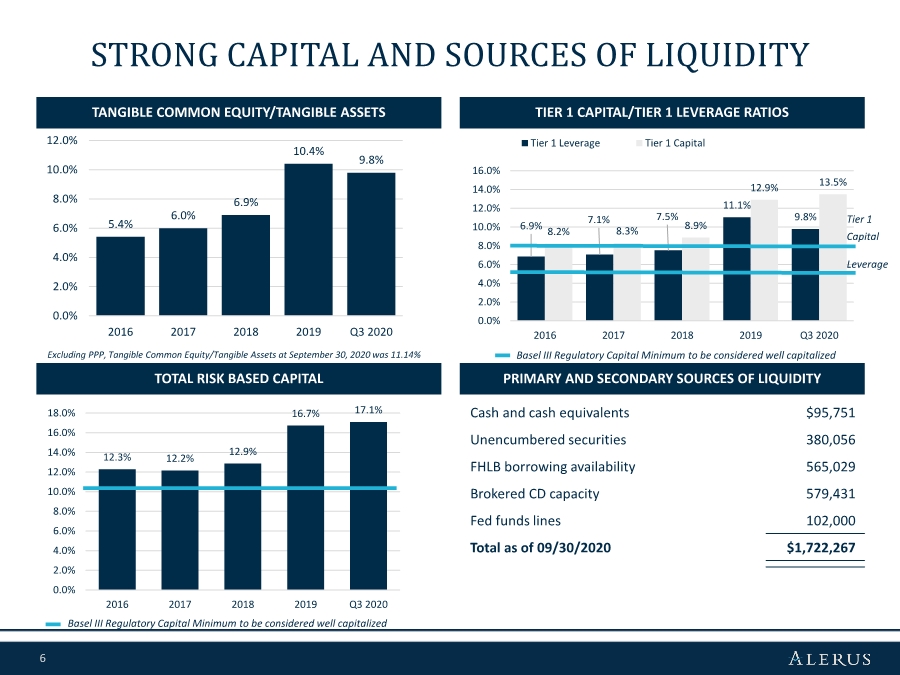
Total stockholders’ equity was $322.0 million as of September 30, 2020, an increase of $36.3 million from December 31, 2019. The tangible book value per common share increased to $16.31 as of September 30, 2020, from $14.08 as of December 31, 2019. Tangible common equity to tangible assets, a non-GAAP financial measure, decreased to 9.78% as of September 30, 2020, from 10.38% as of December 31, 2019. Tangible common equity to tangible assets would have been 11.14% as of September 30, 2020, if PPP loans were excluded.
5
The following table presents our capital ratios as of the dates indicated:
|
| September 30, |
| December 31, |
| September 30, | | |||
|
| 2020 |
| 2019 |
| 2019 | | |||
Capital Ratios(1) | | | | | | | | | | |
Alerus Financial Corporation | | | | | | | | | | |
Common equity tier 1 capital to risk weighted assets | | | 13.08 | % | | 12.48 | % | | 12.38 | % |
Tier 1 capital to risk weighted assets | | | 13.48 | % | | 12.90 | % | | 12.81 | % |
Total capital to risk weighted assets | | | 17.13 | % | | 16.73 | % | | 16.67 | % |
Tier 1 capital to average assets | | | 9.76 | % | | 11.05 | % | | 11.33 | % |
Tangible common equity / tangible assets (2) | |
| 9.78 | % |
| 10.38 | % |
| 10.76 | % |
| | | | | | | | | | |
Alerus Financial, N.A. | | | | | | | | | | |
Common equity tier 1 capital to risk weighted assets | | | 12.47 | % | | 11.91 | % | | 11.84 | % |
Tier 1 capital to risk weighted assets | | | 12.47 | % | | 11.91 | % | | 11.84 | % |
Total capital to risk weighted assets | | | 13.72 | % | | 13.15 | % | | 13.06 | % |
Tier 1 capital to average assets | | | 9.03 | % | | 10.20 | % | | 10.47 | % |
| (1) | Capital ratios for the current quarter are to be considered preliminary until the Call Report for Alerus Financial, N.A. is filed. |
| (2) | Represents a non-GAAP financial measure. See “Non-GAAP to GAAP Reconciliations and Calculation of Non-GAAP Financial Measures.” |
Conference Call
The Company will host a conference call at 9:00 a.m. Central Time on Thursday, October 29, 2020, to discuss its financial results. The call can be accessed via telephone at (888) 317-6016. A recording of the call and transcript will be available on the Company’s investor relations website at investors.alerus.com following the call.
About Alerus Financial Corporation
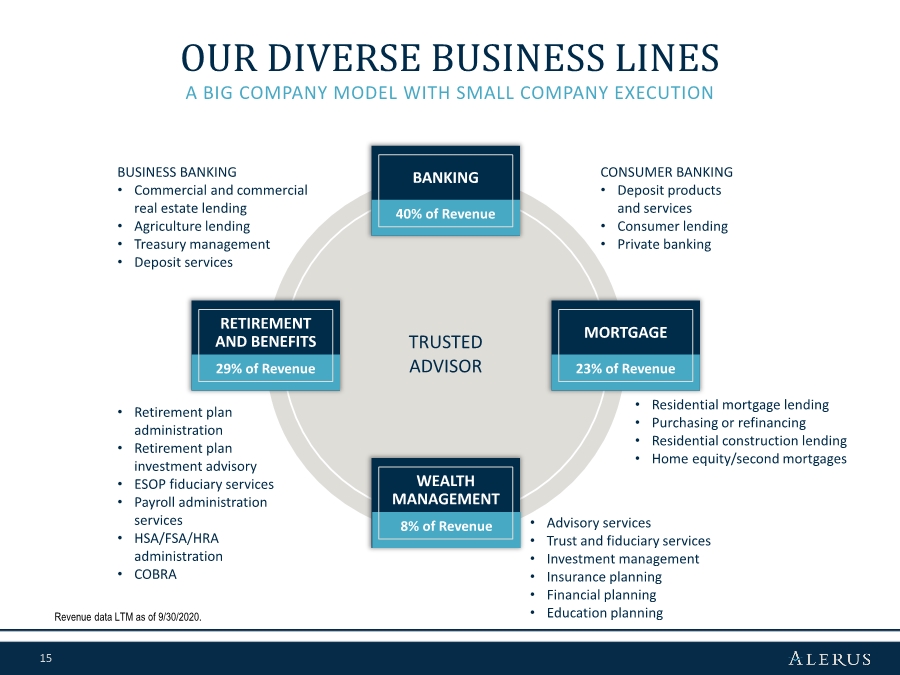
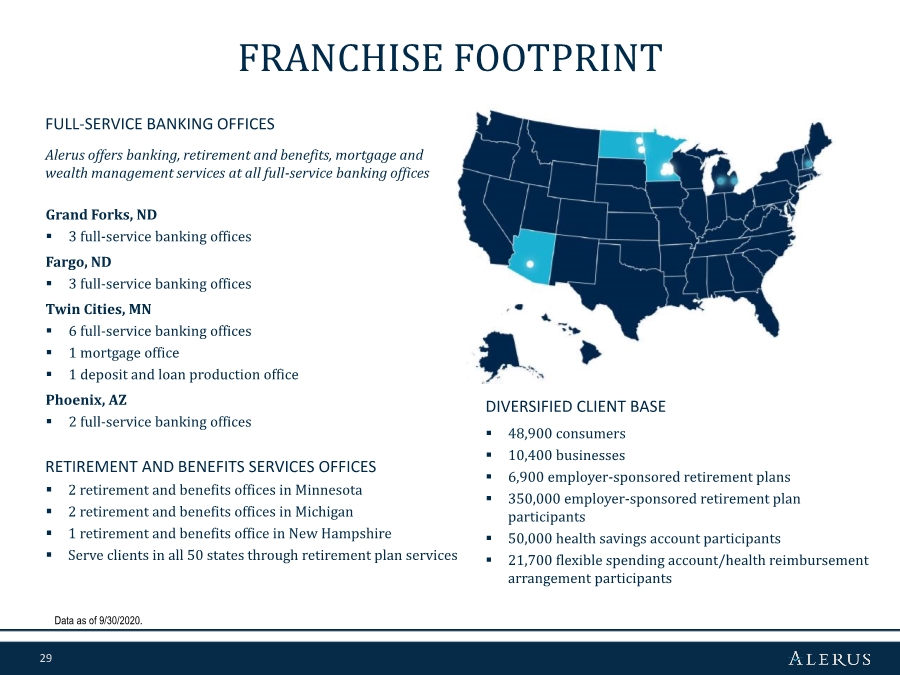
Alerus Financial Corporation is a diversified financial services company headquartered in Grand Forks, ND. Through its subsidiary, Alerus Financial, N.A., Alerus provides innovative and comprehensive financial solutions to businesses and consumers through four distinct business segments—banking, retirement and benefit services, wealth management, and mortgage. These solutions are delivered through a relationship-oriented primary point of contact along with responsive and client-friendly technology. Alerus Financial banking and wealth management offices are located in Grand Forks and Fargo, ND, the Minneapolis-St. Paul, MN metropolitan area and Scottsdale and Mesa, AZ. Alerus Retirement and Benefits plan administration offices are located in St. Paul and Albert Lea, MN, East Lansing and Troy, MI, and Bedford, NH.
Non-GAAP Financial Measures
Some of the financial measures included in this press release are not measures of financial performance recognized by U.S. Generally Accepted Accounting Principles, or GAAP. These non-GAAP financial measures include the ratio of tangible common equity to tangible assets, tangible common equity per share, return on average tangible common equity, net interest margin (tax-equivalent), and the efficiency ratio. Management uses these non-GAAP financial measures in its analysis of its performance, and believes financial analysts and investors frequently use these measures, and other similar measures, to evaluate capital adequacy. Reconciliations of non-GAAP disclosures used in this press release to the comparable GAAP measures are provided in the accompanying tables. Management, banking regulators, many financial analysts and other investors use these measures in conjunction with more traditional bank capital ratios to compare the capital adequacy of banking organizations with significant amounts of goodwill or other intangible assets, which typically stem from the use of the purchase accounting method of accounting for mergers and acquisitions.
These non-GAAP financial measures should not be considered in isolation or as a substitute for total stockholders’ equity, total assets, book value per share, return on average assets, return on average equity, or any other measure calculated in accordance with GAAP. Moreover, the manner in which we calculate these non-GAAP financial measures may differ from that of other companies reporting measures with similar names.
Forward-Looking Statements
This press release contains “forward-looking statements” within the meaning of the safe harbor provisions of the U.S. Private Securities Litigation Reform Act of 1995. Forward-looking statements include, without limitation, statements concerning plans, estimates, calculations, forecasts and projections with respect to the anticipated future performance of Alerus Financial Corporation. These statements are often, but not always, identified by words such as “may”, “might”, “should”, “could”, “predict”, “potential”,
6
“believe”, “expect”, “continue”, “will”, “anticipate”, “seek”, “estimate”, “intend”, “plan”, “projection”, “would”, “annualized”, “target” and “outlook”, or the negative version of those words or other comparable words of a future or forward-looking nature. Examples of forward-looking statements include, among others, statements we make regarding our projected growth, anticipated future financial performance, financial condition, credit quality, management’s long-term performance goals and the future plans and prospects of Alerus Financial Corporation.
Forward-looking statements are neither historical facts nor assurances of future performance. Instead, they are based only on our current beliefs, expectations and assumptions regarding the future of our business, future plans and strategies, projections, anticipated events and trends, the economy and other future conditions. Because forward-looking statements relate to the future, they are subject to inherent uncertainties, risks and changes in circumstances that are difficult to predict and many of which are outside of our control. Our actual results and financial condition may differ materially from those indicated in the forward-looking statements. Therefore, you should not rely on any of these forward-looking statements. Important factors that could cause our actual results and financial condition to differ materially from those indicated in the forward-looking statements include, among others, the following: the effects of the COVID-19 pandemic, including its effects on the economic environment, our clients, and our operations, as well as any changes to federal, state, or local government laws, regulations, or orders in response to the pandemic; our ability to successfully manage credit risk and maintain an adequate level of allowance for loan losses; new or revised accounting standards, including as a result of the implementation of the new Current Expected Credit Loss Standard; business and economic conditions generally and in the financial services industry, nationally and within our market areas; the overall health of the local and national real estate market; concentrations within our loan portfolio; the level of nonperforming assets on our balance sheet; our ability to implement our organic and acquisition growth strategies; the impact of economic or market conditions on our fee-based services; our ability to continue to grow our retirement and benefit services business; our ability to continue to originate a sufficient volume of residential mortgages; the occurrence of fraudulent activity, breaches or failures of our information security controls or cybersecurity-related incidents; interruptions involving our information technology and telecommunications systems or third-party servicers; potential losses incurred in connection with mortgage loan repurchases; the composition of our executive management team and our ability to attract and retain key personnel; rapid technological change in the financial services industry; increased competition in the financial services industry; our ability to successfully manage liquidity risk; the effectiveness of our risk management framework; the commencement and outcome of litigation and other legal proceedings and regulatory actions against us or to which we may become subject; potential impairment to the goodwill we recorded in connection with our past acquisitions; the extensive regulatory framework that applies to us; the impact of recent and future legislative and regulatory changes; interest rate risks associated with our business; fluctuations in the values of the securities held in our securities portfolio; governmental monetary, trade and fiscal policies; severe weather, natural disasters, widespread disease or pandemics, such as the COVID-19 global pandemic, acts of war or terrorism or other adverse external events; any material weaknesses in our internal control over financial reporting; developments and uncertainty related to the future use and availability of some reference rates, such as the London Interbank Offered Rate, as well as other alternative rates; our success at managing the risks involved in the foregoing items; and any other risks described in the “Risk Factors” sections of the reports filed by Alerus Financial Corporation with the Securities and Exchange Commission.
Any forward-looking statement made by us in this press release is based only on information currently available to us and speaks only as of the date on which it is made. We undertake no obligation to publicly update any forward-looking statement, whether written or oral, that may be made from time to time, whether as a result of new information, future developments or otherwise.
7
Alerus Financial Corporation and Subsidiaries
Consolidated Balance Sheets
(dollars and shares in thousands, except per share data)
|
| September 30, |
| December 31, | ||
|
| 2020 |
| 2019 | ||
Assets |
| (Unaudited) |
| (Audited) | ||
Cash and cash equivalents | | $ | 95,751 | | $ | 144,006 |
Investment securities, at fair value | |
|
| |
|
|
Available-for-sale | |
| 495,414 | |
| 310,350 |
Equity | |
| — | |
| 2,808 |
Loans held for sale | |
| 111,311 | |
| 46,846 |
Loans | |
| 2,058,419 | |
| 1,721,279 |
Allowance for loan losses | |
| (31,337) | |
| (23,924) |
Net loans | |
| 2,027,082 | |
| 1,697,355 |
Land, premises and equipment, net | |
| 20,493 | |
| 20,629 |
Operating lease right-of-use assets | |
| 8,168 | |
| 8,343 |
Accrued interest receivable | |
| 9,199 | |
| 7,551 |
Bank-owned life insurance | |
| 32,161 | |
| 31,566 |
Goodwill | |
| 27,329 | |
| 27,329 |
Other intangible assets | |
| 15,421 | |
| 18,391 |
Servicing rights | |
| 2,579 | |
| 3,845 |
Deferred income taxes, net | |
| 8,628 | |
| 7,891 |
Other assets | |
| 45,273 | |
| 29,968 |
Total assets | | $ | 2,898,809 | | $ | 2,356,878 |
Liabilities and Stockholders’ Equity | |
|
| |
|
|
Deposits | |
|
| |
|
|
Noninterest-bearing | | $ | 693,450 | | $ | 577,704 |
Interest-bearing | |
| 1,768,920 | |
| 1,393,612 |
Total deposits | |
| 2,462,370 | |
| 1,971,316 |
Long-term debt | |
| 58,745 | |
| 58,769 |
Operating lease liabilities | |
| 8,671 | |
| 8,864 |
Accrued expenses and other liabilities | |
| 47,020 | |
| 32,201 |
Total liabilities | |
| 2,576,806 | |
| 2,071,150 |
Stockholders’ equity | |
|
| |
|
|
Preferred stock, $1 par value, 2,000,000 shares authorized: 0 issued and outstanding | | | — | | | — |
Common stock, $1 par value, 30,000,000 shares authorized: 17,121,863 and 17,049,551 issued and outstanding | |
| 17,122 | |
| 17,050 |
Additional paid-in capital | |
| 89,757 | |
| 88,650 |
Retained earnings | |
| 204,581 | |
| 178,092 |
Accumulated other comprehensive income (loss) | |
| 10,543 | |
| 1,936 |
Total stockholders’ equity | |
| 322,003 | |
| 285,728 |
Total liabilities and stockholders’ equity | | $ | 2,898,809 | | $ | 2,356,878 |
8
Alerus Financial Corporation and Subsidiaries
Consolidated Statements of Income
(dollars and shares in thousands, except per share data)
| | Three months ended | | Nine months ended | |||||||||||
| | September 30, | | June 30, | | September 30, | | September 30, | | September 30, | |||||
|
| 2020 |
| 2020 |
| 2019 |
| 2020 |
| 2019 | |||||
Interest Income | | (Unaudited) | | (Unaudited) | | (Unaudited) | | (Unaudited) | | (Unaudited) | |||||
Loans, including fees | | $ | 21,962 | | $ | 21,372 | | $ | 21,886 | | $ | 63,876 | | $ | 65,171 |
Investment securities | |
|
| |
|
| |
|
| |
|
| |
|
|
Taxable | |
| 1,973 | |
| 1,765 | |
| 1,374 | |
| 5,497 | |
| 4,021 |
Exempt from federal income taxes | |
| 238 | |
| 239 | |
| 163 | |
| 712 | |
| 618 |
Other | |
| 116 | |
| 130 | |
| 202 | |
| 816 | |
| 603 |
Total interest income | |
| 24,289 | |
| 23,506 | |
| 23,625 | |
| 70,901 | |
| 70,413 |
Interest Expense | |
|
| |
|
| |
|
| |
|
| |
|
|
Deposits | |
| 1,683 | |
| 2,558 | |
| 3,506 | |
| 7,633 | |
| 9,802 |
Short-term borrowings | |
| — | |
| — | |
| 539 | |
| — | |
| 1,805 |
Long-term debt | |
| 841 | |
| 857 | |
| 899 | |
| 2,575 | |
| 2,714 |
Total interest expense | |
| 2,524 | |
| 3,415 | |
| 4,944 | |
| 10,208 | |
| 14,321 |
Net interest income | |
| 21,765 | |
| 20,091 | |
| 18,681 | |
| 60,693 | |
| 56,092 |
Provision for loan losses | |
| 3,500 | |
| 3,500 | |
| 1,498 | |
| 9,500 | |
| 5,515 |
Net interest income after provision for loan losses | |
| 18,265 | |
| 16,591 | |
| 17,183 | |
| 51,193 | |
| 50,577 |
Noninterest Income | |
|
| |
|
| |
|
| |
|
| |
|
|
Retirement and benefit services | |
| 15,104 | |
| 13,710 | |
| 15,307 | |
| 45,034 | |
| 46,142 |
Wealth management | |
| 4,486 | |
| 4,112 | |
| 3,896 | |
| 12,644 | |
| 11,385 |
Mortgage banking | |
| 22,269 | |
| 17,546 | |
| 8,135 | |
| 44,860 | |
| 19,739 |
Service charges on deposit accounts | |
| 355 | |
| 297 | |
| 447 | |
| 1,075 | |
| 1,321 |
Net gains (losses) on investment securities | |
| 1,428 | |
| 1,294 | |
| 48 | |
| 2,722 | |
| 357 |
Other | |
| 1,614 | |
| 1,271 | |
| 1,747 | |
| 4,340 | |
| 5,694 |
Total noninterest income | |
| 45,256 | |
| 38,230 | |
| 29,580 | |
| 110,675 | |
| 84,638 |
Noninterest Expense | |
|
| |
|
| |
|
| |
|
| |
|
|
Compensation | |
| 22,740 | |
| 21,213 | |
| 20,041 | |
| 62,684 | |
| 54,997 |
Employee taxes and benefits | |
| 5,033 | |
| 4,747 | |
| 4,600 | |
| 15,088 | |
| 15,188 |
Occupancy and equipment expense | |
| 2,768 | |
| 2,869 | |
| 2,700 | |
| 8,392 | |
| 8,086 |
Business services, software and technology expense | |
| 4,420 | |
| 4,520 | |
| 4,224 | |
| 13,384 | |
| 12,044 |
Intangible amortization expense | |
| 990 | |
| 991 | |
| 990 | |
| 2,971 | |
| 3,091 |
Professional fees and assessments | |
| 1,031 | |
| 1,160 | |
| 1,051 | |
| 3,231 | |
| 3,146 |
Marketing and business development | |
| 929 | |
| 549 | |
| 890 | |
| 2,088 | |
| 2,024 |
Supplies and postage | |
| 247 | |
| 675 | |
| 631 | |
| 1,625 | |
| 2,027 |
Travel | |
| 26 | |
| 51 | |
| 435 | |
| 338 | |
| 1,335 |
Mortgage and lending expenses | |
| 1,231 | |
| 1,192 | |
| 751 | |
| 3,466 | |
| 1,966 |
Other | |
| 799 | |
| 1,767 | |
| 1,014 | |
| 3,407 | |
| 2,198 |
Total noninterest expense | |
| 40,214 | |
| 39,734 | |
| 37,327 | |
| 116,674 | |
| 106,102 |
Income before income taxes | |
| 23,307 | |
| 15,087 | |
| 9,436 | |
| 45,194 | |
| 29,113 |
Income tax expense | |
| 5,648 | |
| 3,613 | |
| 2,332 | |
| 10,698 | |
| 7,225 |
Net income | | $ | 17,659 | | $ | 11,474 | | $ | 7,104 | | $ | 34,496 | | $ | 21,888 |
Per Common Share Data | | | | | | | | | | | | | | | |
Earnings per common share | | $ | 1.01 | | $ | 0.66 | | $ | 0.49 | | $ | 1.98 | | $ | 1.53 |
Diluted earnings per common share | | $ | 0.99 | | $ | 0.65 | | $ | 0.48 | | $ | 1.94 | | $ | 1.49 |
Dividends declared per common share | | $ | 0.15 | | $ | 0.15 | | $ | 0.14 | | $ | 0.45 | | $ | 0.42 |
Average common shares outstanding | |
| 17,121 | |
| 17,111 | |
| 14,274 | |
| 17,101 | |
| 13,957 |
Diluted average common shares outstanding | |
| 17,453 | |
| 17,445 | |
| 14,626 | |
| 17,435 | |
| 14,317 |
9
Alerus Financial Corporation and Subsidiaries
Non-GAAP to GAAP Reconciliations and Calculation of Non-GAAP Financial Measures (unaudited)
(dollars and shares in thousands, except per share data)
|
| September 30, | | June 30, | | December 31, | | September 30, | | ||||
|
| 2020 |
| 2020 |
| 2019 |
| 2019 | | ||||
Tangible Common Equity to Tangible Assets |
| | | | | | | | | | | | |
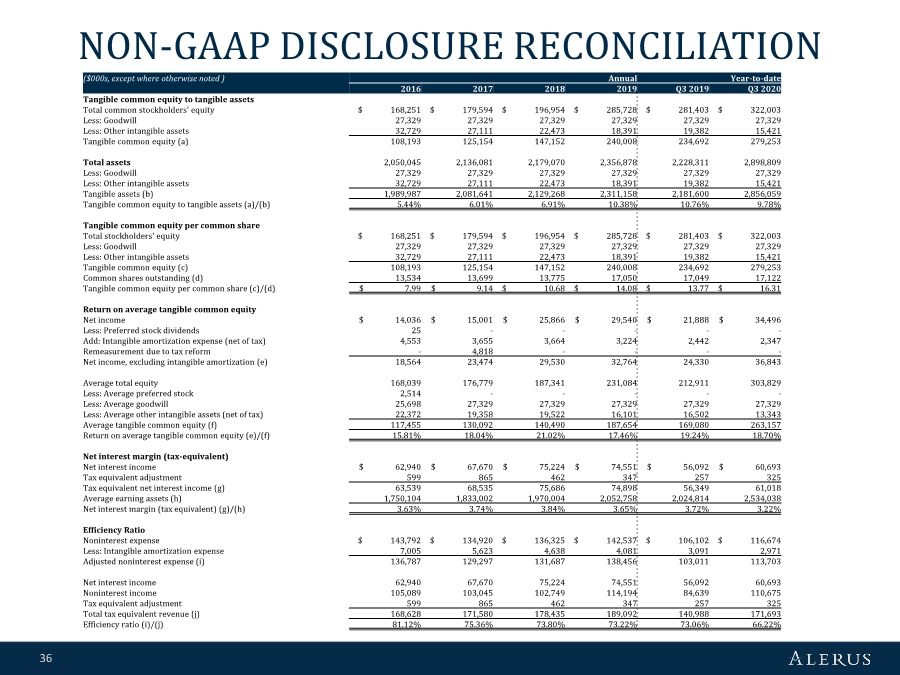
Total common stockholders’ equity | | $ | 322,003 | | $ | 305,732 | | $ | 285,728 | | $ | 281,403 | |
Less: Goodwill | |
| 27,329 | |
| 27,329 | |
| 27,329 | |
| 27,329 | |
Less: Other intangible assets | |
| 15,421 | |
| 16,411 | |
| 18,391 | |
| 19,382 | |
Tangible common equity (a) | |
| 279,253 | |
| 261,992 | |
| 240,008 | |
| 234,692 | |
Total assets | |
| 2,898,809 | |
| 2,875,457 | |
| 2,356,878 | |
| 2,228,311 | |
Less: Goodwill | |
| 27,329 | |
| 27,329 | |
| 27,329 | |
| 27,329 | |
Less: Other intangible assets | |
| 15,421 | |
| 16,411 | |
| 18,391 | |
| 19,382 | |
Tangible assets (b) | |
| 2,856,059 | |
| 2,831,717 | |
| 2,311,158 | |
| 2,181,600 | |
Tangible common equity to tangible assets (a)/(b) | |
| 9.78 | % |
| 9.25 | % |
| 10.38 | % |
| 10.76 | % |
Tangible Book Value Per Common Share | | | | | | | | | | | | | |
Total common stockholders’ equity | | $ | 322,003 | | $ | 305,732 | | $ | 285,728 | | $ | 281,403 | |
Less: Goodwill | |
| 27,329 | |
| 27,329 | |
| 27,329 | | | 27,329 | |
Less: Other intangible assets | |
| 15,421 | |
| 16,411 | |
| 18,391 | |
| 19,382 | |
Tangible common equity (c) | |
| 279,253 | |
| 261,992 | |
| 240,008 | |
| 234,692 | |
Total common shares issued and outstanding (d) | |
| 17,122 | |
| 17,120 | |
| 17,050 | |
| 17,049 | |
Tangible book value per common share (c)/(d) | | $ | 16.31 | | $ | 15.30 | | $ | 14.08 | | $ | 13.77 | |
| | Three months ended | | Nine months ended | | |||||||||||
| | September 30, | | June 30, | | September 30, | | September 30, | | September 30, | | |||||
| | 2020 |
| 2020 |
| 2019 | | 2020 |
| 2019 | | |||||
Return on Average Tangible Common Equity | | | | | | | | | | | | | | | | |
Net income | | $ | 17,659 | | $ | 11,474 | | $ | 7,104 | | $ | 34,496 | | $ | 21,888 | |
Add: Intangible amortization expense (net of tax) | |
| 782 | |
| 783 | |
| 782 | |
| 2,347 | |
| 2,442 | |
Net income, excluding intangible amortization (e) | |
| 18,441 | |
| 12,257 | |
| 7,886 | |
| 36,843 | |
| 24,330 | |
Average total equity | |
| 314,921 | |
| 301,719 | |
| 226,931 | |
| 303,825 | |
| 212,911 | |
Less: Average goodwill | |
| 27,329 | |
| 27,329 | |
| 27,329 | |
| 27,329 | |
| 27,329 | |
Less: Average other intangible assets (net of tax) | |
| 12,565 | |
| 13,345 | |
| 15,697 | |
| 13,343 | |
| 16,502 | |
Average tangible common equity (f) | |
| 275,027 | |
| 261,045 | |
| 183,905 | |
| 263,153 | |
| 169,080 | |
Return on average tangible common equity (e)/(f) | |
| 26.67 | % |
| 18.88 | % |
| 17.01 | % |
| 18.70 | % |
| 19.24 | % |
Net Interest Margin (tax-equivalent) | |
|
| |
|
| |
|
| |
|
| |
|
| |
Net interest income | | $ | 21,765 | | $ | 20,091 | | $ | 18,681 | | $ | 60,693 | | $ | 56,092 | |
Tax-equivalent adjustment | |
| 116 | |
| 109 | |
| 81 | |
| 325 | |
| 257 | |
Tax-equivalent net interest income (g) | |
| 21,881 | |
| 20,200 | |
| 18,762 | |
| 61,018 | |
| 56,349 | |
Average earning assets (h) | |
| 2,744,758 | |
| 2,584,037 | |
| 2,017,198 | |
| 2,534,038 | |
| 2,024,814 | |
Net interest margin (tax-equivalent) (g)/(h) | |
| 3.17 | % |
| 3.14 | % |
| 3.69 | % |
| 3.22 | % |
| 3.72 | % |
Efficiency Ratio | |
|
| |
|
| |
|
| |
|
| |
|
| |
Noninterest expense | | $ | 40,214 | | $ | 39,734 | | $ | 37,327 | | $ | 116,674 | | $ | 106,102 | |
Less: Intangible amortization expense | |
| 990 | |
| 991 | |
| 990 | |
| 2,971 | |
| 3,091 | |
Adjusted noninterest expense (i) | |
| 39,224 | |
| 38,743 | |
| 36,337 | |
| 113,703 | |
| 103,011 | |
Net interest income | |
| 21,765 | |
| 20,091 | |
| 18,681 | |
| 60,693 | |
| 56,092 | |
Noninterest income | |
| 45,256 | |
| 38,230 | |
| 29,580 | |
| 110,675 | |
| 84,638 | |
Tax-equivalent adjustment | |
| 116 | |
| 109 | |
| 81 | |
| 325 | |
| 257 | |
Total tax-equivalent revenue (j) | |
| 67,137 | |
| 58,430 | |
| 48,342 | |
| 171,693 | |
| 140,987 | |
Efficiency ratio (i)/(j) | |
| 58.42 | % |
| 66.31 | % |
| 75.17 | % |
| 66.22 | % |
| 73.06 | % |
10
Alerus Financial Corporation and Subsidiaries
Analysis of Average Balances, Yields, and Rates (unaudited)
(dollars in thousands)
| | Three months ended | | Nine months ended | ||||||||||||||||||||||||||
| | September 30, 2020 | | June 30, 2020 | | September 30, 2019 | | September 30, 2020 | | September 30, 2019 | ||||||||||||||||||||
| | | | | Average | | | | | Average | | | | | Average | | | | | Average | | | | | Average | |||||
| | Average | | Yield/ | | Average | | Yield/ | | Average | | Yield/ | | Average | | Yield/ | | Average | | Yield/ | ||||||||||
|
| Balance |
| Rate |
| Balance |
| Rate |
| Balance |
| Rate |
| Balance |
| Rate |
| Balance |
| Rate | ||||||||||
Interest Earning Assets | | | | | | | | | | | | | | | | | | | | | | | | | | | | | | |
Interest-bearing deposits with banks | | $ | 169,770 | | 0.12 | % | | $ | 153,197 | | 0.16 | % | | $ | 12,998 |
| 2.53 | % | | $ | 162,134 | | 0.51 | % | | $ | 12,910 | | 2.39 | % |
Investment securities (1) | |
| 443,705 | | 2.04 | % | |
| 369,247 | | 2.25 | % | |
| 257,561 |
| 2.43 | % | |
| 383,591 | | 2.23 | % | |
| 255,903 | | 2.51 | % |
Loans held for sale | |
| 90,634 | | 2.44 | % | |
| 69,606 | | 2.69 | % | |
| 45,794 |
| 3.11 | % | |
| 64,555 | | 2.64 | % | |
| 30,734 | | 3.24 | % |
Loans | |
|
| |
| | |
|
| |
| | |
|
|
|
| | |
|
| |
| | |
|
| |
| |
Commercial: | |
|
| |
| | |
|
| |
| | |
|
|
|
| | |
|
| |
| | |
|
| |
| |
Commercial and industrial | |
| 782,853 | | 4.34 | % | |
| 739,816 | | 4.12 | % | |
| 494,081 |
| 5.48 | % | |
| 667,742 | | 4.48 | % | |
| 509,806 | | 5.50 | % |
Real estate construction | |
| 32,747 | | 4.47 | % | |
| 31,660 | | 4.48 | % | |
| 25,137 |
| 5.56 | % | |
| 30,385 | | 4.64 | % | |
| 23,532 | | 5.54 | % |
Commercial real estate | |
| 525,514 | | 4.02 | % | |
| 513,497 | | 4.31 | % | |
| 439,751 |
| 5.29 | % | |
| 515,761 | | 4.31 | % | |
| 444,964 | | 5.04 | % |
Total commercial | |
| 1,341,114 | | 4.22 | % | |
| 1,284,973 | | 4.21 | % | |
| 958,969 |
| 5.40 | % | |
| 1,213,888 | | 4.41 | % | |
| 978,302 | | 5.29 | % |
Consumer | |
|
| |
| | |
|
| |
| | |
|
|
|
| | |
|
| |
| | |
|
| |
| |
Residential real estate first mortgage | |
| 460,995 | | 3.96 | % | |
| 459,789 | | 4.09 | % | |
| 454,971 |
| 4.18 | % | |
| 460,505 | | 4.05 | % | |
| 455,898 | | 4.25 | % |
Residential real estate junior lien | |
| 153,326 | | 4.54 | % | |
| 163,345 | | 4.79 | % | |
| 184,124 |
| 5.63 | % | |
| 163,332 | | 4.84 | % | |
| 186,744 | | 5.75 | % |
Other revolving and installment | |
| 79,343 | | 4.50 | % | |
| 77,921 | | 4.56 | % | |
| 93,478 |
| 4.74 | % | |
| 80,169 | | 4.58 | % | |
| 94,685 | | 4.64 | % |
Total consumer | |
| 693,664 | | 4.15 | % | |
| 701,055 | | 4.31 | % | |
| 732,573 |
| 4.61 | % | |
| 704,006 | | 4.30 | % | |
| 737,327 | | 4.68 | % |
Total loans (1) | |
| 2,034,778 | | 4.20 | % | |
| 1,986,028 | | 4.24 | % | |
| 1,691,542 |
| 5.06 | % | |
| 1,917,894 | | 4.37 | % | |
| 1,715,629 | | 5.03 | % |
Federal Reserve/FHLB stock | |
| 5,871 | | 4.40 | % | |
| 5,959 | | 4.59 | % | |
| 9,303 |
| 5.07 | % | |
| 5,864 | | 4.58 | % | |
| 9,638 | | 5.16 | % |
Total interest earning assets | |
| 2,744,758 | | 3.54 | % | |
| 2,584,037 | | 3.68 | % | |
| 2,017,198 |
| 4.66 | % | |
| 2,534,038 | | 3.75 | % | |
| 2,024,814 | | 4.67 | % |
Noninterest earning assets | | | 163,386 | | | | | | 156,293 | | | | | | 159,664 | | | | | | 156,144 | | | | | | 161,054 | | | |
Total assets | | $ | 2,908,144 | |
| | | $ | 2,740,330 | |
| | | $ | 2,176,862 |
|
| | | $ | 2,690,182 | |
| | | $ | 2,185,868 | |
| |
Interest-Bearing Liabilities | |
|
| |
| | |
|
| |
| | |
|
|
|
| | |
|
| |
| | |
|
| |
| |
Interest-bearing demand deposits | | $ | 589,633 | | 0.27 | % | | $ | 534,733 | | 0.30 | % | | $ | 424,896 |
| 0.49 | % | | $ | 528,024 | | 0.34 | % | | $ | 423,181 | | 0.45 | % |
Money market and savings deposits | |
| 961,669 | | 0.32 | % | |
| 900,812 | | 0.67 | % | |
| 649,190 |
| 1.32 | % | |
| 889,039 | | 0.66 | % | |
| 675,921 | | 1.23 | % |
Time deposits | |
| 204,969 | | 0.98 | % | |
| 201,147 | | 1.30 | % | |
| 187,023 |
| 1.74 | % | |
| 201,747 | | 1.29 | % | |
| 183,686 | | 1.58 | % |
Short-term borrowings | |
| — | | — | % | |
| 321 | | — | % | |
| 87,201 |
| 2.46 | % | |
| 107 | | — | % | |
| 95,489 | | 2.53 | % |
Long-term debt | |
| 58,739 | | 5.70 | % | |
| 58,747 | | 5.87 | % | |
| 58,776 |
| 6.07 | % | |
| 58,747 | | 5.85 | % | |
| 58,798 | | 6.17 | % |
Total interest-bearing liabilities | |
| 1,815,010 | | 0.55 | % | |
| 1,695,760 | | 0.81 | % | |
| 1,407,086 |
| 1.39 | % | |
| 1,677,664 | | 0.81 | % | |
| 1,437,075 | | 1.33 | % |
Noninterest-Bearing Liabilities and Stockholders' Equity | | | | | | | | | | | | | | | | | | | | | | | | | | | | | | |
Noninterest-bearing deposits | |
| 698,594 | |
| | |
| 692,500 | |
| | |
| 502,108 |
|
| | |
| 651,971 | |
| | |
| 496,822 | |
| |
Other noninterest-bearing liabilities | | | 79,619 | | | | | | 50,351 | | | | | | 40,737 | | | | | | 56,722 | | | | | | 39,060 | | | |
Stockholders’ equity | |
| 314,921 | |
| | |
| 301,719 | |
| | |
| 226,931 |
|
| | |
| 303,825 | |
| | |
| 212,911 | |
| |
Total liabilities and stockholders’ equity | | $ | 2,908,144 | |
| | | $ | 2,740,330 | |
| | | $ | 2,176,862 |
|
| | | $ | 2,690,182 | |
| | | $ | 2,185,868 | |
| |
Net interest rate spread | |
| | | 2.99 | % | |
|
| | 2.87 | % | |
|
|
| 3.27 | % | |
|
| | 2.94 | % | |
|
| | 3.34 | % |
Net interest margin, tax-equivalent (2) | |
| | | 3.17 | % | |
|
| | 3.14 | % | |
|
|
| 3.69 | % | |
|
| | 3.22 | % | |
|
| | 3.72 | % |
| (1) | Taxable-equivalent adjustment was calculated utilizing a marginal income tax rate of 21.0%. |
| (2) | Represents a non-GAAP financial measure. See “Non-GAAP to GAAP Reconciliations and Calculation of Non-GAAP Financial Measures.” |
11