
Document
false0000002488 0000002488 2020-04-28 2020-04-28


UNITED STATES
SECURITIES AND EXCHANGE COMMISSION
Washington, D.C. 20549

FORM 8-K
CURRENT REPORT
Pursuant to Section 13 or 15(d) of the
Securities Exchange Act of 1934
April 28, 2020
Date of Report (Date of earliest event reported)


ADVANCED MICRO DEVICES, INC.
(Exact name of registrant as specified in its charter)


Delaware
 
001-07882
 
94-1692300
(State of
Incorporation)
 
(Commission
File Number)
 
(IRS Employer
Identification Number)

2485 Augustine Drive
Santa Clara, California 95054
(Address of principal executive offices) (Zip Code)
(408) 749-4000
(Registrant’s telephone number, including area code)
N/A
(Former Name or Former Address, if Changed Since Last Report)


Check the appropriate box below if the Form 8-K filing is intended to simultaneously satisfy the filing obligation of the registrant under any of the following provisions:
Written communications pursuant to Rule 425 under the Securities Act (17 CFR 230.425)
Soliciting material pursuant to Rule 14a-12 under the Exchange Act (17 CFR 240.14a-12)
Pre-commencement communications pursuant to Rule 14d-2(b) under the Exchange Act (17 CFR 240.14d-2(b))
Pre-commencement communications pursuant to Rule 13e-4(c) under the Exchange Act (17 CFR 240.13e-4(c))
Securities registered pursuant to Section 12(b) of the Act:
Title of each class
Trading Symbol(s)
 Name of each exchange on which registered
Common Stock, $0.01 par value
AMD
The Nasdaq Global Select Market

Indicate by check mark whether the registrant is an emerging growth company as defined in Rule 405 of the Securities Act of 1933 (§230.405 of this chapter) or Rule 12b-2 of the Securities Exchange Act of 1934 (§240.12b-2 of this chapter).Emerging growth company
If an emerging growth company, indicate by check mark if the registrant has elected not to use the extended transition period for complying with any new or revised financial accounting standards provided pursuant to Section 13(a) of the Exchange Act.


Item 2.02 Results of Operations and Financial Condition.
Item 7.01 Regulation FD Disclosure.
The information in this report furnished pursuant to Items 2.02 and 7.01, including Exhibits 99.1 and 99.2 attached hereto, shall not be deemed “filed” for the purposes of Section 18 of the Securities and Exchange Act of 1934, as amended (the “Exchange Act”), or otherwise subject to the liabilities of that section. It may only be incorporated by reference in another filing under the Exchange Act or the Securities Act of 1933, as amended, if such subsequent filing specifically references the information furnished pursuant to Items 2.02 and 7.01 of this report.
On April 28, 2020, the Company announced its financial position and results of operations as of and for its first quarter 2020 in a press release that is attached hereto as Exhibit 99.1. Attached hereto as Exhibit 99.2 is a presentation regarding the Company's first quarter 2020.
The Company will hold a conference call on April 28, 2020 at 2:30 p.m. PT (5:30 p.m. ET) to discuss its first quarter 2020 financial results and forward-looking financial guidance.

To supplement the Company’s financial results presented on a U.S. Generally Accepted Accounting Principles (“GAAP”) basis, the Company’s earnings press release contains non-GAAP financial measures, including non-GAAP gross margin, non-GAAP operating expenses, non-GAAP operating income, non-GAAP net income, non-GAAP earnings per share, Adjusted EBITDA and free cash flow. The Company uses a normalized tax rate in the computation of the non-GAAP income tax provision to provide better consistency across the reporting periods. For fiscal 2020, the projected non-GAAP tax rate is 3%. The Company believes that the supplemental non-GAAP financial measures assist investors in comparing the Company's core performance by excluding items that it believes are not indicative of the Company’s underlying operating performance. The Company cautions investors to carefully evaluate the financial results calculated in accordance with GAAP and the supplemental non-GAAP financial measures and reconciliations. The Company’s non-GAAP financial measures are not intended to be considered in isolation and are not a substitute for, or superior to, financial measures calculated in accordance with GAAP.
Item 9.01 Financial Statements and Exhibits.
(d) Exhibits.


EXHIBIT INDEX

Exhibit No.
 
Description
99.1
 
99.2


SIGNATURE

Pursuant to the requirements of the Exchange Act, the registrant has duly caused this report to be signed on its behalf by the undersigned hereunto duly authorized.


Date: April 28, 2020
ADVANCED MICRO DEVICES, INC.


By:
/s/ Devinder Kumar
 
 
Name:
Devinder Kumar
 
 
Title:
Senior Vice President, Chief Financial Officer & Treasurer


NEWS RELEASE
Media Contact:
Drew Prairie
AMD Communications
512-602-4425
[email protected]
    
Investor Contact:
Laura Graves
AMD Investor Relations
408-749-5467
[email protected]

AMD Reports First Quarter 2020 Financial Results
- Revenue grows 40 percent year-over-year; Gross margin expands to 46 percent -

SANTA CLARA, Calif. - April 28, 2020 - AMD (NASDAQ:AMD) today announced revenue for the first quarter of 2020 of $1.79 billion, operating income of $177 million, net income of $162 million and diluted earnings per share of $0.14. On a non-GAAP* basis, operating income was $236 million, net income was $222 million and diluted earnings per share was $0.18.
GAAP Quarterly Financial Results
 
Q1 2020
Q1 2019
Y/Y
Q4 2019
Q/Q
Revenue ($B)
$1.79
$1.27
Up 40%
$2.13
Down 16%
Gross margin
46%
41%
Up 5pp
45%
Up 1pp
Operating expenses ($M)
$641
$543
Up $98
$601
Up $40
Operating income ($M)
$177
$38
Up $139
$348
Down $171
Net income ($M)
$162
$16
Up $146
$170
Down $8
Earnings per share
$0.14
$0.01
Up $0.13
$0.15
Down $0.01

Non-GAAP* Quarterly Financial Results
 
Q1 2020
Q1 2019
Y/Y
Q4 2019
Q/Q
Revenue ($B)
$1.79
$1.27
Up 40%
$2.13
Down 16%
Gross margin
46%
41%
Up 5pp
45%
Up 1pp
Operating expenses ($M)
$584
$498
Up $86
$545
Up $39
Operating income ($M)
$236
$84
Up $152
$405
Down $169
Net income ($M)
$222
$62
Up $160
$383
Down $161
Earnings per share
$0.18
$0.06
Up $0.12
$0.32
Down $0.14

“We executed well in the first quarter, navigating the challenging environment to deliver 40 percent year-over-year revenue growth and significant gross margin expansion driven by our Ryzen and EPYC processors,” said Dr. Lisa Su, AMD president and CEO. “While we expect some uncertainty in the near-

1


term demand environment, our financial foundation is solid and our strong product portfolio positions us well across a diverse set of resilient end markets. We remain focused on strong business execution while ensuring the safety of our employees and supporting our customers, partners and communities. Our strategy and long-term growth plans are unchanged.”

Q1 2020 Results
Revenue was $1.79 billion, up 40 percent year-over-year primarily driven by higher Computing and Graphics segment revenue. Revenue was down 16 percent quarter-over-quarter due to lower revenue in both segments.
Gross margin was 46 percent, up 5 percentage points year-over-year and 1 percentage point quarter-over-quarter, primarily driven by Ryzen™ and EPYC™ processor sales.
Operating income was $177 million compared to operating income of $38 million a year ago and $348 million in the prior quarter. Non-GAAP operating income was $236 million compared to operating income of $84 million a year ago and $405 million in the prior quarter. Operating income improved year-over-year primarily driven by revenue growth and a greater percentage of Ryzen and EPYC processor sales. On a sequential basis, operating income declined due to lower revenue and higher R&D expenses.
Net income was $162 million compared to net income of $16 million a year ago and $170 million in the prior quarter. Non-GAAP net income was $222 million compared to net income of $62 million a year ago and $383 million in the prior quarter.
Diluted earnings per share was $0.14 compared to diluted earnings per share of $0.01 a year ago and $0.15 in the prior quarter. Non-GAAP diluted earnings per share was $0.18, compared to diluted earnings per share of $0.06 a year ago and $0.32 in the prior quarter.
Cash, cash equivalents and marketable securities were $1.4 billion at the end of the quarter.

Quarterly Financial Segment Summary
Computing and Graphics segment revenue was $1.44 billion, up 73 percent year-over-year and down 13 percent quarter-over-quarter. Revenue was higher year-over-year driven by strong Ryzen

2


processor and Radeon™ product channel sales. The quarter-over-quarter decline was primarily due to lower graphics processor sales.
Client processor average selling price (ASP) was up year-over-year driven by Ryzen processor sales. Client processor ASP was down slightly quarter-over-quarter due to higher notebook sales.
GPU ASP was lower year-over-year and quarter-over-quarter due to product mix.
Operating income was $262 million compared to $16 million a year ago and $360 million in the prior quarter. The year-over-year increase was driven by significantly higher revenue. The quarter-over-quarter decline was primarily due to lower revenue.
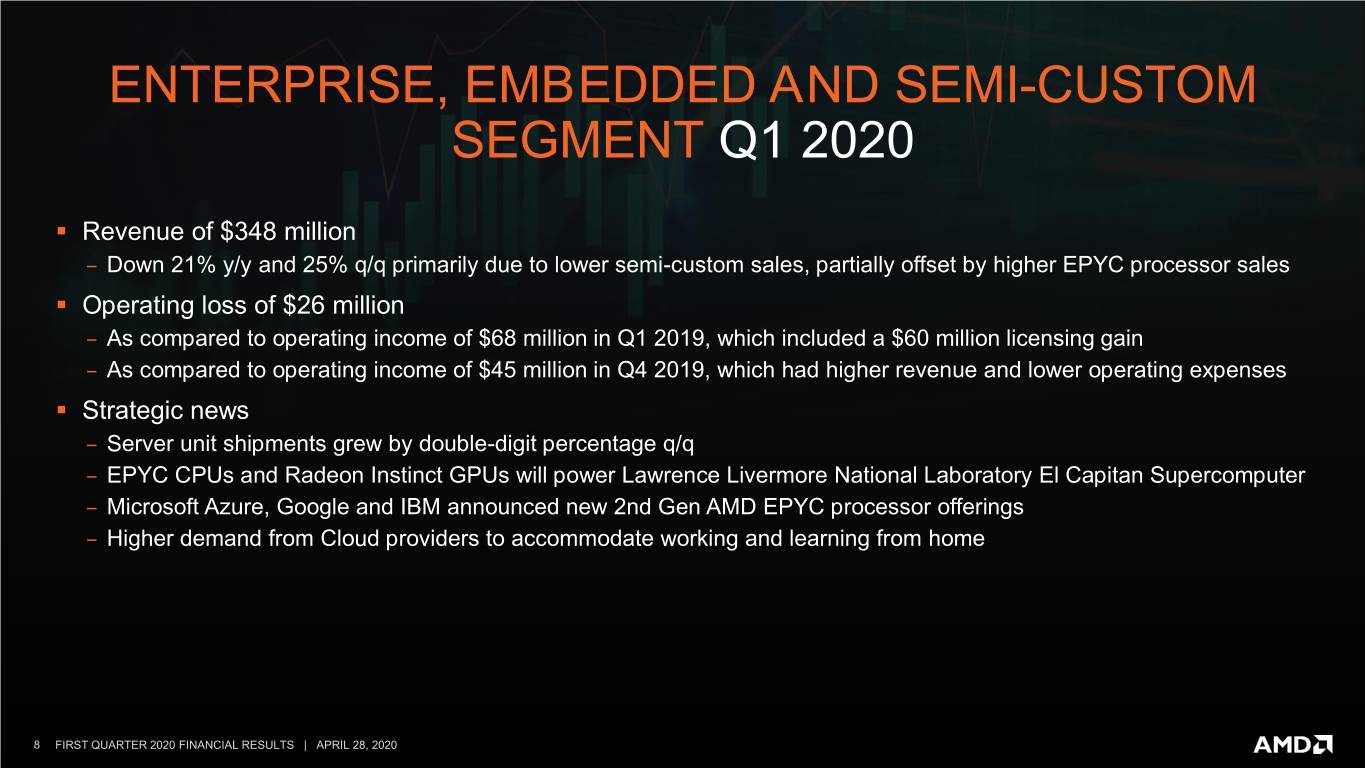
Enterprise, Embedded and Semi-Custom segment revenue was $348 million, down 21 percent year-over-year and 25 percent sequentially primarily due to lower semi-custom sales, partially offset by higher EPYC processor sales.
Operating loss was $26 million compared to operating income of $68 million a year ago, which included a $60 million licensing gain. The decline from operating income of $45 million in the prior quarter was primarily due to lower revenue and higher operating expenses.
All Other operating loss was $59 million compared to operating losses of $46 million a year ago and $57 million in the prior quarter.

Recent PR Highlights
AMD detailed its plans to drive best-in-class growth and strong financial performance through high-performance computing and graphics leadership, aggressive technology investments and sustained execution at its Financial Analyst Day on March 5, 2020.
AMD further strengthened its position as a data center compute and graphics processing solutions leader with new design wins and cloud deployments.
Lawrence Livermore National Laboratory, HPE and AMD announced that the exascale-class supercomputer, El Capitan, powered by next generation AMD EPYC CPUs, next generation AMD Radeon Instinct GPUs and open source AMD ROCm heterogeneous computing software is expected to be the world’s fastest supercomputer with more than 2 exaflops of double precision performance when delivered in early 2023.

3


Google Cloud and AMD announced new Google Compute Engine N2D virtual machines (VMs) based on 2nd Gen AMD EPYC processors are now available to customers.
Microsoft became the first cloud provider to offer virtual machines powered by 2nd Gen AMD EPYC processors and AMD Radeon Instinct GPUs with the new Microsoft Azure NVv4 VMs.
IBM Cloud announced that it is enhancing its global infrastructure with 2nd Gen AMD EPYC processors to power its latest bare metal servers for modern workloads like data analytics, electronic design automation, AI and virtualized workloads.
AMD announced three new 2nd Gen AMD EPYC processors that deliver per-core performance leadership for database, commercial high-performance computing and hyperconverged infrastructure workloads. These new AMD EPYC 7Fx2 series processors leverage higher base and boost frequencies and more cache.
AMD continued building momentum across consumer and commercial notebooks.
The first consumer notebooks based on the AMD Ryzen 4000 Series mobile processors from Acer and ASUS launched, with new platforms from Dell, HP, Lenovo and other OEMs planned to launch over the coming quarters.
Leading commercial OEMs announced availability of the first business notebooks powered by the new AMD Ryzen PRO 4000 Series mobile processors. Lenovo announced plans to use the new processor across its ThinkPad T series, X series and L series and HP launched new enterprise-ready ProBooks.
AMD and its game console partners shared new details and specifications for the AMD-powered Microsoft Xbox Series X and Sony PlayStation 5 consoles expected to launch in the 2020 holiday season.
AMD announced the forthcoming AMD RDNA 2 gaming architecture will support Microsoft’s new DirectX® 12 Ultimate API.
AMD announced a COVID-19 HPC fund with an initial donation of $15 million of high-performance systems powered by AMD EPYC CPUs and AMD Radeon Instinct GPUs to accelerate medical research related to COVID-19. AMD also joined the COVID-19 High Performance Computing

4


Consortium that brings together government, industry and university leaders providing free compute time and resources on world-class supercomputers to help fight the global pandemic.
Lawrence Livermore National Laboratory announced it is upgrading the Corona high performance computing cluster with AMD Radeon Instinct MI50 GPUs. The upgrades will nearly double peak system performance and will be made available to researchers through the COVID-19 High Performance Computing Consortium. 

Current Outlook
AMD’s outlook statements are based on current expectations and contemplate the current COVID-19 environment, global economic backdrop and customer demand signals. The following statements are forward-looking, and actual results could differ materially depending on market conditions, COVID-19 factors and the factors set forth under “Cautionary Statement” below.
For the second quarter of 2020, AMD expects revenue to be approximately $1.85 billion, plus or minus $100 million, an increase of approximately 21 percent year-over-year and 4 percent sequentially. The year-over-year increase is expected to be primarily driven by growth of Ryzen and EPYC processor sales. The sequential increase is expected to be primarily driven by EPYC processor and semi-custom sales. AMD expects non-GAAP gross margin to be approximately 44 percent in the second quarter of 2020. The sequential decrease is expected to be primarily due to the initial ramp of next-generation semi-custom products.
Despite expectations of weaker COVID-19 related consumer demand in the second half of the year, AMD expects 2020 revenue to grow by approximately 25 percent, plus or minus 5 percentage points, compared to 2019 and non-GAAP gross margin to be approximately 45 percent.

AMD Teleconference
AMD will hold a conference call for the financial community at 2:30 p.m. PT (5:30 p.m. ET) today to discuss its first quarter 2020 financial results. AMD will provide a real-time audio broadcast of the teleconference on the Investor Relations page of its website at www.amd.com. The webcast will be available for 12 months after the conference call.

5


RECONCILIATION OF GAAP TO NON-GAAP FINANCIAL MEASURES
 (In millions, except per share data)
 
Three Months Ended

 
March 28,
2020
 
December 28,
2019
 
March 30,
2019
GAAP gross margin
 
$
818

 
$
949

 
$
521

GAAP gross margin %
 
46
%
 
45
%
 
41
%
Stock-based compensation
 
2

 
1

 
1

Non-GAAP gross margin
 
$
820

 
$
950

 
$
522

Non-GAAP gross margin %
 
46
%
 
45
%
 
41
%


GAAP operating expenses
 
$
641

 
$
601

 
$
543

Stock-based compensation
 
57

 
56

 
40

Loss contingency on legal matter


5

Non-GAAP operating expenses
 
$
584

 
$
545

 
$
498


GAAP operating income
 
$
177

 
$
348

 
$
38

Stock-based compensation
 
59

 
57

 
41

Loss contingency on legal matter


5

Non-GAAP operating income
 
$
236

 
$
405

 
$
84


Three Months Ended

 
March 28,
2020
 
December 28,
2019
 
March 30,
2019
GAAP net income / earnings per share
 
$
162

 
$
0.14

 
$
170

 
$
0.15

 
$
16

 
$
0.01

Loss on debt redemption/conversion


128

 
0.10

 
8

 
0.01

Non-cash interest expense related to convertible debt
 
2


4


6

 
0.01

Stock-based compensation
 
59

 
0.04

 
57

 
0.05

 
41

 
0.04

Equity loss in investee


1


Loss contingency on legal matter


5


Provision for (benefit from) income taxes
 
(1
)


24

 
0.02

 
(15
)
 
(0.01
)
Non-GAAP net income / earnings per share
 
$
222

 
$
0.18

 
$
383

 
$
0.32

 
$
62

 
$
0.06


Shares used and net income adjustment in
earnings per share calculation
 (1)


Shares used in per share calculation (GAAP)
 
1,224
 
 
1,188
 
 
1,094
 
Interest expense add-back to GAAP net income
 
$
4
 
 
$
4
 
 
$
 
Shares used in per share calculation (Non-GAAP)
 
1,224
 
 
1,216
 
 
1,195
 
Interest expense add-back to Non-GAAP net income
 
$
2
 
 
$
2
 
 
$
5
 

(1)
 
For the three months ended March 28, 2020 and December 28, 2019, GAAP diluted EPS calculations include 31 million shares related to the Company's 2026 Convertible Notes and the associated $4 million interest expense add-back to net income under the "if converted" method. For the three months ended March 30, 2019, GAAP diluted EPS calculations do not include 100.6 million shares related to the Company’s 2026 Convertible Notes and the associated interest expense add-back to net income because their inclusion would have been anti-dilutive under the "if converted" method.

For the three months ended March 28, 2020, December 28, 2019 and March 30, 2019, Non-GAAP diluted EPS calculations include 31 million, 59 million and 101.6 million shares, respectively, related to the Company's 2026 Convertible Notes and the associated $2 million, $2 million and $5 million interest expense, respectively, add-back to net income under the "if converted" method.

6


About AMD
For 50 years, AMD has driven innovation in high-performance computing, graphics and visualization technologies - the building blocks for gaming, immersive platforms and the data center. Hundreds of millions of consumers, leading Fortune 500 businesses and cutting-edge scientific research facilities around the world rely on AMD technology daily to improve how they live, work and play. AMD employees around the world are focused on building great products that push the boundaries of what is possible. For more information about how AMD is enabling today and inspiring tomorrow, visit the AMD (NASDAQ: AMD) website, blog, Facebook and Twitter pages.

7


Cautionary Statement
    
This document contains forward-looking statements concerning Advanced Micro Devices, Inc. (AMD) such as the uncertainties in the near-term demand environment; AMD’s long-term growth plans; features, expectations and deployment of the exascale-class supercomputer, El Capitan; expected launch timing of Microsoft Xbox Series X and Sony PlayStation 5; the features, functionality, performance, availability, timing and expected benefits of AMD products, including AMD RDNA 2; the timing and availability of OEM platforms powered by AMD Ryzen 4000 Series mobile processors; and AMD’s expected second quarter of 2020 outlook based on current expectations and contemplated current COVID-19 environment, global economic backdrop and customer demand signals, including revenue, as well as the expected drivers of such revenue, and non-GAAP gross margin; AMD’s expected fiscal 2020 financial outlook, including revenue and non-GAAP gross margin; and expected weaker COVID-19 related consumer demand in the second half of 2020, which are made pursuant to the Safe Harbor provisions of the Private Securities Litigation Reform Act of 1995. Forward looking statements are commonly identified by words such as "would," "may," "expects," "believes," "plans," "intends," "projects" and other terms with similar meaning. Investors are cautioned that the forward-looking statements in this document are based on current beliefs, assumptions and expectations, speak only as of the date of this document and involve risks and uncertainties that could cause actual results to differ materially from current expectations. Such statements are subject to certain known and unknown risks and uncertainties, many of which are difficult to predict and generally beyond AMD's control, that could cause actual results and other future events to differ materially from those expressed in, or implied or projected by, the forward-looking information and statements. Material factors that could cause actual results to differ materially from current expectations include, without limitation, the following: The ongoing COVID-19 pandemic could materially adversely affect AMD’s business, financial condition and results of operations; Intel Corporation’s dominance of the microprocessor market and its aggressive business practices may limit AMD’s ability to compete effectively; AMD relies on third parties to manufacture its products, and if they are unable to do so on a timely basis in sufficient quantities and using competitive technologies, AMD’s business could be materially adversely affected; failure to achieve expected manufacturing yields for AMD’s products could negatively impact its financial results; the success of AMD’s business is dependent upon its ability to introduce products on a timely basis with features and performance levels that provide value to its customers while supporting and coinciding with significant industry transitions; if AMD cannot generate sufficient revenue and operating cash flow or obtain external financing, it may face a cash shortfall and be unable to make all of its planned investments in research and development or other strategic investments; the loss of a significant customer may have a material adverse effect on AMD; AMD’s receipt of revenue from its semi-custom SoC products is dependent upon its technology being designed into third-party products and the success of those products; global economic and market uncertainty may adversely impact AMD’s business and operating results; AMD’s worldwide operations are subject to political, legal and economic risks and natural disasters, which could have a material adverse effect on it; government actions and regulations such as export administration regulations, tariffs, and trade protection measures, may limit our ability to export our products to certain customers; AMD’s products may be subject to security vulnerabilities that could have a material adverse effect on AMD; IT outages, data loss, data breaches and cyber-attacks could compromise AMD’s intellectual property or other sensitive information, be costly to remediate and cause significant damage to its business, reputation and operations; AMD has a wafer supply agreement with GLOBALFOUNDRIES Inc. (GF) with obligations to purchase all of its microprocessor and accelerated processing unit (APU) product requirements, and a certain portion of its graphics processing unit (GPU) product requirements manufactured at nodes larger than 7 nanometer from GF, with limited exceptions. If GF is not able to satisfy AMD’s manufacturing requirements, AMD’s business could be adversely impacted; uncertainties involving the ordering and shipment of AMD’s products could materially adversely affect it; AMD’s operating results are subject to quarterly and seasonal sales patterns; the agreements governing AMD’s notes and the Secured Revolving Facility impose restrictions on AMD that may adversely affect AMD’s ability to operate its business; the markets in which AMD’s products are sold are highly competitive; the conversion of the 2.125% Convertible Senior Notes due 2026 (2.125% Notes) may dilute the ownership interest of AMD’s existing stockholders, or may otherwise depress the price of its common stock; the demand for AMD’s products depends in part on the market conditions in the industries into which they are sold. Fluctuations in demand for AMD’s products or a market decline in any of these industries could have a material adverse effect on its results of operations; AMD’s ability to design and introduce new products in a timely manner is dependent upon third-party intellectual property; AMD depends on third-party companies for the design, manufacture and supply of motherboards, software, memory and other computer platform components to support its business; if AMD loses Microsoft Corporation’s support for its products or other software vendors do not design and develop software to run on AMD’s products, its ability to sell its products could be materially adversely affected; AMD’s reliance on third-party distributors and add-in-board (AIB) partners subjects it to certain risks; AMD may incur future impairments of goodwill and technology license purchases; AMD’s inability to continue to attract and retain qualified personnel may hinder its business; AMD’s indebtedness could adversely affect its financial position and prevent it from implementing its strategy or fulfilling its contractual obligations; AMD may not be able to generate sufficient cash to service its debt obligations or meet its working capital requirements; in the event of a change of control, AMD may not be able to repurchase its outstanding debt as required by the applicable indentures and its Secured Revolving Facility, which would result in a default under the indentures and its Secured Revolving Facility; the semiconductor industry is highly cyclical and has experienced severe downturns that have materially adversely affected, and may continue to materially adversely affect its business in the future; acquisitions, joint ventures and/or investments could disrupt its business and/or dilute or adversely affect the price of its common stock; AMD’s business is dependent upon the proper functioning of its internal business processes and information systems and modification or interruption of such systems may disrupt its business, processes and internal controls; if essential equipment, materials or manufacturing processes are not available to manufacture its products, AMD could be materially adversely affected; if AMD’s products are not compatible with some or all industry-standard software and hardware, it could be materially adversely affected; costs related to defective products could have a material adverse effect on AMD; if AMD fails to maintain the efficiency of its supply chain as it responds to changes in customer demand for its products, its business could be materially adversely affected; AMD outsources to third parties certain supply-chain logistics functions, including portions of its product distribution, transportation management and information technology support services; AMD’s stock price is subject to volatility; worldwide political conditions may adversely affect demand for AMD’s products; unfavorable currency exchange rate fluctuations could adversely affect AMD; AMD’s inability to effectively control the sales of its products on the gray market could have a material adverse effect on it; if AMD cannot adequately protect its technology or other intellectual property in the United States and abroad, through patents, copyrights, trade secrets, trademarks and other measures, it may lose a competitive advantage and incur significant expenses; AMD is a party to litigation and may become a party to other claims or litigation that could cause it to incur substantial costs or pay substantial damages or prohibit it from selling its products; AMD’s business is subject to potential tax liabilities; and AMD is subject to environmental laws, conflict minerals-related provisions of the Dodd-Frank Wall Street Reform and Consumer Protection Act as well as a variety of other laws or regulations that could result in additional costs and liabilities. Investors are urged to review in detail the risks and uncertainties in AMD’s Securities and Exchange Commission filings, including but not limited to AMD’s Annual Report on Form 10-K for the year ended December 28, 2019.


8


*
 
In this earnings press release, in addition to GAAP financial results, AMD has provided non-GAAP financial measures including non-GAAP gross margin, non-GAAP operating expenses, non-GAAP operating income, non-GAAP net income and non-GAAP earnings per share. These non-GAAP financial measures reflect certain adjustments as presented in the tables in this earnings press release. We use a normalized tax rate in our computation of the non-GAAP income tax provision to provide better consistency across the reporting periods. For fiscal 2020, the projected non-GAAP tax rate is 3%. AMD has also provided adjusted EBITDA and free cash flow as supplemental non-GAAP measures of its performance. These items are defined in the footnotes to the selected corporate data tables provided at the end of this earnings press release. AMD is providing these financial measures because it believes this non-GAAP presentation makes it easier for investors to compare its operating results for current and historical periods and also because AMD believes it assists investors in comparing AMD’s performance across reporting periods on a consistent basis by excluding items that it does not believe are indicative of its core operating performance and for the other reasons described in the footnotes to the selected data tables. Refer to the data tables at the end of this earnings press release.

AMD, the AMD Arrow logo, EPYC, Radeon, Ryzen, Athlon and combinations thereof, are trademarks of Advanced Micro Devices, Inc. Other names are for informational purposes only and used to identify companies and products and may be trademarks of their respective owner.

9


ADVANCED MICRO DEVICES, INC.
CONDENSED CONSOLIDATED STATEMENTS OF OPERATIONS
(Millions except per share amounts and percentages) (Unaudited)


Three Months Ended
 
 
March 28,
2020
 
December 28,
2019
 
March 30,
2019
Net revenue
 
$
1,786

 
$
2,127

 
$
1,272

Cost of sales
 
968

 
1,178

 
751

Gross margin
 
818

 
949

 
521

Gross margin %
 
46
%
 
45
%
 
41
%
Research and development
 
442

 
395

 
373

Marketing, general and administrative
 
199

 
206

 
170

Licensing gain


(60
)
Operating income
 
177

 
348

 
38

Interest expense
 
(13
)
 
(18
)
 
(27
)
Other income (expense), net
 
4

 
(125
)
 
(7
)
Income before income taxes and equity loss
 
168

 
205

 
4

Provision for (benefit from) income taxes
 
6

 
35

 
(13
)
Equity loss in investee


(1
)
Net Income
 
$
162

 
$
170

 
$
16

Earnings per share


Basic
 
$
0.14

 
$
0.15

 
$
0.01

Diluted
 
$
0.14

 
$
0.15

 
$
0.01

Shares used in per share calculation


Basic
 
1,170

 
1,140

 
1,044

Diluted
 
1,224

 
1,188

 
1,094


10


ADVANCED MICRO DEVICES, INC.
CONDENSED CONSOLIDATED BALANCE SHEETS
(Millions) (Unaudited)


March 28,
2020
 
December 28,
2019 
ASSETS


Current assets:


Cash and cash equivalents
 
$
1,330

 
$
1,466

Marketable securities
 
55

 
37

Accounts receivable, net
 
1,691

 
1,859

Inventories, net
 
1,056

 
982

Prepayment and receivables—related parties
 
17

 
20

Prepaid expenses and other current assets
 
241

 
233

Total current assets
 
4,390

 
4,597

Property and equipment, net
 
540

 
500

Operating lease right-of use assets
 
221

 
205

Goodwill
 
289

 
289

Investment: equity method
 
58

 
58

Other assets
 
366

 
379

Total Assets
 
$
5,864

 
$
6,028


LIABILITIES AND STOCKHOLDERS' EQUITY


Current liabilities:


Accounts payable
 
$
653

 
$
988

Payables to related parties
 
187

 
213

Accrued liabilities
 
1,070

 
1,084

Other current liabilities
 
75

 
74

Total current liabilities
 
1,985

 
2,359

Long-term debt, net
 
488

 
486

Long-term operating lease liabilities
 
211

 
199

Other long-term liabilities
 
143

 
157


Stockholders' equity:


Capital stock:


Common stock, par value
 
12

 
12

Additional paid-in capital
 
10,026

 
9,963

Treasury stock, at cost
 
(54
)
 
(53
)
Accumulated deficit
 
(6,933
)
 
(7,095
)
Accumulated other comprehensive loss
 
(14
)
 

Total Stockholders' equity
 
3,037

 
2,827

Total Liabilities and Stockholders' Equity
 
$
5,864

 
$
6,028


11


ADVANCED MICRO DEVICES, INC.
SELECTED CASH FLOW INFORMATION
(Millions) (Unaudited)
 
 
Three Months Ended
 
 
March 28,
2020
Net cash provided by (used in)
 
 
Operating activities
 
$
(65
)
Investing activities
 
$
(73
)
Financing activities
 
$
2


SELECTED CORPORATE DATA
(Millions) (Unaudited)
 
 
Three Months Ended
 
 
March 28,
2020
 
December 28,
2019
 
March 30,
2019
Segment and Category Information


Computing and Graphics (1)


Net revenue
 
$
1,438

 
$
1,662

 
$
831

Operating income
 
$
262

 
$
360

 
$
16

Enterprise, Embedded and Semi-Custom (2)


Net revenue
 
$
348

 
$
465

 
$
441

Operating (loss) income
 
$
(26
)
 
$
45

 
$
68

All Other (3)


Net revenue
 
$

 
$

 
$

Operating loss
 
$
(59
)
 
$
(57
)
 
$
(46
)
Total


Net revenue
 
$
1,786

 
$
2,127

 
$
1,272

Operating income
 
$
177

 
$
348

 
$
38


Other Data


Capital expenditures
 
$
55

 
$
42

 
$
62

Adjusted EBITDA (4)
 
$
304

 
$
469

 
$
130

Cash, cash equivalents and marketable securities
 
$
1,385

 
$
1,503

 
$
1,194

Free cash flow (5)
 
$
(120
)
 
$
400

 
$
(275
)
Total assets
 
$
5,864

 
$
6,028

 
$
4,931

Total debt
 
$
488

 
$
486

 
$
1,094

(1) 
 
The Computing and Graphics segment primarily includes desktop and notebook processors and chipsets, discrete and integrated graphics processing units (GPUs), data center and professional GPUs, and development services. The Company also licenses portions of its intellectual property portfolio.


(2) 
 
The Enterprise, Embedded and Semi-Custom segment primarily includes server and embedded processors, semi-custom System-on-Chip (SoC) products, development services and technology for game consoles. The Company also licenses portions of its intellectual property portfolio.


(3) 
 
All Other category primarily includes certain expenses and credits that are not allocated to any of the operating segments. Also included in this category is stock-based compensation expense.


12


(4) 
 
Reconciliation of GAAP Net Income to Adjusted EBITDA*


Three Months Ended
 
 
March 28,
2020
 
December 28,
2019
 
March 30,
2019
GAAP net income
 
$
162

 
$
170

 
$
16

Interest expense
 
13

 
18

 
27

Other (income) expense, net
 
(4
)
 
125

 
7

Provision for (benefit from) income taxes
 
6

 
35

 
(13
)
Equity loss in investee


1

Stock-based compensation
 
59

 
57

 
41

Depreciation and amortization
 
68

 
64

 
46

Loss contingency on legal matter


5

Adjusted EBITDA
 
$
304

 
$
469

 
$
130


(5) 
 
Reconciliation of GAAP Net Cash Provided by Operating Activities to Free Cash Flow**


Three Months Ended
 
 
March 28,
2020
 
December 28,
2019
 
March 30,
2019
GAAP net cash provided by (used in) operating activities
 
$
(65
)
 
$
442

 
$
(213
)
Purchases of property and equipment
 
(55
)
 
(42
)
 
(62
)
Free cash flow
 
$
(120
)
 
$
400

 
$
(275
)
*
 
The Company presents “Adjusted EBITDA” as a supplemental measure of its performance. Adjusted EBITDA for the Company is determined by adjusting GAAP net income for interest expense, other income (expense), net, provision for (benefit from) income taxes, equity income (loss) on investee, stock-based compensation, and depreciation and amortization expense. In addition, the Company included a loss contingency on legal matter in the three months ended March 30, 2019. The Company calculates and presents Adjusted EBITDA because management believes it is of importance to investors and lenders in relation to its overall capital structure and its ability to borrow additional funds. In addition, the Company presents Adjusted EBITDA because it believes this measure assists investors in comparing its performance across reporting periods on a consistent basis by excluding items that the Company does not believe are indicative of its core operating performance. The Company’s calculation of Adjusted EBITDA may or may not be consistent with the calculation of this measure by other companies in the same industry. Investors should not view Adjusted EBITDA as an alternative to the GAAP operating measure of income or GAAP liquidity measures of cash flows from operating, investing and financing activities. In addition, Adjusted EBITDA does not take into account changes in certain assets and liabilities that can affect cash flows.


**
 
The Company also presents free cash flow as a supplemental Non-GAAP measure of its performance. Free cash flow is determined by adjusting GAAP net cash provided by (used in) operating activities for capital expenditures. The Company calculates and communicates free cash flow in the financial earnings press release because management believes it is of importance to investors to understand the nature of these cash flows. The Company’s calculation of free cash flow may or may not be consistent with the calculation of this measure by other companies in the same industry. Investors should not view free cash flow as an alternative to GAAP liquidity measures of cash flows from operating activities.


The Company has provided reconciliations within the earnings press release of these Non-GAAP financial measures to the most directly comparable GAAP financial measures.

13
FIRST QUARTER 2020 FINANCIAL RESULTS APRIL 28, 2020

 
CAUTIONARY STATEMENT​ This presentation contains forward-looking statements concerning Advanced Micro Devices, Inc. (AMD) such as the expected number of Ryzen-powered consumer and commercial notebooks from OEMs; expectations and deployment of the exascale-class supercomputer, El Capitan; the features, functionality, performance, availability, timing and expected benefits of AMD products; AMD’s financial outlook for the second quarter of 2020 and fiscal 2020, including, revenue, non-GAAP gross margin, non-GAAP operating expenses, non-GAAP operating expenses as a percentage of revenue, non-GAAP interest expense, taxes and other, non-GAAP taxes, and diluted share count; AMD’s leadership roadmaps, execution excellence, sustained market share gains and strong financial returns, which are made pursuant to the Safe Harbor provisions of the Private Securities Litigation Reform Act of 1995. Forward-looking statements are commonly identified by words such as "would," "may," "expects," "believes," "plans," "intends," "projects" and other terms with similar meaning. Investors are cautioned that the forward-looking statements in this presentation are based on current beliefs, assumptions and expectations, speak only as of the date of this presentation and involve risks and uncertainties that could cause actual results to differ materially from current expectations. Such statements are subject to certain known and unknown risks and uncertainties, many of which are difficult to predict and generally beyond AMD's control, that could cause actual results and other future events to differ materially from those expressed in, or implied or projected by, the forward-looking information and statements. Material factors that could cause actual results to differ materially from current expectations include, without limitation, the following: The ongoing COVID-19 pandemic could materially adversely affect our business, financial condition and results of operations; Intel Corporation’s dominance of the microprocessor market and its aggressive business practices; the ability of third party manufacturers to manufacture AMD's products on a timely basis in sufficient quantities and using competitive technologies; expected manufacturing yields for AMD’s products; AMD's ability to introduce products on a timely basis with features and performance levels that provide value to its customers while supporting and coinciding with significant industry transitions; AMD's ability to generate sufficient revenue and operating cash flow or obtain external financing for research and development or other strategic investments; the loss of a significant customer; AMD's ability to generate revenue from its semi-custom SoC products; global economic uncertainty; political, legal, economic risks and natural disasters; government actions and regulations such as export administration regulations, tariffs and trade protection measures may limit our ability to export our products to certain customers; potential security vulnerabilities; potential IT outages, data loss, data breaches and cyber-attacks; the ability of GlobalFoundries Inc.to satisfy AMD’s manufacturing requirements; uncertainties involving the ordering and shipment of AMD’s products; quarterly and seasonal sales patterns; the restrictions imposed by agreements governing AMD’s notes and the secured credit facility; the competitive markets in which AMD’s products are sold; the potential dilutive effect if the 2.125% Convertible Senior Notes due 2026 are converted; the market conditions of the industries in which AMD products are sold; AMD’s reliance on third-party intellectual property to design and introduce new products in a timely manner; AMD's reliance on third-party companies for the design, manufacture and supply of motherboards, software and other computer platform components; AMD's reliance on Microsoft Corporation and other software vendors' support to design and develop software to run on AMD’s products; AMD’s reliance on third-party distributors and add-in-board partners; future impairments of goodwill and technology license purchases; AMD’s ability to attract and retain qualified personnel; AMD's indebtedness; AMD's ability to generate sufficient cash to service its debt obligations or meet its working capital requirements; AMD's ability to repurchase its outstanding debt in the event of a change of control; the cyclical nature of the semiconductor industry; the impact of acquisitions, joint ventures and/or investments on AMD's business; the impact of modification or interruption of AMD’s internal business processes and information systems; the availability of essential equipment, materials or manufacturing processes; compatibility of AMD’s products with some or all industry-standard software and hardware; costs related to defective products; the efficiency of AMD's supply chain; AMD's ability to rely on third party supply-chain logistics functions; AMD’s stock price volatility; worldwide political conditions; unfavorable currency exchange rate fluctuations; AMD’s ability to effectively control the sales of its products on the gray market; AMD's ability to adequately protect its technology or other intellectual property; current and future claims and litigation; potential tax liabilities; and environmental laws, conflict minerals-related provisions and other laws or regulations. Investors are urged to review in detail the risks and uncertainties in AMD's Securities and Exchange Commission filings, including but not limited to AMD's Annual Report on Form 10-K for the year ended December 28, 2019. NON-GAAP FINANCIAL MEASURES In this presentation, in addition to GAAP financial results, AMD has provided non-GAAP financial measures including non-GAAP gross margin, non-GAAP operating expenses, non-GAAP operating income, non-GAAP net income, non-GAAP earnings per share, free cash flow, and Adjusted EBITDA. We use a normalized tax rate in our computation of the non-GAAP income tax provision to provide better consistency across the reporting periods. For fiscal 2020, the projected non-GAAP tax rate is 3%. AMD is providing these financial measures because it believes this non-GAAP presentation makes it easier for investors to compare its operating results for current and historical periods and also because AMD believes it assists investors in comparing AMD’s performance across reporting periods on a consistent basis by excluding items that it does not believe are indicative of its core operating performance and for the other reasons described in the footnotes to the selected data tables at the end of AMD’s earnings press release. The non-GAAP financial measures disclosed in this presentation should be viewed in addition to and not as a substitute for or superior to AMD’s reported results prepared in accordance with GAAP and should be read only in conjunction with AMD’s Consolidated Financial Statements prepared in accordance with GAAP. These non-GAAP financial measures referenced are reconciled to their most directly comparable GAAP financial measures in the Appendices at the end of this presentation. This presentation also contains forward-looking non-GAAP measures concerning AMD’s financial outlook such as gross margin, operating expenses, interest expense, taxes and other. Non-GAAP adjustments relating to the financial outlook typically includes stock-based compensation, non-cash interest expense related to convertible debt, provision for (benefit from) for income taxes, equity (income) loss in investee, and other non-recurring items such as loss on debt redemption/conversion, impairment charges, and loss contingency on legal matters. The timing and impact of such non-GAAP adjustments are dependent on future events that may be uncertain or outside of AMD's control. These forward-looking non-GAAP measures are based on current expectations, assumptions and beliefs that involve numerous risks and uncertainties. 2 FIRST QUARTER 2020 FINANCIAL RESULTS | APRIL 28, 2020

 
OUR JOURNEY High-Performance Disruptive Solutions Strong and Best-in-Class Computing Combining CPUs Predictable Growth Leadership and GPUs Execution Franchise 3 FIRST QUARTER 2020 FINANCIAL RESULTS | APRIL 28, 2020

 
OUR TECHNOLOGY INVESTMENTS INDUSTRY-LEADING IP ADVANCED TECHNOLOGY DATA CENTER LEADERSHIP PC/GAMING SOLUTIONS Delivering Multi-generational Leadership Process, Innovation in Cloud, Driving Leadership PC Leadership CPU and GPU Packaging and Interconnect Enterprise, and Accelerated Experiences and Gaming Roadmaps Technology Computing Solutions 4 FIRST QUARTER 2020 FINANCIAL RESULTS | APRIL 28, 2020


OUR BEST PRODUCT PORTFOLIO EVER Leadership Desktop Processors Leadership Ultrathin and Unmatched High-end Desktop Price-performance Leadership Up to 64 “Zen 2” Cores with with up to 16 “Zen 2” Cores Gaming Notebook Processors with up to 64 “Zen 2” Cores with New RDNA Architecture up to 50% Lower TCO PERFORMANCE LEADERSHIP FROM NOTEBOOK TO DESKTOP TO DATA CENTER 5 FIRST QUARTER 2020 FINANCIAL RESULTS | APRIL 28, 2020 Based on Virtualization See Endnote ROM-557


FINANCIAL SUMMARY Q1 2020¹ ▪ Revenue of $1.79 billion, up 40% y/y and down 16% q/q Quarterly Revenue ($B) ‒ Up y/y driven primarily by Computing and Graphics segment revenue ‒ Down q/q due to lower revenue in both segments +40% y/y ‒ Navigated pockets of supply chain disruption and demand shifts caused by COVID-19 $1.79 ▪ Gross margin of 46% ‒ Up 5 percentage points y/y and 1 percentage point q/q, primarily driven by $1.27 RyzenTM and EPYCTM processor sales ▪ Operating expenses of $641 million GAAP, $584 million non-GAAP ▪ Profitability improvements y/y ‒ Operating income of $177 million; Non-GAAP operating income of $236 million ‒ Net income of $162 million; Non-GAAP net income of $222 million ‒ Diluted EPS of $0.14; Non-GAAP diluted EPS of $0.18 ▪ Cash, cash equivalents and marketable securities of $1.4 billion Q1 2019 Q1 2020 ▪ Operating Cash Flow and Free Cash Flow improvements y/y 1. See Appendices for GAAP to Non-GAAP reconciliation 6 FIRST QUARTER 2020 FINANCIAL RESULTS | APRIL 28, 2020


COMPUTING AND GRAPHICS SEGMENT Q1 2020 ▪ Revenue of $1.44 billion ‒ Up 73% y/y primarily driven by strong Ryzen processor and RadeonTM product channel sales ‒ Down 13% q/q primarily due to lower graphics processor sales ▪ Average Selling Price (ASP) ‒ Client processor ASP up y/y driven by Ryzen processor sales and down slightly q/q due to higher notebook sales ‒ GPU ASP down y/y and q/q due to product mix ▪ Operating income of $262 million ‒ Up $246 million y/y driven by significantly higher revenue and down $98 million q/q primarily due to lower revenue ▪ Strategic news ‒ Record quarterly notebook revenue ‒ Gained commercial momentum with new Lenovo and HP systems ‒ Strong initial ramp of Ryzen Mobile 4000 processors ‒ Expecting over 135 new Ryzen-powered consumer and commercial notebooks from OEMs in the coming quarters ‒ Apple announced notebooks with Radeon 5000M mobile GPUs ‒ Microsoft Azure added virtual machines powered by Radeon Instinct MI25 GPUs 7 FIRST QUARTER 2020 FINANCIAL RESULTS | APRIL 28, 2020

 
ENTERPRISE, EMBEDDED AND SEMI-CUSTOM SEGMENT Q1 2020 ▪ Revenue of $348 million ‒ Down 21% y/y and 25% q/q primarily due to lower semi-custom sales, partially offset by higher EPYC processor sales ▪ Operating loss of $26 million ‒ As compared to operating income of $68 million in Q1 2019, which included a $60 million licensing gain ‒ As compared to operating income of $45 million in Q4 2019, which had higher revenue and lower operating expenses ▪ Strategic news ‒ Server unit shipments grew by double-digit percentage q/q ‒ EPYC CPUs and Radeon Instinct GPUs will power Lawrence Livermore National Laboratory El Capitan Supercomputer ‒ Microsoft Azure, Google and IBM announced new 2nd Gen AMD EPYC processor offerings ‒ Higher demand from Cloud providers to accommodate working and learning from home 8 FIRST QUARTER 2020 FINANCIAL RESULTS | APRIL 28, 2020


REVENUE TREND ($ IN MILLIONS) $2,127 +40% y/y $1,801 $1,756 $1,786 $1,653 $1,531 $1,419 $1,272 Q2'18 Q3'18 Q4'18 Q1'19 Q2'19 Q3'19 Q4'19 Q1'20 STRONG Y/Y REVENUE GROWTH 9 FIRST QUARTER 2020 FINANCIAL RESULTS | APRIL 28, 2020
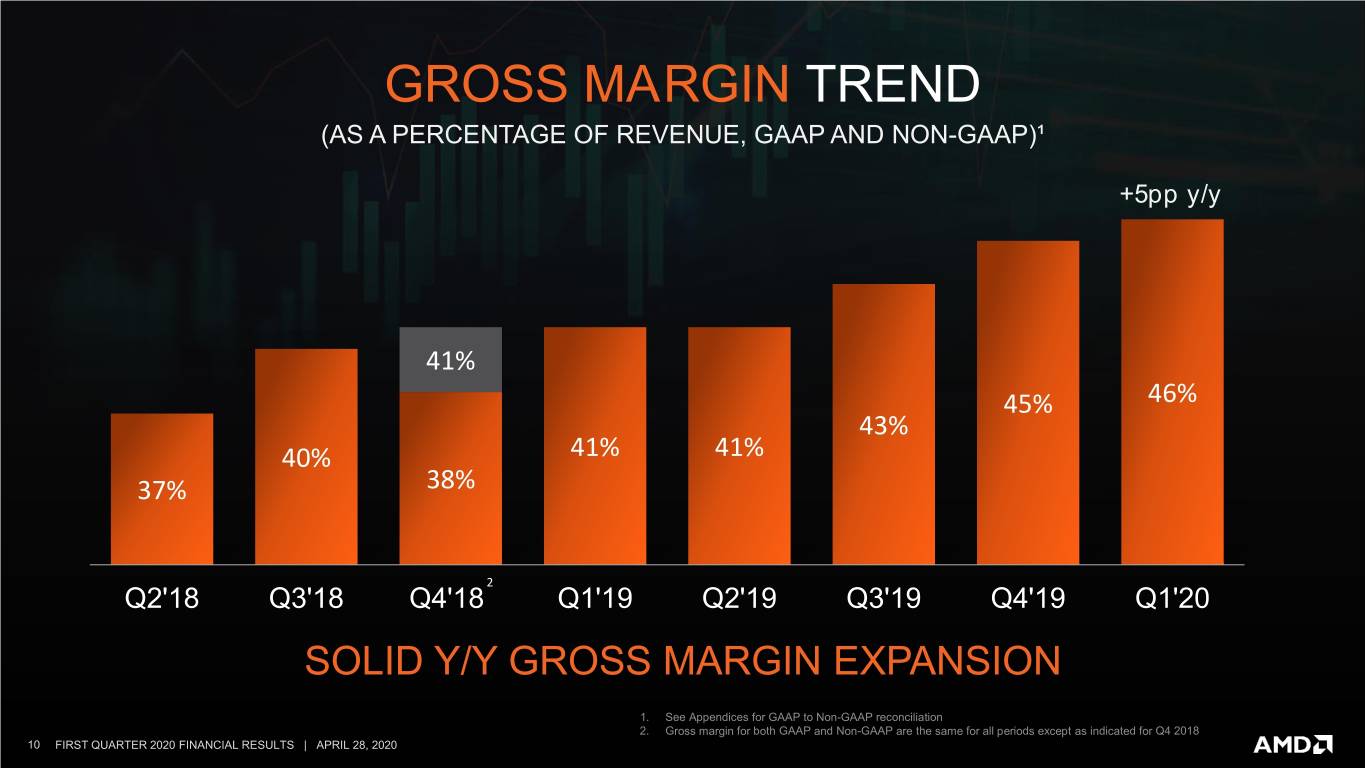

 
GROSS MARGIN TREND (AS A PERCENTAGE OF REVENUE, GAAP AND NON-GAAP)¹ +5pp y/y 41% 45% 46% 43% 40% 41% 41% 37% 38% 2 Q2'18 Q3'18 Q4'18 Q1'19 Q2'19 Q3'19 Q4'19 Q1'20 SOLID Y/Y GROSS MARGIN EXPANSION 1. See Appendices for GAAP to Non-GAAP reconciliation 2. Gross margin for both GAAP and Non-GAAP are the same for all periods except as indicated for Q4 2018 10 FIRST QUARTER 2020 FINANCIAL RESULTS | APRIL 28, 2020
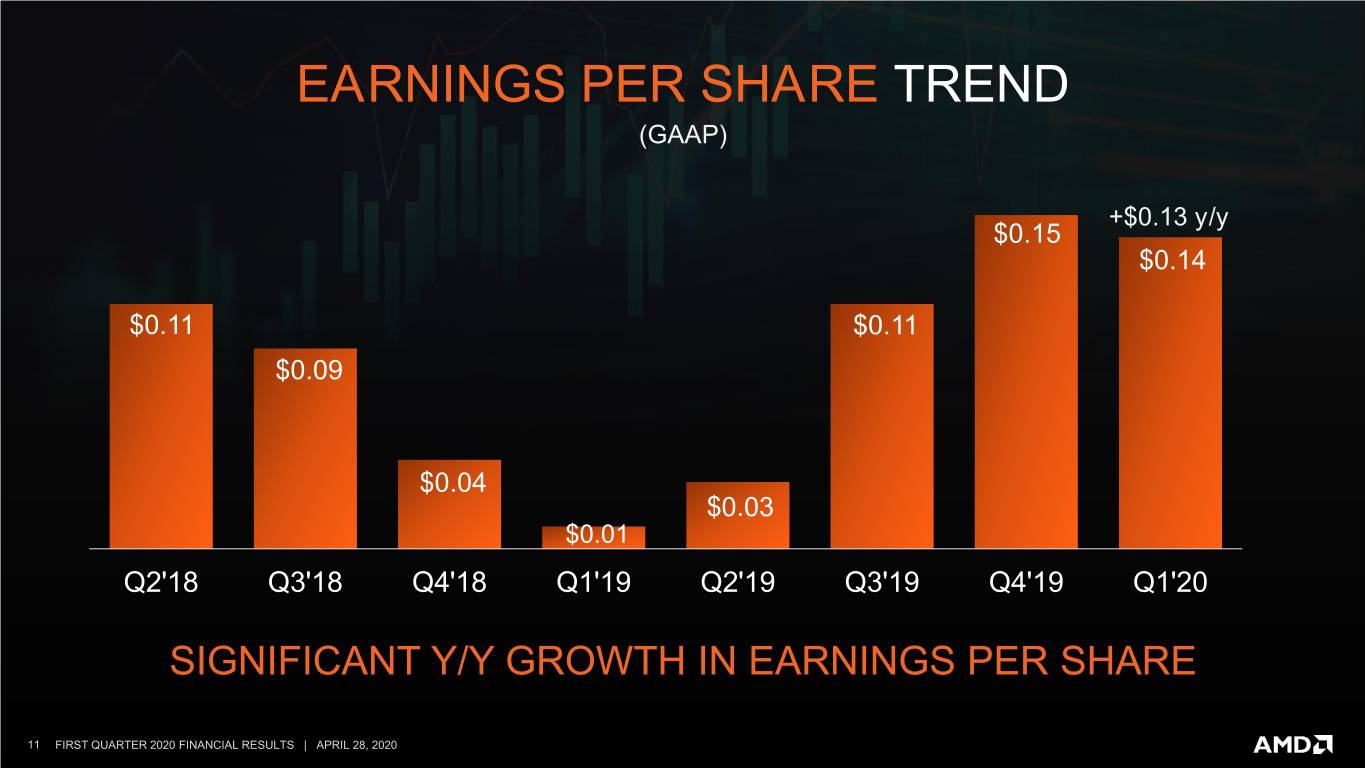

 
EARNINGS PER SHARE TREND (GAAP) +$0.13 y/y $0.15 $0.14 $0.11 $0.11 $0.09 $0.04 $0.03 $0.01 Q2'18 Q3'18 Q4'18 Q1'19 Q2'19 Q3'19 Q4'19 Q1'20 SIGNIFICANT Y/Y GROWTH IN EARNINGS PER SHARE 11 FIRST QUARTER 2020 FINANCIAL RESULTS | APRIL 28, 2020


EARNINGS PER SHARE TREND (NON-GAAP)¹ $0.32 +$0.12 y/y $0.18 $0.18 $0.14 $0.13 $0.08 $0.08 $0.06 Q2'18 Q3'18 Q4'18 Q1'19 Q2'19 Q3'19 Q4'19 Q1'20 SIGNIFICANT Y/Y GROWTH EARNINGS PER SHARE 12 FIRST QUARTER 2020 FINANCIAL RESULTS | APRIL 28, 2020 1. See Appendices for GAAP to Non-GAAP reconciliation
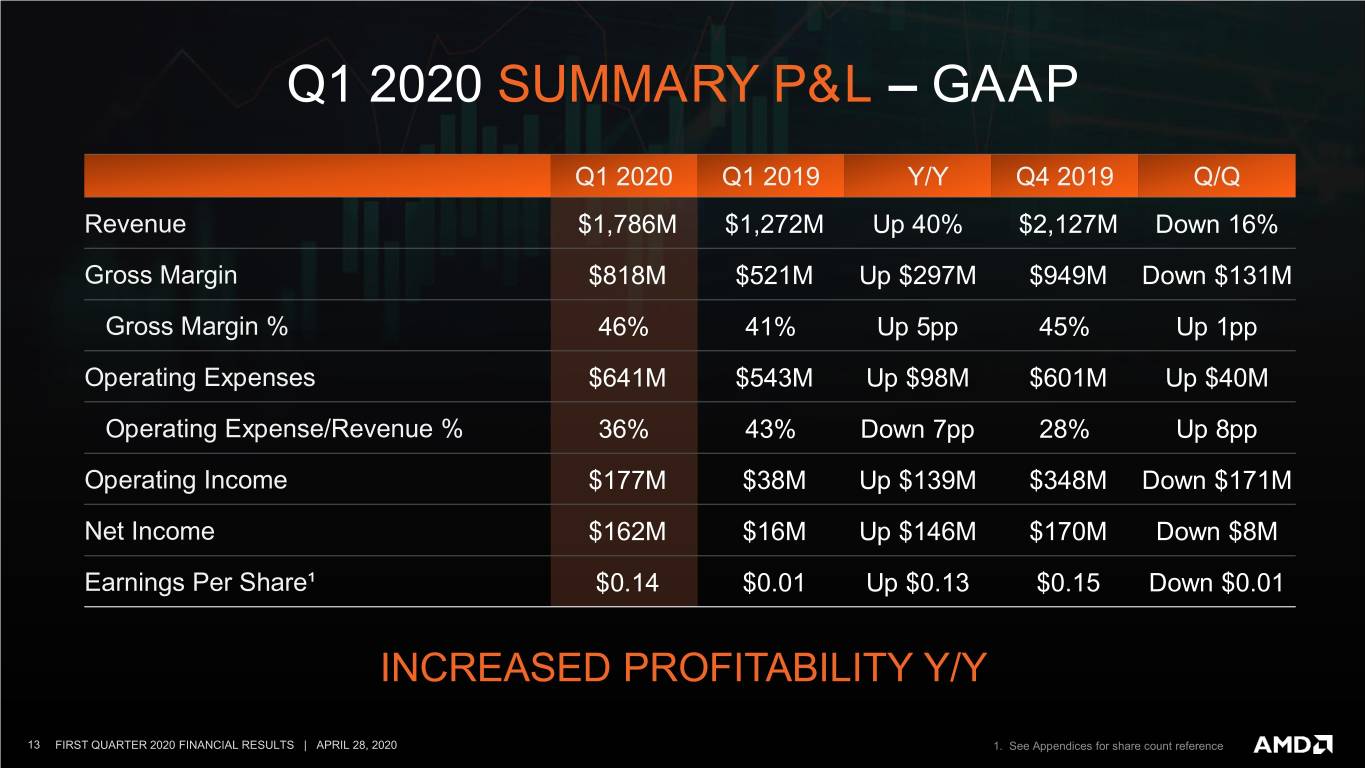

 
Q1 2020 SUMMARY P&L – GAAP Q1 2020 Q1 2019 Y/Y Q4 2019 Q/Q Revenue $1,786M $1,272M Up 40% $2,127M Down 16% Gross Margin $818M $521M Up $297M $949M Down $131M Gross Margin % 46% 41% Up 5pp 45% Up 1pp Operating Expenses $641M $543M Up $98M $601M Up $40M Operating Expense/Revenue % 36% 43% Down 7pp 28% Up 8pp Operating Income $177M $38M Up $139M $348M Down $171M Net Income $162M $16M Up $146M $170M Down $8M Earnings Per Share¹ $0.14 $0.01 Up $0.13 $0.15 Down $0.01 INCREASED PROFITABILITY Y/Y 13 FIRST QUARTER 2020 FINANCIAL RESULTS | APRIL 28, 2020 1. See Appendices for share count reference


Q1 2020 SUMMARY P&L – NON-GAAP¹ Q1 2020 Q1 2019 Y/Y Q4 2019 Q/Q Revenue $1,786M $1,272M Up 40% $2,127M Down 16% Gross Margin $820M $522M Up $298M $950M Down $130M Gross Margin % 46% 41% Up 5pp 45% Up 1pp Operating Expenses $584M $498M Up $86M $545M Up $39M Operating Expense/Revenue % 33% 39% Down 6pp 26% Up 7pp Operating Income $236M $84M Up $152M $405M Down $169M Net Income $222M $62M Up $160M $383M Down $161M Earnings Per Share¹ $0.18 $0.06 Up $0.12 $0.32 Down $0.14 INCREASED PROFITABILITY Y/Y 14 FIRST QUARTER 2020 FINANCIAL RESULTS | APRIL 28, 2020 1. See Appendices for GAAP to Non-GAAP reconciliation and share count reference
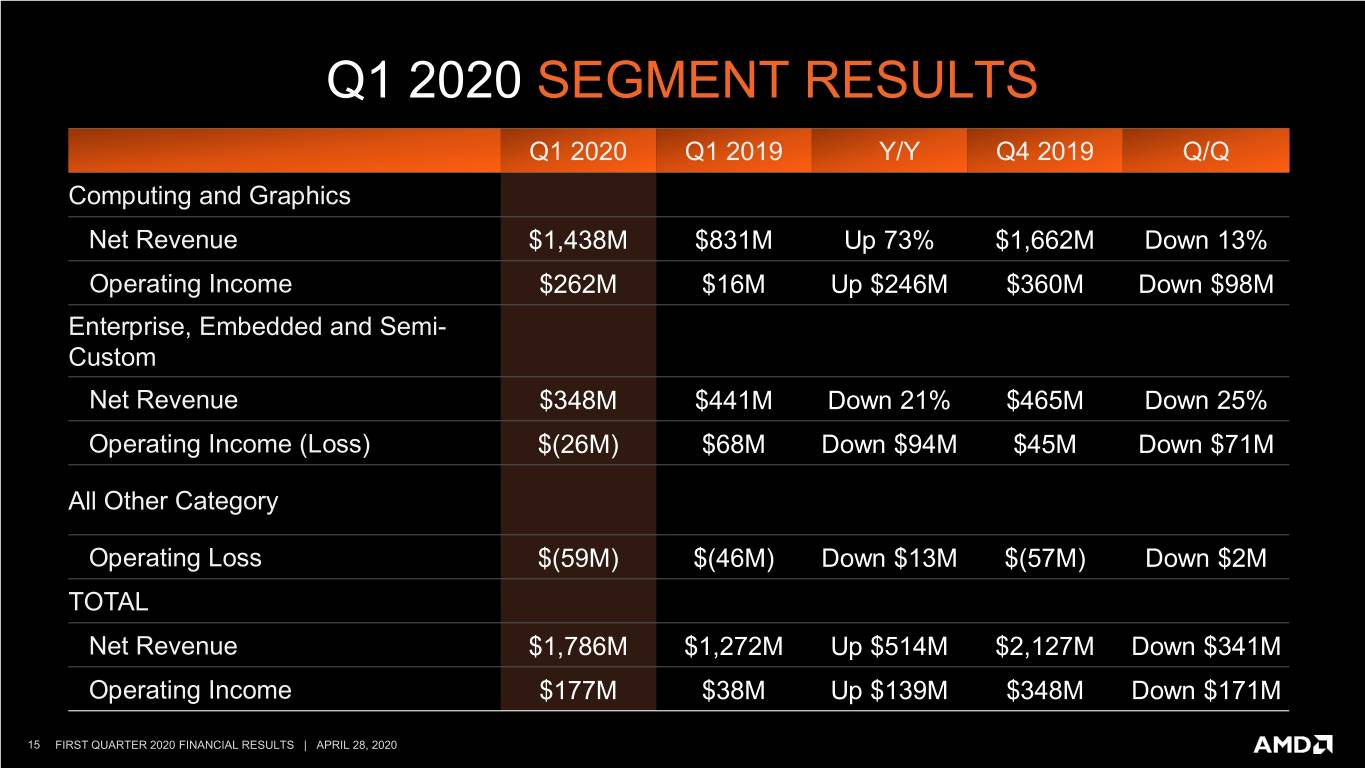

 
Q1 2020 SEGMENT RESULTS Q1 2020 Q1 2019 Y/Y Q4 2019 Q/Q Computing and Graphics Net Revenue $1,438M $831M Up 73% $1,662M Down 13% Operating Income $262M $16M Up $246M $360M Down $98M Enterprise, Embedded and Semi- Custom Net Revenue $348M $441M Down 21% $465M Down 25% Operating Income (Loss) $(26M) $68M Down $94M $45M Down $71M All Other Category Operating Loss $(59M) $(46M) Down $13M $(57M) Down $2M TOTAL Net Revenue $1,786M $1,272M Up $514M $2,127M Down $341M Operating Income $177M $38M Up $139M $348M Down $171M 15 FIRST QUARTER 2020 FINANCIAL RESULTS | APRIL 28, 2020


Q1 2020 SUMMARY BALANCE SHEET ITEMS Q1 2020 Q1 2019 Y/Y Q4 2019 Q/Q Cash, Cash Equivalents & Marketable $1,385M $1,194M Up $191M $1,503M Down $118M Securities Accounts Receivable, Net $1,691M $1,241M Up $450M $1,859M Down $168M Inventories, Net $1,056M $955M Up $101M $982M Up $74M Total Debt (principal amount)1 $563M $1,363M Down $800M $563M Flat Total Debt, Net1 $488M $1,094M Down $606M $486M Up $2M 1. See Appendices for Total Debt reconciliation 16 FIRST QUARTER 2020 FINANCIAL RESULTS | APRIL 28, 2020
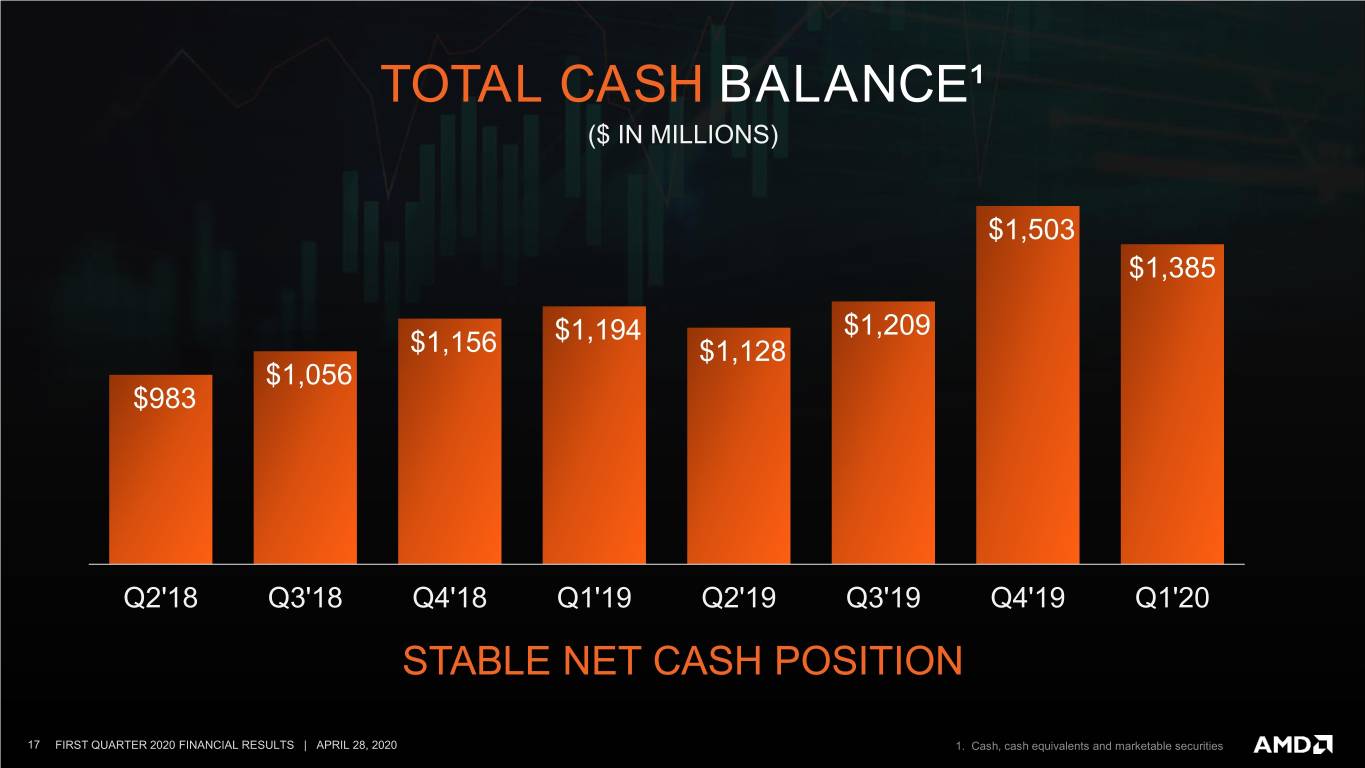

 
TOTAL CASH BALANCE¹ ($ IN MILLIONS) $1,503 $1,385 $1,194 $1,209 $1,156 $1,128 $1,056 $983 Q2'18 Q3'18 Q4'18 Q1'19 Q2'19 Q3'19 Q4'19 Q1'20 STABLE NET CASH POSITION 17 FIRST QUARTER 2020 FINANCIAL RESULTS | APRIL 28, 2020 1. Cash, cash equivalents and marketable securities


DEBT AND LEVERAGE TREND (DEBT PRINCIPAL AMOUNT, TRAILING TWELVE MONTHS ADJUSTED EBITDA AND NET INCOME TREND, $ IN MILLIONS)¹·²·³ Debt Balance TTM Adjusted EBITDA Leverage Ratio $1,685 $1,588 $1,528 $1,363 $1,293 $1,236 $1,087 2.5x $1,062 2.2x 1.9x $803 1.8x 1.9x $709 $737 $745 $666 $672 1.5x $563 $563 0.5x 0.5x Q2'18 Q3'18 Q4'18 Q1'19 Q2'19 Q3'19 Q4'19 Q1'20 TTM GAAP Net Income $239 $280 $337 $272 $191 $209 $341 $487 ACCESSED $200M FROM $500M REVOLVING LINE OF CREDIT IN EARLY Q2 2020 1. See Appendices for reconciliation to Total Debt (Net) 2. See Appendices for TTM Adjusted EBITDA and TTM GAAP Net Income 3. Gross Leverage = Principal debt divided by TTM adjusted EBITDA 18 FIRST QUARTER 2020 FINANCIAL RESULTS | APRIL 28, 2020
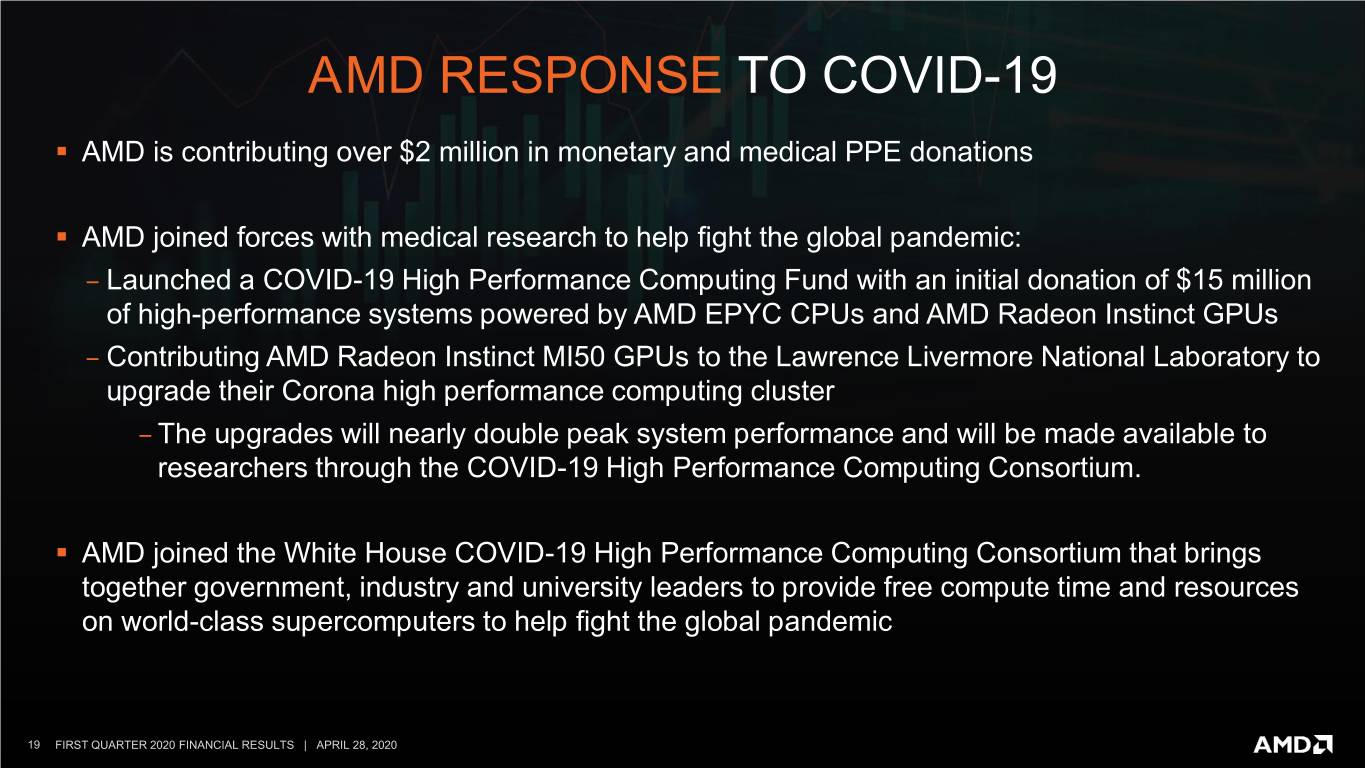

 
AMD RESPONSE TO COVID-19 ▪ AMD is contributing over $2 million in monetary and medical PPE donations ▪ AMD joined forces with medical research to help fight the global pandemic: ‒ Launched a COVID-19 High Performance Computing Fund with an initial donation of $15 million of high-performance systems powered by AMD EPYC CPUs and AMD Radeon Instinct GPUs ‒ Contributing AMD Radeon Instinct MI50 GPUs to the Lawrence Livermore National Laboratory to upgrade their Corona high performance computing cluster ‒ The upgrades will nearly double peak system performance and will be made available to researchers through the COVID-19 High Performance Computing Consortium. ▪ AMD joined the White House COVID-19 High Performance Computing Consortium that brings together government, industry and university leaders to provide free compute time and resources on world-class supercomputers to help fight the global pandemic 19 FIRST QUARTER 2020 FINANCIAL RESULTS | APRIL 28, 2020
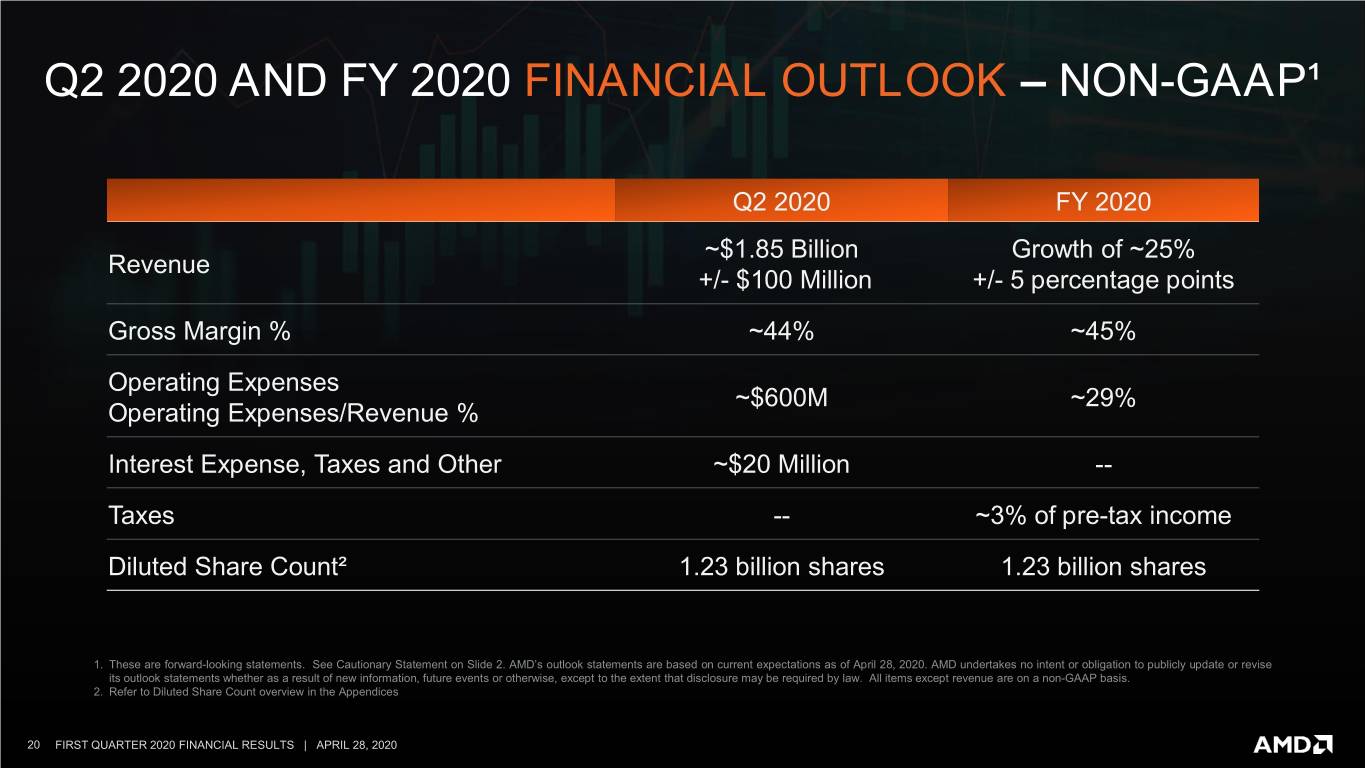

 
Q2 2020 AND FY 2020 FINANCIAL OUTLOOK – NON-GAAP¹ Q2 2020 FY 2020 ~$1.85 Billion Growth of ~25% Revenue +/- $100 Million +/- 5 percentage points Gross Margin % ~44% ~45% Operating Expenses ~$600M ~29% Operating Expenses/Revenue % Interest Expense, Taxes and Other ~$20 Million -- Taxes -- ~3% of pre-tax income Diluted Share Count² 1.23 billion shares 1.23 billion shares 1. These are forward-looking statements. See Cautionary Statement on Slide 2. AMD’s outlook statements are based on current expectations as of April 28, 2020. AMD undertakes no intent or obligation to publicly update or revise its outlook statements whether as a result of new information, future events or otherwise, except to the extent that disclosure may be required by law. All items except revenue are on a non-GAAP basis. 2. Refer to Diluted Share Count overview in the Appendices 20 FIRST QUARTER 2020 FINANCIAL RESULTS | APRIL 28, 2020
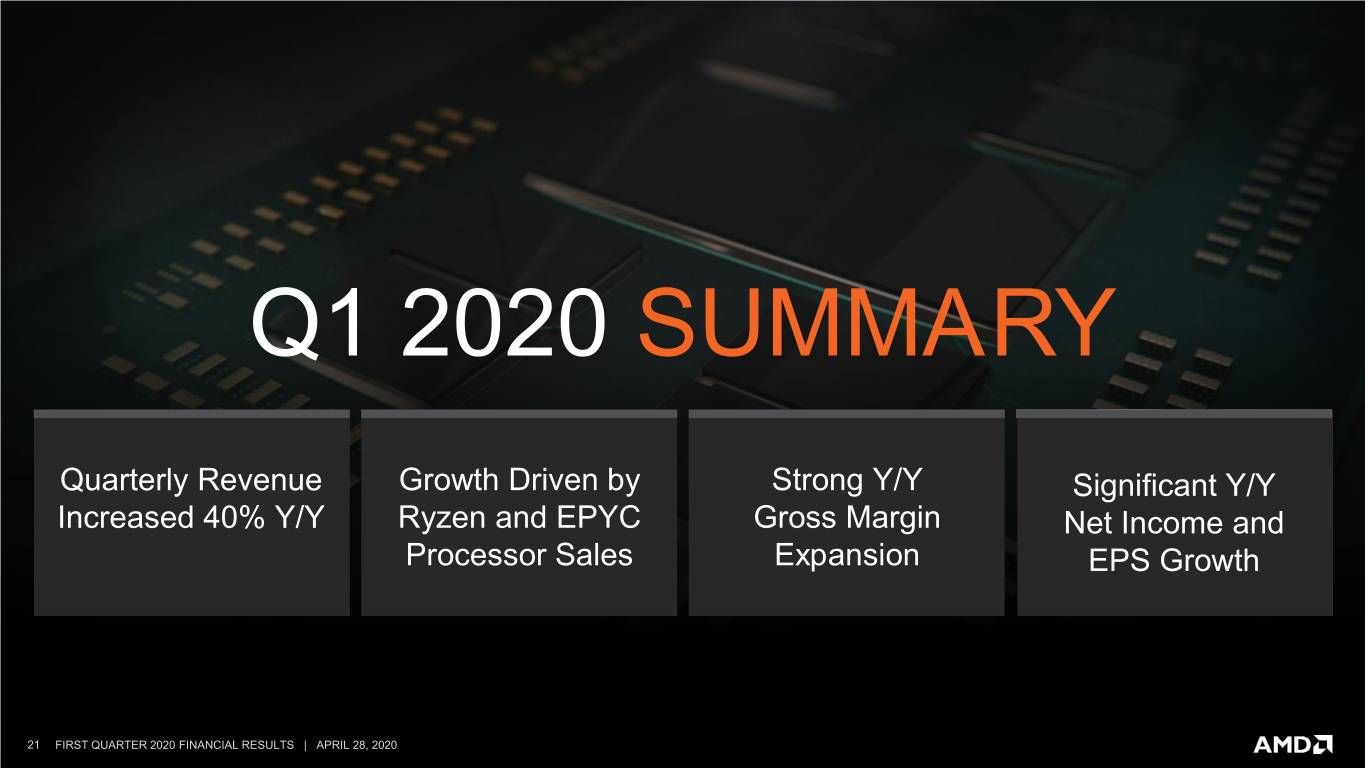

 
Q1 2020 SUMMARY Quarterly Revenue Growth Driven by Strong Y/Y Significant Y/Y Increased 40% Y/Y Ryzen and EPYC Gross Margin Net Income and Processor Sales Expansion EPS Growth 21 FIRST QUARTER 2020 FINANCIAL RESULTS | APRIL 28, 2020


BUILDING THE BEST Leadership Execution Sustained Market Strong Roadmaps Excellence Share Gains Financial Returns 22 FIRST QUARTER 2020 FINANCIAL RESULTS | APRIL 28, 2020
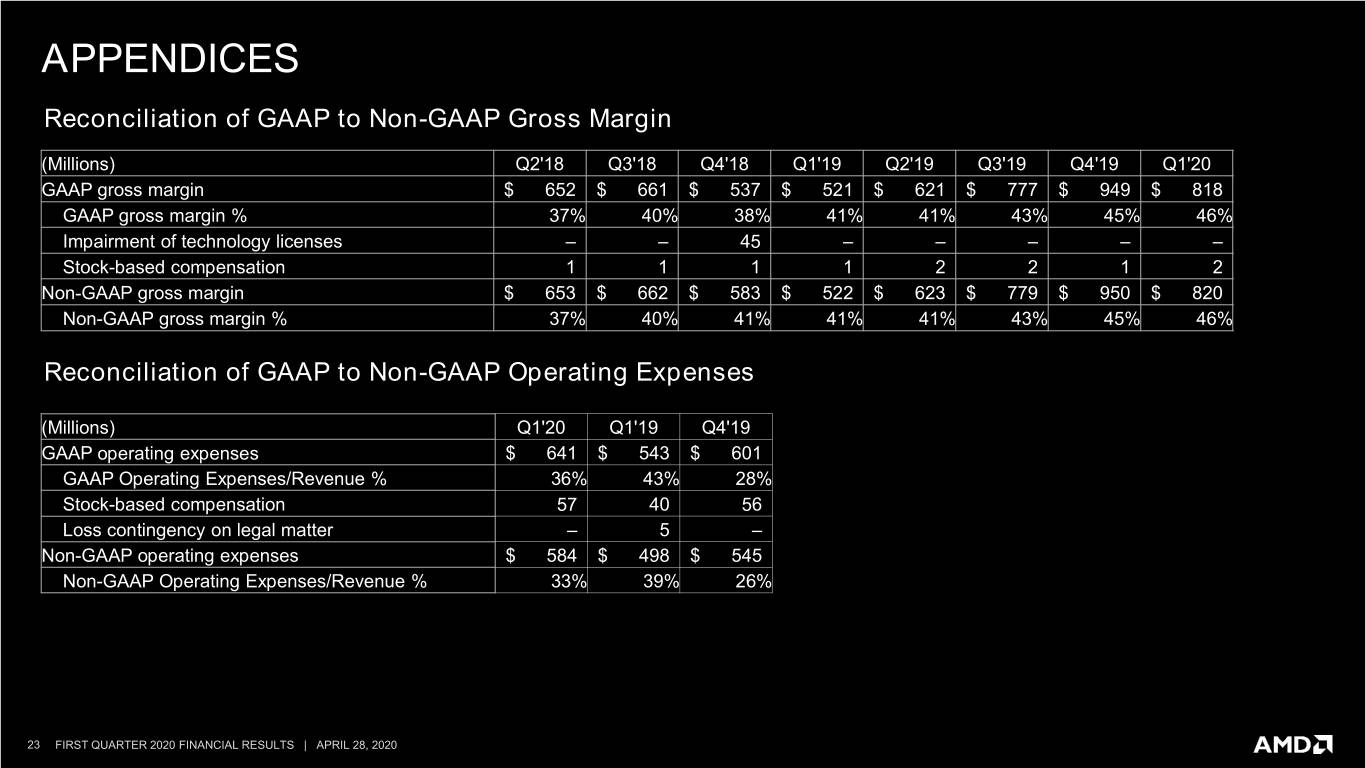

 
APPENDICES Reconciliation of GAAP to Non-GAAP Gross Margin (Millions) Q2'18 Q3'18 Q4'18 Q1'19 Q2'19 Q3'19 Q4'19 Q1'20 GAAP gross margin $ 652 $ 661 $ 537 $ 521 $ 621 $ 777 $ 949 $ 818 GAAP gross margin % 37% 40% 38% 41% 41% 43% 45% 46% Impairment of technology licenses – – 45 – – – – – Stock-based compensation 1 1 1 1 2 2 1 2 Non-GAAP gross margin $ 653 $ 662 $ 583 $ 522 $ 623 $ 779 $ 950 $ 820 Non-GAAP gross margin % 37% 40% 41% 41% 41% 43% 45% 46% Reconciliation of GAAP to Non-GAAP Operating Expenses (Millions) Q1'20 Q1'19 Q4'19 GAAP operating expenses $ 641 $ 543 $ 601 GAAP Operating Expenses/Revenue % 36% 43% 28% Stock-based compensation 57 40 56 Loss contingency on legal matter – 5 – Non-GAAP operating expenses $ 584 $ 498 $ 545 Non-GAAP Operating Expenses/Revenue % 33% 39% 26% 23 FIRST QUARTER 2020 FINANCIAL RESULTS | APRIL 28, 2020


APPENDICES Reconciliation of GAAP Operating Income to Non-GAAP Operating Income (Millions) Q1'20 Q1'19 Q4'19 GAAP operating income $ 177 $ 38 $ 348 Stock-based compensation 59 41 57 Loss contingency on legal matter – 5 – Non-GAAP operating income $ 236 $ 84 $ 405 Reconciliation of GAAP Net Income to Adjusted EBITDA (Calculated as Trailing Twelve Months) (Millions) Q2'18 Q3'18 Q4'18 Q1'19 Q2'19 Q3'19 Q4'19 Q1'20 GAAP net income $ 239 $ 280 $ 337 $ 272 $ 191 $ 209 $ 341 $ 487 Interest expense 124 123 121 117 111 105 94 80 Other (income) expense, net (1) 2 – 8 6 36 165 154 Provision for (benefit from) income taxes 24 14 (9) (30) (34) (39) 31 50 Equity loss (income) in investee 4 2 2 2 1 – – (1) Stock-based compensation 115 122 137 146 158 176 197 215 Depreciation and amortization 161 166 170 172 182 201 222 244 Impairment of technology licenses – – 45 45 45 45 – – Loss contingency on legal matter – – – 5 12 12 12 7 Adjusted EBITDA $ 666 $ 709 $ 803 $ 737 $ 672 $ 745 $ 1,062 $ 1,236 24 FIRST QUARTER 2020 FINANCIAL RESULTS | APRIL 28, 2020


APPENDICES Reconciliation of GAAP to Non-GAAP Net Income / Earnings Per Share (Millions, except per share data) Q2'18 Q3'18 Q4'18 Q1'19 Q2'19 Q3'19 Q4'19 Q1'20 GAAP net income / earnings per share $ 116 $ 0.11 $ 102 $ 0.09 $ 38 $ 0.04 $ 16 $ 0.01 $ 35 $ 0.03 $ 120 $ 0.11 $ 170 $ 0.15 $ 162 $ 0.14 Loss on debt redemption/conversion – – 6 – 5 – 8 0.01 – – 40 0.03 128 0.10 – – Non-cash interest expense related to convertible debt 6 – 6 0.01 6 0.01 6 0.01 6 – 6 – 4 – 2 – Stock-based compensation 33 0.03 36 0.03 36 0.03 41 0.04 45 0.04 54 0.04 57 0.05 59 0.04 Impairment of technology licenses – – – – 45 0.04 – – – – – – – – – – Equity (income) loss in investee 1 – – – – – 1 – – – (1) – – – – – Loss contingency on legal matter – – – – – – 5 – 7 0.01 – – – – – – Provision for (benefit from) income taxes – – – – – – (15) (0.01) (1) – – – 24 0.02 (1) – Withholding tax refund including interest – – – – (43) (0.04) – – – – – – – – – – Non-GAAP net income / earnings per share $ 156 $ 0.14 $ 150 $ 0.13 $ 87 $ 0.08 $ 62 $ 0.06 $ 92 $ 0.08 $ 219 $ 0.18 $ 383 $ 0.32 $ 222 $ 0.18 Shares used and net income adjustment in earnings per share calculation Shares used in per share calculation (GAAP) (1) 1,147 1,076 1,079 1,094 1,109 1,117 1,188 1,224 Interest expense add back to GAAP net income (1) $ 11 $ - $ - $ - $ - $ - $ 4 $ 4 Shares used in per share calculation (Non-GAAP) 1,147 1,177 1,180 1,195 1,210 1,212 1,216 1,224 Interest expense add back to Non-GAAP net income $ 5 $ 5 $ 5 $ 5 $ 5 $ 4 $ 2 $ 2 (1) Q2'18 GAAP diluted EPS calculation includes 100.6 million shares related to the Company’s 2026 Convertible Notes and the associated $11 million interest expense add-back to net income under the "if converted" method. Q4’19 and Q1’20 GAAP diluted EPS calculation includes 31 million shares related to the Company's 2026 Convertible Notes and the associated $4 million interest expense add-back to net income under the "if converted" method. The 53 million shares (28 million weighted-average) issued in exchange for $428 million of convertible debt in Q4’19 were not included as their inclusion would have been anti-dilutive. 25 FIRST QUARTER 2020 FINANCIAL RESULTS | APRIL 28, 2020
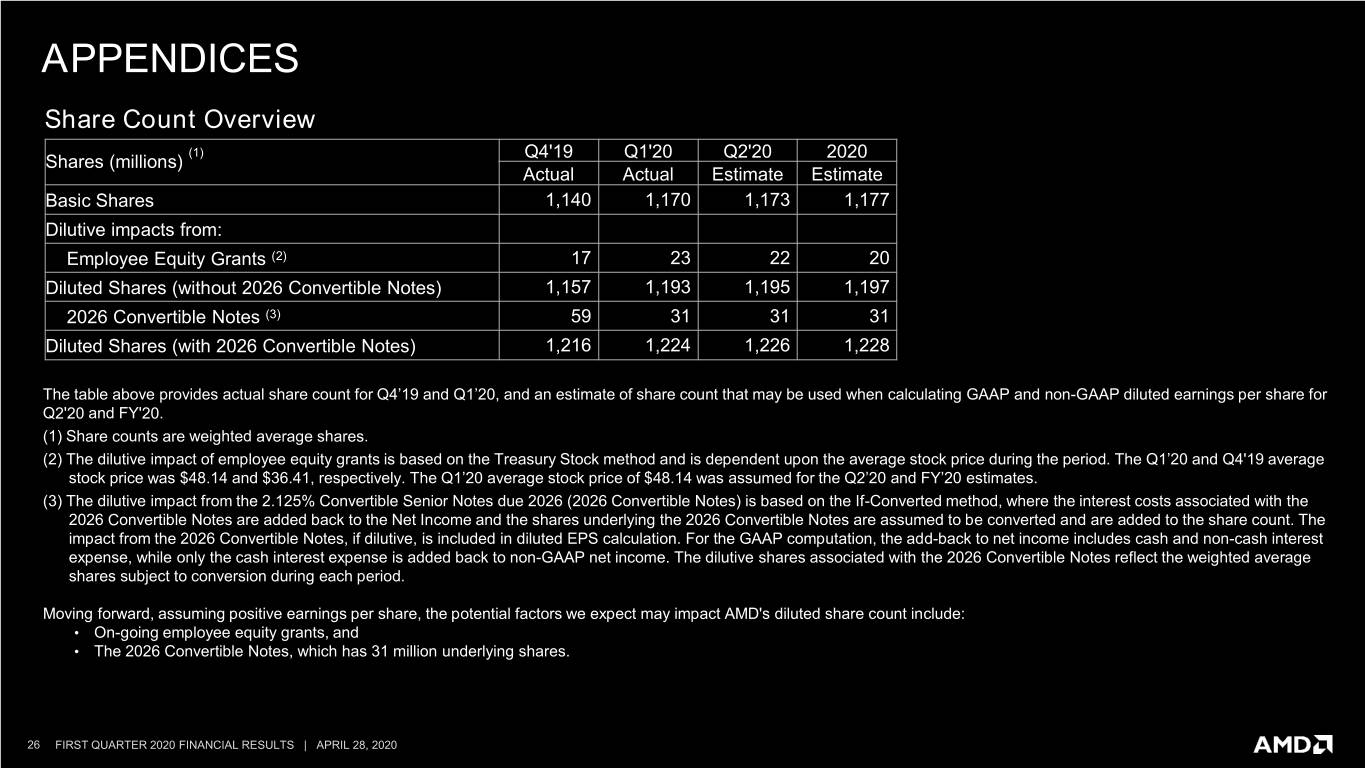

 
APPENDICES Share Count Overview (1) Q4'19 Q1'20 Q2'20 2020 Shares (millions) Actual Actual Estimate Estimate Basic Shares 1,140 1,170 1,173 1,177 Dilutive impacts from: Employee Equity Grants (2) 17 23 22 20 Diluted Shares (without 2026 Convertible Notes) 1,157 1,193 1,195 1,197 2026 Convertible Notes (3) 59 31 31 31 Diluted Shares (with 2026 Convertible Notes) 1,216 1,224 1,226 1,228 The table above provides actual share count for Q4’19 and Q1’20, and an estimate of share count that may be used when calculating GAAP and non-GAAP diluted earnings per share for Q2'20 and FY'20. (1) Share counts are weighted average shares. (2) The dilutive impact of employee equity grants is based on the Treasury Stock method and is dependent upon the average stock price during the period. The Q1’20 and Q4'19 average stock price was $48.14 and $36.41, respectively. The Q1’20 average stock price of $48.14 was assumed for the Q2’20 and FY’20 estimates. (3) The dilutive impact from the 2.125% Convertible Senior Notes due 2026 (2026 Convertible Notes) is based on the If-Converted method, where the interest costs associated with the 2026 Convertible Notes are added back to the Net Income and the shares underlying the 2026 Convertible Notes are assumed to be converted and are added to the share count. The impact from the 2026 Convertible Notes, if dilutive, is included in diluted EPS calculation. For the GAAP computation, the add-back to net income includes cash and non-cash interest expense, while only the cash interest expense is added back to non-GAAP net income. The dilutive shares associated with the 2026 Convertible Notes reflect the weighted average shares subject to conversion during each period. Moving forward, assuming positive earnings per share, the potential factors we expect may impact AMD's diluted share count include: • On-going employee equity grants, and • The 2026 Convertible Notes, which has 31 million underlying shares. 26 FIRST QUARTER 2020 FINANCIAL RESULTS | APRIL 28, 2020
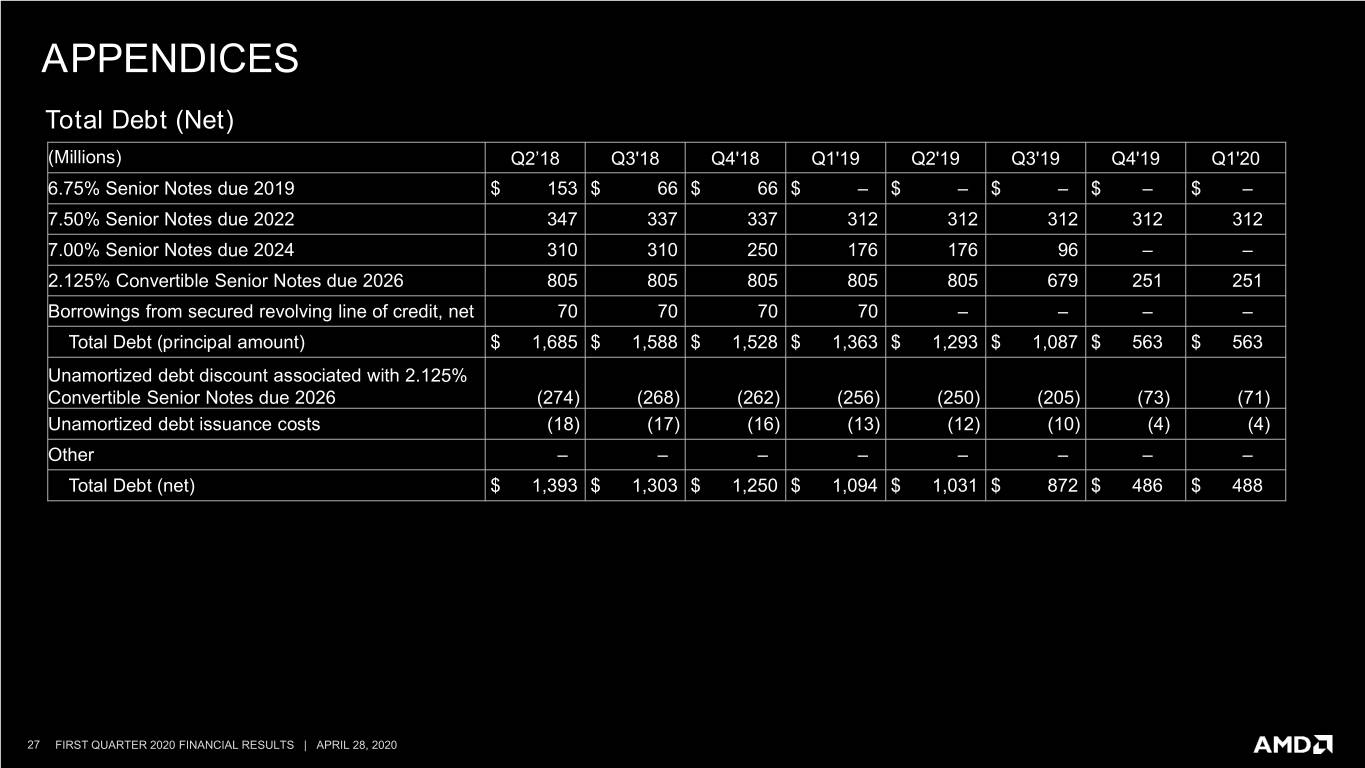

 
APPENDICES Total Debt (Net) (Millions) Q2’18 Q3'18 Q4'18 Q1'19 Q2'19 Q3'19 Q4'19 Q1'20 6.75% Senior Notes due 2019 $ 153 $ 66 $ 66 $ – $ – $ – $ – $ – 7.50% Senior Notes due 2022 347 337 337 312 312 312 312 312 7.00% Senior Notes due 2024 310 310 250 176 176 96 – – 2.125% Convertible Senior Notes due 2026 805 805 805 805 805 679 251 251 Borrowings from secured revolving line of credit, net 70 70 70 70 – – – – Total Debt (principal amount) $ 1,685 $ 1,588 $ 1,528 $ 1,363 $ 1,293 $ 1,087 $ 563 $ 563 Unamortized debt discount associated with 2.125% Convertible Senior Notes due 2026 (274) (268) (262) (256) (250) (205) (73) (71) Unamortized debt issuance costs (18) (17) (16) (13) (12) (10) (4) (4) Other – – – – – – – – Total Debt (net) $ 1,393 $ 1,303 $ 1,250 $ 1,094 $ 1,031 $ 872 $ 486 $ 488 27 FIRST QUARTER 2020 FINANCIAL RESULTS | APRIL 28, 2020