
UNITED STATES
SECURITIES AND EXCHANGE COMMISSION
WASHINGTON, DC 20549
_______________

FORM 8-K
 
 CURRENT REPORT
Pursuant to Section 13 or 15(d) of the
Securities Exchange Act of 1934
 
Date of report (Date of earliest event reported): February 10, 2020

 CONTURA ENERGY, INC.
(Exact Name of Registrant as Specified in Charter)
 
Delaware
(State or Other Jurisdiction of Incorporation) 
001-38735
81-3015061
(Commission File Number)
(IRS Employer Identification No.)
 
340 Martin Luther King Jr. Blvd.
Bristol, Tennessee 37620
(Address of Principal Executive Offices, zip code)
 
(423) 573-0300
(Registrant’s telephone number, including area code)
 
Not Applicable
(Former Name or Former Address, if Changed Since Last Report)

Check the appropriate box below if the Form 8-K filing is intended to simultaneously satisfy the filing obligation of the registrant under any of the following provisions:
¨ Written communications pursuant to Rule 425 under the Securities Act (17 CFR 230.425)
¨ Soliciting material pursuant to Rule 14a-12 under the Exchange Act (17 CFR 240.14a-12)
¨ Pre-commencement communications pursuant to Rule 14d-2(b) under the Exchange Act (17 CFR 240.14d-2(b))
¨ Pre-commencement communications pursuant to Rule 13e-4(c) under the Exchange Act (17 CFR 240.13e-4(c))
Securities registered pursuant to Section 12(b) of the Act:
Title of each class
Trading Symbol(s)
Name of each exchange on which registered
Common Stock
CTRA
New York Stock Exchange
Indicate by check mark whether the registrant is an emerging growth company as defined in Rule 405 of the Securities Act of 1933 (§230.405 of this chapter) or Rule 12b-2 of the Securities Exchange Act of 1934 (§240.12b-2 of this chapter).
Emerging Growth Company      ¨
If an emerging growth company, indicate by check mark if the registrant has elected not to use the extended transition period for complying with any new or revised financial accounting standards provided pursuant to Section 13(a) of the Exchange Act. ¨ 


TABLE OF CONTENTS


Item 2.02 Results of Operations and Financial Condition. 

On February 10, 2020, Contura Energy, Inc. (“Contura”) issued a press release announcing certain preliminary, unaudited financial results for its fiscal quarter ended December 31, 2019. The press release is attached hereto as Exhibit 99.1.

Preliminary, unaudited financial results for the fiscal quarter ended December 31, 2019 contained in the written presentation described in Item 7.01 below and attached hereto as Exhibit 99.2 are hereby incorporated by reference.

This Current Report on Form 8-K and the earnings press release attached hereto are being furnished by the Registrant pursuant to Item 2.02 “Results of Operations and Financial Condition.” In accordance with General Instruction B.2 of Form 8-K, the information contained in this Current Report on Form 8-K, including Exhibit 99.1, shall not be deemed “filed” for the purposes of Section 18 of the Securities Exchange Act of 1934, as amended, or otherwise subject to the liability of that section or Sections 11 and 12(a)(2) of the Securities Act of 1933, as amended. In addition, this information shall not be deemed incorporated by reference into any of the Registrant’s filings with the Securities and Exchange Commission, except as shall be expressly set forth by specific reference in any such filing.


Item 7.01 Regulation FD Disclosure.
 
On February 10, 2020, Contura management will meet with current and potential investors. A copy of the written presentation to be used in connection with these meetings is attached hereto as Exhibit 99.2.

This Current Report on Form 8-K and the presentation attached hereto are being furnished by the Registrant pursuant to Item 7.01, “Regulation FD Disclosure.” In accordance with General Instruction B.2 of Form 8-K, the information contained in this Current Report on Form 8-K, including Exhibit 99.2, shall not be deemed “filed” for the purposes of Section 18 of the Securities Exchange Act of 1934, as amended, or otherwise subject to the liability of that section or Sections 11 and 12(a)(2) of the Securities Act of 1933, as amended. In addition, this information shall not be deemed incorporated by reference into any of the Registrant’s filings with the Securities and Exchange Commission, except as shall be expressly set forth by specific reference in any such filing.


Item 9.01 Financial Statements and Exhibits. 

(d) Exhibits

Exhibit 99.1
Press Release dated February 10, 2020
Exhibit 99.2
Investor Presentation


SIGNATURES
Pursuant to the requirements of the Securities Exchange Act of 1934, the registrant has duly caused this report to be signed on its behalf by the undersigned hereunto duly authorized.
 
Contura Energy, Inc.


Date: February 10, 2020
By:
/s/ C. Andrew Eidson
 
 
Name: C. Andrew Eidson
 
 
Title: Executive Vice President and Chief Financial Officer


EXHIBIT INDEX

Exhibit No.
Description
Exhibit 99.1
Exhibit 99.2


Exhibit 99.1

image0a41.jpg
newsreleaseimagea08.jpg
FOR IMMEDIATE RELEASE                         


Contura Announces Updated 2020 Guidance and Certain Preliminary, Unaudited Fourth Quarter 2019 Results

Exchange Call with Contura Management on February 11

Coal revenues of $497 million and coal revenues excluding freight and handling fulfillment revenues(1) of $424 million for the fourth quarter
6 million tons of coal sold in the quarter
Year-end unrestricted cash balance of $213 million; total liquidity of $328 million

BRISTOL, Tenn., February 10, 2020 - Contura Energy, Inc. (NYSE: CTRA), a leading U.S. coal supplier, today announced updated guidance for 2020 as well as certain preliminary, unaudited financial results for the fourth quarter of 2019. The company expects to announce its audited financial results for full-year and fourth quarter 2019 on or about March 13, 2020.

“As we continue to chart a new course for Contura, one that includes broad operational improvements, cost containment at administrative and overhead levels, and a lean, nimble organizational structure that facilitates quicker decisions, I felt it important to share an interim update on the company,” said David Stetson, Contura’s chairman and chief executive officer. “The progress made on all of these fronts during the fourth quarter gives us confidence in revising our previously issued guidance to reflect our efforts in reducing costs, as well as a recognition of the need for changing sales targets to better reflect the reality of the current environment.”

“Despite the market headwinds of the last several months, I am proud that our team has delivered a strong performance in containing costs, streamlining decision-making and safely increasing productivity,” said Stetson. “Circumstances like these require difficult decisions, but we continue to meet these challenges with strategic thinking and a commitment to closely managing the parts of the business within our control.”


(1) Represents non-GAAP coal revenues which is defined and reconciled under "Non-GAAP Financial Measures" and "Certain Preliminary Unaudited Results of Operations."


releasefootera13.jpg


Unaudited Operational Results:
 
(in millions, except for per ton data)
 
4Q19
3Q19
Coal revenues
$497.2
$524.0
Cost of coal sales
$444.6
$467.7


Coal revenues (excl. f&h) (2)
$424.1
$461.1
Cost of coal sales (excl. f&h/idle) (2)
$365.9
$400.0


Tons sold
 
 
CAPP - Met
3.3
3.0
CAPP - Thermal
0.9
1.1
NAPP
1.5
1.6
Coal sales realization per ton (2)
 
 
CAPP - Met
$94.98
$108.35
CAPP - Thermal
$56.13
$61.46
NAPP
$41.17
$41.33
Cost of coal sales per ton sold (2)
 
 
CAPP - Met
$82.13
$87.32
CAPP - Thermal
$49.21
$59.17
NAPP
$34.67
$43.87
Coal margin per ton (2)
 
 
CAPP - Met
$12.85
$21.03
CAPP - Thermal
$6.92
$2.29
NAPP
$6.50
$(2.54)

__________________________________
(2) Represents non-GAAP coal revenues, non-GAAP cost of coal sales, non-GAAP coal sales realization per ton, non-GAAP cost of coal sales per ton, and non-GAAP coal margin per ton which are defined and reconciled under "Non-GAAP Financial Measures" and "Certain Preliminary Unaudited Results of Operations."

“In spite of challenged coal markets and multiple reductions in overhead staffing, Contura’s Central Appalachian (CAPP) deep mines showed continued strengthening in Q4 realizing nearly a 10% increase in feet per shift over Q3 performance. It is important to note that Contura’s CAPP NFDL safety rate also improved by nearly 10% over the same period,” said Jason Whitehead, Contura’s chief operating officer. “Continuing our strategic initiatives of reducing our thermal footprint, Contura’s Republic Surface mine has now redesigned and accelerated its plans to shift into a metallurgical mine. Previously a thermal coal operation in 2019, Republic output has now reached 60% metallurgical quality. Our Highland Surface and Black Castle Surface mines are continuing to execute on their mine-to-reclamation plans and will conclude production in Q1 of 2020 and Q1 of 2021 respectively.”


Other Unaudited Financial Measures:
 
(millions)
 
Three months ended
 
Dec. 31, 2019
SG&A
$25.8
Less: non-cash stock compensation and one-time expenses
($12.7)
Non-GAAP SG&A(3)
$13.1
__________________________________
(3) Refer to “Non-GAAP Financial Measures” below.

Selling, general and administrative (SG&A) expense for the fourth quarter was $25.8 million. Non-GAAP SG&A expense for the quarter was $13.1 million, excluding $12.7 million of non-cash or one-time expenses, including stock compensation and severance and management restructuring costs. Idle/closed mine costs were approximately $6 million in the fourth quarter, and the company also anticipates a loss on disposal of assets of approximately $7 million.

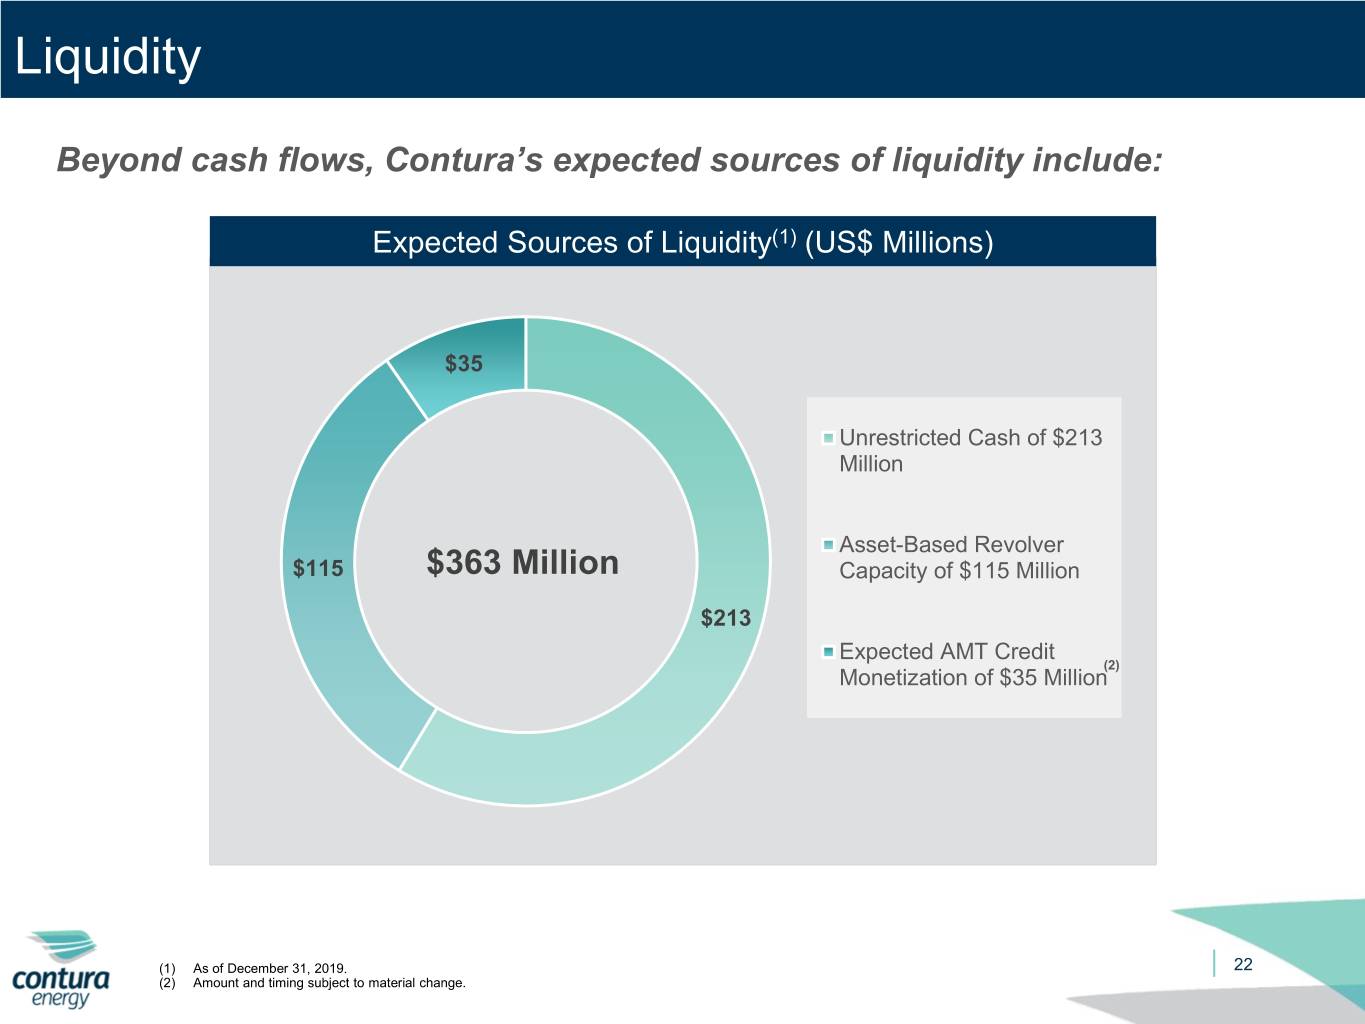
At the end of 2019, Contura had a total liquidity of $327.8 million, including cash and cash equivalents of $212.8 million, which includes the receipt of an AMT credit refund of $65.3 million, and $115.0 million of unused commitments available under the Asset-Based Revolving Credit Facility.

Contura is performing goodwill and long-lived asset impairment tests as of December 31, 2019 primarily due to the decline in global coal market pricing and Contura’s equity pricing. Based on preliminary impairment testing results, the company expects that it will be required to record a long-lived asset impairment charge of approximately $60 million to write down the carrying value of the company’s long-lived assets. In the fourth quarter, the company also expects to record a goodwill impairment charge, potentially up to the full carrying value of $124 million.

Capital Projects Update

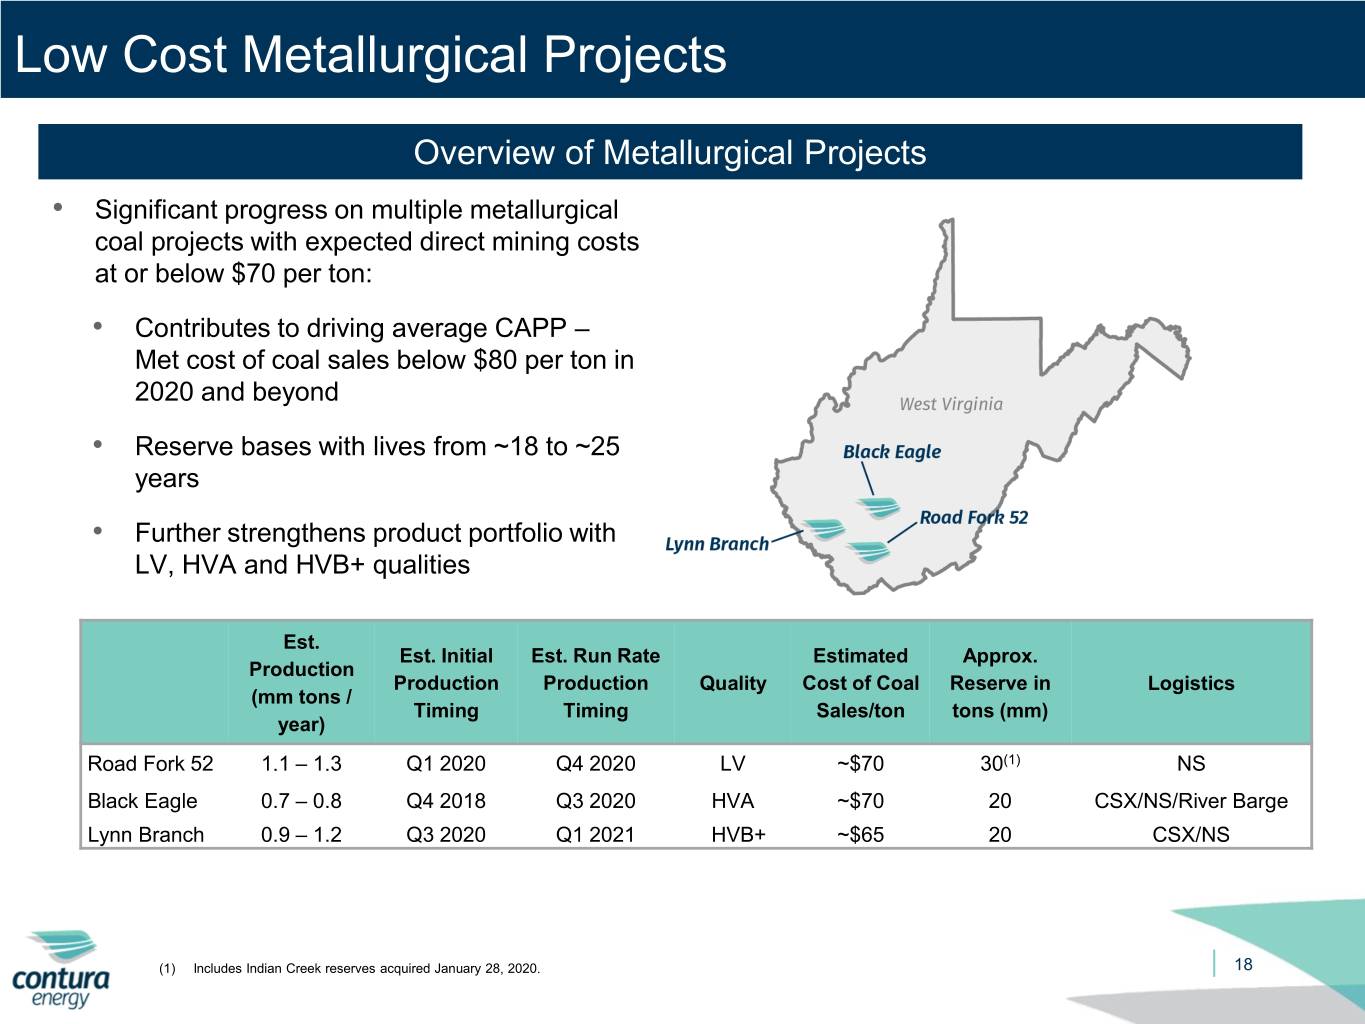
The Kepler complex, which produces premium CAPP low volatile metallurgical coal, finished excavation of the Road Fork 52 slope during the fourth quarter of 2019 and initiated installation of ventilation systems, a conveyor and other infrastructure. As previously announced, Road Fork 52 is expected to begin production late in the first quarter of 2020.

The Black Eagle mine is continuing development, on its planned pace, of a mine corridor towards the main reserve body. Corridor development is expected to conclude in the fourth quarter of 2020. Black Eagle will continue to contribute low ash and low sulfur premier high volatile coal to Marfork.


With all necessary property acquisitions completed, Bandmill’s Lynn Branch mine began construction during the fourth quarter of 2019. Production in the 20-million-ton high volatile metallurgical reserve body is expected to commence in the third quarter of 2020.

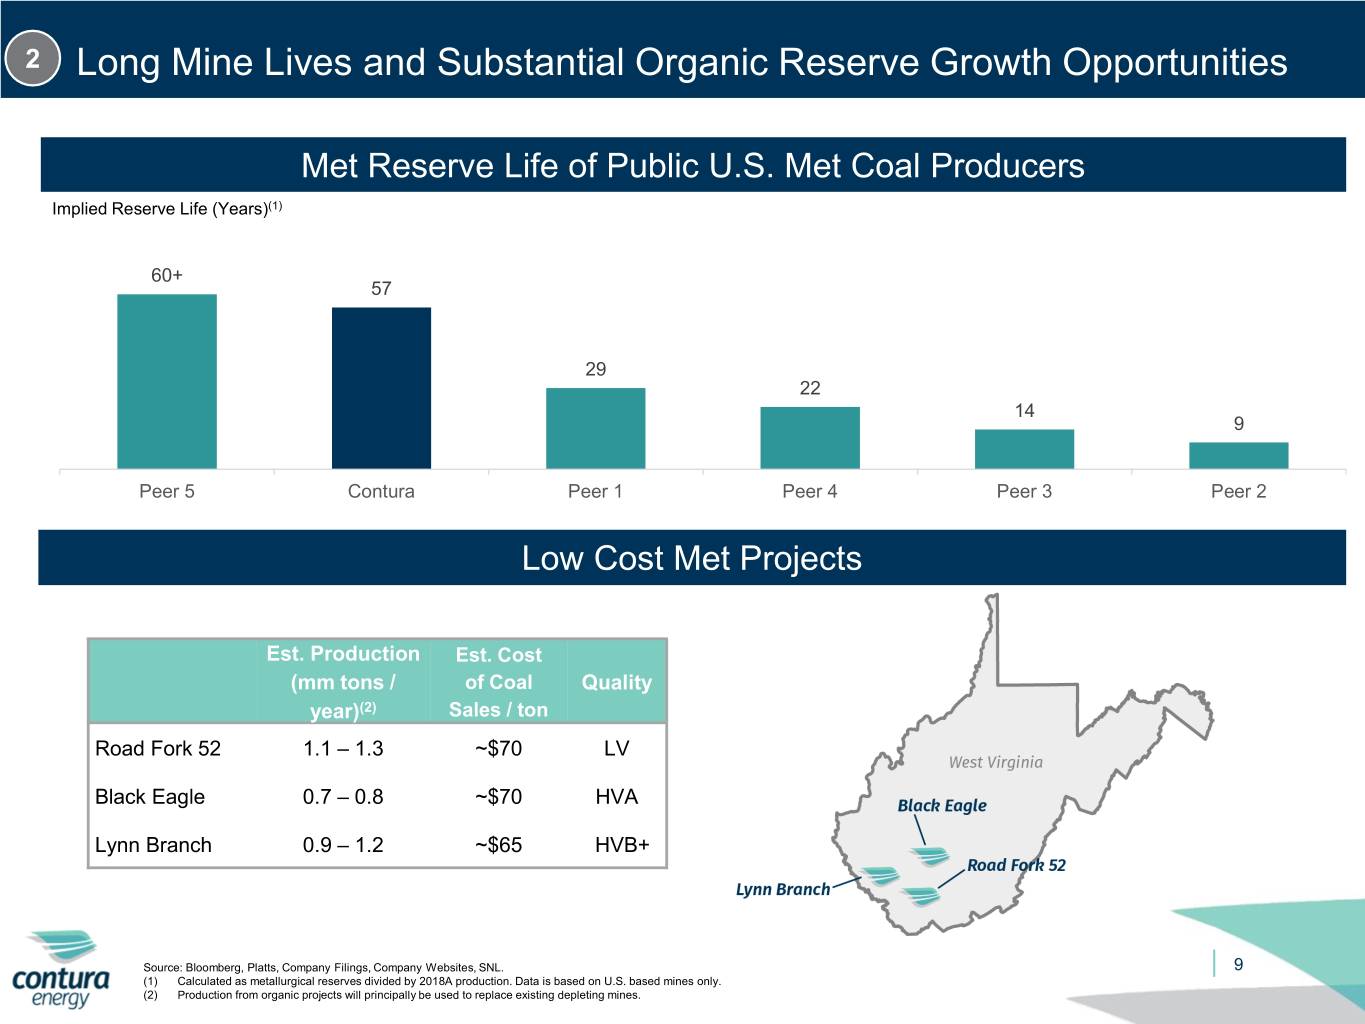
Together, Road Fork 52, Black Eagle and Lynn Branch represent approximately 27% of annual metallurgical capacity with cost structures expected to be in the $65-$70 range.

Indian Creek Reserves Transaction Closing

On January 28, 2020, the company closed on a previously announced acquisition of certain assets adjacent to Contura’s recently excavated Road Fork 52 slope in Wyoming County, West Virginia. Contura purchased certain mining equipment and other assets from Mission Coal Company, LLC (Mission), and entered into a new lease with the owner of the coal reserves. Mission formerly controlled the coal reserves when it filed for Chapter 11 bankruptcy protection. Through its new lease, Contura obtained the right to mine a large block of coal known as the “Indian Creek” reserves. The transaction allows Contura’s Road Fork 52 operation to access approximately 10 million additional tons of clean, recoverable, low-vol metallurgical coal in the Pocahontas No. 3 seam. These additional reserves are expected to extend the mine’s projected life to more than 25 years.

Updated 2020 Guidance

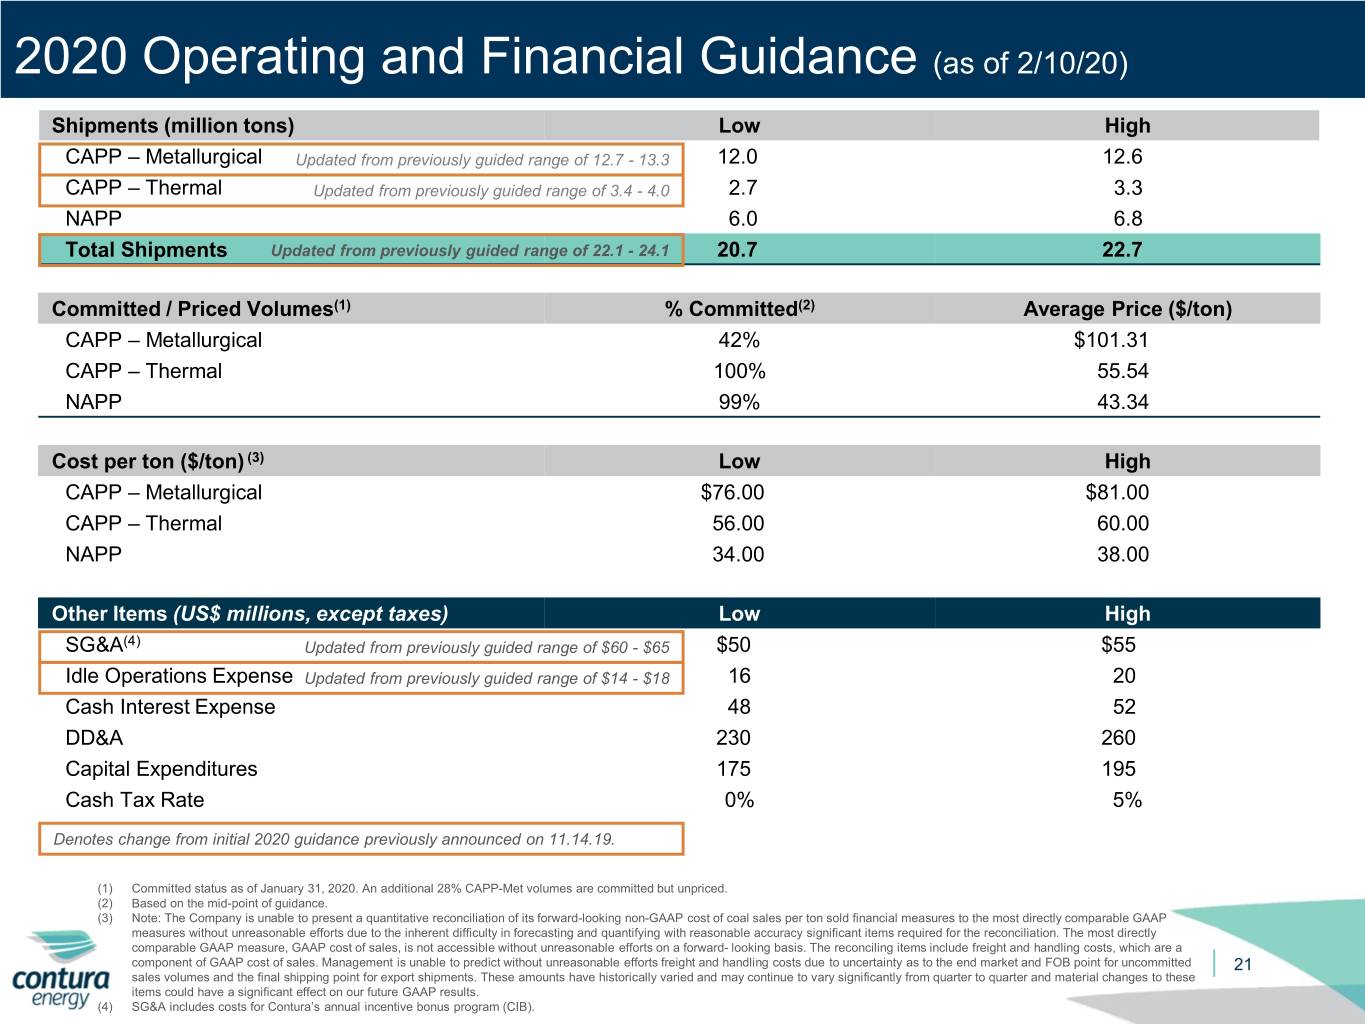
The company is adjusting its 2020 guidance for CAPP - Met shipments to a range of 12.0 million tons to 12.6 million tons, from the previously announced guidance of 12.7 million tons to 13.3 million tons. The range for CAPP - Thermal shipments is being reduced to 2.7 million tons to 3.3 million tons, from a previously announced range of 3.4 million tons to 4.0 million tons. NAPP shipment guidance remains as previously disclosed at a range of 6.0 million tons to 6.8 million tons.

For 2020, Contura has committed and priced approximately 42% of CAPP - Met tons at an average expected price of $101.31 per ton, 100% of CAPP - Thermal tons at an average price of $55.54 per ton and 99% of NAPP tons at an average price of $43.34 per ton.

The previously announced guidance for cost of coal sales remains unchanged for 2020, with CAPP - Met expected to be in a range of $76.00 to $81.00, CAPP - Thermal expected to be in the range of $56.00 to $60.00 per ton and NAPP in the range of $34.00 to $38.00 per ton.

The company is lowering its SG&A expense guidance to be in the range of $50 million to $55 million, excluding non-recurring items and stock compensation. Idle operations expense is expected to be in a slightly higher range of $16 million to $20 million, as compared to the previously announced $14 million to $18 million range, due to the idling of the Litwar coal preparation facility. 2020 capital expenditure is estimated to remain in the previously announced range of $175 million to $195 million; depreciation, depletion and amortization is expected to be between $230 million and $260 million; and cash interest expense is expected to be in the range of $48 million and $52 million.

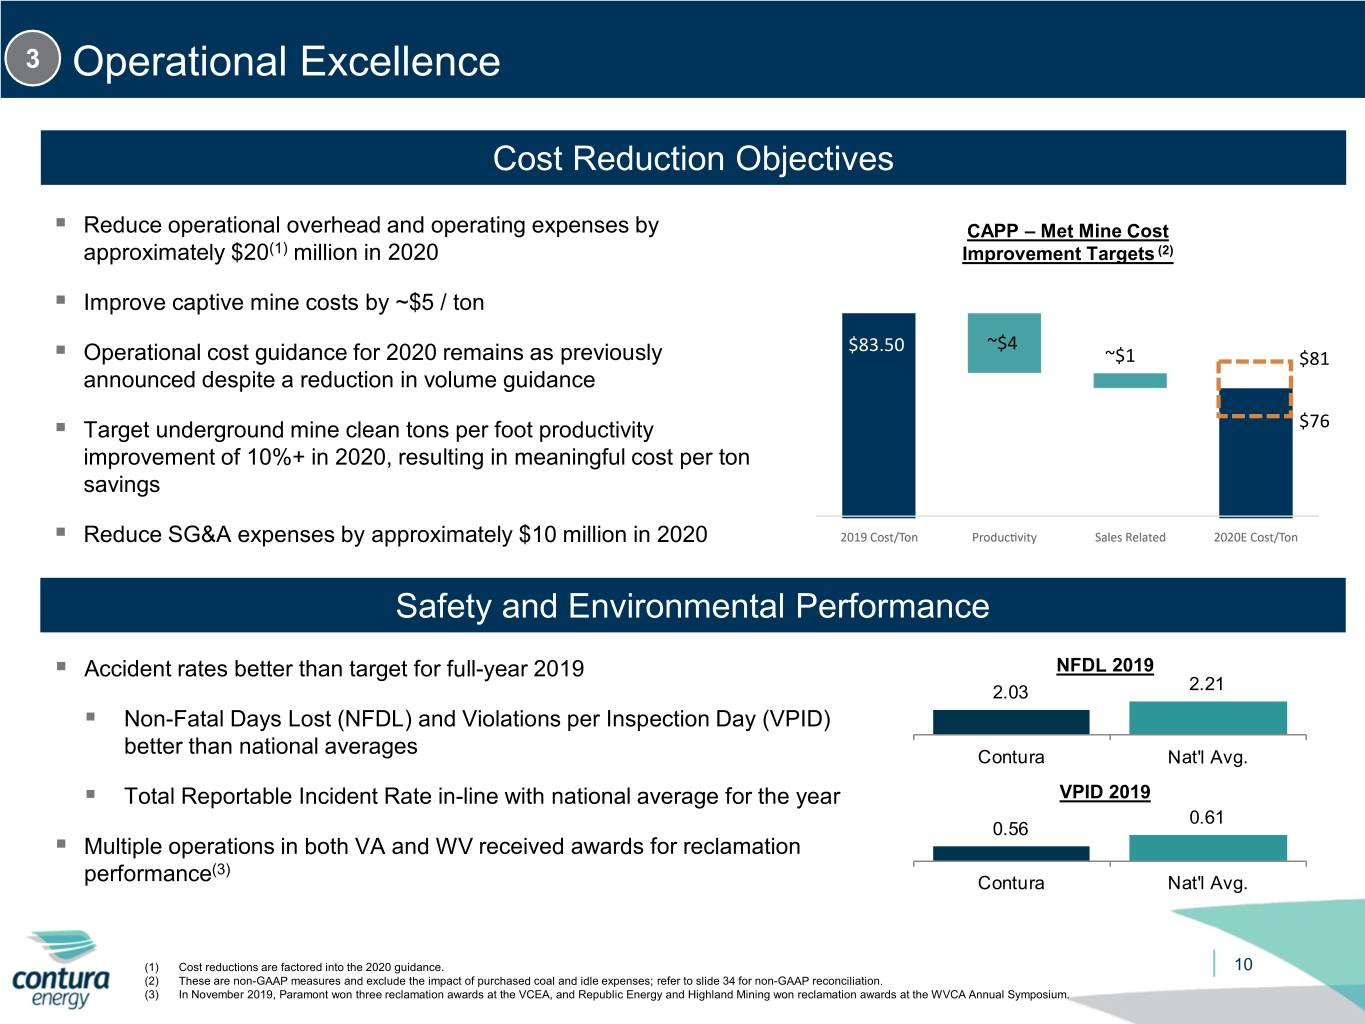
“During the past several weeks, we undertook significant efforts to reduce our SG&A cost structure, as well as eliminate costs from our overhead/production support organization. Those efforts led to a $10 million reduction in our SG&A costs, as well as a total of $20 million reduction in overhead costs, all of which have already been secured and included in our revised guidance,” said Andy Eidson, Contura’s chief financial officer. “It is also worth noting that we


are maintaining our operating cost guidance in spite of a 1.4-million-ton total reduction in sales volume guidance (at range midpoints), which reflects the continued productivity achievements of the operations team.”


2020 Guidance
in millions of tons
Low

High

CAPP - Metallurgical
12.0

12.6

CAPP - Thermal
2.7

3.3

NAPP
6.0

6.8

Total Shipments
20.7

22.7


Committed/Priced1,2,3
Committed

Average Price

CAPP - Metallurgical
42
%
$101.31

CAPP - Thermal
100
%
$55.54

NAPP
99
%
$43.34


Committed/Unpriced1,3
Committed

 
CAPP - Metallurgical
28
%
 
CAPP - Thermal
0
%
 
NAPP
1
%


Costs per ton4
Low

High

CAPP - Metallurgical
$76
$81
CAPP - Thermal
$56
$60
NAPP
$34
$38


In millions (except taxes)
Low

High

SG&A5
$50
$55
Idle Operations Expense
$16
$20
Cash Interest Expense
$48
$52
DD&A
$230
$260
Capital Expenditures
$175
$195
Tax Rate
%
5
%
Notes:
1.
Based on committed and priced coal shipments as of January 31, 2020. Committed percentage based on the midpoint of shipment guidance range.
2.
Actual average per-ton realizations on committed and priced tons recognized in future periods may vary based on actual freight expense in future periods relative to assumed freight expense embedded in projected average per-ton realizations.
3.
Includes estimates of future coal shipments based upon contract terms and anticipated delivery schedules. Actual coal shipments may vary from these estimates.
4.
Note: The Company is unable to present a quantitative reconciliation of its forward-looking non-GAAP cost of coal sales per ton sold financial measures to the most directly comparable GAAP measures without unreasonable efforts due to the inherent difficulty in forecasting and quantifying with reasonable accuracy significant items required for the reconciliation. The most directly comparable GAAP measure, GAAP cost of sales, is not accessible without unreasonable efforts on a forward- looking basis. The reconciling items include freight and handling costs, which are a component of GAAP cost of sales. Management is unable to predict without unreasonable efforts freight and handling costs due to uncertainty as to the end market and FOB point for uncommitted sales volumes and the final shipping point for export shipments. These amounts have historically varied and may continue to vary significantly from quarter to quarter and material changes to these items could have a significant effect on our future GAAP results.
5.
Excludes expenses related to non-cash stock compensation, merger-related expenses and non-recurring business development expenses.


Conference Call

Contura’s chairman and chief executive officer, David Stetson, chief financial officer, Andy Eidson, and chief operating officer, Jason Whitehead, will participate in an exchange call hosted by The Benchmark Company on February 11 at 2:00 p.m. EST. The discussion will focus on Contura’s preliminary operational and financial review for the fourth quarter of 2019, coal market dynamics and management’s plans for reduced costs and optimized performance in 2020. Those who would like to hear the conference call, and analysts who would like to participate, should dial 917-920-2973 approximately 10 minutes prior to the start of the call. An audio recording of the call will be provided as soon as available in the Events section of the Investor page of Contura’s website at investors.conturaenergy.com/investors/.


ABOUT CONTURA ENERGY

Contura Energy (NYSE: CTRA) is a Tennessee-based coal supplier with affiliate mining operations across major coal basins in Pennsylvania, Virginia and West Virginia. With customers across the globe, high-quality reserves and significant port capacity, Contura Energy reliably supplies both metallurgical coal to produce steel and thermal coal to generate power. For more information, visit www.conturaenergy.com.


IMPORTANT INFORMATION ABOUT PRELIMINARY FINANCIAL RESULTS
 
The financial results presented in this news release, as of and for the three months ended December 31, 2019, are preliminary, unaudited, subject to completion, reflect management’s current good faith estimates and may be significantly revised as a result of further review and developments. Final results for this period could differ materially from the preliminary results presented in this news release. During the course of the preparation of consolidated financial statements and related notes as of and for the three months ended December 31, 2019, the company may identify items that would require material adjustments to the preliminary financial information. The preliminary financial results presented in this news release should therefore not be viewed as a substitute for, or indicative of, full financial statements prepared in accordance with generally accepted accounting principles in the United States (GAAP). In addition, these preliminary estimates as of and for the three months ended December 31, 2019 are not necessarily indicative of the potential results for any future period.

FORWARD-LOOKING STATEMENTS

This news release includes forward-looking statements. These forward-looking statements are based on Contura's expectations and beliefs concerning future events and involve risks and uncertainties that may cause actual results to differ materially from current expectations. You should review the company’s filings with the Securities and Exchange Commission for information about some of the risk factors that may affect the company. These factors are difficult to predict accurately and may be beyond Contura’s control. Forward-looking statements in this news release or elsewhere speak only as of the date made. New uncertainties and risks arise from time to time, and it is impossible for the company to predict these events or how they may affect Contura. Except as required by law, Contura has no duty to, and does not intend to, update or revise the forward-looking statements in this news release or elsewhere after the date this release is issued. In light of these risks and uncertainties,


investors should keep in mind that results, events or developments discussed in any forward-looking statement made in this news release may not occur.


INVESTOR CONTACT
[email protected]

Alex Rotonen, CFA
423.573.0396

MEDIA CONTACT
[email protected]

Emily O’Quinn
423.573.0369


Non-GAAP Financial Measures

The discussion contains “non-GAAP financial measures.” These are financial measures which either exclude or include amounts that are not excluded or included in the most directly comparable measures calculated and presented in accordance with generally accepted accounting principles in the United States (“GAAP”). Specifically, the company makes use of the non-GAAP financial measure “non-GAAP coal revenues,” “non-GAAP cost of coal sales,” and "non-GAAP SG&A." The company uses non-GAAP coal revenues to present coal revenues generated, excluding freight and handling fulfillment revenues. Non-GAAP coal sales realization per ton for its operations is calculated as non-GAAP coal revenues divided by tons sold. The company uses non-GAAP cost of coal sales to adjust cost of coal sales to remove freight and handling costs and idled and closed mine costs. Non-GAAP cost of coal sales per ton for operations is calculated as non-GAAP cost of coal sales divided by tons sold. Non-GAAP coal margin per ton for coal operations is calculated as non-GAAP coal sales realization per ton for coal operations less cost of non-GAAP coal sales per ton for coal operations. The company uses non-GAAP SG&A to adjust SG&A to remove non-cash stock compensation and one-time expenses. The presentation of these measures should not be considered in isolation, or as a substitute for analysis of company results as reported under GAAP.

Management uses non-GAAP financial measures to supplement GAAP results to provide a more complete understanding of the factors and trends affecting the business than GAAP results alone. The definition of these non-GAAP measures may be changed periodically by management to adjust for significant items important to an understanding of operating trends. Because not all companies use identical calculations, the presentations of these measures may not be comparable to other similarly titled measures of other companies and can differ significantly from company to company depending on long-term strategic decisions regarding capital structure, the tax jurisdictions in which companies operate, and capital investments.

Included below are reconciliations of non-GAAP financial measures to GAAP financial measures.


CONTURA ENERGY, INC. AND SUBSIDIARIES
CERTAIN PRELIMINARY UNAUDITED RESULTS OF OPERATIONS

 
Three Months Ended December 31, 2019
(In thousands, except for per ton data)
CAPP - Met
 
CAPP - Thermal
 
NAPP
 
All Other
 
Consolidated
Coal revenues
$
370,200

 
$
60,576

 
$
65,775

 
$
681

 
$
497,232

Less: freight and handling fulfillment revenues
(59,320
)
 
(10,450
)
 
(3,397
)


(73,167
)
Non-GAAP coal revenues
$
310,880


$
50,126


$
62,378


$
681


$
424,065

Tons sold
3,273

 
893

 
1,515

 
8

 
5,689

Non-GAAP coal sales realization per ton (1)
$
94.98


$
56.13


$
41.17


$
85.13


$
74.54


Cost of coal sales
$
330,883

 
$
55,653

 
$
57,701

 
$
374

 
$
444,611

Less: freight and handling costs
(59,320
)

(10,450
)

(3,397
)


(73,167
)
Less: idled and closed mine costs
(2,757
)
 
(1,260
)
 
(1,783
)
 
290

 
(5,510
)
Non-GAAP cost of coal sales
$
268,806


$
43,943


$
52,521


$
664


$
365,934

Tons sold
3,273


893


1,515


8


5,689

Non-GAAP cost of coal sales per ton (2)
$
82.13


$
49.21


$
34.67


$
83.00


$
64.32


Coal margin per ton (3)
$
12.01


$
5.51


$
5.33


$
38.38


$
9.25

Idled and closed mine costs per ton
0.84

 
1.41

 
1.17

 
(36.25
)
 
0.97

Non-GAAP coal margin per ton (4)
$
12.85


$
6.92


$
6.50


$
2.13


$
10.22

(1) Non-GAAP coal sales realization per ton for our operations is calculated as non-GAAP coal revenues divided by tons sold.
(2) Non-GAAP cost of coal sales per ton for our operations is calculated as non-GAAP cost of coal sales divided by tons sold.
(3) Coal margin per ton for our coal operations is calculated as coal sales realization per ton for our coal operations less cost of coal sales per ton for our coal operations.
(4) Non-GAAP coal margin per ton for our coal operations is calculated as non-GAAP coal sales realization per ton for our coal operations less non-GAAP cost of coal sales per ton for our coal operations.

 
Three Months Ended September 30, 2019
(In thousands, except for per ton data)
CAPP - Met
 
CAPP - Thermal
 
NAPP
 
All Other
 
Consolidated
Coal revenues
$
373,078

 
$
80,174

 
$
70,735

 
$

 
$
523,987

Less: freight and handling fulfillment revenues
(50,100
)
 
(9,869
)
 
(2,961
)


(62,930
)
Non-GAAP coal revenues
$
322,978

 
$
70,305

 
$
67,774

 
$

 
$
461,057

Tons sold
2,981

 
1,144

 
1,640


5,765

Non-GAAP coal sales realization per ton (1)
$
108.35

 
$
61.46

 
$
41.33

 
$

 
$
79.98


Cost of coal sales
$
312,369

 
$
78,022

 
$
75,571

 
$
1,696

 
$
467,658

Less: freight and handling costs
(50,100
)
 
(9,869
)
 
(2,961
)


(62,930
)
Less: idled and closed mine costs
(1,956
)
 
(458
)
 
(659
)
 
(1,696
)
 
(4,769
)
Non-GAAP cost of coal sales
$
260,313

 
$
67,695

 
$
71,951

 
$

 
$
399,959

Tons sold
2,981

 
1,144

 
1,640


5,765

Non-GAAP cost of coal sales per ton (2)
$
87.32

 
$
59.17

 
$
43.87

 
$

 
$
69.38


Coal margin per ton (3)
$
20.37

 
$
1.88

 
$
(2.95
)
 
$

 
$
9.77

Idled and closed mine costs per ton
0.66

 
0.41

 
0.41


0.83

Non-GAAP coal margin per ton (4)
$
21.03

 
$
2.29

 
$
(2.54
)
 
$

 
$
10.60

(1) Non-GAAP coal sales realization per ton for our operations is calculated as non-GAAP coal revenues divided by tons sold.
(2) Non-GAAP cost of coal sales per ton for our operations is calculated as non-GAAP cost of coal sales divided by tons sold.
(3) Coal margin per ton for our coal operations is calculated as coal sales realization per ton for our coal operations less cost of coal sales per ton for our coal operations.
(4) Non-GAAP coal margin per ton for our coal operations is calculated as non-GAAP coal sales realization per ton for our coal operations less non-GAAP cost of coal sales per ton for our coal operations.
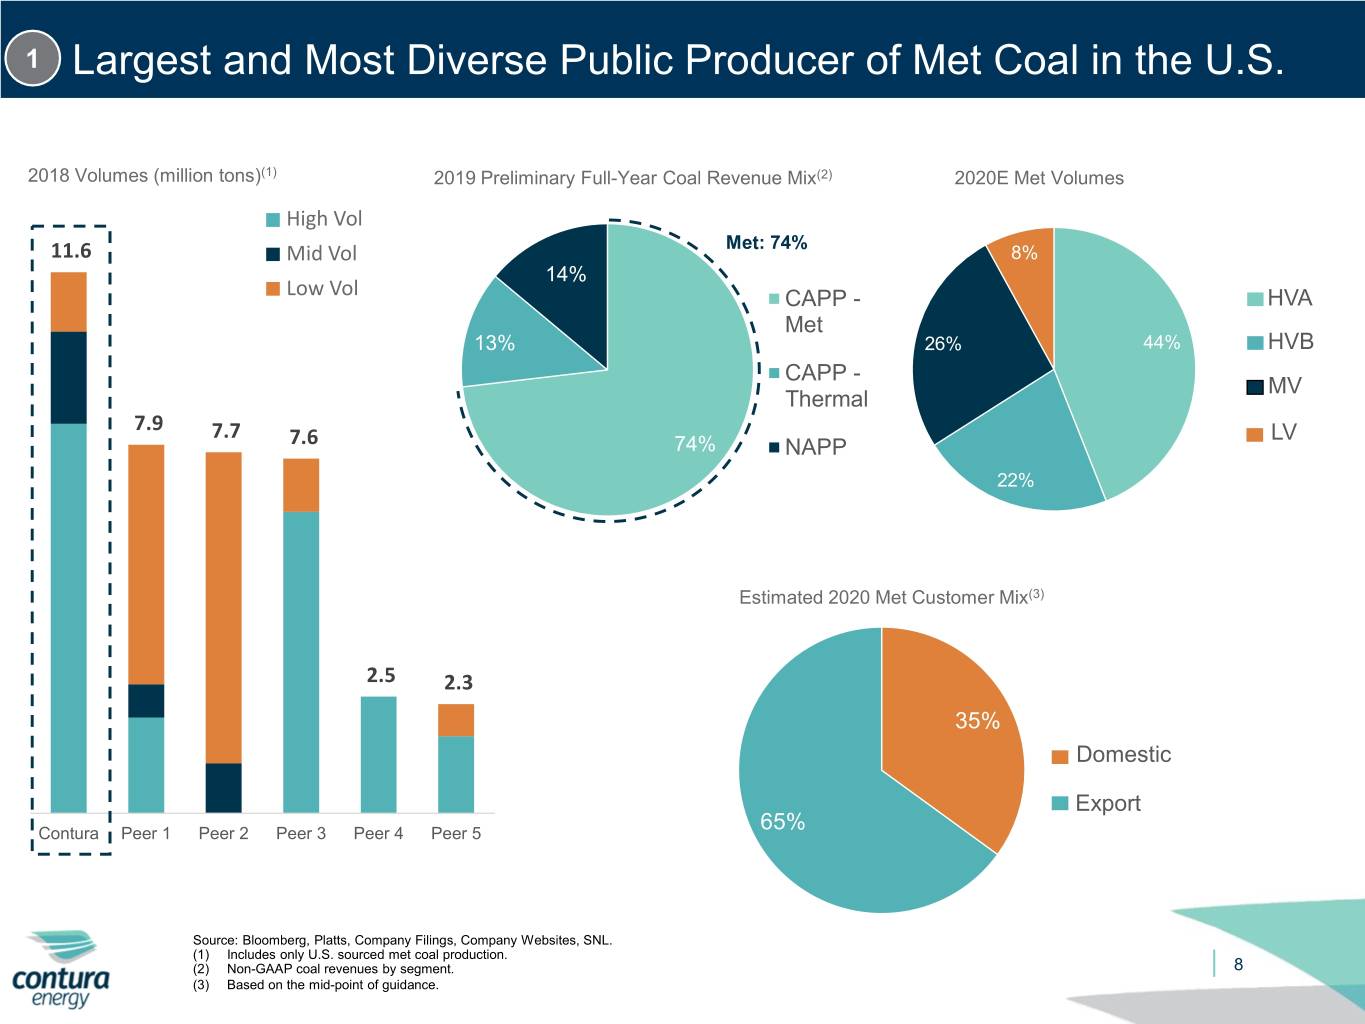


Exhibit 99.2 Contura Energy: Investor Presentation February 2020 1


Certain Financial Results This presentation contains certain financial results for the three months and year ended December 31, 2019. This information is preliminary, unaudited and subject to material revision, and the company cautions investors and potential investors not to place undue reliance upon this information. 2


Forward Looking Statements This document includes forward-looking statements. These forward-looking statements are based on Contura's expectations and beliefs concerning future events and involve risks and uncertainties that may cause actual results to differ materially from current expectations. These factors are difficult to predict accurately and may be beyond Contura’s control. Examples of forward-looking statements include, but are not limited to: . the financial performance of the company; . our liquidity, results of operations and financial condition; . our ability to generate sufficient cash or obtain financing to fund our business operations; . depressed levels or declines in coal prices; . worldwide market demand for coal, steel, and electricity, including demand for U.S. coal exports, and competition in coal markets; . the imposition or continuation of barriers to trade, such as tariffs; . utilities switching to alternative energy sources such as natural gas, renewables and coal from basins where we do not operate; . reductions or increases in customer coal inventories and the timing of those changes; . our production capabilities and costs; . inherent risks of coal mining beyond our control; . changes in, interpretations of, or implementations of domestic or international tax or other laws and regulations; . changes in domestic or international environmental laws and regulations, and court decisions, including those directly affecting our coal mining and production, and those affecting our customers’ coal usage, including potential climate change initiatives; . our relationships with, and other conditions affecting, our customers, including the inability to collect payments from our customers if their creditworthiness declines; . changes in, renewal or acquisition of, terms of and performance of customers under coal supply arrangements and the refusal by our customers to receive coal under agreed contract terms; . our ability to obtain, maintain or renew any necessary permits or rights, and our ability to mine properties due to defects in title on leasehold interests; . attracting and retaining key personnel and other employee workforce factors, such as labor relations; . funding for and changes in employee benefit obligations; . any new or increased liabilities, including reclamation obligations, that we may incur in connection with our former mines in Wyoming; . cybersecurity attacks or failures, threats to physical security, extreme weather conditions or other natural disasters; . reclamation and mine closure obligations; . our assumptions concerning economically recoverable coal reserve estimates; . our ability to negotiate new United Mine Workers of America wage agreements on terms acceptable to us, increased unionization of our workforce in the future, and any strikes by our workforce; . disruptions in delivery or changes in pricing from third party vendors of key equipment and materials that are necessary for our operations, such as diesel fuel, steel products, explosives, tires and purchased coal; . inflationary pressures on supplies and labor and significant or rapid increases in commodity prices; . railroad, barge, truck and other transportation availability, performance and costs; . disruption in third party coal supplies; . the consummation of financing or refinancing transactions, acquisitions or dispositions and the related effects on our business and financial position; . our indebtedness and potential future indebtedness; and . our ability to obtain or renew surety bonds on acceptable terms or maintain our current bonding status; Forward-looking statements in this document or elsewhere speak only as of the date made. New uncertainties and risks arise from time to time, and it is impossible for Contura to predict these events or how they may affect Contura. Except as required by law, Contura has no duty to, and does not intend to, update or revise the forward-looking statements in this document or elsewhere. In light of these risks and uncertainties, investors should keep in mind that results, events or developments discussed in any forward-looking statement made in this document may not occur. Third Party Information This presentation, including certain forward-looking statements herein, includes information obtained from third party sources that we believe to be reliable. However, we have not independently verified this third party information and cannot assure you of its accuracy or completeness. While we are not aware of any misstatements regarding any third party data contained in this presentation, such data involve risks and uncertainties and are subject to change based on various factors, including those discussed in detail in our filings with the U.S. Securities and Exchange Commission. We assume no obligation to revise or update this third party information to reflect future events or circumstances. 3
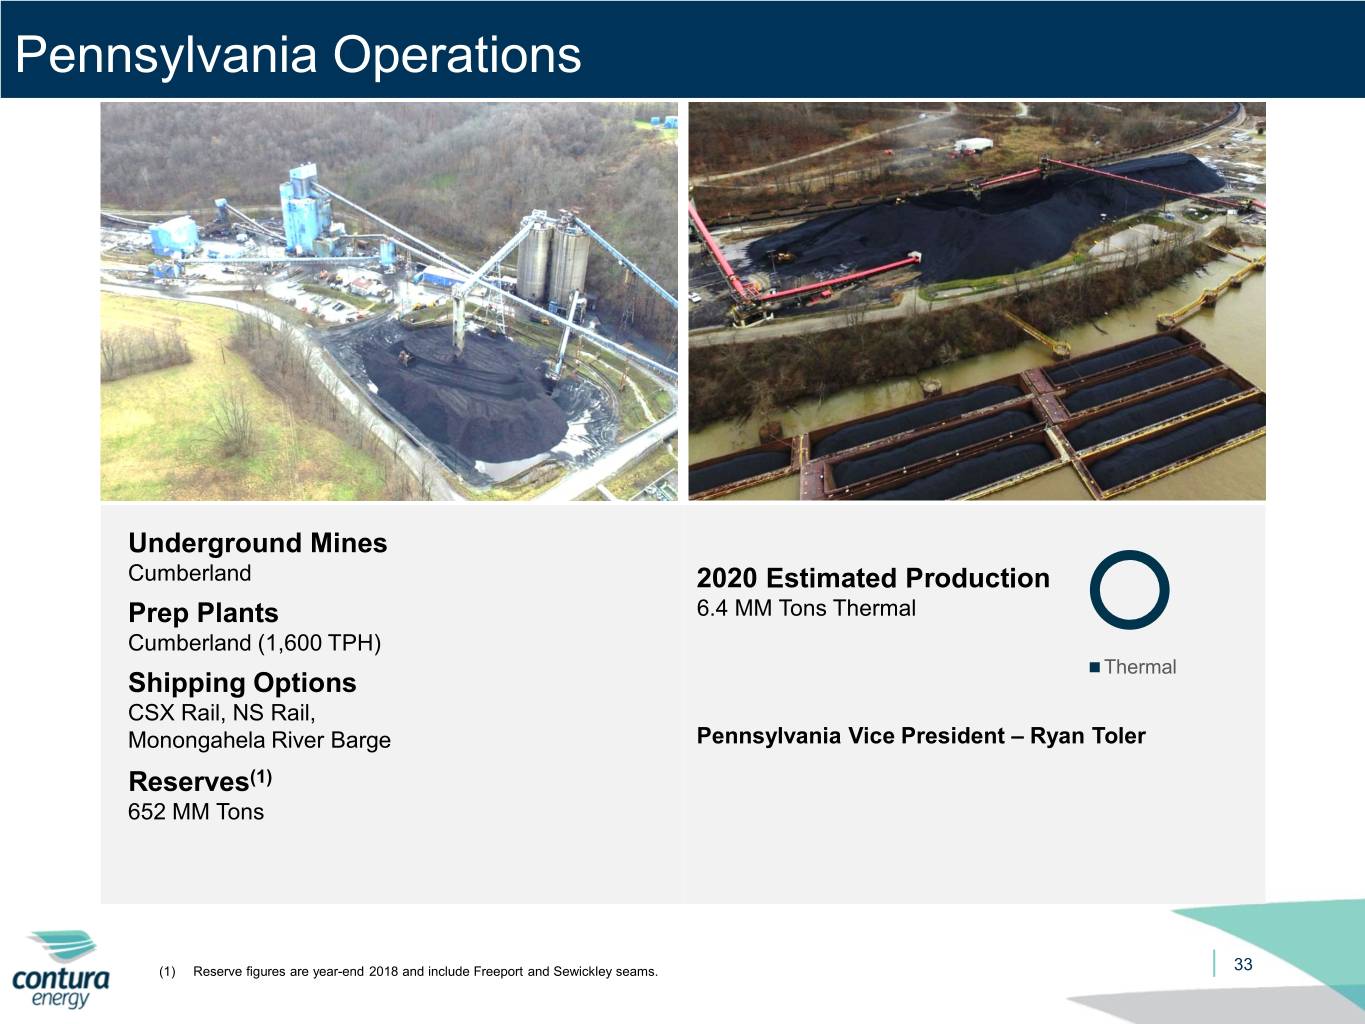

 
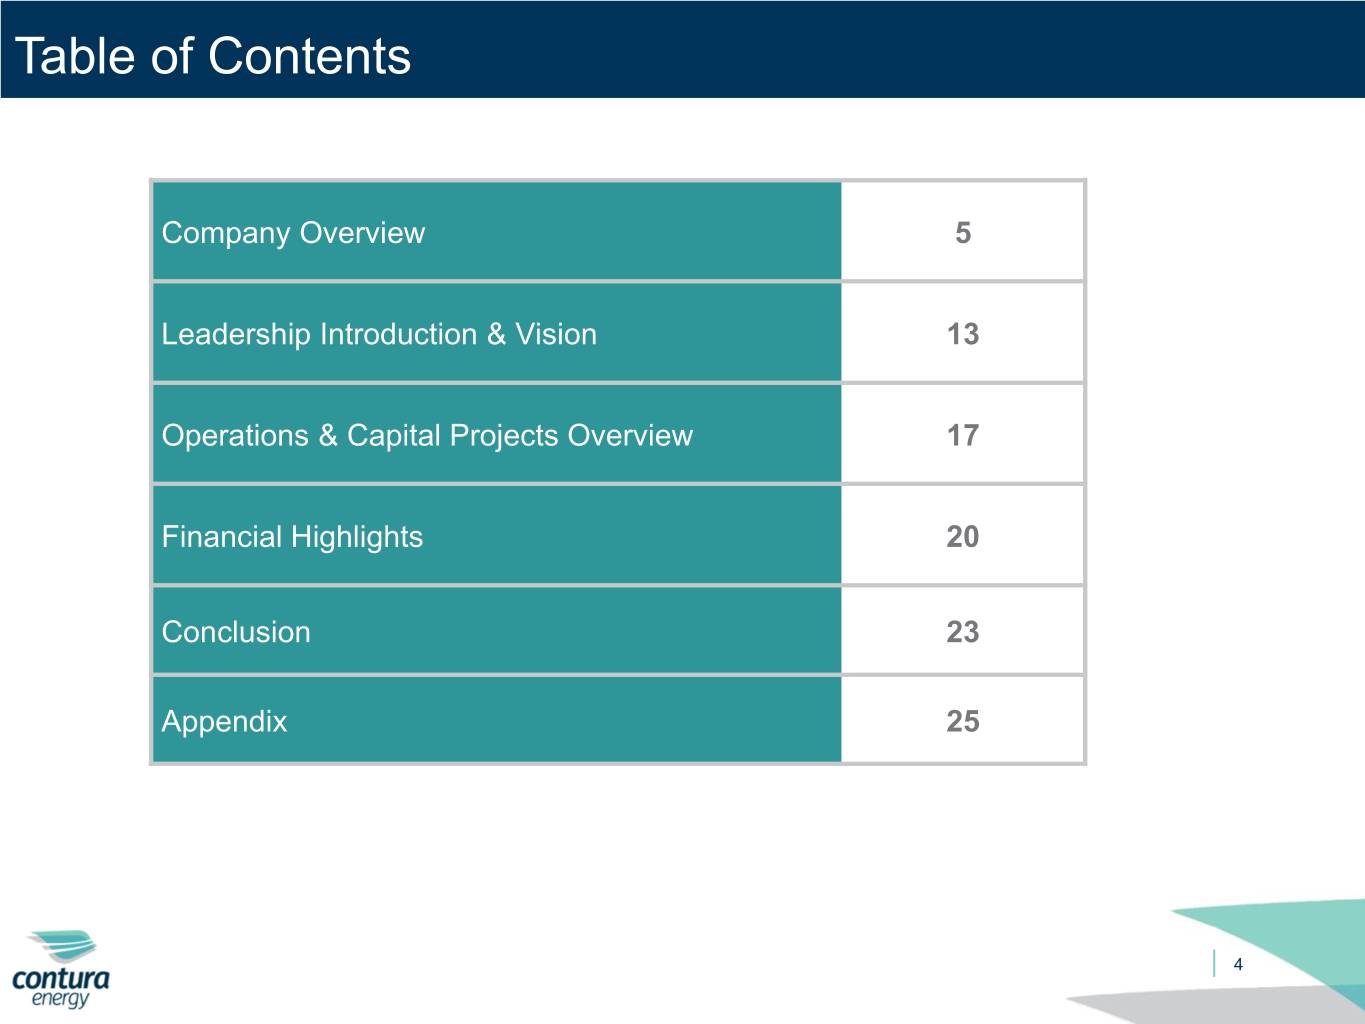
Table of Contents Company Overview 5 Leadership Introduction & Vision 13 Operations & Capital Projects Overview 17 Financial Highlights 20 Conclusion 23 Appendix 25 4


Company Overview


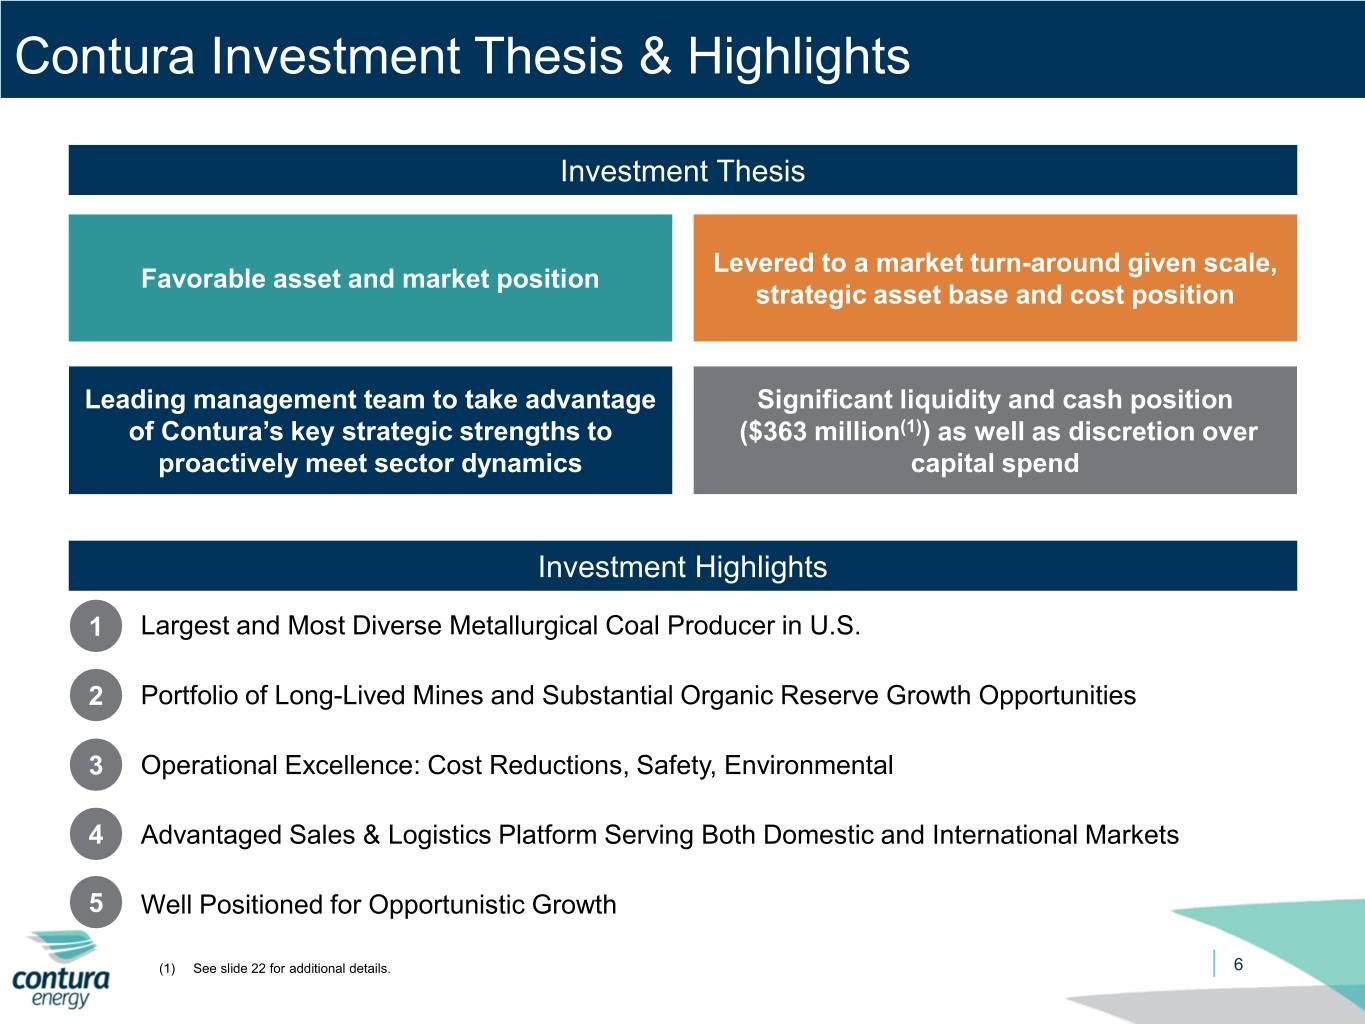
Contura Investment Thesis & Highlights Investment Thesis Levered to a market turn-around given scale, Favorable asset and market position strategic asset base and cost position Leading management team to take advantage Significant liquidity and cash position of Contura’s key strategic strengths to ($363 million(1)) as well as discretion over proactively meet sector dynamics capital spend Investment Highlights •1 Largest and Most Diverse Metallurgical Coal Producer in U.S. •2 Portfolio of Long-Lived Mines and Substantial Organic Reserve Growth Opportunities •3 Operational Excellence: Cost Reductions, Safety, Environmental •4 Advantaged Sales & Logistics Platform Serving Both Domestic and International Markets •5 Well Positioned for Opportunistic Growth (1) See slide 22 for additional details. 6


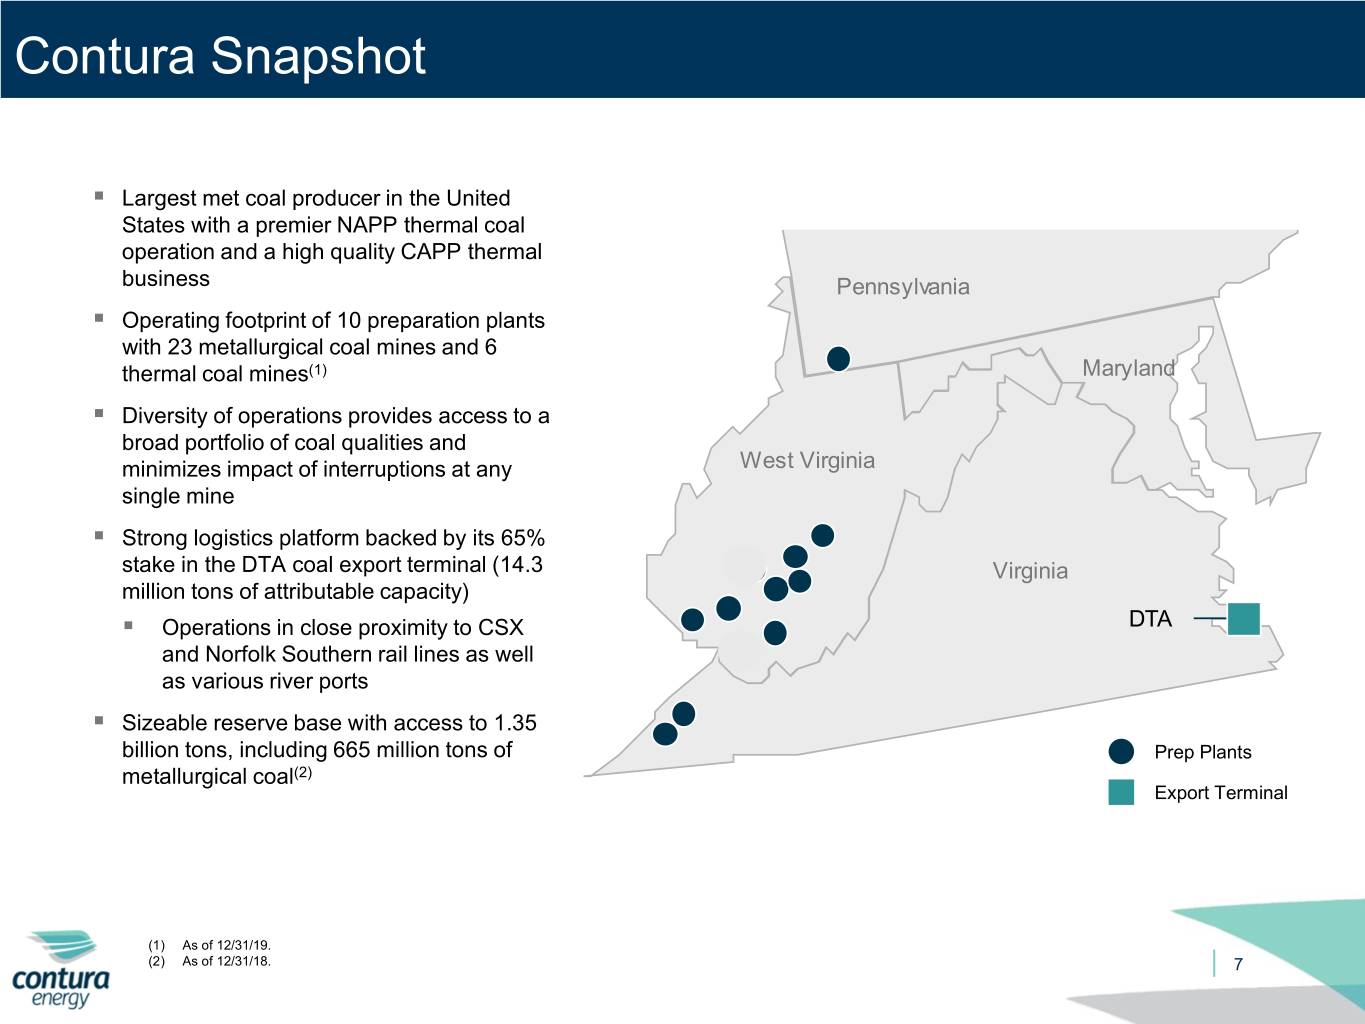
Contura Snapshot . Largest met coal producer in the United States with a premier NAPP thermal coal operation and a high quality CAPP thermal business Pennsylvania . Operating footprint of 10 preparation plants with 23 metallurgical coal mines and 6 thermal coal mines(1) Maryland . Diversity of operations provides access to a broad portfolio of coal qualities and minimizes impact of interruptions at any West Virginia single mine . Strong logistics platform backed by its 65% stake in the DTA coal export terminal (14.3 Virginia million tons of attributable capacity) . Operations in close proximity to CSX DTA and Norfolk Southern rail lines as well as various river ports . Sizeable reserve base with access to 1.35 billion tons, including 665 million tons of Prep Plants metallurgical coal(2) Export Terminal (1) As of 12/31/19. (2) As of 12/31/18. 7


1 Largest and Most Diverse Public Producer of Met Coal in the U.S. 2018 Volumes (million tons)(1) 2019 Preliminary Full-Year Coal Revenue Mix(2) 2020E Met Volumes High Vol 11.6 Mid Vol Met: 74% 8% 14% Low Vol CAPP - HVA Met 13% 26% 44% HVB CAPP - MV Thermal 7.9 7.7 LV 7.6 74% NAPP 22% Estimated 2020 Met Customer Mix(3) 2.5 2.3 35% Domestic Export Contura Peer 1 Peer 2 Peer 3 Peer 4 Peer 5 65% Source: Bloomberg, Platts, Company Filings, Company Websites, SNL. (1) Includes only U.S. sourced met coal production. (2) Non-GAAP coal revenues by segment. 8 (3) Based on the mid-point of guidance.


2 Long Mine Lives and Substantial Organic Reserve Growth Opportunities Met Reserve Life of Public U.S. Met Coal Producers Implied Reserve Life (Years)(1) 60+ 57 29 22 14 9 Peer 5 Contura Peer 1 Peer 4 Peer 3 Peer 2 Low Cost Met Projects Est. Production Est. Cost (mm tons / of Coal Quality year)(2) Sales / ton Road Fork 52 1.1 – 1.3 ~$70 LV Black Eagle 0.7 – 0.8 ~$70 HVA Lynn Branch 0.9 – 1.2 ~$65 HVB+ Source: Bloomberg, Platts, Company Filings, Company Websites, SNL. 9 (1) Calculated as metallurgical reserves divided by 2018A production. Data is based on U.S. based mines only. (2) Production from organic projects will principally be used to replace existing depleting mines.


3 Operational Excellence Cost Reduction Objectives . Reduce operational overhead and operating expenses by CAPP – Met Mine Cost approximately $20(1) million in 2020 Improvement Targets (2) . Improve captive mine costs by ~$5 / ton $83.50 ~$4 . Operational cost guidance for 2020 remains as previously ~$1 $81 announced despite a reduction in volume guidance . Target underground mine clean tons per foot productivity $76 improvement of 10%+ in 2020, resulting in meaningful cost per ton savings . Reduce SG&A expenses by approximately $10 million in 2020 Safety and Environmental Performance . Accident rates better than target for full-year 2019 NFDL 2019 2.03 2.21 . Non-Fatal Days Lost (NFDL) and Violations per Inspection Day (VPID) better than national averages Contura Nat'l Avg. . Total Reportable Incident Rate in-line with national average for the year VPID 2019 0.61 0.56 . Multiple operations in both VA and WV received awards for reclamation (3) performance Contura Nat'l Avg. (1) Cost reductions are factored into the 2020 guidance. 10 (2) These are non-GAAP measures and exclude the impact of purchased coal and idle expenses; refer to slide 34 for non-GAAP reconciliation. (3) In November 2019, Paramont won three reclamation awards at the VCEA, and Republic Energy and Highland Mining won reclamation awards at the WVCA Annual Symposium.


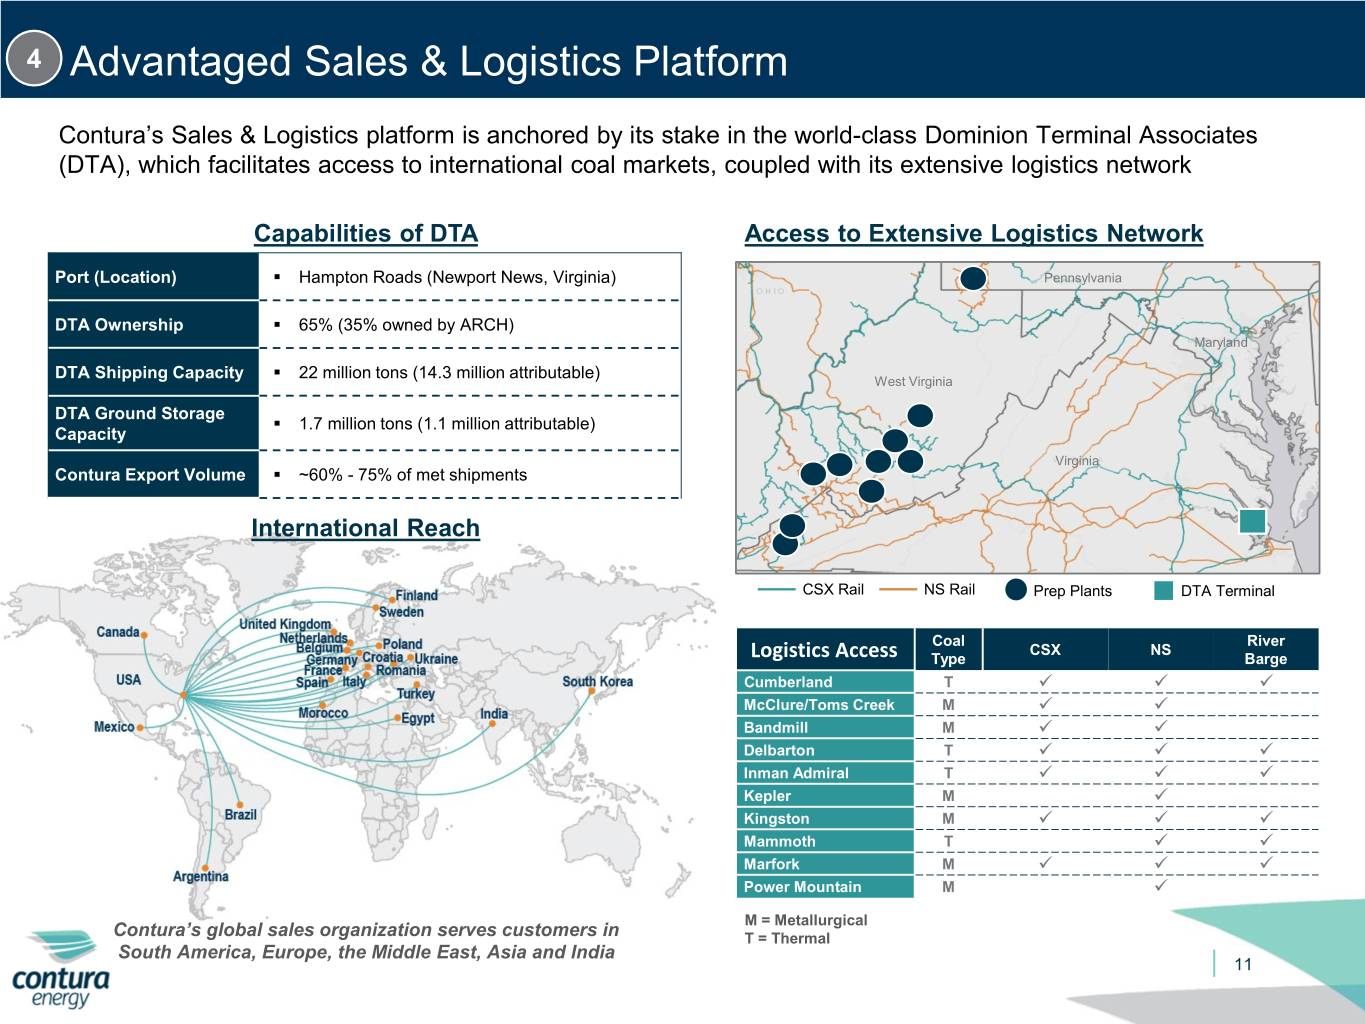
4 Advantaged Sales & Logistics Platform Contura’s Sales & Logistics platform is anchored by its stake in the world-class Dominion Terminal Associates (DTA), which facilitates access to international coal markets, coupled with its extensive logistics network Capabilities of DTA Access to Extensive Logistics Network Port (Location) . Hampton Roads (Newport News, Virginia) Pennsylvania DTA Ownership . 65% (35% owned by ARCH) Maryland . DTA Shipping Capacity 22 million tons (14.3 million attributable) West Virginia DTA Ground Storage . 1.7 million tons (1.1 million attributable) Capacity Virginia Contura Export Volume . ~60% - 75% of met shipments International Reach CSX Rail NS Rail Prep Plants DTA Terminal Coal River CSX NS Logistics Access Type Barge Cumberland T    McClure/Toms Creek M   Bandmill M   Delbarton T    Inman Admiral T    Kepler M  Kingston M    Mammoth T   Marfork M    Power Mountain M  M = Metallurgical Contura’s global sales organization serves customers in T = Thermal South America, Europe, the Middle East, Asia and India 11


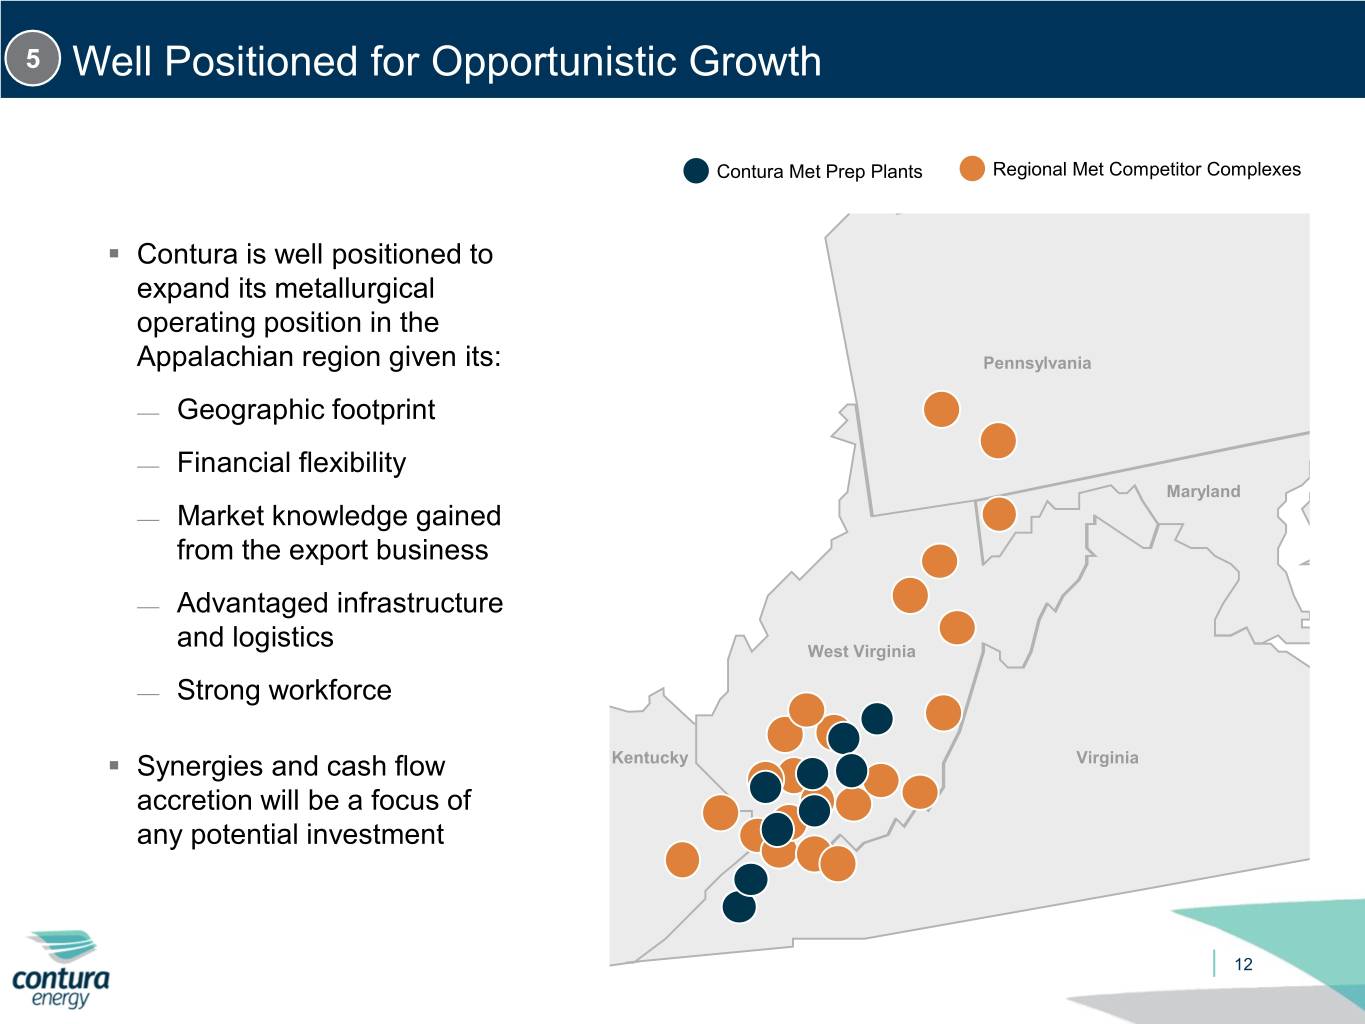
5 Well Positioned for Opportunistic Growth Contura Met Prep Plants Regional Met Competitor Complexes . Contura is well positioned to expand its metallurgical operating position in the Appalachian region given its: Pennsylvania  Geographic footprint  Financial flexibility Maryland  Market knowledge gained from the export business  Advantaged infrastructure and logistics West Virginia  Strong workforce . Synergies and cash flow Kentucky Virginia accretion will be a focus of any potential investment 12


Leadership Introduction & Vision


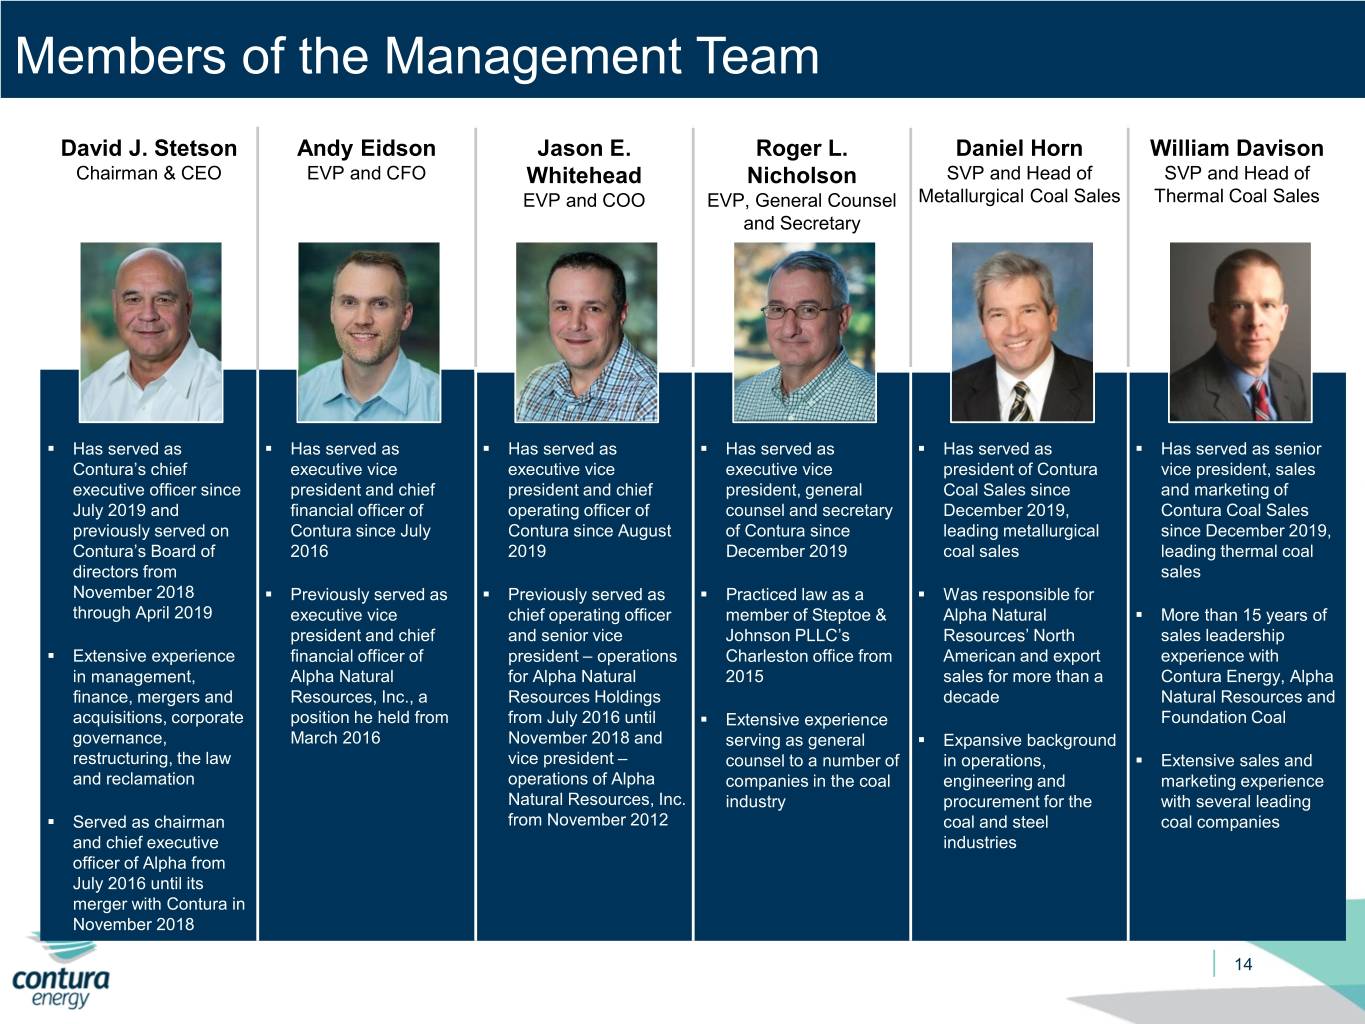
Members of the Management Team David J. Stetson Andy Eidson Jason E. Roger L. Daniel Horn William Davison Chairman & CEO EVP and CFO Whitehead Nicholson SVP and Head of SVP and Head of EVP and COO EVP, General Counsel Metallurgical Coal Sales Thermal Coal Sales and Secretary . Has served as . Has served as . Has served as . Has served as . Has served as . Has served as senior Contura’s chief executive vice executive vice executive vice president of Contura vice president, sales executive officer since president and chief president and chief president, general Coal Sales since and marketing of July 2019 and financial officer of operating officer of counsel and secretary December 2019, Contura Coal Sales previously served on Contura since July Contura since August of Contura since leading metallurgical since December 2019, Contura’s Board of 2016 2019 December 2019 coal sales leading thermal coal directors from sales November 2018 . Previously served as . Previously served as . Practiced law as a . Was responsible for through April 2019 executive vice chief operating officer member of Steptoe & Alpha Natural . More than 15 years of president and chief and senior vice Johnson PLLC’s Resources’ North sales leadership . Extensive experience financial officer of president – operations Charleston office from American and export experience with in management, Alpha Natural for Alpha Natural 2015 sales for more than a Contura Energy, Alpha finance, mergers and Resources, Inc., a Resources Holdings decade Natural Resources and acquisitions, corporate position he held from from July 2016 until . Extensive experience Foundation Coal governance, March 2016 November 2018 and serving as general . Expansive background restructuring, the law vice president – counsel to a number of in operations, . Extensive sales and and reclamation operations of Alpha companies in the coal engineering and marketing experience Natural Resources, Inc. industry procurement for the with several leading . Served as chairman from November 2012 coal and steel coal companies and chief executive industries officer of Alpha from July 2016 until its merger with Contura in November 2018 14


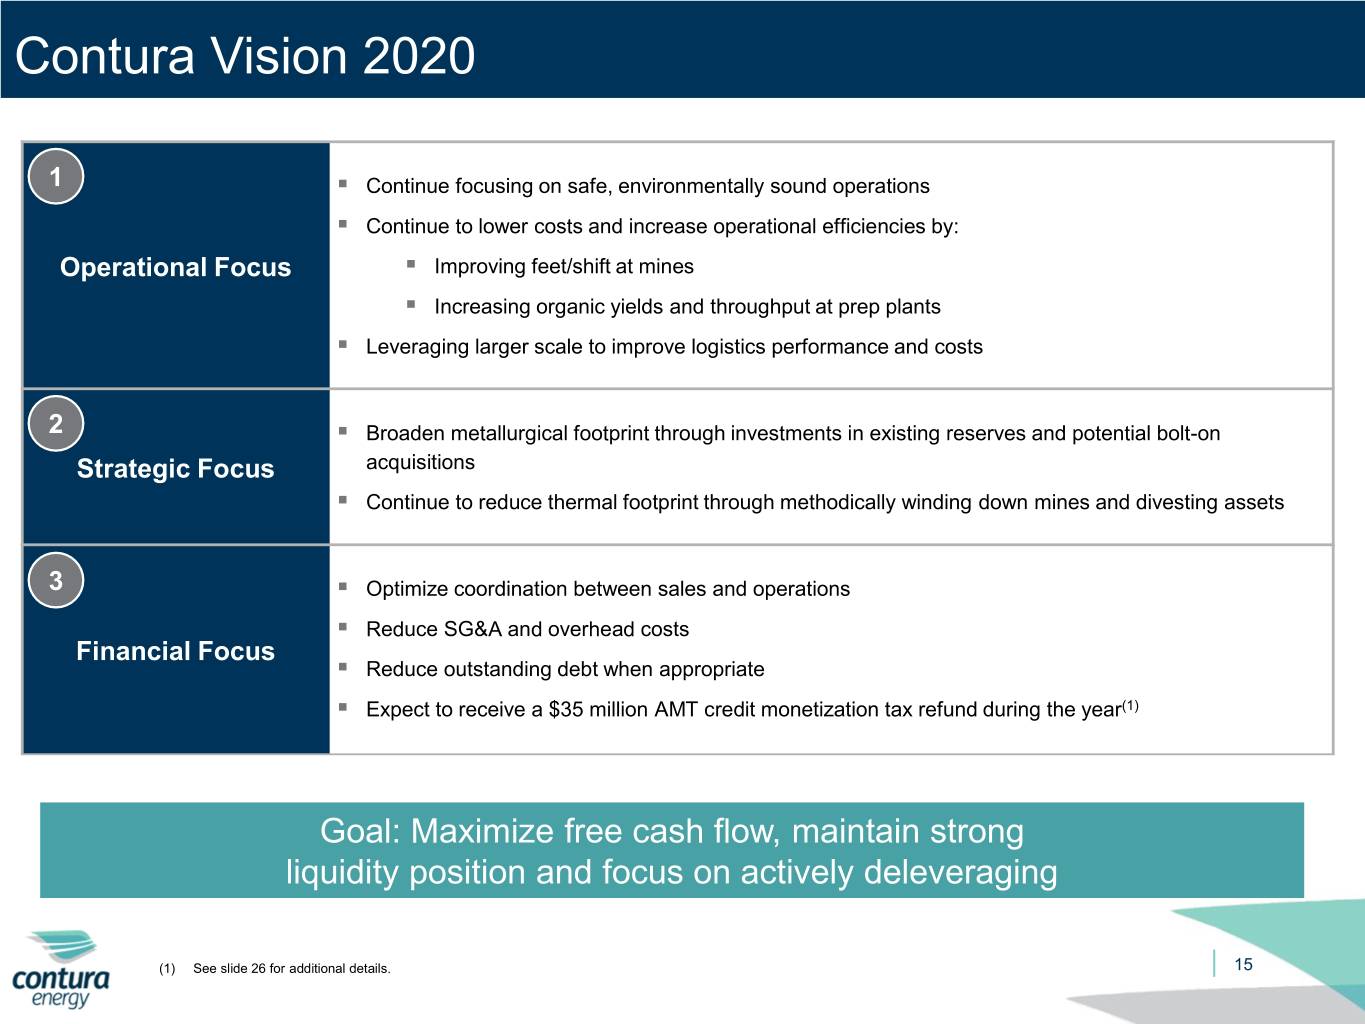
Contura Vision 2020 1 . Continue focusing on safe, environmentally sound operations . Continue to lower costs and increase operational efficiencies by: Operational Focus . Improving feet/shift at mines . Increasing organic yields and throughput at prep plants . Leveraging larger scale to improve logistics performance and costs 2 . Broaden metallurgical footprint through investments in existing reserves and potential bolt-on Strategic Focus acquisitions . Continue to reduce thermal footprint through methodically winding down mines and divesting assets 3 . Optimize coordination between sales and operations . Reduce SG&A and overhead costs Financial Focus . Reduce outstanding debt when appropriate . Expect to receive a $35 million AMT credit monetization tax refund during the year(1) Goal: Maximize free cash flow, maintain strong liquidity position and focus on actively deleveraging (1) See slide 26 for additional details. 15


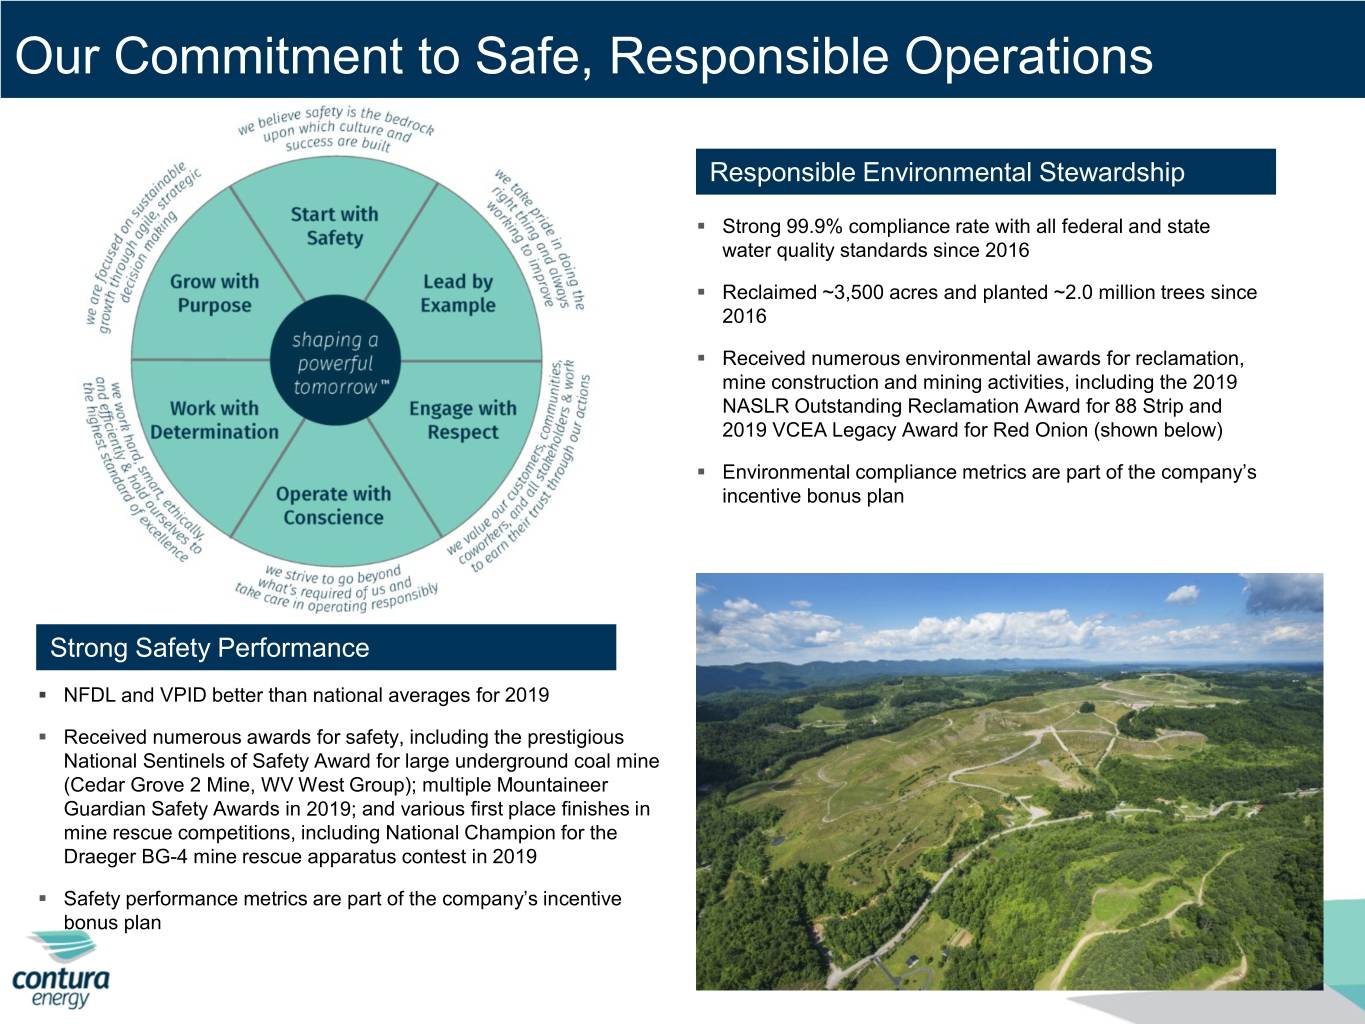
Our Commitment to Safe, Responsible Operations Responsible Environmental Stewardship . Strong 99.9% compliance rate with all federal and state water quality standards since 2016 . Reclaimed ~3,500 acres and planted ~2.0 million trees since 2016 . Received numerous environmental awards for reclamation, mine construction and mining activities, including the 2019 NASLR Outstanding Reclamation Award for 88 Strip and 2019 VCEA Legacy Award for Red Onion (shown below) . Environmental compliance metrics are part of the company’s incentive bonus plan Strong Safety Performance . NFDL and VPID better than national averages for 2019 . Received numerous awards for safety, including the prestigious National Sentinels of Safety Award for large underground coal mine (Cedar Grove 2 Mine, WV West Group); multiple Mountaineer Guardian Safety Awards in 2019; and various first place finishes in mine rescue competitions, including National Champion for the Draeger BG-4 mine rescue apparatus contest in 2019 . Safety performance metrics are part of the company’s incentive bonus plan 16


Operations & Capital Projects Overview


Low Cost Metallurgical Projects Overview of Metallurgical Projects • Significant progress on multiple metallurgical coal projects with expected direct mining costs at or below $70 per ton: • Contributes to driving average CAPP – Met cost of coal sales below $80 per ton in 2020 and beyond • Reserve bases with lives from ~18 to ~25 years • Further strengthens product portfolio with LV, HVA and HVB+ qualities Est. Est. Initial Est. Run Rate Estimated Approx. Production Production Production Quality Cost of Coal Reserve in Logistics (mm tons / Timing Timing Sales/ton tons (mm) year) Road Fork 52 1.1 – 1.3 Q1 2020 Q4 2020 LV ~$70 30(1) NS Black Eagle 0.7 – 0.8 Q4 2018 Q3 2020 HVA ~$70 20 CSX/NS/River Barge Lynn Branch 0.9 – 1.2 Q3 2020 Q1 2021 HVB+ ~$65 20 CSX/NS (1) Includes Indian Creek reserves acquired January 28, 2020. 18


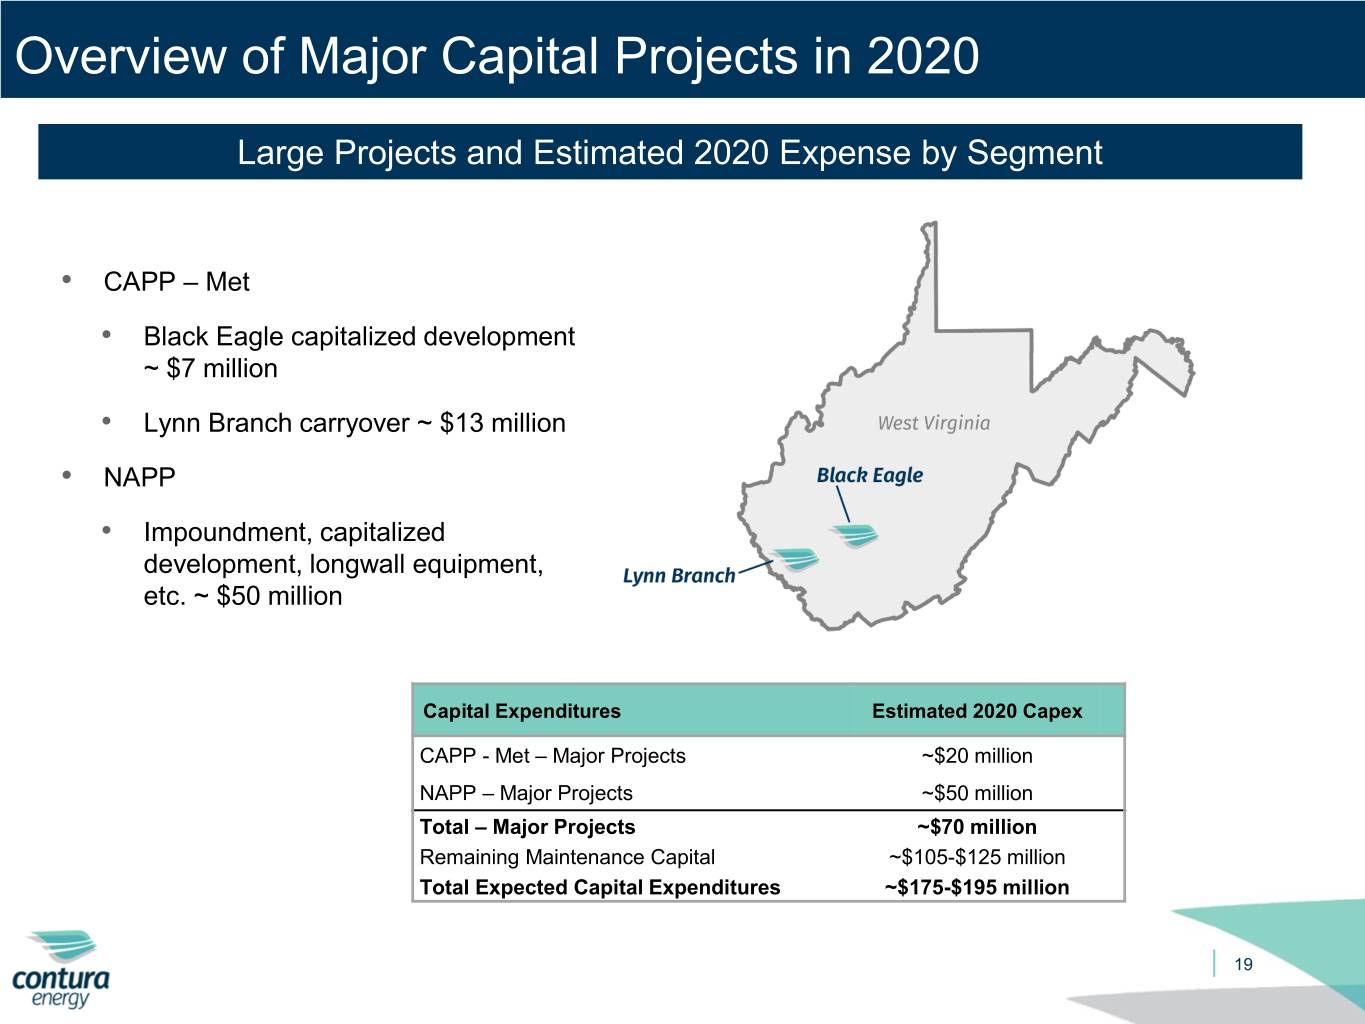
Overview of Major Capital Projects in 2020 Large Projects and Estimated 2020 Expense by Segment • CAPP – Met • Black Eagle capitalized development ~ $7 million • Lynn Branch carryover ~ $13 million • NAPP • Impoundment, capitalized development, longwall equipment, etc. ~ $50 million Capital Expenditures Estimated 2020 Capex CAPP - Met – Major Projects ~$20 million NAPP – Major Projects ~$50 million Total – Major Projects ~$70 million Remaining Maintenance Capital ~$105-$125 million Total Expected Capital Expenditures ~$175-$195 million 19


Financial Highlights


2020 Operating and Financial Guidance (as of 2/10/20) Shipments (million tons) Low High CAPP – Metallurgical Updated from previously guided range of 12.7 - 13.3 12.0 12.6 CAPP – Thermal Updated from previously guided range of 3.4 - 4.0 2.7 3.3 NAPP 6.0 6.8 Total Shipments Updated from previously guided range of 22.1 - 24.1 20.7 22.7 Committed / Priced Volumes(1) % Committed(2) Average Price ($/ton) CAPP – Metallurgical 42% $101.31 CAPP – Thermal 100% 55.54 NAPP 99% 43.34 Cost per ton ($/ton) (3) Low High CAPP – Metallurgical $76.00 $81.00 CAPP – Thermal 56.00 60.00 NAPP 34.00 38.00 Other Items (US$ millions, except taxes) Low High SG&A(4) Updated from previously guided range of $60 - $65 $50 $55 Idle Operations Expense Updated from previously guided range of $14 - $18 16 20 Cash Interest Expense 48 52 DD&A 230 260 Capital Expenditures 175 195 Cash Tax Rate 0% 5% Denotes change from initial 2020 guidance previously announced on 11.14.19. (1) Committed status as of January 31, 2020. An additional 28% CAPP-Met volumes are committed but unpriced. (2) Based on the mid-point of guidance. (3) Note: The Company is unable to present a quantitative reconciliation of its forward-looking non-GAAP cost of coal sales per ton sold financial measures to the most directly comparable GAAP measures without unreasonable efforts due to the inherent difficulty in forecasting and quantifying with reasonable accuracy significant items required for the reconciliation. The most directly comparable GAAP measure, GAAP cost of sales, is not accessible without unreasonable efforts on a forward- looking basis. The reconciling items include freight and handling costs, which are a component of GAAP cost of sales. Management is unable to predict without unreasonable efforts freight and handling costs due to uncertainty as to the end market and FOB point for uncommitted 21 sales volumes and the final shipping point for export shipments. These amounts have historically varied and may continue to vary significantly from quarter to quarter and material changes to these items could have a significant effect on our future GAAP results. (4) SG&A includes costs for Contura’s annual incentive bonus program (CIB).


Liquidity Beyond cash flows, Contura’s expected sources of liquidity include: Expected Sources of Liquidity(1) (US$ Millions) $35 Unrestricted Cash of $213 Million Asset-Based Revolver $115 $363 Million Capacity of $115 Million $213 Expected AMT Credit (2) Monetization of $35 Million (1) As of December 31, 2019. 22 (2) Amount and timing subject to material change.


Conclusion


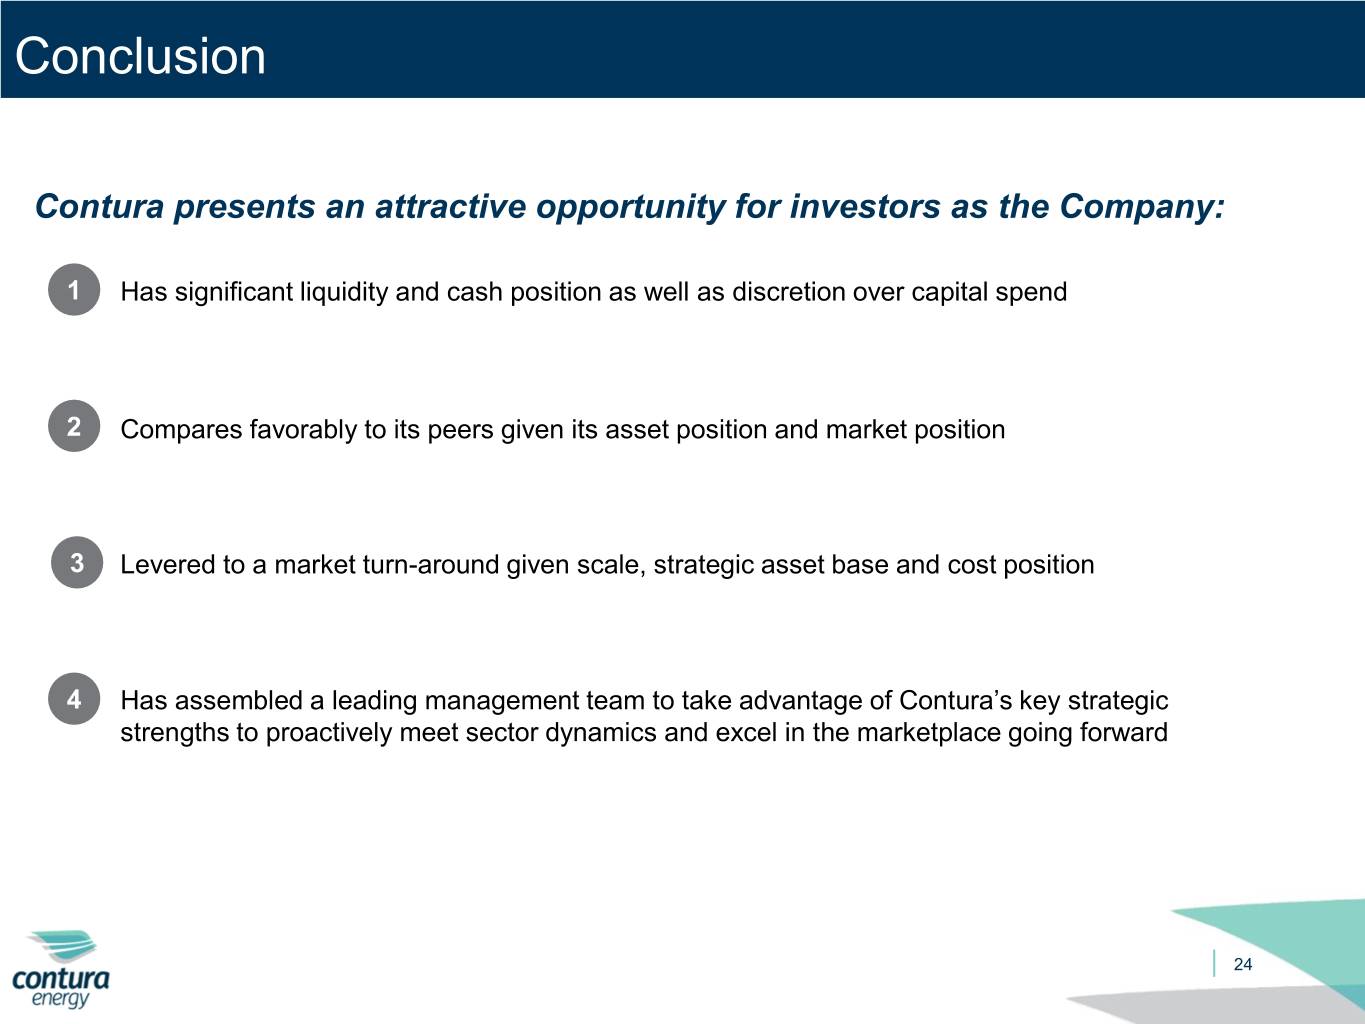
Conclusion Contura presents an attractive opportunity for investors as the Company: 1 Has significant liquidity and cash position as well as discretion over capital spend 2 Compares favorably to its peers given its asset position and market position 3 Levered to a market turn-around given scale, strategic asset base and cost position 4 Has assembled a leading management team to take advantage of Contura’s key strategic strengths to proactively meet sector dynamics and excel in the marketplace going forward 24


Appendix February 2020 16


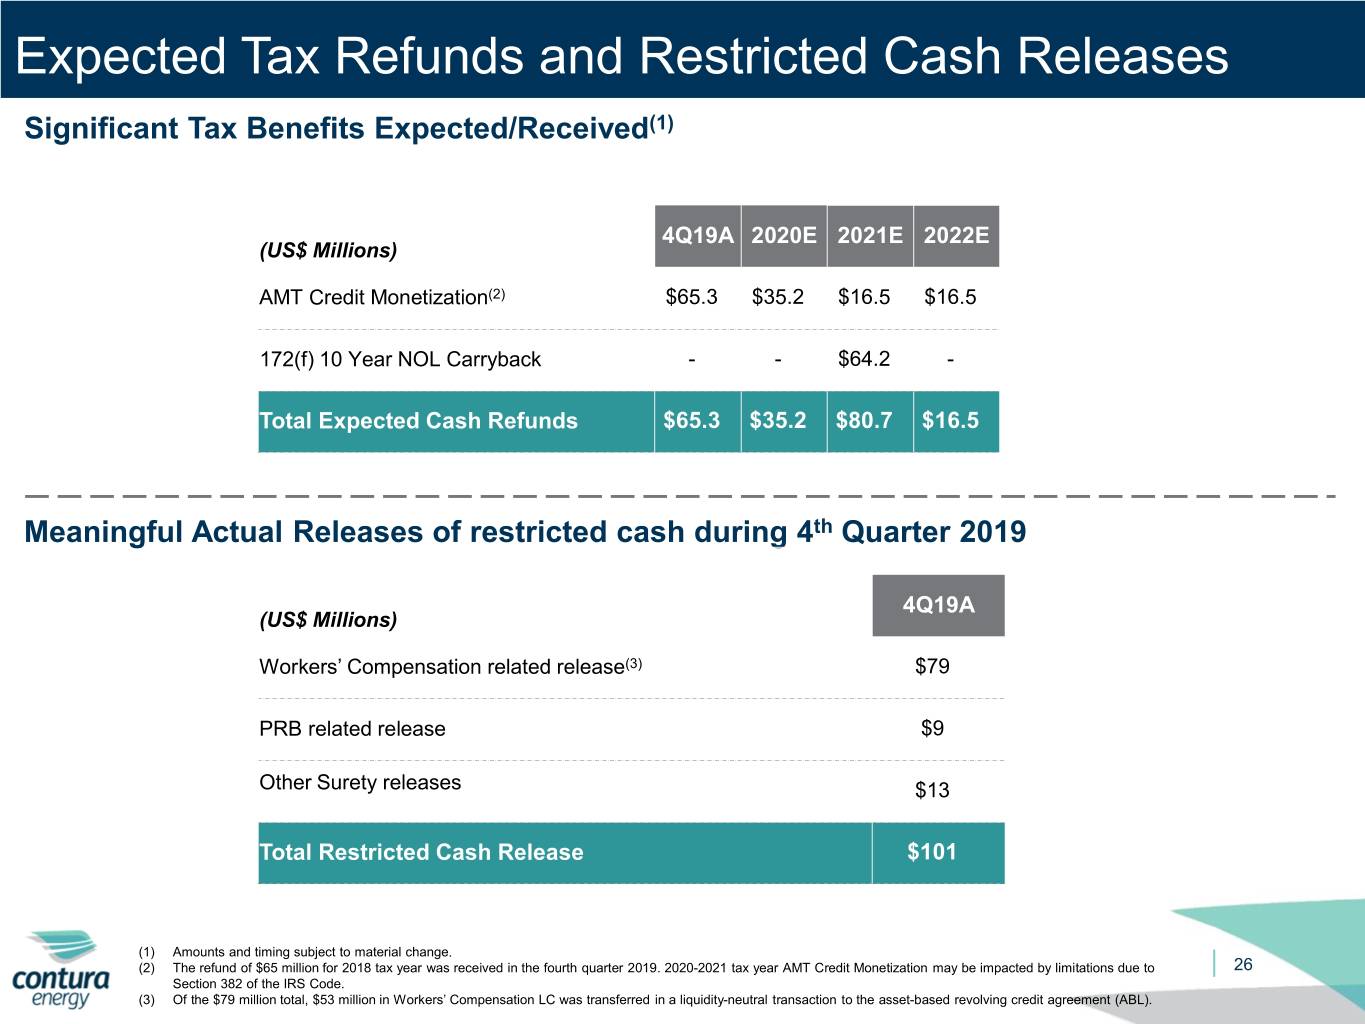
Expected Tax Refunds and Restricted Cash Releases Significant Tax Benefits Expected/Received(1) 4Q19A 2020E 2021E 2022E (US$ Millions) AMT Credit Monetization(2) $65.3 $35.2 $16.5 $16.5 172(f) 10 Year NOL Carryback - - $64.2 - Total Expected Cash Refunds $65.3 $35.2 $80.7 $16.5 Meaningful Actual Releases of restricted cash during 4th Quarter 2019 4Q19A (US$ Millions) Workers’ Compensation related release(3) $79 PRB related release $9 Other Surety releases $13 Total Restricted Cash Release $101 (1) Amounts and timing subject to material change. (2) The refund of $65 million for 2018 tax year was received in the fourth quarter 2019. 2020-2021 tax year AMT Credit Monetization may be impacted by limitations due to 26 Section 382 of the IRS Code. (3) Of the $79 million total, $53 million in Workers’ Compensation LC was transferred in a liquidity-neutral transaction to the asset-based revolving credit agreement (ABL).


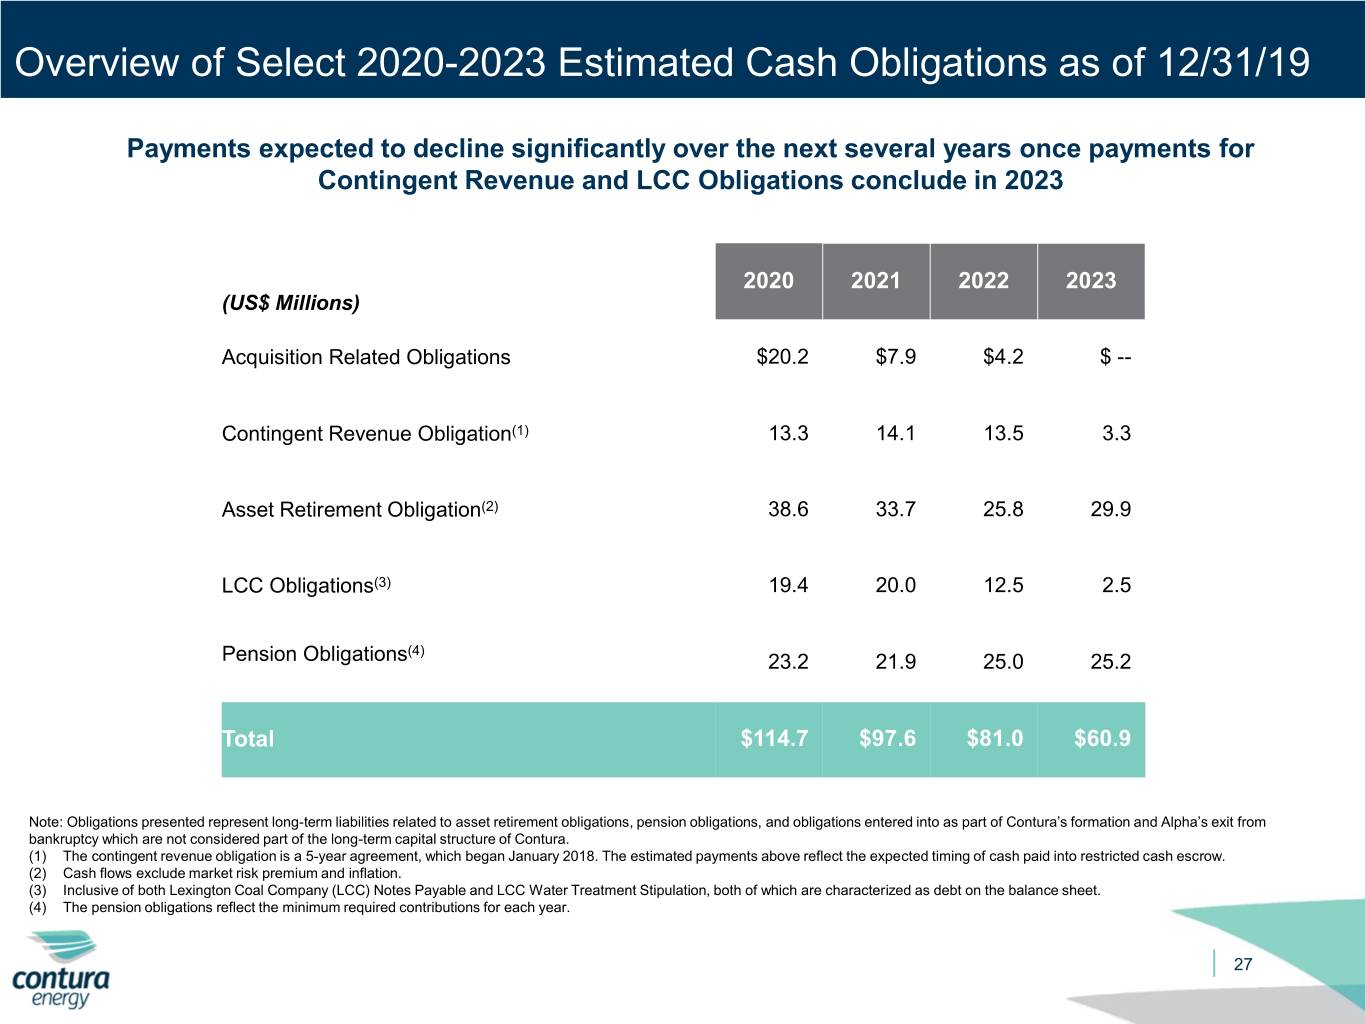
Overview of Select 2020-2023 Estimated Cash Obligations as of 12/31/19 Payments expected to decline significantly over the next several years once payments for Contingent Revenue and LCC Obligations conclude in 2023 2020 2021 2022 2023 (US$ Millions) Acquisition Related Obligations $20.2 $7.9 $4.2 $ -- Contingent Revenue Obligation(1) 13.3 14.1 13.5 3.3 Asset Retirement Obligation(2) 38.6 33.7 25.8 29.9 LCC Obligations(3) 19.4 20.0 12.5 2.5 (4) Pension Obligations 23.2 21.9 25.0 25.2 Total $114.7 $97.6 $81.0 $60.9 Note: Obligations presented represent long-term liabilities related to asset retirement obligations, pension obligations, and obligations entered into as part of Contura’s formation and Alpha’s exit from bankruptcy which are not considered part of the long-term capital structure of Contura. (1) The contingent revenue obligation is a 5-year agreement, which began January 2018. The estimated payments above reflect the expected timing of cash paid into restricted cash escrow. (2) Cash flows exclude market risk premium and inflation. (3) Inclusive of both Lexington Coal Company (LCC) Notes Payable and LCC Water Treatment Stipulation, both of which are characterized as debt on the balance sheet. (4) The pension obligations reflect the minimum required contributions for each year. 27


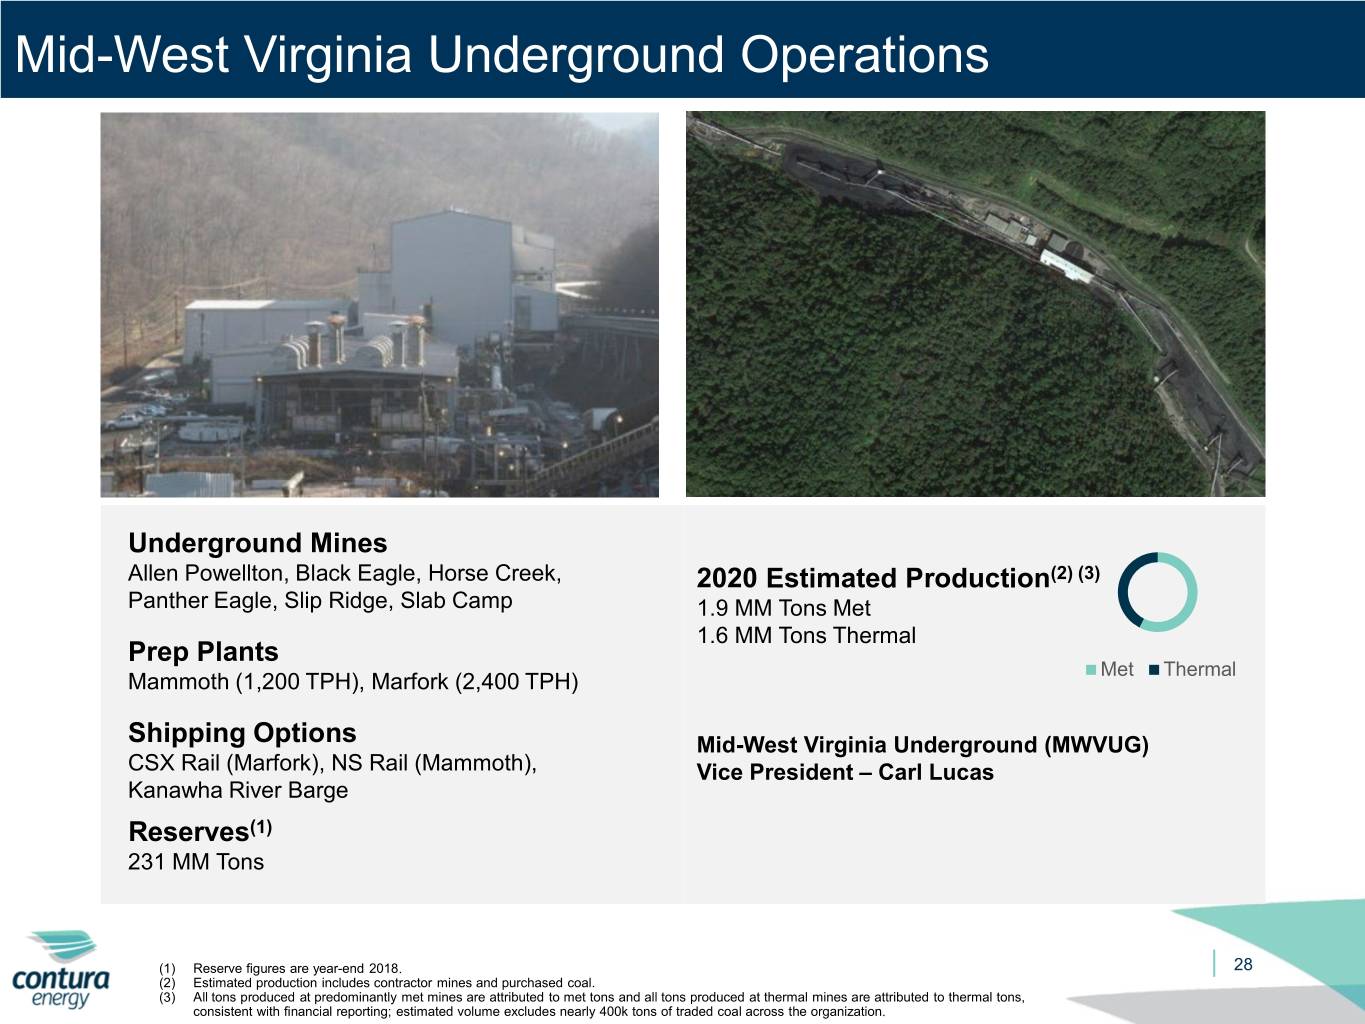
Mid-West Virginia Underground Operations Underground Mines Allen Powellton, Black Eagle, Horse Creek, 2020 Estimated Production(2) (3) Panther Eagle, Slip Ridge, Slab Camp 1.9 MM Tons Met 1.6 MM Tons Thermal Prep Plants Met Thermal Mammoth (1,200 TPH), Marfork (2,400 TPH) Shipping Options Mid-West Virginia Underground (MWVUG) CSX Rail (Marfork), NS Rail (Mammoth), Vice President – Carl Lucas Kanawha River Barge Reserves(1) 231 MM Tons (1) Reserve figures are year-end 2018. 28 (2) Estimated production includes contractor mines and purchased coal. (3) All tons produced at predominantly met mines are attributed to met tons and all tons produced at thermal mines are attributed to thermal tons, consistent with financial reporting; estimated volume excludes nearly 400k tons of traded coal across the organization.


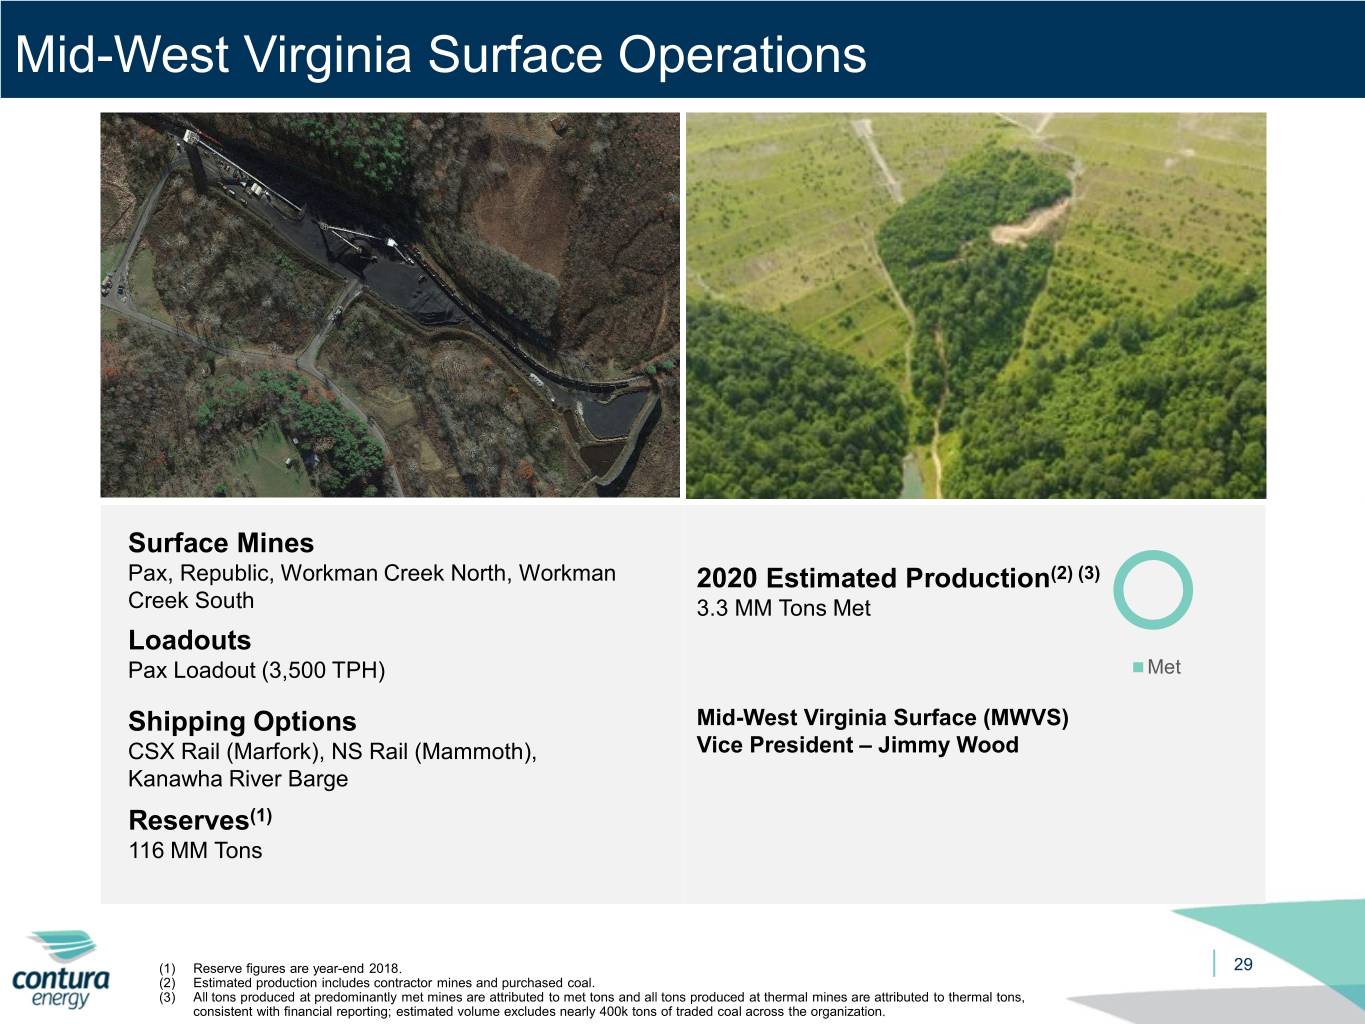
Mid-West Virginia Surface Operations Surface Mines Pax, Republic, Workman Creek North, Workman 2020 Estimated Production(2) (3) Creek South 3.3 MM Tons Met Loadouts Pax Loadout (3,500 TPH) Met Shipping Options Mid-West Virginia Surface (MWVS) CSX Rail (Marfork), NS Rail (Mammoth), Vice President – Jimmy Wood Kanawha River Barge Reserves(1) 116 MM Tons (1) Reserve figures are year-end 2018. 29 (2) Estimated production includes contractor mines and purchased coal. (3) All tons produced at predominantly met mines are attributed to met tons and all tons produced at thermal mines are attributed to thermal tons, consistent with financial reporting; estimated volume excludes nearly 400k tons of traded coal across the organization.


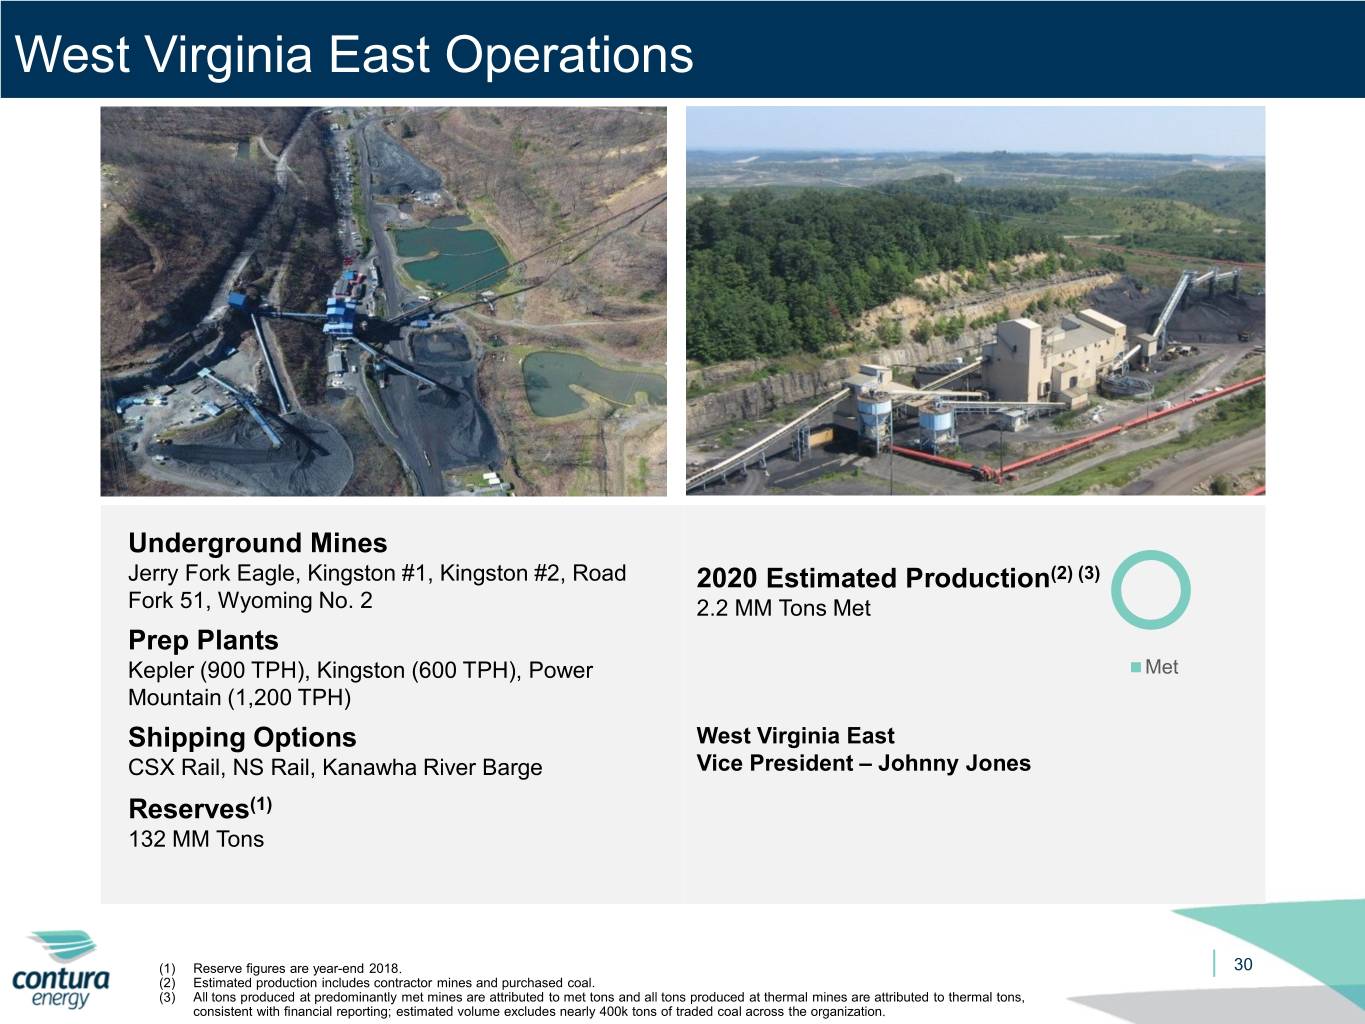
West Virginia East Operations Underground Mines Jerry Fork Eagle, Kingston #1, Kingston #2, Road 2020 Estimated Production(2) (3) Fork 51, Wyoming No. 2 2.2 MM Tons Met Prep Plants Kepler (900 TPH), Kingston (600 TPH), Power Met Mountain (1,200 TPH) Shipping Options West Virginia East CSX Rail, NS Rail, Kanawha River Barge Vice President – Johnny Jones Reserves(1) 132 MM Tons (1) Reserve figures are year-end 2018. 30 (2) Estimated production includes contractor mines and purchased coal. (3) All tons produced at predominantly met mines are attributed to met tons and all tons produced at thermal mines are attributed to thermal tons, consistent with financial reporting; estimated volume excludes nearly 400k tons of traded coal across the organization.


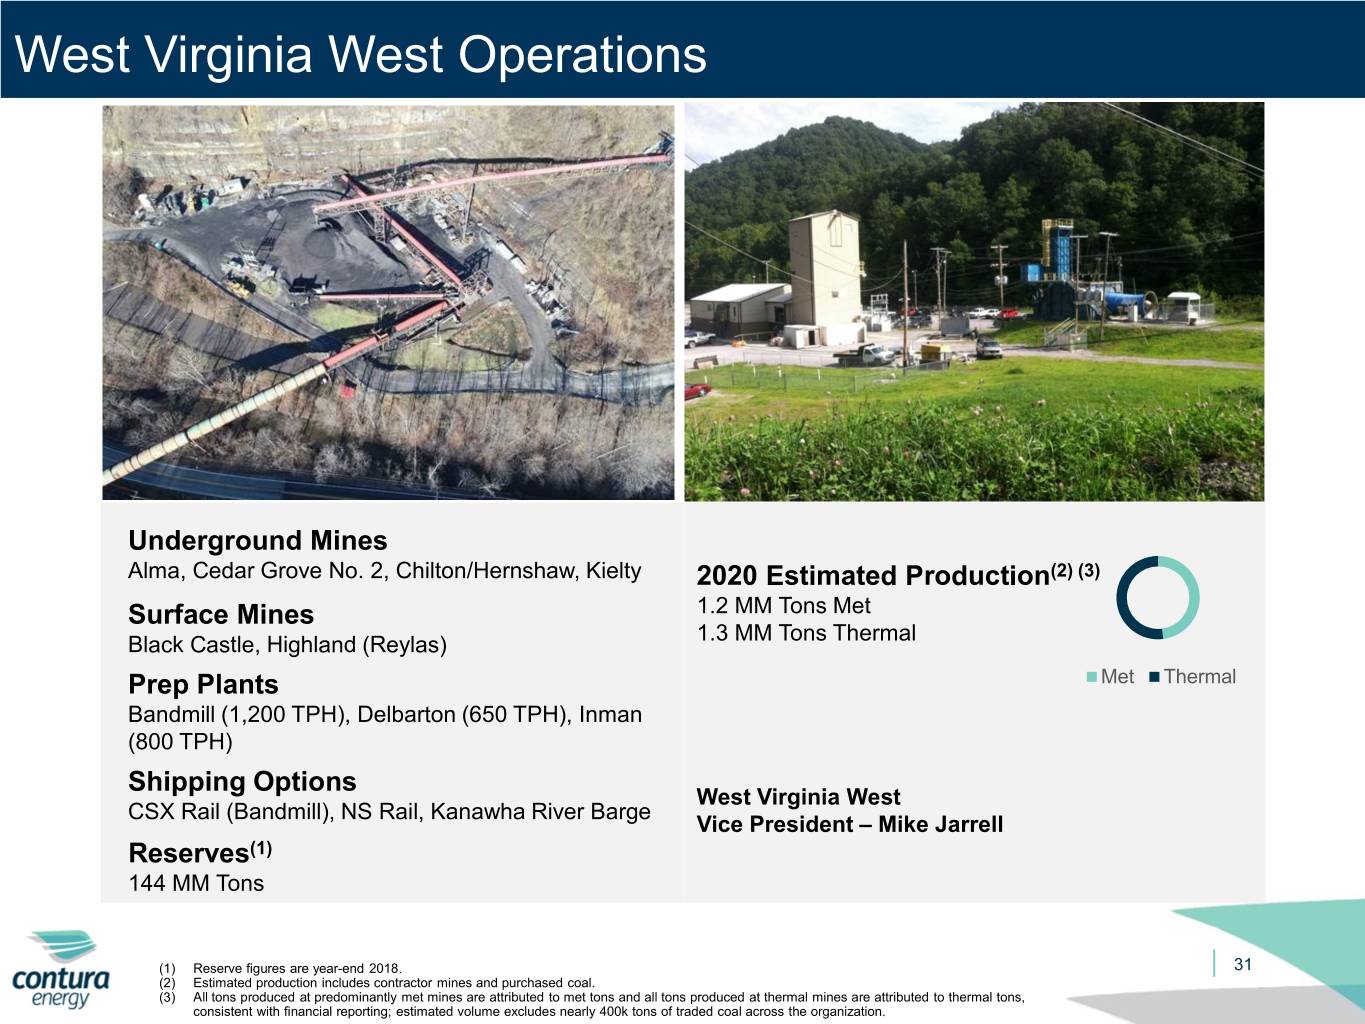
West Virginia West Operations Underground Mines Alma, Cedar Grove No. 2, Chilton/Hernshaw, Kielty 2020 Estimated Production(2) (3) Surface Mines 1.2 MM Tons Met 1.3 MM Tons Thermal Black Castle, Highland (Reylas) Prep Plants Met Thermal Bandmill (1,200 TPH), Delbarton (650 TPH), Inman (800 TPH) Shipping Options West Virginia West CSX Rail (Bandmill), NS Rail, Kanawha River Barge Vice President – Mike Jarrell Reserves(1) 144 MM Tons (1) Reserve figures are year-end 2018. 31 (2) Estimated production includes contractor mines and purchased coal. (3) All tons produced at predominantly met mines are attributed to met tons and all tons produced at thermal mines are attributed to thermal tons, consistent with financial reporting; estimated volume excludes nearly 400k tons of traded coal across the organization.


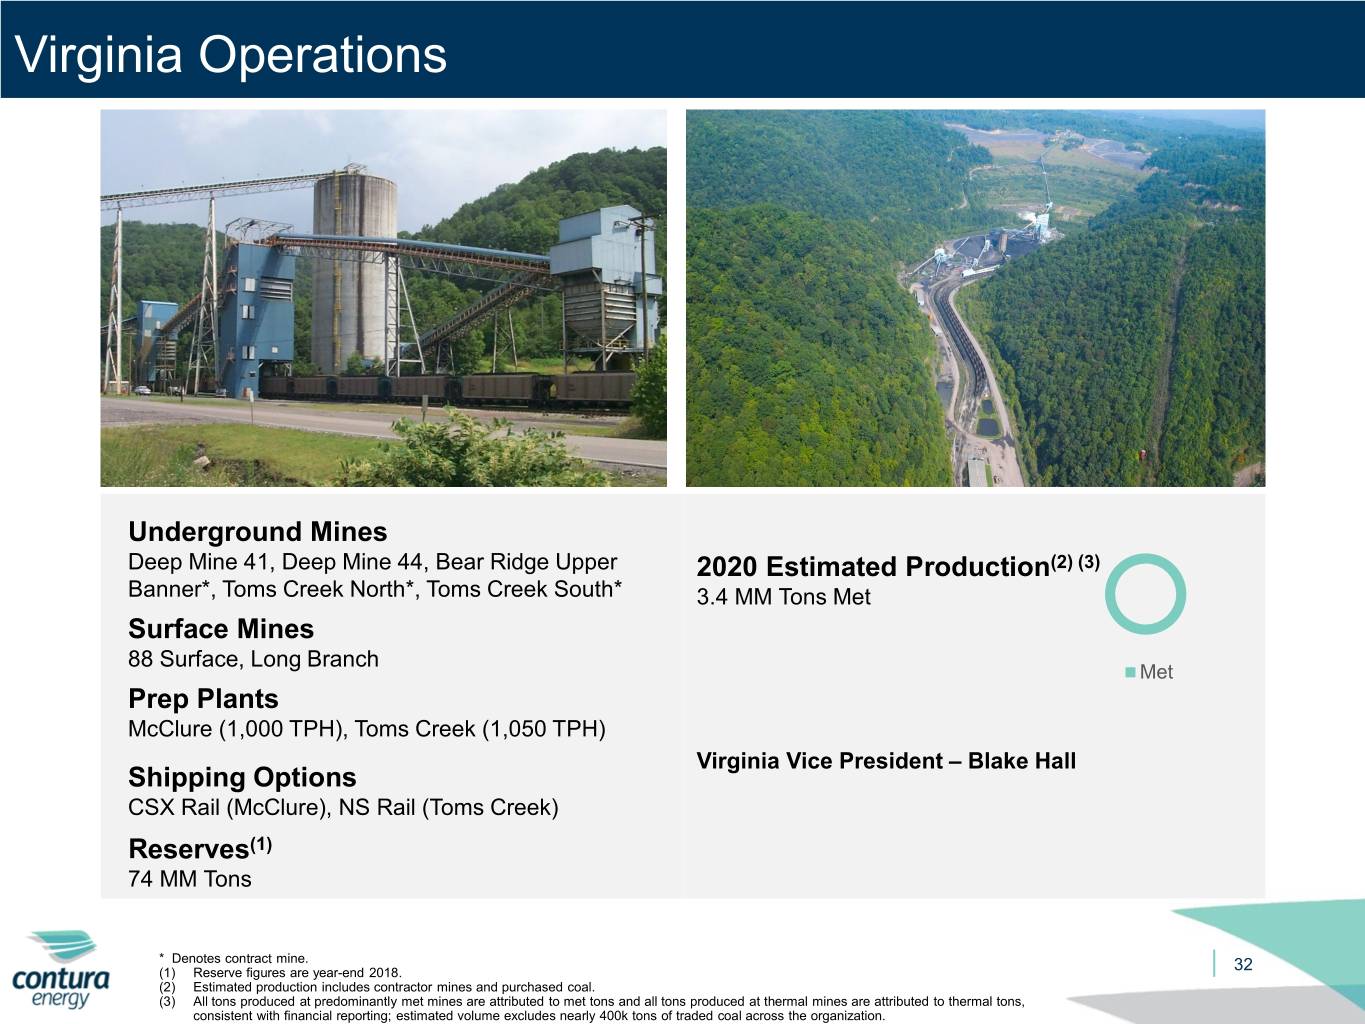
Virginia Operations Underground Mines Deep Mine 41, Deep Mine 44, Bear Ridge Upper 2020 Estimated Production(2) (3) Banner*, Toms Creek North*, Toms Creek South* 3.4 MM Tons Met Surface Mines 88 Surface, Long Branch Met Prep Plants McClure (1,000 TPH), Toms Creek (1,050 TPH) Virginia Vice President – Blake Hall Shipping Options CSX Rail (McClure), NS Rail (Toms Creek) Reserves(1) 74 MM Tons * Denotes contract mine. (1) Reserve figures are year-end 2018. 32 (2) Estimated production includes contractor mines and purchased coal. (3) All tons produced at predominantly met mines are attributed to met tons and all tons produced at thermal mines are attributed to thermal tons, consistent with financial reporting; estimated volume excludes nearly 400k tons of traded coal across the organization.


Pennsylvania Operations Underground Mines Cumberland 2020 Estimated Production Prep Plants 6.4 MM Tons Thermal Cumberland (1,600 TPH) Thermal Shipping Options CSX Rail, NS Rail, Monongahela River Barge Pennsylvania Vice President – Ryan Toler Reserves(1) 652 MM Tons (1) Reserve figures are year-end 2018 and include Freeport and Sewickley seams. 33


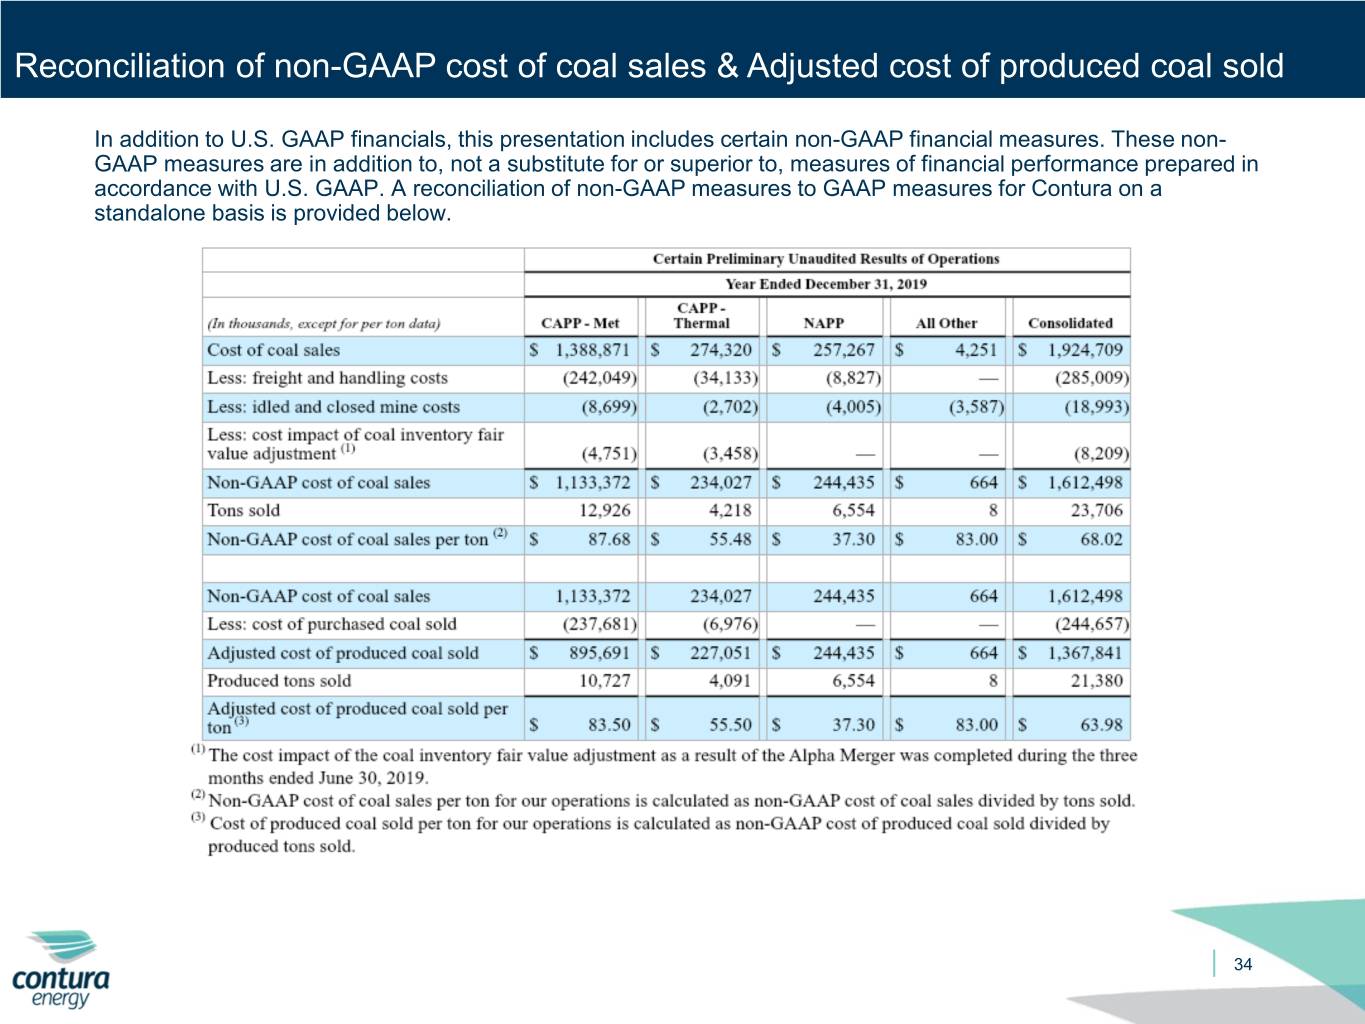
Reconciliation of non-GAAP cost of coal sales & Adjusted cost of produced coal sold In addition to U.S. GAAP financials, this presentation includes certain non-GAAP financial measures. These non- GAAP measures are in addition to, not a substitute for or superior to, measures of financial performance prepared in accordance with U.S. GAAP. A reconciliation of non-GAAP measures to GAAP measures for Contura on a standalone basis is provided below. 34