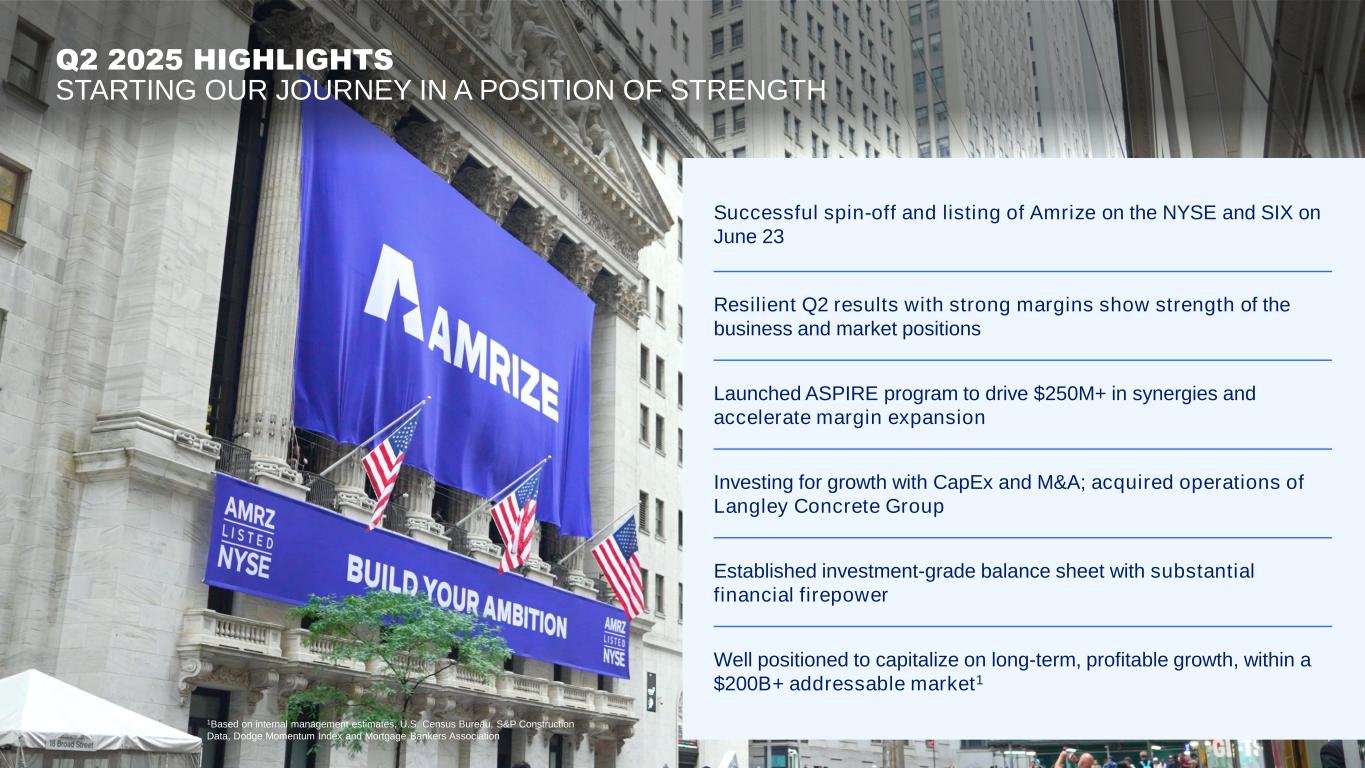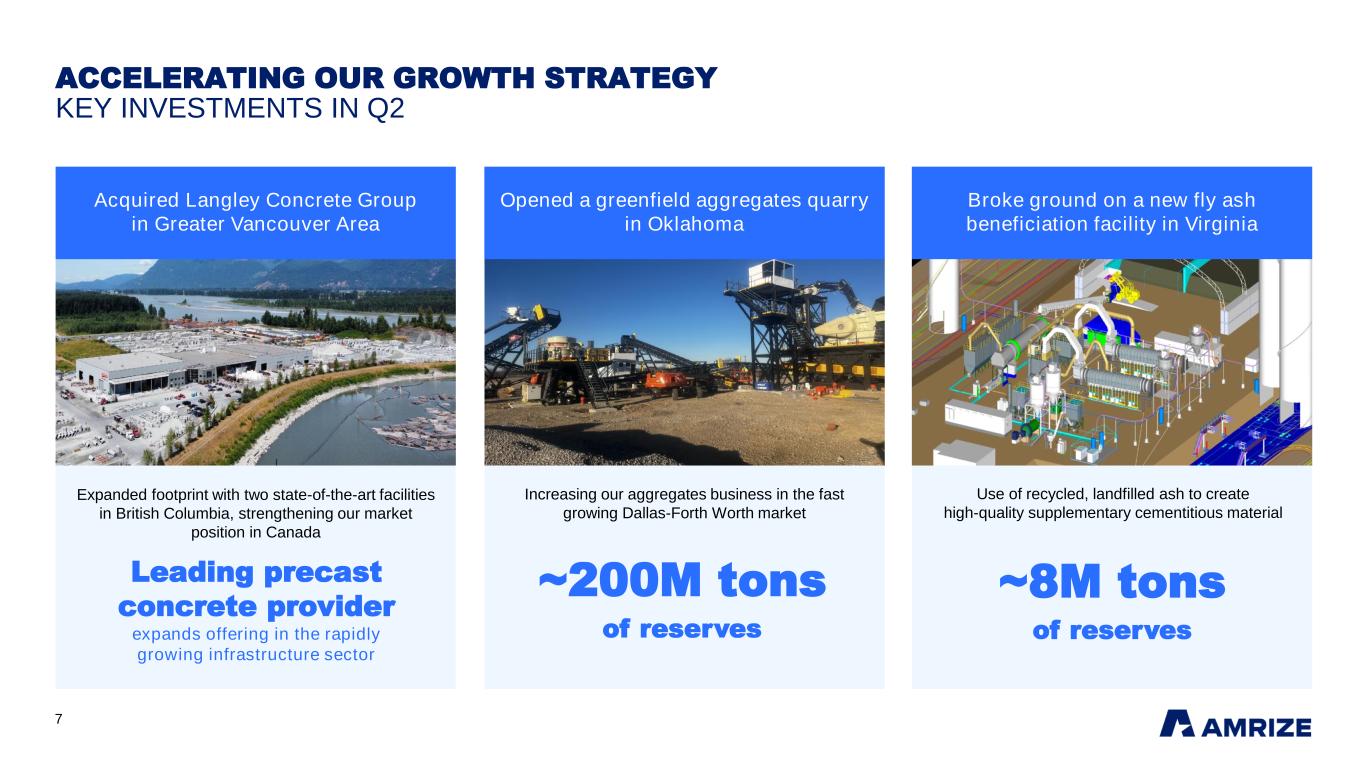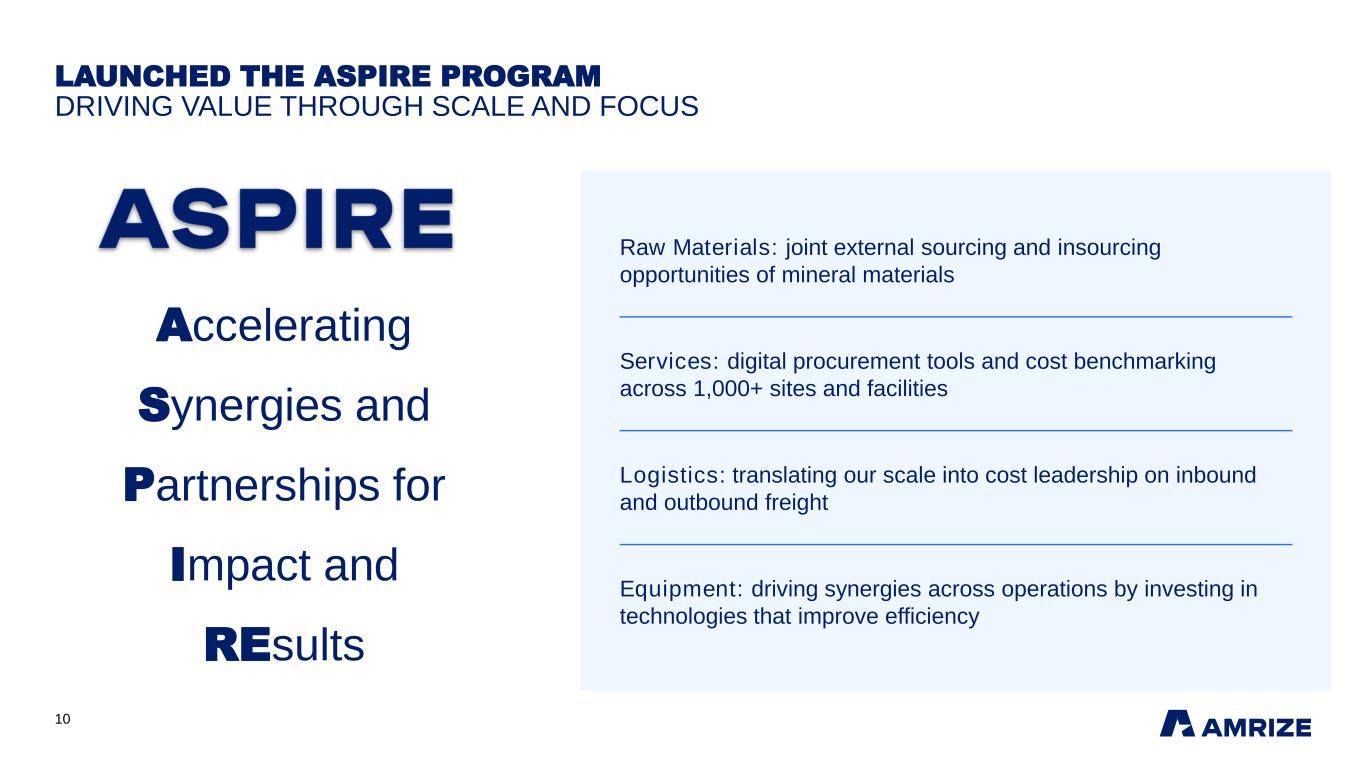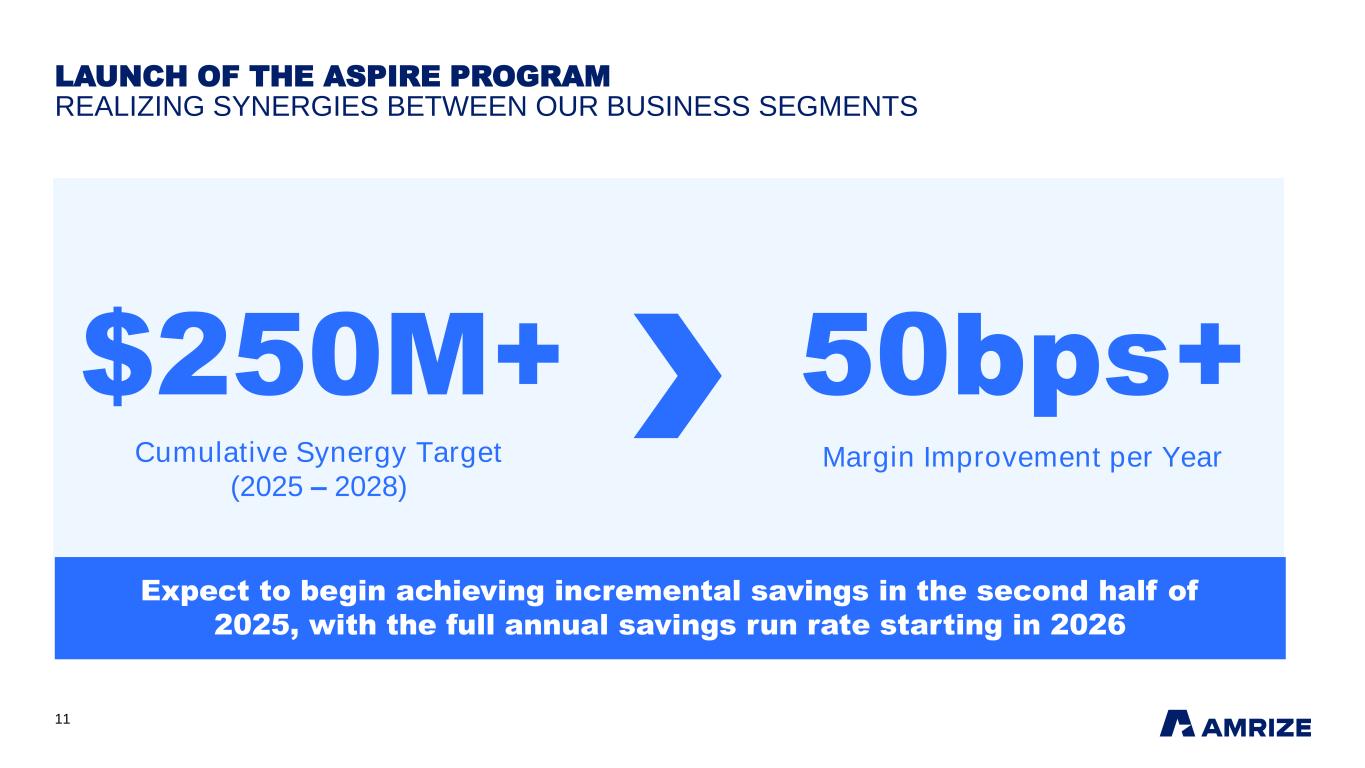
Media Release Ad hoc announcement pursuant to Art. 53 LR Media Relations: [email protected] Investor Relations: [email protected] +1 773-676-4981 1 +1 773-355-4404 Amrize Delivers Solid Second Quarter, Starts Journey in Position of Strength ● Successful spin-off and listing of Amrize on the NYSE and SIX on June 23 ● Resilient Q2 results with strong margins show strength of the business and market positions ● Launched ASPIRE program to drive $250M+ in synergies and accelerate margin expansion ● Investing for growth with CapEx and M&A; acquired operations of Langley Concrete Group, Inc. ● Established investment-grade balance sheet with substantial financial firepower ● Well positioned to capitalize on long-term, profitable growth within a $200B+ addressable market CHICAGO/ZUG, August 6, 2025 – Amrize (AMRZ) announced today its second quarter 2025 financial results. Jan Jenisch, Chairman and CEO: "We successfully listed Amrize on the NYSE and SIX on June 23 and we now begin our growth journey as Amrize in a position of strength, ready to serve our customers as the partner of choice for the professional builders of North America. In the second quarter, we successfully navigated a challenging environment, generating stable revenue and strong margins showing the resilience and strength of our business and market positions. With a growing order book, we are partnering with our customers to advance their most critical projects from infrastructure modernization and onshoring of advanced manufacturing to data center expansion and the need to bridge the housing gap. The steps we are taking from investing in our growth to driving synergies across the business provide the foundation for us to capitalize on the strong, long-term demand across our $200 billion addressable market. With an investment grade balance sheet and substantial financial firepower to fuel our growth, we are ready to deliver superior value to all stakeholders. I thank our 19,000 Amrize teammates across North America who are delivering for our customers and empowering our growth in every U.S. state and Canadian province." Expanding Margins with the ASPIRE Program Amrize launched its ASPIRE program to accelerate synergies and profitable growth. Leveraging its scale across 1,000 sites and two business segments, Amrize is optimizing third party spending and driving efficiencies in its operational footprint and logistics network. With the ASPIRE program, Amrize is targeting more than $250 million in synergies through 2028, delivering over 50 basis points of margin improvement per year. The company expects to begin achieving incremental savings in the second half of 2025, with the full annual savings run rate starting in 2026. Investing for Growth Amrize continued to invest for growth through CapEx and value accretive M&A. Highlights include: • Acquired the operations of Langley Concrete Group, Inc., expanding the company's precast concrete footprint with two state-of-the-art facilities in British Columbia and strengthening its market position in Canada's rapidly growing infrastructure sector. • Opened a greenfield quarry in Oklahoma with 200 million tons of reserves expanding the company's strong aggregates business serving the fast growing Dallas-Fort Worth market.
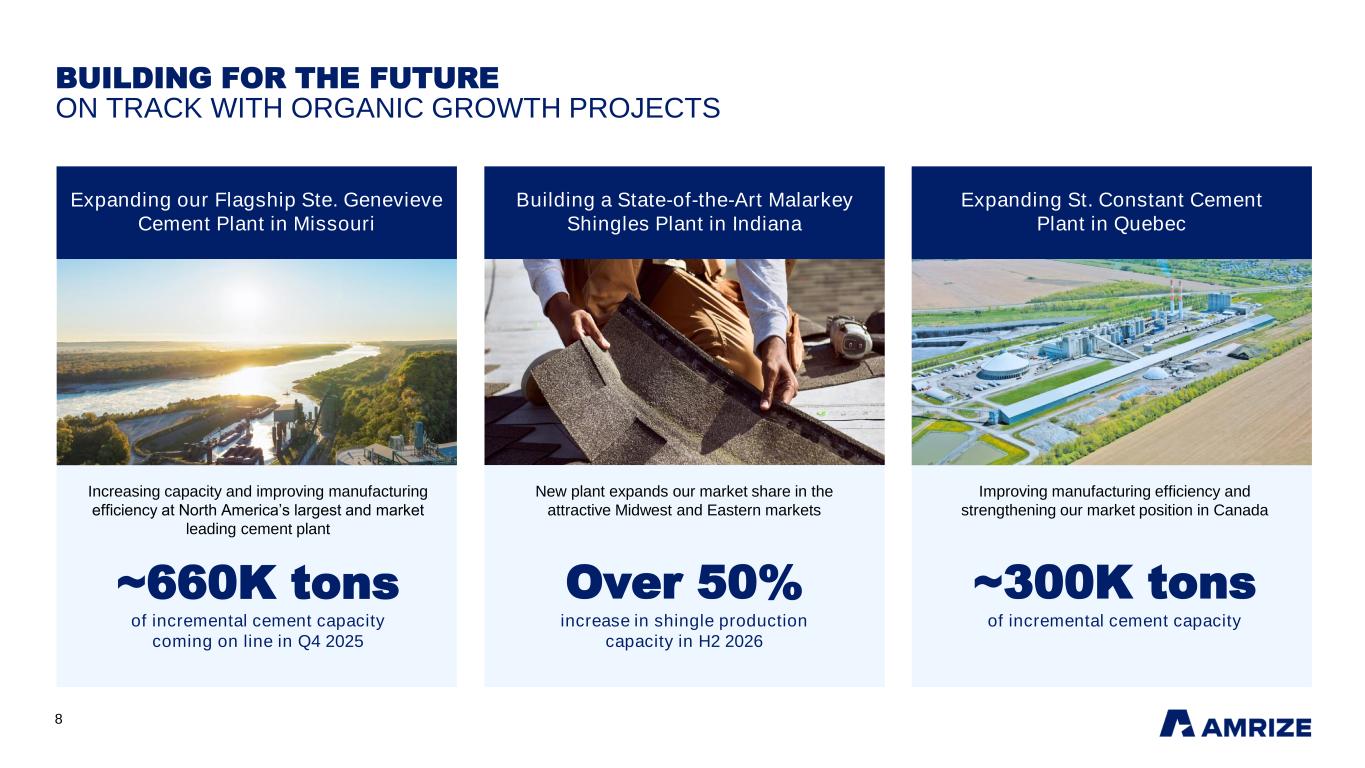
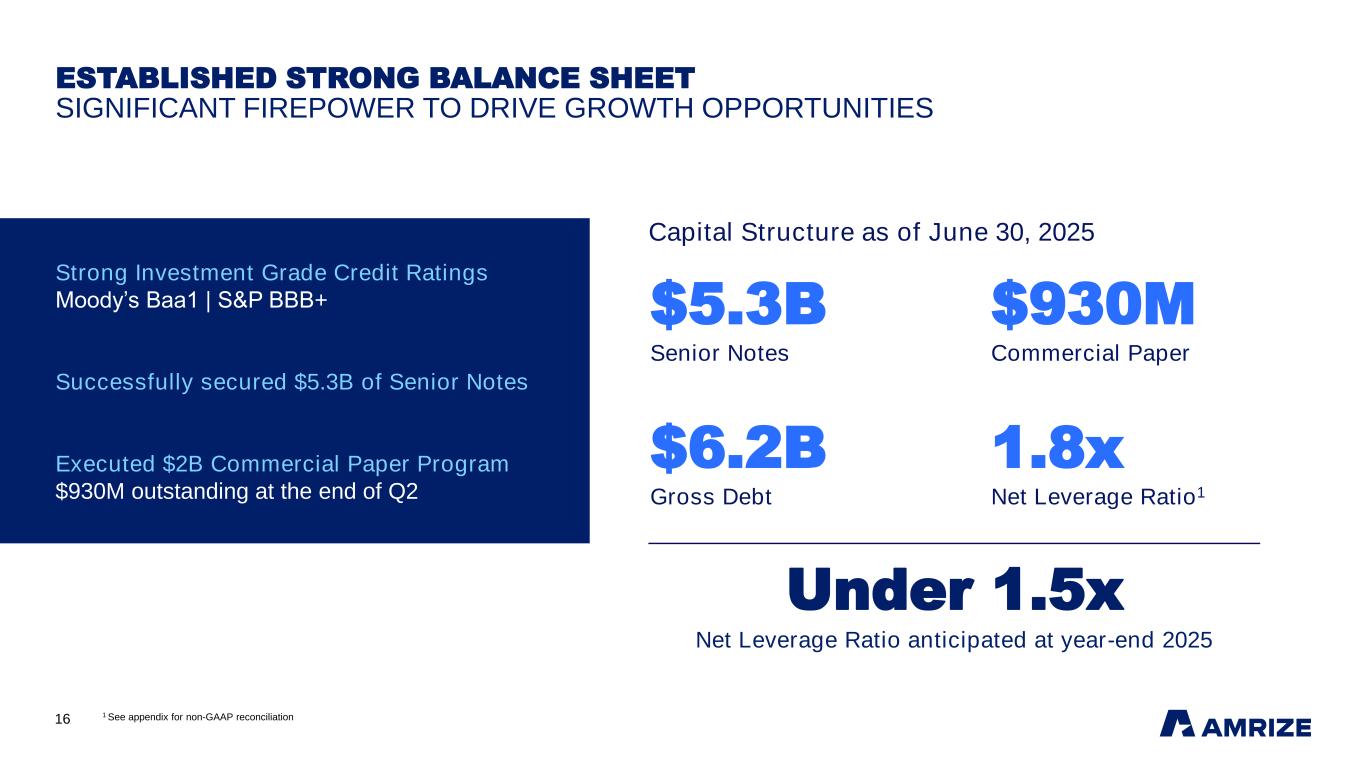
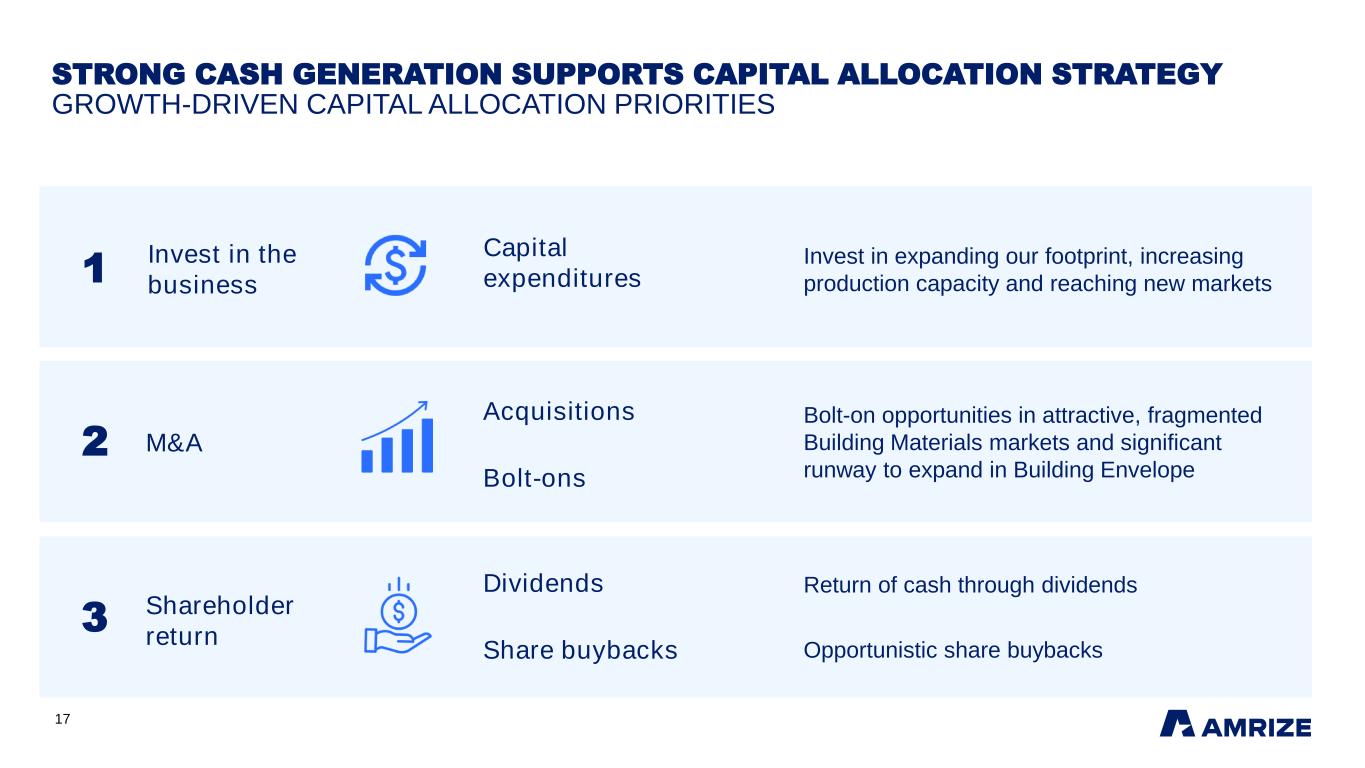
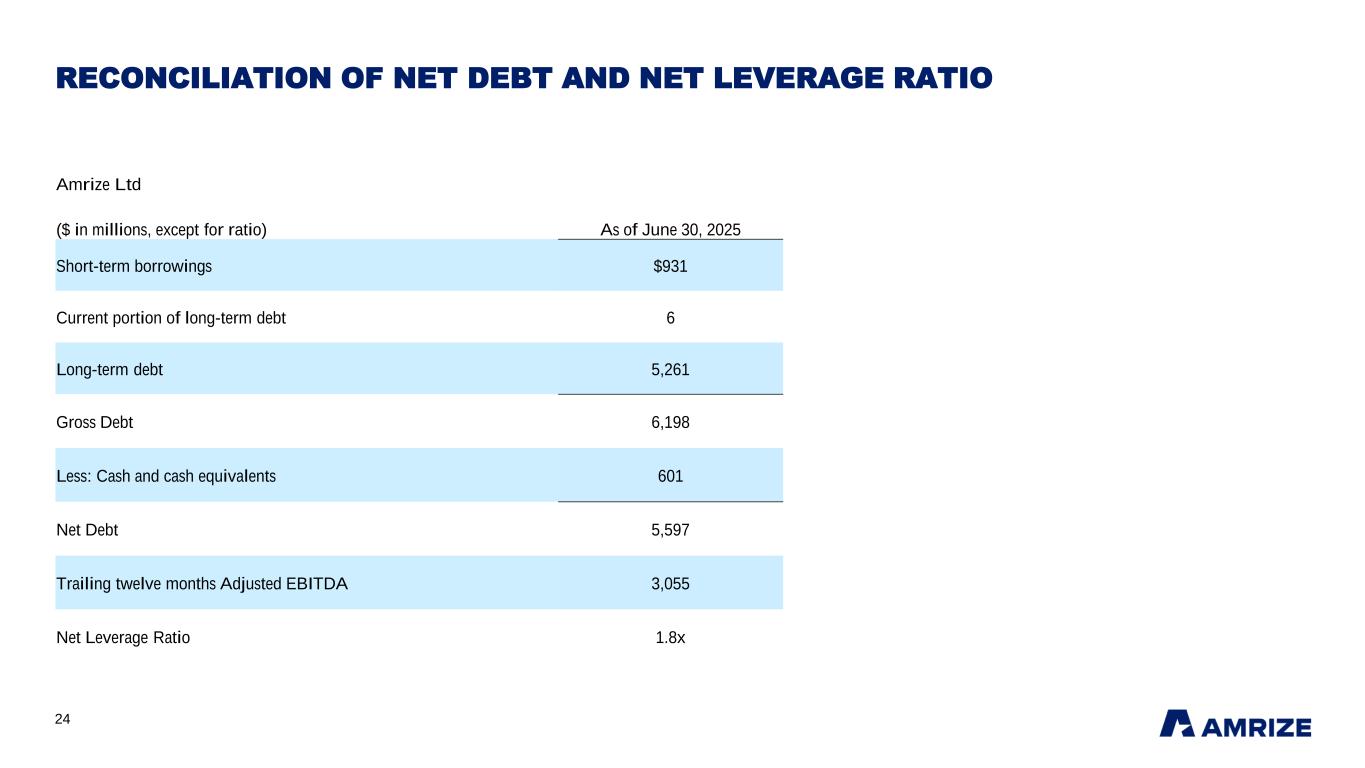
Media Release Ad hoc announcement pursuant to Art. 53 LR Media Relations: [email protected] Investor Relations: [email protected] +1 773-676-4981 2 +1 773-355-4404 • On track to add 660,000 tons of cement capacity and improve manufacturing efficiency by the end of this year at the company's flagship cement plant in Missouri, North America's largest and market-leading cement plant. • Broke ground on a new fly ash beneficiation facility in Virginia, to enable the use of recycled, landfilled ash as a high-quality supplementary cementitious material. • On track to complete construction and open a new state-of-the-art Malarkey shingle factory in Indiana in the second half of 2026 to increase production capacity by over 50% and expand market share in the attractive Midwest and Eastern markets. • On track with expansion of the St. Constant cement plant in Quebec to increase capacity by 300,000 tons, improve manufacturing efficiency and strengthen Amrize's market position in Canada. Established Investment-Grade Balance Sheet Amrize has established a strong balance sheet and capital structure. In the second quarter, the company successfully secured $5.3 billion of senior notes, and $930 million of short-term borrowings under the company's $2 billion commercial paper program. Cash and cash equivalents were $601 million as of June 30, 2025, resulting in Gross Debt balance of $6.2 billion and a Net Debt1 balance of $5.6 billion and a Net Leverage Ratio2 of 1.8x. The company expects to achieve a Net Leverage Ratio of below 1.5x by the end of the year. S&P Global Ratings and Moody's Ratings have rated Amrize investment grate at BBB+ and Baa1, respectively, with a stable outlook. With its strong balance sheet and cash generation, Amrize will maintain a growth-focused capital allocation strategy to prioritize investments in the business, value accretive M&A and shareholder returns. 1 Net Debt represents a non-GAAP measure which is defined on page 7 and reconciled on page 12 and 13. 2 Net leverage ratio represents a non-GAAP measure which is defined on page 7 and reconciled on page 12 and 13.
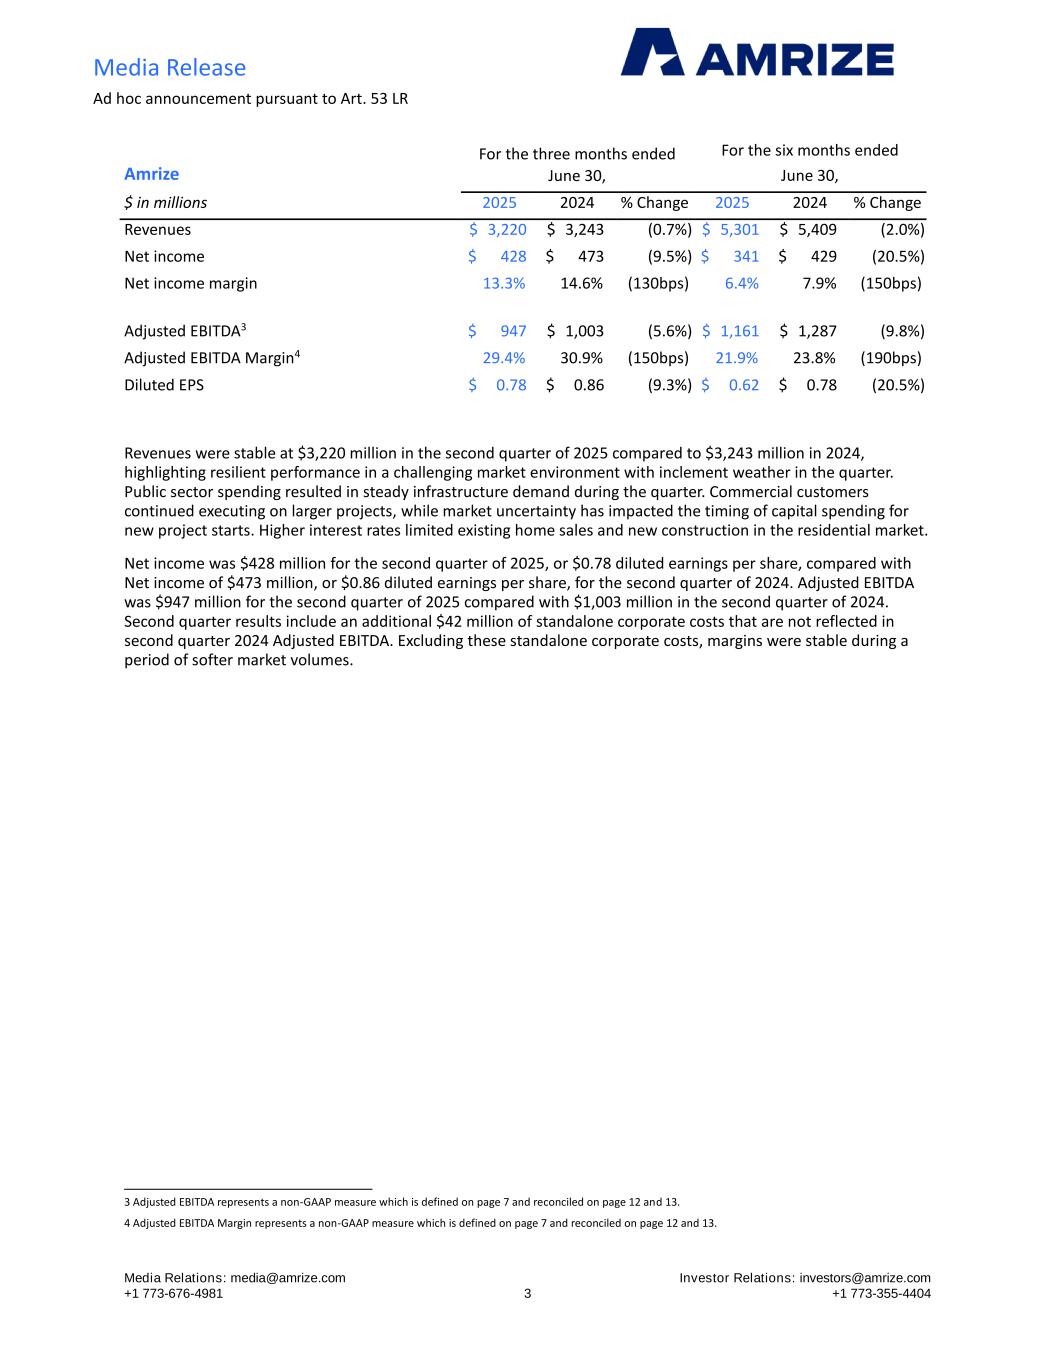
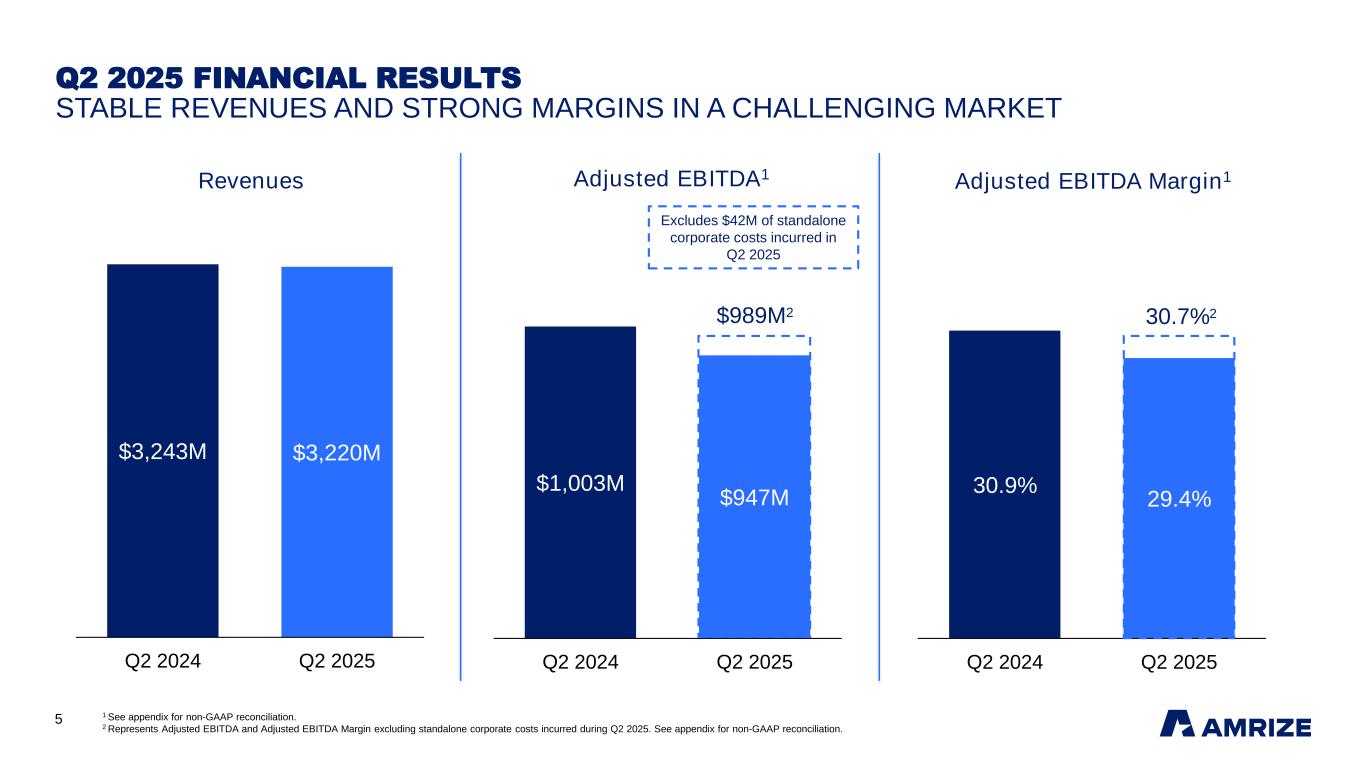
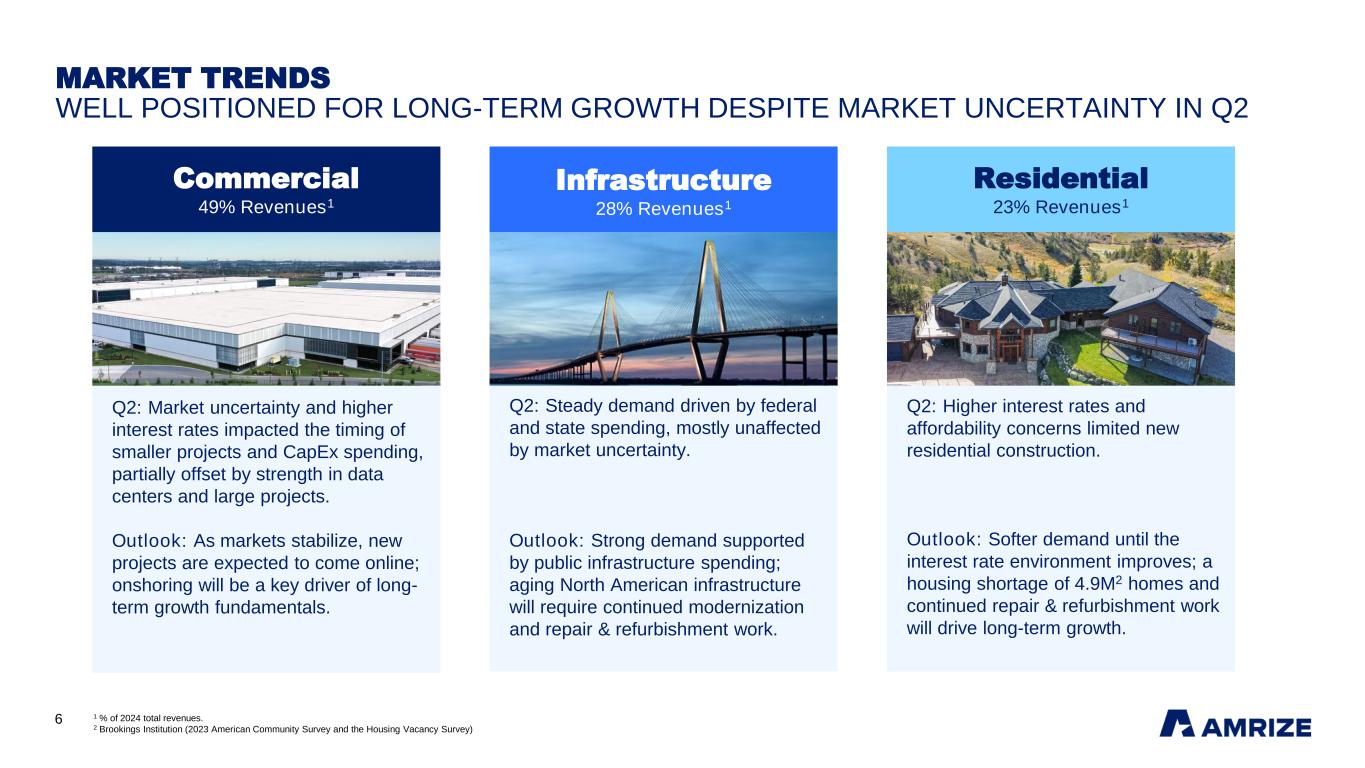
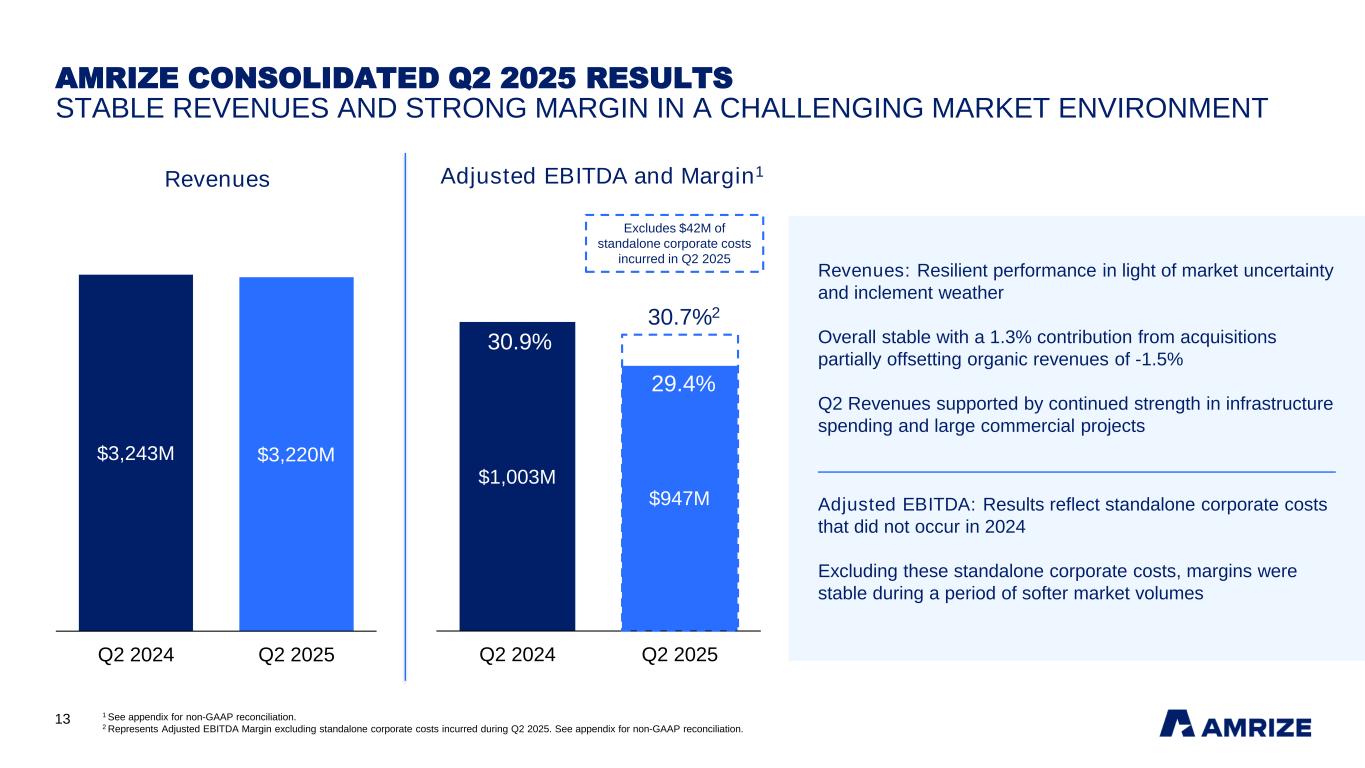
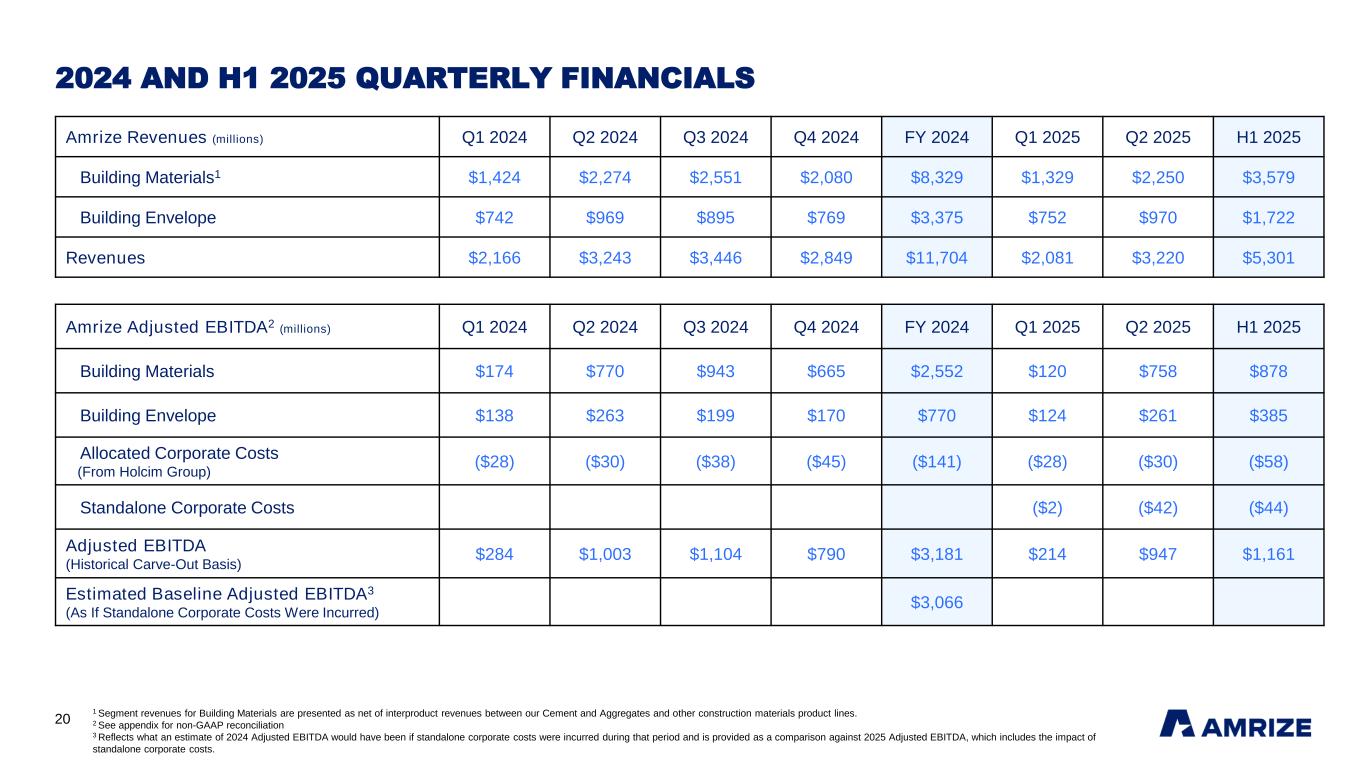
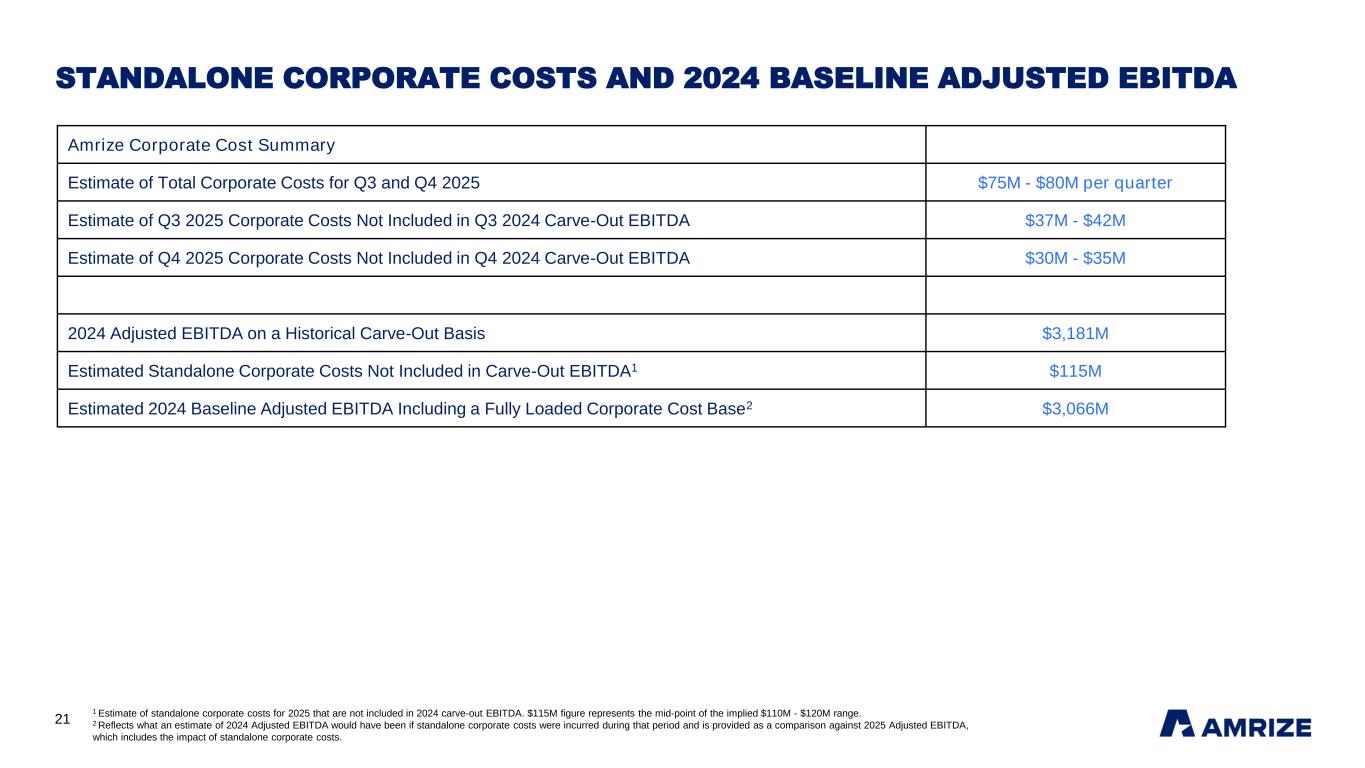
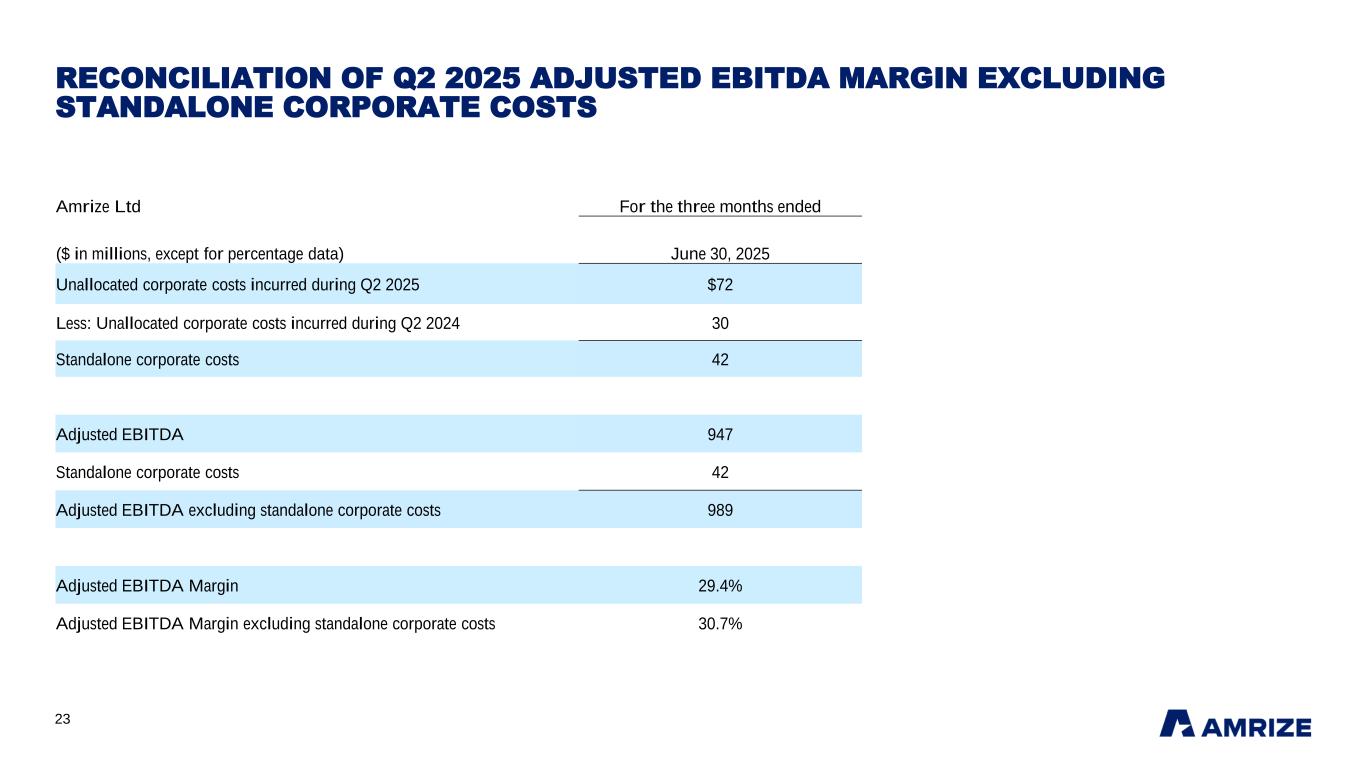
Media Release Ad hoc announcement pursuant to Art. 53 LR Media Relations: [email protected] Investor Relations: [email protected] +1 773-676-4981 3 +1 773-355-4404 Amrize For the three months ended June 30, For the six months ended June 30, $ in millions 2025 2024 % Change 2025 2024 % Change Revenues $ 3,220 $ 3,243 (0.7%) $ 5,301 $ 5,409 (2.0%) Net income $ 428 $ 473 (9.5%) $ 341 $ 429 (20.5%) Net income margin 13.3% 14.6% (130bps) 6.4% 7.9% (150bps) Adjusted EBITDA3 $ 947 $ 1,003 (5.6%) $ 1,161 $ 1,287 (9.8%) Adjusted EBITDA Margin4 29.4% 30.9% (150bps) 21.9% 23.8% (190bps) Diluted EPS $ 0.78 $ 0.86 (9.3%) $ 0.62 $ 0.78 (20.5%) Revenues were stable at $3,220 million in the second quarter of 2025 compared to $3,243 million in 2024, highlighting resilient performance in a challenging market environment with inclement weather in the quarter. Public sector spending resulted in steady infrastructure demand during the quarter. Commercial customers continued executing on larger projects, while market uncertainty has impacted the timing of capital spending for new project starts. Higher interest rates limited existing home sales and new construction in the residential market. Net income was $428 million for the second quarter of 2025, or $0.78 diluted earnings per share, compared with Net income of $473 million, or $0.86 diluted earnings per share, for the second quarter of 2024. Adjusted EBITDA was $947 million for the second quarter of 2025 compared with $1,003 million in the second quarter of 2024. Second quarter results include an additional $42 million of standalone corporate costs that are not reflected in second quarter 2024 Adjusted EBITDA. Excluding these standalone corporate costs, margins were stable during a period of softer market volumes. 3 Adjusted EBITDA represents a non-GAAP measure which is defined on page 7 and reconciled on page 12 and 13. 4 Adjusted EBITDA Margin represents a non-GAAP measure which is defined on page 7 and reconciled on page 12 and 13.
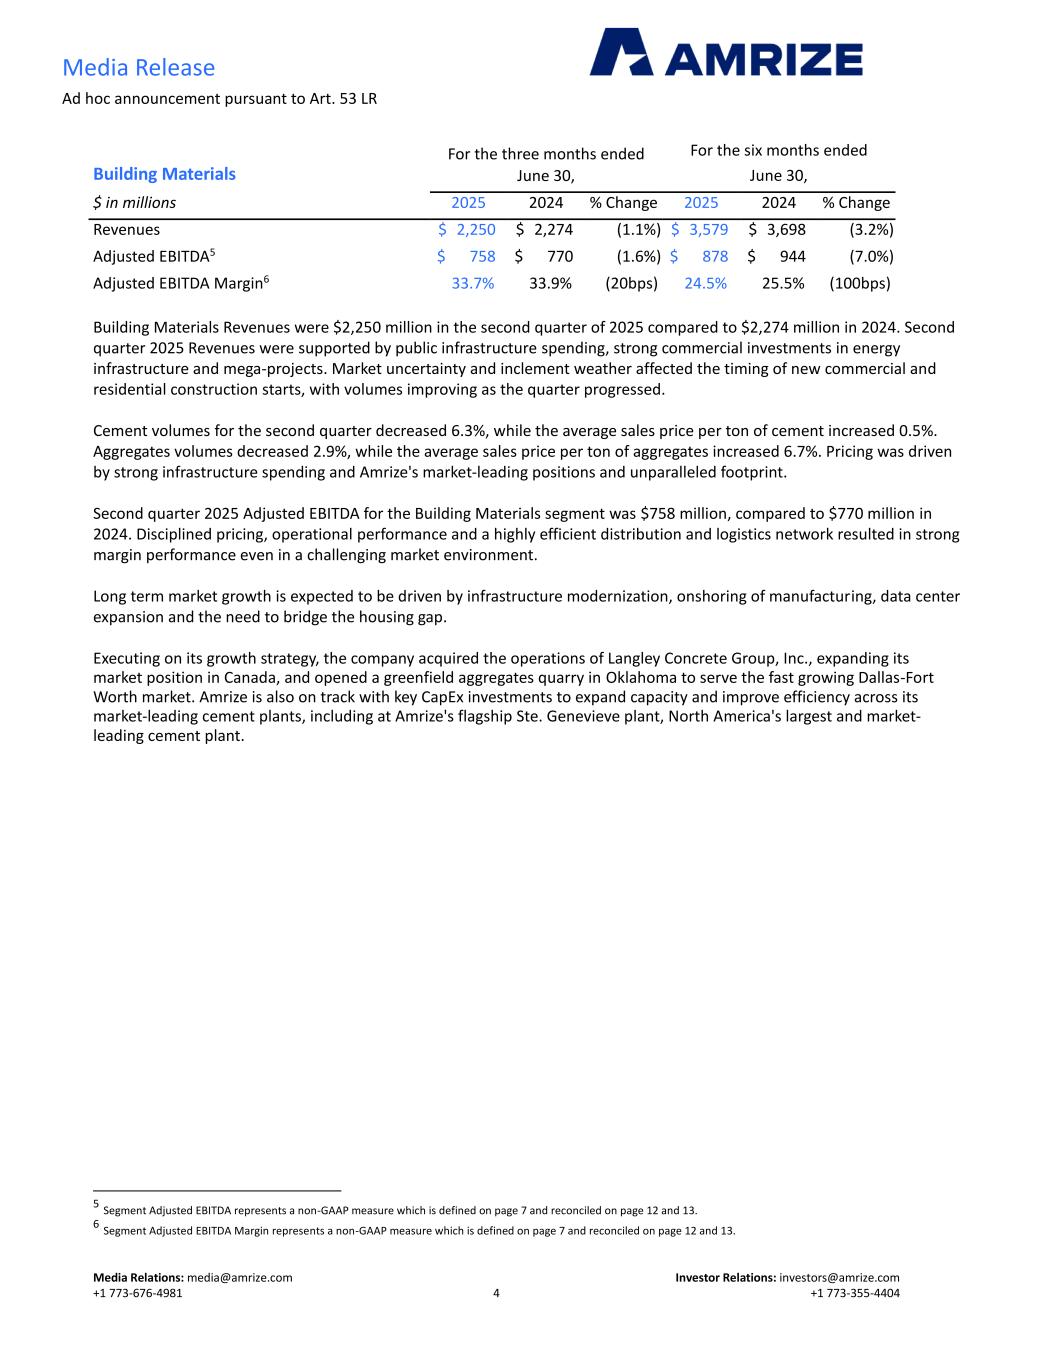
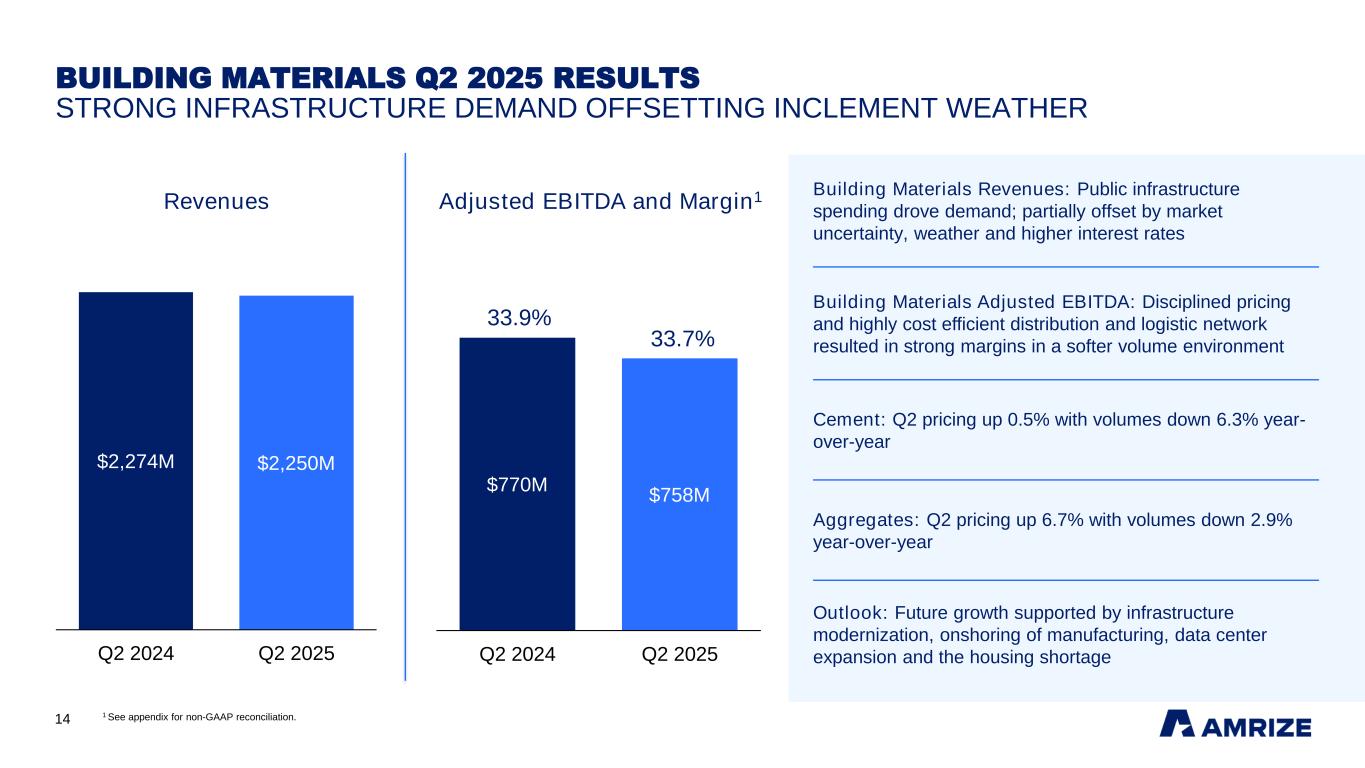
Media Release Ad hoc announcement pursuant to Art. 53 LR Media Relations: [email protected] Investor Relations: [email protected] +1 773-676-4981 4 +1 773-355-4404 Building Materials For the three months ended June 30, For the six months ended June 30, $ in millions 2025 2024 % Change 2025 2024 % Change Revenues $ 2,250 $ 2,274 (1.1%) $ 3,579 $ 3,698 (3.2%) Adjusted EBITDA5 $ 758 $ 770 (1.6%) $ 878 $ 944 (7.0%) Adjusted EBITDA Margin6 33.7% 33.9% (20bps) 24.5% 25.5% (100bps) Building Materials Revenues were $2,250 million in the second quarter of 2025 compared to $2,274 million in 2024. Second quarter 2025 Revenues were supported by public infrastructure spending, strong commercial investments in energy infrastructure and mega-projects. Market uncertainty and inclement weather affected the timing of new commercial and residential construction starts, with volumes improving as the quarter progressed. Cement volumes for the second quarter decreased 6.3%, while the average sales price per ton of cement increased 0.5%. Aggregates volumes decreased 2.9%, while the average sales price per ton of aggregates increased 6.7%. Pricing was driven by strong infrastructure spending and Amrize's market-leading positions and unparalleled footprint. Second quarter 2025 Adjusted EBITDA for the Building Materials segment was $758 million, compared to $770 million in 2024. Disciplined pricing, operational performance and a highly efficient distribution and logistics network resulted in strong margin performance even in a challenging market environment. Long term market growth is expected to be driven by infrastructure modernization, onshoring of manufacturing, data center expansion and the need to bridge the housing gap. Executing on its growth strategy, the company acquired the operations of Langley Concrete Group, Inc., expanding its market position in Canada, and opened a greenfield aggregates quarry in Oklahoma to serve the fast growing Dallas-Fort Worth market. Amrize is also on track with key CapEx investments to expand capacity and improve efficiency across its market-leading cement plants, including at Amrize's flagship Ste. Genevieve plant, North America's largest and market- leading cement plant. 5 Segment Adjusted EBITDA represents a non-GAAP measure which is defined on page 7 and reconciled on page 12 and 13. 6 Segment Adjusted EBITDA Margin represents a non-GAAP measure which is defined on page 7 and reconciled on page 12 and 13.
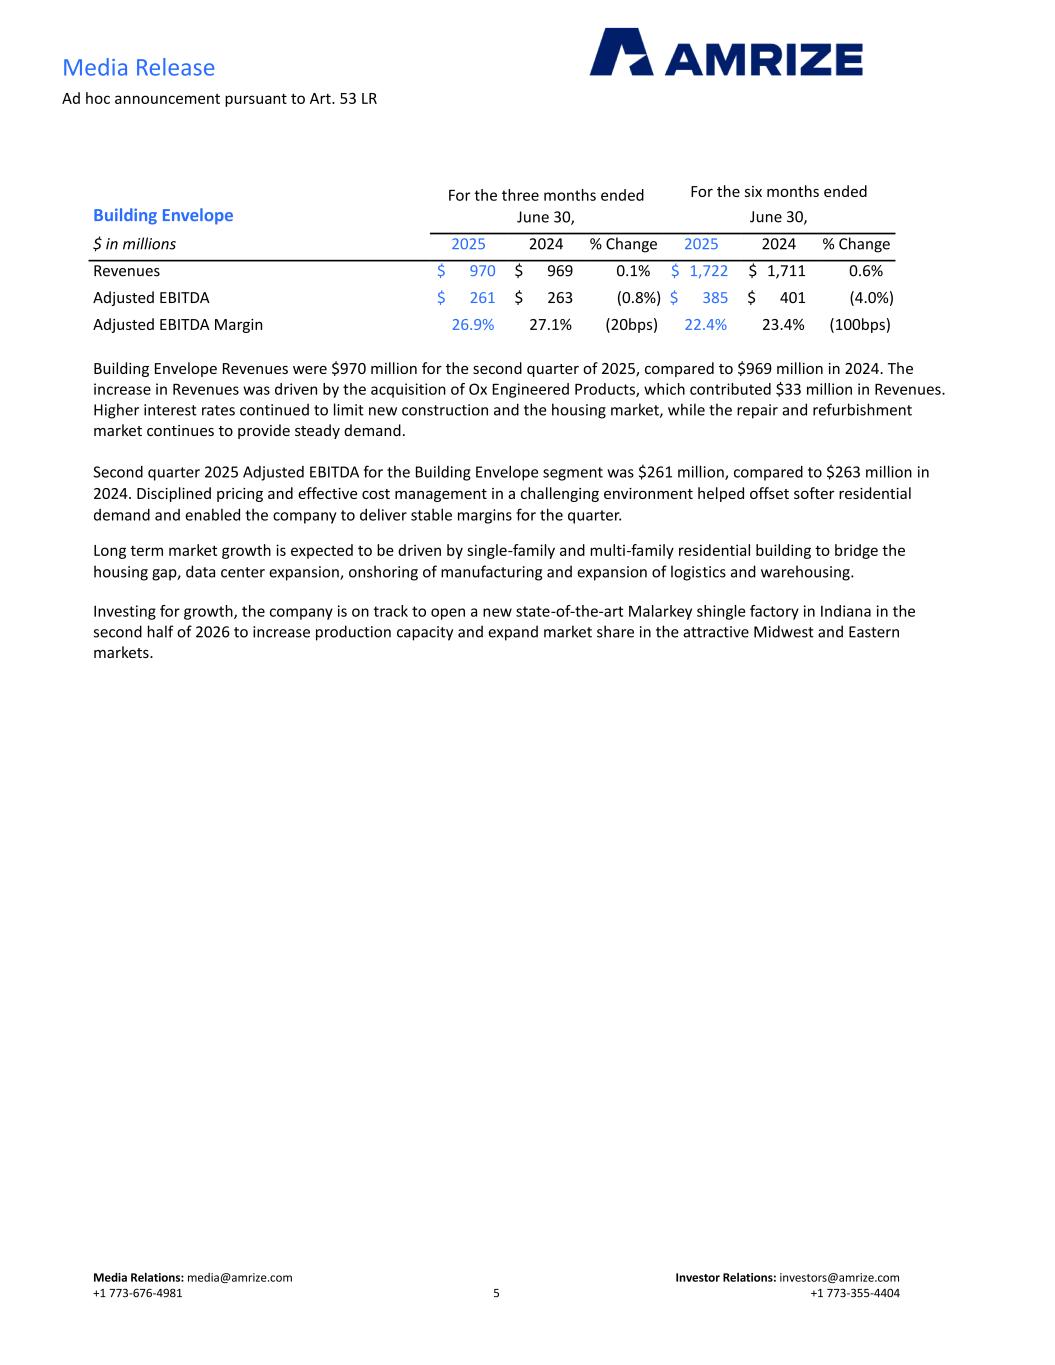
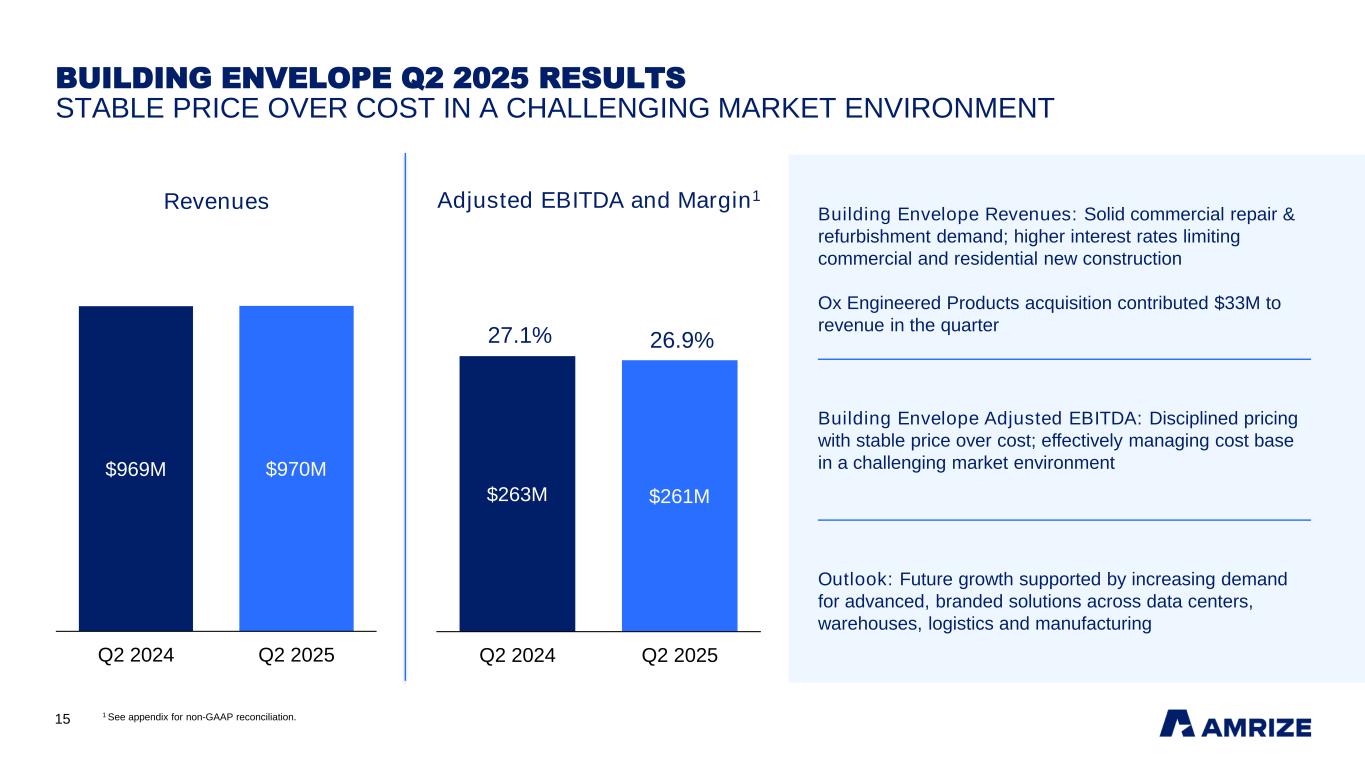
Media Release Ad hoc announcement pursuant to Art. 53 LR Media Relations: [email protected] Investor Relations: [email protected] +1 773-676-4981 5 +1 773-355-4404 Building Envelope For the three months ended June 30, For the six months ended June 30, $ in millions 2025 2024 % Change 2025 2024 % Change Revenues $ 970 $ 969 0.1% $ 1,722 $ 1,711 0.6% Adjusted EBITDA $ 261 $ 263 (0.8%) $ 385 $ 401 (4.0%) Adjusted EBITDA Margin 26.9% 27.1% (20bps) 22.4% 23.4% (100bps) Building Envelope Revenues were $970 million for the second quarter of 2025, compared to $969 million in 2024. The increase in Revenues was driven by the acquisition of Ox Engineered Products, which contributed $33 million in Revenues. Higher interest rates continued to limit new construction and the housing market, while the repair and refurbishment market continues to provide steady demand. Second quarter 2025 Adjusted EBITDA for the Building Envelope segment was $261 million, compared to $263 million in 2024. Disciplined pricing and effective cost management in a challenging environment helped offset softer residential demand and enabled the company to deliver stable margins for the quarter. Long term market growth is expected to be driven by single-family and multi-family residential building to bridge the housing gap, data center expansion, onshoring of manufacturing and expansion of logistics and warehousing. Investing for growth, the company is on track to open a new state-of-the-art Malarkey shingle factory in Indiana in the second half of 2026 to increase production capacity and expand market share in the attractive Midwest and Eastern markets.
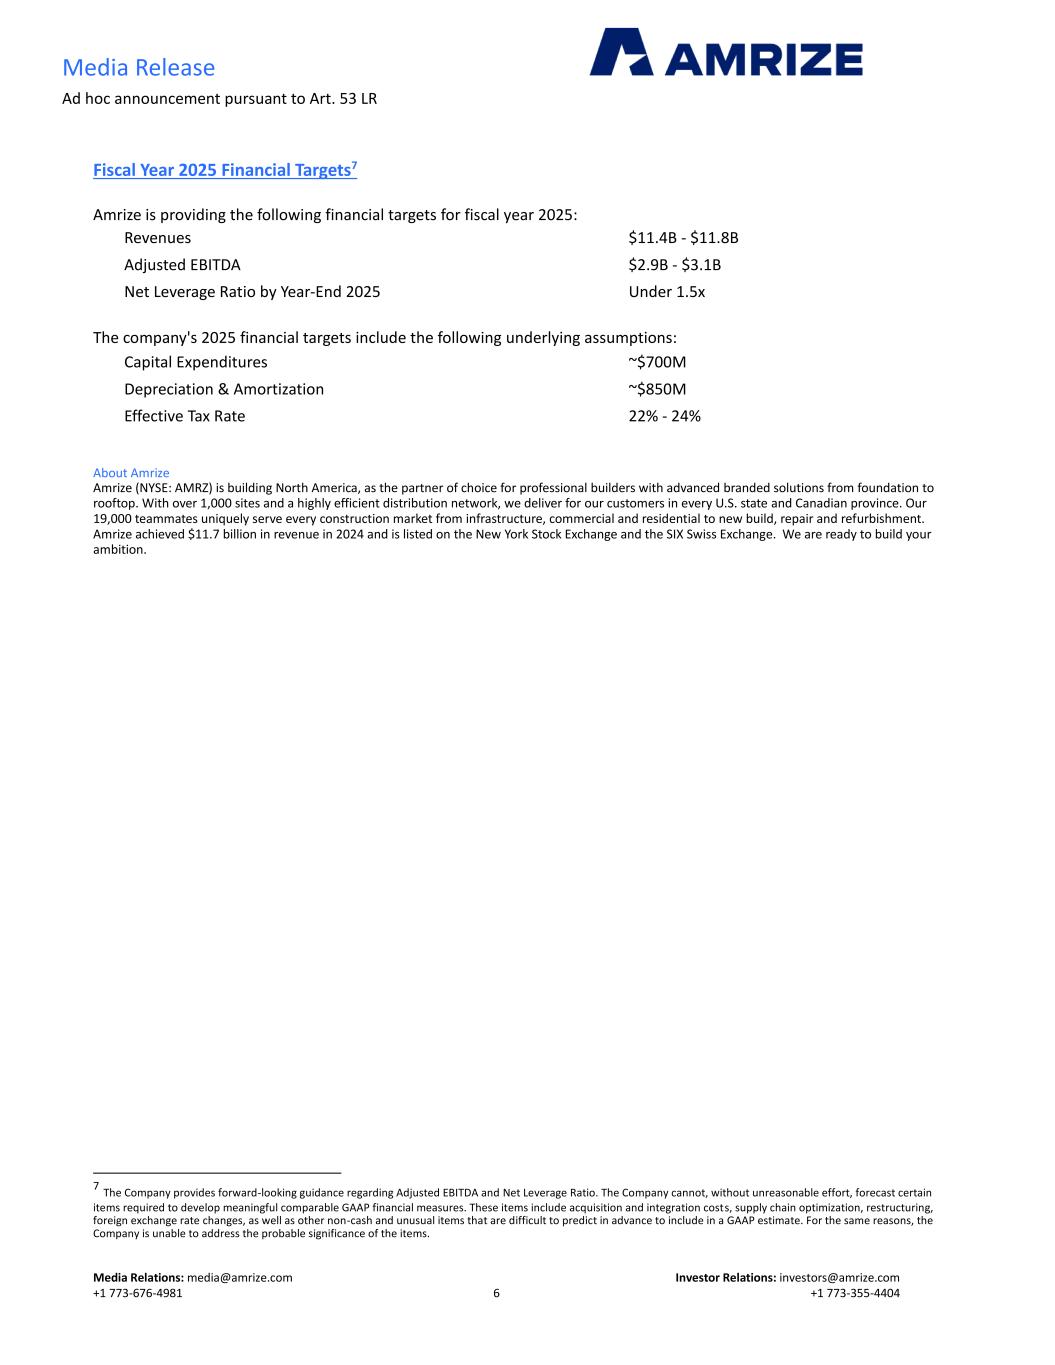
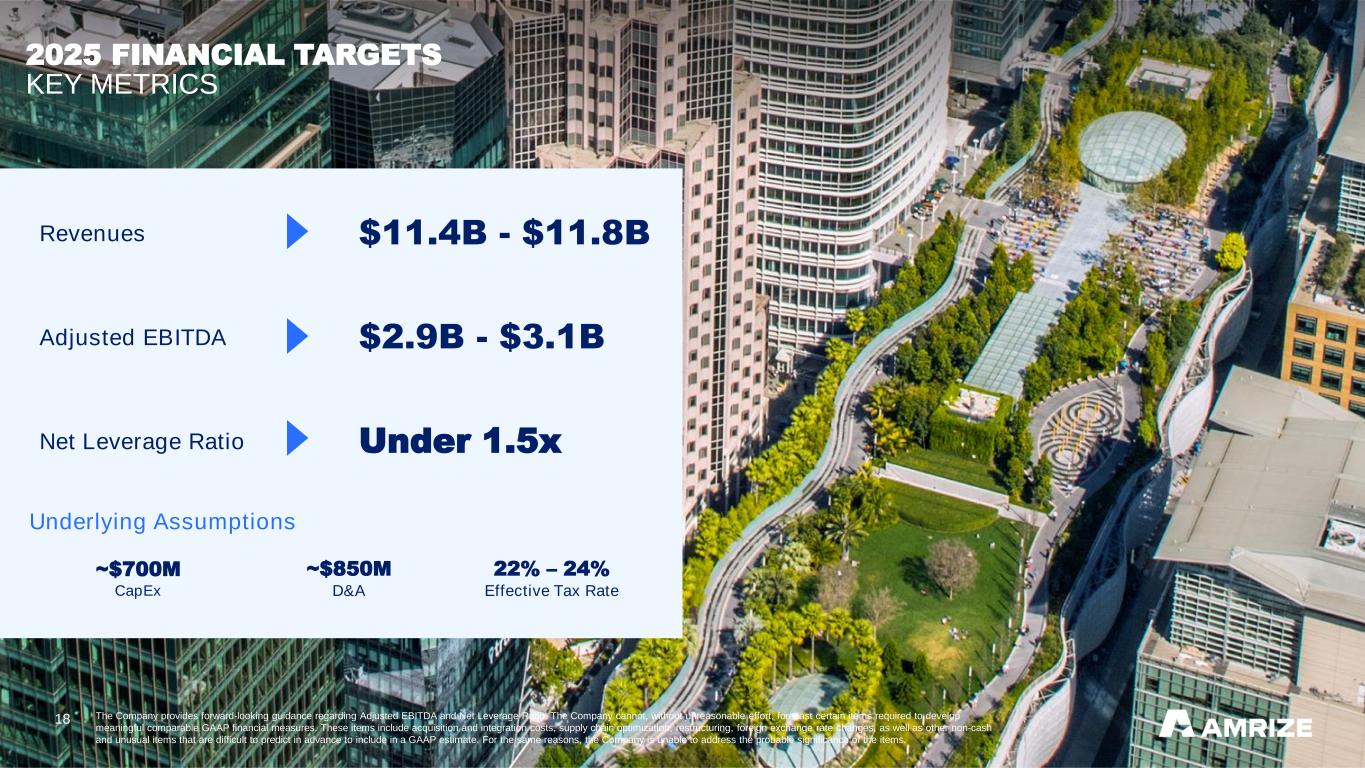
Media Release Ad hoc announcement pursuant to Art. 53 LR Media Relations: [email protected] Investor Relations: [email protected] +1 773-676-4981 6 +1 773-355-4404 Fiscal Year 2025 Financial Targets7 Amrize is providing the following financial targets for fiscal year 2025: Revenues $11.4B - $11.8B Adjusted EBITDA $2.9B - $3.1B Net Leverage Ratio by Year-End 2025 Under 1.5x The company's 2025 financial targets include the following underlying assumptions: Capital Expenditures ~$700M Depreciation & Amortization ~$850M Effective Tax Rate 22% - 24% About Amrize Amrize (NYSE: AMRZ) is building North America, as the partner of choice for professional builders with advanced branded solutions from foundation to rooftop. With over 1,000 sites and a highly efficient distribution network, we deliver for our customers in every U.S. state and Canadian province. Our 19,000 teammates uniquely serve every construction market from infrastructure, commercial and residential to new build, repair and refurbishment. Amrize achieved $11.7 billion in revenue in 2024 and is listed on the New York Stock Exchange and the SIX Swiss Exchange. We are ready to build your ambition. 7 The Company provides forward-looking guidance regarding Adjusted EBITDA and Net Leverage Ratio. The Company cannot, without unreasonable effort, forecast certain items required to develop meaningful comparable GAAP financial measures. These items include acquisition and integration costs, supply chain optimization, restructuring, foreign exchange rate changes, as well as other non-cash and unusual items that are difficult to predict in advance to include in a GAAP estimate. For the same reasons, the Company is unable to address the probable significance of the items.
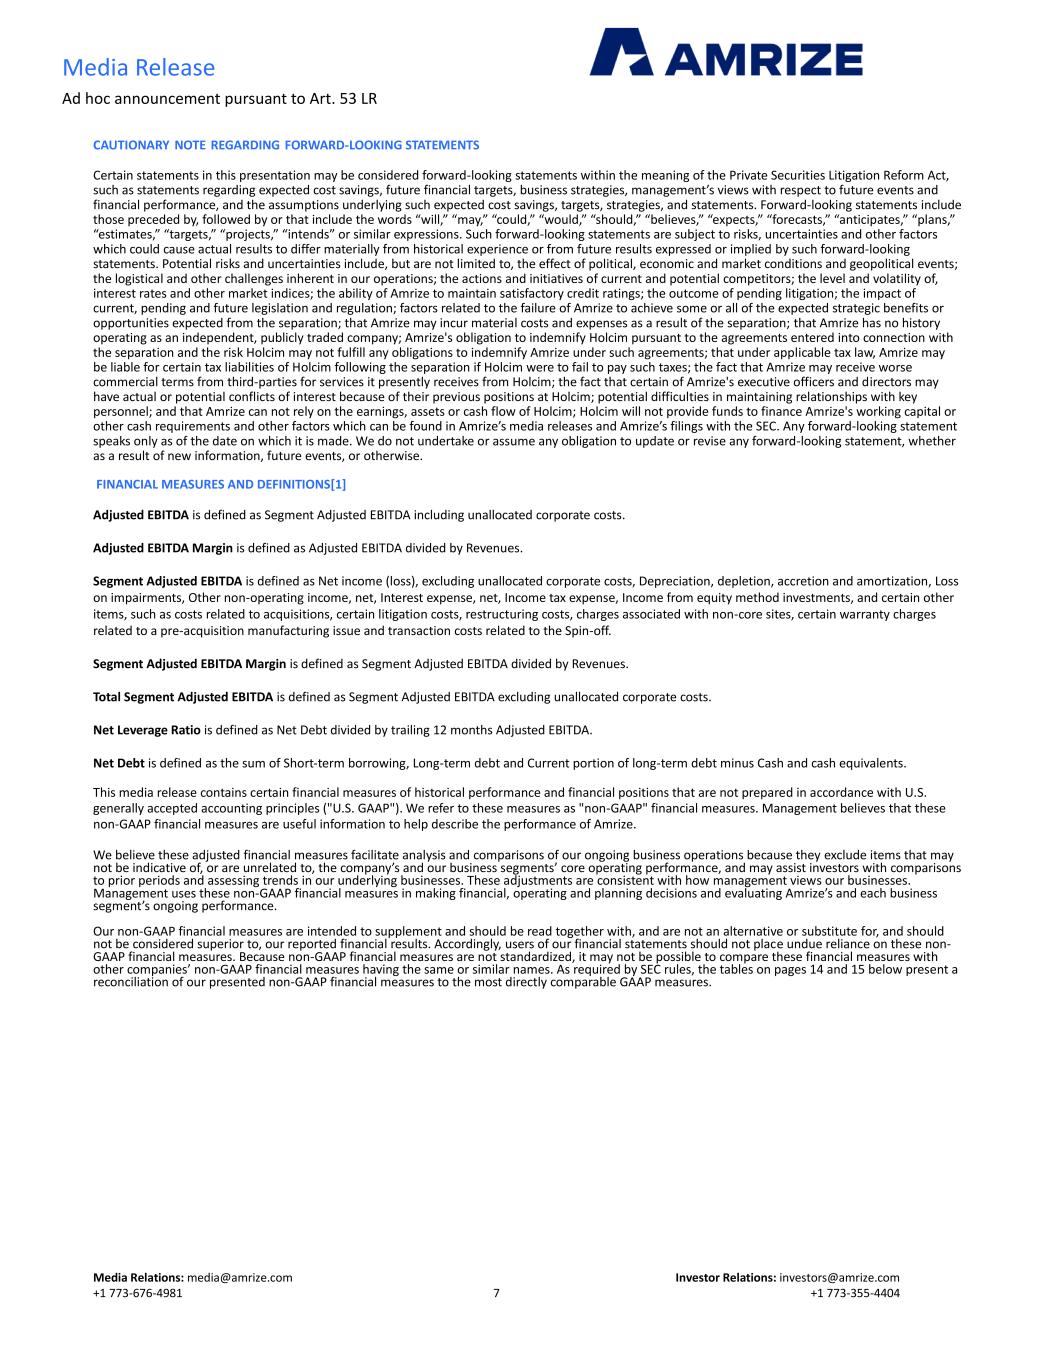
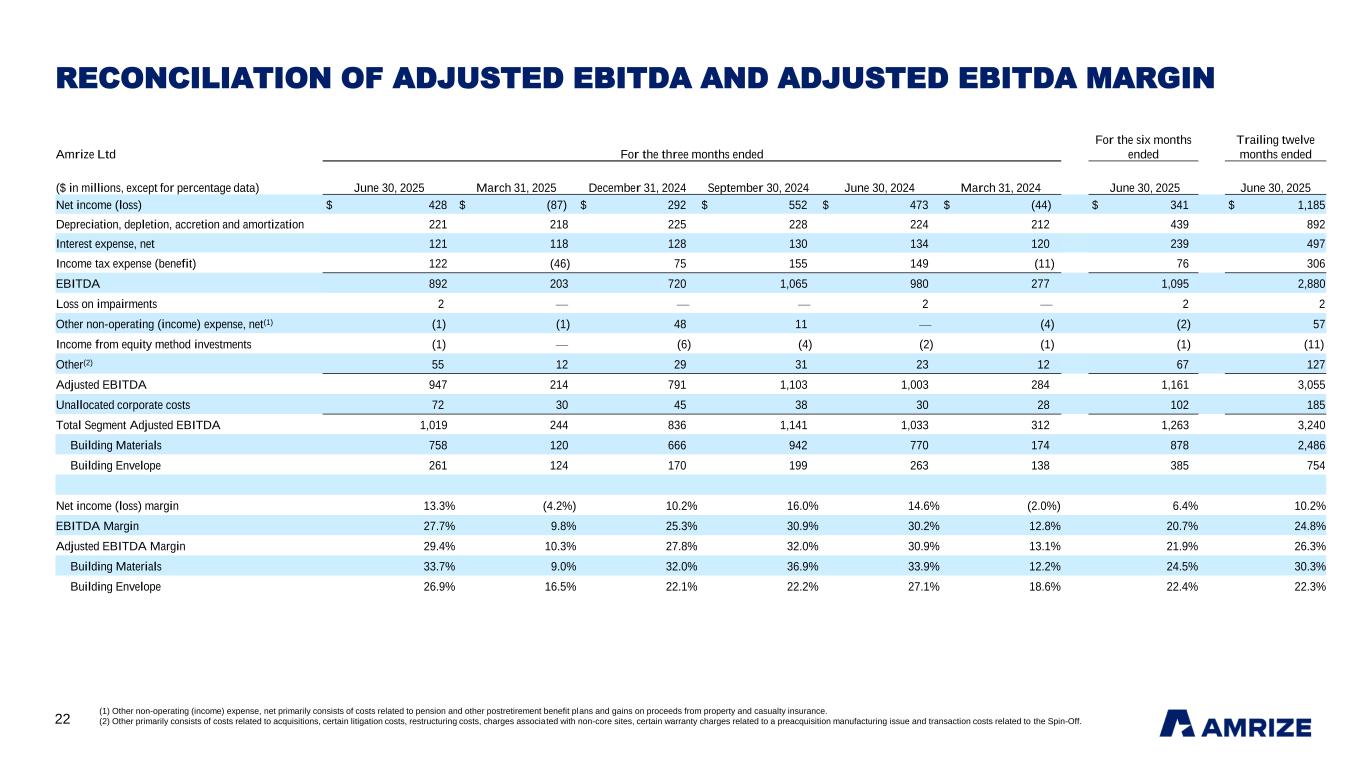
Media Release Ad hoc announcement pursuant to Art. 53 LR Media Relations: [email protected] Investor Relations: [email protected] +1 773-676-4981 7 +1 773-355-4404 CAUTIONARY NOTE REGARDING FORWARD-LOOKING STATEMENTS Certain statements in this presentation may be considered forward-looking statements within the meaning of the Private Securities Litigation Reform Act, such as statements regarding expected cost savings, future financial targets, business strategies, management’s views with respect to future events and financial performance, and the assumptions underlying such expected cost savings, targets, strategies, and statements. Forward-looking statements include those preceded by, followed by or that include the words “will,” “may,” “could,” “would,” “should,” “believes,” “expects,” “forecasts,” “anticipates,” “plans,” “estimates,” “targets,” “projects,” “intends” or similar expressions. Such forward-looking statements are subject to risks, uncertainties and other factors which could cause actual results to differ materially from historical experience or from future results expressed or implied by such forward-looking statements. Potential risks and uncertainties include, but are not limited to, the effect of political, economic and market conditions and geopolitical events; the logistical and other challenges inherent in our operations; the actions and initiatives of current and potential competitors; the level and volatility of, interest rates and other market indices; the ability of Amrize to maintain satisfactory credit ratings; the outcome of pending litigation; the impact of current, pending and future legislation and regulation; factors related to the failure of Amrize to achieve some or all of the expected strategic benefits or opportunities expected from the separation; that Amrize may incur material costs and expenses as a result of the separation; that Amrize has no history operating as an independent, publicly traded company; Amrize's obligation to indemnify Holcim pursuant to the agreements entered into connection with the separation and the risk Holcim may not fulfill any obligations to indemnify Amrize under such agreements; that under applicable tax law, Amrize may be liable for certain tax liabilities of Holcim following the separation if Holcim were to fail to pay such taxes; the fact that Amrize may receive worse commercial terms from third-parties for services it presently receives from Holcim; the fact that certain of Amrize's executive officers and directors may have actual or potential conflicts of interest because of their previous positions at Holcim; potential difficulties in maintaining relationships with key personnel; and that Amrize can not rely on the earnings, assets or cash flow of Holcim; Holcim will not provide funds to finance Amrize's working capital or other cash requirements and other factors which can be found in Amrize’s media releases and Amrize’s filings with the SEC. Any forward-looking statement speaks only as of the date on which it is made. We do not undertake or assume any obligation to update or revise any forward-looking statement, whether as a result of new information, future events, or otherwise. FINANCIAL MEASURES AND DEFINITIONS[1] Adjusted EBITDA is defined as Segment Adjusted EBITDA including unallocated corporate costs. Adjusted EBITDA Margin is defined as Adjusted EBITDA divided by Revenues. Segment Adjusted EBITDA is defined as Net income (loss), excluding unallocated corporate costs, Depreciation, depletion, accretion and amortization, Loss on impairments, Other non-operating income, net, Interest expense, net, Income tax expense, Income from equity method investments, and certain other items, such as costs related to acquisitions, certain litigation costs, restructuring costs, charges associated with non-core sites, certain warranty charges related to a pre-acquisition manufacturing issue and transaction costs related to the Spin-off. Segment Adjusted EBITDA Margin is defined as Segment Adjusted EBITDA divided by Revenues. Total Segment Adjusted EBITDA is defined as Segment Adjusted EBITDA excluding unallocated corporate costs. Net Leverage Ratio is defined as Net Debt divided by trailing 12 months Adjusted EBITDA. Net Debt is defined as the sum of Short-term borrowing, Long-term debt and Current portion of long-term debt minus Cash and cash equivalents. This media release contains certain financial measures of historical performance and financial positions that are not prepared in accordance with U.S. generally accepted accounting principles ("U.S. GAAP"). We refer to these measures as "non-GAAP" financial measures. Management believes that these non-GAAP financial measures are useful information to help describe the performance of Amrize. We believe these adjusted financial measures facilitate analysis and comparisons of our ongoing business operations because they exclude items that may not be indicative of, or are unrelated to, the company’s and our business segments’ core operating performance, and may assist investors with comparisons to prior periods and assessing trends in our underlying businesses. These adjustments are consistent with how management views our businesses. Management uses these non-GAAP financial measures in making financial, operating and planning decisions and evaluating Amrize’s and each business segment’s ongoing performance. Our non-GAAP financial measures are intended to supplement and should be read together with, and are not an alternative or substitute for, and should not be considered superior to, our reported financial results. Accordingly, users of our financial statements should not place undue reliance on these non- GAAP financial measures. Because non-GAAP financial measures are not standardized, it may not be possible to compare these financial measures with other companies’ non-GAAP financial measures having the same or similar names. As required by SEC rules, the tables on pages 14 and 15 below present a reconciliation of our presented non-GAAP financial measures to the most directly comparable GAAP measures.
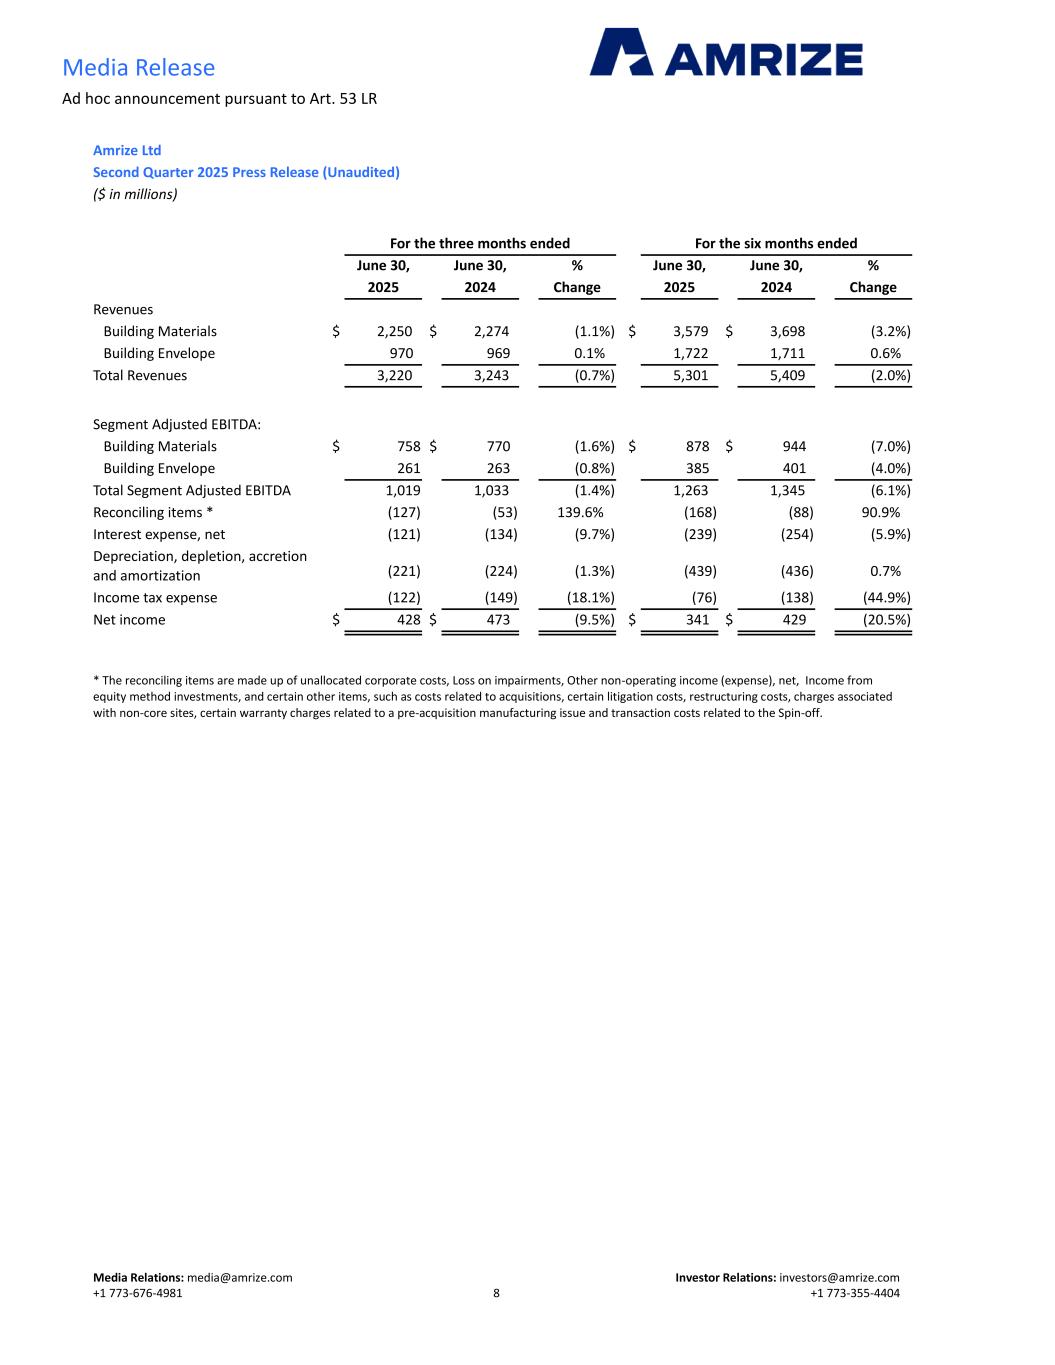
Media Release Ad hoc announcement pursuant to Art. 53 LR Media Relations: [email protected] Investor Relations: [email protected] +1 773-676-4981 8 +1 773-355-4404 Amrize Ltd Second Quarter 2025 Press Release (Unaudited) ($ in millions) For the three months ended For the six months ended June 30, June 30, % June 30, June 30, % 2025 2024 Change 2025 2024 Change Revenues Building Materials $ 2,250 $ 2,274 (1.1%) $ 3,579 $ 3,698 (3.2%) Building Envelope 970 969 0.1% 1,722 1,711 0.6% Total Revenues 3,220 3,243 (0.7%) 5,301 5,409 (2.0%) Segment Adjusted EBITDA: Building Materials $ 758 $ 770 (1.6%) $ 878 $ 944 (7.0%) Building Envelope 261 263 (0.8%) 385 401 (4.0%) Total Segment Adjusted EBITDA 1,019 1,033 (1.4%) 1,263 1,345 (6.1%) Reconciling items * (127) (53) 139.6% (168) (88) 90.9% Interest expense, net (121) (134) (9.7%) (239) (254) (5.9%) Depreciation, depletion, accretion and amortization (221) (224) (1.3%) (439) (436) 0.7% Income tax expense (122) (149) (18.1%) (76) (138) (44.9%) Net income $ 428 $ 473 (9.5%) $ 341 $ 429 (20.5%) * The reconciling items are made up of unallocated corporate costs, Loss on impairments, Other non-operating income (expense), net, Income from equity method investments, and certain other items, such as costs related to acquisitions, certain litigation costs, restructuring costs, charges associated with non-core sites, certain warranty charges related to a pre-acquisition manufacturing issue and transaction costs related to the Spin-off.
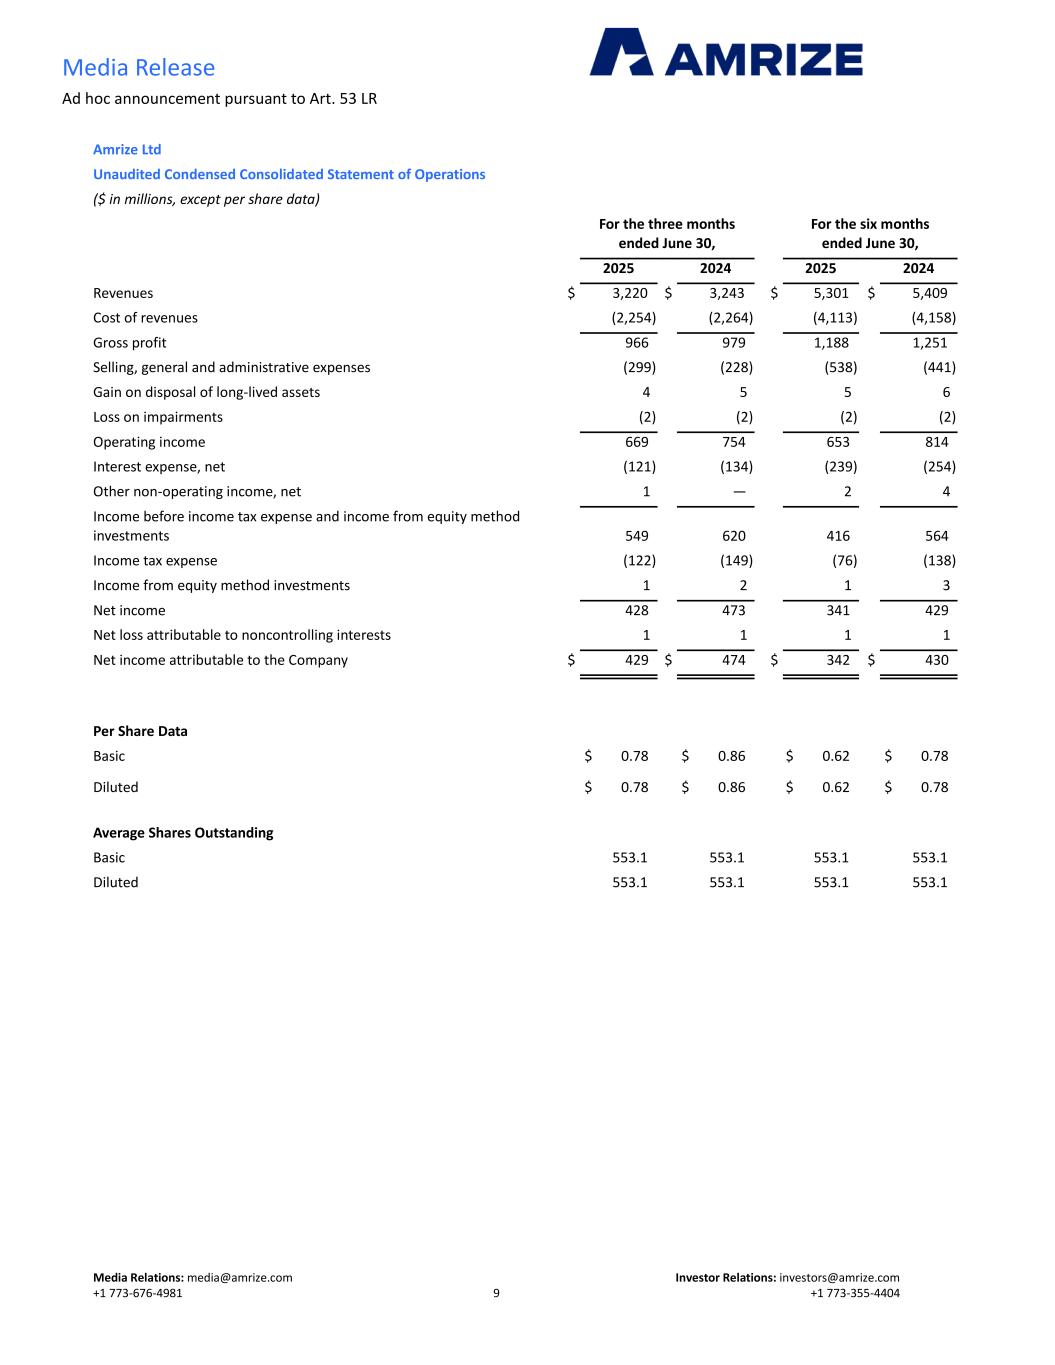
Media Release Ad hoc announcement pursuant to Art. 53 LR Media Relations: [email protected] Investor Relations: [email protected] +1 773-676-4981 9 +1 773-355-4404 Amrize Ltd Unaudited Condensed Consolidated Statement of Operations ($ in millions, except per share data) For the three months ended June 30, For the six months ended June 30, 2025 2024 2025 2024 Revenues $ 3,220 $ 3,243 $ 5,301 $ 5,409 Cost of revenues (2,254) (2,264) (4,113) (4,158) Gross profit 966 979 1,188 1,251 Selling, general and administrative expenses (299) (228) (538) (441) Gain on disposal of long-lived assets 4 5 5 6 Loss on impairments (2) (2) (2) (2) Operating income 669 754 653 814 Interest expense, net (121) (134) (239) (254) Other non-operating income, net 1 — 2 4 Income before income tax expense and income from equity method investments 549 620 416 564 Income tax expense (122) (149) (76) (138) Income from equity method investments 1 2 1 3 Net income 428 473 341 429 Net loss attributable to noncontrolling interests 1 1 1 1 Net income attributable to the Company $ 429 $ 474 $ 342 $ 430 Per Share Data Basic $ 0.78 $ 0.86 $ 0.62 $ 0.78 Diluted $ 0.78 $ 0.86 $ 0.62 $ 0.78 Average Shares Outstanding Basic 553.1 553.1 553.1 553.1 Diluted 553.1 553.1 553.1 553.1
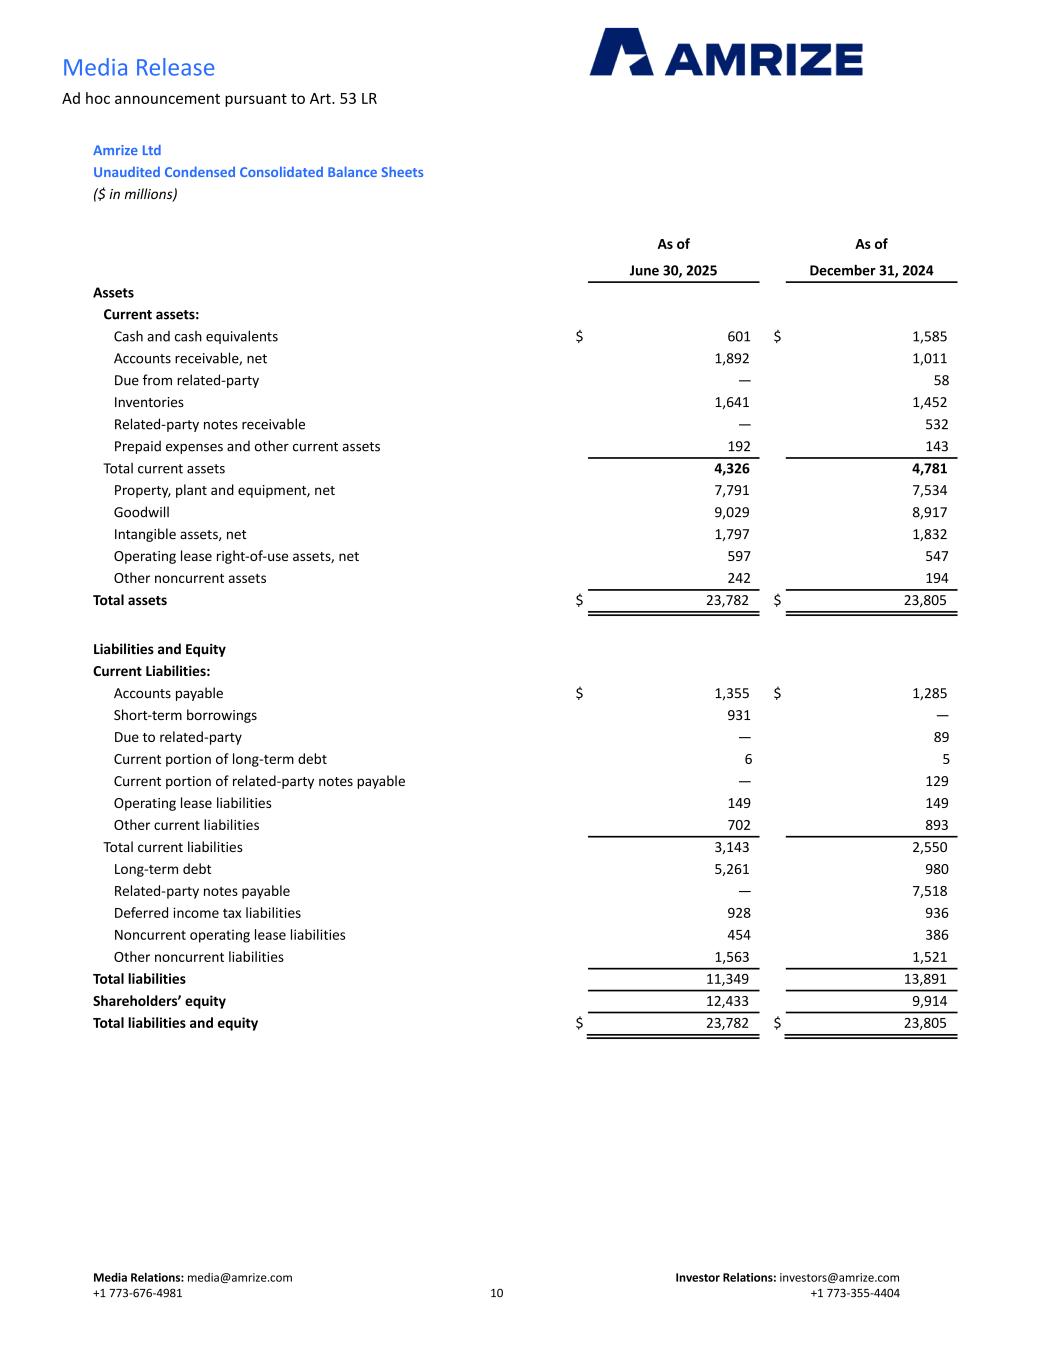
Media Release Ad hoc announcement pursuant to Art. 53 LR Media Relations: [email protected] Investor Relations: [email protected] +1 773-676-4981 10 +1 773-355-4404 Amrize Ltd Unaudited Condensed Consolidated Balance Sheets ($ in millions) As of As of June 30, 2025 December 31, 2024 Assets Current assets: Cash and cash equivalents $ 601 $ 1,585 Accounts receivable, net 1,892 1,011 Due from related-party — 58 Inventories 1,641 1,452 Related-party notes receivable — 532 Prepaid expenses and other current assets 192 143 Total current assets 4,326 4,781 Property, plant and equipment, net 7,791 7,534 Goodwill 9,029 8,917 Intangible assets, net 1,797 1,832 Operating lease right-of-use assets, net 597 547 Other noncurrent assets 242 194 Total assets $ 23,782 $ 23,805 Liabilities and Equity Current Liabilities: Accounts payable $ 1,355 $ 1,285 Short-term borrowings 931 — Due to related-party — 89 Current portion of long-term debt 6 5 Current portion of related-party notes payable — 129 Operating lease liabilities 149 149 Other current liabilities 702 893 Total current liabilities 3,143 2,550 Long-term debt 5,261 980 Related-party notes payable — 7,518 Deferred income tax liabilities 928 936 Noncurrent operating lease liabilities 454 386 Other noncurrent liabilities 1,563 1,521 Total liabilities 11,349 13,891 Shareholders’ equity 12,433 9,914 Total liabilities and equity $ 23,782 $ 23,805
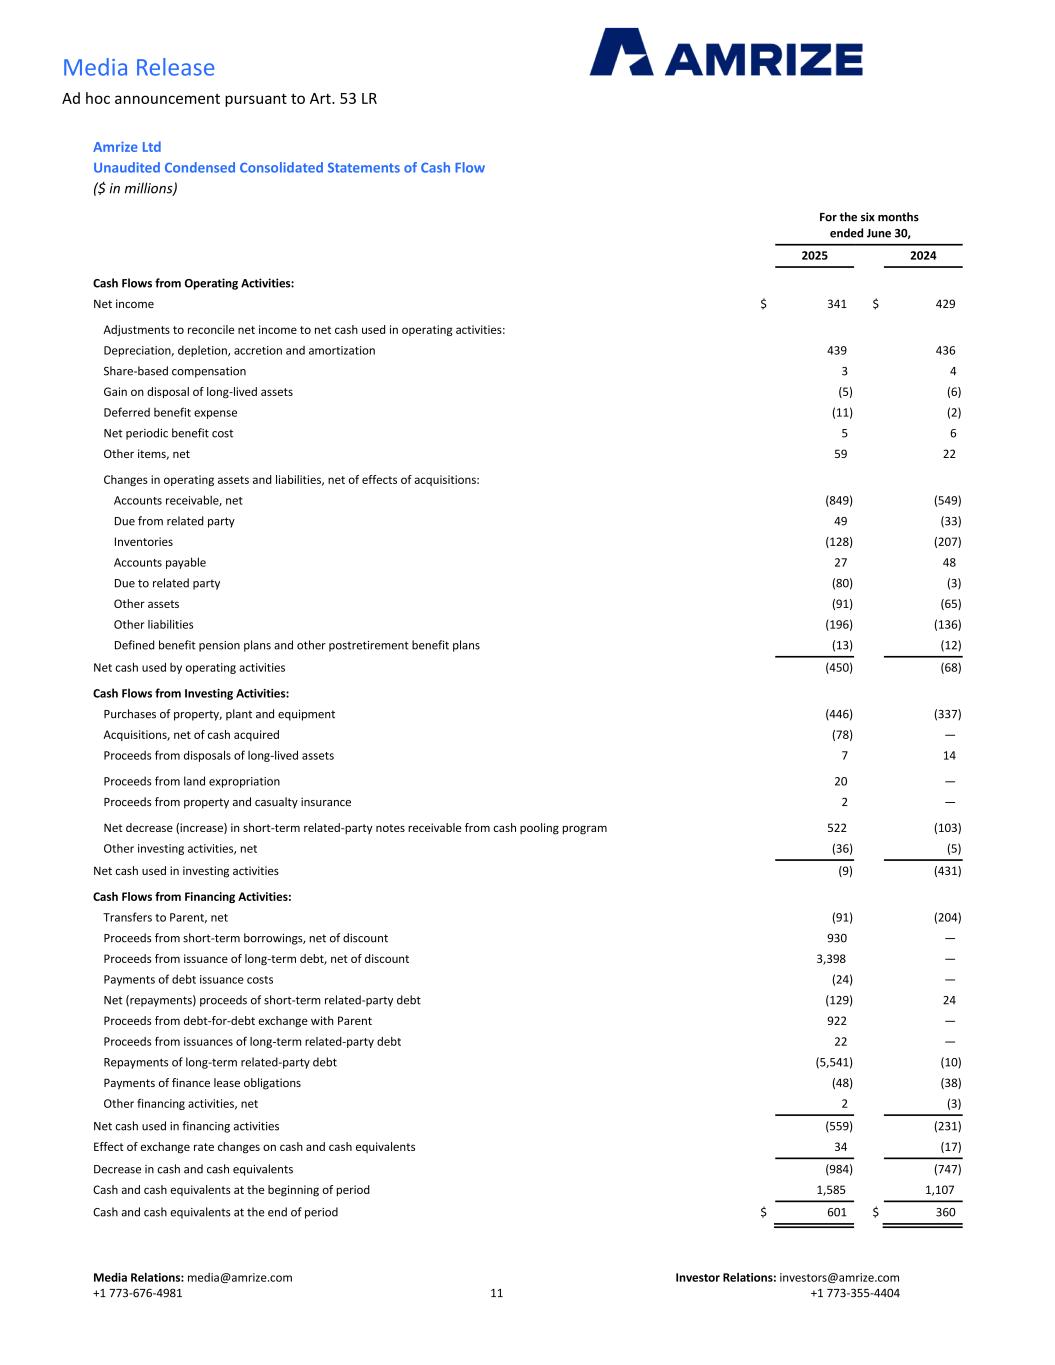
Media Release Ad hoc announcement pursuant to Art. 53 LR Media Relations: [email protected] Investor Relations: [email protected] +1 773-676-4981 11 +1 773-355-4404 Amrize Ltd Unaudited Condensed Consolidated Statements of Cash Flow ($ in millions) For the six months ended June 30, 2025 2024 Cash Flows from Operating Activities: Net income $ 341 $ 429 Adjustments to reconcile net income to net cash used in operating activities: Depreciation, depletion, accretion and amortization 439 436 Share-based compensation 3 4 Gain on disposal of long-lived assets (5) (6) Deferred benefit expense (11) (2) Net periodic benefit cost 5 6 Other items, net 59 22 Changes in operating assets and liabilities, net of effects of acquisitions: Accounts receivable, net (849) (549) Due from related party 49 (33) Inventories (128) (207) Accounts payable 27 48 Due to related party (80) (3) Other assets (91) (65) Other liabilities (196) (136) Defined benefit pension plans and other postretirement benefit plans (13) (12) Net cash used by operating activities (450) (68) Cash Flows from Investing Activities: Purchases of property, plant and equipment (446) (337) Acquisitions, net of cash acquired (78) — Proceeds from disposals of long-lived assets 7 14 Proceeds from land expropriation 20 — Proceeds from property and casualty insurance 2 — Net decrease (increase) in short-term related-party notes receivable from cash pooling program 522 (103) Other investing activities, net (36) (5) Net cash used in investing activities (9) (431) Cash Flows from Financing Activities: Transfers to Parent, net (91) (204) Proceeds from short-term borrowings, net of discount 930 — Proceeds from issuance of long-term debt, net of discount 3,398 — Payments of debt issuance costs (24) — Net (repayments) proceeds of short-term related-party debt (129) 24 Proceeds from debt-for-debt exchange with Parent 922 — Proceeds from issuances of long-term related-party debt 22 — Repayments of long-term related-party debt (5,541) (10) Payments of finance lease obligations (48) (38) Other financing activities, net 2 (3) Net cash used in financing activities (559) (231) Effect of exchange rate changes on cash and cash equivalents 34 (17) Decrease in cash and cash equivalents (984) (747) Cash and cash equivalents at the beginning of period 1,585 1,107 Cash and cash equivalents at the end of period $ 601 $ 360
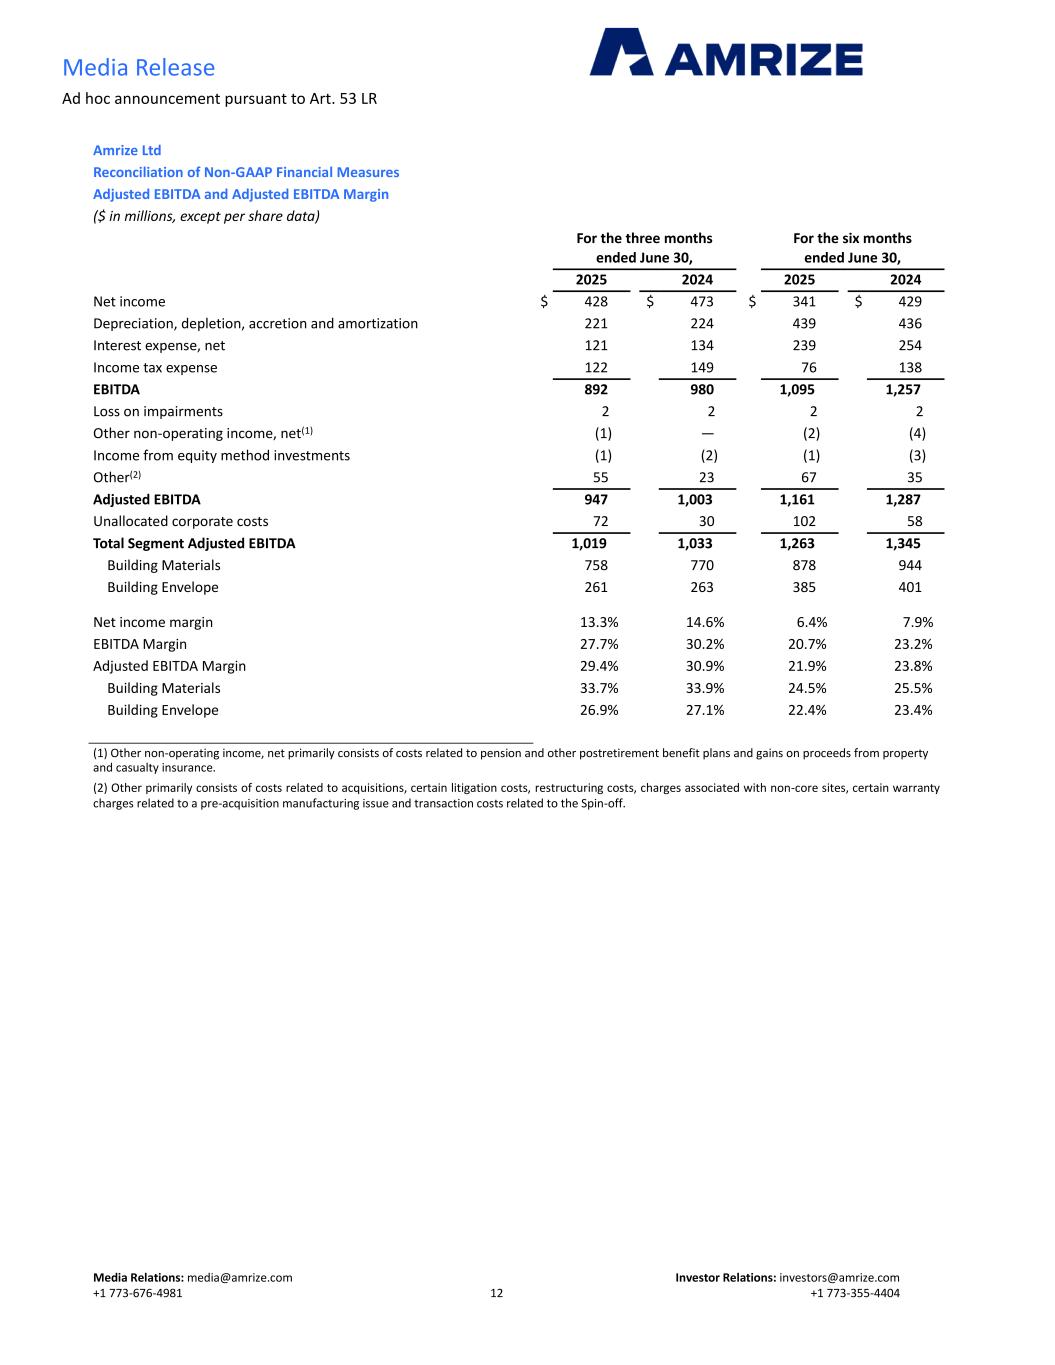
Media Release Ad hoc announcement pursuant to Art. 53 LR Media Relations: [email protected] Investor Relations: [email protected] +1 773-676-4981 12 +1 773-355-4404 Amrize Ltd Reconciliation of Non-GAAP Financial Measures Adjusted EBITDA and Adjusted EBITDA Margin ($ in millions, except per share data) For the three months ended June 30, For the six months ended June 30, 2025 2024 2025 2024 Net income $ 428 $ 473 $ 341 $ 429 Depreciation, depletion, accretion and amortization 221 224 439 436 Interest expense, net 121 134 239 254 Income tax expense 122 149 76 138 EBITDA 892 980 1,095 1,257 Loss on impairments 2 2 2 2 Other non-operating income, net(1) (1) — (2) (4) Income from equity method investments (1) (2) (1) (3) Other(2) 55 23 67 35 Adjusted EBITDA 947 1,003 1,161 1,287 Unallocated corporate costs 72 30 102 58 Total Segment Adjusted EBITDA 1,019 1,033 1,263 1,345 Building Materials 758 770 878 944 Building Envelope 261 263 385 401 Net income margin 13.3% 14.6% 6.4% 7.9% EBITDA Margin 27.7% 30.2% 20.7% 23.2% Adjusted EBITDA Margin 29.4% 30.9% 21.9% 23.8% Building Materials 33.7% 33.9% 24.5% 25.5% Building Envelope 26.9% 27.1% 22.4% 23.4% (1) Other non-operating income, net primarily consists of costs related to pension and other postretirement benefit plans and gains on proceeds from property and casualty insurance. (2) Other primarily consists of costs related to acquisitions, certain litigation costs, restructuring costs, charges associated with non-core sites, certain warranty charges related to a pre-acquisition manufacturing issue and transaction costs related to the Spin-off.
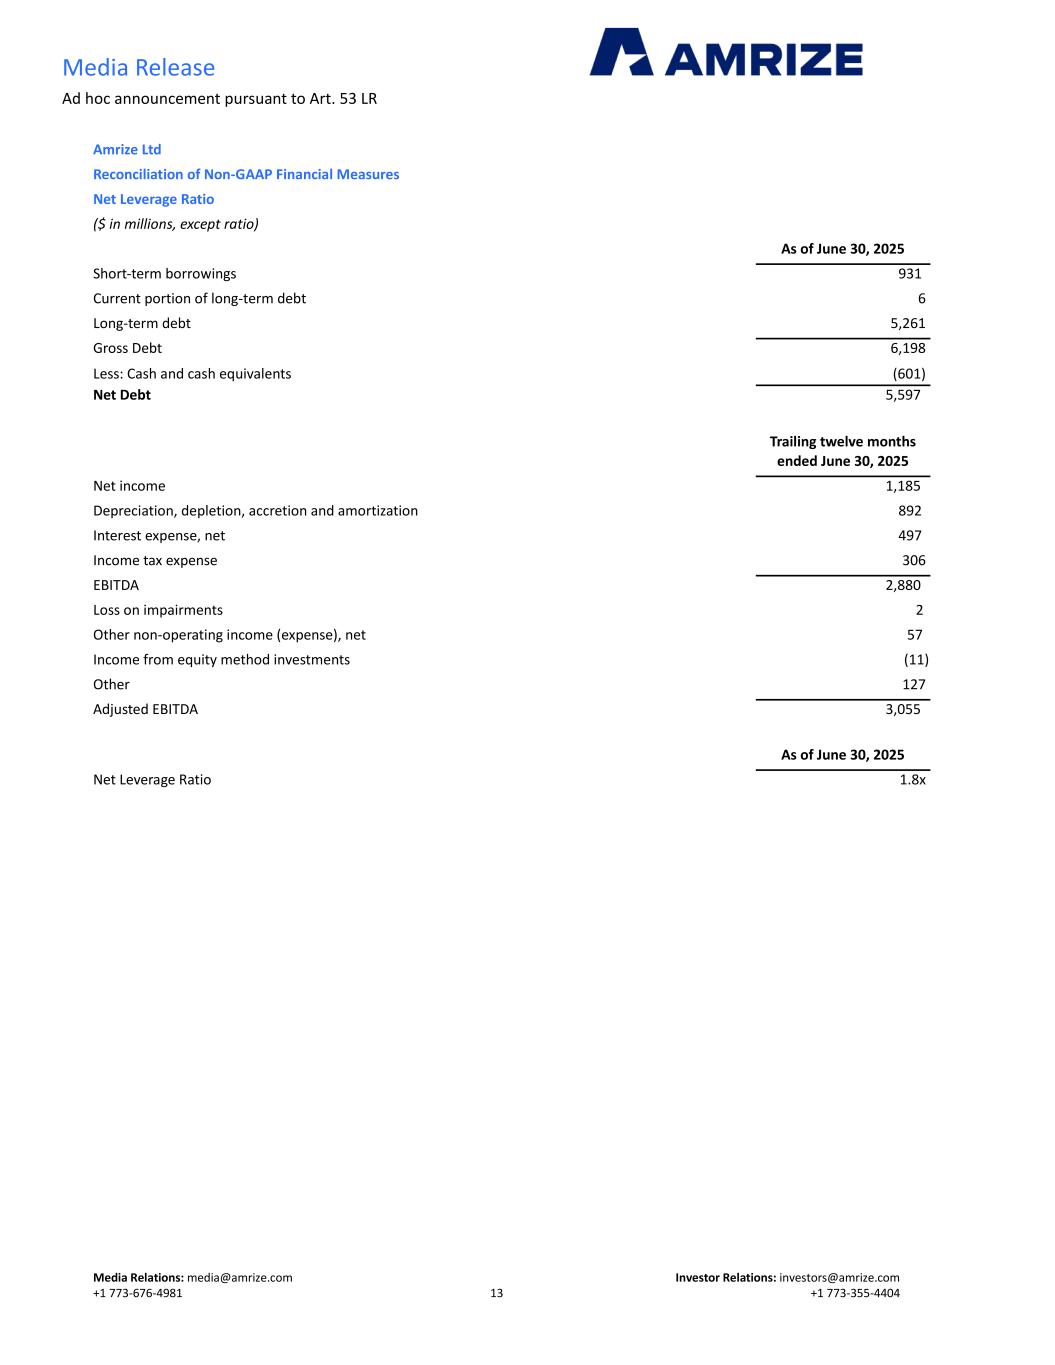
Media Release Ad hoc announcement pursuant to Art. 53 LR Media Relations: [email protected] Investor Relations: [email protected] +1 773-676-4981 13 +1 773-355-4404 Amrize Ltd Reconciliation of Non-GAAP Financial Measures Net Leverage Ratio ($ in millions, except ratio) As of June 30, 2025 Short-term borrowings 931 Current portion of long-term debt 6 Long-term debt 5,261 Gross Debt 6,198 Less: Cash and cash equivalents (601) Net Debt 5,597 Trailing twelve months ended June 30, 2025 Net income 1,185 Depreciation, depletion, accretion and amortization 892 Interest expense, net 497 Income tax expense 306 EBITDA 2,880 Loss on impairments 2 Other non-operating income (expense), net 57 Income from equity method investments (11) Other 127 Adjusted EBITDA 3,055 As of June 30, 2025 Net Leverage Ratio 1.8x