CONTACTS: | ||||||||
Investors | ||||||||
| Laura Rossi | ||||||||
(305) 460-8728 | ||||||||
| Media | ||||||||
| Silvia M. Larrieu | ||||||||
(305) 441-8414 | ||||||||
AMERANT REPORTS SECOND QUARTER 2021 NET INCOME OF $16.0 MILLION, DILUTED EARNINGS PER SHARE OF $0.42
Results include key actions taken to improve ongoing profitability
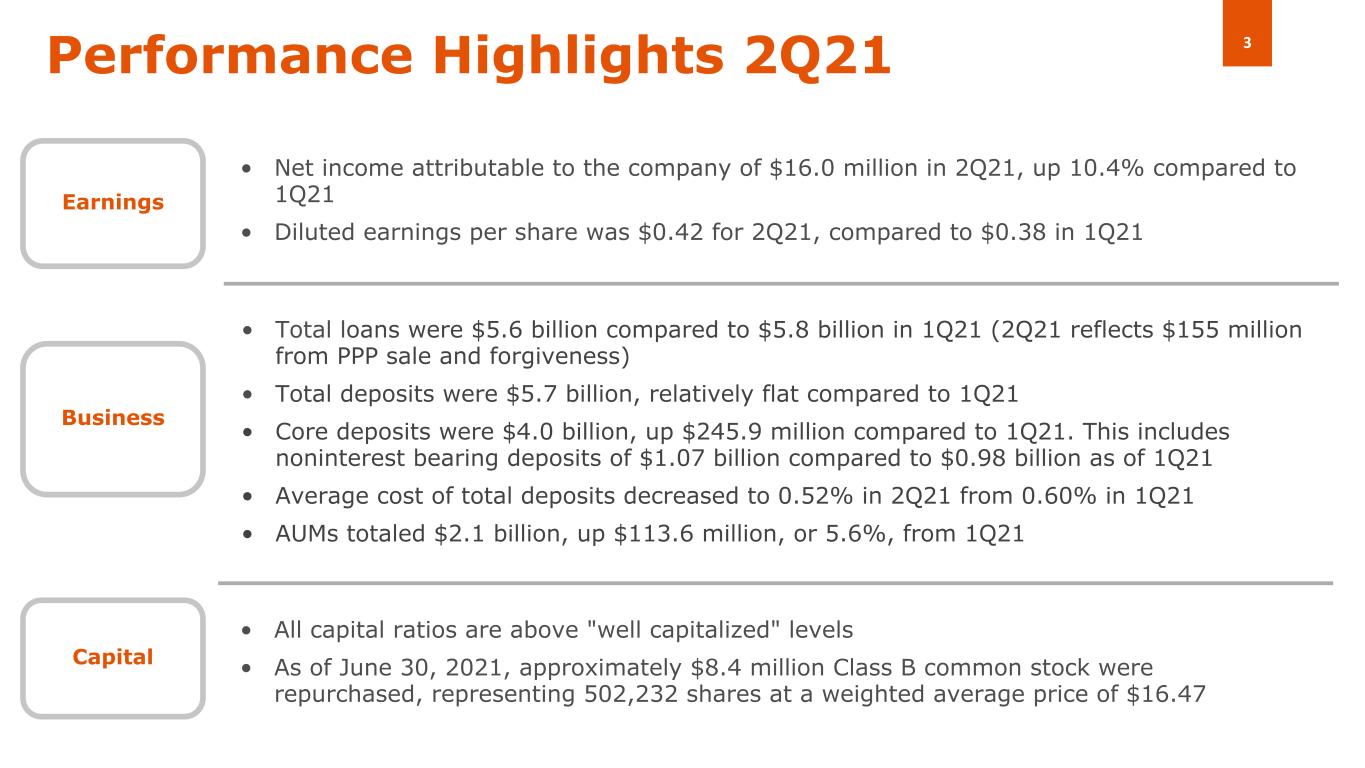
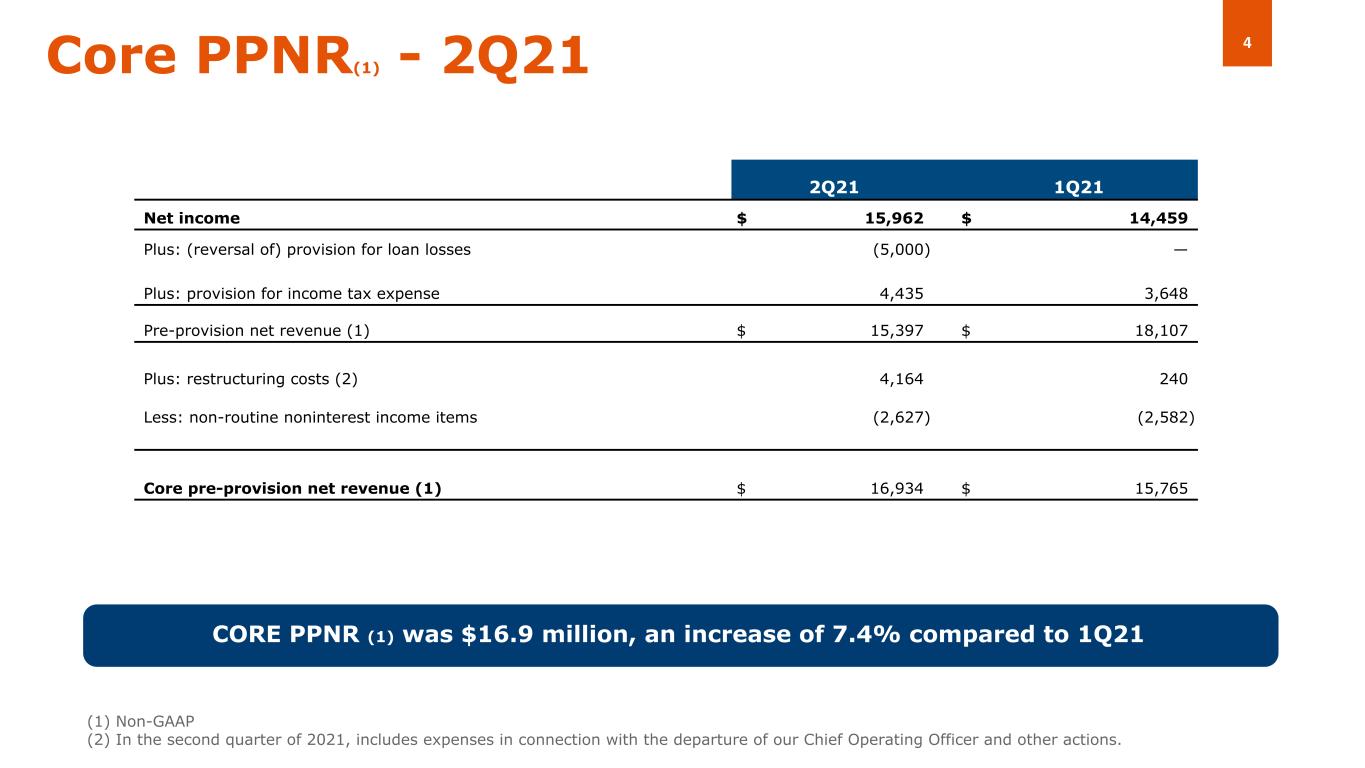
CORAL GABLES, FLORIDA, July 21, 2021. Amerant Bancorp Inc. (NASDAQ: AMTB and AMTBB) (the “Company” or “Amerant”) today reported net income attributable to the Company of $16.0 million in the second quarter of 2021, or $0.42 per diluted share, compared to net income attributable to the Company of $14.5 million, or $0.38 per diluted share, in the first quarter of 2021 and net loss attributable to the Company of $15.3 million, or $0.37 per diluted share, in the second quarter of 2020. Pre-provision net revenue (“PPNR”) (non-GAAP) was $15.4 million in the second quarter of 2021, a decrease from $18.1 million in the first quarter of 2021, and a decrease from $29.3 million in the second quarter of 2020. Core pre-provision net revenue (“Core PPNR”) (non-GAAP) was $16.9 million in the second quarter of 2021, an increase from $15.8 million in the first quarter of 2021, and a decrease from $23.0 million in the second quarter of 2020. Second quarter of 2020 included $7.8 million in deferred expenses directly related to the origination of PPP loans.
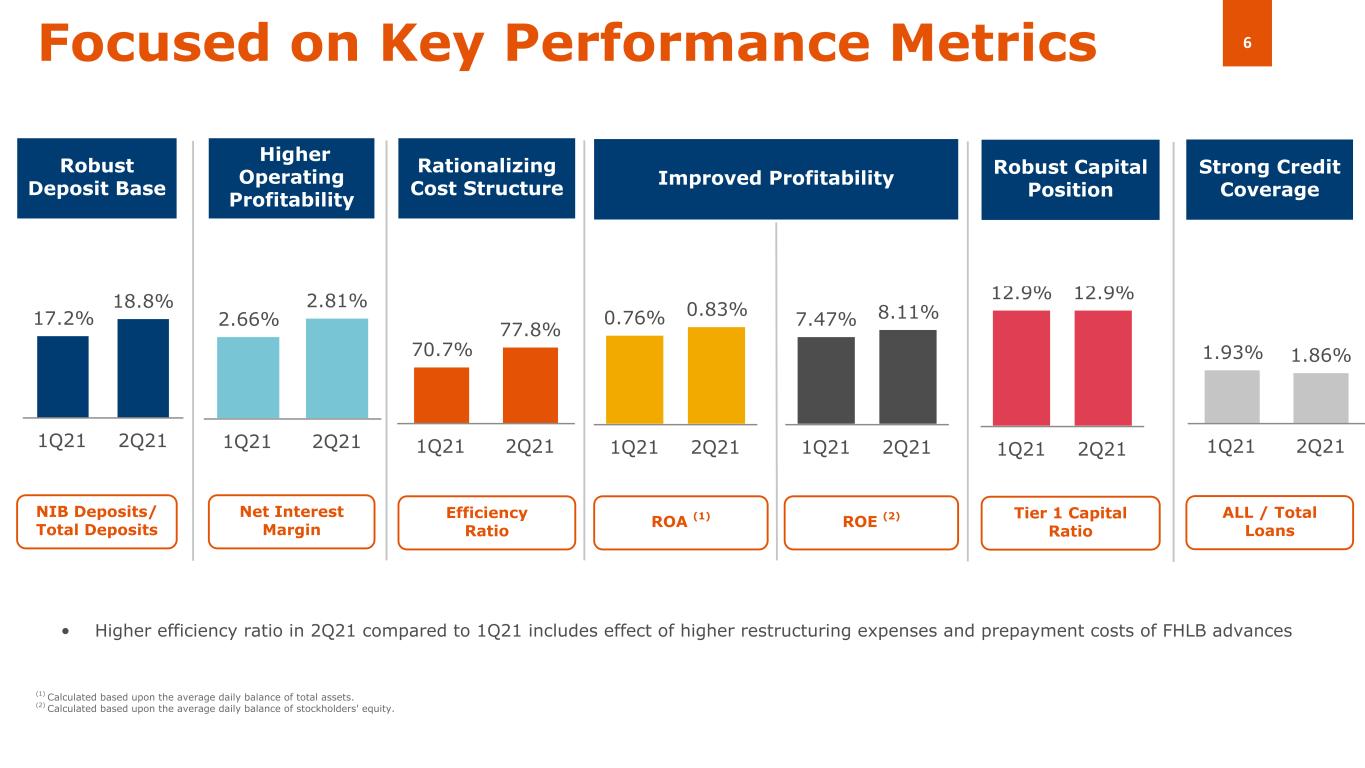
Annualized return on assets (“ROA”) and return on equity (“ROE”) were 0.83% and 8.11%, respectively, in the second quarter of 2021, compared to 0.76% and 7.47%, respectively, in the first quarter of 2021. Second quarter of 2020 ROA and ROE were negative 0.75% and 7.21%, respectively.
Jerry Plush, vice chairman and CEO said, “We are pleased to report improved results this quarter, even while taking a number of important actions to lower future funding costs and operating expenses. We are excited about the fintech partnerships we recently announced, as well as our new marketing agency partner. We believe these partnerships will help us drive greater brand recognition and profitable growth, leading to further improvement in operating results in the coming quarters.”
1
Summary Results
Results of the second quarter ended June 30, 2021 were as follows:
•Net income was $16.0 million in the second quarter of 2021, up 10.4% from $14.5 million in the first quarter of 2021. In the second quarter of 2020 there was a net loss of $15.3 million. Core net income (non-GAAP) was $17.2 million in the second quarter of 2021 compared to core net income of $12.6 million in the first quarter of 2021 and core net loss (non-GAAP) of $20.3 million in the second quarter of 2020.
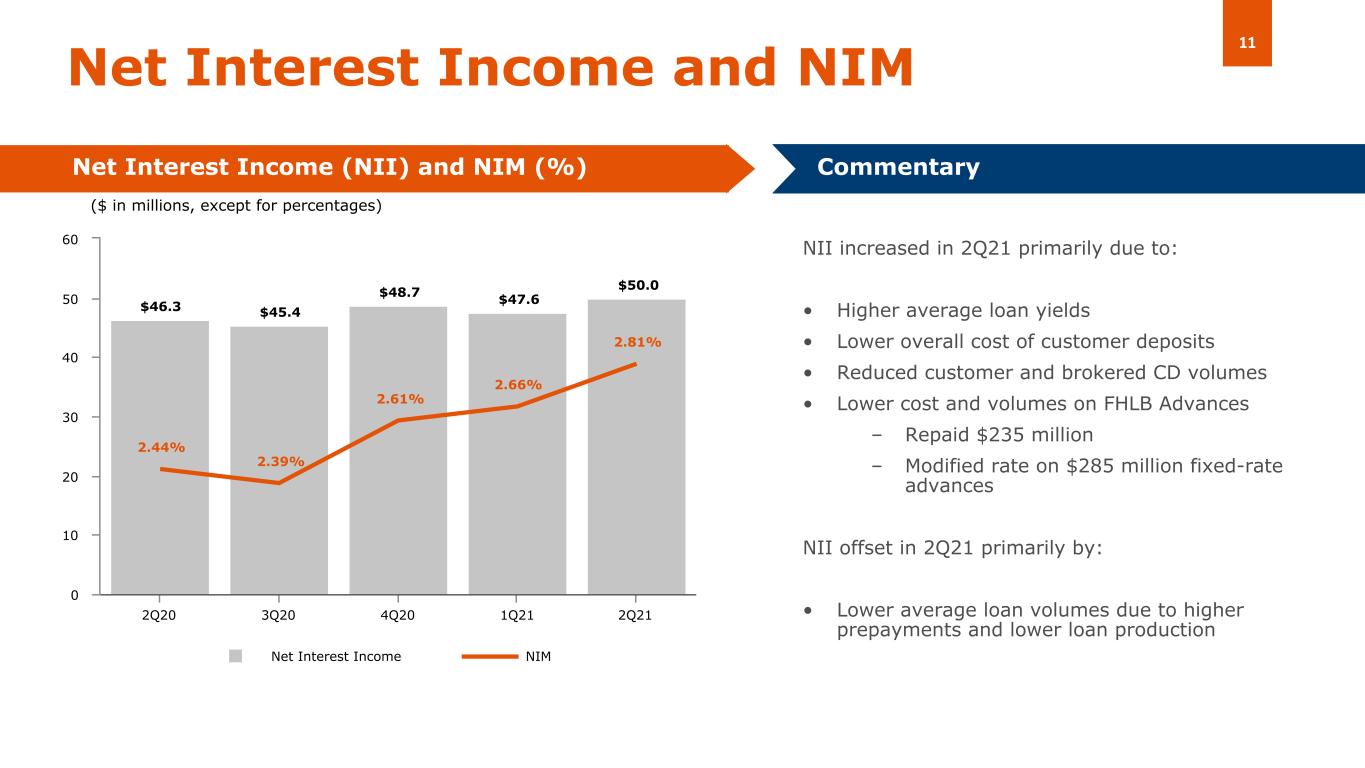
•Net Interest Income (“NII”) was $50.0 million, up 5.1% from $47.6 million in the first quarter of 2021, and up 7.9% from $46.3 million in the second quarter of 2020. Net interest margin (“NIM”) was 2.81% in the second quarter of 2021, up 15 basis points from 2.66% in the first quarter of 2021 and up 37 basis points from 2.44% in the second quarter of 2020.
•A release of $5.0 million from the allowance for loan losses was recorded during the second quarter of 2021, compared to a $48.6 million provision recorded in the second quarter of 2020. No provision for loan losses was recorded during the first quarter of 2021. The ratio of allowance for loan losses (“ALL”) to total loans was 1.86% as of June 30, 2021, down from 1.93% as of March 31, 2021 and down from 2.04% as of June 30, 2020. The ratio of net charge-offs to average total loans in the second quarter of 2021 was 0.12% compared to 0.13% in the second quarter of 2020. There were no net charge offs recorded in the first quarter of 2021.
•Noninterest income was $15.7 million in the second quarter of 2021, up 11.1% from $14.2 million in the first quarter of 2021, and down 20.4% from $19.8 million in the second quarter of 2020, as second quarter of 2020 included higher net gains on sale of securities.
•Noninterest expense was $51.1 million, up 17.2% from $43.6 million in the first quarter of 2021, and up 39.2% from $36.7 million in the second quarter of 2020, as second quarter of 2021 included higher nonrecurring charges.
•The efficiency ratio was 77.8% in the second quarter of 2021, compared to 70.7% in the first quarter of 2021, and 55.6% for the second quarter of 2020. Core efficiency ratio (non-GAAP) was 74.45% in the second quarter of 2021, compared to 73.35% in the first quarter of 2021, and 60.65% for the second quarter of 2020.
•Total loans were $5.6 billion at June 30, 2021, down $146.3 million, or 2.5%, compared to March 31, 2021. Total deposits were $5.7 billion at June 30, 2021, slightly down $3.2 million, or 0.1%, compared to March 31, 2021.
•Stockholders’ book value per common share attributable to the Company increased to $21.27 at June 30, 2021, compared to $20.70 at March 31, 2021. Tangible book value per common share (“TBV”) (non-GAAP) increased to $20.69 as of June 30, 2021, compared to $20.13 at March 31, 2021.
2
Credit Quality
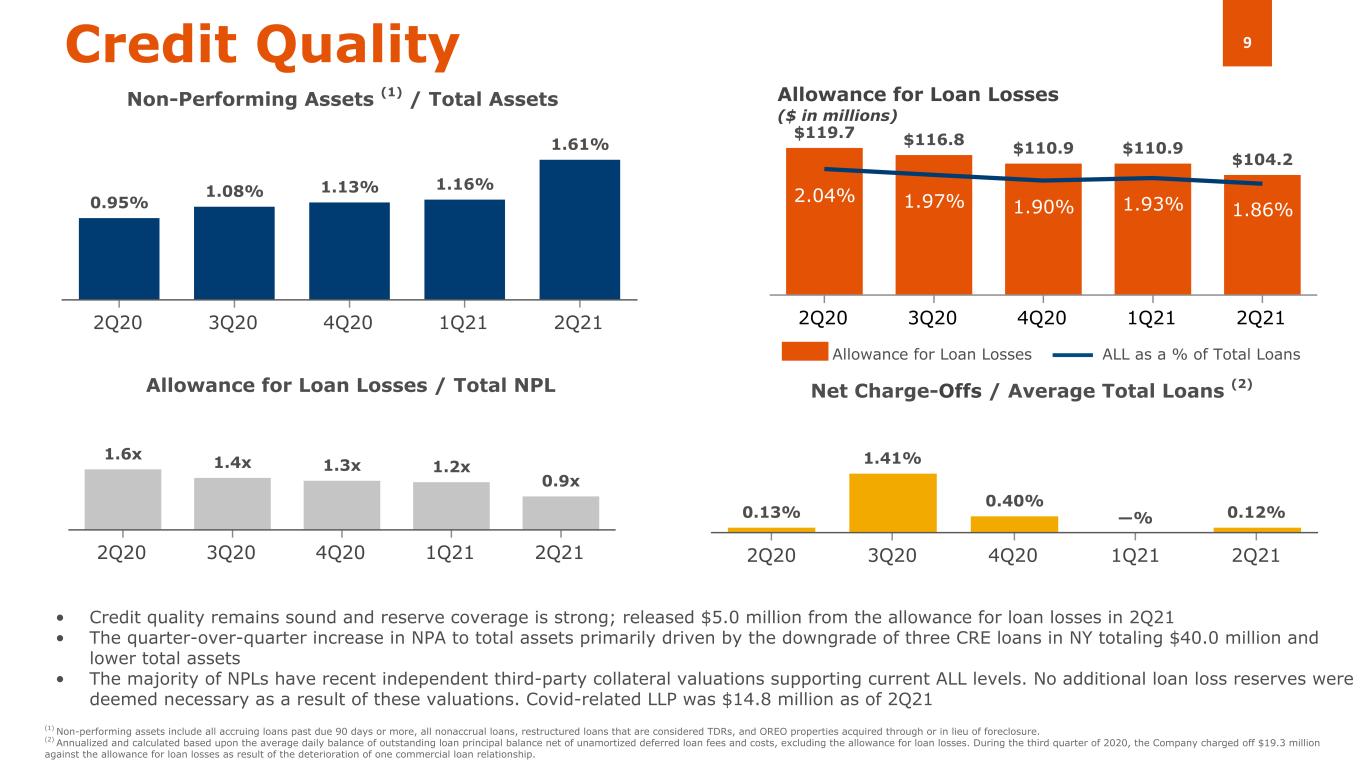
The ALL was $104.2 million as of the close of the second quarter of 2021, compared to $110.9 million at the close of the first quarter of 2021 and $119.7 million at the close of the second quarter of 2020. The Company released $5.0 million from the allowance for loan losses in the second quarter of 2021, compared to a $48.6 million provision for loan losses in the second quarter of 2020. No provision for loan losses was recorded during the first quarter of 2021. The reserve release during the second quarter of 2021 was primarily attributed to the improving macro-economic conditions and credit outlook, as the Florida and Texas economies continue to recover from the pandemic. The decrease in loan portfolio outstanding balance when compared to the first quarter of 2021, also contributed to lower reserve requirements. Offsetting the release were loan downgrades and additional reserves allocated in connection with the COVID-19 pandemic, primarily due to slower economic recovery of the New York market. The ALL associated with the pandemic was $14.8 million in the second quarter, compared to $10.5 million in the first quarter of 2021, and $32.9 million in the second quarter of 2020 at the onset of the pandemic.
Classified loans totaled $122.6 million at the end of the second quarter of 2021 compared to $91.3 million and $87.6 million in the first quarter of 2021 and second quarter of 2020, respectively. These loans increased $31.3 million, or 34.3%, compared to the first quarter of 2021 and $35.1 million, or 40.1%, compared to the second quarter of 2020. The quarter-over-quarter increases were primarily driven by the downgrade of three Commercial Real Estate (“CRE”) loans totaling $40.0 million, primarily in New York due to increased vacancies, and one commercial loan totaling $2.7 million. These increases were partially offset by upgrades of three loans totaling $6.2 million, the charge-off of two loans totaling $1.4 million and loan pay downs and payoffs during the second quarter of 2021. The year-over-year increase was primarily due to the loans mentioned above, as well as, specific loan downgrades disclosed in previous quarters. These loans include downgrades of a $12.7 million loan to a food wholesaler with exposure to the cruise industry, and two CRE multifamily loans totaling $9.9 million. Classified loans include the $39.8 million Coffee Trader loan relationship, out of which $19.3 million were charged-off and $0.9 million was offset as partial payment during the third quarter of 2020, with an outstanding balance of $19.6 million as of the second quarter of 2021
Special mention loans as of June 30, 2021 totaled $92.5 million, a decrease of $17.1 million, or 15.6%, from $109.6 million as of March 31, 2021. This decrease was primarily due to the downgrade to substandard of a $12.1 million CRE loan and a $2.7 million commercial loan, as well as the upgrade to pass of a $1.4 million owner occupied loan; partially offset by the downgrade to special mention of a $2.6 million CRE loan. Special mention loans as of June 30, 2021 increased $69.6 million, or 304.3%, compared to the second quarter of 2020, due to downgrades disclosed in previous quarters, primarily a $28.2 million CRE retail loan, two commercial loans totaling $36.5 million and two owner occupied loans totaling $14.6 million; and partially offset primarily by the payoff of a $7.2 million construction loan. All special mention loans remain current.
Non-performing assets totaled $121.5 million at the end of the second quarter of 2021, an increase of $31.6 million or 35.1%, compared to the first quarter of 2021, and $44.2 million, or 57.2%, compared to the second quarter of 2020 due to the increase in classified loans described above. The ratio of non-performing assets to total assets was 161 basis points, up 45 basis points from the first quarter of 2021 and up 66 basis points from the second quarter of 2020. In
3
the second quarter of 2021, the ratio of ALL to non-performing loans decreased to 86.0%, from 123.9% at March 31, 2021 and 154.9% at the close of the second quarter of 2020. During the second quarter of 2021 the Company obtained independent third-party collateral valuations on the majority of non-performing loans supporting current ALL levels. No additional loan loss reserves were deemed necessary as a result of these valuations.
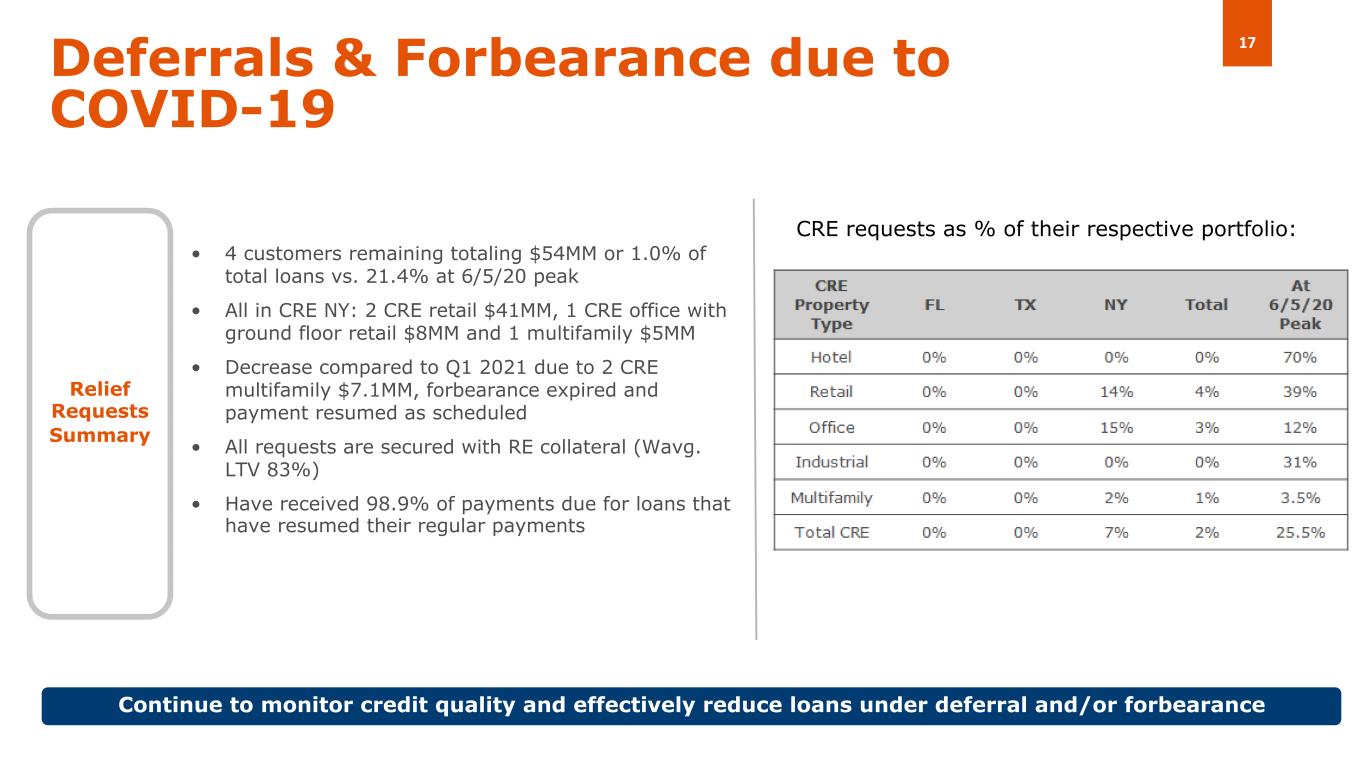
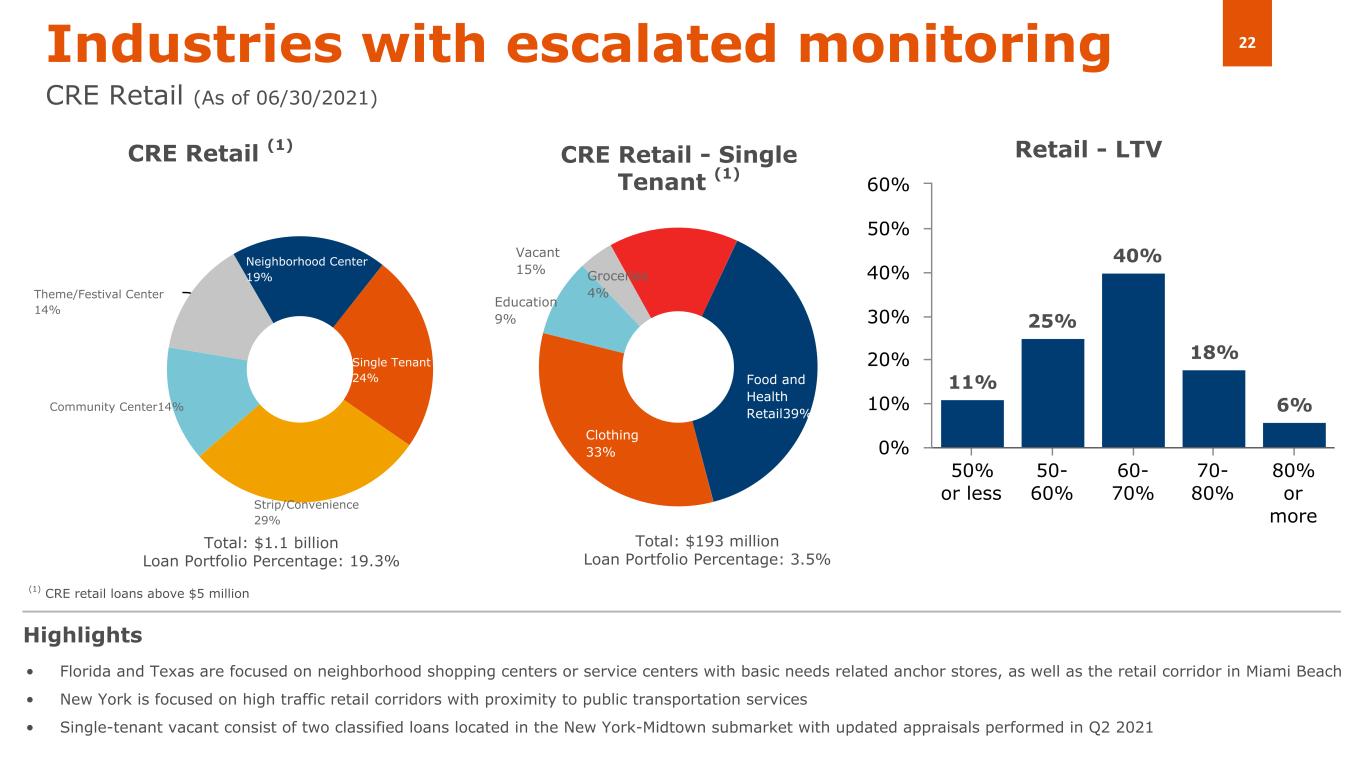
As of June 30, 2021, $54.4 million, or 1.0% of total loans, were still under applicable deferral and/or forbearance periods, a decrease from $61.5 million, or 1.1% of total loans, at the end of first quarter 2021, and significantly down from $1.1 billion, or 19.3% of total loans, at the beginning of the loan loss mitigation programs established in April 2020 in response to the pandemic. The quarter-over-quarter decrease was primarily due to $7.1 million in CRE loans that resumed regular payments after deferral and/or forbearance periods ended.
Additionally, 100% of the loans under deferral and/or forbearance are secured by real estate collateral with average Loan to Value (“LTV”) of 83% as of June 30, 2021, based on recent appraisal valuations. All loans that have moved out of forbearance status have resumed regular payments. The Company continues to closely monitor the performance of the remaining loans in deferral and/or forbearance periods under the terms of the temporary relief granted.
Loans and Deposits
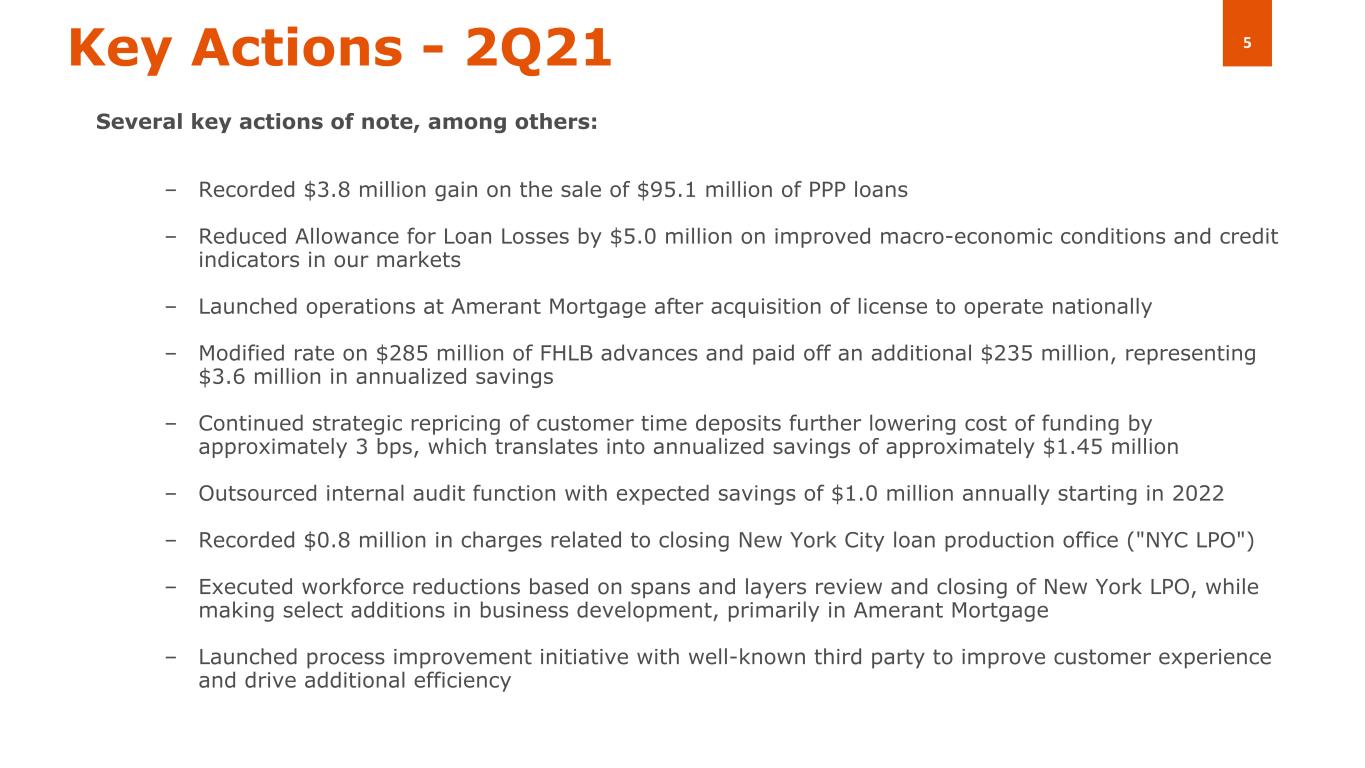
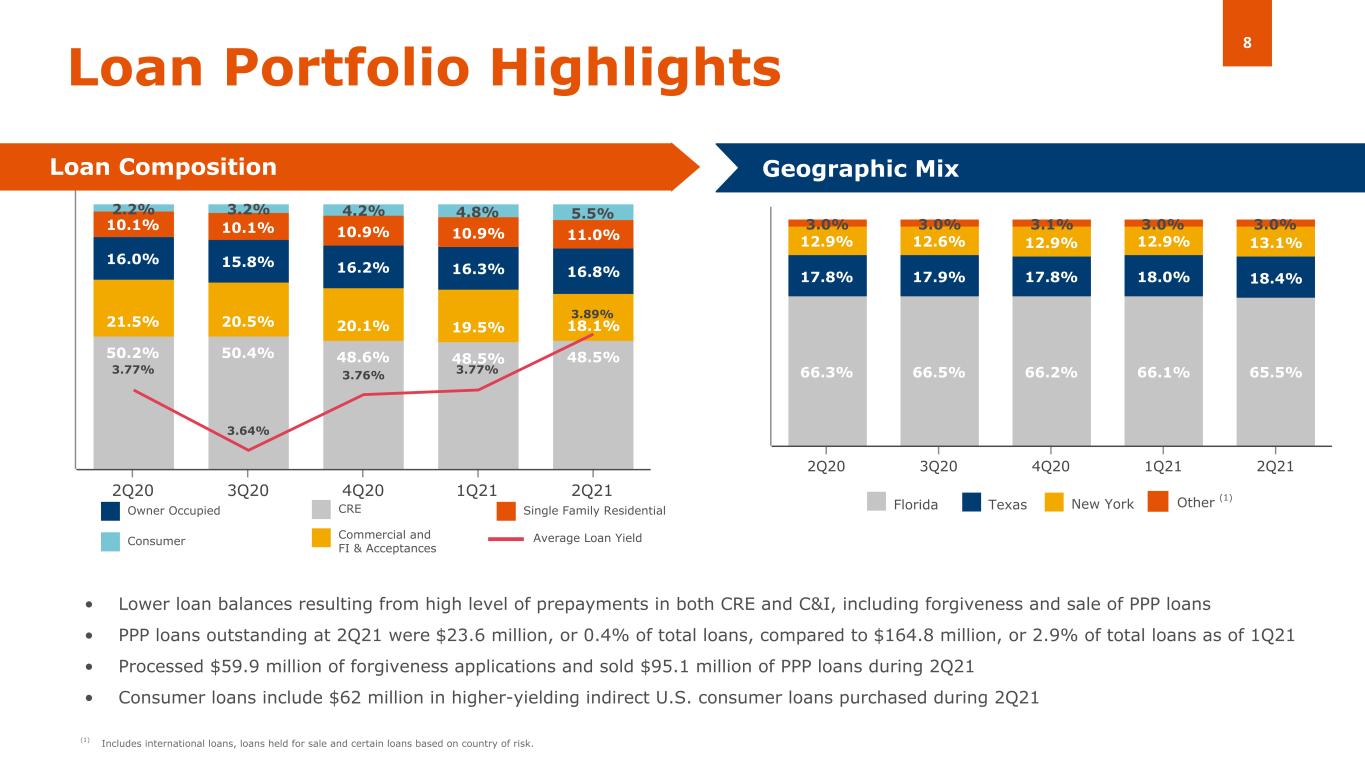
Total loans as of June 30, 2021 were $5.6 billion, down $146.3 million, or 2.5%, compared to March 31, 2021. This decrease was primarily due to loan production being offset by (i) approximately $260 million in prepayments received in both CRE and C&I loans, (ii) the sale of $95.1 million in PPP loans in May of 2021; and (iii) $59.9 million in PPP loan forgiveness processed, while loan demand slowly recovers and pricing competition has intensified. During the second quarter of 2021, Amerant continued purchasing higher yielding consumer loans, as planned. Consumer loans, which include $62 million of higher-yielding indirect consumer lending, increased $32.0 million, or 11.5%, quarter over quarter.
As of June 30, 2021, total PPP loans outstanding were $23.6 million, or 0.4% of total loans, compared to $164.8 million, or 2.9% of total loans as of March 31, 2021. The Company estimates as of June 30, 2021, there were $131.4 million of deposits related to PPP loans compared to $173.2 million as of March 31, 2021.
During May 2021, Amerant Mortgage started taking loan applications, and, as previously announced, acquired an Idaho-based operation which allows it to operate its mortgage business nationally with direct access to important federal housing agencies.
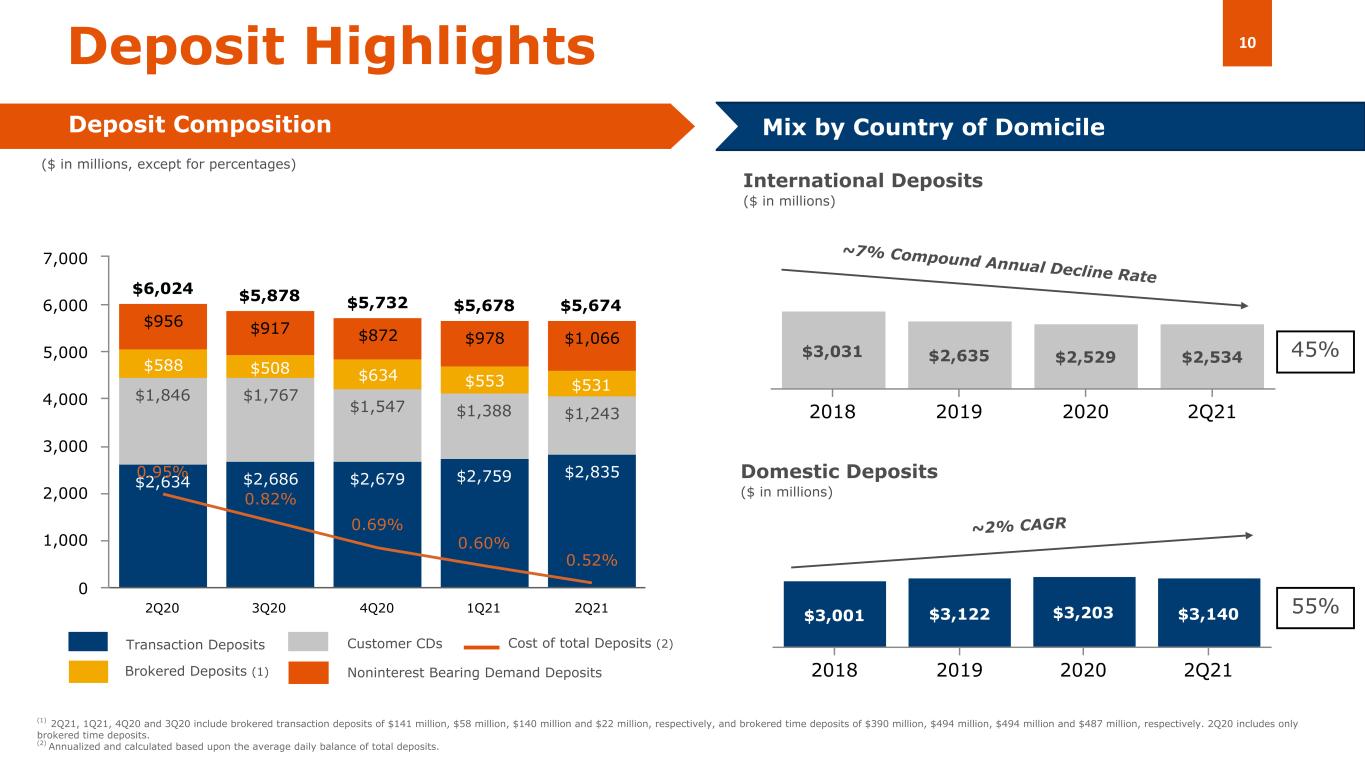
Core deposits as of June 30, 2021 were $4.0 billion, an increase of $245.9 million or 6.5%, compared to March 31, 2021. This includes noninterest bearing deposits of $1.07 billion as of June 30, 2021 compared to $0.98 billion as of March 31, 2021. Total deposits as of June 30, 2021 totaled $5.7 billion, slightly down $3.2 million, or 0.1%, compared to March 31, 2021. Domestic deposits totaled $3.1 billion, down $35.0 million, or 1.1%, compared to March 31, 2021, while foreign deposits totaled $2.5 billion, up $31.8 million, or 1.3%, compared to March 31, 2021.
The quarter-over-quarter decline in total deposits was primarily attributable to a $145.1 million, or 10.5%, reduction in customer CDs compared to the prior quarter, as the Company continued to lower CD rates and focus on increasing core deposits and emphasizing multi-product
4
relationships versus single product higher-cost CDs. This decline in CDs includes a $25.8 million, or 17.2%, reduction in online CD balances. During the second quarter of 2021 brokered deposits also decreased $21.5 million, or 3.9%. Brokered time and brokered interest bearing demand deposits decreased by $104.0 million and $41.7 million, respectively, offset by a $124.2 million increase in brokered money market deposits. The decreases in total customer CDs and brokered deposits were partially offset by an increase of $163.5 million, or 4.4%, in customer transaction accounts, with savings and money market, noninterest bearing and interest bearing deposits contributing 39%, 54% and 7% to such growth, respectively.
Net Interest Income and Net Interest Margin
Second quarter 2021 NII was $50.0 million, up $2.4 million, or 5.1%, from $47.6 million in the first quarter of 2021 and up $3.6 million, or 7.9%, from $46.3 million in the second quarter of 2020. The quarter-over-quarter increase was primarily driven by higher average loan yields due to (i) lower net amortization of net deferred loan origination costs in the second quarter due to PPP loan forgiveness activity during the first quarter in connection with the first round of PPP loans, which had higher deferred loan origination costs; (ii) an increase in higher-yielding consumer loans, as well as lower overall customer deposit costs and declines in average balances on customer and brokered CDs. Lower cost and average balances on FHLB advances and other borrowings also contributed to the increase in NII. In May 2021, the Company repaid $235 million fixed-rate FHLB advances and modified rates on $285 million of additional borrowings, resulting in $3.6 million in annual savings and $2.5 million savings for the remainder of 2021. Offsetting the increase in NII were lower average loan balances due to higher prepayment activity and lower loan production as the economy slowly recovers from the COVID-19 pandemic. Also contributing to the offset were lower average balances and yields on available for sale securities due to prepayments and sale of securities in the first and second quarters.
The year-over-year increase in NII was primarily driven by higher average loan yields and significantly lower costs across all deposit types as well as lower average balances on customer and brokered time deposits. Lower cost and average balances on FHLB advances and other borrowings also contributed to the increase. Offsetting the year-over-year NII increase were lower average loan balances as well as lower average balances and yields on available for sale securities. Additionally, the company completed its offering of $60.0 million of 5.75% senior notes in June 2020 contributing to the offset to NII during the period.
NIM was 2.81% in the second quarter of 2021, up 15 basis points from 2.66% in the first quarter of 2021 and up 37 basis points from 2.44% in the second quarter of 2020. As in previous quarters, during the second quarter of 2021, Amerant continued to focus on offsetting ongoing NIM pressure by (i) decreasing cost of funds via strategic repricing of customer time and relationship money market deposits and restructuring of FHLB advances; and (ii) proactively seeking to increase spreads in loan origination.
As of June 30, 2021, Amerant had $364 million of time deposits maturing in the third quarter of 2021. This is expected to decrease the average cost of CDs by approximately 12bps and the overall cost of deposits by approximately 3bps.
5
Noninterest income
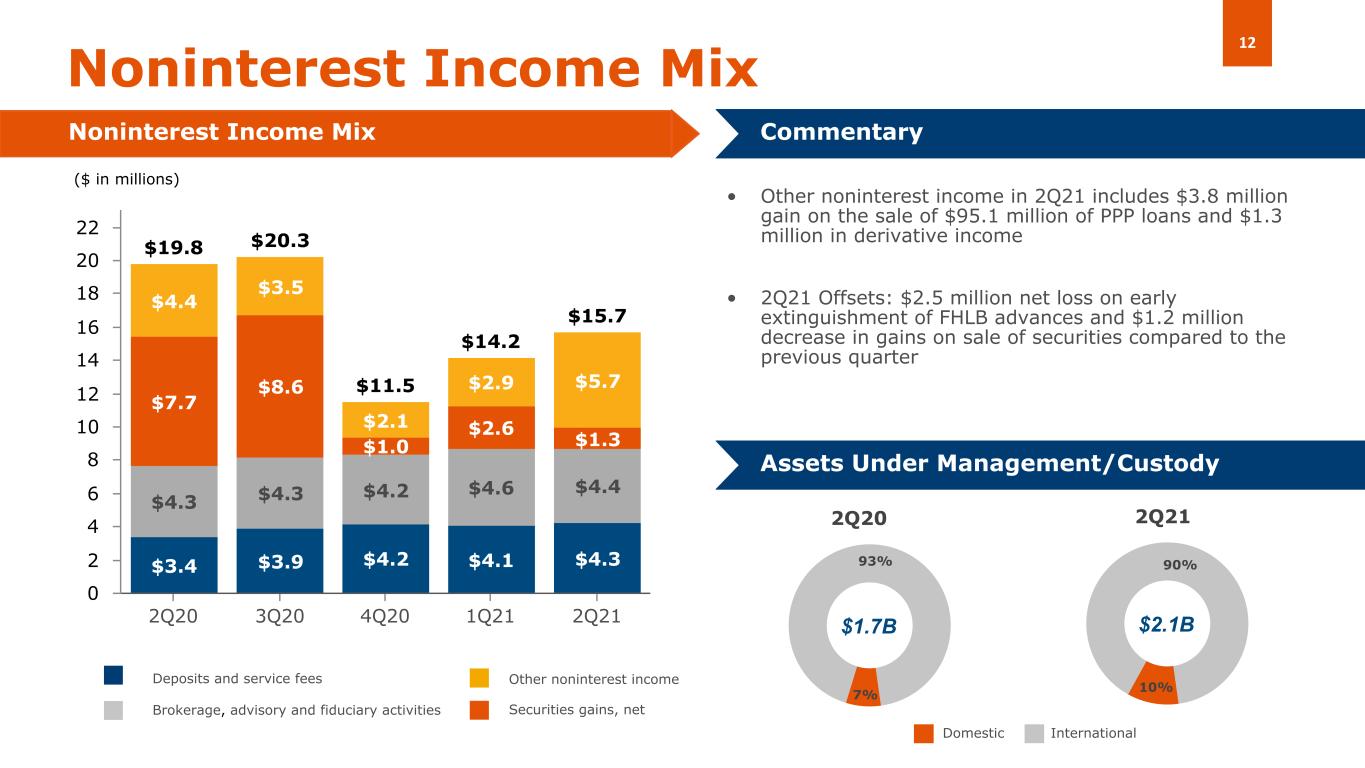
In the second quarter of 2021, noninterest income was $15.7 million, up 11.1% from $14.2 million in the first quarter of 2021. The increase was primarily driven by a net gain of $3.8 million in connection with the sale of $95.1 million of PPP loans in May 2021 and $1.1 million in higher customer derivative income. The quarter-over-quarter increase in noninterest income was partially offset by a $2.5 million net loss on early extinguishment of FHLB advances as the company repaid $235 million of these borrowings and a decrease of $1.2 million in net gain on sale of securities compared to the previous quarter. In the second quarter of 2021, Amerant realized a total net gain on sale of securities of $1.3 million. Core noninterest income (non-GAAP) was $13.1 million in the second quarter of 2021 compared to $11.6 million in the first quarter of 2021 and $12.1 million in the second quarter of 2020.
Noninterest income decreased $4.0 million, or 20.3%, from $19.8 million in the second quarter of 2020. The year-over-year decrease in noninterest income was primarily driven by a $6.4 million decrease in net gains on sale of securities as well as a $2.5 million net loss on early extinguishment of FHLB advances incurred during the second quarter of 2021, as previously mentioned. Lower customer derivative income in the current period compared to the second quarter of 2020 also contributed to the decrease year-over-year. The decrease in noninterest income year-over-year was partially offset by a net gain of $3.8 million from the sale of $95.1 million of PPP loans, and higher wire transfer fees.
The Company’s assets under management and custody (“AUM”) totaled $2.13 billion as of June 30, 2021, increasing $113.6 million, or 5.6%, from $2.02 billion as of March 31, 2021, and $416.7 million, or 24.3%, from $1.72 billion as of June 30, 2020 primarily driven by increased market value in AUM. From these increases in AUM net new assets represent $33.8 million, or 1.7%, compared to the first quarter of 2021 and $114.0 million, or 6.6%, compared to the second quarter of 2020, as the Company continues to build on its client-focused and relationship-centric strategy. Amerant remains firmly focused on growing AUM, both domestically and internationally.
Noninterest expense
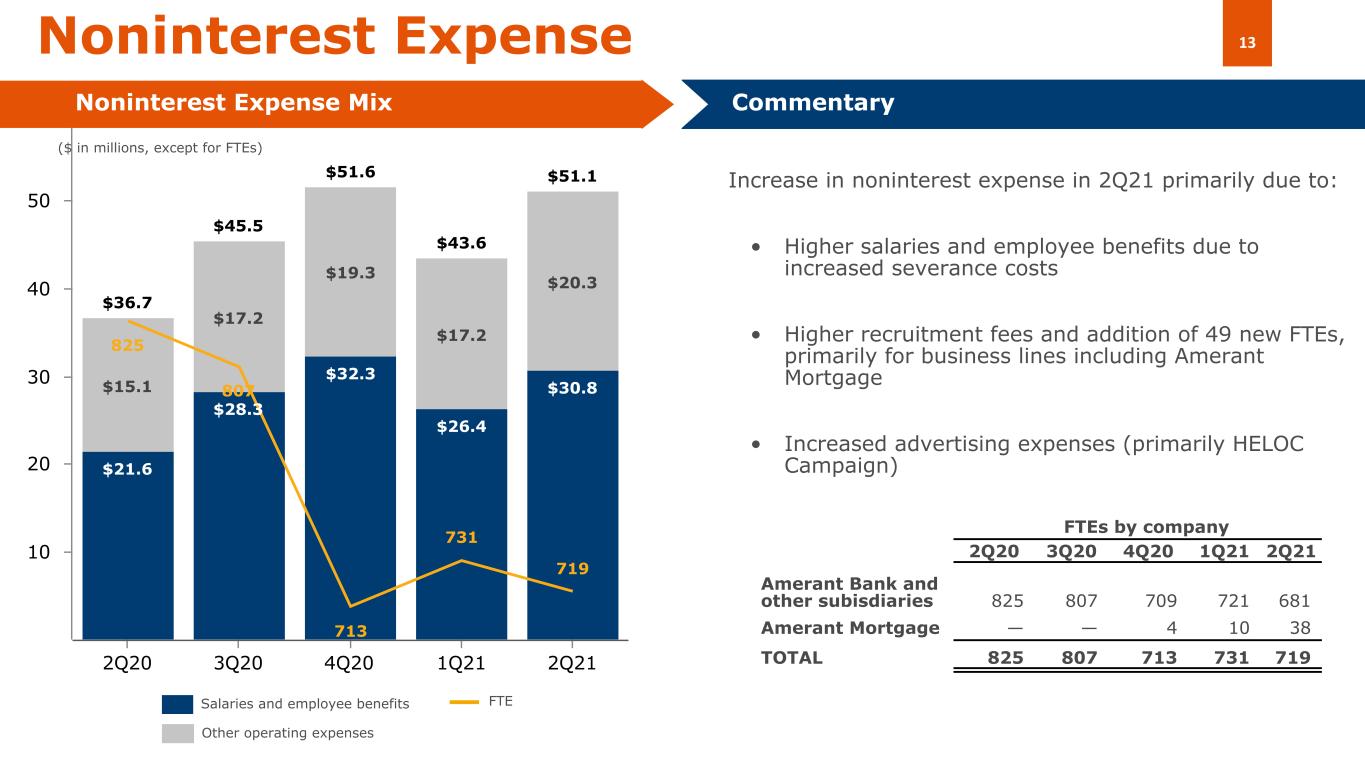
Second quarter of 2021 noninterest expense was $51.1 million, up $7.5 million, or 17.2%, from $43.6 million in the first quarter of 2021. The increase was primarily driven by higher salaries and employee benefits expenses primarily as a result of $3.3 million in severance expenses in connection with (i) the departure of the Company’s Chief Operating Officer; (ii) the closing of the New York City loan production Office (“NYC LPO”), as the Company ceased to originate loans there; (iii) the Company’s decision to outsource its internal audit function; and (iv) costs in connection with the elimination of various other support function positions. Additionally, the second quarter noninterest expense includes a $0.8 million lease impairment charge in connection with the closing of the NYC LPO. Lastly, there were higher recruitment fees and advertising expenses which also contributed to the increase quarter over quarter. There was no significant offset to the increase in noninterest expense during the period.
Noninterest expense for the second quarter of 2021, increased $14.4 million, or 39.2% compared to $36.7 million in the second quarter of 2020 primarily driven by higher salaries and employee benefits due to the absence of the $7.8 million deferral of expenses in the second quarter of 2020 directly related to the origination of PPP loans in accordance with GAAP. Higher
6
severance costs and rent expense under leases, as previously mentioned, as well as higher other noninterest expenses due to the absence of deferral costs in connection with PPP loan originations and advertising expenses also contributed to the increase year-over-year.
Core noninterest expense (non-GAAP) was $47.0 million in the second quarter of 2021, up $3.6 million, or 8.2%, from $43.4 million in the first quarter of 2021, and up $11.5 million, or 32.6%, from $35.4 million in the second quarter of 2020. Restructuring expenses totaled $4.2 million in the second quarter of 2021, compared to $0.2 million in the first quarter of 2021 and $1.3 million in the second quarter of 2020, primarily due to higher severance expenses, as described above.
The efficiency ratio was 77.8% in the second quarter of 2021, compared to 70.7% during the first quarter of 2021, and 55.6% for the second quarter of 2020. The quarter-over-quarter increase in the efficiency ratio was driven by severance expenses incurred during the second quarter of 2021 in connection with the restructuring activities and events previously referenced above. The year-over-year increase was primarily attributable to higher salaries and employee benefits due to the absence of the $7.8 million deferral of expenses in the second quarter of 2020, as explained above. Core efficiency ratio was 74.45% in the second quarter of 2021 compared to 73.35% in the first quarter of 2021 and 60.65% in the second quarter of 2020.
Amerant remains dedicated to finding new ways to increase efficiencies across the Company while simultaneously providing an enhanced banking experience for customers. As part of these continued efforts, Amerant signed partnerships with leading fintech firms in the most recent quarter, Numerated and Marstone, Inc., driving forward the Company's digital transformation. Numerated's platform is expected to improve the business lending and deposit account opening processes while Marstone's online wealth management platform is expected to further improve banking relationships by empowering Amerant customers to fully understand their financial position, plans and outlook.
Additionally, as part of Amerant’s keen focus on profitable growth, in July of 2021, the Company engaged Zimmerman Advertising as its new marketing partner demonstrating its commitment to driving brand awareness and business development.
Finally, the Company recently determined to close its banking center in Wellington, FL which is expected to be completed in the third quarter of 2021. This closure results from extensive profitability analyses of the Company’s retail banking network and current and expected individual branch contributions towards Amerant's strategic goals.
Capital Resources and Liquidity
The Company’s capital continues to be strong and well in excess of the minimum regulatory requirements to be considered “well-capitalized” at June 30, 2021.
Stockholders’ equity attributable to the Company totaled $799.1 million as of June 30, 2021, up $14.1 million, or 1.8%, from $785.0 million as of March 31, 2021. This increase in stockholder’s equity was primarily driven by net income in the second quarter of 2021 and higher valuation of the Company’s debt securities available for sale as a result of lower long-term yield curves.
7
Partially offsetting the increase was the $6.5 million Class B shares repurchased by the Company during the second quarter of 2021. Book value per common share increased to $21.27 at June 30, 2021 compared to $20.70 at March 31, 2021. TBV increased to $20.69 at June 30, 2021 compared to $20.13 at March 31, 2021.
As of June 30, 2021, the Company had repurchased approximately $8.4 million Class B shares since launching its Class B share repurchase program for the repurchase of up to $40 million of its Class B shares on March 11, 2021, demonstrating its commitment to increasing total return to shareholders.
Amerant’s liquidity position continues to be strong and includes cash and cash equivalents of $171.5 million at the close of the second quarter of 2021, compared to $233.5 million as of March 31, 2021. Additionally, as of June 30, 2021, the Company had $1.5 billion in available borrowing capacity with the FHLB, an increase from $1.3 billion in the first quarter of 2021.
Second Quarter 2021 Earnings Conference Call
As previously announced, the Company will hold an earnings conference call on Thursday, July 22nd, 2021 at 9:00 a.m. (Eastern Time) to discuss its second quarter 2021 results. The conference call and presentation materials can be accessed via webcast by logging on from the Investor Relations section of the company’s website at https://investor.amerantbank.com. The online replay will remain available for approximately one month following the call through the above link.
About Amerant Bancorp Inc.
The Company is a bank holding company headquartered in Coral Gables, Florida since 1979. The Company operates through its subsidiaries, Amerant Bank, N.A. (the “Bank”), Amerant Investments, Inc., Elant Bank and Trust Ltd., and Amerant Mortgage, LLC. The Company provides individuals and businesses in the U.S., as well as select international clients, with deposit, credit and wealth management services. The Bank, which has operated for over 40 years, is the second largest community bank headquartered in Florida. The Bank operates 25 banking centers – 18 in South Florida and 7 in the Houston, Texas area.
nCino® is a registered trademark of nCino, Inc. used in accordance with contractual terms.
Numerated® is a trademark of Numerated Growth Technologies, Inc. and is used with permission.
Marstone® is a trademark of Marstone, Inc. and is used with permission.
Zimmerman Advertising, LLC is used with permission.
Visit our investor relations page at https://investor.amerantbank.com for additional information.
Cautionary Notice Regarding Forward-Looking Statements
8
This press release contains “forward-looking statements” within the meaning of the Securities Act of 1933 and the Securities Exchange Act of 1934, including statements with respect to our objectives, expectations and intentions and other statements that are not historical facts. All statements other than statements of historical fact are statements that could be forward-looking statements. You can identify these forward-looking statements through our use of words such as “may,” “will,” “anticipate,” “assume,” “should,” “indicate,” “would,” “believe,” “contemplate,” “expect,” “estimate,” “continue,” “plan,” “point to,” “project,” “could,” “intend,” “target,” “goals,” “outlooks,” “modeled,” “dedicated,” “create,” and other similar words and expressions of the future.
Forward-looking statements, including those as to our beliefs, plans, objectives, goals, expectations, anticipations, estimates and intentions, involve known and unknown risks, uncertainties and other factors, which may be beyond our control, and which may cause the Company’s actual results, performance, achievements, or financial condition to be materially different from future results, performance, achievements, or financial condition expressed or implied by such forward-looking statements. You should not rely on any forward-looking statements as predictions of future events. You should not expect us to update any forward-looking statements, except as required by law. All written or oral forward-looking statements attributable to us are expressly qualified in their entirety by this cautionary notice, together with those risks and uncertainties described in “Risk factors” in our annual report on Form 10-K for the fiscal year ended December 31, 2020 and in our other filings with the U.S. Securities and Exchange Commission (the “SEC”), which are available at the SEC’s website www.sec.gov.
Interim Financial Information
Unaudited financial information as of and for interim periods, including as of and for the three and six months ended June 30, 2021 and 2020, may not reflect our results of operations for our fiscal year ending, or financial condition as of December 31, 2021, or any other period of time or date.
Non-GAAP Financial Measures
The Company supplements its financial results that are determined in accordance with accounting principles generally accepted in the United States of America (“GAAP”) with non-GAAP financial measures, such as “pre-provision net revenue (PPNR)”, “core pre-provision net revenue (Core PPNR)”, “core noninterest income”, “core noninterest expense”, “core net income (loss)”, “core net income (loss) per share (basic and diluted)”, “core return on assets (ROA)”, “core return on equity (ROE)”, and “core efficiency ratio”. This supplemental information is not required by, or are not presented in accordance with GAAP. The Company refers to these financial measures and ratios as “non-GAAP financial measures” and they should not be considered in isolation or as a substitute for the GAAP measures presented herein.
We use certain non-GAAP financial measures, including those mentioned above, both to explain our results to shareholders and the investment community and in the internal evaluation and management of our businesses. Our management believes that these non-GAAP financial measures and the information they provide are useful to investors since these measures permit investors to view our performance using the same tools that our management uses to evaluate our past performance and prospects for future performance, especially in light of the additional costs we have incurred in connection with the Company’s restructuring activities that began in
9
2018 and have continued into 2021, including the effect of non-core banking activities such as the sale of loans and securities, and other non-recurring actions intended to improve customer service and operating performance. While we believe that these non-GAAP financial measures are useful in evaluating our performance, this information should be considered as supplemental and not as a substitute for or superior to the related financial information prepared in accordance with GAAP. Additionally, these non-GAAP financial measures may differ from similar measures presented by other companies.
Exhibit 2 reconciles these non-GAAP financial measures to reported results.
10
Exhibit 1- Selected Financial Information
The following table sets forth selected financial information derived from our unaudited and audited consolidated financial statements.
(in thousands) | June 30, 2021 | March 31, 2021 | December 31, 2020 | September 30, 2020 | June 30, 2020 | ||||||||||||||||||||||||
| Consolidated Balance Sheets | |||||||||||||||||||||||||||||
| Total assets | $ | 7,532,844 | $ | 7,751,098 | $ | 7,770,893 | $ | 7,977,047 | $ | 8,130,723 | |||||||||||||||||||
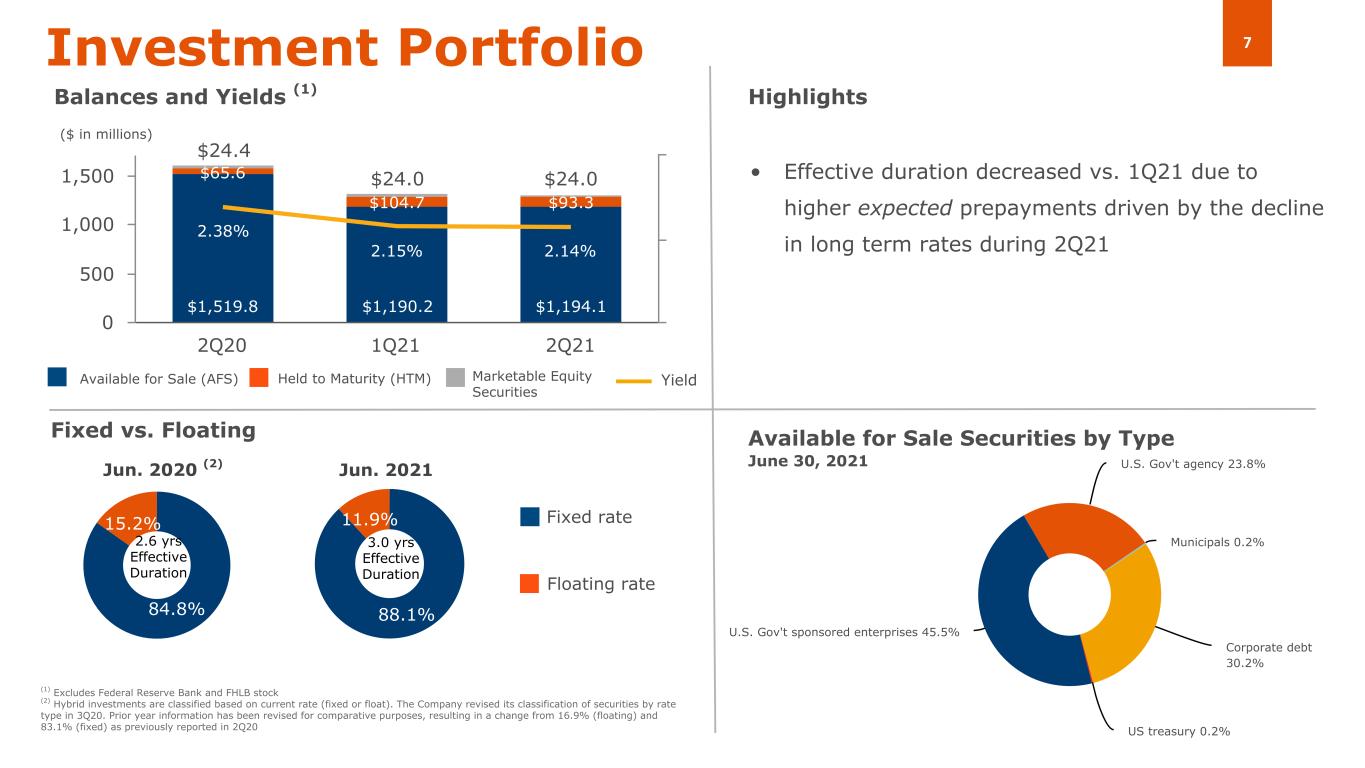
| Total investments | 1,359,240 | 1,375,292 | 1,372,567 | 1,468,796 | 1,674,811 | ||||||||||||||||||||||||
| Total gross loans (1) | 5,608,548 | 5,754,838 | 5,842,337 | 5,924,617 | 5,872,271 | ||||||||||||||||||||||||
| Allowance for loan losses | 104,185 | 110,940 | 110,902 | 116,819 | 119,652 | ||||||||||||||||||||||||
| Total deposits | 5,674,908 | 5,678,079 | 5,731,643 | 5,877,546 | 6,024,702 | ||||||||||||||||||||||||
| Core deposits (2) | 4,041,867 | 3,795,949 | 3,690,081 | 3,623,647 | 3,590,625 | ||||||||||||||||||||||||
| Advances from the FHLB and other borrowings | 808,614 | 1,050,000 | 1,050,000 | 1,050,000 | 1,050,000 | ||||||||||||||||||||||||
| Senior notes (3) | 58,736 | 58,656 | 58,577 | 58,498 | 58,419 | ||||||||||||||||||||||||
| Junior subordinated debentures | 64,178 | 64,178 | 64,178 | 64,178 | 64,178 | ||||||||||||||||||||||||
| Stockholders' equity (4) | 799,068 | 785,014 | 783,421 | 829,533 | 830,198 | ||||||||||||||||||||||||
Assets under management and custody (5) | 2,132,516 | 2,018,870 | 1,972,321 | 1,762,803 | 1,715,804 | ||||||||||||||||||||||||
Three Months Ended | Six Months Ended June 30, | ||||||||||||||||||||||||||||||||||||||||
(in thousands, except percentages and per share amounts) | June 30, 2021 | March 31, 2021 | December 31, 2020 | September 30, 2020 | June 30, 2020 | 2021 | 2020 | ||||||||||||||||||||||||||||||||||
Consolidated Results of Operations | |||||||||||||||||||||||||||||||||||||||||
| Net interest income | $ | 49,971 | $ | 47,569 | $ | 48,652 | $ | 45,348 | $ | 46,323 | $ | 97,540 | $ | 95,552 | |||||||||||||||||||||||||||
| (Reversal of) provision for loan losses | (5,000) | — | — | 18,000 | 48,620 | (5,000) | 70,620 | ||||||||||||||||||||||||||||||||||
| Noninterest income | 15,734 | 14,163 | 11,515 | 20,292 | 19,753 | 29,897 | 41,663 | ||||||||||||||||||||||||||||||||||
| Noninterest expense | 51,125 | 43,625 | 51,629 | 45,500 | 36,740 | 94,750 | 81,607 | ||||||||||||||||||||||||||||||||||
| Net income (loss) attributable to Amerant Bancorp Inc. (6) | 15,962 | 14,459 | 8,473 | 1,702 | (15,279) | 30,421 | (11,897) | ||||||||||||||||||||||||||||||||||
| Effective income tax rate | 22.65 | % | 20.15 | % | 0.76 | % | 20.47 | % | 20.77 | % | 21.45 | % | 20.75 | % | |||||||||||||||||||||||||||
Common Share Data | |||||||||||||||||||||||||||||||||||||||||
| Stockholders' book value per common share | $ | 21.27 | $ | 20.70 | $ | 20.70 | $ | 19.68 | $ | 19.69 | $ | 21.27 | $ | 19.69 | |||||||||||||||||||||||||||
| Tangible stockholders' equity (book value) per common share (7) | $ | 20.69 | $ | 20.13 | $ | 20.13 | $ | 19.17 | $ | 19.18 | $ | 20.69 | $ | 19.18 | |||||||||||||||||||||||||||
| Basic earnings (loss) per common share | $ | 0.43 | $ | 0.38 | $ | 0.21 | $ | 0.04 | $ | (0.37) | $ | 0.81 | $ | (0.28) | |||||||||||||||||||||||||||
| Diluted earnings (loss) per common share (8) | $ | 0.42 | $ | 0.38 | $ | 0.20 | $ | 0.04 | $ | (0.37) | $ | 0.81 | $ | (0.28) | |||||||||||||||||||||||||||
| Basic weighted average shares outstanding | 37,330 | 37,618 | 41,326 | 41,722 | 41,720 | 37,473 | 41,953 | ||||||||||||||||||||||||||||||||||
| Diluted weighted average shares outstanding (8) | 37,693 | 37,846 | 41,688 | 42,065 | 41,720 | 37,768 | 41,953 | ||||||||||||||||||||||||||||||||||
11
| Three Months Ended | Six Months Ended June 30, | ||||||||||||||||||||||||||||||||||||||||
| June 30, 2021 | March 31, 2021 | December 31, 2020 | September 30, 2020 | June 30, 2020 | 2021 | 2020 | |||||||||||||||||||||||||||||||||||
| Other Financial and Operating Data (9) | |||||||||||||||||||||||||||||||||||||||||
| Profitability Indicators (%) | |||||||||||||||||||||||||||||||||||||||||
| Net interest income / Average total interest earning assets (NIM) (10) | 2.81 | % | 2.66 | % | 2.61 | % | 2.39 | % | 2.44 | % | 2.74 | % | 2.55 | % | |||||||||||||||||||||||||||
| Net income (loss) / Average total assets (ROA) (11) | 0.83 | % | 0.76 | % | 0.42 | % | 0.08 | % | (0.75) | % | 0.80 | % | (0.30) | % | |||||||||||||||||||||||||||
| Net income (loss) / Average stockholders' equity (ROE) (12) | 8.11 | % | 7.47 | % | 4.09 | % | 0.81 | % | (7.21) | % | 7.80 | % | (2.82) | % | |||||||||||||||||||||||||||
| Noninterest income / Total revenue (13) | 23.95% | 22.94% | 19.14% | 30.91% | 29.89% | 23.46% | 30.36% | ||||||||||||||||||||||||||||||||||
| Capital Indicators (%) | |||||||||||||||||||||||||||||||||||||||||
| Total capital ratio (14) | 14.17 % | 14.12 | % | 13.96 | % | 14.56 | % | 14.34 | % | 14.17 % | 14.34 | % | |||||||||||||||||||||||||||||
| Tier 1 capital ratio (15) | 12.92 | % | 12.87 | % | 12.71 | % | 13.30 | % | 13.08 | % | 12.92 | % | 13.08 | % | |||||||||||||||||||||||||||
| Tier 1 leverage ratio (16) | 10.75 % | 10.54 | % | 10.11 | % | 10.52 | % | 10.39 | % | 10.75 % | 10.39 | % | |||||||||||||||||||||||||||||
| Common equity tier 1 capital ratio (CET1) (17) | 11.96 % | 11.90 | % | 11.73 | % | 12.34 | % | 12.13 | % | 11.96 % | 12.13 | % | |||||||||||||||||||||||||||||
| Tangible common equity ratio (18) | 10.35 | % | 9.88 | % | 9.83 | % | 10.16 | % | 9.97 | % | 10.35 | % | 9.97 | % | |||||||||||||||||||||||||||
| Asset Quality Indicators (%) | |||||||||||||||||||||||||||||||||||||||||
| Non-performing assets / Total assets (19) | 1.61 | % | 1.16 | % | 1.13 | % | 1.08 | % | 0.95 | % | 1.61 | % | 0.95 | % | |||||||||||||||||||||||||||
| Non-performing loans / Total loans (1) (20) | 2.16 | % | 1.56 | % | 1.50 | % | 1.46 | % | 1.32 | % | 2.16 | % | 1.32 | % | |||||||||||||||||||||||||||
| Allowance for loan losses / Total non-performing loans | 86.02 | % | 123.92 | % | 126.46 | % | 135.09 | % | 154.87 | % | 86.02 | % | 154.87 | % | |||||||||||||||||||||||||||
| Allowance for loan losses / Total loans (1) | 1.86 | % | 1.93 | % | 1.90 | % | 1.97 | % | 2.04 | % | 1.86 | % | 2.04 | % | |||||||||||||||||||||||||||
| Net charge-offs / Average total loans (21) | 0.12 | % | — | % | 0.40 | % | 1.41 | % | 0.13 | % | 0.06 | % | 0.11 | % | |||||||||||||||||||||||||||
| Efficiency Indicators (% except FTE) | |||||||||||||||||||||||||||||||||||||||||
| Noninterest expense / Average total assets | 2.67 | % | 2.28 | % | 2.59 | % | 2.24 | % | 1.81 | % | 2.48 | % | 2.04 | % | |||||||||||||||||||||||||||
| Salaries and employee benefits / Average total assets | 1.61 | % | 1.38 | % | 1.62 | % | 1.39 | % | 1.06 | % | 1.50 | % | 1.27 | % | |||||||||||||||||||||||||||
| Other operating expenses/ Average total assets (22) | 1.06 | % | 0.90 | % | 0.97 | % | 0.85 | % | 0.75 | % | 0.98 | % | 0.77 | % | |||||||||||||||||||||||||||
| Efficiency ratio (23) | 77.80 | % | 70.70 | % | 85.81 | % | 69.32 | % | 55.60 | % | 74.35 | % | 59.47 | % | |||||||||||||||||||||||||||
| Full-Time-Equivalent Employees (FTEs) (24) | 719 | 731 | 713 | 807 | 825 | 719 | 825 | ||||||||||||||||||||||||||||||||||
12
| Three Months Ended | Six Months Ended June 30, | ||||||||||||||||||||||||||||||||||||||||
(in thousands, except percentages and per share amounts) | June 30, 2021 | March 31, 2021 | December 31, 2020 | September 30, 2020 | June 30, 2020 | 2021 | 2020 | ||||||||||||||||||||||||||||||||||
| Core Selected Consolidated Results of Operations and Other Data (6) | |||||||||||||||||||||||||||||||||||||||||
| Core pre-provision net revenue (Core PPNR) | $ | 16,934 | $ | 15,765 | $ | 17,641 | $ | 13,387 | $ | 22,983 | $ | 32,699 | $ | 39,996 | |||||||||||||||||||||||||||
| Core net income (loss) | $ | 17,199 | $ | 12,589 | $ | 20,917 | $ | (3,638) | $ | (20,321) | $ | 29,788 | $ | (24,270) | |||||||||||||||||||||||||||
| Core basic earnings (loss) per common share | 0.46 | 0.33 | 0.50 | (0.09) | (0.49) | 0.79 | (0.58) | ||||||||||||||||||||||||||||||||||
| Core earnings (loss) per diluted common share (7) | 0.46 | 0.33 | 0.50 | (0.09) | (0.49) | 0.79 | (0.58) | ||||||||||||||||||||||||||||||||||
| Core net income (loss) / Average total assets (Core ROA) (11) | 0.90 | % | 0.66 | % | 1.05 | % | (0.18) | % | (1.00) | % | 0.78 | % | (0.61) | % | |||||||||||||||||||||||||||
| Core net income (loss) / Average stockholders' equity (Core ROE) (12) | 8.74 | % | 6.50 | % | 10.08 | % | (1.74) | % | (9.59) | % | 7.64 | % | (5.76) | % | |||||||||||||||||||||||||||
| Core efficiency ratio (25) | 74.45 | % | 73.35 | % | 71.02 | % | 76.53 | % | 60.65 | % | 73.92 | % | 66.65 | % | |||||||||||||||||||||||||||
__________________
(1) Total gross loans are net of unamortized deferred loan origination fees and costs. At June 30, 2021 and March 31, 2021, total loans include $1.8 million and $1.0 million in loans held for sale, respectively. There were no loans held for sale at any of the other dates presented.
(2) Core deposits consist of total deposits excluding all time deposits.
(3) During the second quarter of 2020, the Company completed a $60 million offering of Senior Notes with a coupon rate of 5.75%. Senior Notes are presented net of direct issuance cost which is deferred and amortized over 5 years.
(4) On March 10, 2021, the Company’s Board of Directors approved a stock repurchase program which provides for the potential repurchase of up to $40 million of shares of the Company’s Class B common stock (the “2021 Stock Repurchase Program”). In the second and first quarters of 2021, the Company repurchased an aggregate of 386,195 and 116,037 shares of Class B common stock, respectively, at a weighted average price per share of $16.62 and $15.98, respectively, under the 2021 Stock Repurchase Program. In the fourth quarter of 2020, the Company completed a modified “Dutch auction” tender offer to purchase, for cash, up to $50.0 million of shares of its Class B common stock, and accepted to purchase 4,249,785 shares of Class B common stock in the tender offer at a price of $12.55 per share. The purchase price for this transaction was approximately $54.1 million, including $0.8 million in related fees and other expenses.
(5) Assets held for clients in an agency or fiduciary capacity which are not assets of the Company and therefore are not included in the consolidated financial statements.
(6) Includes 49% minority interest of Amerant Mortgage LLC.
(7) This presentation contains adjusted financial information determined by methods other than GAAP. This adjusted financial information is reconciled to GAAP in Exhibit 2 - Non-GAAP Financial Measures Reconciliation.
(8) In the three and six months periods ended June 30, 2021, potential dilutive instruments consisted of unvested shares of restricted stock, restricted stock units and performance share units (restricted stock and restricted stock units for all of the other periods shown). For the three and six month periods ended June 30, 2020, potential dilutive instruments were not included in the diluted earnings per share computation because the Company reported a net loss and their inclusion would have an antidilutive effect. For all other periods presented, potential dilutive instruments were included in the diluted earnings per share computation because, when the unamortized deferred compensation cost related to these shares was divided by the average market price per share in those periods, fewer shares would have been purchased than restricted shares assumed issued. Therefore, in those periods, such awards resulted in higher diluted weighted average shares outstanding than basic weighted average shares outstanding, and had a dilutive effect in per share earnings.
(9) Operating data for the periods presented have been annualized.
10) NIM is defined as NII divided by average interest-earning assets, which are loans, securities, deposits with banks and other financial assets which yield interest or similar income.
(11)Calculated based upon the average daily balance of total assets.
13
(12) Calculated based upon the average daily balance of stockholders’ equity.
(13) Total revenue is the result of net interest income before provision for loan losses plus noninterest income.
(14) Total stockholders’ equity divided by total risk-weighted assets, calculated according to the standardized regulatory capital ratio calculations.
(15) Tier 1 capital divided by total risk-weighted assets. Tier 1 capital is composed of Common Equity Tier 1 (CET1) capital plus outstanding qualifying trust preferred securities of $62.3 million at June 30, 2021, March 31, 2021, December 31, 2020, September 30, 2020 and June 30, 2020.
(16) Tier 1 capital divided by quarter to date average assets.
(17)CET1 capital divided by total risk-weighted assets.
(18) Tangible common equity is calculated as the ratio of common equity less goodwill and other intangibles divided by total assets less goodwill and other intangible assets. Other intangibles assets are included in other assets in the Company’s consolidated balance sheets.
(19)Non-performing assets include all accruing loans past due by 90 days or more, all nonaccrual loans, restructured loans that are considered “troubled debt restructurings” or “TDRs”, and OREO properties acquired through or in lieu of foreclosure.
(20)Non-performing loans include all accruing loans past due by 90 days or more, all nonaccrual loans and restructured loans that are considered TDRs.
(21)Calculated based upon the average daily balance of outstanding loan principal balance net of unamortized deferred loan origination fees and costs, excluding the allowance for loan losses. During the second quarter of 2021, there were net charge offs of $1.8 million. In the first quarter of 2021, there were zero net charge offs. During the third quarter of 2020, the Company charged off $19.3 million against the allowance for loan losses as result of the deterioration of one commercial loan relationship.
(22)Other operating expenses is the result of total noninterest expense less salary and employee benefits.
(23)Efficiency ratio is the result of noninterest expense divided by the sum of noninterest income and NII.
(24)As of June 30, 2021, includes 38 FTEs for Amerant Mortgage LLC.
(25)Core efficiency ratio is the efficiency ratio less the effect of restructuring costs and other adjustments, described in Exhibit 2 - Non-GAAP Financial Measures Reconciliation.
14
Exhibit 2- Non-GAAP Financial Measures Reconciliation
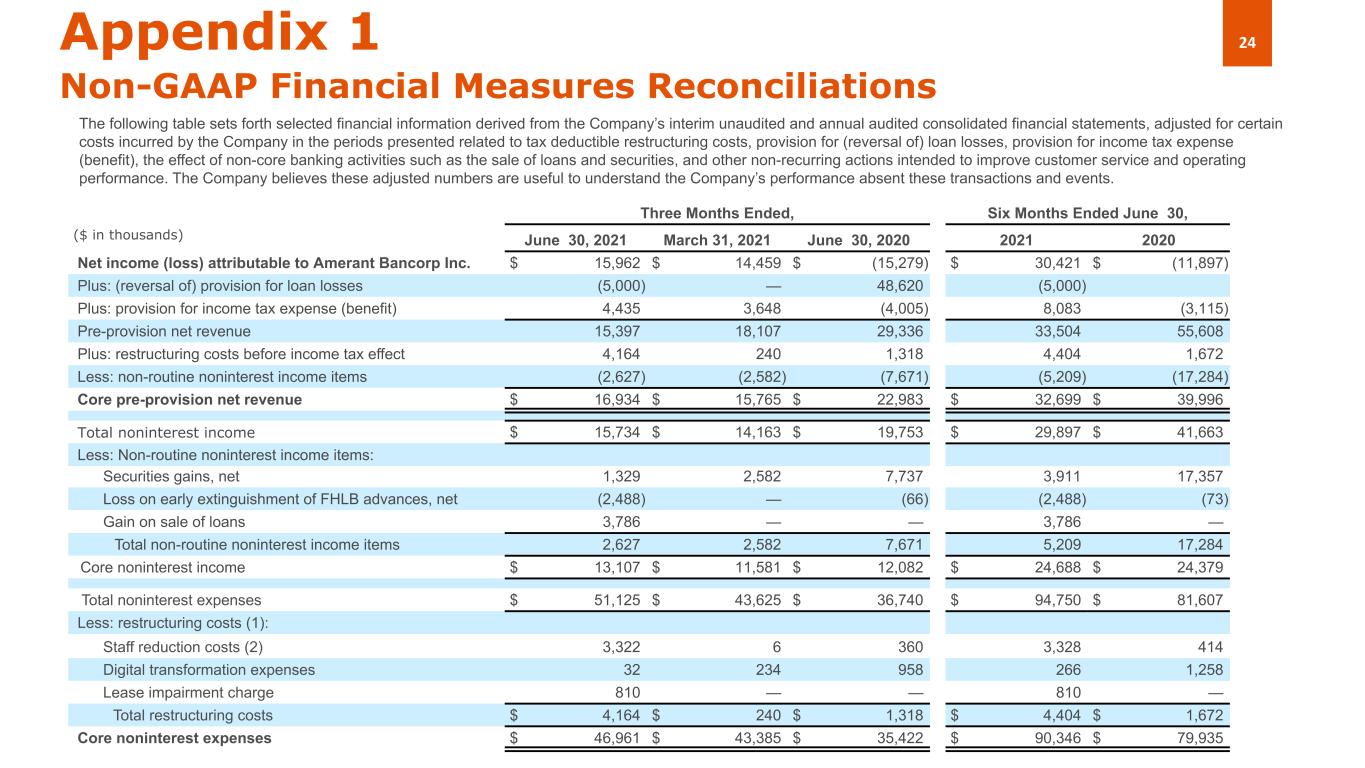
The following table sets forth selected financial information derived from the Company’s interim unaudited and annual audited consolidated financial statements, adjusted for certain costs incurred by the Company in the periods presented related to tax deductible restructuring costs, provision for (reversal of) loan losses, provision for income tax expense (benefit), the effect of non-core banking activities such as the sale of loans and securities, and other non-recurring actions intended to improve customer service and operating performance. The Company believes these adjusted numbers are useful to understand the Company’s performance absent these transactions and events.
| Three Months Ended, | Six Months Ended June 30, | |||||||||||||||||||||||||
(in thousands) | June 30, 2021 | March 31, 2021 | December 31, 2020 | September 30, 2020 | June 30, 2020 | 2021 | 2020 | |||||||||||||||||||
| Net income (loss) attributable to Amerant Bancorp Inc. | $ | 15,962 | $ | 14,459 | $ | 8,473 | $ | 1,702 | $ | (15,279) | $ | 30,421 | $ | (11,897) | ||||||||||||
| Plus: (reversal of) provision for loan losses | (5,000) | — | — | 18,000 | 48,620 | (5,000) | 70,620 | |||||||||||||||||||
| Plus: provision for income tax expense (benefit) | 4,435 | 3,648 | 65 | 438 | (4,005) | 8,083 | (3,115) | |||||||||||||||||||
| Pre-provision net revenue | 15,397 | 18,107 | 8,538 | 20,140 | 29,336 | 33,504 | 55,608 | |||||||||||||||||||
| Plus: restructuring costs before income tax effect | 4,164 | 240 | 8,407 | 1,846 | 1,318 | 4,404 | 1,672 | |||||||||||||||||||
| Less: non-routine noninterest income items | (2,627) | (2,582) | 696 | (8,599) | (7,671) | (5,209) | (17,284) | |||||||||||||||||||
| Core pre-provision net revenue | $ | 16,934 | $ | 15,765 | $ | 17,641 | $ | 13,387 | $ | 22,983 | $ | 32,699 | $ | 39,996 | ||||||||||||
| Total noninterest income | $ | 15,734 | $ | 14,163 | $ | 11,515 | $ | 20,292 | $ | 19,753 | $ | 29,897 | $ | 41,663 | ||||||||||||
| Less: Non-routine noninterest income items: | ||||||||||||||||||||||||||
Loss on sale of the Beacon operations center (1) | — | — | (1,729) | — | — | — | — | |||||||||||||||||||
| Securities gains, net | 1,329 | 2,582 | 1,033 | 8,599 | 7,737 | 3,911 | 17,357 | |||||||||||||||||||
| Loss on early extinguishment of FHLB advances, net | (2,488) | — | — | — | (66) | (2,488) | (73) | |||||||||||||||||||
| Gain on sale of loans | 3,786 | — | — | — | — | 3,786 | — | |||||||||||||||||||
| Total non-routine noninterest income items | $ | 2,627 | $ | 2,582 | $ | (696) | $ | 8,599 | $ | 7,671 | $ | 5,209 | $ | 17,284 | ||||||||||||
| Core noninterest income | $ | 13,107 | $ | 11,581 | $ | 12,211 | $ | 11,693 | $ | 12,082 | $ | 24,688 | $ | 24,379 | ||||||||||||
| Total noninterest expenses | $ | 51,125 | $ | 43,625 | $ | 51,629 | $ | 45,500 | $ | 36,740 | $ | 94,750 | $ | 81,607 | ||||||||||||
| Less: restructuring costs (2): | ||||||||||||||||||||||||||
| Staff reduction costs (3) | 3,322 | 6 | 5,345 | 646 | 360 | 3,328 | 414 | |||||||||||||||||||
| Digital transformation expenses | 32 | 234 | 658 | 1,200 | 958 | 266 | 1,258 | |||||||||||||||||||
| Lease impairment charge | 810 | — | — | — | — | 810 | — | |||||||||||||||||||
| Branch closure expenses | — | — | 2,404 | — | — | — | — | |||||||||||||||||||
| Total restructuring costs | $ | 4,164 | $ | 240 | $ | 8,407 | $ | 1,846 | $ | 1,318 | $ | 4,404 | $ | 1,672 | ||||||||||||
| Core noninterest expenses | $ | 46,961 | $ | 43,385 | $ | 43,222 | $ | 43,654 | $ | 35,422 | $ | 90,346 | $ | 79,935 | ||||||||||||
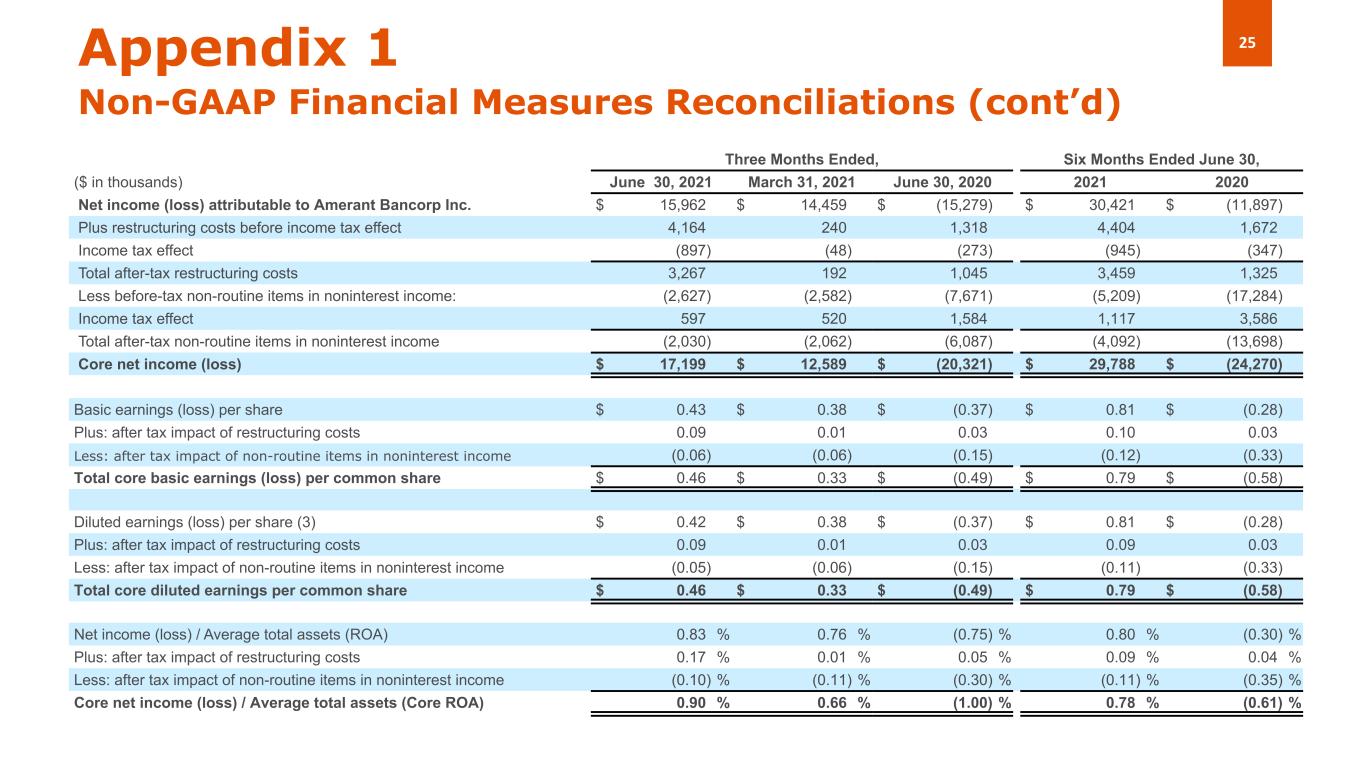
| Net income (loss) attributable to Amerant Bancorp Inc. | $ | 15,962 | $ | 14,459 | $ | 8,473 | $ | 1,702 | $ | (15,279) | $ | 30,421 | $ | (11,897) | ||||||||||||
| Plus after-tax restructuring costs: | ||||||||||||||||||||||||||
| Restructuring costs before income tax effect | 4,164 | 240 | 8,407 | 1,846 | 1,318 | 4,404 | 1,672 | |||||||||||||||||||
| Income tax effect | (897) | (48) | (6,455) | (385) | (273) | (945) | (347) | |||||||||||||||||||
| Total after-tax restructuring costs | 3,267 | 192 | 1,952 | 1,461 | 1,045 | 3,459 | 1,325 | |||||||||||||||||||
| Less before-tax non-routine items in noninterest income: | (2,627) | (2,582) | 696 | (8,599) | (7,671) | (5,209) | (17,284) | |||||||||||||||||||
| Income tax effect | 597 | 520 | 9,796 | 1,798 | 1,584 | 1,117 | 3,586 | |||||||||||||||||||
| Total after-tax non-routine items in noninterest income | (2,030) | (2,062) | 10,492 | (6,801) | (6,087) | (4,092) | (13,698) | |||||||||||||||||||
| Core net income (loss) | $ | 17,199 | $ | 12,589 | $ | 20,917 | $ | (3,638) | $ | (20,321) | $ | 29,788 | $ | (24,270) | ||||||||||||
15
| Three Months Ended, | Six Months Ended June 30, | |||||||||||||||||||||||||
(in thousands, except percentages and per share amounts) | June 30, 2021 | March 31, 2021 | December 31, 2020 | September 30, 2020 | June 30, 2020 | 2021 | 2020 | |||||||||||||||||||
| Basic earnings (loss) per share | $ | 0.43 | $ | 0.38 | $ | 0.21 | $ | 0.04 | $ | (0.37) | $ | 0.81 | $ | (0.28) | ||||||||||||
| Plus: after tax impact of restructuring costs | 0.09 | 0.01 | 0.04 | 0.04 | 0.03 | 0.10 | 0.03 | |||||||||||||||||||
| Less: after tax impact of non-routine items in noninterest income | (0.06) | (0.06) | 0.25 | (0.17) | (0.15) | (0.12) | (0.33) | |||||||||||||||||||
| Total core basic earnings (loss) per common share | $ | 0.46 | $ | 0.33 | $ | 0.50 | $ | (0.09) | $ | (0.49) | $ | 0.79 | $ | (0.58) | ||||||||||||
| Diluted earnings (loss) per share (4) | $ | 0.42 | $ | 0.38 | $ | 0.20 | $ | 0.04 | $ | (0.37) | $ | 0.81 | $ | (0.28) | ||||||||||||
| Plus: after tax impact of restructuring costs | 0.09 | 0.01 | 0.05 | 0.04 | 0.03 | 0.09 | 0.03 | |||||||||||||||||||
| Less: after tax impact of non-routine items in noninterest income | (0.05) | (0.06) | 0.25 | (0.17) | (0.15) | (0.11) | (0.33) | |||||||||||||||||||
| Total core diluted earnings (loss) per common share | $ | 0.46 | $ | 0.33 | $ | 0.50 | $ | (0.09) | $ | (0.49) | $ | 0.79 | $ | (0.58) | ||||||||||||
| Net income (loss) / Average total assets (ROA) | 0.83 | % | 0.76 | % | 0.42 | % | 0.08 | % | (0.75) | % | 0.80 | % | (0.30) | % | ||||||||||||
| Plus: after tax impact of restructuring costs | 0.17 | % | 0.01 | % | 0.11 | % | 0.08 | % | 0.05 | % | 0.09 | % | 0.04 | % | ||||||||||||
| Less: after tax impact of non-routine items in noninterest income | (0.10) | % | (0.11) | % | 0.52 | % | (0.34) | % | (0.30) | % | (0.11) | % | (0.35) | % | ||||||||||||
| Core net income (loss) / Average total assets (Core ROA) | 0.90 | % | 0.66 | % | 1.05 | % | (0.18) | % | (1.00) | % | 0.78 | % | (0.61) | % | ||||||||||||
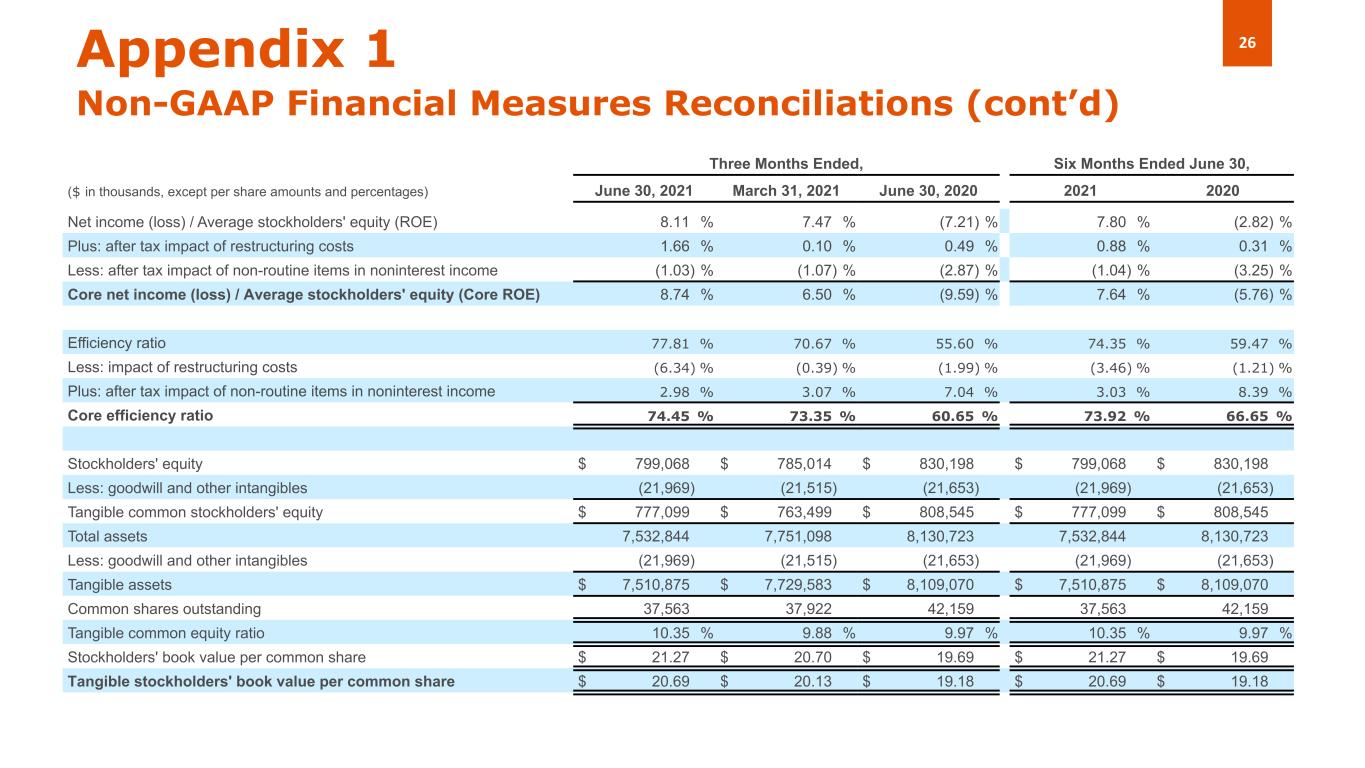
| Net income (loss) / Average stockholders' equity (ROE) | 8.11 | % | 7.47 | % | 4.09 | % | 0.81 | % | (7.21) | % | 7.80 | % | (2.82) | % | ||||||||||||
| Plus: after tax impact of restructuring costs | 1.66 | % | 0.10 | % | 0.94 | % | 0.70 | % | 0.49 | % | 0.88 | % | 0.31 | % | ||||||||||||
| Less: after tax impact of non-routine items in noninterest income | (1.03) | % | (1.07) | % | 5.05 | % | (3.25) | % | (2.87) | % | (1.04) | % | (3.25) | % | ||||||||||||
| Core net income (loss) / Average stockholders' equity (Core ROE) | 8.74 | % | 6.50 | % | 10.08 | % | (1.74) | % | (9.59) | % | 7.64 | % | (5.76) | % | ||||||||||||
| Efficiency ratio | 77.81 | % | 70.67 | % | 85.81 | % | 69.32 | % | 55.60 | % | 74.35 | % | 59.47 | % | ||||||||||||
| Less: impact of restructuring costs | (6.34) | % | (0.39) | % | (13.97) | % | (2.81) | % | (1.99) | % | (3.46) | % | (1.21) | % | ||||||||||||
| Plus: after tax impact of non-routine items in noninterest income | 2.98 | % | 3.07 | % | (0.82) | % | 10.02 | % | 7.04 | % | 3.03 | % | 8.39 | % | ||||||||||||
| Core efficiency ratio | 74.45 | % | 73.35 | % | 71.02 | % | 76.53 | % | 60.65 | % | 73.92 | % | 66.65 | % | ||||||||||||
| Stockholders' equity | $ | 799,068 | $ | 785,014 | $ | 783,421 | $ | 829,533 | $ | 830,198 | $ | 799,068 | $ | 830,198 | ||||||||||||
| Less: goodwill and other intangibles | (21,969) | (21,515) | (21,561) | (21,607) | (21,653) | (21,969) | (21,653) | |||||||||||||||||||
| Tangible common stockholders' equity | $ | 777,099 | $ | 763,499 | $ | 761,860 | $ | 807,926 | $ | 808,545 | $ | 777,099 | $ | 808,545 | ||||||||||||
| Total assets | 7,532,844 | 7,751,098 | 7,770,893 | 7,977,047 | 8,130,723 | 7,532,844 | 8,130,723 | |||||||||||||||||||
| Less: goodwill and other intangibles | (21,969) | (21,515) | (21,561) | (21,607) | (21,653) | (21,969) | (21,653) | |||||||||||||||||||
| Tangible assets | $ | 7,510,875 | $ | 7,729,583 | $ | 7,749,332 | $ | 7,955,440 | $ | 8,109,070 | $ | 7,510,875 | $ | 8,109,070 | ||||||||||||
| Common shares outstanding | 37,563 | 37,922 | 37,843 | 42,147 | 42,159 | 37,563 | 42,159 | |||||||||||||||||||
| Tangible common equity ratio | 10.35 | % | 9.88 | % | 9.83 | % | 10.16 | % | 9.97 | % | 10.35 | % | 9.97 | % | ||||||||||||
| Stockholders' book value per common share | $ | 21.27 | $ | 20.70 | $ | 20.70 | $ | 19.68 | $ | 19.69 | $ | 21.27 | $ | 19.69 | ||||||||||||
| Tangible stockholders' book value per common share | $ | 20.69 | $ | 20.13 | $ | 20.13 | $ | 19.17 | $ | 19.18 | $ | 20.69 | $ | 19.18 | ||||||||||||
16
____________
(1) The Company leased-back the property for a 2-year term.
(2) Expenses incurred for actions designed to implement the Company’s strategy as a new independent company. These actions include, but are not limited to reductions in workforce, streamlining operational processes, rolling out the Amerant brand, implementation of new technology system applications, enhanced sales tools and training, expanded product offerings and improved customer analytics to identify opportunities.
(3) In the second quarter of 2021, includes expenses in connection with the departure of the Company’s Chief Operating Officer and the elimination of various other support function positions, including the NYC LPO. In the fourth quarter of 2020, the Board of Directors of the Company adopted a voluntary early retirement plan for certain eligible long-term employees and an involuntary severance plan for certain other positions consistent with the Company’s effort to streamline operations and better align its operating structure with its business activities. 31 employees elected to participate in the voluntary plan, all of whom retired on or before December 31, 2020. The involuntary plan impacted 31 employees most of whom no longer worked for the Company and/or its subsidiaries by December 31, 2020. On December 28, 2020, the Company determined the termination costs and annual savings related to the voluntary and involuntary plans. The Company incurred approximately $3.5 million and $1.8 million in one-time termination costs in the fourth quarter of 2020 in connection with the voluntary and involuntary plans, respectively, the majority of which will be paid over time in the form of installment payments until December 2021. The Company estimates that the voluntary and involuntary plans will yield estimated annual savings of approximately $4.2 million and $5.5 million, respectively, for combined estimated annual savings of approximately $9.7 million beginning in 2021.
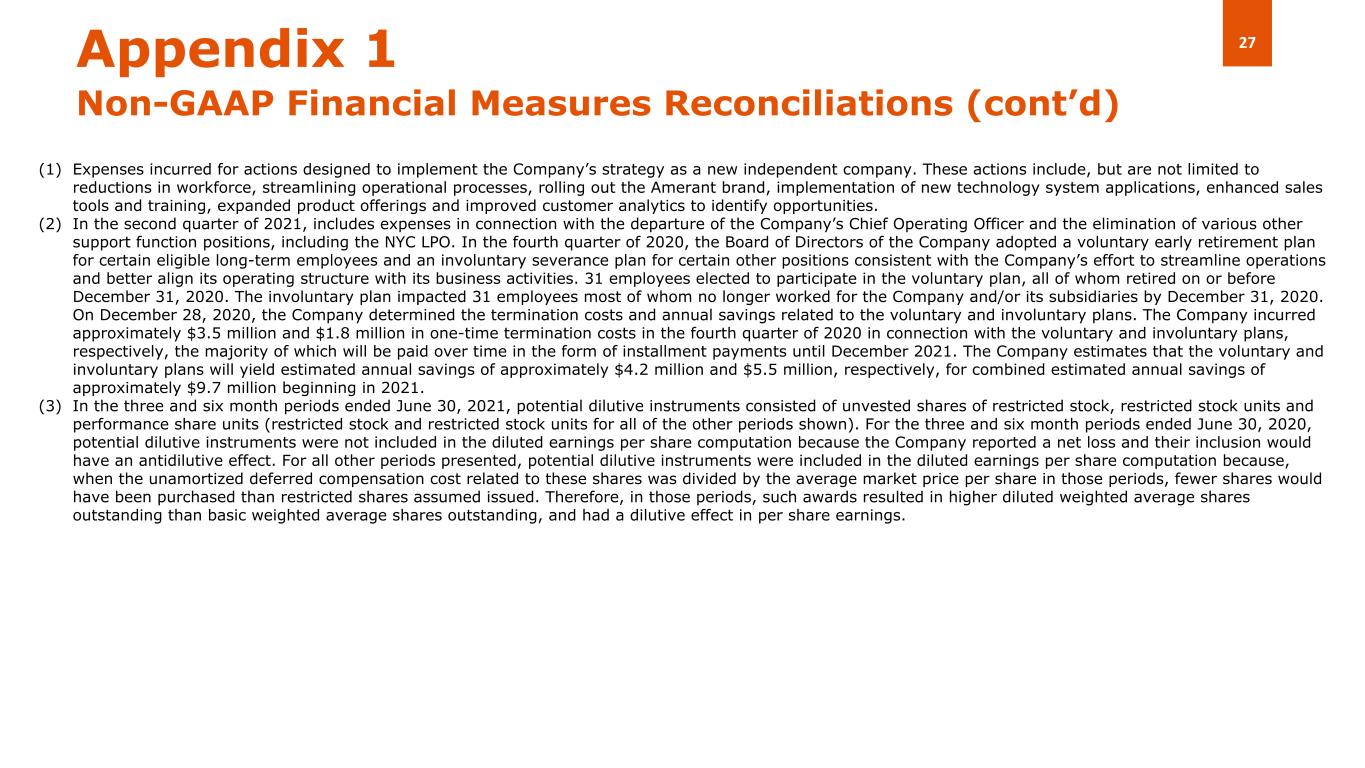
(4) In the three and six month periods ended June 30, 2021, potential dilutive instruments consisted of unvested shares of restricted stock, restricted stock units and performance share units (restricted stock and restricted stock units for all of the other periods shown). For the three and six month periods ended June 30, 2020, potential dilutive instruments were not included in the diluted earnings per share computation because the Company reported a net loss and their inclusion would have an antidilutive effect. For all other periods presented, potential dilutive instruments were included in the diluted earnings per share computation because, when the unamortized deferred compensation cost related to these shares was divided by the average market price per share in those periods, fewer shares would have been purchased than restricted shares assumed issued. Therefore, in those periods, such awards resulted in higher diluted weighted average shares outstanding than basic weighted average shares outstanding, and had a dilutive effect in per share earnings.
17
Exhibit 3 - Average Balance Sheet, Interest and Yield/Rate Analysis
The following tables present average balance sheet information, interest income, interest expense and the corresponding average yields earned and rates paid for the periods presented. The average balances for loans include both performing and nonperforming balances. Interest income on loans includes the effects of discount accretion and the amortization of non-refundable loan origination fees, net of direct loan origination costs, accounted for as yield adjustments. Average balances represent the daily average balances for the periods presented.
| Three Months Ended | |||||||||||||||||||||||||||||||||||
| June 30, 2021 | March 31, 2021 | June 30, 2020 | |||||||||||||||||||||||||||||||||
| (in thousands, except percentages) | Average Balances | Income/ Expense | Yield/ Rates | Average Balances | Income/ Expense | Yield/ Rates | Average Balances | Income/ Expense | Yield/ Rates | ||||||||||||||||||||||||||
| Interest-earning assets: | |||||||||||||||||||||||||||||||||||
| Loan portfolio, net (1) | $ | 5,526,727 | $ | 53,612 | 3.89 | % | $ | 5,678,547 | $ | 52,771 | 3.77 | % | $ | 5,712,548 | $ | 53,483 | 3.77 | % | |||||||||||||||||
| Debt securities available for sale (2) | 1,180,766 | 6,393 | 2.17 | % | 1,207,764 | 6,495 | 2.18 | % | 1,545,335 | 9,283 | 2.42 | % | |||||||||||||||||||||||
| Debt securities held to maturity (3) | 97,208 | 481 | 1.98 | % | 67,729 | 302 | 1.81 | % | 68,237 | 308 | 1.82 | % | |||||||||||||||||||||||
| Debt securities held for trading | 258 | 2 | 3.11 | % | 104 | 1 | 3.90 | % | — | — | — | % | |||||||||||||||||||||||
| Equity securities with readily determinable fair value not held for trading | 24,010 | 75 | 1.25 | % | 24,225 | 84 | 1.41 | % | 24,303 | 121 | 2.00 | % | |||||||||||||||||||||||
| Federal Reserve Bank and FHLB stock | 51,764 | 548 | 4.25 | % | 63,781 | 625 | 3.97 | % | 69,801 | 916 | 5.28 | % | |||||||||||||||||||||||
| Deposits with banks | 239,951 | 62 | 0.10 | % | 205,355 | 51 | 0.10 | % | 215,406 | 56 | 0.10 | % | |||||||||||||||||||||||
| Total interest-earning assets | 7,120,684 | 61,173 | 3.45 | % | 7,247,505 | 60,329 | 3.38 | % | 7,635,630 | 64,167 | 3.38 | % | |||||||||||||||||||||||
| Total non-interest-earning assets less allowance for loan losses | 559,807 | 498,754 | 512,569 | ||||||||||||||||||||||||||||||||
| Total assets | $ | 7,680,491 | $ | 7,746,259 | $ | 8,148,199 | |||||||||||||||||||||||||||||
18
| Three Months Ended | |||||||||||||||||||||||||||||||||||
| June 30, 2021 | March 31, 2021 | June 30, 2020 | |||||||||||||||||||||||||||||||||
| (in thousands, except percentages) | Average Balances | Income/ Expense | Yield/ Rates | Average Balances | Income/ Expense | Yield/ Rates | Average Balances | Income/ Expense | Yield/ Rates | ||||||||||||||||||||||||||
| Interest-bearing liabilities: | |||||||||||||||||||||||||||||||||||
| Checking and saving accounts - | |||||||||||||||||||||||||||||||||||
| Interest bearing DDA | $ | 1,292,612 | $ | 123 | 0.04 | % | $ | 1,258,301 | $ | 113 | 0.04 | % | $ | 1,122,405 | $ | 104 | 0.04 | % | |||||||||||||||||
| Money market | 1,310,133 | 931 | 0.29 | % | 1,236,026 | 966 | 0.32 | % | 1,112,363 | 1,521 | 0.55 | % | |||||||||||||||||||||||
| Savings | 373,723 | 14 | 0.02 | % | 318,800 | 14 | 0.02 | % | 320,644 | 48 | 0.06 | % | |||||||||||||||||||||||
| Total checking and saving accounts | 2,976,468 | 1,068 | 0.14 | % | 2,813,127 | 1,093 | 0.16 | % | 2,555,412 | 1,673 | 0.26 | % | |||||||||||||||||||||||
| Time deposits | 1,789,517 | 6,327 | 1.42 | % | 1,956,559 | 7,360 | 1.53 | % | 2,484,219 | 12,406 | 2.01 | % | |||||||||||||||||||||||
| Total deposits | 4,765,985 | 7,395 | 0.62 | % | 4,769,686 | 8,453 | 0.72 | % | 5,039,631 | 14,079 | 1.12 | % | |||||||||||||||||||||||
| Securities sold under agreements to repurchase | 440 | 1 | 0.91 | % | — | — | — | % | 474 | — | — | % | |||||||||||||||||||||||
| Advances from the FHLB and other borrowings (4) | 922,050 | 2,255 | 0.98 | % | 1,050,000 | 2,758 | 1.07 | % | 1,163,022 | 3,110 | 1.08 | % | |||||||||||||||||||||||
| Senior notes | 58,697 | 942 | 6.44 | % | 58,618 | 942 | 6.52 | % | 5,136 | 84 | 6.58 | % | |||||||||||||||||||||||
| Junior subordinated debentures | 64,178 | 609 | 3.81 | % | 64,178 | 607 | 3.84 | % | 64,178 | 571 | 3.58 | % | |||||||||||||||||||||||
| Total interest-bearing liabilities | 5,811,350 | 11,202 | 0.77 | % | 5,942,482 | 12,760 | 0.87 | % | 6,272,441 | 17,844 | 1.14 | % | |||||||||||||||||||||||
| Non-interest-bearing liabilities: | |||||||||||||||||||||||||||||||||||
| Non-interest bearing demand deposits | 937,275 | 925,266 | 916,980 | ||||||||||||||||||||||||||||||||
| Accounts payable, accrued liabilities and other liabilities | 142,226 | 93,450 | 106,738 | ||||||||||||||||||||||||||||||||
| Total non-interest-bearing liabilities | 1,079,501 | 1,018,716 | 1,023,718 | ||||||||||||||||||||||||||||||||
| Total liabilities | 6,890,851 | 6,961,198 | 7,296,159 | ||||||||||||||||||||||||||||||||
| Stockholders’ equity | 789,640 | 785,061 | 852,040 | ||||||||||||||||||||||||||||||||
| Total liabilities and stockholders' equity | $ | 7,680,491 | $ | 7,746,259 | $ | 8,148,199 | |||||||||||||||||||||||||||||
| Excess of average interest-earning assets over average interest-bearing liabilities | $ | 1,309,334 | $ | 1,305,023 | $ | 1,363,189 | |||||||||||||||||||||||||||||
| Net interest income | $ | 49,971 | $ | 47,569 | $ | 46,323 | |||||||||||||||||||||||||||||
| Net interest rate spread | 2.68 | % | 2.51 | % | 2.24 | % | |||||||||||||||||||||||||||||
| Net interest margin (5) | 2.81 | % | 2.66 | % | 2.44 | % | |||||||||||||||||||||||||||||
| Cost of total deposits (6) | 0.52 | % | 0.60 | % | 0.95 | % | |||||||||||||||||||||||||||||
| Ratio of average interest-earning assets to average interest-bearing liabilities | 122.53 | % | 121.96 | % | 121.73 | % | |||||||||||||||||||||||||||||
| Average non-performing loans/ Average total loans | 1.84 | % | 1.54 | % | 0.87 | % | |||||||||||||||||||||||||||||
19
| Six Months Ended | |||||||||||||||||||||||
| June 30, 2021 | June 30, 2020 | ||||||||||||||||||||||
| (in thousands, except percentages) | Average Balances | Income/ Expense | Yield/ Rates | Average Balances | Income/ Expense | Yield/ Rates | |||||||||||||||||
| Interest-earning assets: | |||||||||||||||||||||||
| Loan portfolio, net (1) | $ | 5,602,218 | $ | 106,383 | 3.83 | % | $ | 5,643,088 | $ | 113,271 | 4.04 | % | |||||||||||
| Debt securities available for sale (2) | 1,192,342 | 12,888 | 2.18 | % | 1,547,418 | 18,781 | 2.44 | % | |||||||||||||||
| Debt securities held to maturity (3) | 82,550 | 783 | 1.91 | % | 70,355 | 708 | 2.02 | % | |||||||||||||||
| Debt securities held for trading | 181 | 3 | 3.34 | % | — | — | — | % | |||||||||||||||
| Equity securities with readily determinable fair value not held for trading | 24,117 | 159 | 1.33 | % | 24,178 | 252 | 2.10 | % | |||||||||||||||
| Federal Reserve Bank and FHLB stock | 57,650 | 1,173 | 4.10 | % | 70,497 | 1,952 | 5.57 | % | |||||||||||||||
| Deposits with banks | 222,749 | 113 | 0.10 | % | 193,627 | 518 | 0.54 | % | |||||||||||||||
| Total interest-earning assets | 7,181,807 | 121,502 | 3.41 | % | 7,549,163 | 135,482 | 3.61 | % | |||||||||||||||
| Total non-interest-earning assets less allowance for loan losses | 532,232 | 500,363 | |||||||||||||||||||||
| Total assets | $ | 7,714,039 | $ | 8,049,526 | |||||||||||||||||||
| Interest-bearing liabilities: | |||||||||||||||||||||||
| Checking and saving accounts - | |||||||||||||||||||||||
| Interest bearing DDA | $ | 1,302,603 | $ | 236 | 0.04 | % | $ | 1,097,489 | $ | 239 | 0.04 | % | |||||||||||
| Money market | 1,273,284 | 1,897 | 0.30 | % | 1,124,432 | 4,770 | 0.85 | % | |||||||||||||||
| Savings | 320,903 | 28 | 0.02 | % | 321,663 | 65 | 0.04 | % | |||||||||||||||
| Total checking and saving accounts | 2,896,790 | 2,161 | 0.15 | % | 2,543,584 | 5,074 | 0.40 | % | |||||||||||||||
| Time deposits | 1,872,577 | 13,687 | 1.47 | % | 2,472,646 | 25,890 | 2.11 | % | |||||||||||||||
| Total deposits | 4,769,367 | 15,848 | 0.67 | % | 5,016,230 | 30,964 | 1.24 | % | |||||||||||||||
| Securities sold under agreements to repurchase | 221 | 1 | 0.91 | % | 237 | — | — | % | |||||||||||||||
| Advances from the FHLB and other borrowings (4) | 985,672 | 5,013 | 1.03 | % | 1,179,368 | 7,522 | 1.28 | % | |||||||||||||||
| Junior subordinated debentures | 64,178 | 1,216 | 3.82 | % | 68,650 | 1,360 | 3.98 | % | |||||||||||||||
| Senior notes | 58,658 | 1,884 | 6.48 | % | 2,568 | 84 | 6.58 | % | |||||||||||||||
| Total interest-bearing liabilities | 5,878,096 | 23,962 | 0.82 | % | 6,267,053 | 39,930 | 1.28 | % | |||||||||||||||
| Non-interest-bearing liabilities: | |||||||||||||||||||||||
| Non-interest bearing demand deposits | 931,291 | 836,782 | |||||||||||||||||||||
| Accounts payable, accrued liabilities and other liabilities | 118,021 | 97,816 | |||||||||||||||||||||
| Total non-interest-bearing liabilities | 1,049,312 | 934,598 | |||||||||||||||||||||
| Total liabilities | 6,927,408 | 7,201,651 | |||||||||||||||||||||
| Stockholders’ equity | 786,631 | 847,875 | |||||||||||||||||||||
| Total liabilities and stockholders' equity | $ | 7,714,039 | $ | 8,049,526 | |||||||||||||||||||
| Excess of average interest-earning assets over average interest-bearing liabilities | $ | 1,303,711 | $ | 1,282,110 | |||||||||||||||||||
| Net interest income | $ | 97,540 | $ | 95,552 | |||||||||||||||||||
| Net interest rate spread | 2.59 | % | 2.33 | % | |||||||||||||||||||
| Net interest margin (5) | 2.74 | % | 2.55 | % | |||||||||||||||||||
| Cost of total deposits | 0.56 | % | 1.06 | % | |||||||||||||||||||
| Ratio of average interest-earning assets to average interest-bearing liabilities | 122.18 | % | 120.46 | % | |||||||||||||||||||
| Average non-performing loans/ Average total loans | 1.69 | % | 0.73 | % | |||||||||||||||||||
20
_______________
(1) Average non-performing loans of $103.6 million, $89.2 million and $50.4 million for the three months ended June 30, 2021, March 31, 2021 and June 30, 2020, respectively, and $96.4 million and $41.6 million in the six months ended June 30, 2021 and 2020, respectively, are included in the average loan portfolio, net. Interest income that would have been recognized on these non-performing loans totaled $0.9 million, $0.8 million and $0.6 million, in the three months ended June 30, 2021, March 31, 2021 and June 30, 2020, respectively, and $1.7 million and $1.1 million in the six months ended June 30, 2021 and 2020, respectively.
(2) Includes nontaxable securities with average balances of $27.3 million, $54.7 million and $62.2 million for the three months ended June 30, 2021, March 31, 2021 and June 30, 2020, respectively, and $47.9 million and $55.8 million in the six months ended June 30, 2021 and 2020, respectively. The tax equivalent yield for these nontaxable securities was 2.15%, 3.80% and 3.77% for the three months ended June 30, 2021, March 31, 2021 and June 30, 2020, respectively, and 2.77% and 3.82% for the six months ended June 30, 2021 and 2020, respectively. In 2021 and 2020, the tax equivalent yields were calculated by assuming a 21% tax rate and dividing the actual yield by 0.79.
(3) Includes nontaxable securities with average balances of $52.2 million, $56.6 million and $68.2 million for the three months ended June 30, 2021, March 31, 2021 and June 30, 2020, respectively, and $54.4 million and $70.4 million in the six months ended June 30, 2021 and 2020, respectively. The tax equivalent yield for these nontaxable securities was 2.19%, 2.40% and 2.30% for the three months ended June 30, 2021, March 31, 2021 and June 30, 2020, respectively, and 2.30% and 2.56% for the six months ended June 30, 2021 and 2020, respectively. In 2021 and 2020, the tax equivalent yields were calculated assuming a 21% tax rate and dividing the actual yield by 0.79.
(4) The terms of the FHLB advance agreements require the Bank to maintain certain investment securities or loans as collateral for these advances.
(5) NIM is defined as net interest income divided by average interest-earning assets, which are loans, securities, deposits with banks and other financial assets which yield interest or similar income.
(6) Calculated based upon the average balance of total noninterest bearing and interest bearing deposits.
Exhibit 4 - Noninterest Income
This table shows the amounts of each of the categories of noninterest income for the periods presented.
| Three Months Ended | Six Months Ended June 30, | |||||||||||||||||||||||||||||||||||||||||||
| June 30, 2021 | March 31, 2021 | June 30, 2020 | 2021 | 2020 | ||||||||||||||||||||||||||||||||||||||||
| (in thousands, except percentages) | Amount | % | Amount | % | Amount | % | Amount | % | Amount | % | ||||||||||||||||||||||||||||||||||
| Deposits and service fees | $ | 4,284 | 27.2 | % | $ | 4,106 | 29.0 | % | $ | 3,438 | 17.4 | % | $ | 8,390 | 28.1 | % | $ | 7,728 | 18.6 | % | ||||||||||||||||||||||||
| Brokerage, advisory and fiduciary activities | 4,431 | 28.2 | % | 4,603 | 32.5 | % | 4,325 | 21.9 | % | 9,034 | 30.2 | % | 8,458 | 20.3 | % | |||||||||||||||||||||||||||||
Change in cash surrender value of bank owned life insurance (“BOLI”)(1) | 1,368 | 8.7 | % | 1,356 | 9.6 | % | 1,427 | 7.2 | % | 2,724 | 9.1 | % | 2,841 | 6.8 | % | |||||||||||||||||||||||||||||
| Cards and trade finance servicing fees | 388 | 2.5 | % | 339 | 2.4 | % | 273 | 1.4 | % | 727 | 2.4 | % | 668 | 1.6 | % | |||||||||||||||||||||||||||||
| Loss on early extinguishment of FHLB advances, net | (2,488) | (15.8) | % | — | — | % | (66) | (0.3) | % | (2,488) | (8.3) | % | (73) | (0.2) | % | |||||||||||||||||||||||||||||
Securities gains, net (2) | 1,329 | 8.5 | % | 2,582 | 18.2 | % | 7,737 | 39.2 | % | 3,911 | 13.1 | % | 17,357 | 41.7 | % | |||||||||||||||||||||||||||||
Other noninterest income (3) | 6,404 | 40.7 | % | 1,177 | 8.3 | % | 2,619 | 13.2 | % | 7,581 | 25.4 | % | 4,684 | 11.2 | % | |||||||||||||||||||||||||||||
| Total noninterest income | $ | 15,734 | 100.0 | % | $ | 14,163 | 100.0 | % | $ | 19,753 | 100.0 | % | $ | 29,897 | 100.0 | % | $ | 41,663 | 100.0 | % | ||||||||||||||||||||||||
__________________
(1) Changes in cash surrender value of BOLI are not taxable.
(2) Includes net gain on sale of securities of $1.3 million, $2.9 million and $7.5 million during the three months ended June 30, 2021, March 31, 2021 and June 30, 2020, respectively, and unrealized gains of $22 thousand, unrealized losses of $0.4 million and unrealized gains of $0.2 million during the three months ended June 30, 2021, March 31, 2021 and June 30, 2020, respectively, related to the change in market value of mutual funds.
(3) Includes a gain of $3.8 million on the sale of PPP loans in the three and six month periods ended June 30, 2021. In addition, includes rental income, income from derivative and foreign currency exchange transactions with customers, and valuation income on the investment balances held in the non-qualified deferred compensation plan.
21
Exhibit 5 - Noninterest Expense
This table shows the amounts of each of the categories of noninterest expense for the periods presented.
| Three Months Ended | Six Months Ended June 30, | |||||||||||||||||||||||||||||||||||||||||||
| June 30, 2021 | March 31, 2021 | June 30, 2020 | 2021 | 2020 | ||||||||||||||||||||||||||||||||||||||||
| (in thousands, except percentages) | Amount | % | Amount | % | Amount | % | Amount | % | Amount | % | ||||||||||||||||||||||||||||||||||
Salaries and employee benefits (1) | $ | 30,796 | 60.2 | % | $ | 26,427 | 60.6 | % | $ | 21,570 | 58.7 | % | $ | 57,223 | 60.4 | % | $ | 50,896 | 62.4 | % | ||||||||||||||||||||||||
Occupancy and equipment (2) | 5,342 | 10.4 | % | 4,488 | 10.3 | % | 4,220 | 11.5 | % | 9,830 | 10.4 | % | 8,023 | 9.8 | % | |||||||||||||||||||||||||||||
Professional and other services fees (3) | 4,693 | 9.2 | % | 3,784 | 8.7 | % | 3,965 | 10.8 | % | 8,477 | 9.0 | % | 6,919 | 8.5 | % | |||||||||||||||||||||||||||||
| Telecommunications and data processing | 3,515 | 6.9 | % | 3,727 | 8.5 | % | 3,157 | 8.6 | % | 7,242 | 7.6 | % | 6,621 | 8.1 | % | |||||||||||||||||||||||||||||
| Depreciation and amortization | 1,872 | 3.7 | % | 1,786 | 4.1 | % | 1,960 | 5.3 | % | 3,658 | 3.9 | % | 3,919 | 4.8 | % | |||||||||||||||||||||||||||||
| FDIC assessments and insurance | 1,702 | 3.3 | % | 1,755 | 4.0 | % | 1,240 | 3.4 | % | 3,457 | 3.7 | % | 2,358 | 2.9 | % | |||||||||||||||||||||||||||||
Other operating expenses (4) | 3,205 | 6.3 | % | 1,658 | 3.8 | % | 628 | 1.7 | % | 4,863 | 5.1 | % | 2,871 | 3.5 | % | |||||||||||||||||||||||||||||
| Total noninterest expense | $ | 51,125 | 100.0 | % | $ | 43,625 | 100.0 | % | $ | 36,740 | 100.0 | % | $ | 94,750 | 100.0 | % | $ | 81,607 | 100.0 | % | ||||||||||||||||||||||||
___________
(1) Includes severance of $3.3 million in three months ended June 30, 2021 in connection with the departure of the Company’s COO and other actions, and $1.0 million and $0.5 million in the three months ended June 30, 2021 and March 31, 2021, respectively, in connection with a Long Term Incentive Compensation Program adopted in the first quarter of 2021.
(2) Includes $0.8 million of ROU asset impairment associated with lease in NYC for loan production office.
(3) Other services fees include expenses on derivative contracts.
(4) Includes advertising, marketing, charitable contributions, community engagement, postage and courier expenses, provisions for possible losses on contingent loans, and debits which mirror the valuation income on the investment balances held in the non-qualified deferred compensation plan in order to adjust the liability to participants of the deferred compensation plan.
22
Exhibit 6 - Consolidated Balance Sheets
| (in thousands, except share data) | June 30, 2021 | March 31, 2021 | December 31, 2020 | September 30, 2020 | June 30, 2020 | ||||||||||||||||||||||||
| Assets | |||||||||||||||||||||||||||||
| Cash and due from banks | $ | 45,198 | $ | 37,744 | $ | 30,179 | $ | 34,091 | $ | 35,651 | |||||||||||||||||||
| Interest earning deposits with banks | 126,314 | 195,755 | 184,207 | 193,069 | 181,698 | ||||||||||||||||||||||||
| Cash and cash equivalents | 171,512 | 233,499 | 214,386 | 227,160 | 217,349 | ||||||||||||||||||||||||
| Securities | |||||||||||||||||||||||||||||
| Debt securities available for sale | 1,194,068 | 1,190,201 | 1,225,083 | 1,317,724 | 1,519,784 | ||||||||||||||||||||||||
| Debt securities held to maturity | 93,311 | 104,657 | 58,127 | 61,676 | 65,616 | ||||||||||||||||||||||||
| Trading securities | 198 | — | — | — | — | ||||||||||||||||||||||||
| Equity securities with readily determinable fair value not held for trading | 23,988 | 23,965 | 24,342 | 24,381 | 24,425 | ||||||||||||||||||||||||
| Federal Reserve Bank and Federal Home Loan Bank stock | 47,675 | 56,469 | 65,015 | 65,015 | 64,986 | ||||||||||||||||||||||||
| Securities | 1,359,240 | 1,375,292 | 1,372,567 | 1,468,796 | 1,674,811 | ||||||||||||||||||||||||
| Mortgage loans held for sale (at fair value) | 1,775 | 1,044 | — | — | — | ||||||||||||||||||||||||
| Loans held for investment, gross | 5,606,773 | 5,753,794 | 5,842,337 | 5,924,617 | 5,872,271 | ||||||||||||||||||||||||
| Less: Allowance for loan losses | 104,185 | 110,940 | 110,902 | 116,819 | 119,652 | ||||||||||||||||||||||||
| Loans held for investment, net | 5,502,588 | 5,642,854 | 5,731,435 | 5,807,798 | 5,752,619 | ||||||||||||||||||||||||
| Bank owned life insurance | 220,271 | 218,903 | 217,547 | 216,130 | 214,693 | ||||||||||||||||||||||||
| Premises and equipment, net | 108,708 | 109,071 | 109,990 | 126,895 | 128,327 | ||||||||||||||||||||||||
| Deferred tax assets, net | 13,516 | 15,607 | 11,691 | 16,206 | 15,647 | ||||||||||||||||||||||||
| Goodwill | 19,506 | 19,506 | 19,506 | 19,506 | 19,506 | ||||||||||||||||||||||||
| Accrued interest receivable and other assets (1) | 135,728 | 135,322 | 93,771 | 94,556 | 107,771 | ||||||||||||||||||||||||
| Total assets | $ | 7,532,844 | $ | 7,751,098 | $ | 7,770,893 | $ | 7,977,047 | $ | 8,130,723 | |||||||||||||||||||
| Liabilities and Stockholders' Equity | |||||||||||||||||||||||||||||
| Deposits | |||||||||||||||||||||||||||||
| Demand | |||||||||||||||||||||||||||||
| Noninterest bearing | $ | 1,065,622 | $ | 977,595 | $ | 872,151 | $ | 916,889 | $ | 956,351 | |||||||||||||||||||
| Interest bearing | 1,293,626 | 1,324,127 | 1,230,054 | 1,210,639 | 1,186,613 | ||||||||||||||||||||||||
| Savings and money market | 1,682,619 | 1,494,227 | 1,587,876 | 1,496,119 | 1,447,661 | ||||||||||||||||||||||||
| Time | 1,633,041 | 1,882,130 | 2,041,562 | 2,253,899 | 2,434,077 | ||||||||||||||||||||||||
| Total deposits | 5,674,908 | 5,678,079 | 5,731,643 | 5,877,546 | 6,024,702 | ||||||||||||||||||||||||
| Advances from the Federal Home Loan Bank | 808,614 | 1,050,000 | 1,050,000 | 1,050,000 | 1,050,000 | ||||||||||||||||||||||||
| Senior notes | 58,736 | 58,656 | 58,577 | 58,498 | 58,419 | ||||||||||||||||||||||||
| Junior subordinated debentures held by trust subsidiaries | 64,178 | 64,178 | 64,178 | 64,178 | 64,178 | ||||||||||||||||||||||||
| Accounts payable, accrued liabilities and other liabilities (1) | 127,340 | 115,171 | 83,074 | 97,292 | 103,226 | ||||||||||||||||||||||||
| Total liabilities | 6,733,776 | 6,966,084 | 6,987,472 | 7,147,514 | 7,300,525 | ||||||||||||||||||||||||
| Stockholders’ equity | |||||||||||||||||||||||||||||
| Class A common stock | 2,904 | 2,904 | 2,882 | 2,886 | 2,887 | ||||||||||||||||||||||||
| Class B common stock | 853 | 892 | 904 | 1,329 | 1,329 | ||||||||||||||||||||||||
| Additional paid in capital | 299,547 | 304,448 | 305,569 | 359,553 | 359,028 | ||||||||||||||||||||||||
| Retained earnings | 472,823 | 456,861 | 442,402 | 433,929 | 432,227 | ||||||||||||||||||||||||
| Accumulated other comprehensive income | 23,758 | 19,909 | 31,664 | 31,836 | 34,727 | ||||||||||||||||||||||||
| Total stockholders' equity before noncontrolling interest | 799,885 | 785,014 | 783,421 | 829,533 | 830,198 | ||||||||||||||||||||||||
| Noncontrolling interest | (817) | — | — | — | — | ||||||||||||||||||||||||
| Total stockholders' equity | 799,068 | 785,014 | 783,421 | 829,533 | 830,198 | ||||||||||||||||||||||||
| Total liabilities and stockholders' equity | $ | 7,532,844 | $ | 7,751,098 | $ | 7,770,893 | $ | 7,977,047 | $ | 8,130,723 | |||||||||||||||||||
__________
(1) As of June, 30 2021 and March 31, 2021, includes the effect of adopting ASU 2016-02 (Leases) in the first quarter of 2021.
23
Exhibit 7 - Loans
Loans by Type
The loan portfolio consists of the following loan classes:
| (in thousands) | June 30, 2021 | March 31, 2021 | December 31, 2020 | September 30, 2020 | June 30, 2020 | ||||||||||||||||||||||||
| Real estate loans | |||||||||||||||||||||||||||||
| Commercial real estate | |||||||||||||||||||||||||||||
| Non-owner occupied | $ | 1,699,876 | $ | 1,713,967 | $ | 1,749,839 | $ | 1,797,230 | $ | 1,841,075 | |||||||||||||||||||
| Multi-family residential | 658,022 | 722,783 | 737,696 | 853,159 | 823,450 | ||||||||||||||||||||||||
| Land development and construction loans | 361,077 | 351,502 | 349,800 | 335,184 | 284,766 | ||||||||||||||||||||||||
| 2,718,975 | 2,788,252 | 2,837,335 | 2,985,573 | 2,949,291 | |||||||||||||||||||||||||
| Single-family residential | 616,545 | 625,298 | 639,569 | 597,280 | 589,713 | ||||||||||||||||||||||||
| Owner occupied | 943,342 | 940,126 | 947,127 | 937,946 | 938,511 | ||||||||||||||||||||||||
| 4,278,862 | 4,353,676 | 4,424,031 | 4,520,799 | 4,477,515 | |||||||||||||||||||||||||
| Commercial loans | 1,003,411 | 1,104,594 | 1,154,550 | 1,197,156 | 1,247,455 | ||||||||||||||||||||||||
| Loans to financial institutions and acceptances | 13,672 | 16,658 | 16,636 | 16,623 | 16,597 | ||||||||||||||||||||||||
| Consumer loans and overdrafts | 310,828 | 278,866 | 247,120 | 190,039 | 130,704 | ||||||||||||||||||||||||
| Total loans | $ | 5,606,773 | $ | 5,753,794 | $ | 5,842,337 | $ | 5,924,617 | $ | 5,872,271 | |||||||||||||||||||
24
Non-Performing Assets
This table shows a summary of our non-performing assets by loan class, which includes non-performing loans and other real estate owned, or OREO, at the dates presented. Non-performing loans consist of (i) nonaccrual loans; (ii) accruing loans 90 days or more contractually past due as to interest or principal; and (iii) restructured loans that are considered TDRs.
| (in thousands) | June 30, 2021 | March 31, 2021 | December 31, 2020 | September 30, 2020 | June 30, 2020 | ||||||||||||||||||||||||
Non-Accrual Loans(1) | |||||||||||||||||||||||||||||
| Real Estate Loans | |||||||||||||||||||||||||||||
| Commercial real estate (CRE) | |||||||||||||||||||||||||||||
| Non-owner occupied | $ | 48,347 | $ | 8,515 | $ | 8,219 | $ | 8,289 | $ | 8,426 | |||||||||||||||||||
| Multi-family residential | 9,928 | 11,369 | 11,340 | 1,484 | — | ||||||||||||||||||||||||
| 58,275 | 19,884 | 19,559 | 9,773 | 8,426 | |||||||||||||||||||||||||
| Single-family residential | 7,174 | 10,814 | 10,667 | 11,071 | 7,975 | ||||||||||||||||||||||||
| Owner occupied | 11,277 | 12,527 | 12,815 | 14,539 | 11,828 | ||||||||||||||||||||||||
| 76,726 | 43,225 | 43,041 | 35,383 | 28,229 | |||||||||||||||||||||||||
Commercial loans (2) | 43,876 | 45,282 | 44,205 | 50,991 | 48,961 | ||||||||||||||||||||||||
| Consumer loans and overdrafts | 198 | 270 | 233 | 104 | 70 | ||||||||||||||||||||||||
| Total Non-Accrual Loans | $ | 120,800 | $ | 88,777 | $ | 87,479 | $ | 86,478 | $ | 77,260 | |||||||||||||||||||
Past Due Accruing Loans(3) | |||||||||||||||||||||||||||||
| Real Estate Loans | |||||||||||||||||||||||||||||
| Commercial real estate (CRE) | |||||||||||||||||||||||||||||
| Non-owner occupied | $ | — | $ | 743 | $ | — | $ | — | $ | — | |||||||||||||||||||
| Single-family residential | 20 | — | — | 1 | — | ||||||||||||||||||||||||
| Owner occupied | — | — | 220 | — | — | ||||||||||||||||||||||||
| Commercial | 295 | — | — | — | — | ||||||||||||||||||||||||
| Consumer loans and overdrafts | 4 | 3 | 1 | 1 | — | ||||||||||||||||||||||||
| Total Past Due Accruing Loans | 319 | 746 | 221 | 2 | — | ||||||||||||||||||||||||
| Total Non-Performing Loans | 121,119 | 89,523 | 87,700 | 86,480 | 77,260 | ||||||||||||||||||||||||
| Other Real Estate Owned | 400 | 400 | 427 | 42 | 42 | ||||||||||||||||||||||||
| Total Non-Performing Assets | $ | 121,519 | $ | 89,923 | $ | 88,127 | $ | 86,522 | $ | 77,302 | |||||||||||||||||||
__________________
(1) Includes loan modifications that met the definition of TDRs which may be performing in accordance with their modified loan terms. As of June 30, 2021, March 31, 2021, December 31, 2020, September 30, 2020 and June 30, 2020, non-performing TDRs include $9.6 million, $9.8 million, $8.4 million, $9.0 million and $9.3 million, respectively, in a multiple loan relationship to a South Florida borrower.
(2) As of June 30, 2021, March 31, 2021, December 31, 2020, September 30, 2020 and June 30, 2020, includes $19.6 million, $19.6 million, $19.6 million, $19.6 million, and $39.8 million, respectively, in a commercial relationship placed in nonaccrual status during the second quarter of 2020. During the third quarter of 2020, the Company charged off $19.3 million against the allowance for loan losses as result of the deterioration of this commercial relationship.
(3) Loans past due 90 days or more but still accruing.
25
Loans by Credit Quality Indicators
This table shows the Company’s loans by credit quality indicators. We have no purchased credit-impaired loans.
| June 30, 2021 | March 31, 2021 | June 30, 2020 | ||||||||||||||||||||||||||||||||||||||||||
| (in thousands) | Special Mention | Substandard | Doubtful | Total (1) | Special Mention | Substandard | Doubtful | Total (1) | Special Mention | Substandard | Doubtful | Total (1) | ||||||||||||||||||||||||||||||||
| Real Estate Loans | ||||||||||||||||||||||||||||||||||||||||||||
| Commercial Real Estate (CRE) | ||||||||||||||||||||||||||||||||||||||||||||
| Non-owner occupied | $ | 32,858 | $ | 36,040 | $ | 12,306 | $ | 81,204 | $ | 45,206 | $ | 5,684 | $ | 3,576 | $ | 54,466 | $ | 2,127 | $ | 7,242 | $ | 1,936 | $ | 11,305 | ||||||||||||||||||||
| Multi-family residential | — | 9,928 | — | 9,928 | — | 11,369 | — | 11,369 | — | — | — | — | ||||||||||||||||||||||||||||||||
| Land development and construction loans | — | — | — | — | — | — | — | — | 7,196 | — | — | 7,196 | ||||||||||||||||||||||||||||||||
| 32,858 | 45,968 | 12,306 | 91,132 | 45,206 | 17,053 | 3,576 | 65,835 | 9,323 | 7,242 | 1,936 | 18,501 | |||||||||||||||||||||||||||||||||
| Single-family residential | — | 7,194 | — | 7,194 | — | 10,814 | — | 10,814 | — | 8,127 | — | 8,127 | ||||||||||||||||||||||||||||||||
| Owner occupied | 19,456 | 11,375 | — | 30,831 | 21,045 | 12,627 | — | 33,672 | 7,884 | 14,142 | — | 22,026 | ||||||||||||||||||||||||||||||||
| 52,314 | 64,537 | 12,306 | 129,157 | 66,251 | 40,494 | 3,576 | 110,321 | 17,207 | 29,511 | 1,936 | 48,654 | |||||||||||||||||||||||||||||||||
| Commercial loans (2) | 40,151 | 23,055 | 22,546 | 85,752 | 43,313 | 21,045 | 25,917 | 90,275 | 5,664 | 35,211 | 20,822 | 61,697 | ||||||||||||||||||||||||||||||||
| Consumer loans and overdrafts | — | 201 | — | 201 | — | 298 | — | 298 | — | 81 | — | 81 | ||||||||||||||||||||||||||||||||
| $ | 92,465 | $ | 87,793 | $ | 34,852 | $ | 215,110 | $ | 109,564 | $ | 61,837 | $ | 29,493 | $ | 200,894 | $ | 22,871 | $ | 64,803 | $ | 22,758 | $ | 110,432 | |||||||||||||||||||||
__________
(1) There were no loans categorized as “Loss” as of the dates presented.
(2) Loan balances as of June 30, 2021, March 31, 2021 and June 30, 2020, include $19.6 million, $19.6 million and $39.8 million, respectively, in a commercial relationship placed in nonaccrual status and downgraded during the second quarter of 2020. As of June 30, 2021, March 31, 2021 and June 30, 2020, Substandard loans include $7.3 million, $7.3 million and $20.5 million, respectively, and doubtful loans include $12.3 million, $12.3 million and $19.3 million, respectively, related to this commercial relationship. During the third quarter of 2020, the Company charged off $19.3 million against the allowance for loan losses as result of the deterioration of this commercial relationship.
Exhibit 8 - Deposits by Country of Domicile
This table shows the Company’s deposits by country of domicile of the depositor as of the dates presented.
| (in thousands) | June 30, 2021 | March 31, 2021 | December 31, 2020 | September 30, 2020 | June 30, 2020 | ||||||||||||||||||||||||
| Domestic | $ | 3,140,541 | $ | 3,175,522 | $ | 3,202,936 | $ | 3,310,343 | $ | 3,432,971 | |||||||||||||||||||
| Foreign: | |||||||||||||||||||||||||||||
| Venezuela | 2,075,658 | 2,088,519 | 2,119,412 | 2,169,621 | 2,202,340 | ||||||||||||||||||||||||
| Others | 458,709 | 414,038 | 409,295 | 397,582 | 389,391 | ||||||||||||||||||||||||
| Total foreign | 2,534,367 | 2,502,557 | 2,528,707 | 2,567,203 | 2,591,731 | ||||||||||||||||||||||||
| Total deposits | $ | 5,674,908 | $ | 5,678,079 | $ | 5,731,643 | $ | 5,877,546 | $ | 6,024,702 | |||||||||||||||||||
26