CONTACTS: | ||
Investors | ||
(305) 460-8728 | ||
Media | ||
(305) 441-8414 | ||
AMERANT BANCORP INC. REPORTS FOURTH QUARTER AND FULL-YEAR RESULTS
2019 Full-Year Net Income Up 12.0% Compared to 2018
Fourth Quarter Net Income Down 6.6% Compared to Last Year
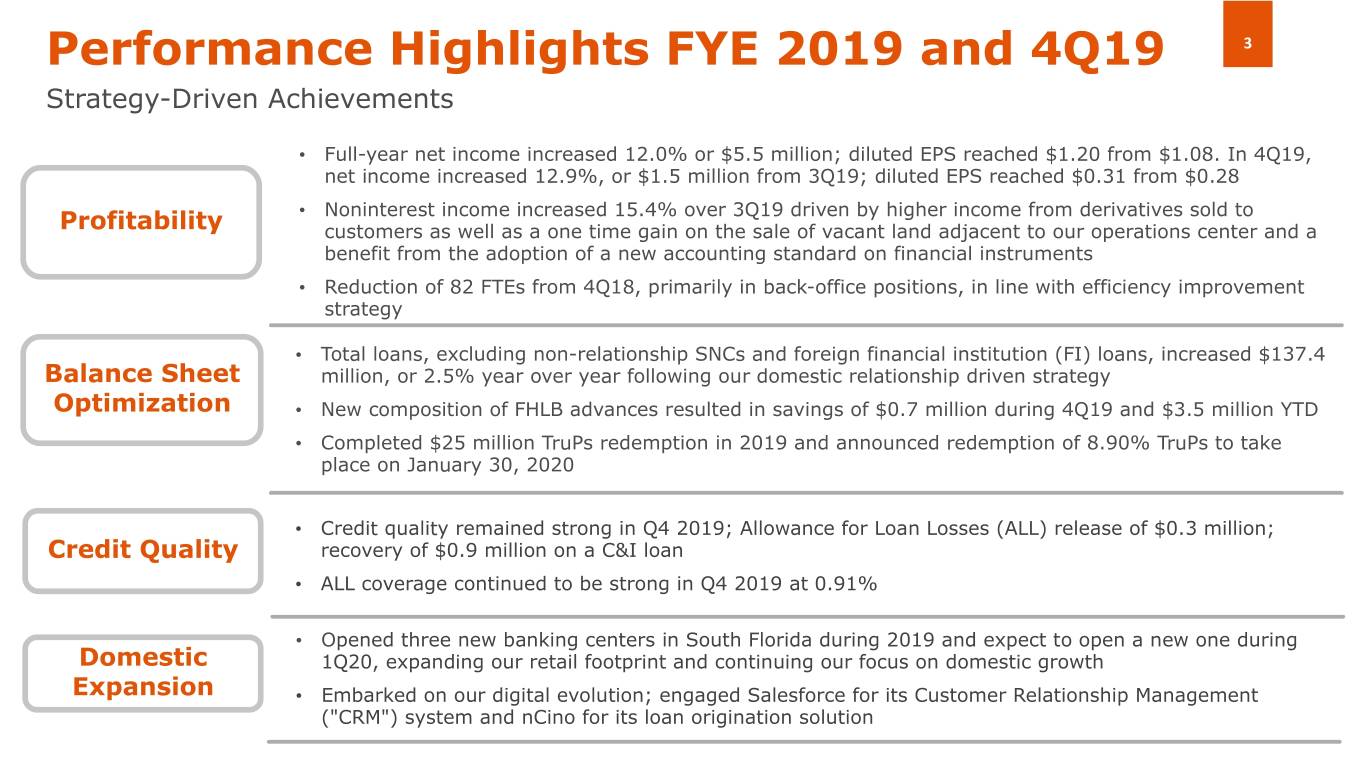
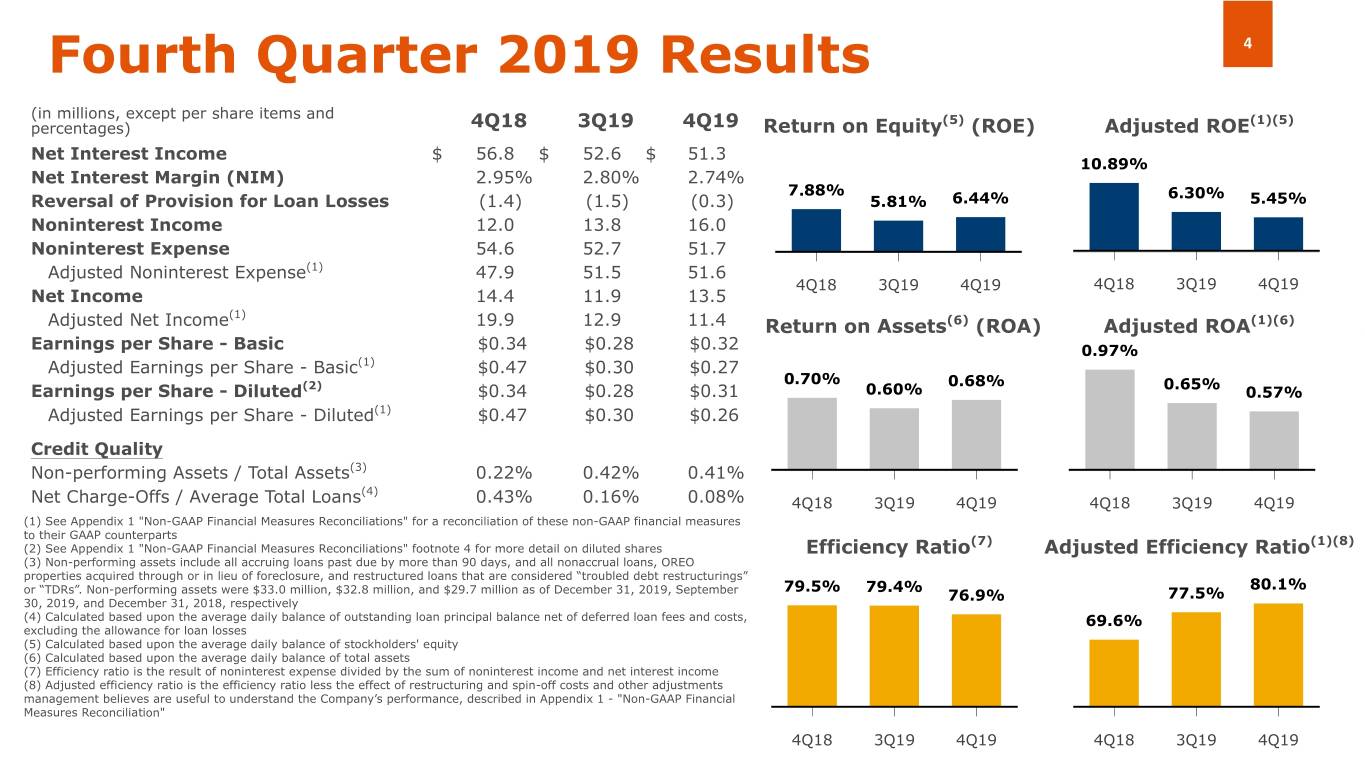
CORAL GABLES, FLORIDA, January 30, 2020. Amerant Bancorp Inc. (NASDAQ: AMTB and AMTBB) (the “Company” or “Amerant”) today reported full-year 2019 net income of $51.3 million, or $1.20 per diluted share, compared to $45.8 million, or $1.08 per diluted share, for the full-year 2018. Net income in the fourth quarter of 2019 was $13.5 million, 6.6% lower than the $14.4 million reported in the fourth quarter of 2018. Net income per diluted share was $0.31 in the fourth quarter of 2019, down 8.8% compared to $0.34 per diluted share in the fourth quarter of 2018.
Return on assets (“ROA”) and return on equity (“ROE”) were 0.65% and 6.43% for the full-year 2019, respectively, compared to 0.55% and 6.29%, respectively, for the full-year 2018. Annualized ROA and ROE were 0.68% and 6.44%, respectively, in the fourth quarter of 2019, compared to 0.70% and 7.88%, respectively, in the fourth quarter of 2018.
Millar Wilson, Vice Chairman and Chief Executive Officer, remarked, “2019 was a milestone year as Amerant completed its first full year as a publicly-traded company. We began the year focused on carrying out a number of initiatives, including a broad transformation, rebranding, workforce realignment, and profitability and efficiency improvements, which I am proud to say have been successful. Our team also did a fantastic job this year in expanding Amerant’s footprint in South Florida, opening three new banking centers in vibrant communities, and readying the opening of another during the first quarter of 2020, adding to our stronghold in South Florida.”
Mr. Wilson added, “The fourth quarter capped off a solid year for Amerant. We saw strong credit quality and a double-digit increase in noninterest income in the fourth quarter of 2019 compared to the same period a year ago. Our business focus underwent a number of meaningful changes in 2019, notably the run-off of low-yielding foreign financial institution and non-relationship Shared National Credits, the phase out of Amerant’s legacy credit card product and introduction of credit card referral programs, and the streamlining of important processes such as account openings at our banking centers, commercial loan origination and online capture of certificate of deposits. Finally, we embarked on our digital evolution and started taking actions related to the use of technologies to support our business strategies, including preparing for the adoption of a new customer relationship management system and a more integrated loan origination solution. All of these realignments were made with the future of Amerant in mind.
1
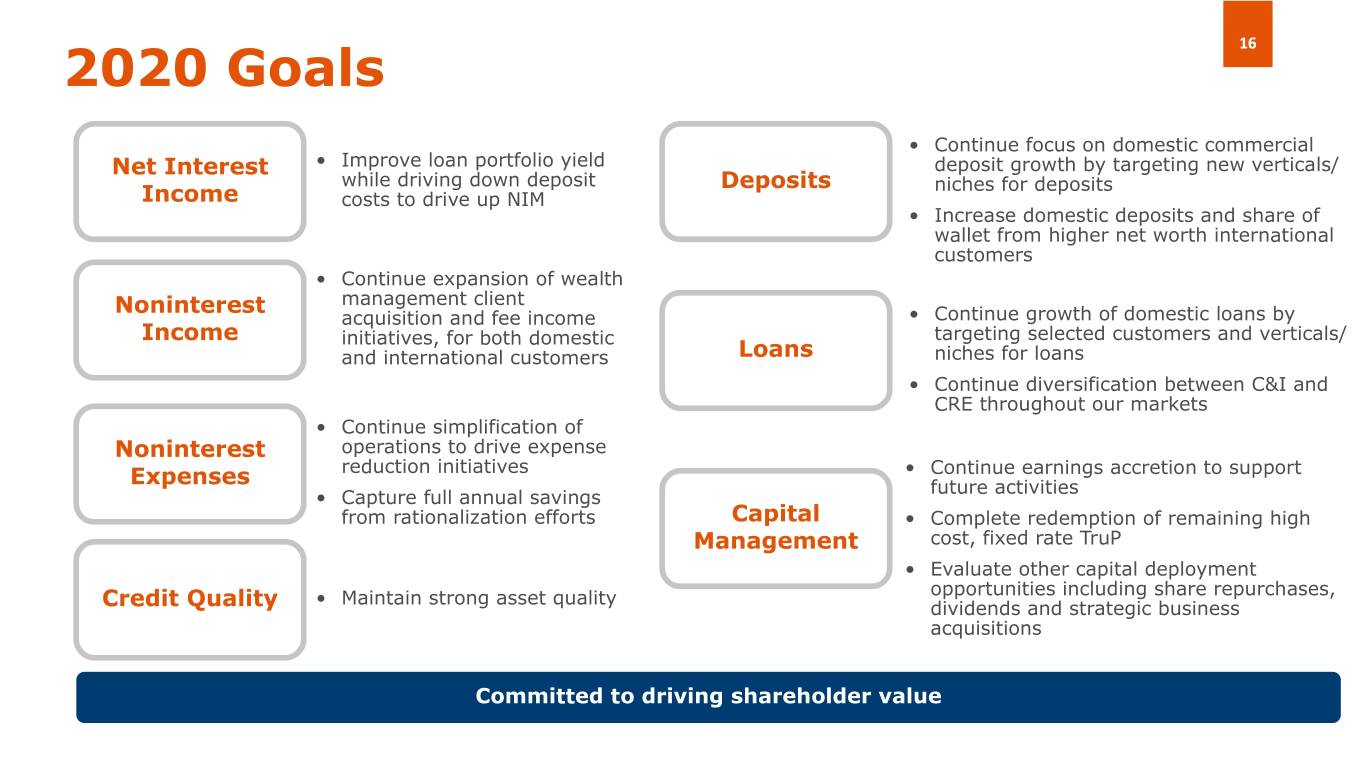
Our strong close in 2019 positions us well for 2020, as we continue to focus on growing domestic loans, improving profitability and efficiency, and navigating a low interest rate environment and strong competition.”
Summary Results
The summary results of the fourth quarter and full-year 2019 include:
• | Net income of $13.5 million, down 6.6% from $14.4 million in the fourth quarter of 2018. Net income for the full-year 2019 was $51.3 million, up 12.0% compared to $45.8 million in full-year 2018. |
• | Net interest income was $51.3 million, down 9.7% compared to $56.8 million in the fourth quarter of 2018 mainly due to lower market rates and a spread compression environment, affecting our earnings assets, coupled with higher deposit costs, mainly due to the repricing of lower cost deposits throughout the first three quarters of 2019 at higher rates. Net interest income for the full-year 2019 was $213.1 million, down 2.7% compared to $219.0 million in 2018. The net interest margin (“NIM”) for full-year 2019 improved to 2.85% from 2.78%, primarily attributed to an improved loan portfolio mix, including the planned strategic run-off of foreign financial institution (“FI”) loans and non-relationship Shared National Credits (“SNCs”), partially offset by higher costs of deposits. |
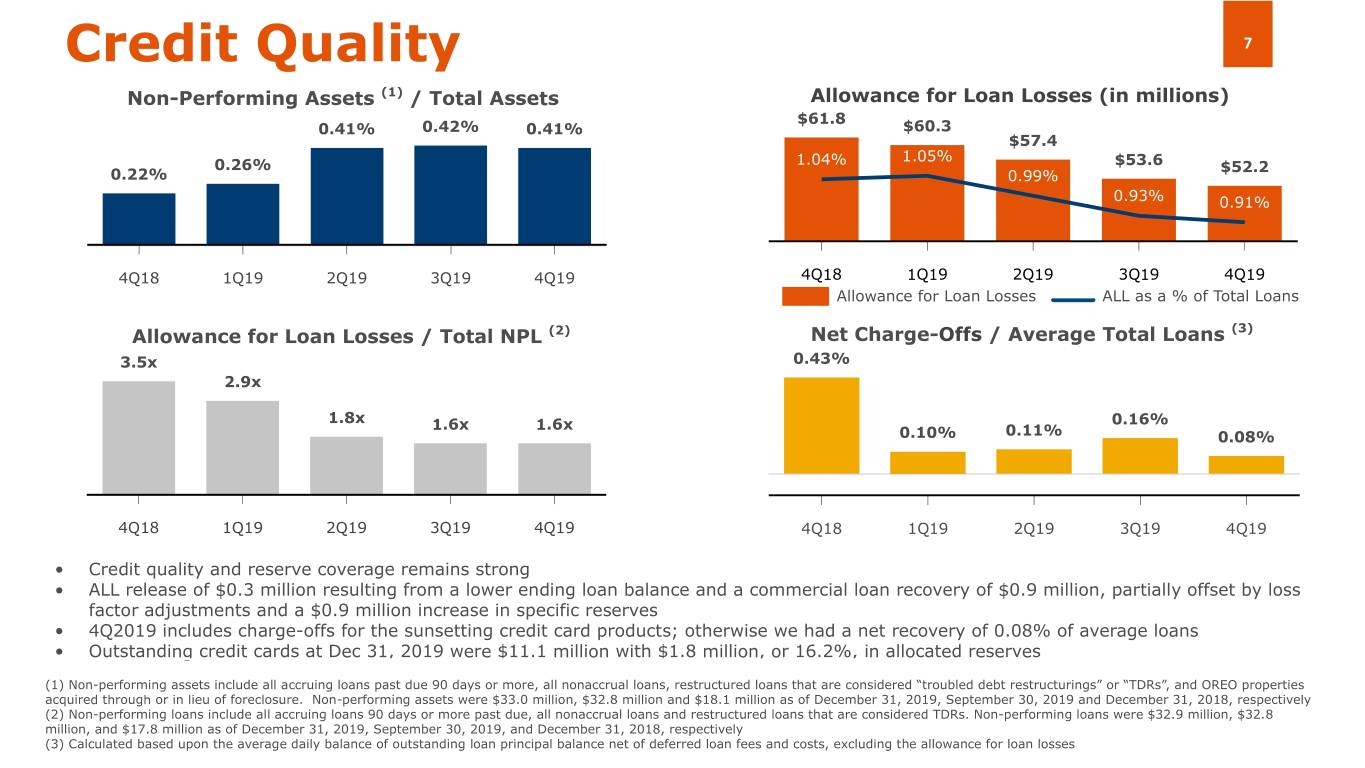
• | Credit quality remained strong during the fourth quarter of 2019. The Company released $0.3 million from the allowance for loan losses (“ALL”) during the fourth quarter of 2019, compared to a $1.4 million release in the fourth quarter of 2018. The ratio of ALL to total loans was 0.91% as of December 31, 2019, down from 1.04% at the end of 2018. The ratio of net charge-offs to average total loans in the fourth quarter of 2019 was 0.08%, down from 0.43% in the fourth quarter of 2018. |
• | Noninterest income was $16.0 million, up 33.3% compared to $12.0 million in the fourth quarter of 2018, and $57.1 million in the full-year 2019, up 6.0% from $53.9 million in 2018, driven by the gain on sale of vacant land adjacent to our Beacon operations center (“vacant Beacon land”), and a significant increase in fees from derivative contracts sold to loan customers. Also included in the quarter was a $0.7 million benefit from the adoption of a new Accounting Standard Update (“ASU”) applicable to marketable equity securities. |
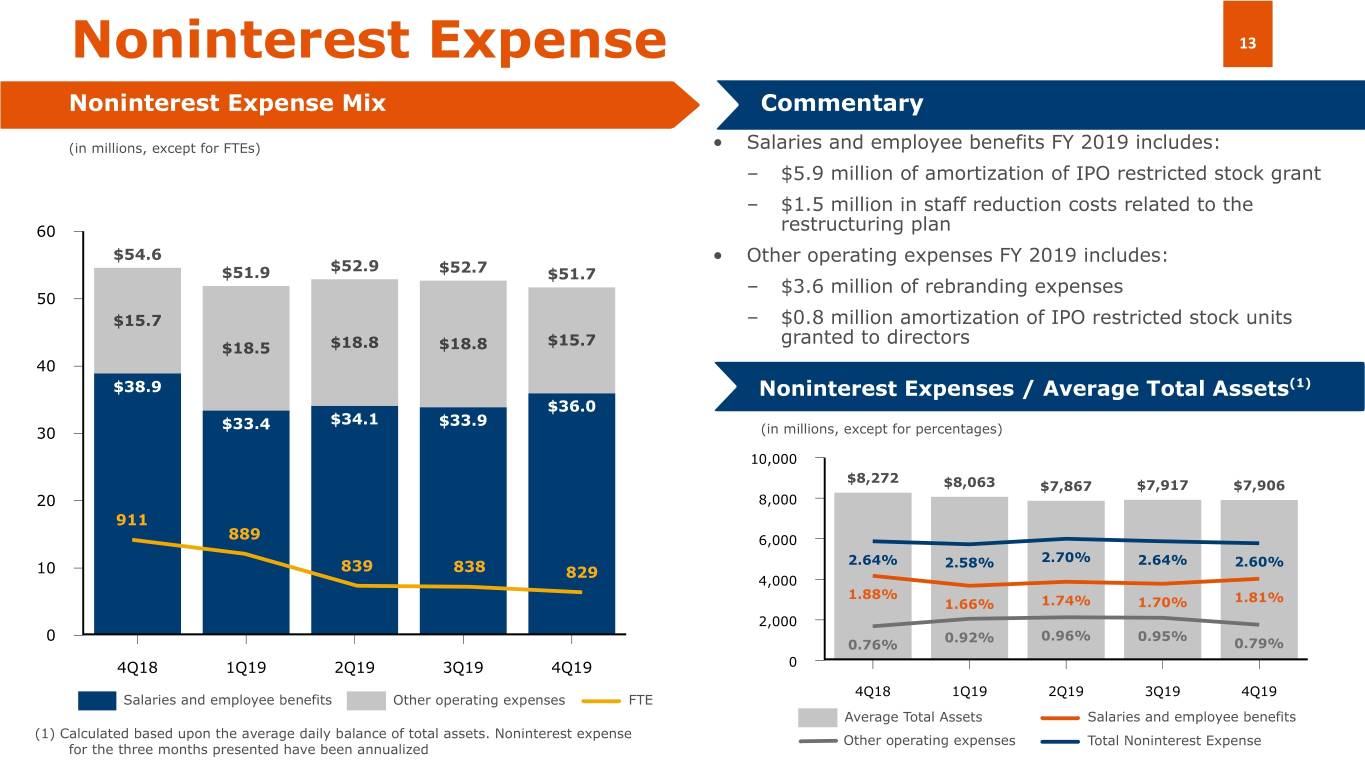
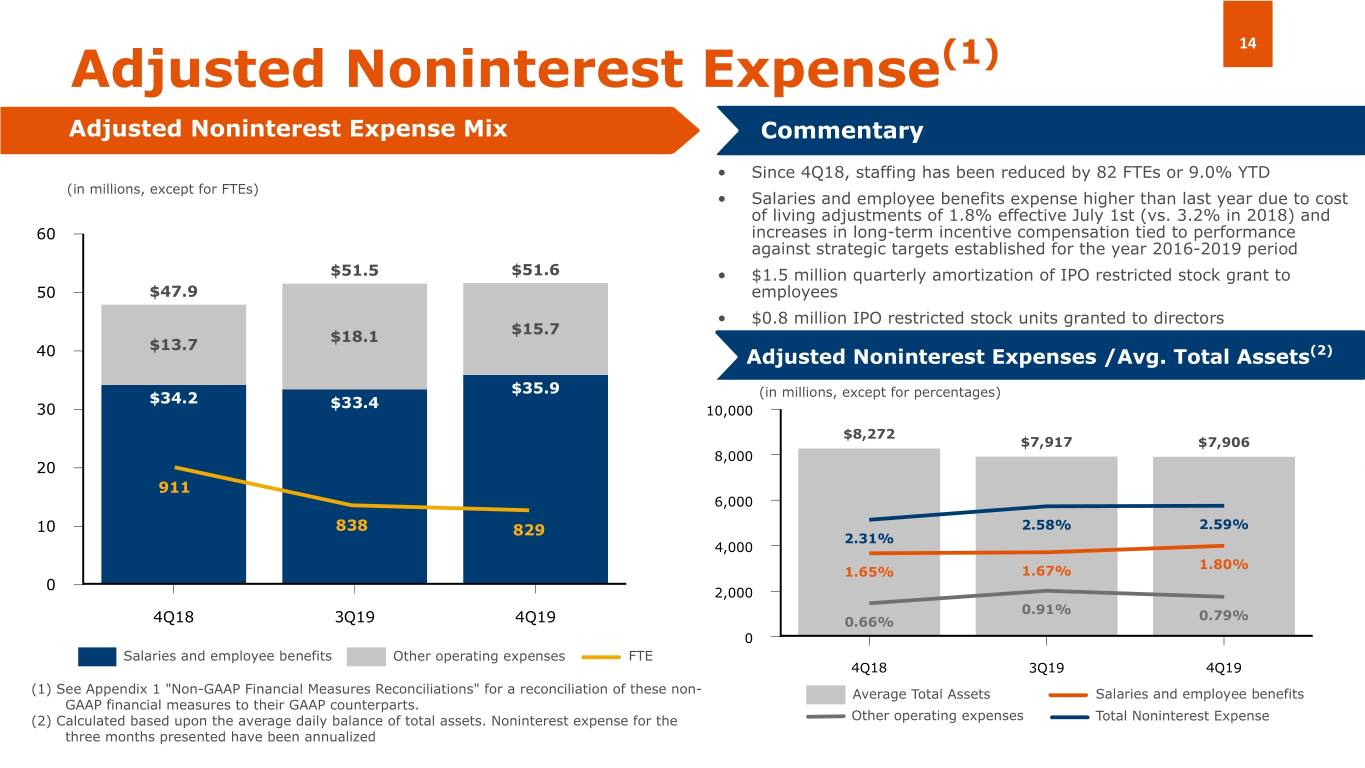
• | Noninterest expense was $51.7 million, down 5.3% compared to $54.6 million in the fourth quarter of 2018. Noninterest expense was $209.3 million in the full-year 2019, down 2.6% from $215.0 million in 2018. Fourth quarter 2019 noninterest expense, compared to the fourth quarter of 2018, includes an additional compensation expense of $1.5 million ($5.9 million year-to-date) related to the amortization of restricted stock awards granted in connection with the Company’s initial public offering (“IPO”) in 2018. Adjusted noninterest expense was $51.6 million in the fourth quarter of 2019, up 7.8% from $47.9 million in the fourth quarter of 2018, primarily due to the compensation expense associated with the 2018 IPO, an adjustment to the cost of our Long-Term Incentive Plan (“LTIP”) and the increase of salaries due to cost of living adjustment, partially offset by the significant staff reductions during the year. Adjusted noninterest expense primarily excludes expenses associated with restructuring activities, including rebranding and staff reduction expenses. In the fourth quarter of 2019, these expenses were only $0.1 million of staff reduction costs compared to total restructuring costs of $6.4 million in the fourth quarter of 2018. Fourth quarter 2018 also included $0.4 million |
2
of spin-off costs. Adjusted noninterest expense for the full-year 2019 was $204.3 million, up 1.2% compared to $201.9 million for 2018.
• | The effective tax rate for the fourth quarter of 2019 was 14.73% and 19.83% for the full-year. The effective tax rate is lower than the statutory tax rate mainly as a result of fourth quarter true-up adjustments after completion of the 2018 tax return filings and a tax windfall benefit associated to the vesting of stock-based compensation in 2019. |
• | The efficiency ratio was 77.5% (76.4% adjusted for restructuring costs and a one-time gain on sale of land) for the full-year 2019, compared to 78.8% (74.0% adjusted for restructuring costs and spin-off costs) for 2018. |
• | Stockholders’ book value per common share increased to $19.35 for the full-year 2019, representing an 11.8% improvement compared to $17.31 for 2018. Tangible book value per common share rose to $18.84, a 12.0% improvement compared to $16.82 at year-end 2018. |
Loans and Deposits
In the fourth quarter of 2019, we continued to focus on providing quality banking products and services and fostering stronger relationships with customers and communities across our growing footprint.
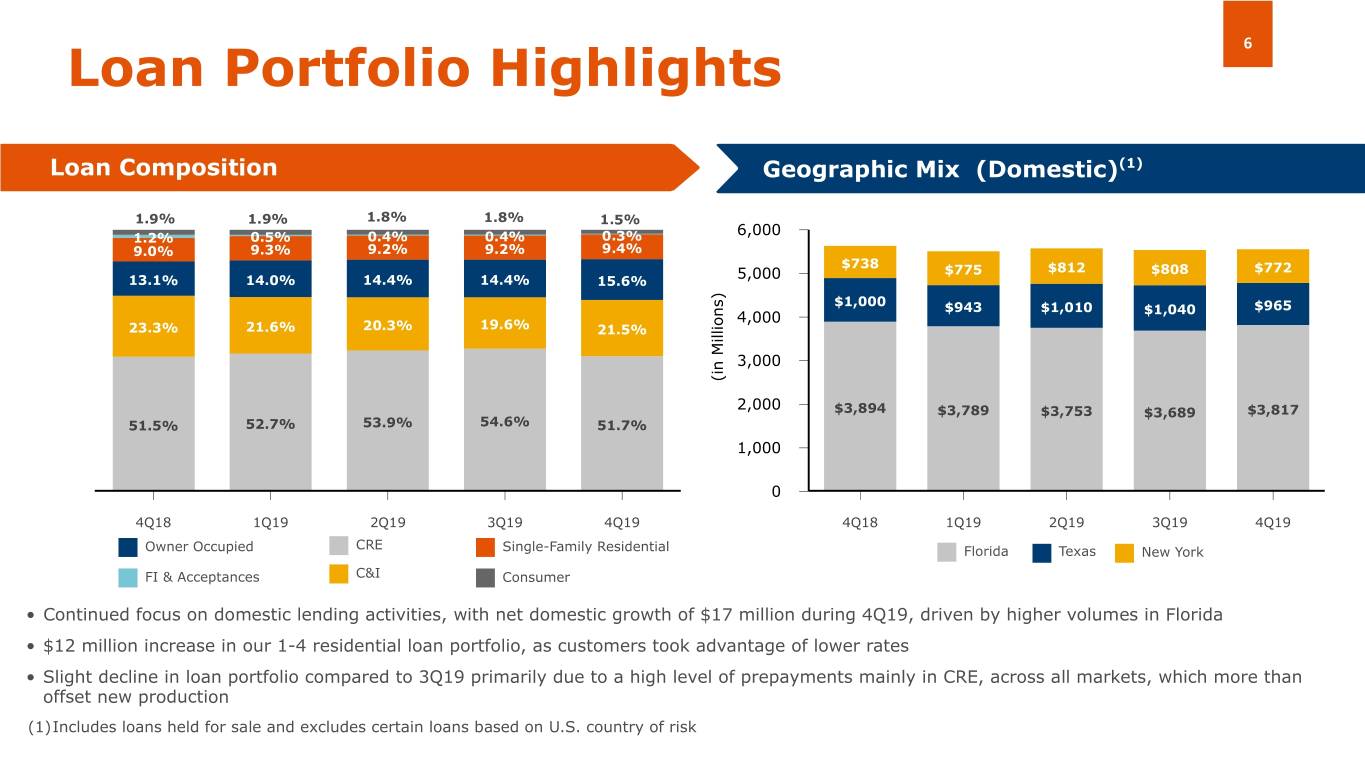
Total loans at December 31, 2019 were $5.7 billion, down 3.0% compared to 2018. As we have explained in previous periods, the net decline in our loan balance was mainly driven by the completion of our strategic run-off of foreign FI loans and sales of non-relationship SNCs. This strategic decline and higher loan prepayments during the year were partially offset by a $117 million increase in owner occupied loans. Excluding the run-off of non-relationship SNCs, domestic loans grew by 3.7% during the year, primarily from relationship loans. While we successfully exited from non-strategic loans more rapidly than originally anticipated, we remained focused on capturing a larger share of relationship loans with their added potential to generate customer deposits as well as wealth management business.
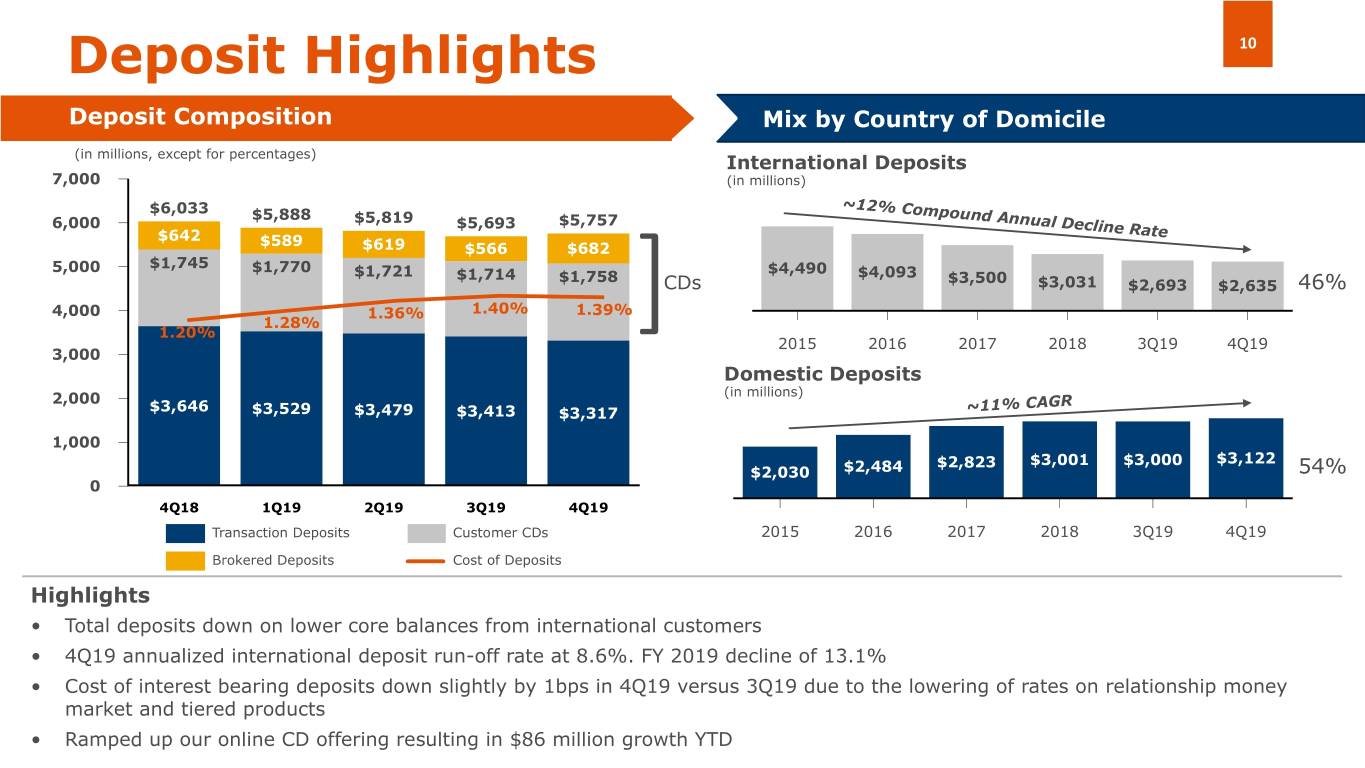
Total deposits at December 31, 2019 were $5.8 billion, down 4.6% compared to 2018. Foreign deposits declined 13.1% from 2018 to 2019, and 8.6% annualized during the fourth quarter. Foreign deposits remained pressured mainly by the high level of deposit utilization from our Venezuelan customers to fund everyday expenses, as the dollarization of the Venezuelan economy continued, and other activities such as buying homes abroad. In an effort to offset this run-off in foreign deposits, Amerant rolled out certificate of deposit (“CD”) campaigns designed to target our Venezuelan customers and capture greater share of wallet as well as a number of strategies to capture more domestic deposits and provide a better banking experience for all our customers. For example, we started providing access to Zelle®, a popular digital-payment platform that makes it easier for our personal banking clients to send and receive small sums of money, typically within minutes. We also ramped up our online CD offering outside of our natural footprint. Domestic deposits increased $120.5 million this year, from which $86.3 million were in online deposits. Also, we increased our brokered deposits by $116.0 million during the quarter and $38.2 million compared to year-end 2018. As we continue to expand our out-of-footprint deposit gathering, we expect to
3
reduce our brokered deposits. Importantly, we remain focused on improving the customer journey and increasing share of wallet of our core customers through expanded customer contact efforts.
During the fourth quarter of 2019, we expanded our footprint across South Florida with the opening of two new banking centers, one in Miami Lakes (Miami-Dade County) and another in Boca Raton (Palm Beach County). We are also nearing completion of our third banking center in Palm Beach County. These new locations reflect Amerant’s vision of the “banking centers of the future,” featuring smaller square footage, enhanced technology and a more focused customer service approach.
Net Interest Income and Net Interest Margin
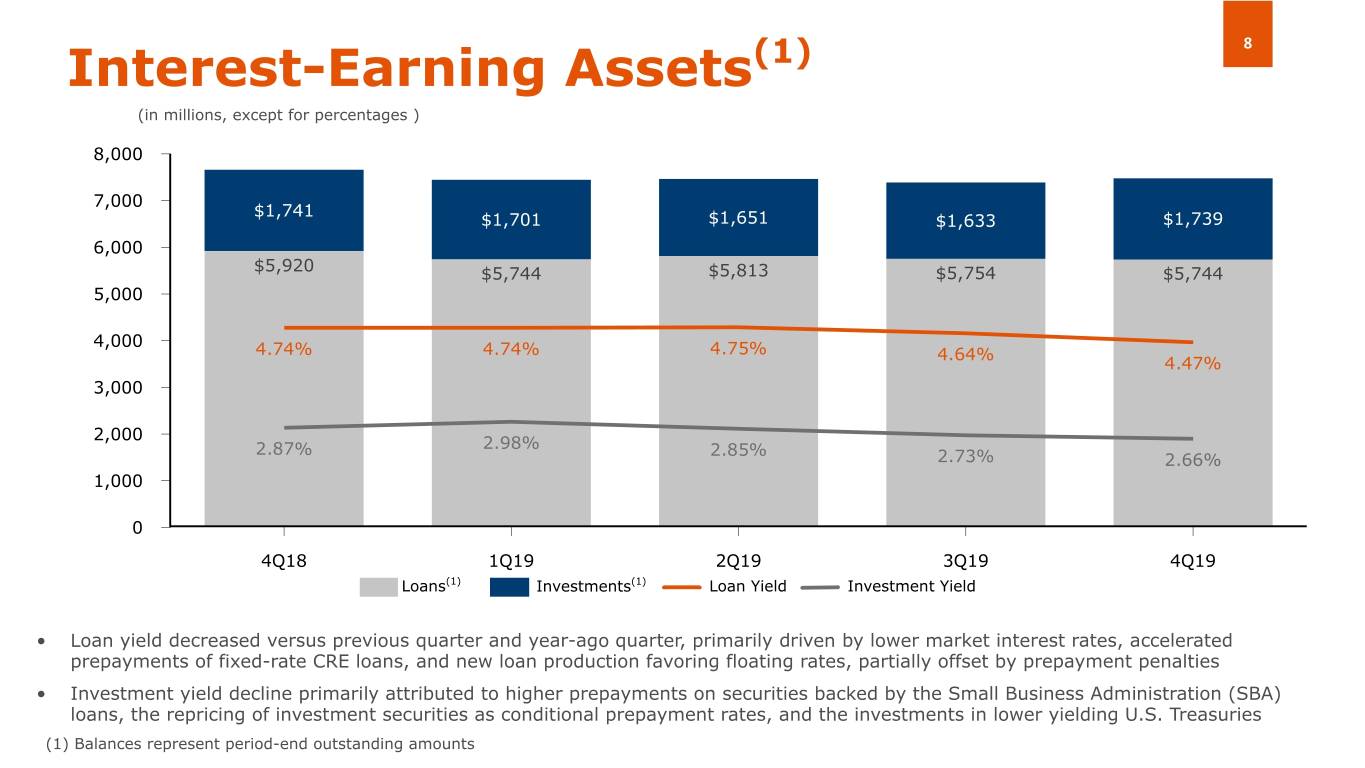
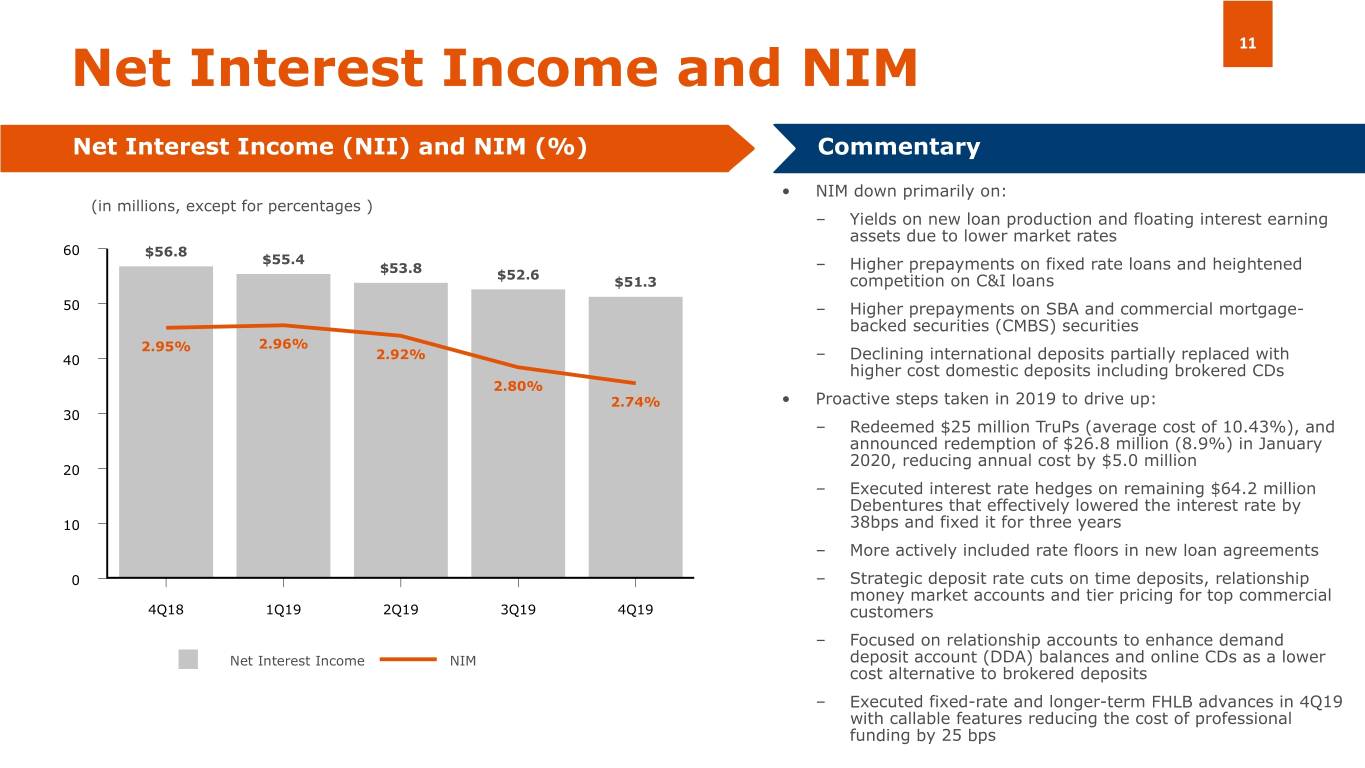
Fourth quarter 2019 net interest income was $51.3 million, down 9.7% compared to $56.8 million in the fourth quarter of 2018. This was primarily due to the planned strategic run-off of foreign FI and non-relationship SNC loans throughout the first three quarters of 2019, as well as lower market rates and an increasingly more competitive rate spread environment. Furthermore, Amerant’s cost of money market deposits as well as time deposits was higher in the fourth quarter of 2019 than in the fourth quarter of 2018, primarily driven by the replacement of less expensive foreign deposits with higher-cost domestic deposits, including brokered CDs, and the recomposition of money market deposits to promotional products within the existing portfolio. Notwithstanding this, our relationship money market accounts had a lower average rate this quarter than in the year-ago period. The net interest margin for the fourth quarter of 2019 was 2.74%, a decrease of 21 basis points compared to the fourth quarter of 2018, driven primarily by earning assets repricing at lower rates, the replacement of the foreign deposits with higher cost domestic deposits and higher money market and time deposit costs.
Compared to third quarter 2019, net interest income declined by $1.3 million or 2.5% mainly due to lower yields on average interest-earning assets. This decline was partially offset by $1.1 million earned in loan prepayment penalties, lower cost of professional funding and lower deposit costs, especially in relationship money market and tiered products. During the fourth quarter of 2019, the Company continued taking measures to counteract the pressure on NIM.
Net interest income for the full-year 2019 was $213.1 million, down 2.7% compared to $219.0 million in full-year 2018. The decline was mainly due to higher deposit costs, mostly related to time and money market deposits, as an increasing amount of foreign deposits were replaced by more expensive domestic deposits throughout the year. The net interest margin for the full-year 2019 was 2.85%, an increase of 7 basis points from full-year 2018, driven by higher average rates on interest-earning assets in the first half of 2019 as well as Amerant’s focus on growing higher-yielding domestic relationship-based loans.
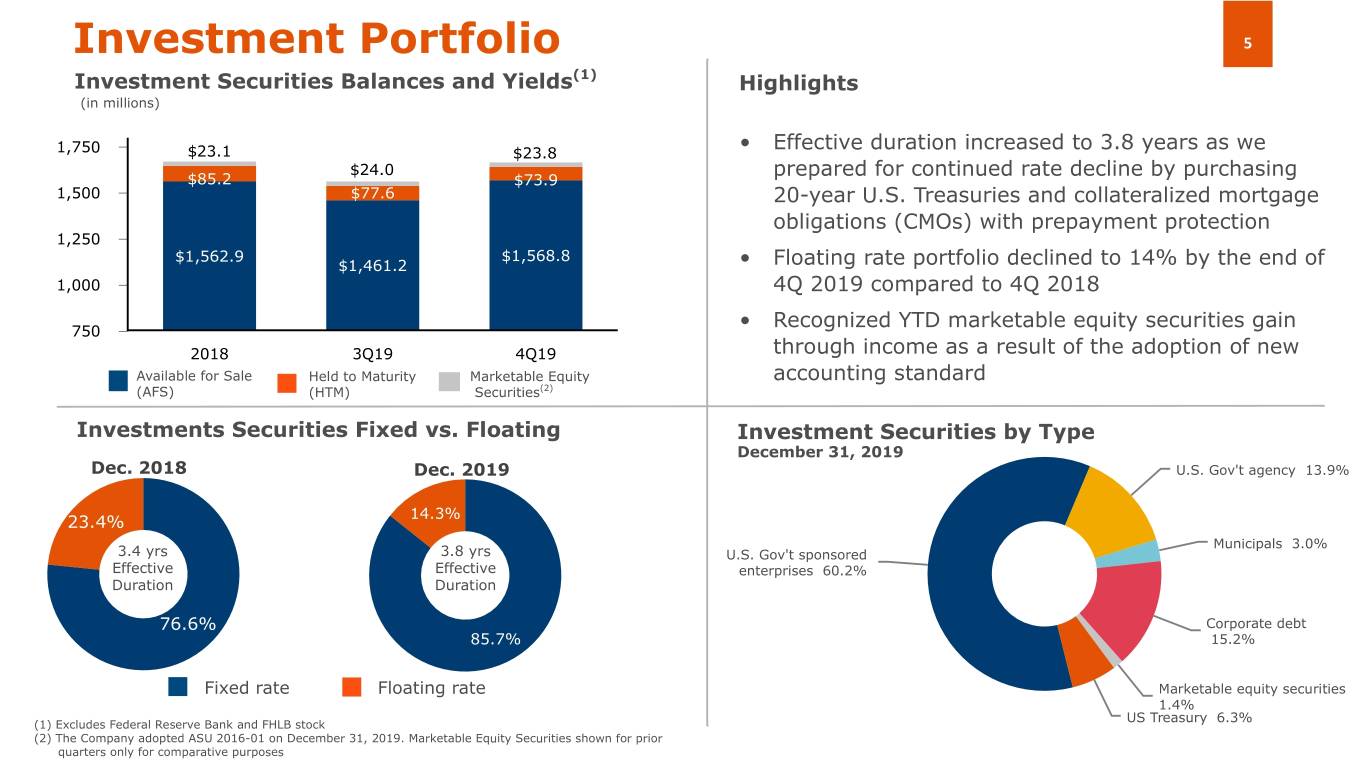
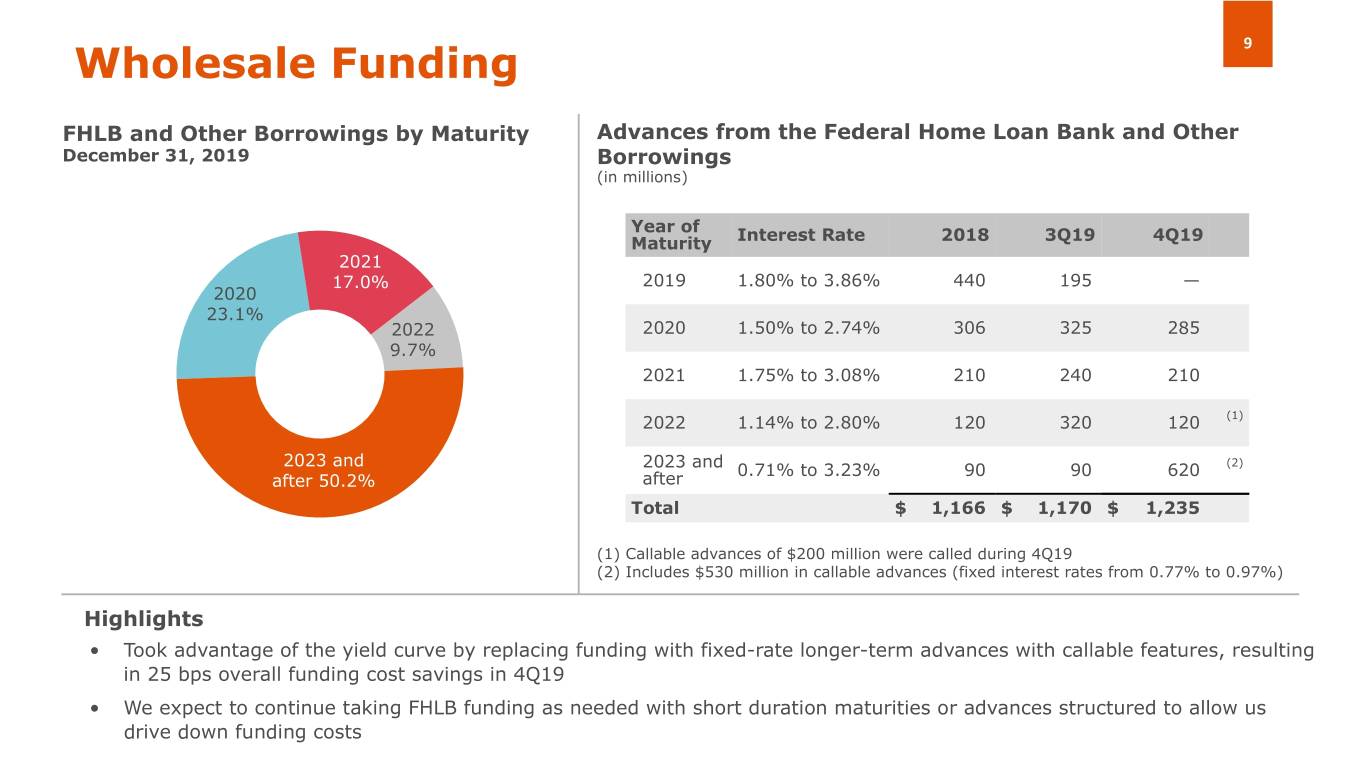
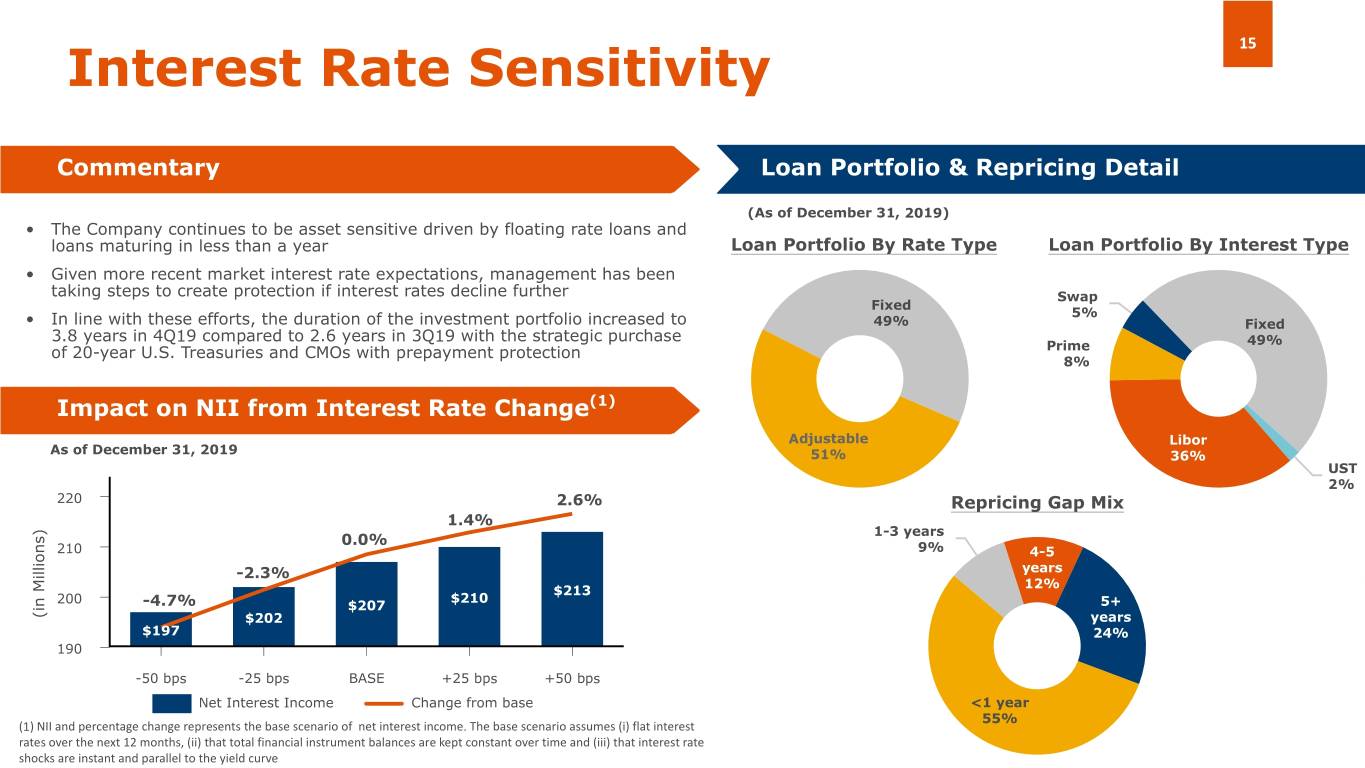
Our net interest income and net interest margin were pressured in the fourth quarter of 2019 as the full effect of interest rate cuts was felt. Against a reduced rate backdrop and trade uncertainty, Amerant and the entire banking industry faced a number of headwinds such as heightened competition for commercial and industrial loans (C&I), increases in earning-assets prepayments and the repricing of the floating-rate securities and loans at lower rates. To counteract the effect of lower rates, in the fourth quarter of 2019 the Company more actively sought interest rate floors in loan production. On the funding side, the Company reduced its rates for time deposits and relationship money market accounts and focused on relationship transactional accounts to enhance demand deposit account ("DDA") balances. We also continued to take advantage of the yield curve
4
by taking fixed-rate, longer-term, Federal Home Loan Bank (“FHLB”) advances with callable features resulting in a 34 basis point interest margin savings compared to the third quarter of 2019, and 54 basis point savings compared to the fourth quarter of 2018. Moreover, as previously announced, today the Company will redeem its remaining fixed-rate trust preferred securities (TruPs) and related junior subordinated debt, which will further reduce our annual interest expense by approximately $2.4 million, adding to the $2.6 million annual cost savings from the two previous redemptions.
Noninterest income
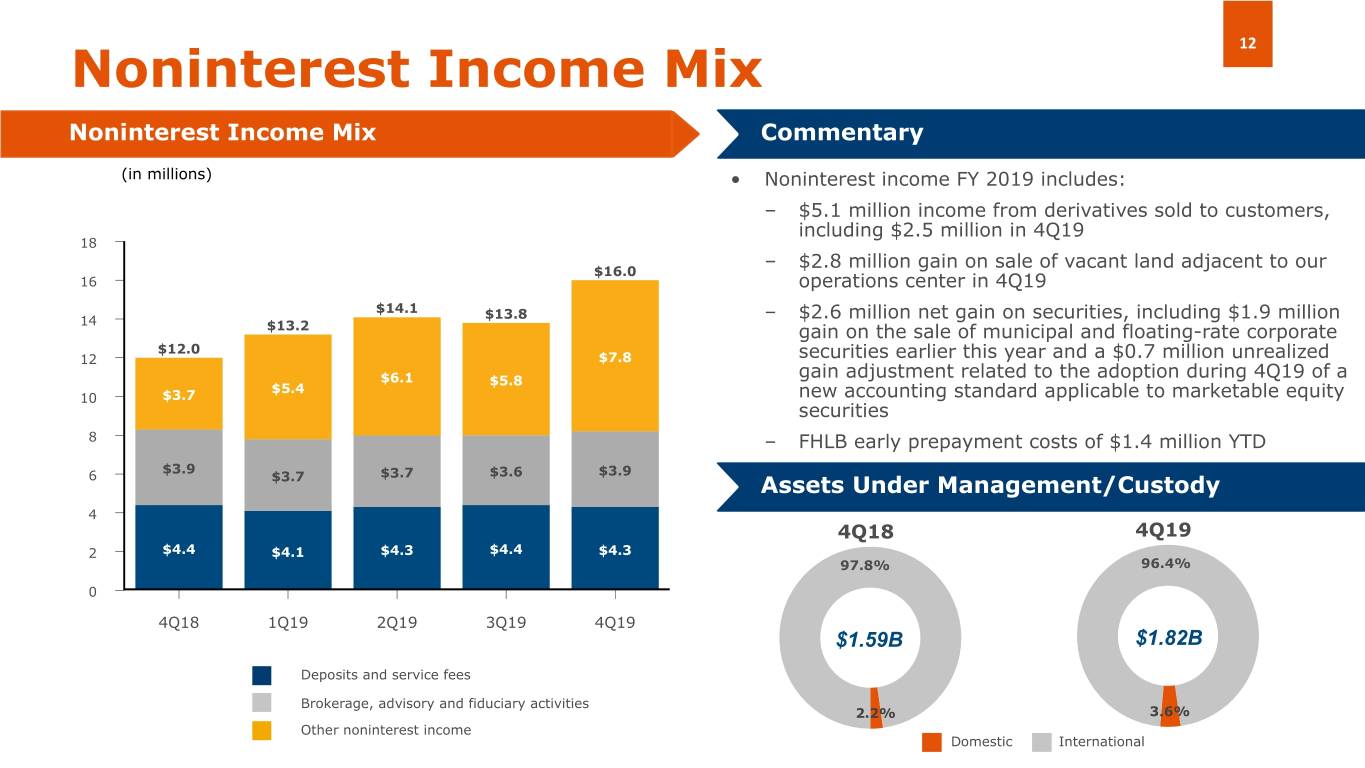
In the fourth quarter of 2019, noninterest income was $16.0 million, up $4.0 million or 33.3% compared to the fourth quarter of 2018. This improvement was driven by a $2.8 million gain on sale of the vacant Beacon land and $2.5 million in income from derivative contracts sold to loan customers. Noninterest income also included an approximately $0.7 million gain from the adoption of the ASU applicable to marketable equity securities in the most recent quarter. These improvements in the fourth quarter of 2019 were partially offset by a $1.4 loss on the early termination of FHLB advances, $0.5 million lower income from our legacy credit card products as we phase them out and $0.5 million lower income from the discontinuation of services to the Company’s former parent and its affiliates.
The increase in noninterest income of $3.2 million, or 6.0%, in the full-year 2019 compared to full-year 2018, is mainly due to the aforementioned increase in income from derivative contracts sold, the gain on sale of the vacant Beacon land, the benefit from the recently-adopted ASU applicable to marketable equity securities, as well as a $1.9 million gain from the sale of municipal bonds and floating-rate corporate securities earlier this year. This increase was partially offset by the decline in brokerage fees as a result of lower fixed income trading volume by our customers, primarily resulting from the increased domestic sanctions against trading on Venezuelan government securities, lower income from the discontinuation of services to the Company’s former parent and its affiliates, lower wire transfer and credit card fees, and a net loss on the early termination of FHLB advances in 2019 compared to a net gain in 2018. These early FHLB terminations allowed the Company to significantly lower its funding cost.
The Company’s assets under management and custody, or AUMs, increased $223.6 million, or 14.0%, to $1.8 billion at December 31, 2019 compared to $1.6 billion at December 31, 2018. This increase was mainly due to a positive market effect resulting in the appreciation of the AUM portfolio, when compared to year-end 2018, and the completion, in the fourth quarter of 2019, of the previously announced acquisition of Grand Cayman-based Mercantil Bank and Trust Limited (Cayman) from Mercantil Holding Financiero Internacional (Mercantil), a former affiliate, now rebranded “Elant Bank and Trust Ltd.” and wholly owned by Amerant Bank, N.A. (“Amerant Bank”).
Noninterest expense
Fourth quarter 2019 noninterest expense was $51.7 million, down $2.9 million or 5.3%, compared to $54.6 million in the fourth quarter of 2018, driven primarily by: (i) lower salaries and employee benefits due to staff reductions made throughout the year, partially offset by cost of living adjustments of 1.8% in 2019 (compared to 3.2% in 2018); (ii) $4.6 million lower severance costs and $1.2 million lower legal and strategy advisory costs in connection with the restructuring process; (iii) a favorable adjustment of depreciation expense of $0.7 million related to our Beacon operations
5
center, and (v) a reduction of FDIC-related costs of $0.7 million mainly due to credits received. Partially offsetting the decreasing expenses were: (i) $2.0 million in additional costs of the Company’s LTIP tied to performance against strategic targets established for the year 2016-2019 period; (ii) $0.8 million of stock-based compensation to directors, and (iii) $0.4 million higher operational charge-offs in the fourth quarter of 2019 related to customer accounts. In addition, total compensation expense in the fourth quarter of 2019 includes $1.5 million in amortization of restricted stock awards granted in December 2018.
Noninterest expense for the year ended December 31, 2019 decreased 2.6%, or $5.7 million, compared to full-year 2018, largely due to: (i) lower salaries and employee benefits and severance costs previously discussed; (ii) lower legal, accounting and consulting fees incurred in 2019 compared to the previous year when the Company completed its spin-off and began its restructuring activities; (iii) lower FDIC-related costs, and (iv) the favorable depreciation adjustment in connection with our Beacon operations center. Partially offsetting these declines were: (i) higher long-term incentive compensation as described above; (ii) stock-based compensation to directors in 2019; (iii) $3.2 million higher rebranding costs in 2019, and (iv) expenses connected with the redemption earlier this year of trust preferred securities and related subordinated debt. Total compensation expense for the full-year 2019 includes a $5.9 million amortization of restricted stock awards granted in December 2018 as a result of the IPO.
Restructuring expenses in 2019 were $5.0 million, consisting of $3.6 million of rebranding costs and $1.5 million of staff realignment expenses, decreasing 21.1% from $6.4 million in 2018. This decrease was primarily due to lower staff reductions costs and no professional or other costs incurred, partially offset by higher rebranding expenses. Restructuring expenses in 2019 represented 2.4% of total noninterest expenses compared to 3.0% of total noninterest expenses in 2018.
Credit Quality
Credit quality remained strong. The ratio of non-performing assets to total assets increased to 0.41% at the end of the fourth quarter of 2019, compared to 0.22% at the end of the fourth quarter of 2018, mainly attributed to the deterioration of an $11.9 million non-performing multi-loan relationship with a South Florida food wholesale borrower whose sales in Puerto Rico were affected by the 2017 hurricanes. These loans were placed in non-accrual status in June 2019 and approximately $9.8 million of these loans were restructured in a troubled debt restructuring (“TDR”) in July 2019. During the fourth quarter of 2019, this TDR loan relationship did not perform in accordance with the restructured terms. As a result, the Company downgraded from substandard to doubtful three loans within the relationship totaling $5.0 million and increased specific reserves by $0.9 million to $2.4 million, or approximately 20% of the $11.9 million outstanding balance at the close of 2019. Specific reserves on this TDR multiple loan relationship represent the potential shortfall from a liquidation of collateral scenario. These loans are secured with a combination of commercial and residential real estate properties and equipment located in South Florida covering 71% of the outstanding balance; as well as receivables and inventory. Adding to the increase in non-performing loans were three owner-occupied loans totaling $4.3 million, and one commercial loan for $2.4 million. These increases were partially offset by the upgrade of one single-family loan for $0.7 million, the charge-off of one commercial loan for $0.6 million, and pay downs of one commercial loan for $0.9 million, one single-family residential loan for $0.6 million and credit cards totaling $0.9 million.
6
Special mention loans increased by $13.5 million at December 31, 2019, compared to December 31, 2018. The increase included a $10.0 million condo construction relationship SNC loan in New York City, three commercial loan relationships totaling $4.4 million, four owner occupied loans totaling $7.7 million, and two commercial real estate (“CRE”) loans totaling $5.7 million downgraded to special mention during the period. This was partially offset by the downgrades from special mention, including $9.4 million of loans related to the food wholesale borrower previously mentioned, one CRE loan for $0.8 million, one owner-occupied loan relationship for $2.0 million, and the upgrade of one owner occupied loan for $2.2 million. We continue to closely monitor the performance and status of these loans.
The Company released $0.3 million from the ALL during the fourth quarter of 2019, compared to a $1.4 million release during the same period last year. The release was primarily driven by a lower loan balance and a commercial loan recovery of $0.9 million, partially offset by loss factor adjustments and the increase of $0.9 million in specific reserves for the $11.9 million multiple loan relationship to the food wholesale borrower previously mentioned.
As we announced during 2019, we are in the process of phasing out our legacy credit card products. We have stopped charge privileges to all cardholders, reimbursed unearned annual membership fees, and required repayment of all remaining balances by the end of January 2020. In order to continue providing quality products and services to our foreign and domestic customers, and better manage credit risk, Amerant entered into referral arrangements with recognized U.S. credit card issuers. Charge-offs related to credit cards for the full-year 2019 were $5.3 million. At December 31, 2019, the outstanding balance and ALL, after these charge-offs, were $11.1 million and $1.8 million, respectively. We continue to monitor this portfolio closely and will re-assess the level of required reserves until balances are completely repaid.
Capital
Stockholders’ equity was $834.7 million at December 31, 2019, up 11.7% compared to $747.4 million at December 31, 2018 mainly driven by net income and other comprehensive income stemming from higher market valuations in the Company’s available for sale investment portfolio.
The Company’s capital continues to be strong and well in excess of the minimum regulatory requirements to be considered “well-capitalized.”
Fourth Quarter 2019 Earnings Conference Call
As previously announced, the Company will hold an earnings conference call on Thursday, January 30th, 2020 at 9:30 a.m. (Eastern Time) to discuss its fourth quarter and full-year 2019 results. The conference call and presentation materials can be accessed via webcast by logging on to the Investor Relations section of the company’s website at https://investor.amerantbank.com. The online replay will remain available for approximately one month following the call through the above link.
About Amerant Bancorp Inc.
The Company is a bank holding company headquartered in Coral Gables, Florida. The Company operates through its subsidiaries, Amerant Bank, N.A. (the “Bank”), Amerant Investments, Inc.,
7
Amerant Trust, N.A. and Elant Bank and Trust Ltd. The Company provides individuals and businesses in the U.S., as well as select international clients, with deposit, credit and wealth management services. The Bank, which has operated for over 40 years, is the largest community bank headquartered in Florida. The Bank operates 26 banking centers—18 in South Florida and 8 in the Houston, Texas area—and loan production offices in Dallas, Texas and New York, New York.
Zelle® is a registered trademark of Early Warning Services LLC, used in accordance with contractual terms.
Visit our investor relations page at https://investor.amerantbank.com for additional information.
Cautionary Notice Regarding Forward-Looking Statements
This press release contains “forward-looking statements” within the meaning of the Securities Act of 1933 and the Securities Exchange Act of 1934, including, without limitation, future financial and operating results; costs and revenues; economic conditions generally and in our markets and among our customer base; loan demand; mortgage lending activity; changes in the mix of our earning assets and our deposit and wholesale liabilities; net interest margin; yields on earning assets; interest rates and yield curves (generally and those applicable to our assets and liabilities); credit quality, including loan performance, non-performing assets, provisions for loan losses, charge-offs, other-than-temporary impairments and collateral values; market trends; rebranding and staff realignment costs and expected savings; and customer preferences, as well as statements with respect to our objectives, expectations and intentions and other statements that are not historical facts. All statements other than statements of historical fact are statements that could be forward-looking statements. You can identify these forward-looking statements through our use of words such as “may,” “will,” “anticipate,” “assume,” “should,” “indicate,” “would,” “believe,” “contemplate,” “expect,” “estimate,” “continue,” “plan,” “point to,” “project,” “could,” “intend,” “target,” “goals,” “outlooks,” “modeled,” and other similar words and expressions of the future.
Forward-looking statements, including those as to our beliefs, plans, objectives, goals, expectations, anticipations, estimates and intentions, involve known and unknown risks, uncertainties and other factors, which may be beyond our control, and which may cause the Company’s actual results, performance, achievements, or financial condition to be materially different from future results, performance, achievements, or financial condition expressed or implied by such forward-looking statements. You should not rely on any forward-looking statements as predictions of future events. You should not expect us to update any forward-looking statements. All written or oral forward-looking statements attributable to us are expressly qualified in their entirety by this cautionary notice, together with those risks and uncertainties described in “Risk factors” in our annual report on Form 10-K for the fiscal year ended December 31, 2018 and in our other filings with the U.S. Securities and Exchange Commission (the “SEC”), which are available at the SEC’s website www.sec.gov.
8
Explanation of Certain Non-GAAP Financial Measures
Certain financial measures and ratios contained in this press release including “adjusted noninterest income”, “adjusted noninterest expense,” “adjusted net income,” “adjusted basic and diluted earnings per common share (basic and diluted),” “adjusted ROA,” “adjusted ROE,” “adjusted efficiency ratio,” and other ratios appearing in Exhibits 1 and 2 are supplemental measures that are not required by, or are not presented in accordance with, U.S. generally accepted accounting principles (“GAAP”). The Company refers to these financial measures and ratios as “non-GAAP financial measures.”
We use certain non-GAAP financial measures, including those mentioned above, both to explain our results to shareholders and the investment community and in the internal evaluation and management of our businesses. Our management believes that these non-GAAP financial measures and the information they provide are useful to investors since these measures permit investors to view our performance using the same tools that our management uses to evaluate our past performance and prospects for future performance, especially in light of the additional costs we incurred in 2018 in connection with the Spin-off and related transactions, the rebranding and restructuring expenses which began in 2018 and continued in 2019, and the one-time gain on sale of the vacant Beacon land in the fourth quarter of 2019. While we believe that these non-GAAP financial measures are useful in evaluating our performance, this information should be considered as supplemental and not as a substitute for or superior to the related financial information prepared in accordance with GAAP. Additionally, these non-GAAP financial measures may differ from similar measures presented by other companies.
Exhibit 2 reconciles these non-GAAP financial measures to reported results.
9
Exhibit 1- Selected Financial Information
The following table sets forth selected financial information derived from our unaudited and audited consolidated financial statements.
(in thousands) | December 31, 2019 | September 30, 2019 | June 30, 2019 | March 31, 2019 | December 31, 2018 | ||||||||||||||
Consolidated Balance Sheets | |||||||||||||||||||
Total assets | $ | 7,985,399 | $ | 7,864,260 | $ | 7,926,826 | $ | 7,902,355 | $ | 8,124,347 | |||||||||
Total investments | 1,739,410 | 1,632,985 | 1,650,632 | 1,701,328 | 1,741,428 | ||||||||||||||
Total gross loans(1) | 5,744,339 | 5,753,709 | 5,812,755 | 5,744,406 | 5,920,175 | ||||||||||||||
Allowance for loan losses | 52,223 | 53,640 | 57,404 | 60,322 | 61,762 | ||||||||||||||
Total deposits | 5,757,143 | 5,692,848 | 5,819,381 | 5,888,188 | 6,032,686 | ||||||||||||||
Junior subordinated debentures(2) | 92,246 | 92,246 | 118,110 | 118,110 | 118,110 | ||||||||||||||
Advances from the FHLB and other borrowings | 1,235,000 | 1,170,000 | 1,125,000 | 1,070,000 | 1,166,000 | ||||||||||||||
Stockholders' equity | 834,701 | 825,751 | 806,368 | 778,749 | 747,418 | ||||||||||||||
Assets under management and custody (22) | 1,815,848 | 1,713,012 | 1,787,257 | 1,693,895 | 1,592,257 | ||||||||||||||
Three Months Ended | Years Ended December 31, | ||||||||||||||||||||||||||
(in thousands, except per share amounts and percentages) | December 31, 2019 | September 30, 2019 | June 30, 2019 | March 31, 2019 | December 31, 2018 | 2019 | 2018 | ||||||||||||||||||||
Consolidated Results of Operations | |||||||||||||||||||||||||||
Net interest income | $ | 51,262 | $ | 52,600 | $ | 53,789 | $ | 55,437 | $ | 56,784 | $ | 213,088 | $ | 219,039 | |||||||||||||
(Reversal of) provision for loan losses | (300 | ) | (1,500 | ) | (1,350 | ) | — | (1,375 | ) | (3,150 | ) | 375 | |||||||||||||||
Noninterest income | 15,971 | 13,836 | 14,147 | 13,156 | 11,994 | 57,110 | 53,875 | ||||||||||||||||||||
Noninterest expense | 51,730 | 52,737 | 52,905 | 51,945 | 54,648 | 209,317 | 214,973 | ||||||||||||||||||||
Net income | 13,475 | 11,931 | 12,857 | 13,071 | 14,430 | 51,334 | 45,833 | ||||||||||||||||||||
Effective income tax rate | 14.73 | % | 21.50 | % | 21.51 | % | 21.49 | % | 6.93 | % | 19.83 | % | 20.38 | % | |||||||||||||
Common Share Data | |||||||||||||||||||||||||||
Stockholders' book value per common share | $ | 19.35 | $ | 19.11 | $ | 18.66 | $ | 18.02 | $ | 17.31 | $ | 19.35 | $ | 17.31 | |||||||||||||
Tangible stockholders' equity (book value) per common share(3) | $ | 18.84 | $ | 18.63 | $ | 18.18 | $ | 17.54 | $ | 16.82 | $ | 18.84 | $ | 16.82 | |||||||||||||
Basic earnings per common share | $ | 0.32 | $ | 0.28 | $ | 0.30 | $ | 0.31 | $ | 0.34 | $ | 1.21 | $ | 1.08 | |||||||||||||
Diluted earnings per common share | $ | 0.31 | $ | 0.28 | $ | 0.30 | $ | 0.30 | $ | 0.34 | $ | 1.20 | $ | 1.08 | |||||||||||||
Basic weighted average shares outstanding | 42,489 | 42,466 | 42,466 | 42,755 | 42,483 | 42,543 | 42,487 | ||||||||||||||||||||
Diluted weighted average shares outstanding(4) | 43,050 | 42,915 | 42,819 | 42,914 | 42,483 | 42,939 | 42,487 | ||||||||||||||||||||
Cash dividend declared per common share(5) | — | — | — | — | — | — | 0.94 | ||||||||||||||||||||
10
Three Months Ended, | Years Ended December 31, | ||||||||||||||||||||||||||
(in thousands, except per share amounts and percentages) | December 31, 2019 | September 30, 2019 | June 30, 2019 | March 31, 2019 | December 31, 2018 | 2019 | 2018 | ||||||||||||||||||||
Other Financial and Operating Data(6) | |||||||||||||||||||||||||||
Profitability Indicators (%) | |||||||||||||||||||||||||||
Net interest income / Average total interest earning assets (NIM)(7) | 2.74 | % | 2.80 | % | 2.92 | % | 2.96 | % | 2.95 | % | 2.85 | % | 2.78 | % | |||||||||||||
Net income / Average total assets (ROA)(8) | 0.68 | % | 0.60 | % | 0.66 | % | 0.65 | % | 0.70 | % | 0.65 | % | 0.55 | % | |||||||||||||
Net income / Average stockholders' equity (ROE)(9) | 6.44 | % | 5.81 | % | 6.56 | % | 6.87 | % | 7.88 | % | 6.43 | % | 6.29 | % | |||||||||||||
Capital Indicators | |||||||||||||||||||||||||||
Total capital ratio(10) | 14.94 | % | 14.77 | % | 14.70 | % | 14.35 | % | 13.54 | % | 14.94 | % | 13.54 | % | |||||||||||||
Tier 1 capital ratio(11) | 14.10 | % | 13.93 | % | 13.85 | % | 13.48 | % | 12.69 | % | 14.10 | % | 12.69 | % | |||||||||||||
Tier 1 leverage ratio(12) | 11.32 | % | 11.15 | % | 11.32 | % | 10.83 | % | 10.34 | % | 11.32 | % | 10.34 | % | |||||||||||||
Common equity tier 1 capital ratio (CET1)(13) | 12.74 | % | 12.57 | % | 12.14 | % | 11.79 | % | 11.07 | % | 12.74 | % | 11.07 | % | |||||||||||||
Tangible common equity ratio(14) | 10.21 | % | 10.26 | % | 9.93 | % | 9.61 | % | 8.96 | % | 10.21 | % | 8.96 | % | |||||||||||||
Asset Quality Indicators (%) | |||||||||||||||||||||||||||
Non-performing assets / Total assets(15) | 0.41 | % | 0.42 | % | 0.41 | % | 0.26 | % | 0.22 | % | 0.41 | % | 0.22 | % | |||||||||||||
Non-performing loans /Total loans(1) (16) | 0.57 | % | 0.57 | % | 0.56 | % | 0.36 | % | 0.30 | % | 0.57 | % | 0.30 | % | |||||||||||||
Allowance for loan losses / Total non-performing loans(17) | 158.60 | % | 163.42 | % | 175.28 | % | 294.01 | % | 347.33 | % | 158.60 | % | 347.33 | % | |||||||||||||
Allowance for loan losses / Total loans(1) (17) | 0.91 | % | 0.93 | % | 0.99 | % | 1.05 | % | 1.04 | % | 0.91 | % | 1.04 | % | |||||||||||||
Net charge-offs/ Average total loans(18) | 0.08 | % | 0.16 | % | 0.11 | % | 0.10 | % | 0.43 | % | 0.11 | % | 0.18 | % | |||||||||||||
Efficiency Indicators | |||||||||||||||||||||||||||
Noninterest expense / Average total assets (8) | 2.60 | % | 2.64 | % | 2.70 | % | 2.58 | % | 2.64 | % | 2.64 | % | 2.57 | % | |||||||||||||
Salaries and employee benefits / Average total assets (8) | 1.81 | % | 1.70 | % | 1.74 | % | 1.66 | % | 1.88 | % | 1.73 | % | 1.69 | % | |||||||||||||
Other operating expenses / Average total assets (8)(19) | 0.79 | % | 0.95 | % | 0.96 | % | 0.92 | % | 0.76 | % | 0.91 | % | 0.87 | % | |||||||||||||
Efficiency ratio(20) | 76.94 | % | 79.38 | % | 77.87 | % | 75.73 | % | 79.46 | % | 77.47 | % | 78.77 | % | |||||||||||||
Full-Time-Equivalent Employees (FTEs) | 829 | 838 | 839 | 889 | 911 | 829 | 911 | ||||||||||||||||||||
Adjusted Selected Consolidated Results of Operations and Other Data(3) | |||||||||||||||||||||||||||
Adjusted noninterest income | $ | 13,176 | $ | 13,836 | $ | 14,147 | $ | 13,156 | $ | 11,994 | $ | 54,315 | $ | 53,875 | |||||||||||||
Adjusted noninterest expense | 51,616 | 51,474 | 50,169 | 51,012 | 47,900 | 204,271 | 201,911 | ||||||||||||||||||||
Adjusted net income | 11,407 | 12,923 | 15,005 | 13,803 | 19,935 | 53,138 | 57,923 | ||||||||||||||||||||
Adjusted earnings per common share | $ | 0.27 | $ | 0.30 | $ | 0.35 | $ | 0.33 | $ | 0.47 | $ | 1.25 | $ | 1.36 | |||||||||||||
Adjusted earnings per diluted common share(4) | $ | 0.26 | $ | 0.30 | $ | 0.35 | $ | 0.32 | $ | 0.47 | $ | 1.24 | $ | 1.36 | |||||||||||||
11
Three Months Ended, | Years Ended December 31, | ||||||||||||||||||||||||||
December 31, 2019 | September 30, 2019 | June 30, 2019 | March 31, 2019 | December 31, 2018 | 2019 | 2018 | |||||||||||||||||||||
Adjusted net income / Average total assets (Adjusted ROA)(8) | 0.57 | % | 0.65 | % | 0.77 | % | 0.69 | % | 0.97 | % | 0.67 | % | 0.69 | % | |||||||||||||
Adjusted net income / Average stockholders' equity (Adjusted ROE)(9) | 5.45 | % | 6.30 | % | 7.66 | % | 7.25 | % | 10.89 | % | 6.66 | % | 7.95 | % | |||||||||||||
Adjusted noninterest expense / Average total assets (8) | 2.59 | % | 2.58 | % | 2.56 | % | 2.53 | % | 2.31 | % | 2.57 | % | 2.41 | % | |||||||||||||
Adjusted salaries and employee benefits / Average total assets (8) | 1.80 | % | 1.67 | % | 1.69 | % | 1.66 | % | 1.65 | % | 1.71 | % | 1.62 | % | |||||||||||||
Adjusted other operating expenses / Average total assets(8)(19) | 0.79 | % | 0.91 | % | 0.87 | % | 0.87 | % | 0.66 | % | 0.86 | % | 0.78 | % | |||||||||||||
Adjusted efficiency ratio(21) | 80.10 | % | 77.48 | % | 73.84 | % | 74.37 | % | 69.64 | % | 76.39 | % | 73.99 | % | |||||||||||||
_______
(1) | Total gross loans are net of deferred loan fees and costs. At September 30, 2019 and March 31, 2019, total loans include $1.9 million and $10.0 million in loans held for sale, respectively. There were no loans held for sale at any of the other dates presented. |
(2) | During the three months ended September 30, 2019, the Company redeemed $25.0 million of its 10.60% and 10.18% trust preferred securities and related junior subordinated debentures. In December 2019, the Company announced the redemption on January 30, 2020 of all $26.8 million of its outstanding 8.90% trust preferred securities and related junior subordinated debentures. |
(3) This presentation contains adjusted financial information determined by methods other than GAAP. This adjusted financial information is reconciled to GAAP in Exhibit 2 - Non-GAAP Financial Measures Reconciliation.
(4) As of December 31, 2019, September 30, 2019, June 30, 2019 and March 31, 2019 potential dilutive instruments consisted of unvested shares of restricted stock and restricted stock units mainly related to the Company’s IPO in 2018. As of December 31, 2019, and March 31, 2019 unvested shares of restricted stock and restricted stock units totaled 530,620 and 786,213, respectively, and 789,652 as of September 30, 2019 and June 30, 2019. These potential dilutive instruments were included in the diluted earnings per share computation because, when the unamortized deferred compensation cost related to these shares was divided by the average market price per share at those dates, fewer shares would have been purchased than restricted shares assumed issued. Therefore, at those dates, such awards resulted in higher diluted weighted average shares outstanding than basic weighted average shares outstanding, and had a dilutive effect in per share earnings for the year ended December 31, 2019. We had no outstanding dilutive instruments as of any period prior to December 2018.
(5) | Special cash dividend of $40.0 million paid to the Company’s former parent in connection with the spin-off. |
(6) | Operating data for the three month periods presented have been annualized. |
(7) | Net interest margin is defined as net interest income divided by average interest-earning assets, which are loans, securities available for sale and held to maturity, deposits with banks and other financial assets which yield interest or similar income. |
(8) | Calculated based upon the average daily balance of total assets. |
(9) | Calculated based upon the average daily balance of stockholders’ equity. |
(10)Total stockholders’ equity divided by total risk-weighted assets, calculated according to the standardized regulatory capital ratio calculations.
(11) | Tier 1 capital divided by total risk-weighted assets. |
(12) | Tier 1 capital divided by quarter to date average assets. Tier 1 capital is composed of Common Equity Tier 1 (CET 1) capital plus outstanding qualifying trust preferred securities of $89.1 million as of December 31, 2019 and September 30, 2019 and $114.1 million at each of the other dates shown. In the three months ended September 30, 2019, $25.0 million in trust preferred securities were redeemed. See footnote 2. |
(13)Common Equity Tier 1 (CET 1) capital divided by total risk-weighted assets.
(14) | Tangible common equity is calculated as the ratio of common equity less goodwill and other intangibles divided by total assets less goodwill and other intangible assets. Other intangibles assets are included in other assets in the Company’s consolidated balance sheets. |
(15)Non-performing assets include all accruing loans past due by 90 days or more, all nonaccrual loans, restructured loans that are considered “troubled debt restructurings” or “TDRs”, and OREO properties acquired through or in lieu of foreclosure. Non-performing assets were $33.0 million, $32.8 million, $32.8 million, $20.5 million and $18.1 million as of December 31, 2019, September 30, 2019, June 30, 2019, March 31, 2019 and December 31, 2018, respectively.
(16)Non-performing loans include all accruing loans past due by 90 days or more, all nonaccrual loans and restructured loans that are considered TDRs. Non-performing loans were $32.9 million, $32.8 million, $32.8 million, $20.5 million and $17.8 million as of December 31, 2019, September 30, 2019, June 30, 2019, March 31, 2019 and December 31, 2018, respectively.
(17)Allowance for loan losses was $52.2 million, $53.6 million, $57.4 million, $60.3 million and $61.8 million as of December 31, 2019, September 30, 2019, June 30, 2019, March 31, 2019 and December 31, 2018, respectively.
(18)Calculated based upon the average daily balance of outstanding loan principal balance net of deferred loan fees and costs, excluding the allowance for loan losses.
12
(19) Other operating expenses is the result of total noninterest expense less salary and employee benefits.
(20)Efficiency ratio is the result of noninterest expense divided by the sum of noninterest income and net interest income.
(21)Adjusted efficiency ratio is the efficiency ratio less the effect of restructuring and spin-off costs and other adjustments management believes are useful to understand the Company’s performance, described in Exhibit 2 - Non-GAAP Financial Measures Reconciliation.
(22) Assets held for clients in an agency or fiduciary capacity which are not assets of the Company and therefore are not included in the consolidated financial statements.
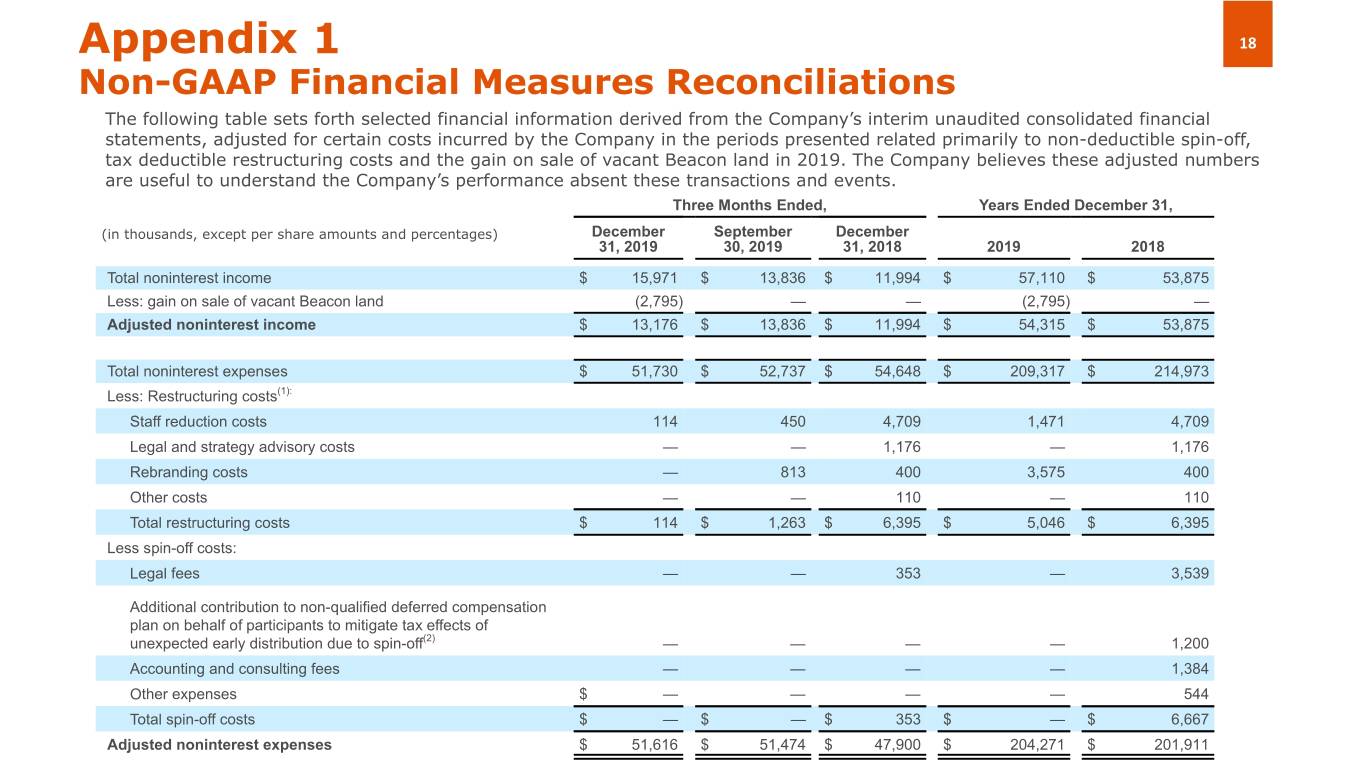
Exhibit 2- Non-GAAP Financial Measures Reconciliation
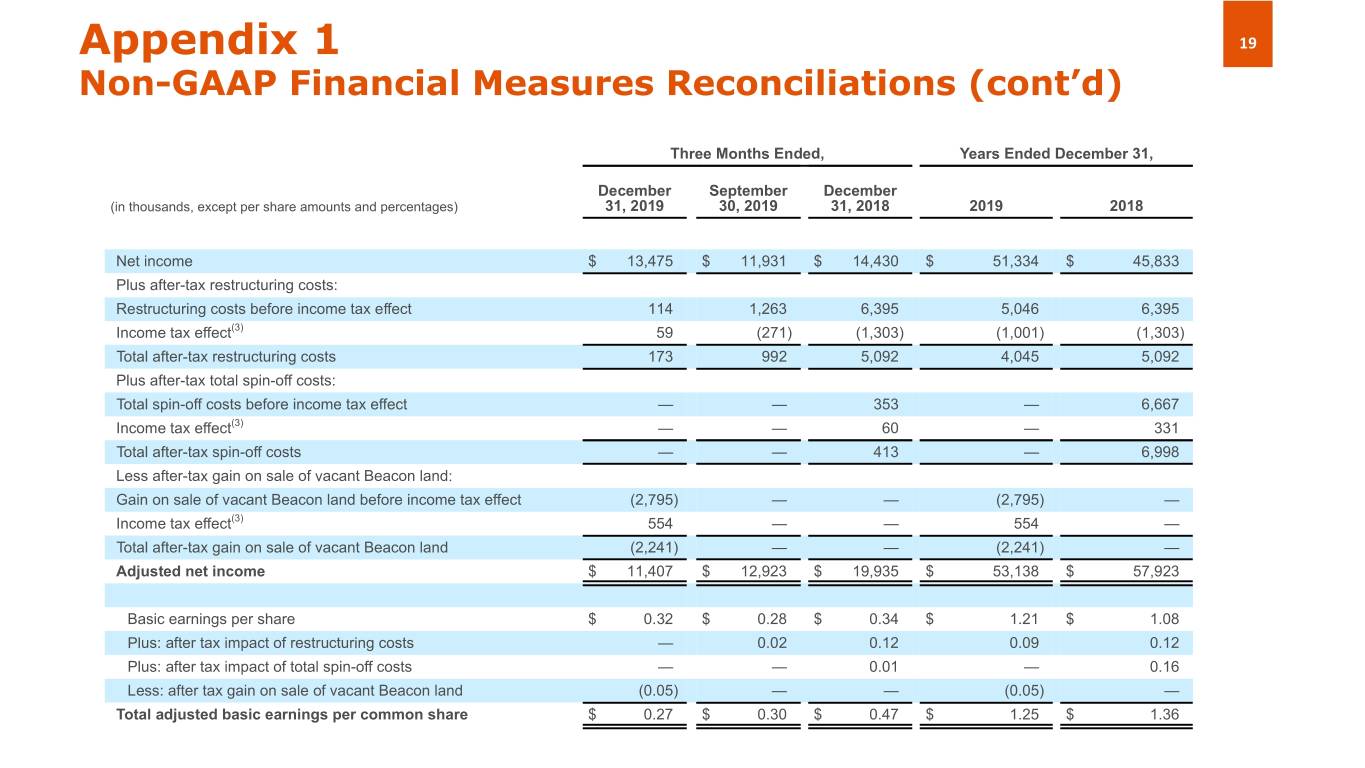
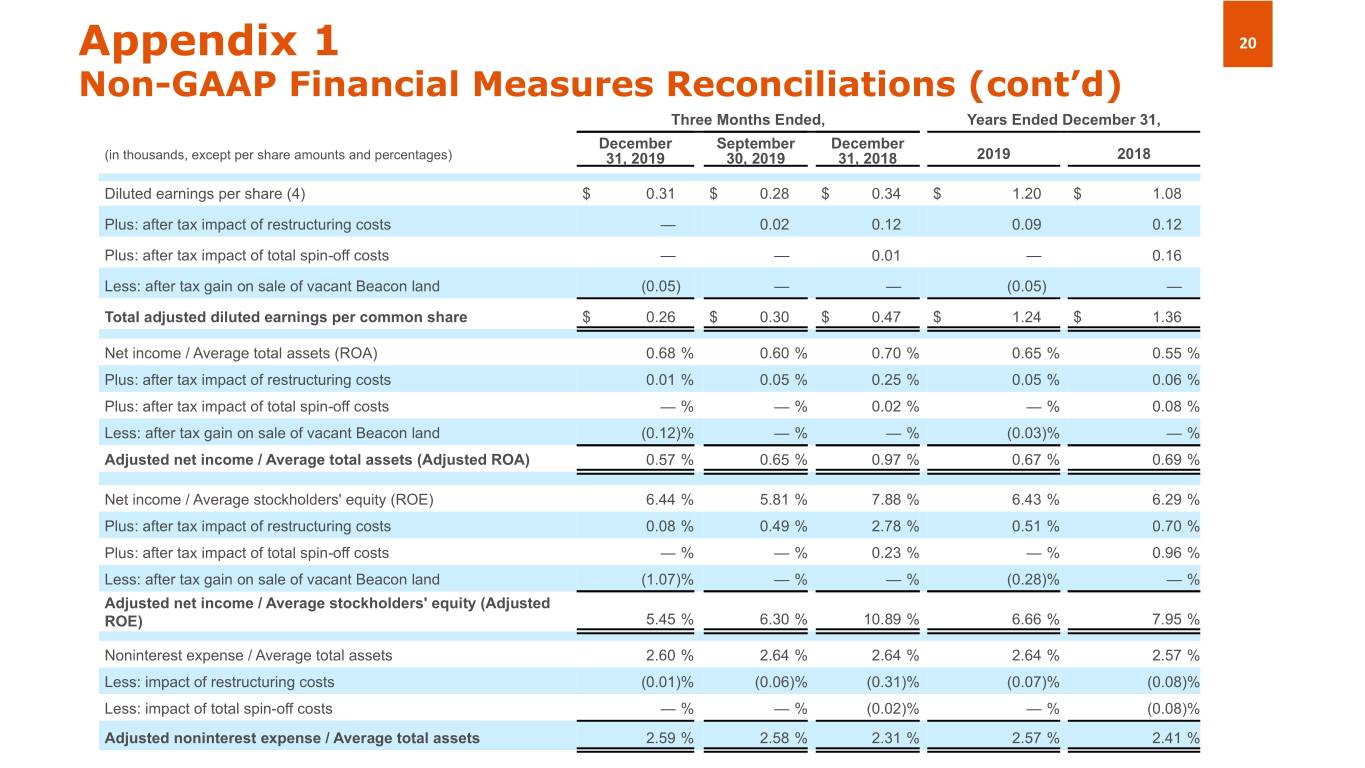
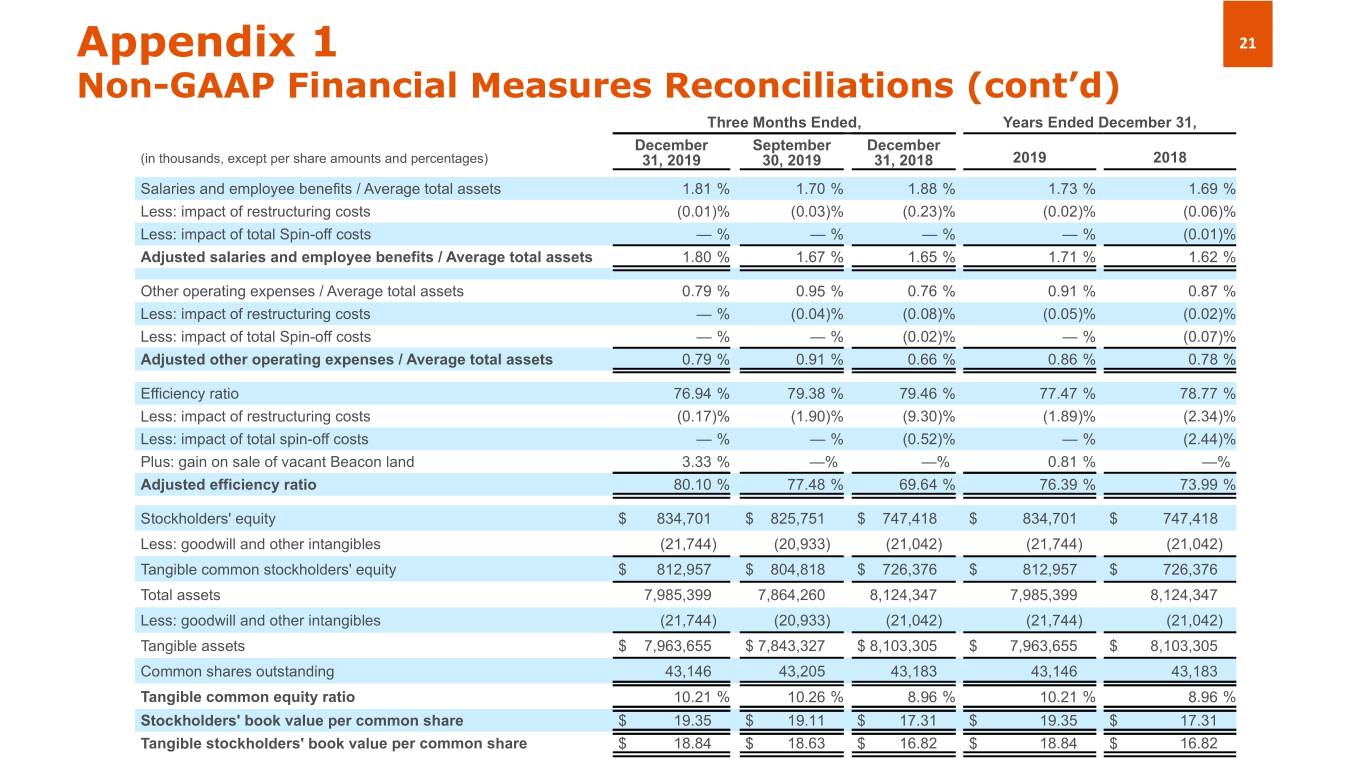
The following table sets forth selected financial information derived from the Company’s interim unaudited and annual audited consolidated financial statements, adjusted for certain costs incurred by the Company in the periods presented related to tax deductible restructuring and non-deductible spin-off costs. These adjustments also reflect the after-tax gain of $2.2 million on the sale of vacant Beacon land in the fourth quarter of 2019.The Company believes these adjusted numbers are useful to understand the Company’s performance absent these transactions and events.
Three Months Ended, | Years Ended December 31, | ||||||||||||||||||||||||||
(in thousands) | December 31, 2019 | September 30, 2019 | June 30, 2019 | March 31, 2019 | December 31, 2018 | 2019 | 2018 | ||||||||||||||||||||
Total noninterest income | $ | 15,971 | $ | 13,836 | $ | 14,147 | $ | 13,156 | $ | 11,994 | $ | 57,110 | $ | 53,875 | |||||||||||||
Less: gain on sale of vacant Beacon land | (2,795 | ) | — | — | — | — | (2,795 | ) | — | ||||||||||||||||||
Adjusted noninterest income | $ | 13,176 | $ | 13,836 | $ | 14,147 | $ | 13,156 | $ | 11,994 | $ | 54,315 | $ | 53,875 | |||||||||||||
Total noninterest expenses | $ | 51,730 | $ | 52,737 | $ | 52,905 | $ | 51,945 | $ | 54,648 | $ | 209,317 | $ | 214,973 | |||||||||||||
Less: Restructuring costs(1): | |||||||||||||||||||||||||||
Staff reduction costs | 114 | 450 | 907 | — | 4,709 | 1,471 | 4,709 | ||||||||||||||||||||
Legal and strategy advisory costs | — | — | — | — | 1,176 | — | 1,176 | ||||||||||||||||||||
Rebranding costs | — | 813 | 1,829 | 933 | 400 | 3,575 | 400 | ||||||||||||||||||||
Other costs | — | — | — | — | 110 | — | 110 | ||||||||||||||||||||
Total restructuring costs | $ | 114 | $ | 1,263 | $ | 2,736 | $ | 933 | $ | 6,395 | $ | 5,046 | $ | 6,395 | |||||||||||||
Less spin-off costs: | |||||||||||||||||||||||||||
Legal fees | — | — | — | — | 353 | — | 3,539 | ||||||||||||||||||||
Additional contribution to non-qualified deferred compensation plan on behalf of participants to mitigate tax effects of unexpected early distribution due to spin-off(2) | — | — | — | — | — | — | 1,200 | ||||||||||||||||||||
Accounting and consulting fees | — | — | — | — | — | — | 1,384 | ||||||||||||||||||||
Other expenses | — | — | — | — | — | — | 544 | ||||||||||||||||||||
Total spin-off costs | $ | — | $ | — | $ | — | $ | — | $ | 353 | $ | — | $ | 6,667 | |||||||||||||
Adjusted noninterest expenses | $ | 51,616 | $ | 51,474 | $ | 50,169 | $ | 51,012 | $ | 47,900 | $ | 204,271 | $ | 201,911 | |||||||||||||
13
Three Months Ended, | Years Ended December 31, | ||||||||||||||||||||||||||
(in thousands, except per share amounts and percentages) | December 31, 2019 | September 30, 2019 | June 30, 2019 | March 31, 2019 | December 31, 2018 | 2019 | 2018 | ||||||||||||||||||||
Net income | $ | 13,475 | $ | 11,931 | $ | 12,857 | $ | 13,071 | $ | 14,430 | $ | 51,334 | $ | 45,833 | |||||||||||||
Plus after-tax restructuring costs: | |||||||||||||||||||||||||||
Restructuring costs before income tax effect | 114 | 1,263 | 2,736 | 933 | 6,395 | 5,046 | 6,395 | ||||||||||||||||||||
Income tax effect | 59 | (271 | ) | (588 | ) | (201 | ) | (1,303 | ) | (1,001 | ) | (1,303 | ) | ||||||||||||||
Total after-tax restructuring costs | 173 | 992 | 2,148 | 732 | 5,092 | 4,045 | 5,092 | ||||||||||||||||||||
Plus after-tax total spin-off costs: | |||||||||||||||||||||||||||
Total spin-off costs before income tax effect | — | — | — | — | 353 | — | 6,667 | ||||||||||||||||||||
Income tax effect(3) | — | — | — | — | 60 | — | 331 | ||||||||||||||||||||
Total after-tax spin-off costs | — | — | — | — | 413 | — | 6,998 | ||||||||||||||||||||
Less after-tax gain on sale of vacant Beacon land: | |||||||||||||||||||||||||||
Gain on sale of vacant Beacon land before income tax effect | (2,795 | ) | — | — | — | — | (2,795 | ) | — | ||||||||||||||||||
Income tax effect | 554 | — | — | — | — | 554 | — | ||||||||||||||||||||
Total after-tax gain on sale of vacant Beacon land | (2,241 | ) | — | — | — | — | (2,241 | ) | — | ||||||||||||||||||
Adjusted net income | $ | 11,407 | $ | 12,923 | $ | 15,005 | $ | 13,803 | $ | 19,935 | $ | 53,138 | $ | 57,923 | |||||||||||||
Basic earnings per share | $ | 0.32 | $ | 0.28 | $ | 0.30 | $ | 0.31 | $ | 0.34 | $ | 1.21 | $ | 1.08 | |||||||||||||
Plus: after tax impact of restructuring costs | — | 0.02 | 0.05 | 0.02 | 0.12 | 0.09 | 0.12 | ||||||||||||||||||||
Plus: after tax impact of total spin-off costs | — | — | — | — | 0.01 | — | 0.16 | ||||||||||||||||||||
Less: after tax gain on sale of vacant Beacon land | (0.05 | ) | — | — | — | — | (0.05 | ) | — | ||||||||||||||||||
Total adjusted basic earnings per common share | $ | 0.27 | $ | 0.30 | $ | 0.35 | $ | 0.33 | $ | 0.47 | $ | 1.25 | $ | 1.36 | |||||||||||||
Diluted earnings per share(4) | $ | 0.31 | $ | 0.28 | $ | 0.30 | $ | 0.30 | $ | 0.34 | $ | 1.20 | $ | 1.08 | |||||||||||||
Plus: after tax impact of restructuring costs | — | 0.02 | 0.05 | 0.02 | 0.12 | 0.09 | 0.12 | ||||||||||||||||||||
Plus: after tax impact of total spin-off costs | — | — | — | — | 0.01 | — | 0.16 | ||||||||||||||||||||
Less: after tax gain on sale of vacant Beacon land | (0.05 | ) | — | — | — | — | (0.05 | ) | — | ||||||||||||||||||
Total adjusted diluted earnings per common share | $ | 0.26 | $ | 0.30 | $ | 0.35 | $ | 0.32 | $ | 0.47 | $ | 1.24 | $ | 1.36 | |||||||||||||
Net income / Average total assets (ROA) | 0.68 | % | 0.60 | % | 0.66 | % | 0.65 | % | 0.70 | % | 0.65 | % | 0.55 | % | |||||||||||||
Plus: after tax impact of restructuring costs | 0.01 | % | 0.05 | % | 0.11 | % | 0.04 | % | 0.25 | % | 0.05 | % | 0.06 | % | |||||||||||||
Plus: after tax impact of total spin-off costs | — | % | — | % | — | % | — | % | 0.02 | % | — | % | 0.08 | % | |||||||||||||
Less: after tax gain on sale of vacant Beacon land | (0.12 | )% | — | % | — | % | — | % | — | % | (0.03 | )% | — | % | |||||||||||||
Adjusted net income / Average total assets (Adjusted ROA) | 0.57 | % | 0.65 | % | 0.77 | % | 0.69 | % | 0.97 | % | 0.67 | % | 0.69 | % | |||||||||||||
14
Three Months Ended, | Years Ended December 31, | ||||||||||||||||||||||||||
(in thousands, except per share amounts and percentages) | December 31, 2019 | September 30, 2019 | June 30, 2019 | March 31, 2019 | December 31, 2018 | 2019 | 2018 | ||||||||||||||||||||
Net income / Average stockholders' equity (ROE) | 6.44 | % | 5.81 | % | 6.56 | % | 6.87 | % | 7.88 | % | 6.43 | % | 6.29 | % | |||||||||||||
Plus: after tax impact of restructuring costs | 0.08 | % | 0.49 | % | 1.10 | % | 0.38 | % | 2.78 | % | 0.51 | % | 0.70 | % | |||||||||||||
Plus: after tax impact of total spin-off costs | — | % | — | % | — | % | — | % | 0.23 | % | — | % | 0.96 | % | |||||||||||||
Less: after tax gain on sale of vacant Beacon land | (1.07 | )% | — | % | — | % | — | % | — | % | (0.28 | )% | — | % | |||||||||||||
Adjusted net income / Average stockholders' equity (Adjusted ROE) | 5.45 | % | 6.30 | % | 7.66 | % | 7.25 | % | 10.89 | % | 6.66 | % | 7.95 | % | |||||||||||||
Efficiency ratio | 76.94 | % | 79.38 | % | 77.87 | % | 75.73 | % | 79.46 | % | 77.47 | % | 78.77 | % | |||||||||||||
Less: impact of restructuring costs | (0.17 | )% | (1.90 | )% | (4.03 | )% | (1.36 | )% | (9.30 | )% | (1.89 | )% | (2.34 | )% | |||||||||||||
Less: impact of total spin-off costs | — | % | — | % | — | % | — | % | (0.52 | )% | — | % | (2.44 | )% | |||||||||||||
Plus: gain on sale of vacant Beacon land | 3.33 | % | — | % | — | % | — | % | — | % | 0.81 | % | — | % | |||||||||||||
Adjusted efficiency ratio | 80.10 | % | 77.48 | % | 73.84 | % | 74.37 | % | 69.64 | % | 76.39 | % | 73.99 | % | |||||||||||||
Noninterest expense / Average total assets | 2.60 | % | 2.64 | % | 2.70 | % | 2.58 | % | 2.64 | % | 2.64 | % | 2.57 | % | |||||||||||||
Less: impact of restructuring costs | (0.01 | )% | (0.06 | )% | (0.14 | )% | (0.05 | )% | (0.31 | )% | (0.07 | )% | (0.08 | )% | |||||||||||||
Less: impact of total spin-off costs | — | % | — | % | — | % | — | % | (0.02 | )% | — | % | (0.08 | )% | |||||||||||||
Adjusted noninterest expense / Average total assets | 2.59 | % | 2.58 | % | 2.56 | % | 2.53 | % | 2.31 | % | 2.57 | % | 2.41 | % | |||||||||||||
Salaries and employee benefits / Average total assets | 1.81 | % | 1.70 | % | 1.74 | % | 1.66 | % | 1.88 | % | 1.73 | % | 1.69 | % | |||||||||||||
Less: impact of restructuring costs | (0.01 | )% | (0.03 | )% | (0.05 | )% | — | % | (0.23 | )% | (0.02 | )% | (0.06 | )% | |||||||||||||
Less: impact of total Spin-off costs | — | % | — | % | — | % | — | % | — | % | — | % | (0.01 | )% | |||||||||||||
Adjusted salaries and employee benefits / Average total assets | 1.80 | % | 1.67 | % | 1.69 | % | 1.66 | % | 1.65 | % | 1.71 | % | 1.62 | % | |||||||||||||
Other operating expenses / Average total assets | 0.79 | % | 0.95 | % | 0.96 | % | 0.92 | % | 0.76 | % | 0.91 | % | 0.87 | % | |||||||||||||
Less: impact of restructuring costs | — | % | (0.04 | )% | (0.09 | )% | (0.05 | )% | (0.08 | )% | (0.05 | )% | (0.02 | )% | |||||||||||||
Less: impact of total Spin-off costs | — | % | — | % | — | % | — | % | (0.02 | )% | — | % | (0.07 | )% | |||||||||||||
Adjusted other operating expenses / Average total assets | 0.79 | % | 0.91 | % | 0.87 | % | 0.87 | % | 0.66 | % | 0.86 | % | 0.78 | % | |||||||||||||
Stockholders' equity | $ | 834,701 | $ | 825,751 | $ | 806,368 | $ | 778,749 | $ | 747,418 | $ | 834,701 | $ | 747,418 | |||||||||||||
Less: goodwill and other intangibles | (21,744 | ) | (20,933 | ) | (20,969 | ) | (21,005 | ) | (21,042 | ) | (21,744 | ) | (21,042 | ) | |||||||||||||
Tangible common stockholders' equity | $ | 812,957 | $ | 804,818 | $ | 785,399 | $ | 757,744 | $ | 726,376 | $ | 812,957 | $ | 726,376 | |||||||||||||
Total assets | $ | 7,985,399 | $ | 7,864,260 | $ | 7,926,826 | $ | 7,902,355 | $ | 8,124,347 | $ | 7,985,399 | $ | 8,124,347 | |||||||||||||
Less: goodwill and other intangibles | (21,744 | ) | (20,933 | ) | (20,969 | ) | (21,005 | ) | (21,042 | ) | (21,744 | ) | (21,042 | ) | |||||||||||||
Tangible assets | $ | 7,963,655 | $ | 7,843,327 | $ | 7,905,857 | $ | 7,881,350 | $ | 8,103,305 | $ | 7,963,655 | $ | 8,103,305 | |||||||||||||
Common shares outstanding | 43,146 | 43,205 | 43,205 | 43,205 | 43,183 | 43,146 | 43,183 | ||||||||||||||||||||
Tangible common equity ratio | 10.21 | % | 10.26 | % | 9.93 | % | 9.61 | % | 8.96 | % | 10.21 | % | 8.96 | % | |||||||||||||
Stockholders' book value per common share | $ | 19.35 | $ | 19.11 | $ | 18.66 | $ | 18.02 | $ | 17.31 | $ | 19.35 | $ | 17.31 | |||||||||||||
Tangible stockholders' book value per common share | $ | 18.84 | $ | 18.63 | $ | 18.18 | $ | 17.54 | $ | 16.82 | $ | 18.84 | $ | 16.82 | |||||||||||||
15
_________________
(1) | Expenses incurred for actions designed to implement the Company’s strategy as a new independent company. These actions include, but are not limited to reductions in workforce, streamlining operational processes, rolling out the Amerant brand, implementation of new technology system applications, enhanced sales tools and training, expanded product offerings and improved customer analytics to identify opportunities. |
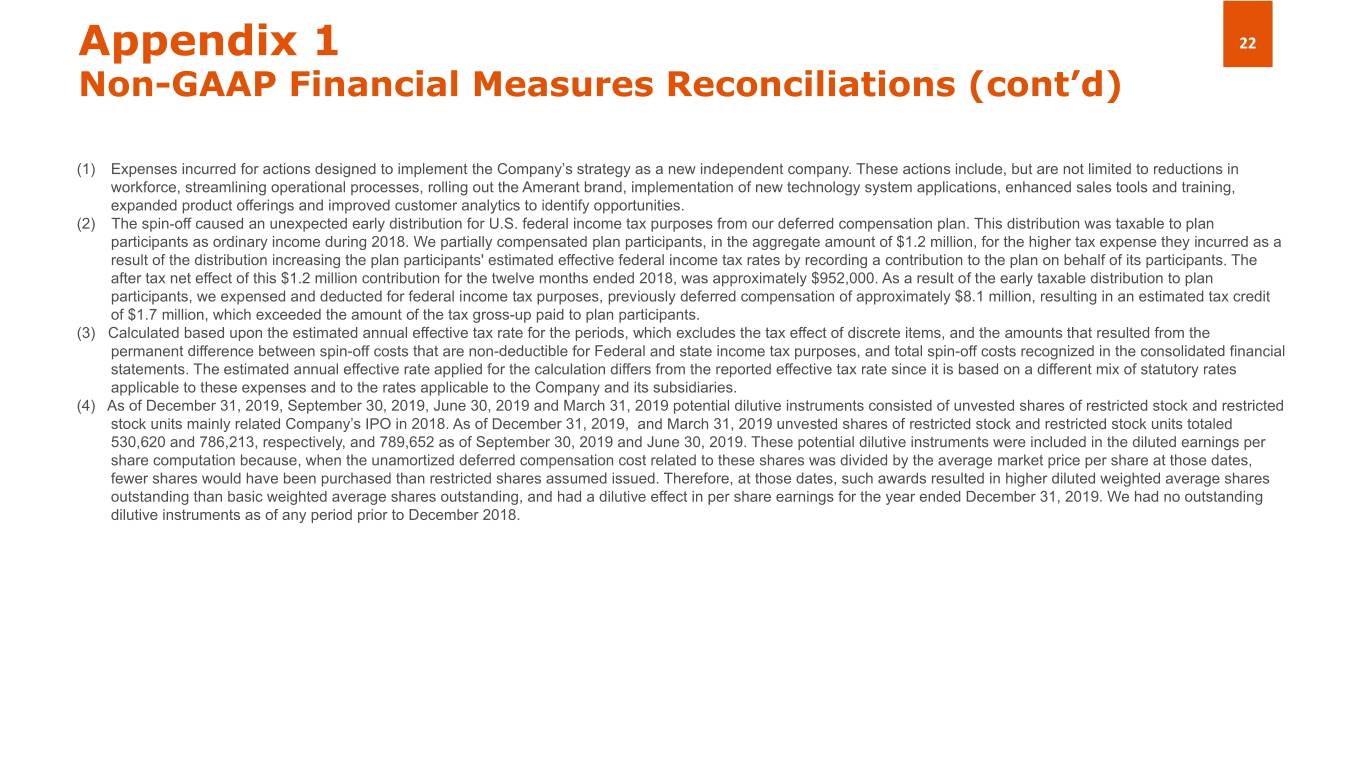
(2) The spin-off caused an unexpected early distribution for U.S. federal income tax purposes from our deferred compensation plan. This distribution was taxable to plan participants as ordinary income during 2018. We partially compensated plan participants, in the aggregate amount of $1.2 million, for the higher tax expense they incurred as a result of the distribution increasing the plan participants' estimated effective federal income tax rates by recording a contribution to the plan on behalf of its participants. The after tax net effect of this $1.2 million contribution for the period ended September 30, 2018, was approximately $952,000. As a result of the early taxable distribution to plan participants, we expensed and deducted for federal income tax purposes, previously deferred compensation of approximately $8.1 million, resulting in an estimated tax credit of $1.7 million, which exceeded the amount of the tax gross-up paid to plan participants.
(3) | Calculated based upon the estimated annual effective tax rate for the periods, which excludes the tax effect of discrete items, and the amounts that resulted from the permanent difference between spin-off costs that are non-deductible for Federal and state income tax purposes, and total spin-off costs recognized in the consolidated financial statements. The estimated annual effective rate applied for the calculation differs from the reported effective tax rate since it is based on a different mix of statutory rates applicable to these expenses and to the rates applicable to the Company and its subsidiaries. |
(4) As of December 31, 2019, September 30, 2019, June 30, 2019 and March 31, 2019 potential dilutive instruments consisted of unvested shares of restricted stock and restricted stock units mainly related to the Company’s IPO in 2018. As of December 31, 2019, and March 31, 2019 unvested shares of restricted stock and restricted stock units totaled 530,620 and 786,213, respectively, and 789,652 as of September 30, 2019 and June 30, 2019. These potential dilutive instruments were included in the diluted earnings per share computation because, when the unamortized deferred compensation cost related to these shares was divided by the average market price per share at those dates, fewer shares would have been purchased than restricted shares assumed issued. Therefore, at those dates, such awards resulted in higher diluted weighted average shares outstanding than basic weighted average shares outstanding, and had a dilutive effect in per share earnings for the year ended December 31, 2019. We had no outstanding dilutive instruments as of any period prior to December 2018.
16
Exhibit 3 - Average Balance Sheet, Interest and Yield/Rate Analysis
The following tables present average balance sheet information, interest income, interest expense and the corresponding average yields earned and rates paid for the periods presented. The average balances for loans include both performing and nonperforming balances. Interest income on loans includes the effects of discount accretion and the amortization of net deferred loan origination costs accounted for as yield adjustments. Average balances represent the daily average balances for the periods presented.
Three Months Ended | ||||||||||||||||||||||||||
December 31, 2019 | September 30, 2019 | December 31, 2018 | ||||||||||||||||||||||||
(in thousands, except percentages) | Average Balances | Income/ Expense | Yield/ Rates | Average Balances | Income/ Expense | Yield/ Rates | Average Balances | Income/ Expense | Yield/ Rates | |||||||||||||||||
Interest-earning assets: | ||||||||||||||||||||||||||
Loan portfolio, net(1) | $ | 5,627,641 | $ | 63,370 | 4.47 | % | $ | 5,656,469 | $ | 66,118 | 4.64 | % | $ | 5,897,116 | $ | 68,717 | 4.74 | % | ||||||||
Securities available for sale(2) | 1,528,916 | 9,814 | 2.55 | % | 1,472,884 | 9,681 | 2.61 | % | 1,587,286 | 10,928 | 2.78 | % | ||||||||||||||
Securities held to maturity(3) | 75,989 | 419 | 2.19 | % | 79,820 | 436 | 2.17 | % | 85,901 | 376 | 1.76 | % | ||||||||||||||
Federal Reserve Bank and FHLB stock | 71,902 | 1,044 | 5.76 | % | 68,825 | 1,071 | 6.17 | % | 73,159 | 1,131 | 6.33 | % | ||||||||||||||
Deposits with banks | 105,060 | 449 | 1.70 | % | 142,583 | 761 | 2.12 | % | 112,800 | 595 | 2.13 | % | ||||||||||||||
Marketable equity securities | 23,912 | 141 | 2.34 | % | 23,856 | 137 | 2.28 | % | 22,875 | 139 | 2.45 | % | ||||||||||||||
Total interest-earning assets | 7,433,420 | $ | 75,237 | 4.02 | % | 7,444,437 | $ | 78,067 | 4.17 | % | 7,779,137 | $ | 81,886 | 4.28 | % | |||||||||||
Total non-interest-earning assets less allowance for loan losses | 472,556 | 472,967 | 493,285 | |||||||||||||||||||||||
Total assets | $ | 7,905,976 | $ | 7,917,404 | $ | 8,272,422 | ||||||||||||||||||||
Interest-bearing liabilities: | ||||||||||||||||||||||||||
Checking and saving accounts: | ||||||||||||||||||||||||||
Interest bearing demand | $ | 1,098,532 | $ | 159 | 0.06 | % | $ | 1,141,788 | $ | 191 | 0.07 | % | $ | 1,321,797 | $ | 244 | 0.07 | % | ||||||||
Money market | 1,147,539 | 3,802 | 1.31 | % | 1,152,700 | 4,109 | 1.41 | % | 1,197,796 | 3,729 | 1.25 | % | ||||||||||||||
Savings | 337,338 | 16 | 0.02 | % | 354,554 | 16 | 0.02 | % | 399,339 | 17 | 0.02 | % | ||||||||||||||
Total checking and saving accounts | 2,583,409 | 3,977 | 0.61 | % | 2,649,042 | 4,316 | 0.65 | % | 2,918,932 | 3,990 | 0.55 | % | ||||||||||||||
Time deposits | 2,317,052 | 13,180 | 2.26 | % | 2,325,695 | 13,284 | 2.27 | % | 2,376,132 | 11,786 | 2.00 | % | ||||||||||||||
Total deposits | 4,900,461 | 17,157 | 1.39 | % | 4,974,737 | 17,600 | 1.40 | % | 5,295,064 | 15,776 | 1.20 | % | ||||||||||||||
Securities sold under agreements to repurchase | 497 | 2 | 1.60 | % | 378 | 3 | 3.15 | % | 659 | 4 | 2.45 | % | ||||||||||||||
Advances from the FHLB and other borrowings(4) | 1,214,728 | 5,575 | 1.82 | % | 1,148,739 | 6,253 | 2.16 | % | 1,241,522 | 7,253 | 2.36 | % | ||||||||||||||
Junior subordinated debentures | 92,246 | 1,241 | 5.34 | % | 106,899 | 1,748 | 6.49 | % | 118,110 | 2,069 | 7.19 | % | ||||||||||||||
Total interest-bearing liabilities | 6,207,932 | 23,975 | 1.53 | % | 6,230,753 | 25,604 | 1.63 | % | 6,655,355 | 25,102 | 1.52 | % | ||||||||||||||
Total non-interest-bearing liabilities | 868,470 | 872,488 | 884,222 | |||||||||||||||||||||||
Total liabilities | 7,076,402 | 7,103,241 | 7,539,577 | |||||||||||||||||||||||
Stockholders' equity | 829,574 | 814,163 | 732,845 | |||||||||||||||||||||||
Total liabilities and stockholders' equity | $ | 7,905,976 | $ | 7,917,404 | $ | 8,272,422 | ||||||||||||||||||||
Excess of average interest-earning assets over average interest-bearing liabilities | $ | 1,225,488 | $ | 1,213,684 | $ | 1,123,782 | ||||||||||||||||||||
Net interest income | $ | 51,262 | $ | 52,463 | $ | 56,784 | ||||||||||||||||||||
Net interest rate spread | 2.49 | % | 2.54 | % | 2.76 | % | ||||||||||||||||||||
Net interest margin(5) | 2.74 | % | 2.80 | % | 2.95 | % | ||||||||||||||||||||
Ratio of average interest-earning assets to average interest-bearing liabilities | 119.74 | % | 119.48 | % | 116.89 | % | ||||||||||||||||||||
17
Years Ended December 31, | |||||||||||||||||||||
2019 | 2018 | ||||||||||||||||||||
(in thousands, except percentages) | Average Balances | Income/ Expense | Yield/ Rates | Average Balances | Income/ Expense | Yield/ Rates | |||||||||||||||
Interest-earning assets: | |||||||||||||||||||||
Loan portfolio, net(1) | $ | 5,658,196 | $ | 263,011 | 4.65 | % | $ | 5,930,615 | $ | 257,611 | 4.34 | % | |||||||||
Securities available for sale(2) | 1,508,203 | 40,420 | 2.68 | % | 1,621,928 | 42,758 | 2.64 | % | |||||||||||||
Securities held to maturity(3) | 80,761 | 1,946 | 2.41 | % | 87,931 | 1,580 | 1.80 | % | |||||||||||||
Federal Reserve Bank and FHLB stock | 68,525 | 4,286 | 6.25 | % | 71,447 | 4,343 | 6.08 | % | |||||||||||||
Deposits with banks | 125,671 | 2,753 | 2.19 | % | 141,021 | 2,540 | 1.80 | % | |||||||||||||
Marketable equity securities | 23,611 | 558 | 2.36 | % | 23,019 | 526 | 2.29 | % | |||||||||||||
Total interest-earning assets | 7,464,967 | $ | 312,974 | 4.19 | % | 7,875,961 | $ | 309,358 | 3.93 | % | |||||||||||
Total non-interest-earning assets less allowance for loan losses | 473,412 | 497,148 | |||||||||||||||||||
Total assets | $ | 7,938,379 | $ | 8,373,109 | |||||||||||||||||
Interest-bearing liabilities: | |||||||||||||||||||||
Checking and saving accounts: | |||||||||||||||||||||
Interest bearing demand | $ | 1,177,031 | $ | 925 | 0.08 | % | $ | 1,397,783 | $ | 657 | 0.05 | % | |||||||||
Money market | 1,150,459 | 15,625 | 1.36 | % | 1,215,635 | 12,840 | 1.06 | % | |||||||||||||
Savings | 361,069 | 65 | 0.02 | % | 422,672 | 71 | 0.02 | % | |||||||||||||
Total checking and saving accounts | 2,688,559 | 16,615 | 0.62 | % | 3,036,090 | 13,568 | 0.45 | % | |||||||||||||
Time deposits | 2,344,587 | 51,757 | 2.21 | % | 2,366,423 | 42,189 | 1.78 | % | |||||||||||||
Total deposits | 5,033,146 | 68,372 | 1.36 | % | 5,402,513 | 55,757 | 1.03 | % | |||||||||||||
Securities sold under agreements to repurchase | 220 | 5 | 2.27 | % | 271 | 6 | 2.21 | % | |||||||||||||
Advances from the FHLB and other borrowings(4) | 1,134,551 | 24,325 | 2.14 | % | 1,200,701 | 26,470 | 2.20 | % | |||||||||||||
Junior subordinated debentures | 108,765 | 7,184 | 6.61 | % | 118,110 | 8,086 | 6.85 | % | |||||||||||||
Total interest-bearing liabilities | 6,276,682 | 99,886 | 1.59 | % | 6,721,595 | 90,319 | 1.34 | % | |||||||||||||
Total non-interest-bearing liabilities | 863,797 | 923,339 | |||||||||||||||||||
Total liabilities | 7,140,479 | 7,644,934 | |||||||||||||||||||
Stockholders' equity | 797,900 | 728,175 | |||||||||||||||||||
Total liabilities and stockholders' equity | $ | 7,938,379 | $ | 8,373,109 | |||||||||||||||||
Excess of average interest-earning assets over average interest-bearing liabilities | $ | 1,188,285 | $ | 1,154,366 | |||||||||||||||||
Net interest income | $ | 213,088 | $ | 219,039 | |||||||||||||||||
Net interest rate spread | 2.60 | % | 2.59 | % | |||||||||||||||||
Net interest margin(5) | 2.85 | % | 2.78 | % | |||||||||||||||||
Ratio of average interest-earning assets to average interest-bearing liabilities | 118.93 | % | 117.17 | % | |||||||||||||||||
____________
(1) Average non-performing loans of $33.0 million, $32.5 million and $25.1 million for the three months ended December 31, 2019, September 30, 2019 and December 31, 2018, respectively, and $27.4 million and $30.8 million for the years ended December 31, 2019 and 2018, respectively, are included in the average loan portfolio, net.
(2) | Includes nontaxable securities with average balances of $46.7 million, $66.5 million and $165.1million for the three months ended December 31, 2019, September 30, 2019 and December 31, 2018, respectively, and $98.1 million and $172.3 million for the years ended December 31, 2019 and 2018, respectively. The tax equivalent yield for these nontaxable securities was 3.97%, 3.92% and 4.57% for the three months ended December 31, 2019, September 30, 2019 and December 31, 2018, respectively, and 4.00% and 4.11% for the years ended December 31, 2019 and 2018, respectively. In 2019 and 2018, the tax equivalent yields were calculated by assuming a 21% tax rate and dividing the actual yield by 0.79. |
18
(3) | Includes nontaxable securities with average balances of $76.0 million, $79.8 million and $85.9 million for the three months ended December 31, 2019, September 30, 2019 and December 31, 2018, respectively, and $80.8 million and $87.8 million for the years ended December 31, 2019 and 2018, respectively. The tax equivalent yield for these nontaxable securities was 2.77%, 2.74% and 2.24% for the three months ended December 31, 2019, September 30, 2019 and December 31, 2018, respectively, and 3.05% and 2.28% for the years ended December 31, 2019 and 2018, respectively. In 2019 and 2018, the tax equivalent yields were calculated assuming a 21% tax rate and dividing the actual yield by 0.79. |
(4) | The terms of the FHLB advance agreements require the Bank to maintain certain investment securities or loans as collateral for these advances. |
(5) | Net interest margin is defined as net interest income divided by average interest-earning assets, which are loans, securities available for sale and held to maturity, deposits with banks and other financial assets which yield interest or similar income. |
Exhibit 4 - Noninterest Income
This table shows the amounts of each of the categories of noninterest income for the periods presented.
Three Months Ended | Years Ended December 31, | ||||||||||||||||||||||||||||
December 31, 2019 | September 30, 2019 | December 31, 2018 | 2019 | 2018 | |||||||||||||||||||||||||
(in thousands, except percentages) | Amount | % | Amount | % | Amount | % | Amount | % | Amount | % | |||||||||||||||||||
Deposits and service fees | $ | 4,274 | 26.8 | % | $ | 4,366 | 31.6 | % | $ | 4,431 | 36.9 | % | $ | 17,067 | 29.9 | % | $ | 17,753 | 33.0 | % | |||||||||
Brokerage, advisory and fiduciary activities | 3,865 | 24.2 | % | 3,647 | 26.4 | % | 3,860 | 32.2 | % | 14,936 | 26.2 | % | 16,849 | 31.3 | % | ||||||||||||||
Change in cash surrender value of bank owned life insurance (“BOLI”)(1) | 1,438 | 9.0 | % | 1,449 | 10.5 | % | 1,452 | 12.1 | % | 5,710 | 10.0 | % | 5,824 | 10.8 | % | ||||||||||||||
Cards and trade finance servicing fees | 557 | 3.5 | % | 1,034 | 7.5 | % | 1,044 | 8.7 | % | 3,925 | 6.9 | % | 4,424 | 8.2 | % | ||||||||||||||
(Loss) gain on early extinguishment of FHLB advances, net | (1,443 | ) | (9.0 | )% | — | — | % | — | — | % | (886 | ) | (1.6 | )% | 882 | 1.6 | % | ||||||||||||
Data processing and fees for other services | — | — | % | 70 | 0.5 | % | 500 | 4.2 | % | 955 | 1.7 | % | 2,517 | 4.7 | % | ||||||||||||||
Securities gains (losses), net | 703 | 4.4 | % | 906 | 6.5 | % | (1,000 | ) | (8.3 | )% | 2,605 | 4.6 | % | (999 | ) | (1.9 | )% | ||||||||||||
Other noninterest income (2) | 6,577 | 41.1 | % | 2,364 | 17.0 | % | 1,707 | 14.2 | % | 12,798 | 22.3 | % | 6,625 | 12.3 | % | ||||||||||||||
Total noninterest income | $ | 15,971 | 100.0 | % | $ | 13,836 | 100.0 | % | $ | 11,994 | 100.0 | % | $ | 57,110 | 100.0 | % | $ | 53,875 | 100.0 | % | |||||||||
__________________
(1) | Changes in cash surrender value of BOLI are not taxable. |
(2) | Includes $2.8 million gain on the sale of vacant land adjacent to our operations center in Q4 2019, rental income, income from derivative and foreign currency exchange transactions with customers, and valuation income on the investment balances held in the non-qualified deferred compensation plan. |
19
Exhibit 5 - Noninterest Expense
This table shows the amounts of each of the categories of noninterest expense for the periods presented.
Three Months Ended | Years Ended December 31, | ||||||||||||||||||||||||||||
December 31, 2019 | September 30, 2019 | December 31, 2018 | 2019 | 2018 | |||||||||||||||||||||||||
(in thousands, except percentages) | Amount | % | Amount | % | Amount | % | Amount | % | Amount | % | |||||||||||||||||||
Salaries and employee benefits | $ | 36,024 | 69.6 | % | $ | 33,862 | 64.2 | % | $ | 38,861 | 71.1 | % | $ | 137,380 | 65.6 | % | $ | 141,801 | 66.0 | % | |||||||||
Occupancy and equipment | 4,042 | 7.8 | % | 3,878 | 7.4 | % | 4,712 | 8.6 | % | 16,194 | 7.7 | % | 16,531 | 7.7 | % | ||||||||||||||
Professional and other services fees(1) | 4,430 | 8.6 | % | 4,295 | 8.1 | % | 3,020 | 5.5 | % | 16,123 | 7.7 | % | 19,119 | 8.9 | % | ||||||||||||||
Telecommunications and data processing | 3,396 | 6.6 | % | 3,408 | 6.5 | % | 3,261 | 6.0 | % | 13,063 | 6.2 | % | 12,399 | 5.7 | % | ||||||||||||||
Depreciation and amortization | 1,214 | 2.3 | % | 1,928 | 3.7 | % | 2,460 | 4.5 | % | 7,094 | 3.4 | % | 8,543 | 4.0 | % | ||||||||||||||
FDIC assessments and insurance | 876 | 1.7 | % | 597 | 1.1 | % | 1,722 | 3.2 | % | 4,043 | 1.9 | % | 6,215 | 2.9 | % | ||||||||||||||
Other operating expenses(2) | 1,748 | 3.4 | % | 4,769 | 9.0 | % | 612 | 1.1 | % | 15,420 | 7.5 | % | 10,365 | 4.8 | % | ||||||||||||||
Total noninterest expenses | $ | 51,730 | 100.0 | % | $ | 52,737 | 100.0 | % | $ | 54,648 | 100.0 | % | $ | 209,317 | 100.0 | % | $ | 214,973 | 100.0 | % | |||||||||
___________
(1) Other services fees include expenses on derivative contracts.
(2) Includes advertising, marketing, charitable contributions, community engagement, postage and courier expenses, provisions for possible losses on contingent loans, and debits which mirror the valuation income on the investment balances held in the non-qualified deferred compensation plan in order to adjust the liability to participants of the non-qualified deferred compensation plan.
Exhibit 6 - Loans
Loans by Type
The loan portfolio consists of the following loan classes:
(in thousands) | December 31, 2019 | September 30, 2019 | June 30, 2019 | March 31, 2019 | December 31, 2018 | ||||||||||||||
Real estate loans | |||||||||||||||||||
Commercial real estate | |||||||||||||||||||
Nonowner occupied | $ | 1,891,802 | $ | 1,933,662 | $ | 1,872,493 | $ | 1,852,903 | $ | 1,809,356 | |||||||||
Multi-family residential | 801,626 | 942,851 | 968,080 | 878,239 | 909,439 | ||||||||||||||
Land development and construction loans | 278,688 | 268,312 | 291,304 | 291,416 | 326,644 | ||||||||||||||
2,972,116 | 3,144,825 | 3,131,877 | 3,022,558 | 3,045,439 | |||||||||||||||
Single-family residential | 539,102 | 527,468 | 535,563 | 535,306 | 533,481 | ||||||||||||||
Owner occupied | 894,060 | 825,601 | 836,334 | 801,856 | 777,022 | ||||||||||||||
4,405,278 | 4,497,894 | 4,503,774 | 4,359,720 | 4,355,942 | |||||||||||||||
Commercial loans | 1,234,043 | 1,127,484 | 1,180,736 | 1,239,525 | 1,380,428 | ||||||||||||||
Loans to financial institutions and acceptances | 16,552 | 24,815 | 25,006 | 27,985 | 68,965 | ||||||||||||||
Consumer loans and overdrafts | 88,466 | 101,598 | 103,239 | 107,208 | 114,840 | ||||||||||||||
Total loans | $ | 5,744,339 | $ | 5,751,791 | $ | 5,812,755 | $ | 5,734,438 | $ | 5,920,175 | |||||||||
20
Non-Performing Assets
This table shows a summary of our non-performing assets by loan class, which includes non-performing loans and other real estate owned, or OREO, at the dates presented. Non-performing loans consist of (i) nonaccrual loans; (ii) accruing loans 90 days or more contractually past due as to interest or principal; and (iii) restructured loans that are considered TDRs.
(in thousands) | December 31, 2019 | September 30, 2019 | June 30, 2019 | March 31, 2019 | December 31, 2018 | ||||||||||||||
Non-Accrual Loans(1) | |||||||||||||||||||
Real Estate Loans | |||||||||||||||||||
Commercial real estate (CRE) | |||||||||||||||||||
Nonowner occupied | $ | 1,936 | $ | 1,936 | $ | 1,964 | $ | — | $ | — | |||||||||
Multi-family residential | — | — | 657 | 665 | — | ||||||||||||||
1,936 | 1,936 | 2,621 | 665 | — | |||||||||||||||
Single-family residential | 7,291 | 9,033 | 9,432 | 6,514 | 6,689 | ||||||||||||||
Owner occupied | 14,130 | 11,921 | 10,528 | 5,192 | 4,983 | ||||||||||||||
23,357 | 22,890 | 22,581 | 12,371 | 11,672 | |||||||||||||||
Commercial loans | 9,149 | 9,605 | 10,032 | 7,361 | 4,772 | ||||||||||||||
Consumer loans and overdrafts | 416 | 116 | 114 | 37 | 35 | ||||||||||||||
Total-Non-Accrual Loans | $ | 32,922 | $ | 32,611 | $ | 32,727 | $ | 19,769 | $ | 16,479 | |||||||||
Past Due Accruing Loans(2) | |||||||||||||||||||
Real Estate Loans | |||||||||||||||||||
Single-family residential | $ | — | $ | — | $ | — | $ | — | $ | 419 | |||||||||
Consumer loans and overdrafts | 5 | 213 | 23 | 749 | 884 | ||||||||||||||
Total Past Due Accruing Loans | 5 | 213 | 23 | 749 | 1,303 | ||||||||||||||
Total Non-Performing Loans | 32,927 | 32,824 | 32,750 | 20,518 | 17,782 | ||||||||||||||
Other Real Estate Owned | 42 | — | — | — | 367 | ||||||||||||||
Total Non-Performing Assets | $ | 32,969 | $ | 32,824 | $ | 32,750 | $ | 20,518 | $ | 18,149 | |||||||||
__________________
(1) | Includes loan modifications that meet the definition of TDRs which may be performing in accordance with their modified loan terms. As of December 31, 2019, non-performing TDRs include $9.8 million in a multiple loan relationship to a South Florida borrower. |
(2) | Loans past due 90 days or more but still accruing. |
21
Loans by Credit Quality Indicators
This tables shows the Company’s loans by credit quality indicators. We have no purchased credit-impaired loans.
December 31, 2019 | September 30, 2019 | December 31, 2018 | ||||||||||||||||||||||||||||||||||||
(in thousands) | Special Mention | Substandard | Doubtful | Total(1) | Special Mention | Substandard | Doubtful | Total(1) | Special Mention | Substandard | Doubtful | Total(1) | ||||||||||||||||||||||||||
Real estate loans | ||||||||||||||||||||||||||||||||||||||
Commercial real estate (CRE) | ||||||||||||||||||||||||||||||||||||||
Nonowner occupied | $ | 9,324 | $ | 762 | $ | 1,936 | $ | 12,022 | $ | 13,056 | $ | 1,936 | $ | — | $ | 14,992 | $ | 6,561 | $ | 222 | $ | — | $ | 6,783 | ||||||||||||||
Land development and construction loans | 9,955 | — | — | 9,955 | 10,184 | — | — | 10,184 | — | — | — | — | ||||||||||||||||||||||||||
19,279 | 762 | 1,936 | 21,977 | 23,240 | 1,936 | — | 25,176 | 6,561 | 222 | — | 6,783 | |||||||||||||||||||||||||||
Single-family residential | — | 7,291 | — | 7,291 | — | 9,033 | — | 9,033 | — | 7,108 | — | 7,108 | ||||||||||||||||||||||||||
Owner occupied | 8,138 | 14,240 | — | 22,378 | 5,719 | 15,307 | — | 21,026 | 9,019 | 9,451 | — | 18,470 | ||||||||||||||||||||||||||
27,417 | 22,293 | 1,936 | 51,646 | 28,959 | 26,276 | — | 55,235 | 15,580 | 16,781 | — | 32,361 | |||||||||||||||||||||||||||
Commercial loans | 5,569 | 8,406 | 2,669 | 16,644 | 5,077 | 11,541 | — | 16,618 | 3,943 | 6,462 | 589 | 10,994 | ||||||||||||||||||||||||||
Consumer loans and overdrafts | — | 67 | 357 | 424 | — | 2,400 | — | 2,400 | — | 6,062 | — | 6,062 | ||||||||||||||||||||||||||
$ | 32,986 | $ | 30,766 | $ | 4,962 | $ | 68,714 | $ | 34,036 | $ | 40,217 | $ | — | $ | 74,253 | $ | 19,523 | $ | 29,305 | $ | 589 | $ | 49,417 | |||||||||||||||
__________
(1)There were no loans categorized as “Loss” at any of the dates presented.
Exhibit 7 - Deposits by Country of Domicile
This tables shows the Company’s deposits by country of domicile of the depositor as of the dates presented.
(in thousands) | December 31, 2019 | September 30, 2019 | June 30, 2019 | March 31, 2019 | December 31, 2018 | ||||||||||||||
Domestic | $ | 3,121,827 | $ | 2,999,687 | $ | 3,014,269 | $ | 2,963,098 | $ | 3,001,366 | |||||||||
Foreign: | |||||||||||||||||||
Venezuela | 2,270,970 | 2,345,938 | 2,465,718 | 2,587,879 | 2,694,690 | ||||||||||||||
Others | 364,346 | 347,223 | 339,394 | 337,211 | 336,630 | ||||||||||||||
Total foreign | 2,635,316 | 2,693,161 | 2,805,112 | 2,925,090 | 3,031,320 | ||||||||||||||
Total deposits | $ | 5,757,143 | $ | 5,692,848 | $ | 5,819,381 | $ | 5,888,188 | $ | 6,032,686 | |||||||||
22