anf-20201124
0001018840false00010188402020-11-242020-11-24

UNITED STATES
SECURITIES AND EXCHANGE COMMISSION
Washington, D.C. 20549

FORM 8-K

CURRENT REPORT
Pursuant to Section 13 or 15(d) of the Securities Exchange Act of 1934

Date of Report (Date of earliest event reported): November 24, 2020

Abercrombie & Fitch Co.
(Exact name of registrant as specified in its charter)

Delaware1-1210731-1469076
(State or other jurisdiction of incorporation or organization)(Commission File Number)(I.R.S. Employer Identification No.)
6301 Fitch PathNew AlbanyOhio43054
(Address of principal executive offices)(Zip Code)
Registrant’s telephone number, including area code: (614)283-6500


Not Applicable
(Former name or former address, if changed since last report)

Check the appropriate box below if the Form 8-K filing is intended to simultaneously satisfy the filing obligation of the registrant under any of the following provisions:

     Written communications pursuant to Rule 425 under the Securities Act (17 CFR 230.425)
     Soliciting material pursuant to Rule 14a-12 under the Exchange Act (17 CFR 240.14a-12)
     Pre-commencement communications pursuant to Rule 14d-2(b) under the Exchange Act (17 CFR 240.14d-2(b))
     Pre-commencement communications pursuant to Rule 13e-4(c) under the Exchange Act (17 CFR 240.13e-4(c))

Securities registered pursuant to Section 12(b) of the Act:
Title of each classTrading symbol(s)Name of each exchange on which registered
Class A Common Stock, $0.01 Par ValueANFNew York Stock Exchange

Indicate by check mark whether the registrant is an emerging growth company as defined in Rule 405 of the Securities Act of 1933 (§230.405 of this chapter) or Rule 12b-2 of the Securities Exchange Act of 1934 (§240.12b-2 of this chapter).
                                        Emerging growth company

If an emerging growth company, indicate by check mark if the registrant has elected not to use the extended transition period for complying with any new or revised financial accounting standards provided pursuant to Section 13(a) of the Exchange Act.


Item 2.02. Results of Operations and Financial Condition.

On November 24, 2020, Abercrombie & Fitch Co. (the “Company”) issued a news release (the “Release”) reporting the Company's unaudited financial results for the third quarter and year-to-date period ended October 31, 2020. A copy of the Release is included as Exhibit 99.1 to this Current Report on Form 8-K and is incorporated herein by reference.

In conjunction with the Release, the Company also made available additional unaudited quarterly financial information for the first quarter, second quarter, third quarter and year-to-date period ended October 31, 2020, and for each of the quarters in the fiscal year ended February 1, 2020. The Company also made available additional unaudited financial information for the fiscal years ended February 1, 2020, February 2, 2019, February 3, 2018 and January 28, 2017. The additional financial information is included as Exhibit 99.2 to this Current Report on Form 8-K and is incorporated herein by reference.

In conjunction with the Release, the Company also made available an investor presentation of results for the third quarter and year-to-date period ended October 31, 2020. The presentation, which is available under the “Investors” section of the Company's website, located at corporate.abercrombie.com, is included as Exhibit 99.3 to this Current Report on Form 8-K and is incorporated herein by reference.

The Company's management conducted a conference call on November 24, 2020 to review the Company's financial results for the third quarter and year-to-date period ended October 31, 2020. A copy of the transcript of the conference call is included as Exhibit 99.4 to this Current Report on Form 8-K and is incorporated herein by reference.


Item 9.01. Financial Statements and Exhibits.

(a) through (c) Not applicable

(d) Exhibits:

The following exhibits are included with this Current Report on Form 8-K:

Exhibit No.Description
99.1
99.2
99.3
99.4
104Cover Page Interactive Data File (embedded within the Inline XBRL document)


SIGNATURE


Pursuant to the requirements of the Securities Exchange Act of 1934, the registrant has duly caused this report to be signed on its behalf by the undersigned hereunto duly authorized.


Abercrombie & Fitch Co.
Dated: November 25, 2020By:/s/ Scott Lipesky
Scott Lipesky
Senior Vice President and Chief Financial Officer


ABERCROMBIE & FITCH CO. REPORTS THIRD QUARTER RESULTS

Delivers net income per diluted share of $0.66 and $0.76 on a GAAP and non-GAAP basis, respectively, positive cash flows fueled by digital sales growth, gross profit rate expansion and operating expense leverage

Continues progress on store network optimization; Announces early exit of four more flagships through lease transfers and sublease, reducing liabilities and bringing fiscal 2020 flagship closures to seven

New Albany, Ohio, November 24, 2020: Abercrombie & Fitch Co. (NYSE: ANF) today announced results for the third quarter ended October 31, 2020. These compare to results for the third quarter ended November 2, 2019. Descriptions of the use of non-GAAP financial measures and reconciliations of GAAP and non-GAAP financial measures accompany this release.

A summary of results for the third quarter ended October 31, 2020 as compared to the third quarter ended November 2, 2019:
Net sales of $820 million, down 5% as compared to last year, reflecting the adverse impact of COVID-19 on store sales.
Digital net sales increased 43% to $382 million reflecting robust growth in every month of the quarter.
Gross profit rate improved 390 basis points to 64.0% on higher average unit retail and lower average unit cost, benefiting from inventory shrink favorability of approximately 100 basis points and changes in foreign currency exchange rates of approximately 90 basis points.
Operating expense leveraged, reflecting an ongoing focus on tightly managing costs. Operating expense as a percentage of sales decreased 160 basis points and 120 basis points on a reported and adjusted non-GAAP basis, respectively.
•     Operating income improved to $59 million and $65 million on a reported and adjusted non-GAAP basis, respectively, as compared to $14 million and $25 million last year, on a reported and adjusted non-GAAP basis, respectively.
Net income per diluted share improved to $0.66 and $0.76 on a reported and adjusted non-GAAP basis, respectively, as compared to net income per diluted share last year of $0.10 and $0.23 on a reported and adjusted non-GAAP basis, respectively.
Generated positive operating cash flows of $63 million during the third quarter ended October 31, 2020, ending the quarter with $813 million of cash and equivalents and liquidity of approximately $1.2 billion.

Fran Horowitz, Chief Executive Officer, said, “I am proud of our global teams and partners. Reflecting your ongoing hard work and perseverance, we delivered our best third quarter operating income in eight years. Results were fueled by 43% year-over-year digital sales growth and sequential sales improvements in our global store base. Updated product and marketing resonated with existing and new customers across brands and regions. Combined with a focused inventory management strategy, we expanded gross profit rate significantly while continuing to tightly manage expenses, leading to operating margin improvements over last year.”

”We are also pleased to announce the early exit of four additional flagship locations by the end of January 2021. This is in addition to the three previously announced fiscal 2020 natural lease expirations. With these seven closures, we should end the year with eight operating flagships down from fifteen at the beginning of the year. These actions align with our multi-year strategy of reducing dependence on tourist-driven locations to reposition within key markets and deliver a better omnichannel experience to our local customer.”

“We are encouraged by quarter-to-date results, including ongoing strong digital demand, with our customers responding favorably to new product and messaging. However, this is tempered by uncertainty regarding the potential for increased COVID-related store restrictions and our expectation for elevated shipping, handling and freight costs. As we approach the peak holiday selling period, inventories remain well-controlled and we have thoughtful plans in place to help us adapt to changing business conditions. As we have done since the start of the pandemic, we will utilize our proven playbooks to remain agile and provide the best omnichannel experience for our customers.”

Details related to net income per diluted share for the third quarter are as follows:
20202019
GAAP$0.66 $0.10 
Excluded items, net of tax effect (1)
(0.09)(0.12)
Adjusted non-GAAP$0.76 $0.23 
Benefit from changes in foreign currency exchange rates (2)
— 0.15 
Adjusted non-GAAP constant currency$0.76 $0.37 
(1)Excluded items consist of certain pre-tax store asset impairment charges and the tax effect of pre-tax excluded items.
(2)The estimated impact from foreign currency is calculated by applying current period exchange rates to prior year results using a 26% tax rate.
1


Net Sales
Net sales by brand and region for the third quarter are as follows:
(in thousands)20202019% Change
Net sales by brand:
Hollister$476,665 $514,772 (7)%
Abercrombie (1)
342,988 348,700 (2)%
Total company$819,653 $863,472 (5)%
Net sales by region:20202019% Change
United States$557,814 $583,593 (4)%
EMEA190,214 191,977 (1)%
APAC43,618 55,910 (22)%
Other28,007 31,992 (12)%
International$261,839 $279,879 (6)%
Total company$819,653 $863,472 (5)%
(1)    Abercrombie includes the Abercrombie & Fitch and abercrombie kids brands.

Financial Position and Liquidity
As of October 31, 2020 the company had:
Cash and equivalents of $813 million. This compares to cash and equivalents of $671 million and $411 million as of February 1, 2020 and November 2, 2019, respectively.
Inventories of $546 million, down 8% as compared to November 2, 2019.
Long-term gross borrowings under the company’s senior secured notes of $350 million (the “Senior Secured Notes”) which mature in July 2025 and bear interest at a rate of 8.75% per annum.
Borrowing available under the senior-secured asset-based revolving credit facility (the “ABL Facility”) of $345 million.
Liquidity, comprised of cash and equivalents and borrowing available under the ABL Facility, of approximately $1.2 billion. This compares to liquidity of $914 million and $770 million as of February 1, 2020 and November 2, 2019, respectively.

Cash Flow and Capital Allocation
Details related to the company’s cash flows for the year-to-date period ended October 31, 2020 are as follows:
Net cash provided by operating activities of $159 million.
Net cash used for investing activities of $92 million. Based on actions taken, the company expects capital expenditures for fiscal 2020 to now be approximately $110 million as compared to $203 million of capital expenditures in fiscal 2019.
Net cash provided by financing activities of $70 million, reflecting the issuance of the Senior Secured Notes of $350 million which were used, along with existing cash on hand, to repay outstanding borrowings under the credit facilities.

The company has returned $28 million to shareholders during the year-to-date period ended October 31, 2020 through share repurchases and dividends, prior to the company’s decision to temporarily suspend its share repurchase and dividend programs in light of COVID-19.

Depreciation and amortization was $127 million for the year-to-date period ended October 31, 2020.

Flagship Store Update
As part of its ongoing global store network optimization initiative and stated goal of repositioning from larger format, tourist-dependent flagship locations to smaller, omni-enabled stores that cater to local customers, the company is announcing the early exit of four European Abercrombie & Fitch flagship locations. The Dusseldorf flagship closed during the third quarter, and the London, Munich and Paris flagships will close by the end of January 2021, all well ahead of their natural lease expirations. Three of the leases will be transferred to a new tenant while the fourth will be subleased to a new tenant. The company no longer has lease obligations beyond fiscal 2020 for the three transfers and is scheduled to receive payments to fully offset its lease obligations on the sublease.

The company has recognized a pre-tax gain of $8 million in the current quarter related to flagship store exit activity, primarily due to a gain on lease assignment and updates to previously established accruals for asset retirement and severance obligations related to the four closures.

In addition to the four early exits, the Brussels, Madrid and Fukuoka flagships will close in early January 2021 due to natural lease expirations leaving the company with eight operating flagships at year end down from fifteen at the beginning of the year.

2


The seven flagship locations that will close in fiscal 2020 represent a combined 200,000 gross square feet, or about 3% of total company gross square footage and 10% of the Abercrombie & Fitch brand square footage as of fiscal year-end 2019. In fiscal 2019, these seven flagships had a combined adverse impact of approximately 20 basis points to comparable sales and approximately 10 basis points to operating margin. The combined stores contributed approximately 1% to revenues and approximately $30 million to annualized payroll and occupancy in fiscal 2019. Fiscal year-to-date, the comparable sales and operating margin drag has been meaningfully worse due to COVID-19.

With the planned closures of these seven underperforming locations, the company removed approximately $85 million of lease liabilities from the balance sheet, reflecting the early exit from certain leases and the corresponding elimination of lease payments previously scheduled for fiscal 2021 through 2031.

See the company's third quarter investor presentation for additional information regarding the company’s flagship store fleet.

Conference Call
Today at 8:30 AM, ET, the company will conduct a conference call. To listen to the conference call, dial (800) 458-4121 or go to corporate.abercrombie.com. The international call-in number is (323) 794-2093. This call will be recorded and made available by dialing the replay number (888) 203-1112 or the international number (719) 457-0820 followed by the conference ID number 7344326 or through corporate.abercrombie.com. A presentation of third quarter results will be available in the “Investors” section at corporate.abercrombie.com at approximately 7:30 AM, ET, today.

Safe Harbor Statement Under the Private Securities Litigation Reform Act of 1995
A&F cautions that any forward-looking statements (as such term is defined in the Private Securities Litigation Reform Act of 1995) contained in this Press Release or made by management or spokespeople of A&F involve risks and uncertainties and are subject to change based on various important factors, many of which may be beyond the company’s control. Words such as “estimate,” “project,” “plan,” “believe,” “expect,” “anticipate,” “intend,” and similar expressions may identify forward-looking statements. Except as may be required by applicable law, we undertake no obligation to publicly update or revise any forward-looking statements. The following factors, in addition to those disclosed in “ITEM 1A. RISK FACTORS” of A&F’s Annual Report on Form 10-K for the fiscal year ended February 1, 2020, and in A&F’s subsequently filed quarterly reports on Form 10-Q, in some cases have affected, and in the future could affect, A&F’s financial performance and could cause actual results for fiscal 2020 and beyond to differ materially from those expressed or implied in any of the forward-looking statements included in this Press Release or otherwise made by management: the current outbreak of the novel coronavirus, or COVID-19, has materially adversely impacted and disrupted, and may continue to materially adversely impact and cause disruption to, our business, financial performance and condition, operating results, liquidity and cash flows; the spread of the COVID-19 outbreak has caused significant disruptions in the United States and global economy, the extent of the impact and duration of which is not yet known and any future outbreak of any other highly infectious or contagious disease could have a similar impact; changes in global economic and financial conditions, and the resulting impact on consumer confidence and consumer spending, as well as other changes in consumer discretionary spending habits could have a material adverse impact on our business; failure to engage our customers, anticipate customer demand and changing fashion trends, and manage our inventory commensurately could have a material adverse impact on our business; our failure to operate in a highly competitive and constantly evolving industry could have a material adverse impact on our business; fluctuations in foreign currency exchange rates could have a material adverse impact on our business; our ability to attract customers to our stores depends, in part, on the success of the shopping malls or area attractions that our stores are located in or around; the impact of war, acts of terrorism, mass casualty events or civil unrest could have a material adverse impact on our business; the impact of extreme weather, infectious disease outbreaks, including COVID-19, and other unexpected events could result in an interruption to our business, as well as to the operations of our third-party partners, and have a material adverse impact on our business; failure to successfully develop an omnichannel shopping experience, a significant component of our growth strategy, or failure to successfully invest in customer, digital and omnichannel initiatives could have a material adverse impact on our business; our failure to optimize our global store network could have a material adverse impact on our business; our failure to execute our international growth strategy successfully and inability to conduct business in international markets as a result of legal, tax, regulatory, political and economic risks could have a material adverse impact on our business; failure to protect our reputation could have a material adverse impact on our business; if our information technology systems are disrupted or cease to operate effectively it could have a material adverse impact on our business; we may be exposed to risks and costs associated with cyber-attacks, data protection, credit card fraud and identity theft that could have a material adverse impact on our business; our reliance on our distribution centers makes us susceptible to disruptions or adverse conditions affecting our supply chain; changes in the cost, availability and quality of raw materials, labor, transportation, and trade relations could have a material adverse impact on our business; we depend upon independent third parties for the manufacture and delivery of all our merchandise, and a disruption of the manufacture or delivery of our merchandise could have a material adverse impact on our business; we rely on the experience and skills of our executive officers and associates, and the failure to attract or retain this talent, or effectively manage succession could have a material adverse impact on our business; fluctuations in our tax obligations and effective tax rate may result in volatility in our results of operations could have a material adverse impact on our business; our litigation exposure, or any securities litigation and shareholder activism, could have a material adverse impact on our business; failure to adequately protect our trademarks could have a negative impact on our brand image and limit our ability to penetrate new markets which could have a material adverse
3


impact on our business; changes in the regulatory or compliance landscape could have a material adverse impact on our business; and the agreements related to our senior secured asset-based revolving credit facility and our senior secured notes include restrictive covenants that limit our flexibility in operating our business and our inability to obtain credit on reasonable terms in the future could have an adverse impact on our business.

About Abercrombie & Fitch Co.
Abercrombie & Fitch Co. (NYSE: ANF) is a leading, global specialty retailer of apparel and accessories for men, women and kids through three renowned brands. Abercrombie & Fitch believes that every day should feel as exceptional as the start of the long weekend. Since 1892, the brand has been a specialty retailer of quality apparel, outerwear and fragrance - designed to inspire our global customers to feel confident, be comfortable and face their Fierce. The quintessential retail brand of the global teen consumer, Hollister Co. believes in liberating the spirit of an endless summer inside everyone. At Hollister, summer isn’t just a season, it’s a state of mind. Hollister creates carefree style designed to make all teens feel celebrated and comfortable in their own skin, so they can live in a summer mindset all year long, whatever the season. A global specialty retailer of quality, comfortable, made-to-play favorites, abercrombie kids sees the world through kids’ eyes, where play is life and every day is an opportunity to be anything and better everything.

The brands share a commitment to offering products of enduring quality and exceptional comfort that allow consumers around the world to express their own individuality and style. The company operates approximately 850 stores under these brands across North America, Europe, Asia and the Middle East, as well as the e-commerce sites www.abercrombie.com and www.hollisterco.com.
Investor Contact:Media Contact:
Pamela QuintilianoMackenzie Gusweiler
Abercrombie & Fitch Co.Abercrombie & Fitch Co.
(614) 283-6751(614) 283-6192
[email protected][email protected]

4


Abercrombie & Fitch Co.
Condensed Consolidated Statements of Operations
(in thousands, except per share data)
(Unaudited)
Thirteen Weeks EndedThirteen Weeks Ended
October 31, 2020% of
Net Sales
November 2, 2019% of
Net Sales
Net sales$819,653 100.0 %$863,472 100.0 %
Cost of sales, exclusive of depreciation and amortization295,220 36.0 %344,541 39.9 %
Gross profit524,433 64.0 %518,931 60.1 %
Stores and distribution expense346,263 42.2 %377,697 43.7 %
Marketing, general and administrative expense121,000 14.8 %114,075 13.2 %
Flagship store exit (benefits) charges(8,063)(1.0)%285 0.0 %
Asset impairment, exclusive of flagship store exit charges6,329 0.8 %12,610 1.5 %
Other operating loss (income), net288 0.0 %(215)0.0 %
Operating income58,616 7.2 %14,479 1.7 %
Interest expense, net8,808 1.1 %2,922 0.3 %
Income before income taxes49,808 6.1 %11,557 1.3 %
Income tax expense5,779 0.7 %3,987 0.5 %
Net income44,029 5.4 %7,570 0.9 %
Less: Net income attributable to noncontrolling interests1,758 0.2 %1,047 0.1 %
Net income attributable to Abercrombie & Fitch Co.$42,271 5.2 %$6,523 0.8 %
Net income per share attributable to Abercrombie & Fitch Co.:
Basic$0.68 $0.10 
Diluted$0.66 $0.10 
Weighted-average shares outstanding:
Basic62,558 63,099 
Diluted63,877 63,911 


5


Abercrombie & Fitch Co.
Condensed Consolidated Statements of Operations
(in thousands, except per share data)
(Unaudited)
Thirty-nine Weeks EndedThirty-nine Weeks Ended
October 31, 2020% of
Net Sales
November 2, 2019% of
Net Sales
Net sales$2,003,340 100.0 %$2,438,522 100.0 %
Cost of sales, exclusive of depreciation and amortization791,154 39.5 %976,868 40.1 %
Gross profit1,212,186 60.5 %1,461,654 59.9 %
Stores and distribution expense978,757 48.9 %1,110,656 45.5 %
Marketing, general and administrative expense326,509 16.3 %341,716 14.0 %
Flagship store exit (benefits) charges(12,490)(0.6)%47,023 1.9 %
Asset impairment, exclusive of flagship store exit charges57,340 2.9 %14,987 0.6 %
Other operating income, net(1,562)(0.1)%(465)0.0 %
Operating loss(136,368)(6.8)%(52,263)(2.1)%
Interest expense, net19,277 1.0 %4,908 0.2 %
Loss before income taxes(155,645)(7.8)%(57,171)(2.3)%
Income tax expense (benefit)38,565 1.9 %(16,931)(0.7)%
Net loss(194,210)(9.7)%(40,240)(1.7)%
Less: Net income attributable to noncontrolling interests2,203 0.1 %3,534 0.1 %
Net loss attributable to Abercrombie & Fitch Co.$(196,413)(9.8)%$(43,774)(1.8)%
Net loss per share attributable to Abercrombie & Fitch Co.:
Basic$(3.14)$(0.67)
Diluted$(3.14)$(0.67)
Weighted-average shares outstanding:
Basic62,541 64,932 
Diluted62,541 64,932 

6


Reporting and Use of GAAP and Non-GAAP Measures
The company believes that each of the non-GAAP financial measures presented are useful to investors as they provide a measure of the company’s operating performance excluding the effect of certain items which the company believes do not reflect its future operating outlook, such as certain asset impairment charges related to the company’s flagship stores and significant impairments primarily attributable to the COVID-19 pandemic, therefore supplementing investors’ understanding of comparability of operations across periods. Management used these non-GAAP financial measures during the periods presented to assess the company’s performance and to develop expectations for future operating performance. Non-GAAP financial measures should be used supplemental to, and not as an alternative to, the company’s GAAP financial results, and may not be calculated in the same manner as similar measures presented by other companies.

In addition, at times the company provides comparable sales, defined as the percentage year-over-year change in the aggregate of: (1) sales for stores that have been open as the same brand at least one year and whose square footage has not been expanded or reduced by more than 20% within the past year, with prior year’s net sales converted at the current year’s foreign currency exchange rate to remove the impact of foreign currency rate fluctuation, and (2) direct-to-consumer sales with prior year’s net sales converted at the current year’s foreign currency exchange rate to remove the impact of foreign currency rate fluctuation. 

The company also provides certain financial information on a constant currency basis to enhance investors’ understanding of underlying business trends and operating performance, by removing the impact of foreign currency exchange rate fluctuations. The effect from foreign currency, calculated on a constant currency basis, is determined by applying current year average exchange rates to prior year results and is net of the year-over-year impact from hedging. The per diluted share effect from foreign currency is calculated using a 26% tax rate.

At times, the company may also refer to certain non-GAAP store-level metrics, including 4-wall operating margins. Store-level 4-wall operating margins exclude certain components of the company’s results of operations, including but not limited to, amounts related to marketing, depreciation and amortization related to home-office and IT assets, distribution center expense, direct-to-consumer expense, and other corporate overhead expenses that are considered normal operating costs as well as all asset impairment and flagship store exit charges. This measure also excludes certain product costs related to direct-to-consumer, wholesale, licensing and franchise operations as well as variances from estimated freight and import costs, and provisions for inventory shrink and lower of cost or net realizable value. In addition, this metric excludes revenue other than store sales and does not include gift card breakage. As such, store-level 4-wall operating margins is not indicative of the overall results of the company and does not accrue directly to the benefit of shareholders because of these exclusions. The company provides store-level 4-wall operating margins on occasion because it believes that it provides a meaningful supplement to the company’s operating results.

Abercrombie & Fitch Co.
Schedule of Non-GAAP Financial Measures
Thirteen Weeks Ended October 31, 2020
(in thousands, except per share data)
(Unaudited)
GAAP (1)
Excluded itemsAdjusted
non-GAAP
Asset impairment, exclusive of flagship store exit charges (2)
$6,329 $6,329 $— 
Operating income58,616 (6,329)64,945 
Income before income taxes49,808 (6,329)56,137 
Income tax expense (3)
5,779 (369)6,148 
Net income attributable to Abercrombie & Fitch Co.$42,271 $(5,960)$48,231 
Net income per diluted share attributable to Abercrombie & Fitch Co.$0.66 $(0.09)$0.76 
Diluted weighted-average shares outstanding:63,877 63,877 

(1)    “GAAP” refers to accounting principles generally accepted in the United States of America.
(2)    Excluded items consist of pre-tax store asset impairment charges of $6.3 million, which are principally the result of the impact of COVID-19 on store cash flows.
(3)    The tax effect of excluded items is the difference between the tax provision calculated on a GAAP basis and an adjusted non-GAAP basis.
7


Abercrombie & Fitch Co.
Schedule of Non-GAAP Financial Measures
Thirteen Weeks Ended November 2, 2019
(in thousands, except per share data)
(Unaudited)
GAAP (1)
Excluded itemsAdjusted
non-GAAP
Asset impairment, exclusive of flagship store exit charges (2)
$12,610 10,468 $2,142 
Operating income14,479 (10,468)24,947 
Income before income taxes11,557 (10,468)22,025 
Income tax expense (3)
3,987 (2,485)6,472 
Net income attributable to Abercrombie & Fitch Co.$6,523 $(7,983)$14,506 
Net income per diluted share attributable to Abercrombie & Fitch Co.$0.10 $(0.12)$0.23 
Diluted weighted-average shares outstanding:63,911 63,911 

(1)    “GAAP” refers to accounting principles generally accepted in the United States of America.
(2)    Excluded items consist of pre-tax store asset impairment charges of $10.5 million related to certain of the company’s international Abercrombie & Fitch flagship stores.
(3)    The tax effect of excluded items is the difference between the tax provision calculated on a GAAP basis and an adjusted non-GAAP basis.


8


Abercrombie & Fitch Co.
Schedule of Non-GAAP Financial Measures
Thirty-nine Weeks Ended October 31, 2020
(in thousands, except per share data)
(Unaudited)
GAAP (1)
Excluded itemsAdjusted
non-GAAP
Asset impairment, exclusive of flagship store exit charges (2)
$57,340 $57,340 $— 
Operating loss(136,368)(57,340)(79,028)
Loss before income taxes(155,645)(57,340)(98,305)
Income tax expense (3)
38,565 (3,635)42,200 
Net loss attributable to Abercrombie & Fitch Co.$(196,413)$(53,705)$(142,708)
Net loss per diluted share attributable to Abercrombie & Fitch Co.$(3.14)$(0.86)$(2.28)
Diluted weighted-average shares outstanding:62,541 62,541 

(1)    “GAAP” refers to accounting principles generally accepted in the United States of America.
(2)    Excluded items consist of pre-tax store asset impairment charges of $57.3 million which are principally the result of the impact of COVID-19 on store cash flows.
(3)    The tax effect of excluded items is the difference between the tax provision calculated on a GAAP basis and an adjusted non-GAAP basis.


9


Abercrombie & Fitch Co.
Schedule of Non-GAAP Financial Measures
Thirty-nine Weeks Ended November 2, 2019
(in thousands, except per share data)
(Unaudited)
GAAP (1)
Excluded itemsAdjusted
non-GAAP
Asset impairment, exclusive of flagship store exit charges (2)
$14,987 10,468 $4,519 
Operating loss(52,263)(10,468)(41,795)
Loss before income taxes(57,171)(10,468)(46,703)
Income tax benefit (3)
(16,931)(2,485)(14,446)
Net loss attributable to Abercrombie & Fitch Co.$(43,774)$(7,983)$(35,791)
Net loss per diluted share attributable to Abercrombie & Fitch Co.$(0.67)$(0.12)$(0.55)
Diluted weighted-average shares outstanding:64,932 64,932 

(1)    “GAAP” refers to accounting principles generally accepted in the United States of America.
(2)    Excluded items consist of pre-tax store asset impairment charges of $10.5 million related to certain of the company’s international Abercrombie & Fitch flagship stores.
(3)    The tax effect of excluded items is the difference between the tax provision calculated on a GAAP basis and an adjusted non-GAAP basis.
10


Abercrombie & Fitch Co.
Reconciliation of Constant Currency Financial Measures
Thirteen Weeks Ended October 31, 2020
(in thousands, except percentage and basis point changes and per share data)
(Unaudited)
20202019% Change
Net sales
GAAP (1)
$819,653 $863,472 (5)%
Benefit from changes in foreign currency exchange rates (2)
— 11,896 (1)%
Non-GAAP constant currency basis$819,653 $875,368 (6)%
Gross profit20202019
BPS Change (3)
GAAP (1)
$524,433 $518,931 390
Benefit from changes in foreign currency exchange rates (2)
— 14,779 (90)
Non-GAAP constant currency basis$524,433 $533,710 300
Operating income20202019
BPS Change (3)
GAAP (1)
$58,616 $14,479 550
Excluded items (4)
(6,329)(10,468)40
Adjusted non-GAAP $64,945 $24,947 500
Benefit from changes in foreign currency exchange rates (2)
— 7,410 (80)
Adjusted non-GAAP constant currency basis$64,945 $32,357 420
Net income per diluted share attributable to Abercrombie & Fitch Co.20202019$ Change
GAAP (1)
$0.66 $0.10 $0.56
Excluded items, net of tax (4)
(0.09)(0.12)0.03
Adjusted non-GAAP $0.76 $0.23 $0.53
Benefit from changes in foreign currency exchange rates (2)
— 0.15 (0.15)
Adjusted non-GAAP constant currency basis$0.76 $0.37 $0.39

(1)    “GAAP” refers to accounting principles generally accepted in the United States of America.
(2)    The estimated impact from foreign currency is determined by applying current period exchange rates to prior year results and is net of the year-over-year impact from hedging. The per diluted share estimated impact from foreign currency is calculated using a 26% tax rate.
(3)    The estimated basis point change has been rounded based on the percentage change.
(4)    Excluded items this year consist of pre-tax store asset impairment charges of $6.3 million, which are principally the result of the impact of COVID-19 on store cash flows. Excluded items last year consist of pre-tax store asset impairment charges of $10.5 million related to certain of the company’s international Abercrombie & Fitch flagship stores.
11


Abercrombie & Fitch Co.
Condensed Consolidated Balance Sheets
(in thousands)
(Unaudited)
October 31, 2020February 1, 2020November 2, 2019
Assets
Current assets:
Cash and equivalents$812,881 $671,267 $410,775 
Receivables89,074 80,251 92,736 
Inventories545,548 434,326 590,883 
Other current assets73,776 78,905 86,275 
Total current assets1,521,279 1,264,749 1,180,669 
Property and equipment, net593,932 665,290 665,862 
Operating lease right-of-use assets955,781 1,230,954 1,223,512 
Other assets205,970 388,672 415,962 
Total assets$3,276,962 $3,549,665 $3,486,005 
Liabilities and stockholders’ equity
Current liabilities:
Accounts payable$334,775 $219,919 $269,578 
Accrued expenses356,370 302,214 269,334 
Short-term portion of operating lease liabilities255,775 282,829 284,694 
Income taxes payable6,663 10,392 13,728 
Total current liabilities953,583 815,354 837,334 
Long-term liabilities:
Long-term portion of operating lease liabilities$1,010,051 $1,252,634 $1,234,502 
Long-term borrowings, net343,559 231,963 241,343 
Other liabilities110,965 178,536 178,460 
Total long-term liabilities1,464,575 1,663,133 1,654,305 
Total Abercrombie & Fitch Co. stockholders’ equity849,379 1,058,810 983,512 
Noncontrolling interests9,425 12,368 10,854 
Total stockholders’ equity858,804 1,071,178 994,366 
Total liabilities and stockholders’ equity$3,276,962 $3,549,665 $3,486,005 

12


Abercrombie & Fitch Co.
Condensed Consolidated Statements of Cash Flows
(in thousands, except per share data)
(Unaudited)
 Thirty-nine Weeks Ended
 October 31, 2020November 2, 2019
Operating activities
Net cash provided by (used for) operating activities$158,894 $(33,839)
Investing activities
Purchases of property and equipment$(91,748)$(154,373)
Net cash used for investing activities$(91,748)$(154,373)
Financing activities
Proceeds from issuance of senior secured notes$350,000 $— 
Proceeds from borrowings under the asset-based senior secured credit facility210,000 — 
Repayment of term loan facility borrowings(233,250)(10,000)
Repayment of borrowings under the asset-based senior secured credit facility(210,000)— 
Payment of debt issuance costs and fees(7,151)— 
Purchases of common stock(15,172)(63,542)
Dividends paid(12,556)(38,959)
Other financing activities(11,742)(10,407)
Net cash provided by (used for) financing activities$70,129 $(122,908)
Effect of foreign currency exchange rates on cash$2,269 $(2,686)
Net increase (decrease) in cash and equivalents, and restricted cash and equivalents$139,544 $(313,806)
Cash and equivalents, and restricted cash and equivalents, beginning of period$692,264 $745,829 
Cash and equivalents, and restricted cash and equivalents, end of period$831,808 $432,023 

13


Abercrombie & Fitch Co.
Store Count

Thirteen Weeks Ended October 31, 2020
Hollister (1)
Abercrombie (2)
Total
United StatesInternationalUnited StatesInternationalUnited StatesInternational
August 1, 202038615525356639211
New123
Permanently closed(1)(1)(2)(1)(3)
October 31, 202038615425554641208
Thirty-nine Weeks Ended October 31, 2020
Hollister (1)
Abercrombie (2)
Total
United StatesInternationalUnited StatesInternationalUnited StatesInternational
February 1, 202039115525652647207
New224466
Permanently closed(7)(3)(5)(2)(12)(5)
October 31, 202038615425554641208
(1)Locations with Gilly Hicks carveouts within Hollister stores are represented as a single store count. Excludes nine international franchise stores as of each of October 31, 2020, August 1, 2020 and February 1, 2020, respectively. Excludes 15 Company-operated temporary stores as of each of October 31, 2020 and August 1, 2020, and 16 Company-operated temporary stores as of February 1, 2020.
(2)Abercrombie includes the company's Abercrombie & Fitch and abercrombie kids brands. Locations with abercrombie kids carveouts within Abercrombie & Fitch stores are represented as a single store count. Excludes eight international franchise stores as of each of October 31, 2020 and August 1, 2020, and seven international franchise stores as of February 1, 2020. Excludes five, six, and eight Company-operated temporary stores as of October 31, 2020, August 1, 2020, and February 1, 2020 respectively.
14

Abercrombie & Fitch Co.
Financial Information
(Unaudited)
(in thousands, except per share data and store data)
Fiscal 2019Fiscal 2020
2016
2017 (1)
2018Q1Q2Q3Q42019Q1Q2Q32020
Net sales$3,326,740 $3,492,690 $3,590,109 $733,972 $841,078 $863,472 $1,184,551 $3,623,073 $485,359 $698,328 $819,653 $2,003,340 
Cost of sales, exclusive of depreciation and amortization1,298,172 1,408,848 1,430,193 289,882 342,445 344,541 495,287 1,472,155 221,214 274,720 295,220 791,154 
Gross profit2,028,568 2,083,842 2,159,916 444,090 498,633 518,931 689,264 2,150,918 264,145 423,608 524,433 1,212,186 
Stores and distribution expense1,562,703 1,540,032 1,536,216 356,612 376,347 377,697 440,587 1,551,243 322,124 310,370 346,263 978,757 
Marketing, general and administrative expense453,202 471,914 484,863 111,947 115,694 114,075 122,899 464,615 108,257 97,252 121,000 326,509 
Flagship store exit charges (benefits)15,757 2,393 5,806 1,744 44,994 285 234 47,257 (543)(3,884)(8,063)(12,490)
Asset impairment, exclusive of flagship store exit charges7,930 14,391 11,580 1,662 715 12,610 4,148 19,135 42,928 8,083 6,329 57,340 
Other operating (income) loss, net(26,212)(16,938)(5,915)(617)367 (215)(935)(1,400)506 (2,356)288 (1,562)
Operating income (loss)15,188 72,050 127,366 (27,258)(39,484)14,479 122,331 70,068 (209,127)14,143 58,616 (136,368)
Interest expense, net18,666 16,889 10,999 616 1,370 2,922 2,829 7,737 3,371 7,098 8,808 19,277 
(Loss) income before income taxes(3,478)55,161 116,367 (27,874)(40,854)11,557 119,502 62,331 (212,498)7,045 49,808 (155,645)
Income tax (benefit) expense(11,196)44,636 37,559 (9,588)(11,330)3,987 34,302 17,371 31,533 1,253 5,779 38,565 
Net income (loss)7,718 10,525 78,808 (18,286)(29,524)7,570 85,200 44,960 (244,031)5,792 44,029 (194,210)
Less: Net income attributable to noncontrolling interests3,762 3,431 4,267 869 1,618 1,047 2,068 5,602 117 328 1,758 2,203 
Net income (loss) attributable to Abercrombie & Fitch Co.$3,956 $7,094 $74,541 $(19,155)$(31,142)$6,523 $83,132 $39,358 $(244,148)$5,464 $42,271 $(196,413)
Fiscal 2019Fiscal 2020
2016
2017 (1)
2018Q1Q2Q3Q42019Q1Q2Q32020
Net income (loss) per share attributable to Abercrombie & Fitch Co.:
 Basic$0.06 $0.10 $1.11 $(0.29)$(0.48)$0.10 $1.32 $0.61 $(3.90)$0.09 $0.68 $(3.14)
 Diluted$0.06 $0.10 $1.08 $(0.29)$(0.48)$0.10 $1.29 $0.60 $(3.90)$0.09 $0.66 $(3.14)
Weighted-average shares outstanding:
 Basic67,878 68,391 67,350 66,540 65,156 63,099 62,916 64,428 62,541 62,527 62,558 62,541 
 Diluted68,284 69,403 69,137 66,540 65,156 63,911 64,198 65,778 62,541 63,286 63,877 62,541 
Hollister comparable sales (2)
%%%%%(2)%(2)%(1)%Not providedNot providedNot providedNot provided
Abercrombie comparable sales (2) (3)
(11)%(2)%%%%%%%Not providedNot providedNot providedNot provided
Comparable sales (2)
(5)%%%%%%%%Not providedNot providedNot providedNot provided
Shares outstanding67,758 68,195 66,227 66,637 63,146 62,757 62,786 62,786 62,284 62,365 62,384 62,384 
 Number of stores - end of period898 868 861 857 863 881 854 854 849 850 849 849 
 Gross square feet - end of period7,007 6,710 6,566 6,503 6,476 6,556 6,303 6,303 6,265 6,277 6,217 6,217 
(1) Fiscal 2017 was a fifty-three week year.
(2) Comparable sales are calculated on a constant currency basis and exclude revenue other than store and online sales. The Company did not provide comparable sales results for fiscal 2020 due to widespread temporary store closures as a result of COVID-19.
(3) Abercrombie includes the Company's Abercrombie & Fitch and abercrombie kids brands.
1
INVESTOR PRESENTATION: THIRD QUARTER 2020

 
2 SAFE HARBOR STATEMENT UNDER THE PRIVATE SECURITIES LITIGATION REFORM ACT OF 1995 A&F cautions that any forward-looking statements (as such term is defined in the Private Securities Litigation Reform Act of 1995) contained in this presentation or made by management or spokespeople of A&F involve risks and uncertainties and are subject to change based on various important factors, many of which may be beyond the company's control. Words such as "estimate," "project," "plan," "believe," "expect," "anticipate," "intend," and similar expressions may identify forward-looking statements. Except as may be required by applicable law, we assume no obligation to publicly update or revise our forward-looking statements. Risks and uncertainties related to the duration and impact of the COVID-19 pandemic on the Company and the factors disclosed in "ITEM 1A. RISK FACTORS" of A&F's Annual Report on Form 10-K for the fiscal year ended February 1, 2020,  and in A&F's quarterly reports on Form 10-Q, in some cases have affected, and in the future could affect, the company's financial performance and could cause actual results for the 2020 fiscal year and beyond to differ materially from those expressed or implied in any of the forward-looking statements included in this presentation or otherwise made by management. OTHER INFORMATION The following presentation includes certain adjusted non-GAAP financial measures. Additional details about non-GAAP financial measures and a reconciliation of GAAP financial measures to non-GAAP financial measures is included in the news release issued by the company on November 24, 2020 which is available in the "Investors" section of the company's website, located at corporate.abercrombie.com. As used in the presentation, "GAAP" refers to accounting principles generally accepted in the United States of America. As used in the presentation, "Abercrombie" refers to the company's Abercrombie & Fitch and abercrombie kids brands. Sub-totals and totals may not foot due to rounding. Net income and net income per share financial measures included herein are attributable to Abercrombie & Fitch Co., excluding net income attributable to noncontrolling interests.

 
3 TABLE OF CONTENTS Safe Harbor and Other Information 2 Company Overview 4 Response to COVID-19 7 Q3 2020 Results 12 Financial Position, Liquidity & Capital Allocation 18 Global Store Network Optimization 24 Appendix 29


 
4 COMPANY OVERVIEW
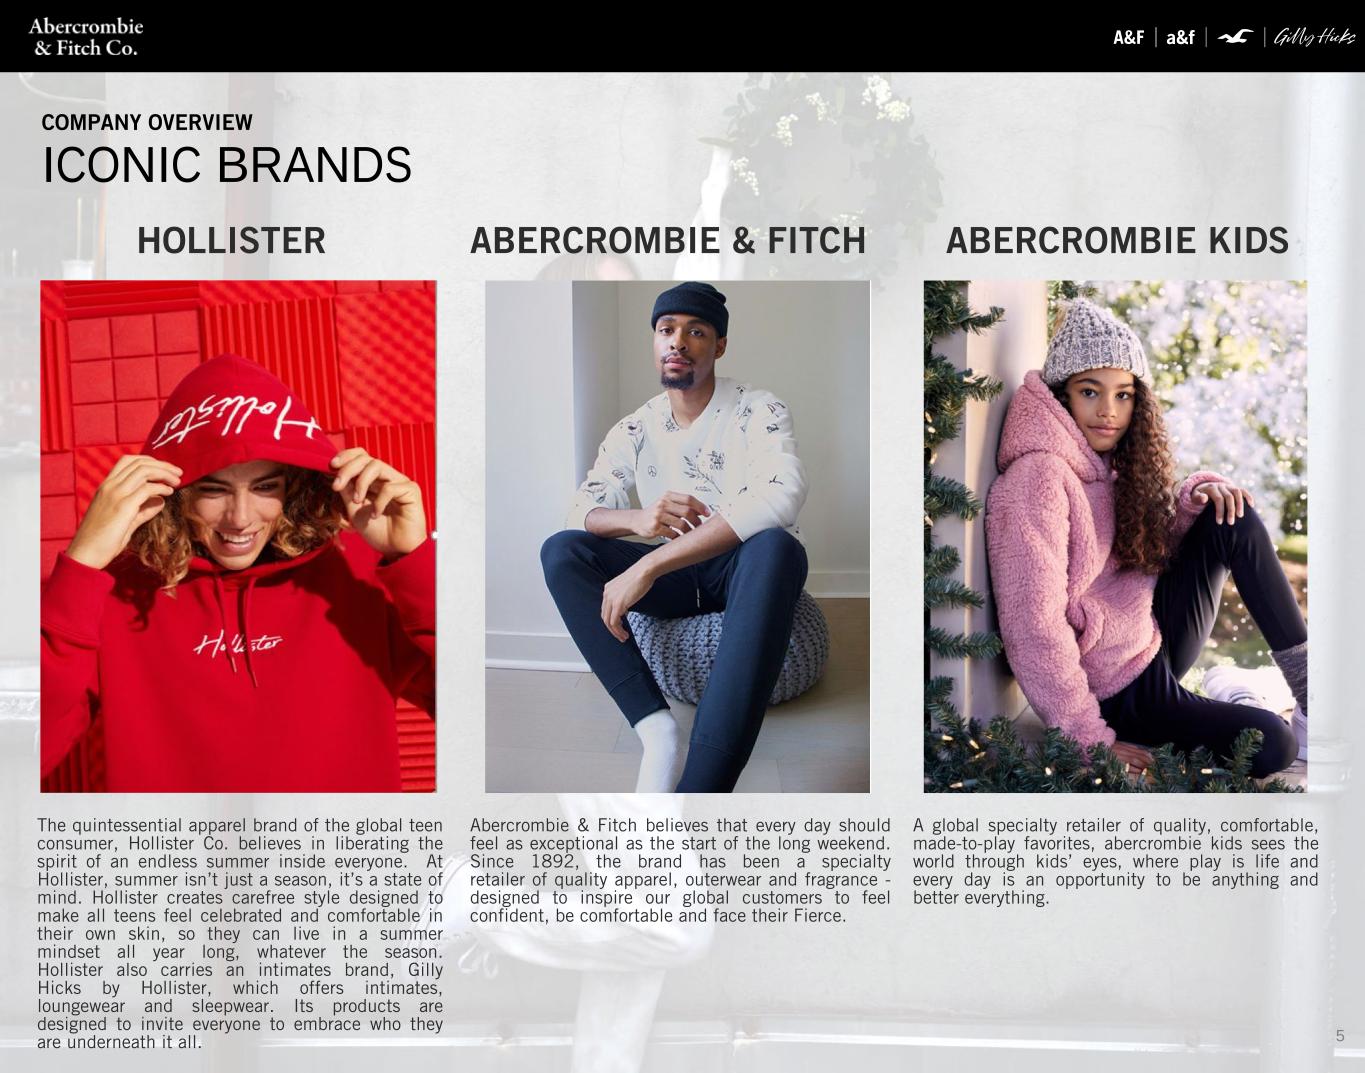

 
5 HOLLISTER The quintessential apparel brand of the global teen consumer, Hollister Co. believes in liberating the spirit of an endless summer inside everyone. At Hollister, summer isn’t just a season, it’s a state of mind. Hollister creates carefree style designed to make all teens feel celebrated and comfortable in their own skin, so they can live in a summer mindset all year long, whatever the season. Hollister also carries an intimates brand, Gilly Hicks by Hollister, which offers intimates, loungewear and sleepwear. Its products are designed to invite everyone to embrace who they are underneath it all. COMPANY OVERVIEW ICONIC BRANDS ABERCROMBIE KIDS A global specialty retailer of quality, comfortable, made-to-play favorites, abercrombie kids sees the world through kids’ eyes, where play is life and every day is an opportunity to be anything and better everything. ABERCROMBIE & FITCH Abercrombie & Fitch believes that every day should feel as exceptional as the start of the long weekend.   Since 1892, the brand has been a specialty retailer of quality apparel, outerwear and fragrance - designed to inspire our  global  customers to feel confident, be comfortable and face their Fierce.
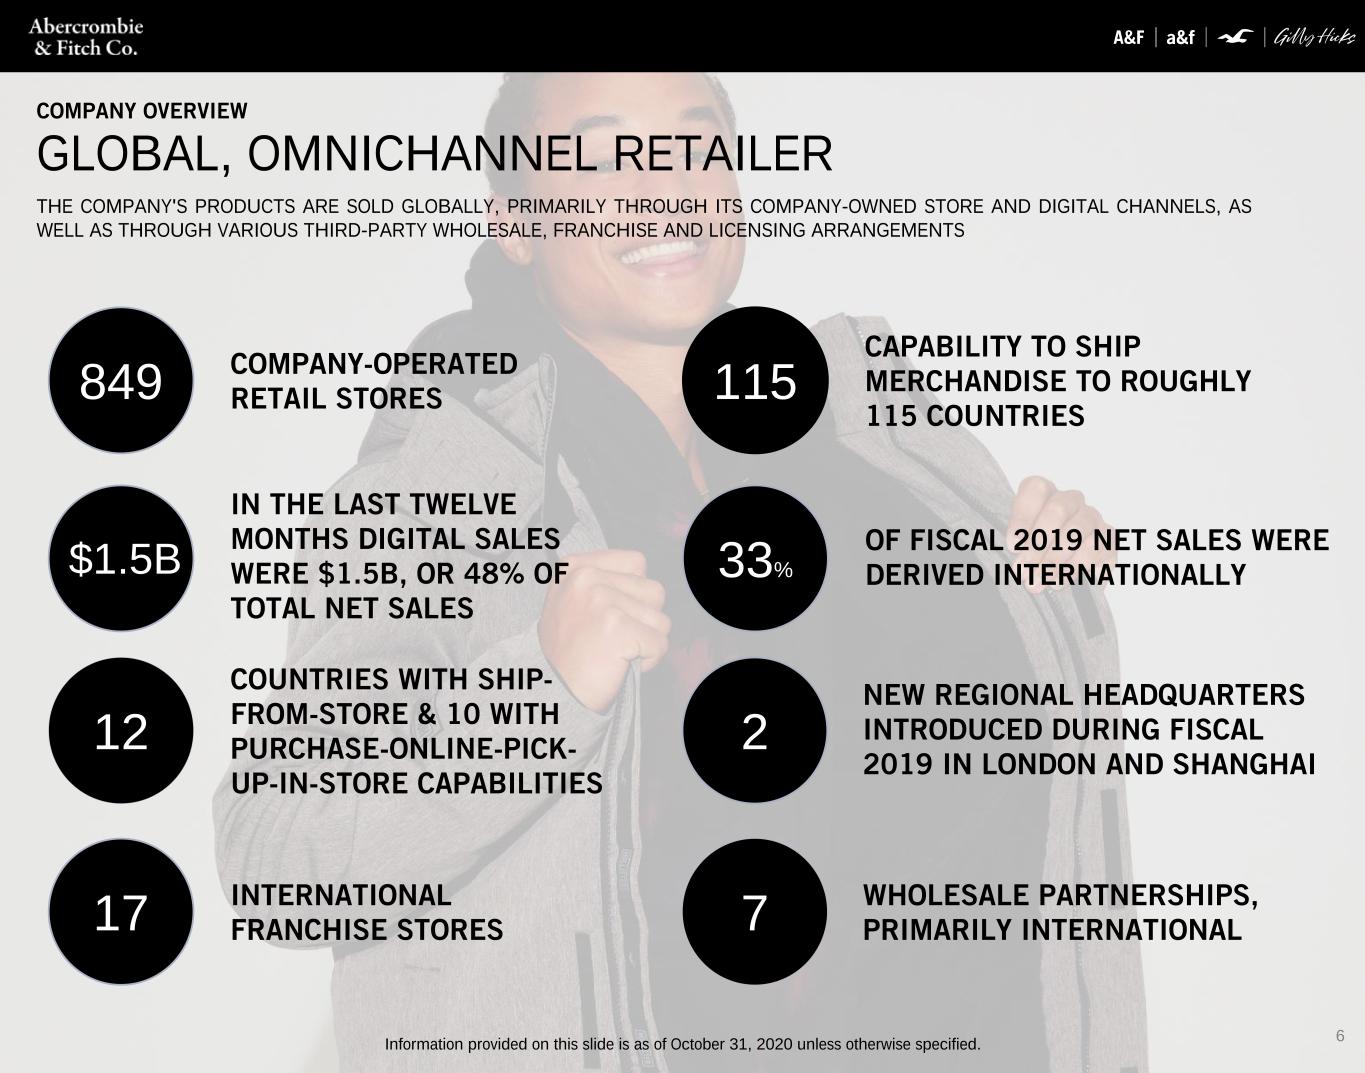

 
6 IN THE LAST TWELVE MONTHS DIGITAL SALES WERE $1.5B, OR 48% OF TOTAL NET SALES COMPANY OVERVIEW GLOBAL, OMNICHANNEL RETAILER THE COMPANY'S PRODUCTS ARE SOLD GLOBALLY, PRIMARILY THROUGH ITS COMPANY-OWNED STORE AND DIGITAL CHANNELS, AS WELL AS THROUGH VARIOUS THIRD-PARTY WHOLESALE, FRANCHISE AND LICENSING ARRANGEMENTS 17 CAPABILITY TO SHIP MERCHANDISE TO ROUGHLY 115 COUNTRIES INTERNATIONAL FRANCHISE STORES COMPANY-OPERATED RETAIL STORES WHOLESALE PARTNERSHIPS, PRIMARILY INTERNATIONAL COUNTRIES WITH SHIP- FROM-STORE & 10 WITH PURCHASE-ONLINE-PICK- UP-IN-STORE CAPABILITIES NEW REGIONAL HEADQUARTERS INTRODUCED DURING FISCAL 2019 IN LONDON AND SHANGHAI 12 849 7 2 115 33% OF FISCAL 2019 NET SALES WERE DERIVED INTERNATIONALLY Information provided on this slide is as of October 31, 2020 unless otherwise specified. $1.5B

 
7 RESPONSE TO COVID-19
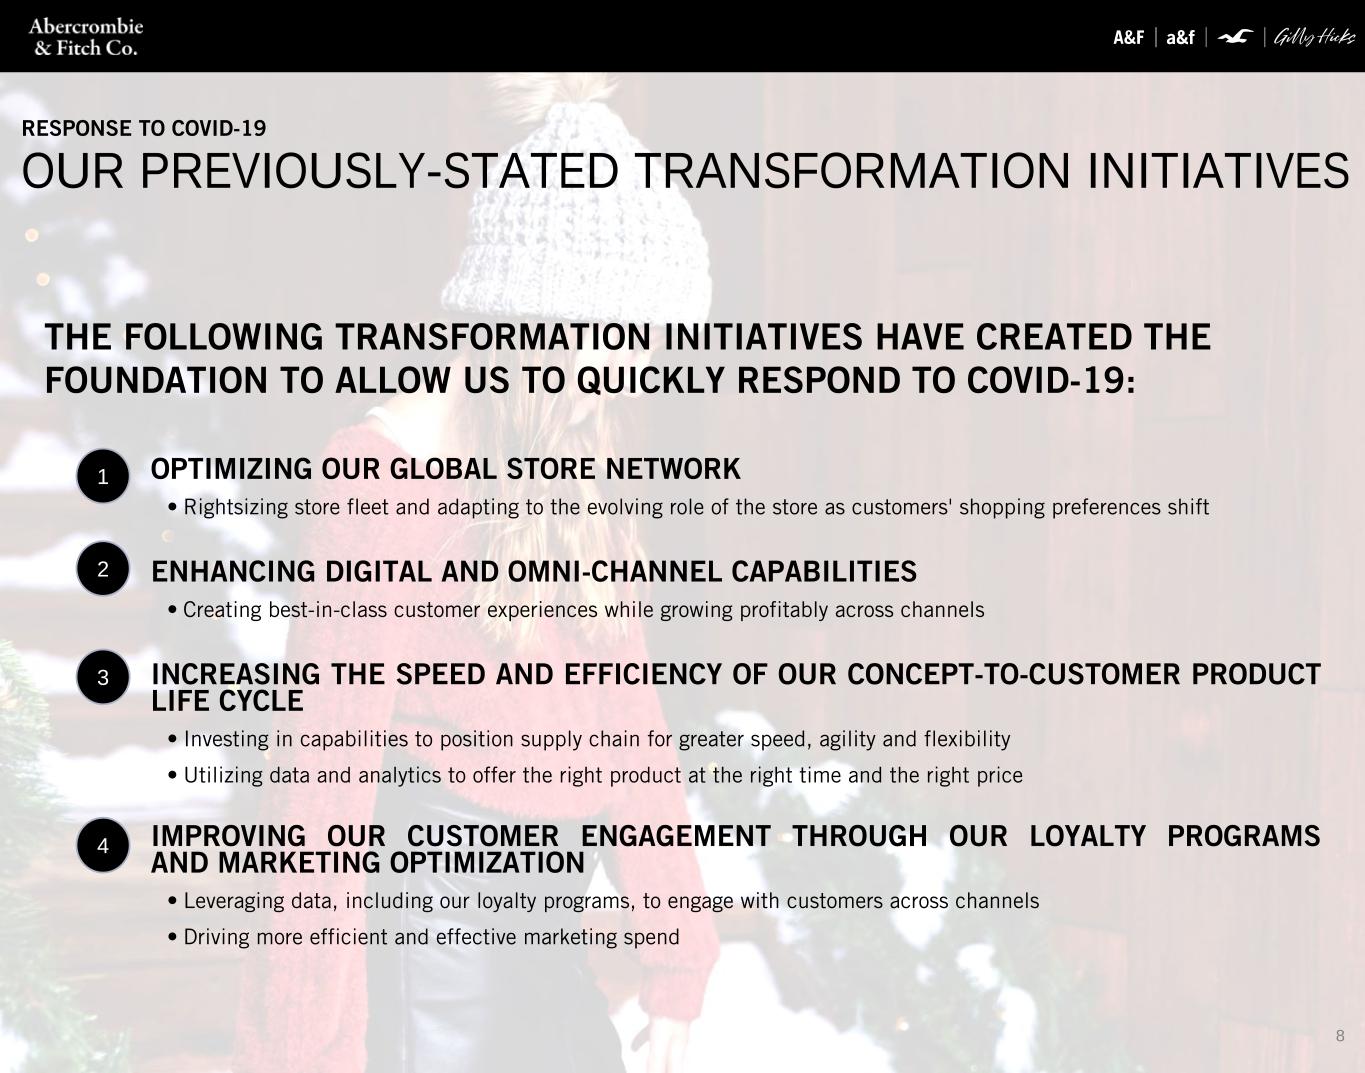

 
8 OPTIMIZING OUR GLOBAL STORE NETWORK • Rightsizing store fleet and adapting to the evolving role of the store as customers' shopping preferences shift ENHANCING DIGITAL AND OMNI-CHANNEL CAPABILITIES • Creating best-in-class customer experiences while growing profitably across channels INCREASING THE SPEED AND EFFICIENCY OF OUR CONCEPT-TO-CUSTOMER PRODUCT LIFE CYCLE • Investing in capabilities to position supply chain for greater speed, agility and flexibility • Utilizing data and analytics to offer the right product at the right time and the right price IMPROVING OUR CUSTOMER ENGAGEMENT THROUGH OUR LOYALTY PROGRAMS AND MARKETING OPTIMIZATION • Leveraging data, including our loyalty programs, to engage with customers across channels • Driving more efficient and effective marketing spend THE FOLLOWING TRANSFORMATION INITIATIVES HAVE CREATED THE FOUNDATION TO ALLOW US TO QUICKLY RESPOND TO COVID-19: 1 2 3 4 RESPONSE TO COVID-19 OUR PREVIOUSLY-STATED TRANSFORMATION INITIATIVES
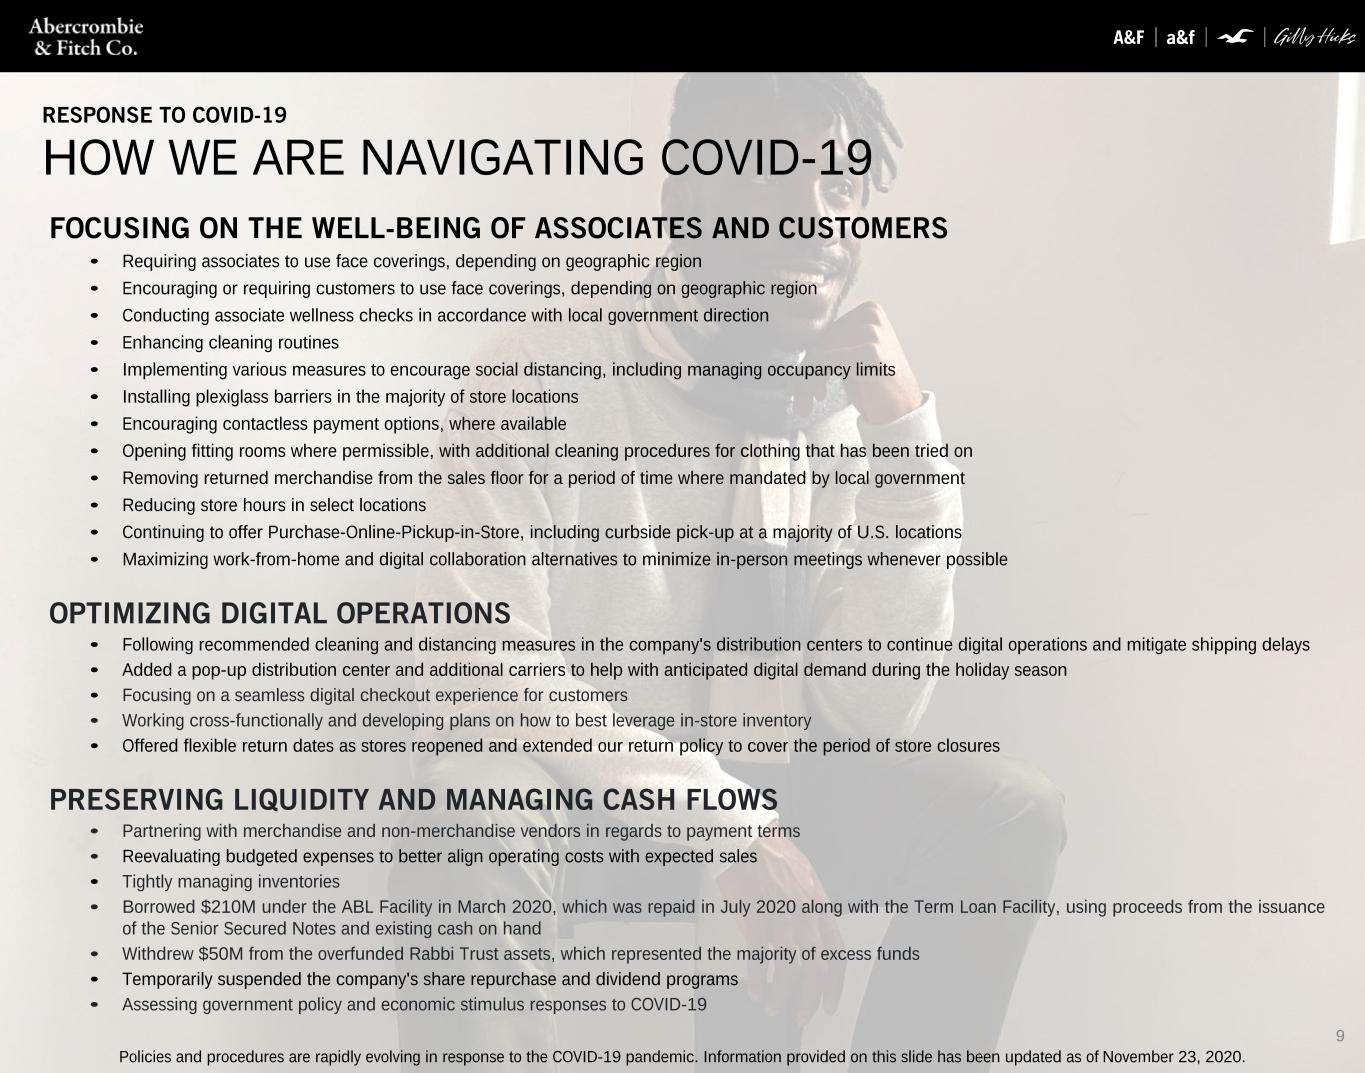

 
9 FOCUSING ON THE WELL-BEING OF ASSOCIATES AND CUSTOMERS • Requiring associates to use face coverings, depending on geographic region • Encouraging or requiring customers to use face coverings, depending on geographic region • Conducting associate wellness checks in accordance with local government direction • Enhancing cleaning routines • Implementing various measures to encourage social distancing, including managing occupancy limits • Installing plexiglass barriers in the majority of store locations • Encouraging contactless payment options, where available • Opening fitting rooms where permissible, with additional cleaning procedures for clothing that has been tried on • Removing returned merchandise from the sales floor for a period of time where mandated by local government • Reducing store hours in select locations • Continuing to offer Purchase-Online-Pickup-in-Store, including curbside pick-up at a majority of U.S. locations • Maximizing work-from-home and digital collaboration alternatives to minimize in-person meetings whenever possible OPTIMIZING DIGITAL OPERATIONS • Following recommended cleaning and distancing measures in the company's distribution centers to continue digital operations and mitigate shipping delays • Added a pop-up distribution center and additional carriers to help with anticipated digital demand during the holiday season • Focusing on a seamless digital checkout experience for customers • Working cross-functionally and developing plans on how to best leverage in-store inventory • Offered flexible return dates as stores reopened and extended our return policy to cover the period of store closures PRESERVING LIQUIDITY AND MANAGING CASH FLOWS •   Partnering with merchandise and non-merchandise vendors in regards to payment terms • Reevaluating budgeted expenses to better align operating costs with expected sales • Tightly managing inventories • Borrowed $210M under the ABL Facility in March 2020, which was repaid in July 2020 along with the Term Loan Facility, using proceeds from the issuance of the Senior Secured Notes and existing cash on hand • Withdrew $50M from the overfunded Rabbi Trust assets, which represented the majority of excess funds • Temporarily suspended the company's share repurchase and dividend programs • Assessing government policy and economic stimulus responses to COVID-19 RESPONSE TO COVID-19 HOW WE ARE NAVIGATING COVID-19 Policies and procedures are rapidly evolving in response to the COVID-19 pandemic. Information provided on this slide has been updated as of November 23, 2020.
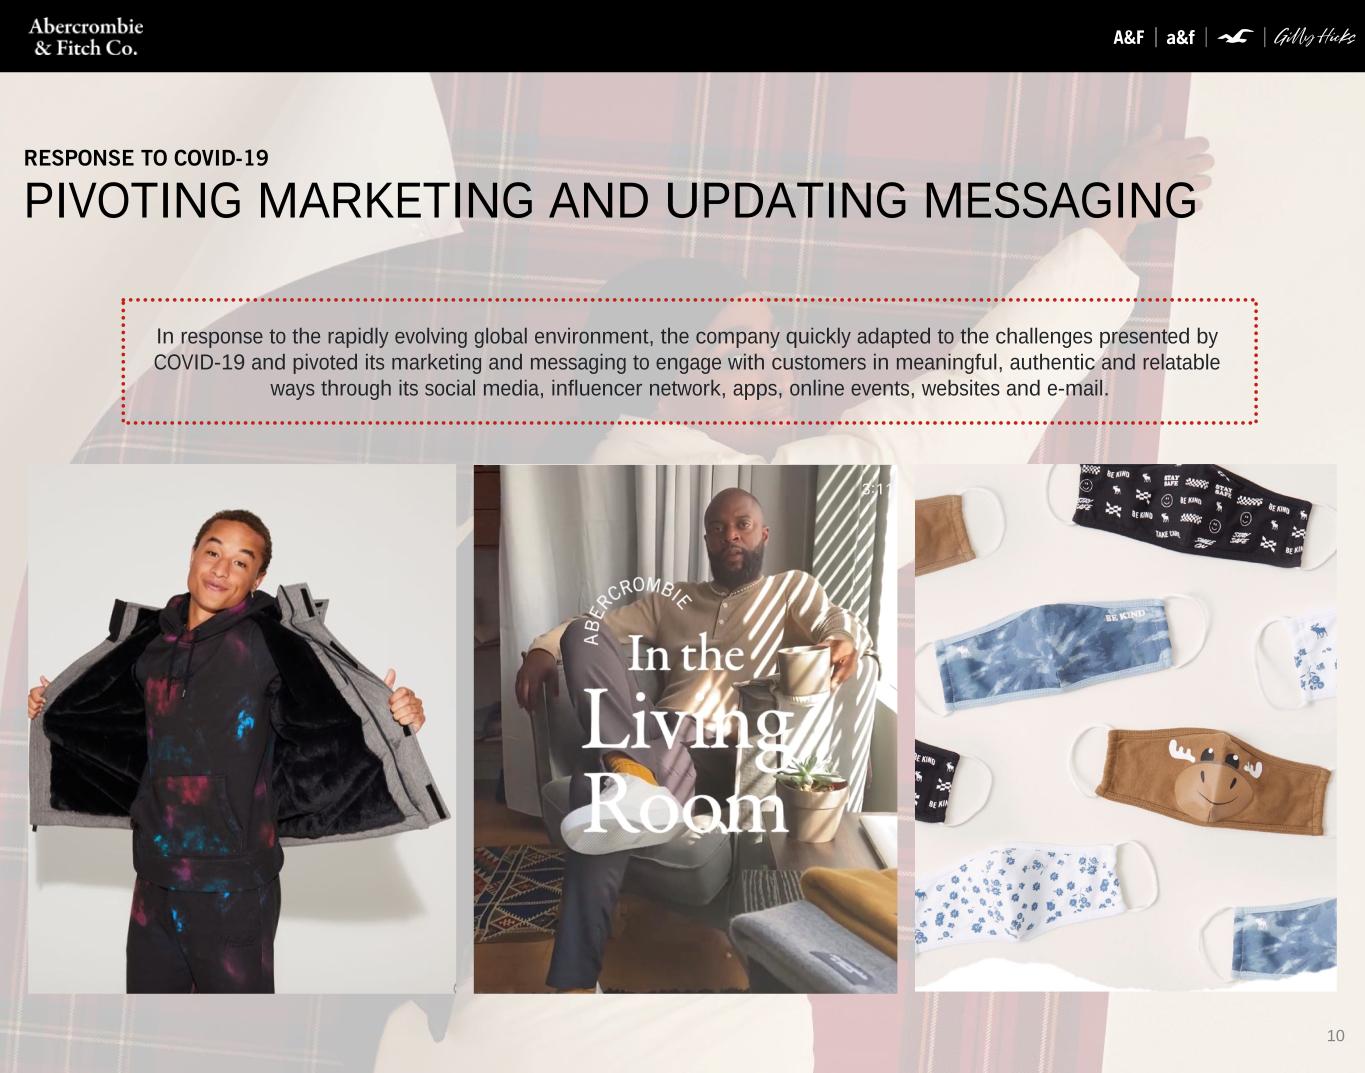

 
10 RESPONSE TO COVID-19 PIVOTING MARKETING AND UPDATING MESSAGING In response to the rapidly evolving global environment, the company quickly adapted to the challenges presented by COVID-19 and pivoted its marketing and messaging to engage with customers in meaningful, authentic and relatable ways through its social media, influencer network, apps, online events, websites and e-mail.
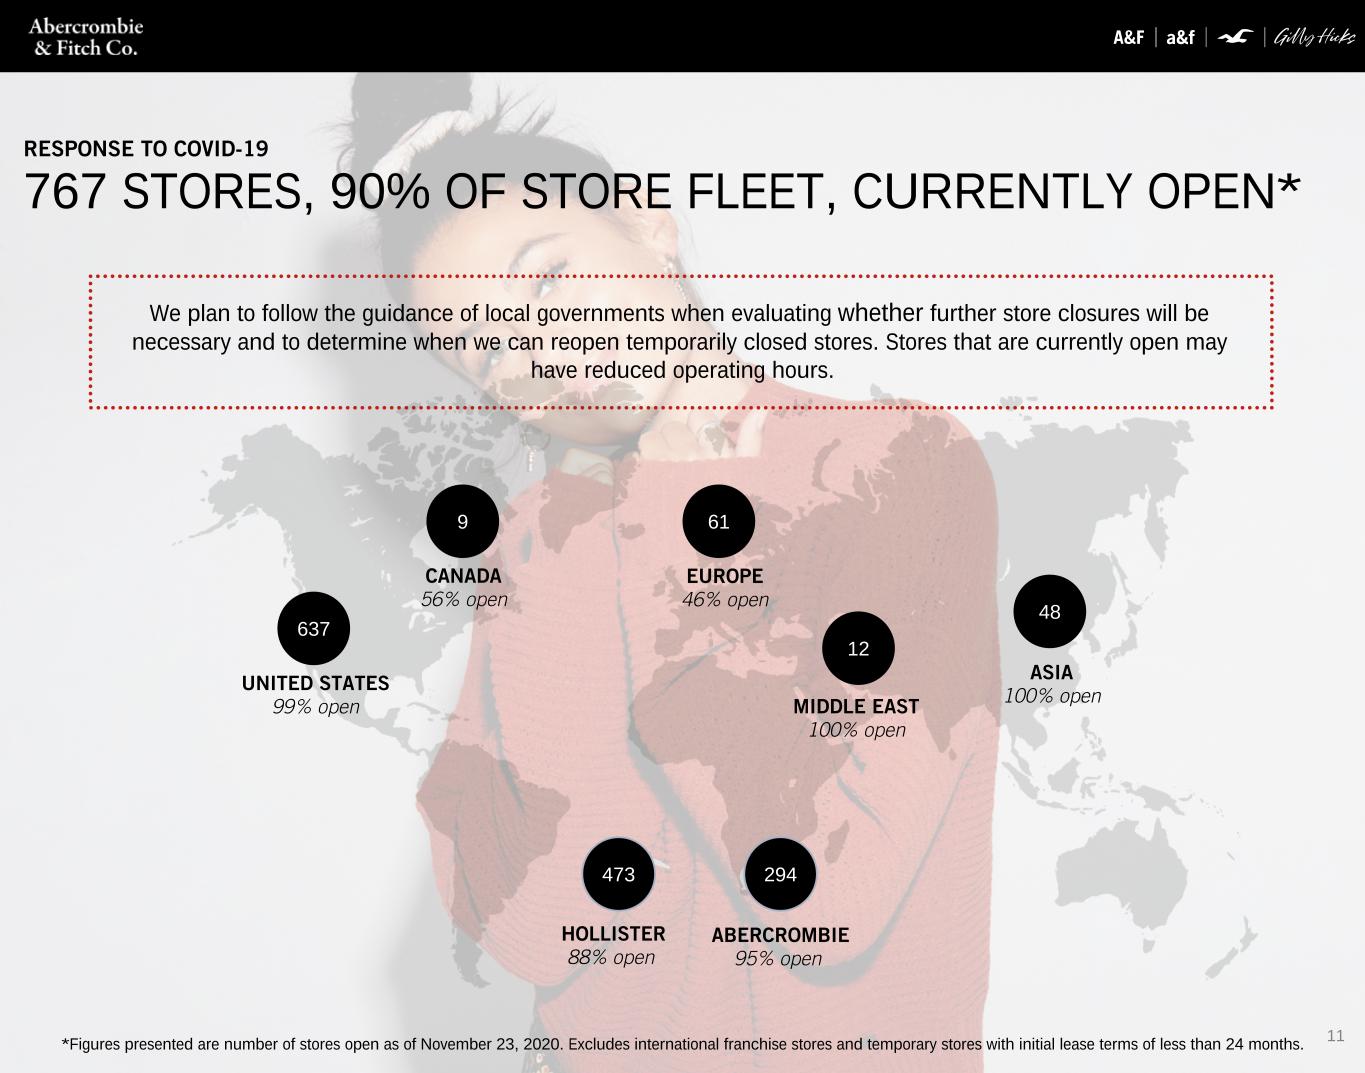

 
11 We plan to follow the guidance of local governments when evaluating whether further store closures will be necessary and to determine when we can reopen temporarily closed stores. Stores that are currently open may have reduced operating hours. RESPONSE TO COVID-19 767 STORES, 90% OF STORE FLEET, CURRENTLY OPEN* HOLLISTER 88% open ABERCROMBIE 95% open 473 9 61 12 294 CANADA 56% open UNITED STATES 99% open EUROPE 46% open MIDDLE EAST 100% open ASIA 100% open 48 *Figures presented are number of stores open as of November 23, 2020. Excludes international franchise stores and temporary stores with initial lease terms of less than 24 months. 637

 
12 Q3 2020 RESULTS

 
13 “I am proud of our global teams and partners. Reflecting your ongoing hard work and perseverance, we delivered our best third quarter operating income in eight years. Results were fueled by 43% year-over-year digital sales growth and sequential sales improvements in our global store base. Updated product and marketing resonated with existing and new customers across brands and regions. Combined with a focused inventory management strategy, we expanded gross profit rate significantly while continuing to tightly manage expenses, leading to operating margin improvements over last year.” ”We are also pleased to announce the early exit of four additional flagship locations by the end of January 2021. This is in addition to the three previously announced fiscal 2020 natural lease expirations. With these seven closures, we should end the year with eight operating flagships down from fifteen at the beginning of the year. These actions align with our multi-year strategy of reducing dependence on tourist-driven locations to reposition within key markets and deliver a better omnichannel experience to our local customer.” “We are encouraged by quarter-to-date results, including ongoing strong digital demand, with our customers responding favorably to new product and messaging. However, this is tempered by uncertainty regarding the potential for increased COVID-related store restrictions and our expectation for elevated shipping, handling and freight costs. As we approach the peak holiday selling period, inventories remain well-controlled and we have thoughtful plans in place to help us adapt to changing business conditions. As we have done since the start of the pandemic, we will utilize our proven playbooks to remain agile and provide the best omnichannel experience for our customers.” FRAN HOROWITZ, CHIEF EXECUTIVE OFFICER Q3 2020 RESULTS CEO COMMENTARY
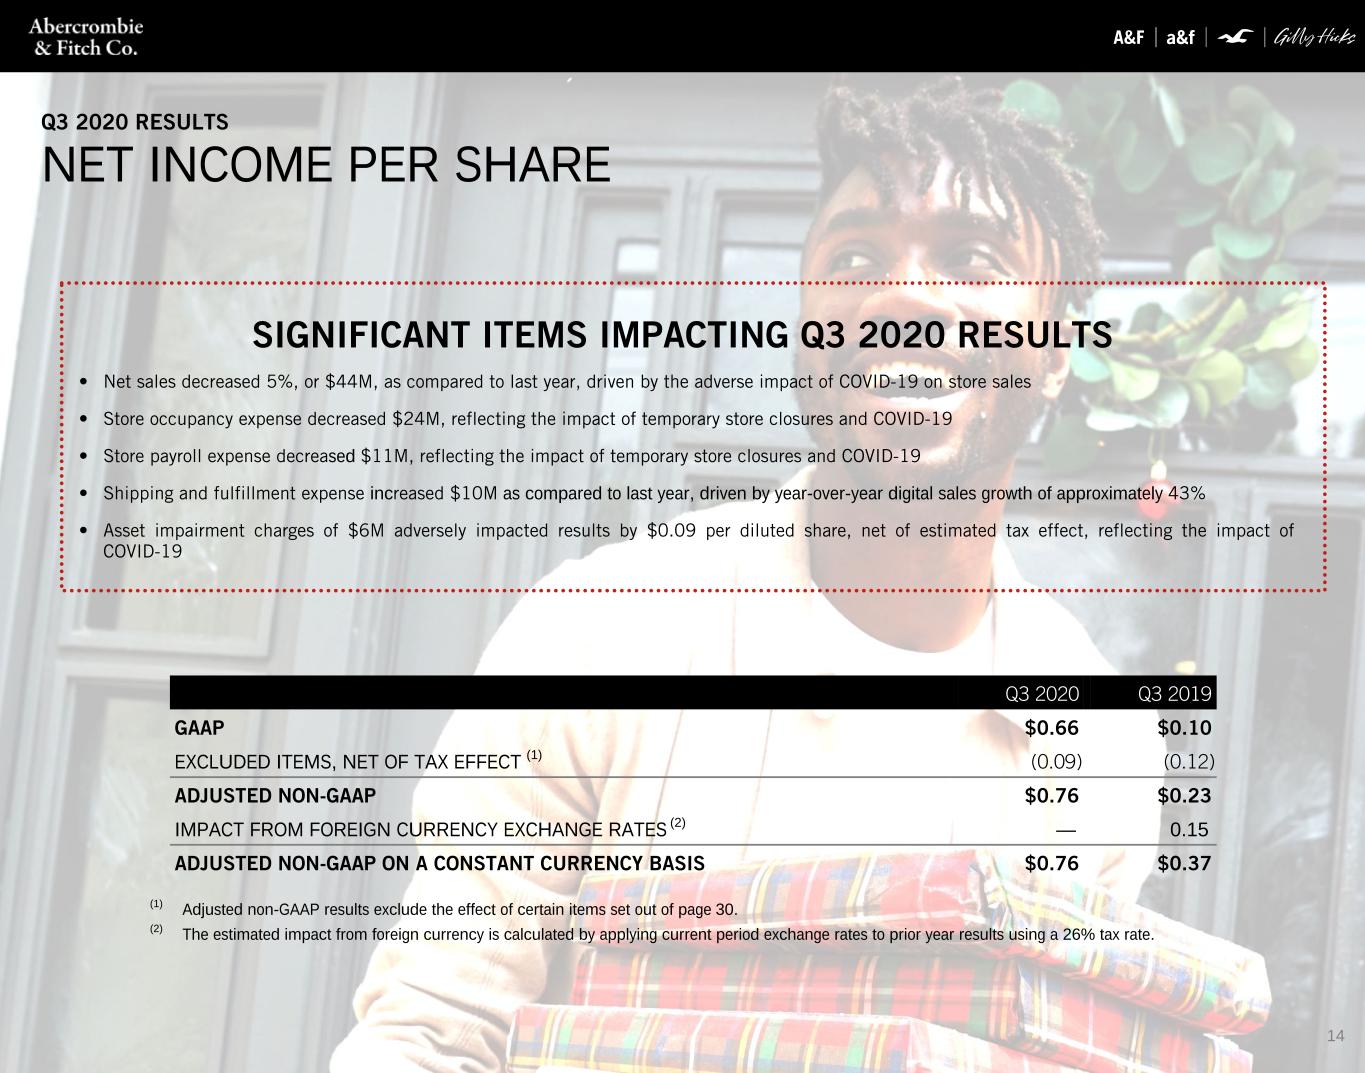

 
14 SIGNIFICANT ITEMS IMPACTING Q3 2020 RESULTS • Net sales decreased 5%, or $44M, as compared to last year, driven by the adverse impact of COVID-19 on store sales • Store occupancy expense decreased $24M, reflecting the impact of temporary store closures and COVID-19 • Store payroll expense decreased $11M, reflecting the impact of temporary store closures and COVID-19 • Shipping and fulfillment expense increased $10M as compared to last year, driven by year-over-year digital sales growth of approximately 43% • Asset impairment charges of $6M adversely impacted results by $0.09 per diluted share, net of estimated tax effect, reflecting the impact of COVID-19 (1) Adjusted non-GAAP results exclude the effect of certain items set out of page 30. (2) The estimated impact from foreign currency is calculated by applying current period exchange rates to prior year results using a 26% tax rate. Q3 2020 Q3 2019 GAAP $0.66 $0.10 EXCLUDED ITEMS, NET OF TAX EFFECT (1) (0.09) (0.12) ADJUSTED NON-GAAP $0.76 $0.23 IMPACT FROM FOREIGN CURRENCY EXCHANGE RATES (2) — 0.15 ADJUSTED NON-GAAP ON A CONSTANT CURRENCY BASIS $0.76 $0.37 Q3 2020 RESULTS NET INCOME PER SHARE
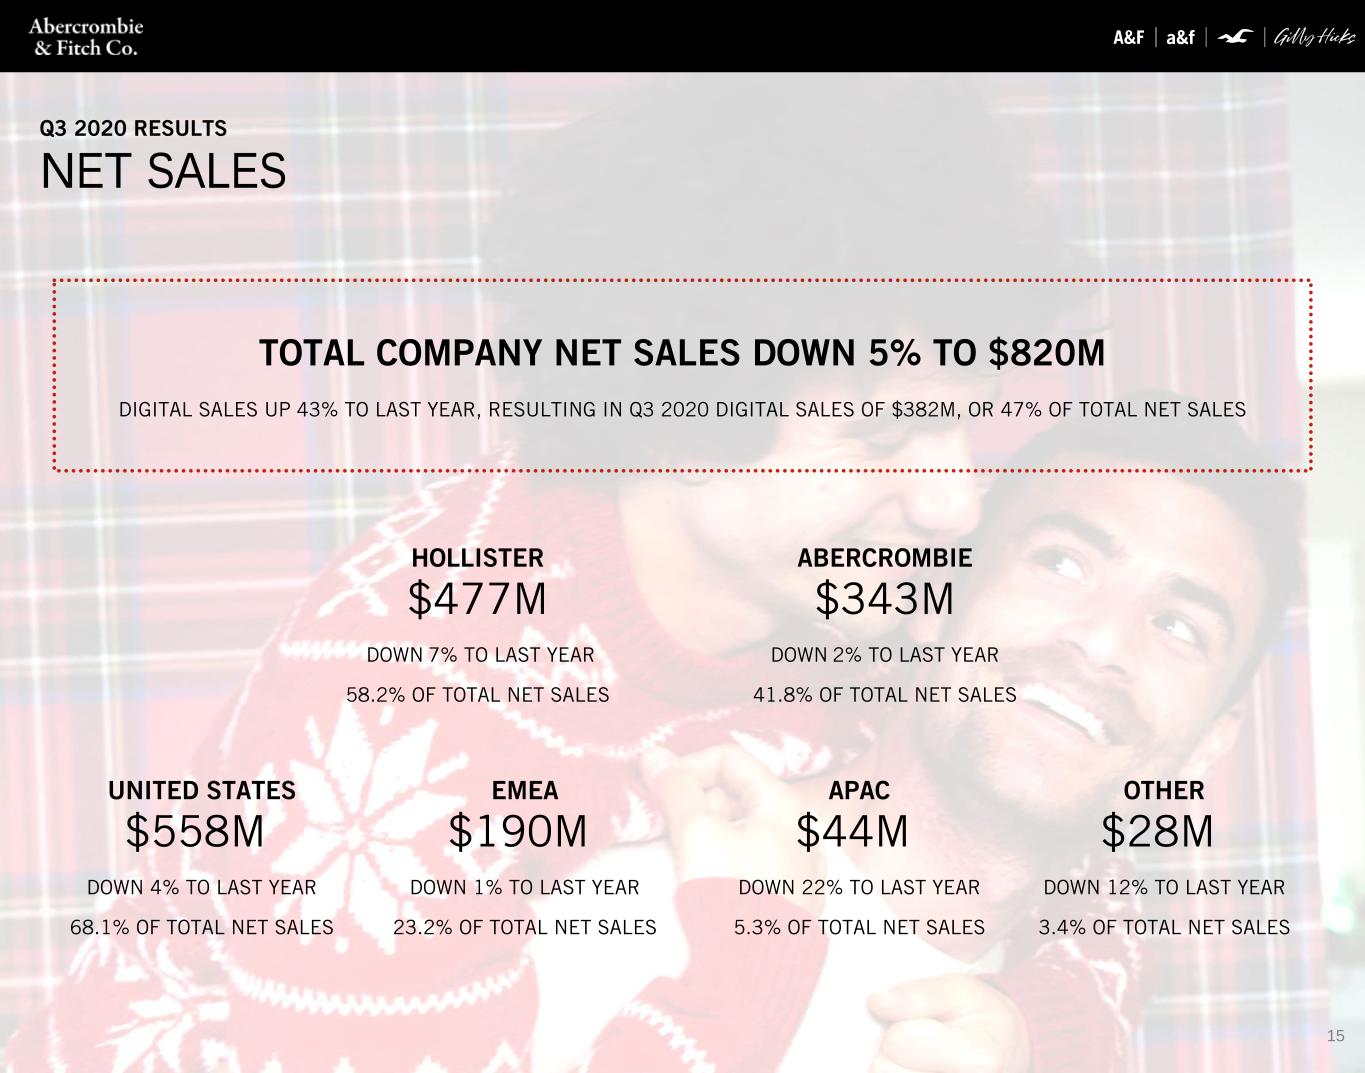

 
15 Q3 2020 RESULTS NET SALES ABERCROMBIE $343M DOWN 2% TO LAST YEAR 41.8% OF TOTAL NET SALES HOLLISTER $477M DOWN 7% TO LAST YEAR 58.2% OF TOTAL NET SALES EMEA $190M DOWN 1% TO LAST YEAR 23.2% OF TOTAL NET SALES UNITED STATES $558M DOWN 4% TO LAST YEAR 68.1% OF TOTAL NET SALES TOTAL COMPANY NET SALES DOWN 5% TO $820M DIGITAL SALES UP 43% TO LAST YEAR, RESULTING IN Q3 2020 DIGITAL SALES OF $382M, OR 47% OF TOTAL NET SALES APAC $44M DOWN 22% TO LAST YEAR 5.3% OF TOTAL NET SALES OTHER $28M DOWN 12% TO LAST YEAR 3.4% OF TOTAL NET SALES
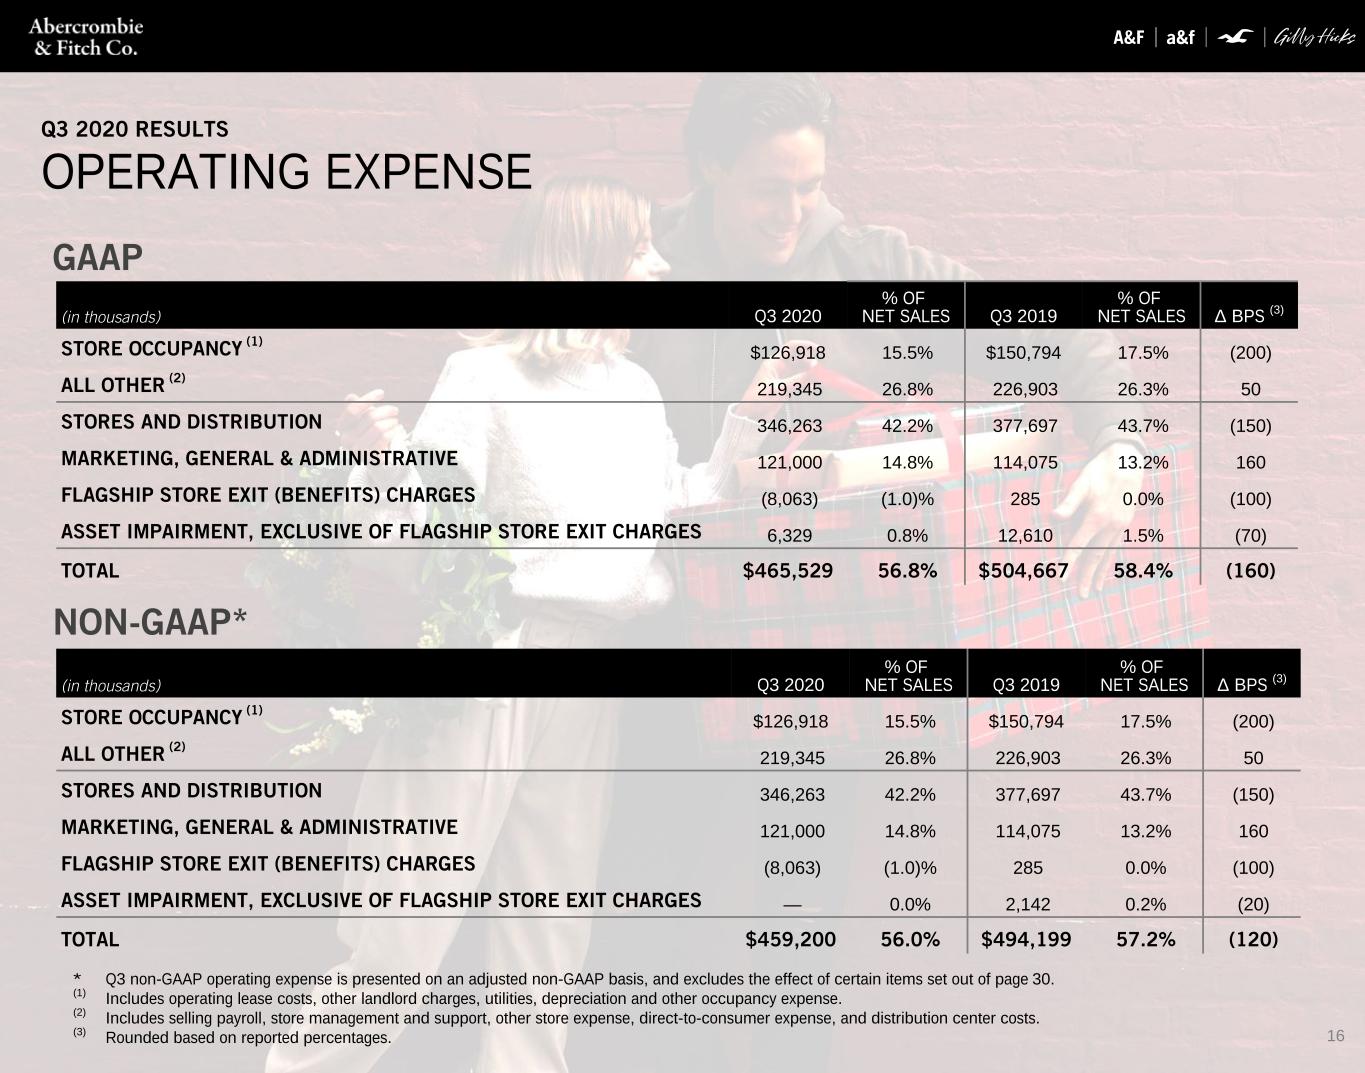

 
16 GAAP NON-GAAP* Q3 2020 RESULTS OPERATING EXPENSE * Q3 non-GAAP operating expense is presented on an adjusted non-GAAP basis, and excludes the effect of certain items set out of page 30. (1) Includes operating lease costs, other landlord charges, utilities, depreciation and other occupancy expense. (2) Includes selling payroll, store management and support, other store expense, direct-to-consumer expense, and distribution center costs. (3) Rounded based on reported percentages. (in thousands) Q3 2020 % OF NET SALES Q3 2019 % OF NET SALES Δ BPS (3) STORE OCCUPANCY (1) $126,918 15.5% $150,794 17.5% (200) ALL OTHER (2) 219,345 26.8% 226,903 26.3% 50 STORES AND DISTRIBUTION 346,263 42.2% 377,697 43.7% (150) MARKETING, GENERAL & ADMINISTRATIVE 121,000 14.8% 114,075 13.2% 160 FLAGSHIP STORE EXIT (BENEFITS) CHARGES (8,063) (1.0)% 285 0.0% (100) ASSET IMPAIRMENT, EXCLUSIVE OF FLAGSHIP STORE EXIT CHARGES 6,329 0.8% 12,610 1.5% (70) TOTAL $465,529 56.8% $504,667 58.4% (160) (in thousands) Q3 2020 % OF NET SALES Q3 2019 % OF NET SALES Δ BPS (3) STORE OCCUPANCY (1) $126,918 15.5% $150,794 17.5% (200) ALL OTHER (2) 219,345 26.8% 226,903 26.3% 50 STORES AND DISTRIBUTION 346,263 42.2% 377,697 43.7% (150) MARKETING, GENERAL & ADMINISTRATIVE 121,000 14.8% 114,075 13.2% 160 FLAGSHIP STORE EXIT (BENEFITS) CHARGES (8,063) (1.0)% 285 0.0% (100) ASSET IMPAIRMENT, EXCLUSIVE OF FLAGSHIP STORE EXIT CHARGES — 0.0% 2,142 0.2% (20) TOTAL $459,200 56.0% $494,199 57.2% (120)
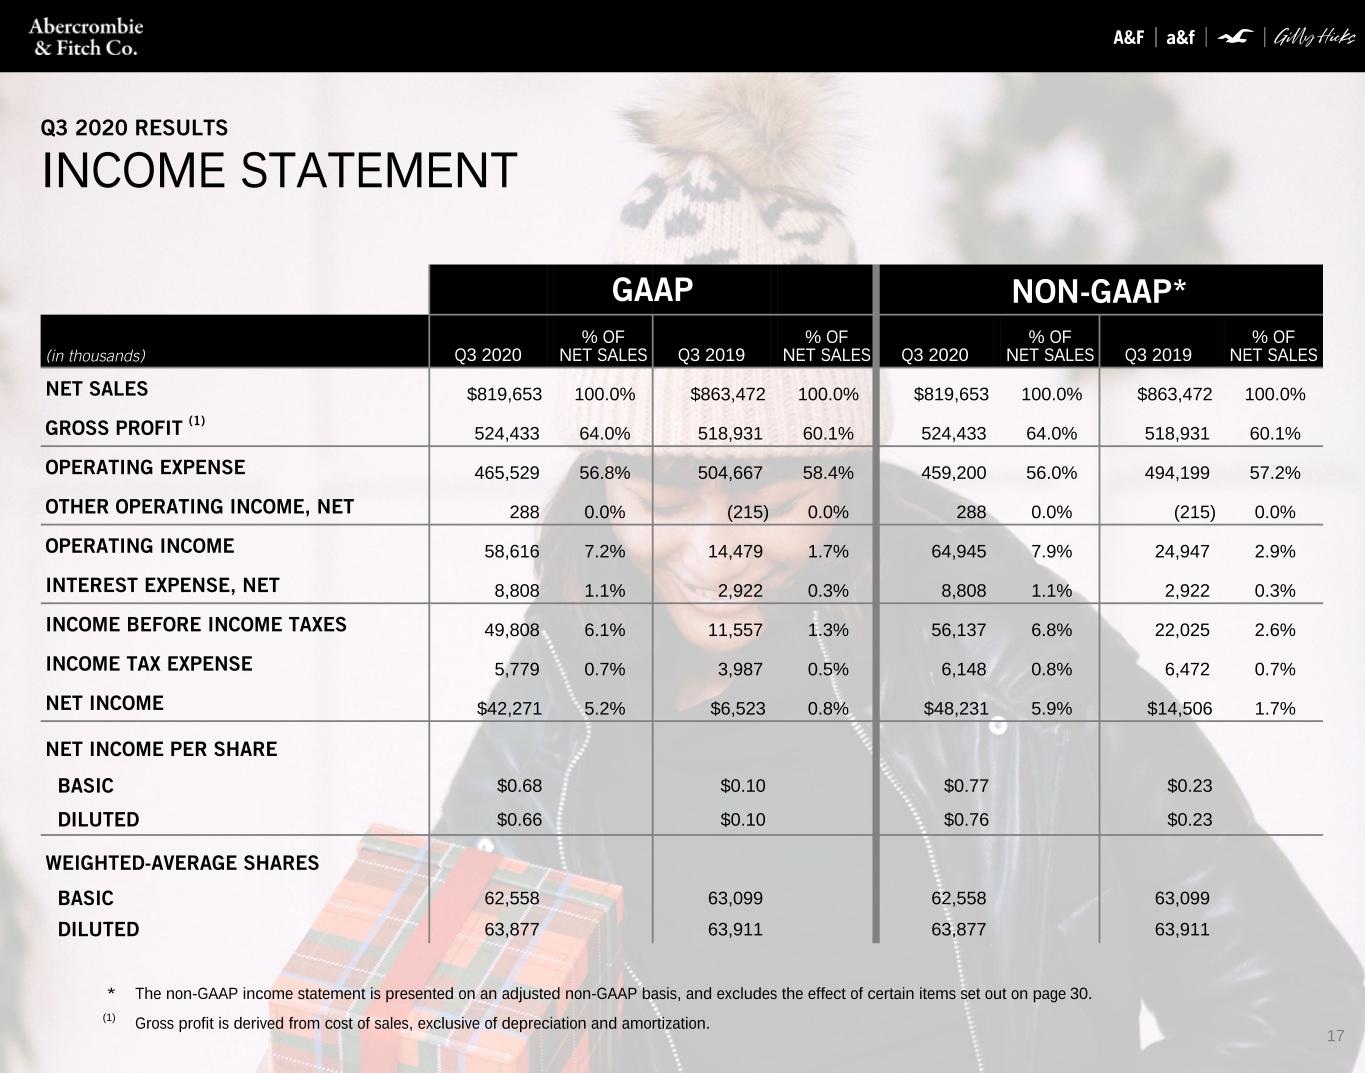

 
17 Q3 2020 RESULTS INCOME STATEMENT * The non-GAAP income statement is presented on an adjusted non-GAAP basis, and excludes the effect of certain items set out on page 30. (1) Gross profit is derived from cost of sales, exclusive of depreciation and amortization. GAAP NON-GAAP* (in thousands) Q3 2020   % OF NET SALES Q3 2019   % OF NET SALES Q3 2020   % OF NET SALES Q3 2019   % OF NET SALES NET SALES $819,653 100.0% $863,472 100.0% $819,653 100.0% $863,472 100.0% GROSS PROFIT (1) 524,433 64.0% 518,931 60.1% 524,433 64.0% 518,931 60.1% OPERATING EXPENSE 465,529 56.8% 504,667 58.4% 459,200 56.0% 494,199 57.2% OTHER OPERATING INCOME, NET 288 0.0% (215) 0.0% 288 0.0% (215) 0.0% OPERATING INCOME 58,616 7.2% 14,479 1.7% 64,945 7.9% 24,947 2.9% INTEREST EXPENSE, NET 8,808 1.1% 2,922 0.3% 8,808 1.1% 2,922 0.3% INCOME BEFORE INCOME TAXES 49,808 6.1% 11,557 1.3% 56,137 6.8% 22,025 2.6% INCOME TAX EXPENSE 5,779 0.7% 3,987 0.5% 6,148 0.8% 6,472 0.7% NET INCOME $42,271 5.2% $6,523 0.8% $48,231 5.9% $14,506 1.7% NET INCOME PER SHARE BASIC $0.68 $0.10 $0.77 $0.23 DILUTED $0.66 $0.10 $0.76 $0.23 WEIGHTED-AVERAGE SHARES BASIC 62,558 63,099 62,558 63,099 DILUTED 63,877 63,911 63,877 63,911


 
18 FINANCIAL POSITION, LIQUIDITY & CAPITAL ALLOCATION
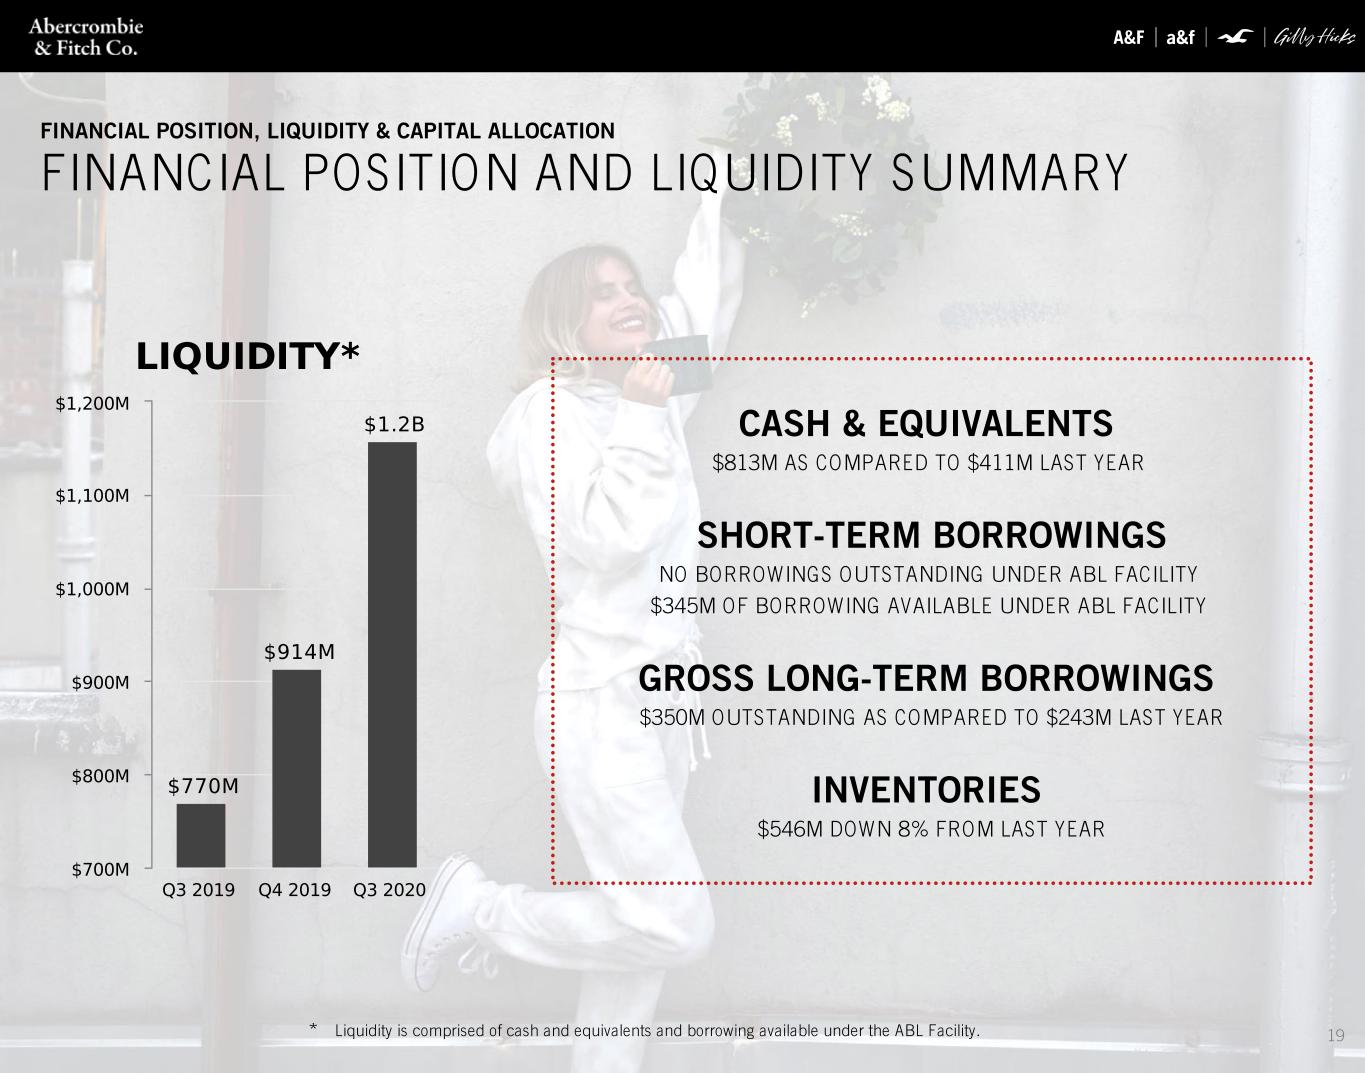

 
19 FINANCIAL POSITION, LIQUIDITY & CAPITAL ALLOCATION FINANCIAL POSITION AND LIQUIDITY SUMMARY CASH & EQUIVALENTS $813M AS COMPARED TO $411M LAST YEAR SHORT-TERM BORROWINGS NO BORROWINGS OUTSTANDING UNDER ABL FACILITY $345M OF BORROWING AVAILABLE UNDER ABL FACILITY GROSS LONG-TERM BORROWINGS $350M OUTSTANDING AS COMPARED TO $243M LAST YEAR INVENTORIES $546M DOWN 8% FROM LAST YEAR * Liquidity is comprised of cash and equivalents and borrowing available under the ABL Facility.
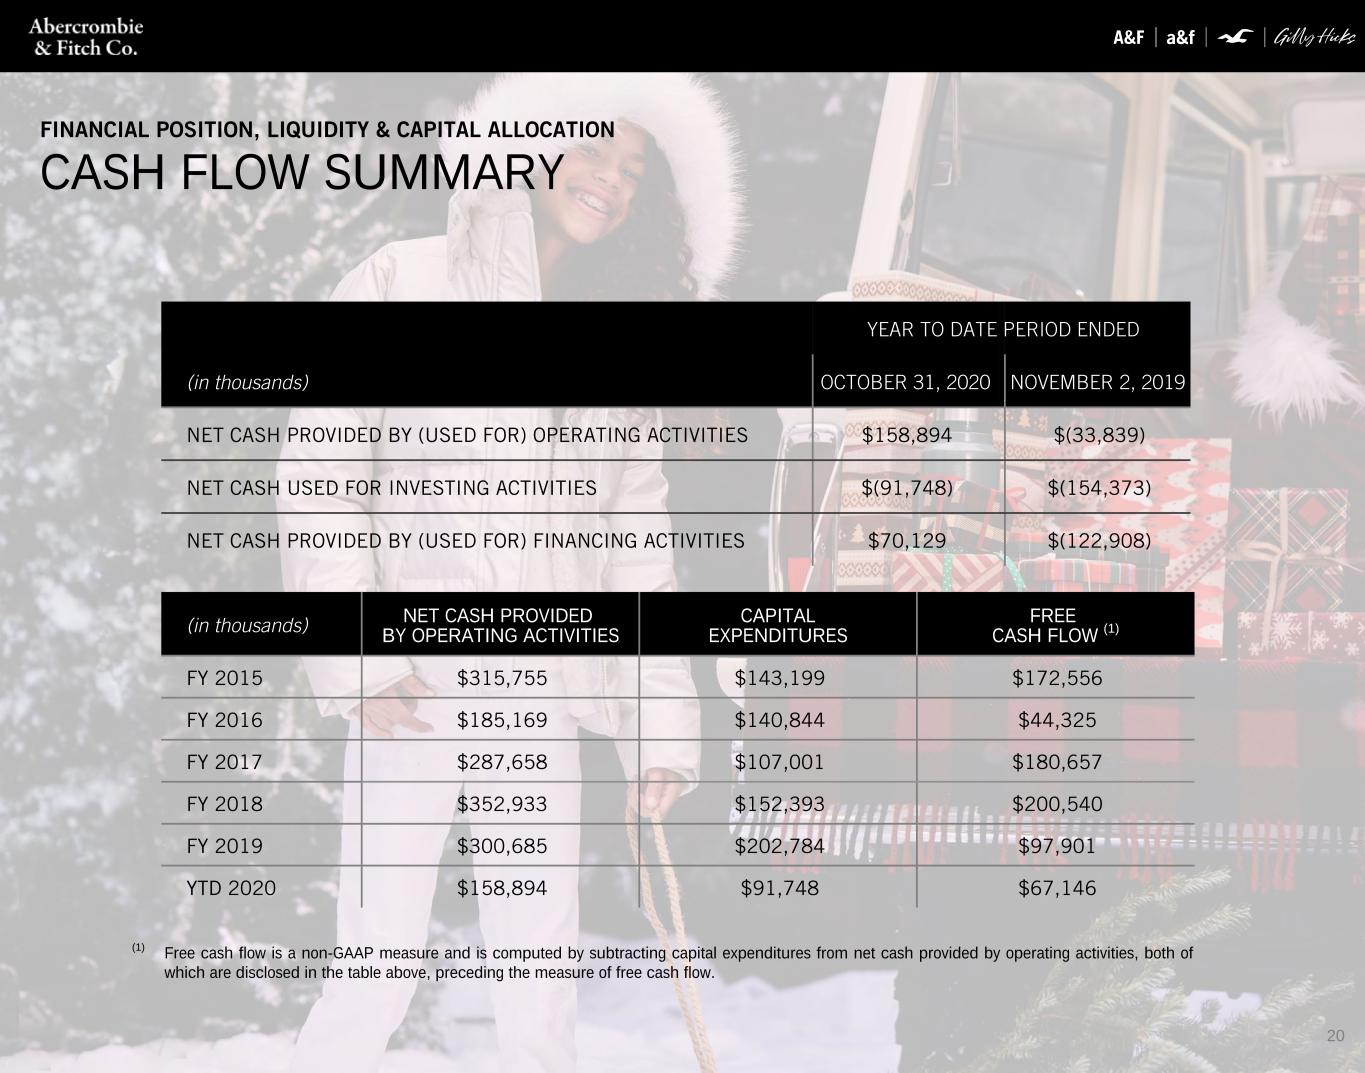

 
20 (in thousands) NET CASH PROVIDED BY OPERATING ACTIVITIES CAPITAL EXPENDITURES FREE CASH FLOW (1) FY 2015 $315,755 $143,199 $172,556 FY 2016 $185,169 $140,844 $44,325 FY 2017 $287,658 $107,001 $180,657 FY 2018 $352,933 $152,393 $200,540 FY 2019 $300,685 $202,784 $97,901 YTD 2020 $158,894 $91,748 $67,146 (1) Free cash flow is a non-GAAP measure and is computed by subtracting capital expenditures from net cash provided by operating activities, both of which are disclosed in the table above, preceding the measure of free cash flow. FINANCIAL POSITION, LIQUIDITY & CAPITAL ALLOCATION CASH FLOW SUMMARY YEAR TO DATE PERIOD ENDED (in thousands) OCTOBER 31, 2020 NOVEMBER 2, 2019 NET CASH PROVIDED BY (USED FOR) OPERATING ACTIVITIES $158,894 $(33,839) NET CASH USED FOR INVESTING ACTIVITIES $(91,748) $(154,373) NET CASH PROVIDED BY (USED FOR) FINANCING ACTIVITIES $70,129 $(122,908)
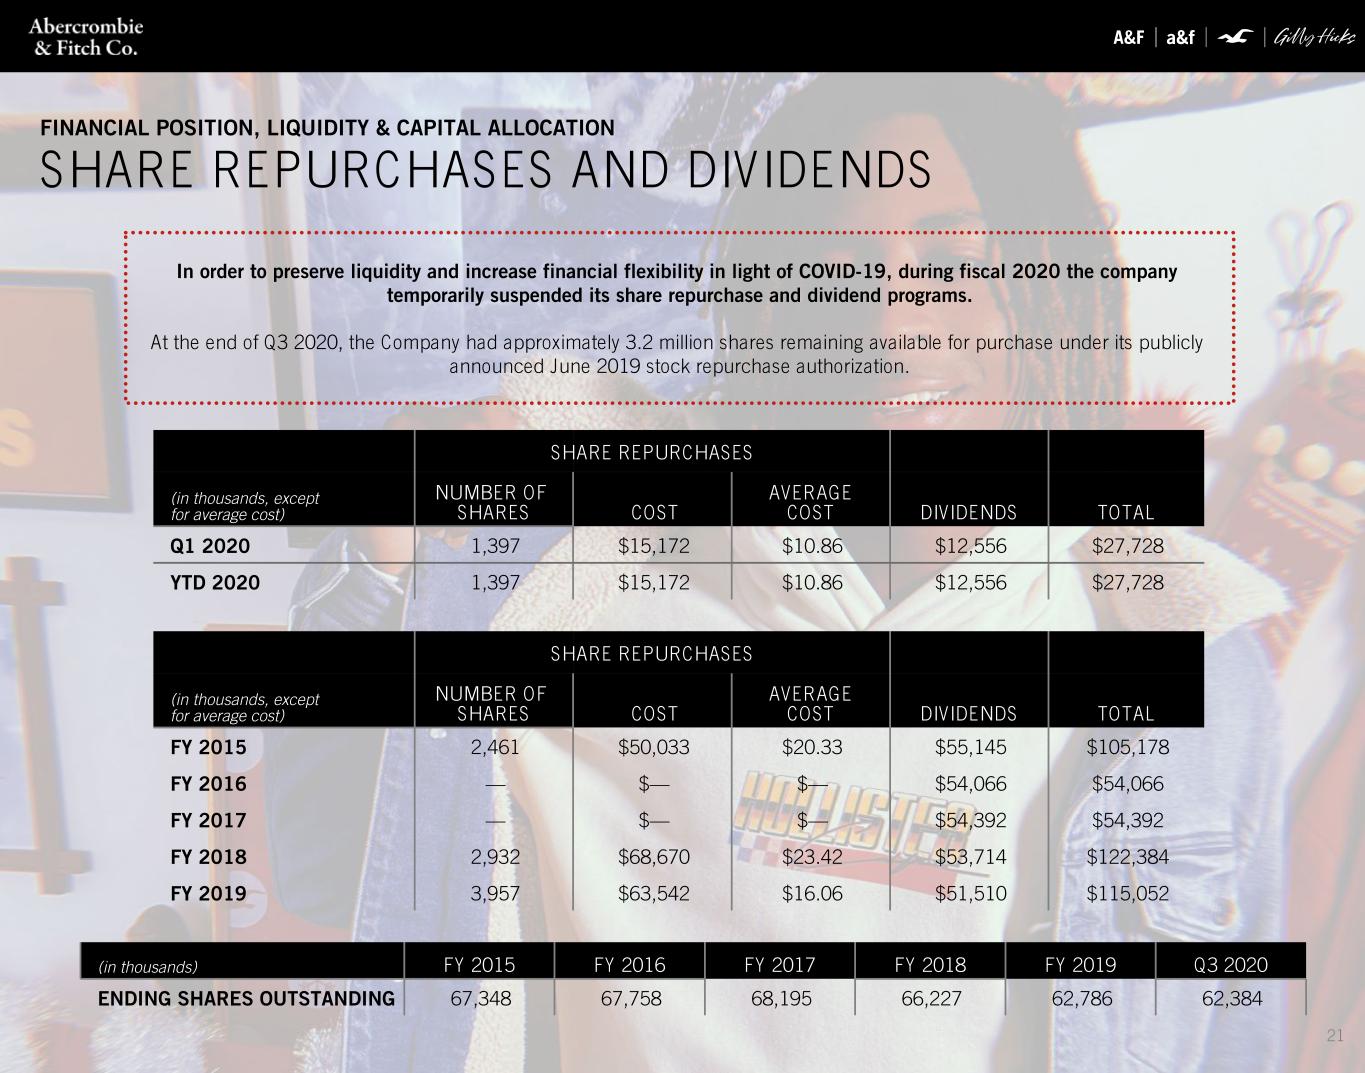

 
21 SHARE REPURCHASES (in thousands, except for average cost) NUMBER OF SHARES COST AVERAGE COST DIVIDENDS TOTAL Q1 2020 1,397 $15,172 $10.86 $12,556 $27,728 YTD 2020 1,397 $15,172 $10.86 $12,556 $27,728 FINANCIAL POSITION, LIQUIDITY & CAPITAL ALLOCATION SHARE REPURCHASES AND DIVIDENDS SHARE REPURCHASES (in thousands, except for average cost) NUMBER OF SHARES COST AVERAGE COST DIVIDENDS TOTAL FY 2015 2,461 $50,033 $20.33 $55,145 $105,178 FY 2016 — $— $— $54,066 $54,066 FY 2017 — $— $— $54,392 $54,392 FY 2018 2,932 $68,670 $23.42 $53,714 $122,384 FY 2019 3,957 $63,542 $16.06 $51,510 $115,052 In order to preserve liquidity and increase financial flexibility in light of COVID-19, during fiscal 2020 the company temporarily suspended its share repurchase and dividend programs. At the end of Q3 2020, the Company had approximately 3.2 million shares remaining available for purchase under its publicly announced June 2019 stock repurchase authorization. (in thousands) FY 2015 FY 2016 FY 2017 FY 2018 FY 2019 Q3 2020 ENDING SHARES OUTSTANDING 67,348 67,758 68,195 66,227 62,786 62,384
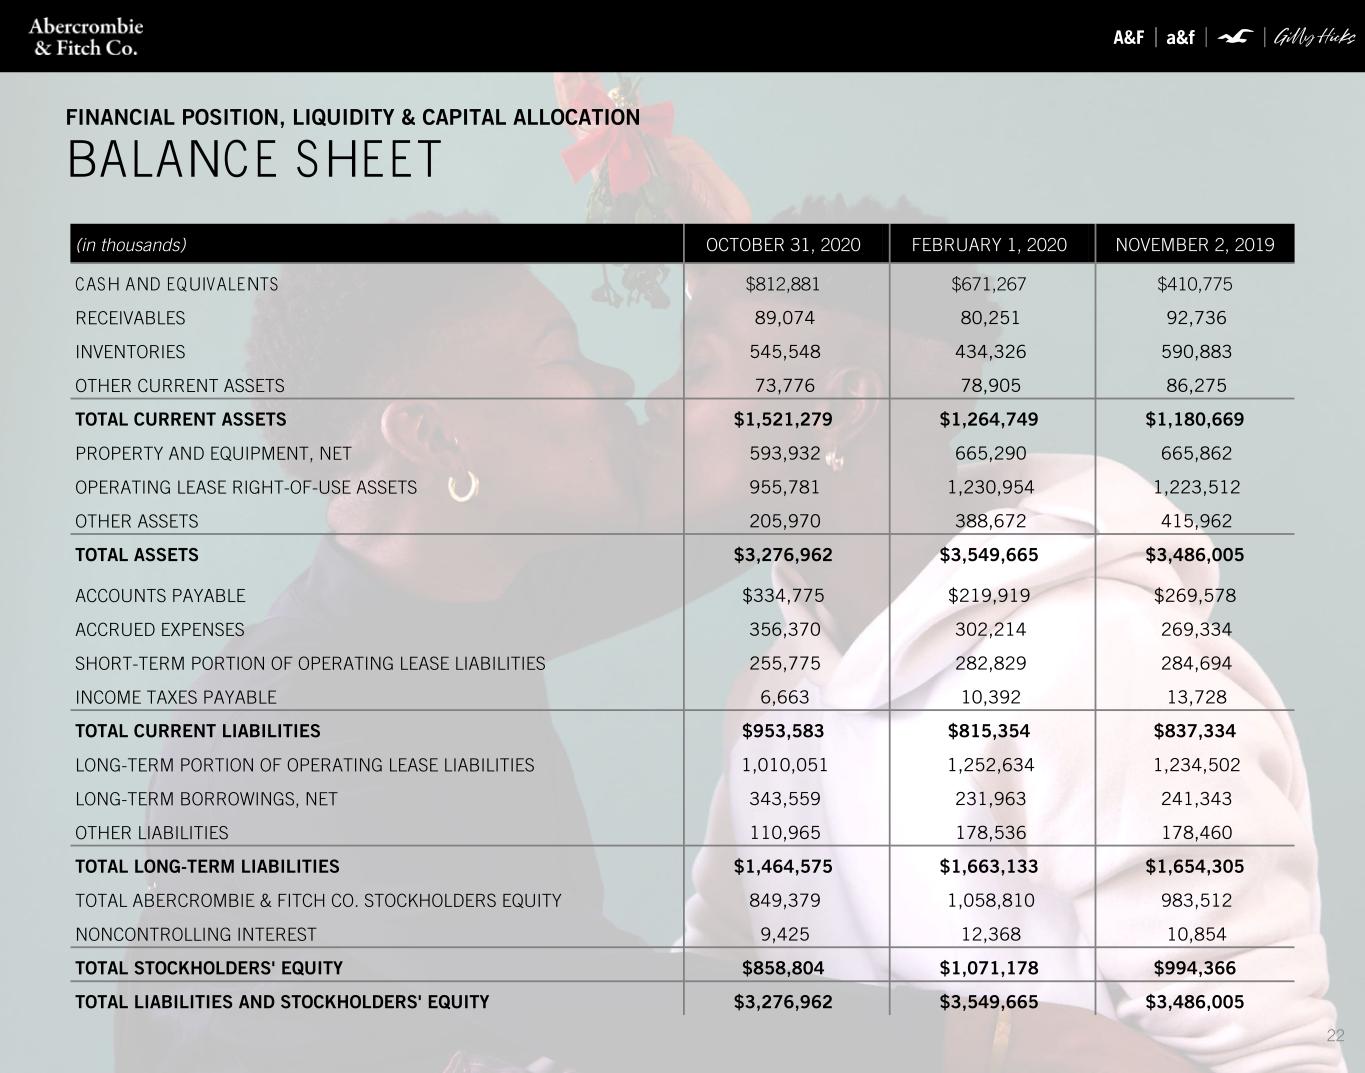

 
22 FINANCIAL POSITION, LIQUIDITY & CAPITAL ALLOCATION BALANCE SHEET (in thousands) OCTOBER 31, 2020 FEBRUARY 1, 2020 NOVEMBER 2, 2019 CASH AND EQUIVALENTS $812,881 $671,267 $410,775 RECEIVABLES 89,074 80,251 92,736 INVENTORIES 545,548 434,326 590,883 OTHER CURRENT ASSETS 73,776 78,905 86,275 TOTAL CURRENT ASSETS $1,521,279 $1,264,749 $1,180,669 PROPERTY AND EQUIPMENT, NET 593,932 665,290 665,862 OPERATING LEASE RIGHT-OF-USE ASSETS 955,781 1,230,954 1,223,512 OTHER ASSETS 205,970 388,672 415,962 TOTAL ASSETS $3,276,962 $3,549,665 $3,486,005 ACCOUNTS PAYABLE $334,775 $219,919 $269,578 ACCRUED EXPENSES 356,370 302,214 269,334 SHORT-TERM PORTION OF OPERATING LEASE LIABILITIES 255,775 282,829 284,694 INCOME TAXES PAYABLE 6,663 10,392 13,728 TOTAL CURRENT LIABILITIES $953,583 $815,354 $837,334 LONG-TERM PORTION OF OPERATING LEASE LIABILITIES 1,010,051 1,252,634 1,234,502 LONG-TERM BORROWINGS, NET 343,559 231,963 241,343 OTHER LIABILITIES 110,965 178,536 178,460 TOTAL LONG-TERM LIABILITIES $1,464,575 $1,663,133 $1,654,305 TOTAL ABERCROMBIE & FITCH CO. STOCKHOLDERS EQUITY 849,379 1,058,810 983,512 NONCONTROLLING INTEREST 9,425 12,368 10,854 TOTAL STOCKHOLDERS' EQUITY $858,804 $1,071,178 $994,366 TOTAL LIABILITIES AND STOCKHOLDERS' EQUITY $3,276,962 $3,549,665 $3,486,005
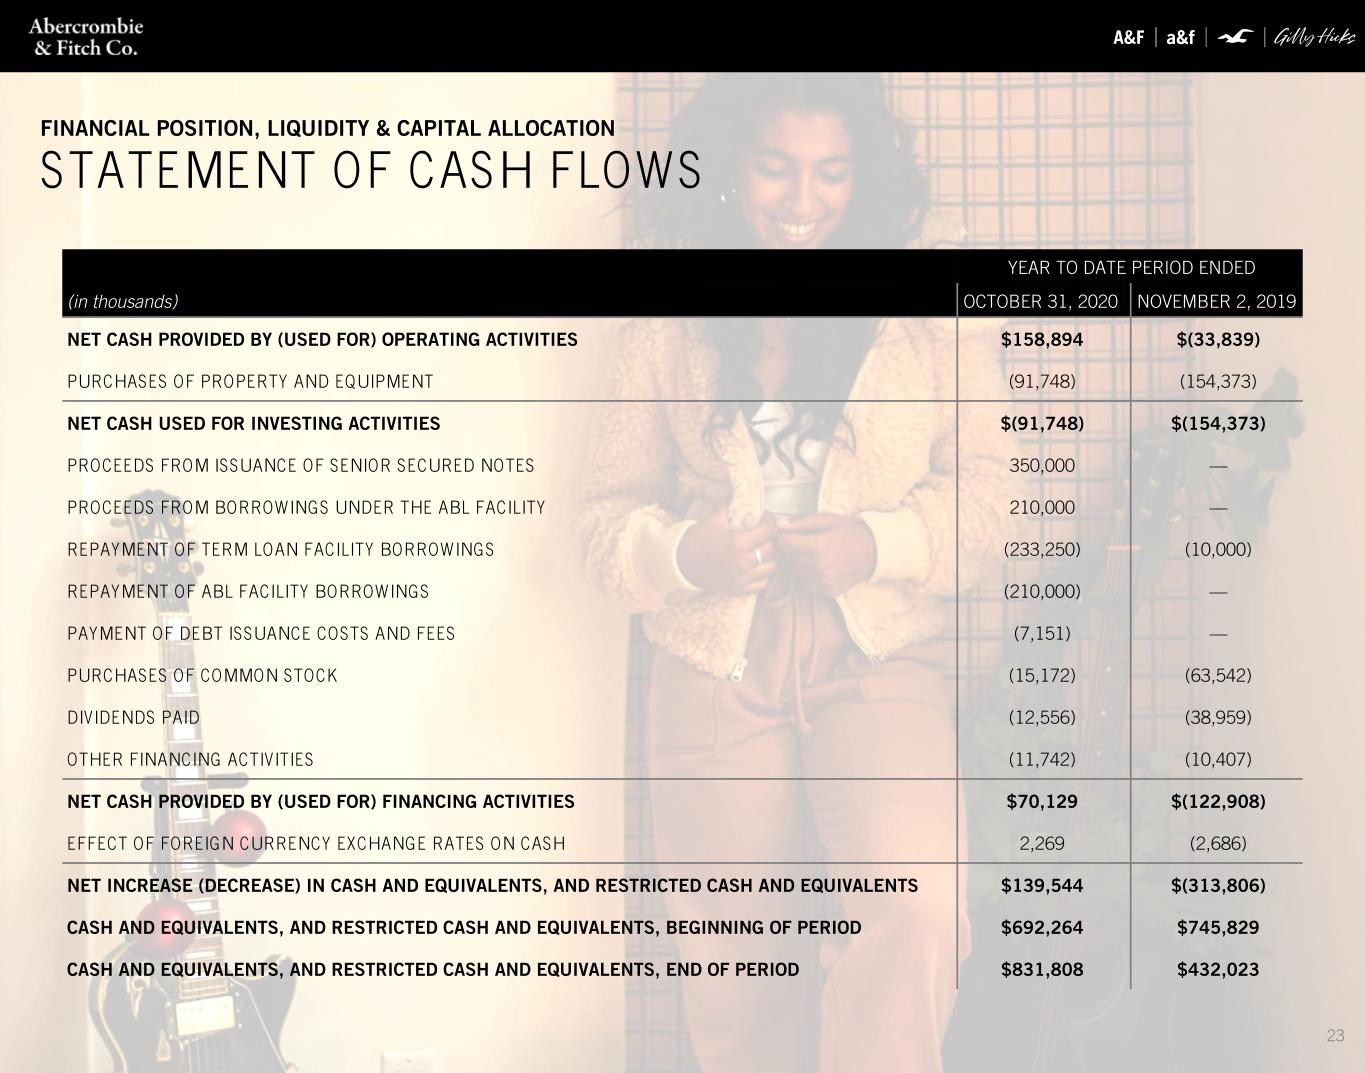

 
23 YEAR TO DATE PERIOD ENDED (in thousands) OCTOBER 31, 2020 NOVEMBER 2, 2019 NET CASH PROVIDED BY (USED FOR) OPERATING ACTIVITIES $158,894 $(33,839) PURCHASES OF PROPERTY AND EQUIPMENT (91,748) (154,373) NET CASH USED FOR INVESTING ACTIVITIES $(91,748) $(154,373) PROCEEDS FROM ISSUANCE OF SENIOR SECURED NOTES 350,000 — PROCEEDS FROM BORROWINGS UNDER THE ABL FACILITY 210,000 — REPAYMENT OF TERM LOAN FACILITY BORROWINGS (233,250) (10,000) REPAYMENT OF ABL FACILITY BORROWINGS (210,000) — PAYMENT OF DEBT ISSUANCE COSTS AND FEES (7,151) — PURCHASES OF COMMON STOCK (15,172) (63,542) DIVIDENDS PAID (12,556) (38,959) OTHER FINANCING ACTIVITIES (11,742) (10,407) NET CASH PROVIDED BY (USED FOR) FINANCING ACTIVITIES $70,129 $(122,908) EFFECT OF FOREIGN CURRENCY EXCHANGE RATES ON CASH 2,269 (2,686) NET INCREASE (DECREASE) IN CASH AND EQUIVALENTS, AND RESTRICTED CASH AND EQUIVALENTS $139,544 $(313,806) CASH AND EQUIVALENTS, AND RESTRICTED CASH AND EQUIVALENTS, BEGINNING OF PERIOD $692,264 $745,829 CASH AND EQUIVALENTS, AND RESTRICTED CASH AND EQUIVALENTS, END OF PERIOD $831,808 $432,023 FINANCIAL POSITION, LIQUIDITY & CAPITAL ALLOCATION STATEMENT OF CASH FLOWS

 
24 GLOBAL STORE NETWORK OPTIMIZATION
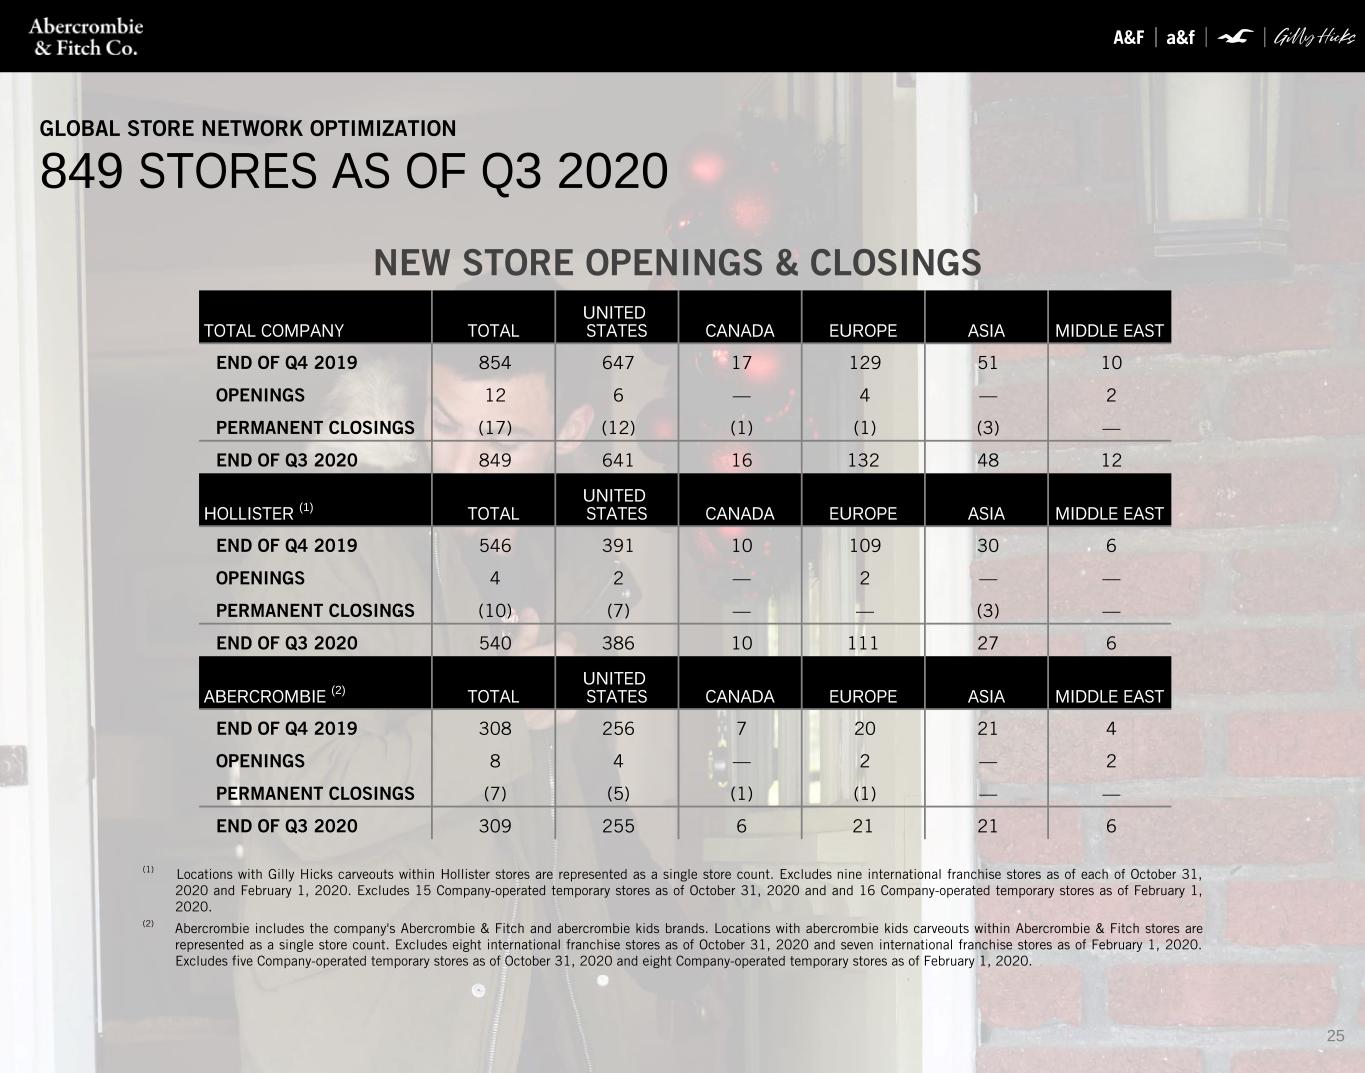

 
25 NEW STORE OPENINGS & CLOSINGS GLOBAL STORE NETWORK OPTIMIZATION 849 STORES AS OF Q3 2020 (1) Locations with Gilly Hicks carveouts within Hollister stores are represented as a single store count. Excludes nine international franchise stores as of each of October 31, 2020 and February 1, 2020. Excludes 15 Company-operated temporary stores as of October 31, 2020 and and 16 Company-operated temporary stores as of February 1, 2020. (2) Abercrombie includes the company's Abercrombie & Fitch and abercrombie kids brands. Locations with abercrombie kids carveouts within Abercrombie & Fitch stores are represented as a single store count. Excludes eight international franchise stores as of October 31, 2020 and seven international franchise stores as of February 1, 2020. Excludes five Company-operated temporary stores as of October 31, 2020 and eight Company-operated temporary stores as of February 1, 2020. TOTAL COMPANY TOTAL UNITED STATES CANADA EUROPE ASIA MIDDLE EAST END OF Q4 2019 854 647 17 129 51 10 OPENINGS 12 6 — 4 — 2 PERMANENT CLOSINGS (17) (12) (1) (1) (3) — END OF Q3 2020 849 641 16 132 48 12 HOLLISTER (1) TOTAL UNITED STATES CANADA EUROPE ASIA MIDDLE EAST END OF Q4 2019 546 391 10 109 30 6 OPENINGS 4 2 — 2 — — PERMANENT CLOSINGS (10) (7) — — (3) — END OF Q3 2020 540 386 10 111 27 6 ABERCROMBIE (2) TOTAL UNITED STATES CANADA EUROPE ASIA MIDDLE EAST END OF Q4 2019 308 256 7 20 21 4 OPENINGS 8 4 — 2 — 2 PERMANENT CLOSINGS (7) (5) (1) (1) — — END OF Q3 2020 309 255 6 21 21 6
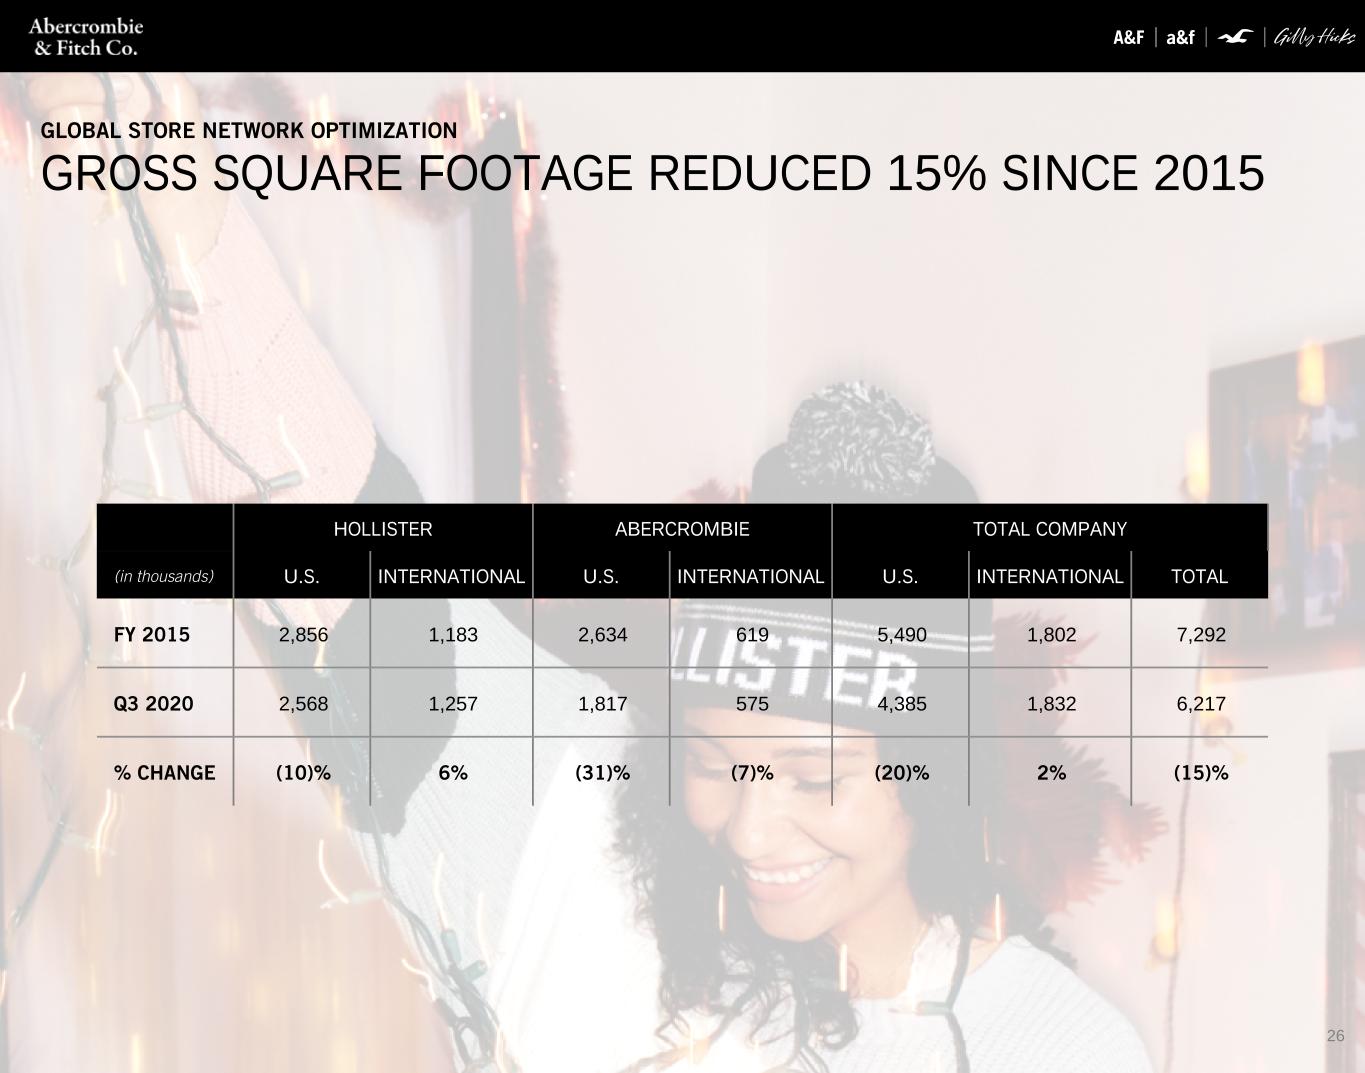

 
26 GLOBAL STORE NETWORK OPTIMIZATION GROSS SQUARE FOOTAGE REDUCED 15% SINCE 2015 HOLLISTER ABERCROMBIE TOTAL COMPANY (in thousands) U.S. INTERNATIONAL U.S. INTERNATIONAL U.S. INTERNATIONAL TOTAL FY 2015 2,856 1,183 2,634 619 5,490 1,802 7,292 Q3 2020 2,568 1,257 1,817 575 4,385 1,832 6,217 % CHANGE (10)% 6% (31)% (7)% (20)% 2% (15)%
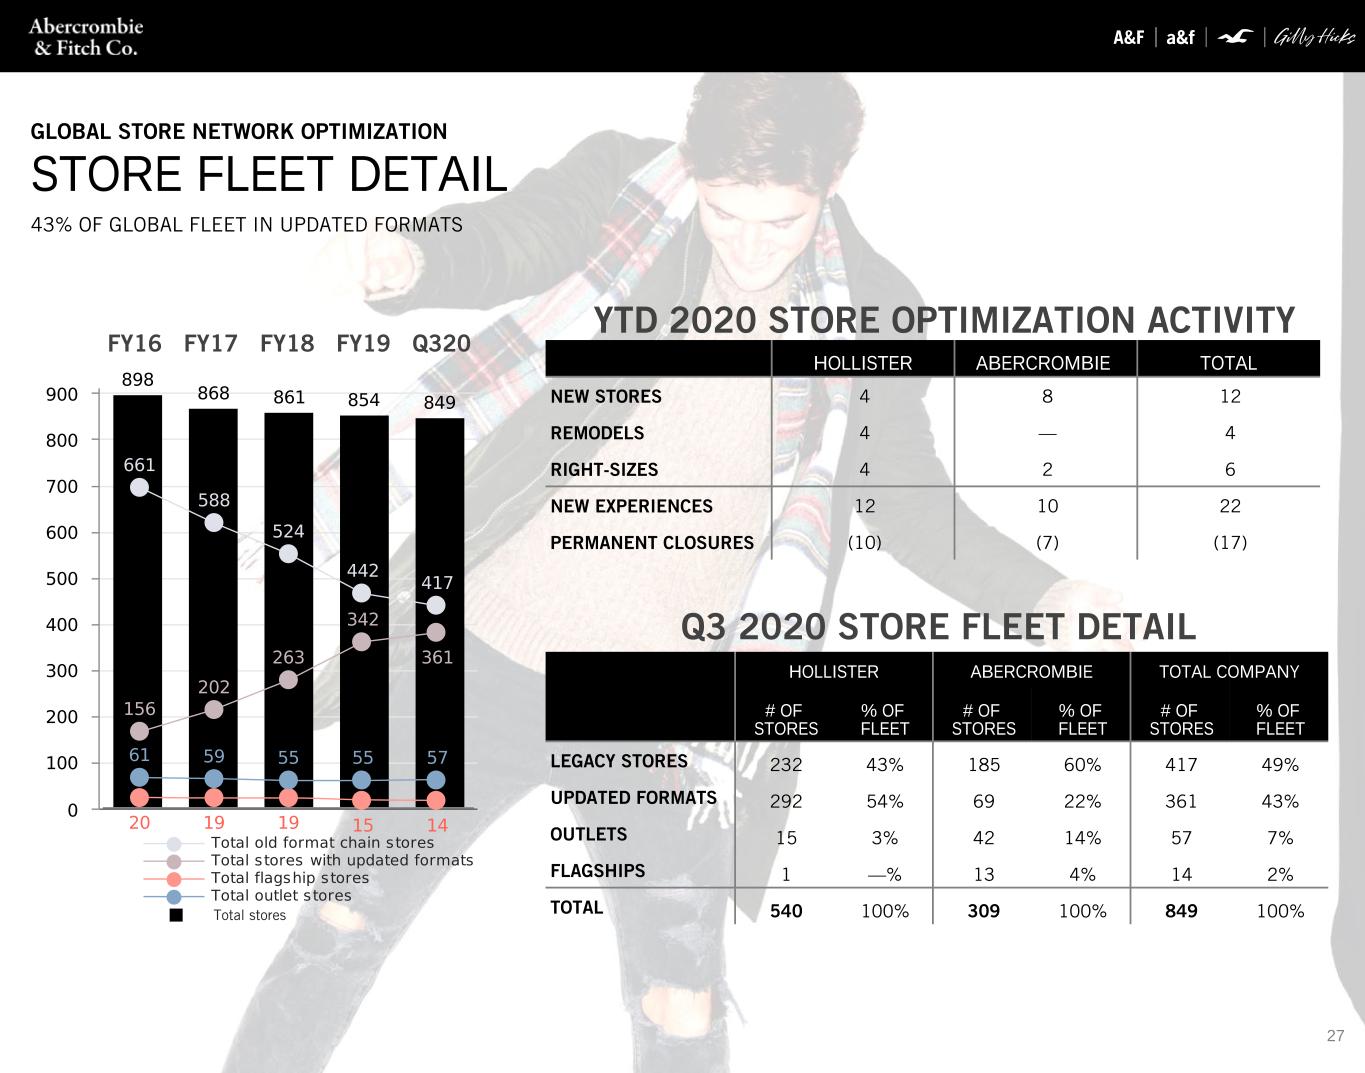

 
27 YTD 2020 STORE OPTIMIZATION ACTIVITY Q3 2020 STORE FLEET DETAIL GLOBAL STORE NETWORK OPTIMIZATION STORE FLEET DETAIL 43% OF GLOBAL FLEET IN UPDATED FORMATS HOLLISTER ABERCROMBIE TOTAL COMPANY # OF STORES % OF FLEET # OF STORES % OF FLEET # OF STORES % OF FLEET LEGACY STORES 232 43% 185 60% 417 49% UPDATED FORMATS 292 54% 69 22% 361 43% OUTLETS 15 3% 42 14% 57 7% FLAGSHIPS 1 —% 13 4% 14 2% TOTAL 540 100% 309 100% 849 100% HOLLISTER ABERCROMBIE TOTAL NEW STORES 4 8 12 REMODELS 4 — 4 RIGHT-SIZES 4 2 6 NEW EXPERIENCES 12 10 22 PERMANENT CLOSURES (10) (7) (17) Total stores FY16 FY17 FY18 FY19 Q320
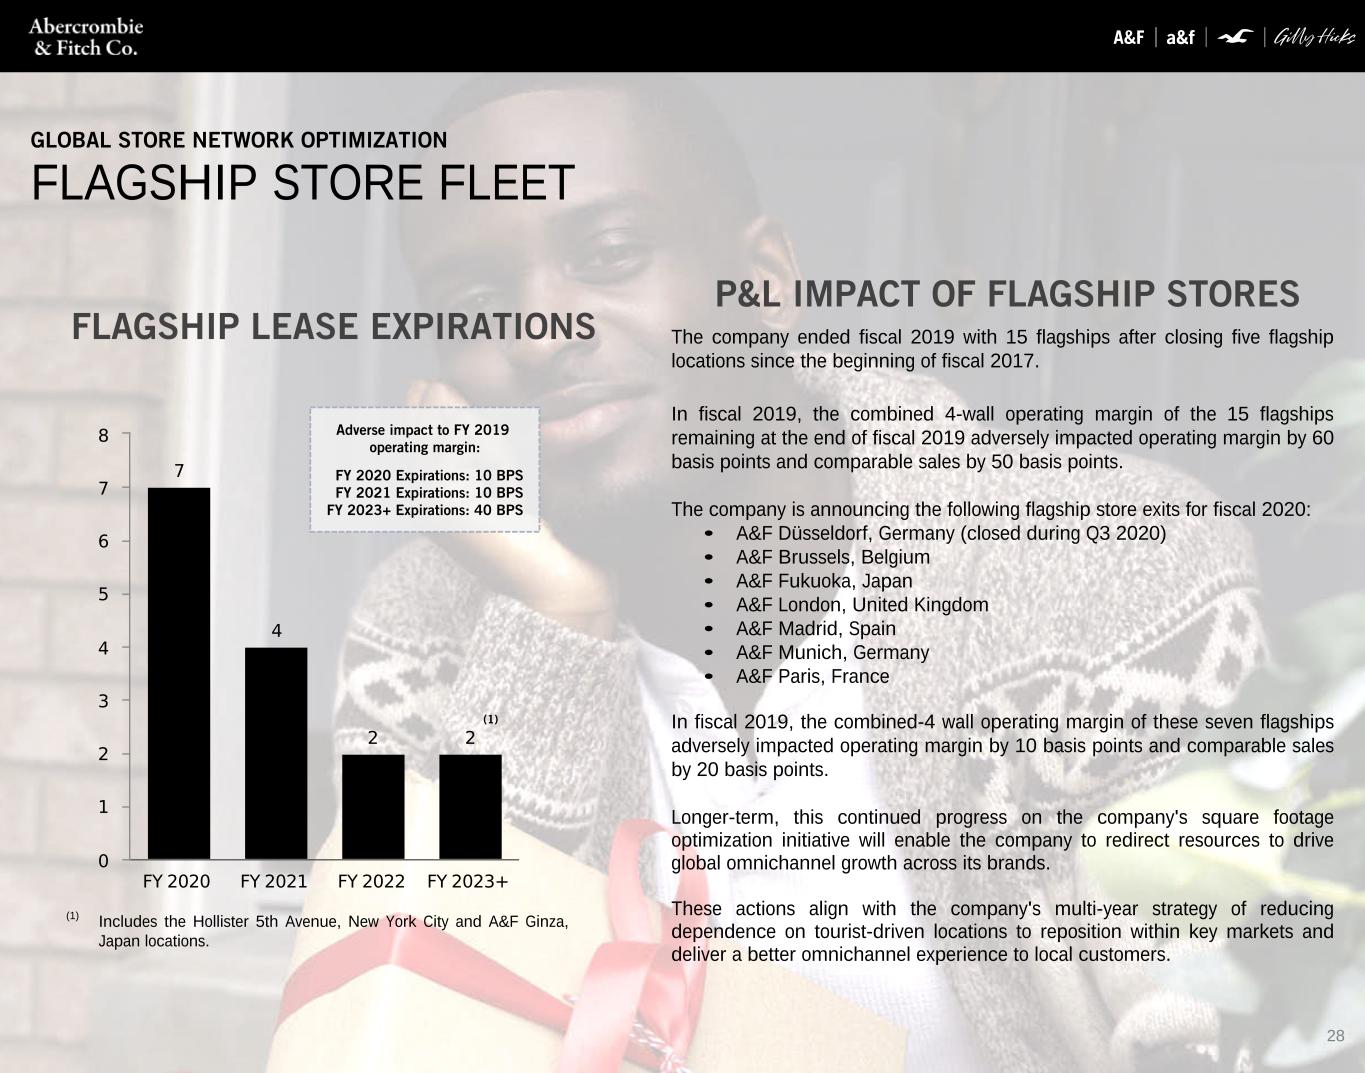

 
28 (1) Includes the Hollister 5th Avenue, New York City and A&F Ginza, Japan locations. GLOBAL STORE NETWORK OPTIMIZATION FLAGSHIP STORE FLEET FLAGSHIP LEASE EXPIRATIONS The company ended fiscal 2019 with 15 flagships after closing five flagship locations since the beginning of fiscal 2017. In fiscal 2019, the combined 4-wall operating margin of the 15 flagships remaining at the end of fiscal 2019 adversely impacted operating margin by 60 basis points and comparable sales by 50 basis points. The company is announcing the following flagship store exits for fiscal 2020: • A&F Düsseldorf, Germany (closed during Q3 2020) • A&F Brussels, Belgium • A&F Fukuoka, Japan • A&F London, United Kingdom • A&F Madrid, Spain • A&F Munich, Germany • A&F Paris, France In fiscal 2019, the combined-4 wall operating margin of these seven flagships adversely impacted operating margin by 10 basis points and comparable sales by 20 basis points. Longer-term, this continued progress on the company's square footage optimization initiative will enable the company to redirect resources to drive global omnichannel growth across its brands. These actions align with the company's multi-year strategy of reducing dependence on tourist-driven locations to reposition within key markets and deliver a better omnichannel experience to local customers. (1) P&L IMPACT OF FLAGSHIP STORES Adverse impact to FY 2019 operating margin: FY 2020 Expirations: 10 BPS FY 2021 Expirations: 10 BPS FY 2023+ Expirations: 40 BPS

 
29 APPENDIX
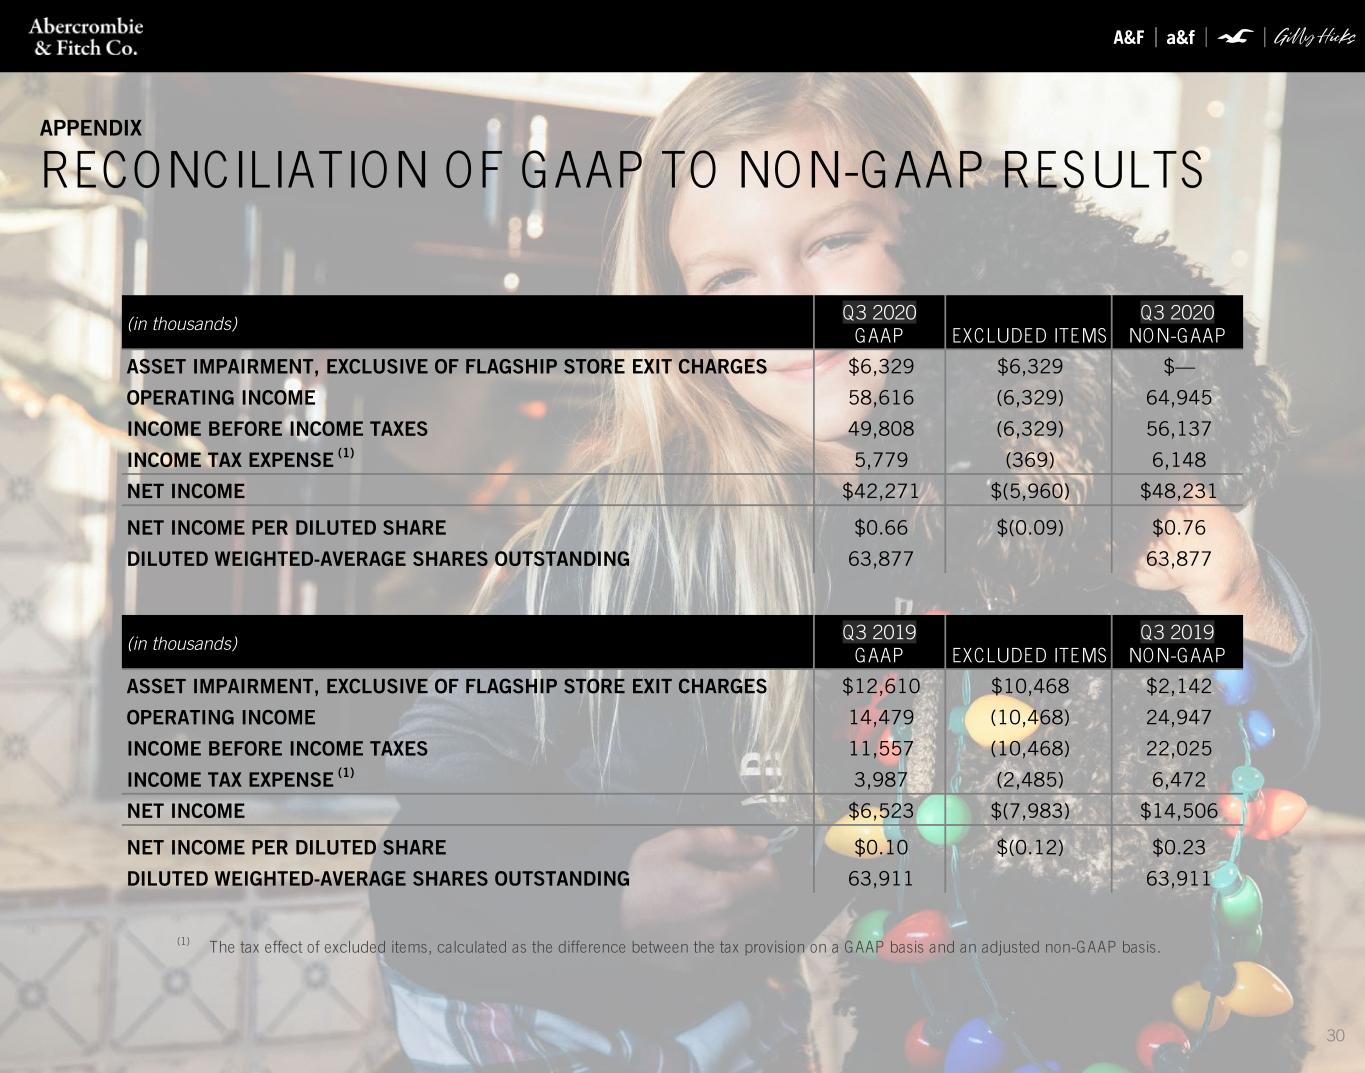

 
30 (1) The tax effect of excluded items, calculated as the difference between the tax provision on a GAAP basis and an adjusted non-GAAP basis. (in thousands) Q3 2020 GAAP EXCLUDED ITEMS Q3 2020 NON-GAAP ASSET IMPAIRMENT, EXCLUSIVE OF FLAGSHIP STORE EXIT CHARGES $6,329 $6,329 $— OPERATING INCOME 58,616 (6,329) 64,945 INCOME BEFORE INCOME TAXES 49,808 (6,329) 56,137 INCOME TAX EXPENSE (1) 5,779 (369) 6,148 NET INCOME $42,271 $(5,960) $48,231 NET INCOME PER DILUTED SHARE $0.66 $(0.09) $0.76 DILUTED WEIGHTED-AVERAGE SHARES OUTSTANDING 63,877 63,877 APPENDIX RECONCILIATION OF GAAP TO NON-GAAP RESULTS (in thousands) Q3 2019 GAAP EXCLUDED ITEMS Q3 2019 NON-GAAP ASSET IMPAIRMENT, EXCLUSIVE OF FLAGSHIP STORE EXIT CHARGES $12,610 $10,468 $2,142 OPERATING INCOME 14,479 (10,468) 24,947 INCOME BEFORE INCOME TAXES 11,557 (10,468) 22,025 INCOME TAX EXPENSE (1) 3,987 (2,485) 6,472 NET INCOME $6,523 $(7,983) $14,506 NET INCOME PER DILUTED SHARE $0.10 $(0.12) $0.23 DILUTED WEIGHTED-AVERAGE SHARES OUTSTANDING 63,911 63,911
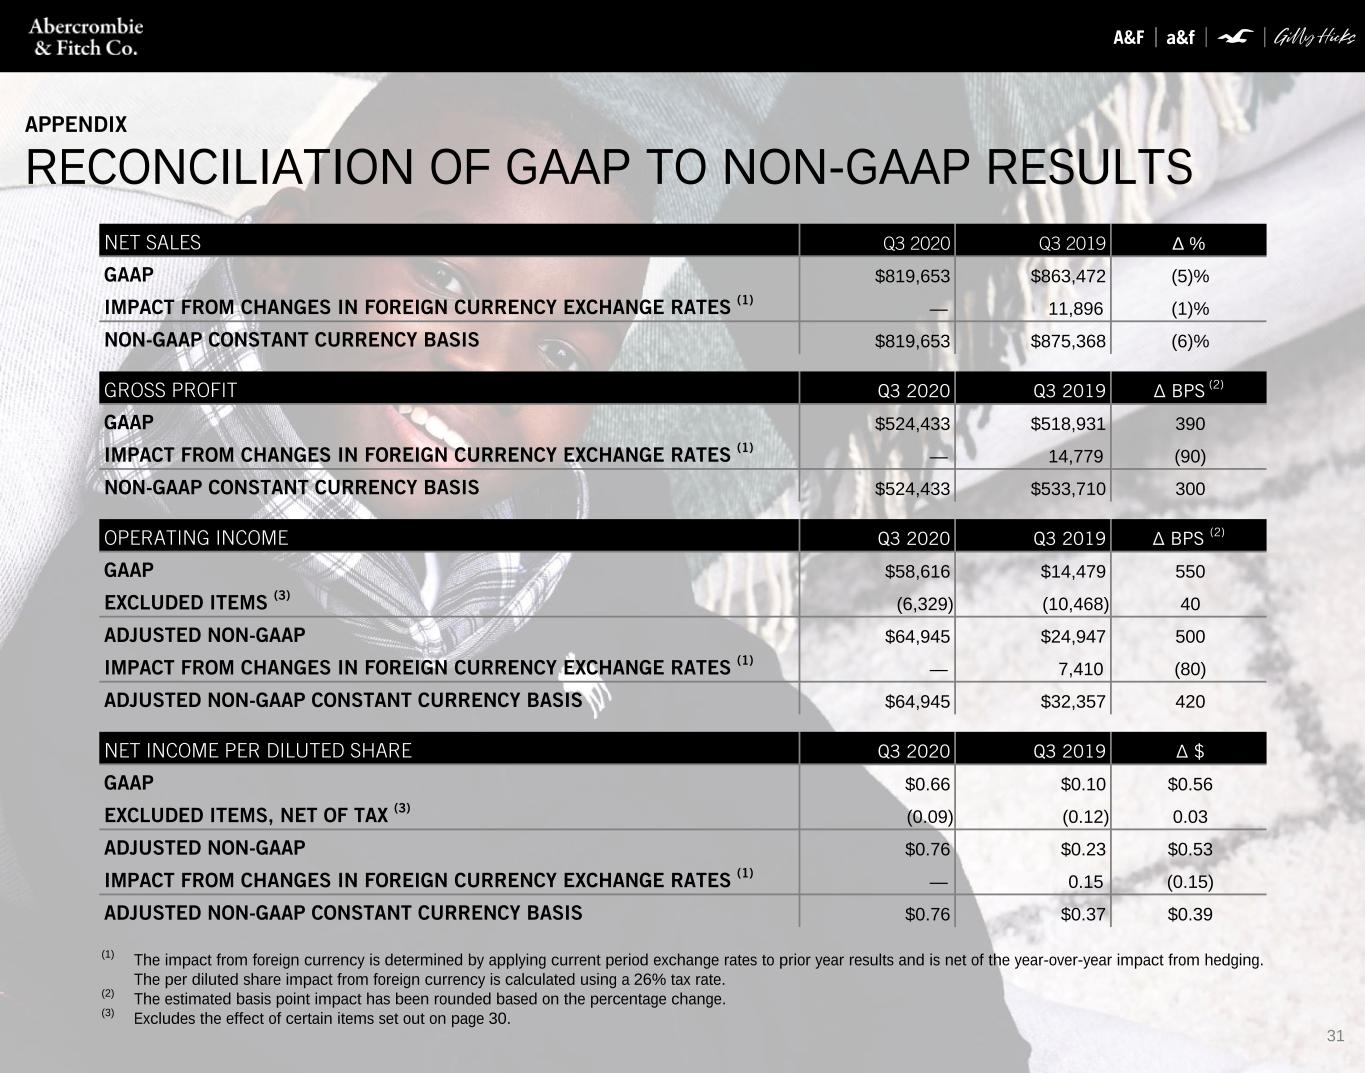

 
31 APPENDIX RECONCILIATION OF GAAP TO NON-GAAP RESULTS NET SALES Q3 2020 Q3 2019 Δ % GAAP $819,653 $863,472 (5)% IMPACT FROM CHANGES IN FOREIGN CURRENCY EXCHANGE RATES (1) — 11,896 (1)% NON-GAAP CONSTANT CURRENCY BASIS $819,653 $875,368 (6)% GROSS PROFIT Q3 2020 Q3 2019 Δ BPS (2) GAAP $524,433 $518,931 390 IMPACT FROM CHANGES IN FOREIGN CURRENCY EXCHANGE RATES (1) — 14,779 (90) NON-GAAP CONSTANT CURRENCY BASIS $524,433 $533,710 300 OPERATING INCOME Q3 2020 Q3 2019 Δ BPS (2) GAAP $58,616 $14,479 550 EXCLUDED ITEMS (3) (6,329) (10,468) 40 ADJUSTED NON-GAAP $64,945 $24,947 500 IMPACT FROM CHANGES IN FOREIGN CURRENCY EXCHANGE RATES (1) — 7,410 (80) ADJUSTED NON-GAAP CONSTANT CURRENCY BASIS $64,945 $32,357 420 NET INCOME PER DILUTED SHARE Q3 2020 Q3 2019 Δ $ GAAP $0.66 $0.10 $0.56 EXCLUDED ITEMS, NET OF TAX (3) (0.09) (0.12) 0.03 ADJUSTED NON-GAAP $0.76 $0.23 $0.53 IMPACT FROM CHANGES IN FOREIGN CURRENCY EXCHANGE RATES (1) — 0.15 (0.15) ADJUSTED NON-GAAP CONSTANT CURRENCY BASIS $0.76 $0.37 $0.39 (1) The impact from foreign currency is determined by applying current period exchange rates to prior year results and is net of the year-over-year impact from hedging. The per diluted share impact from foreign currency is calculated using a 26% tax rate. (2) The estimated basis point impact has been rounded based on the percentage change. (3) Excludes the effect of certain items set out on page 30.



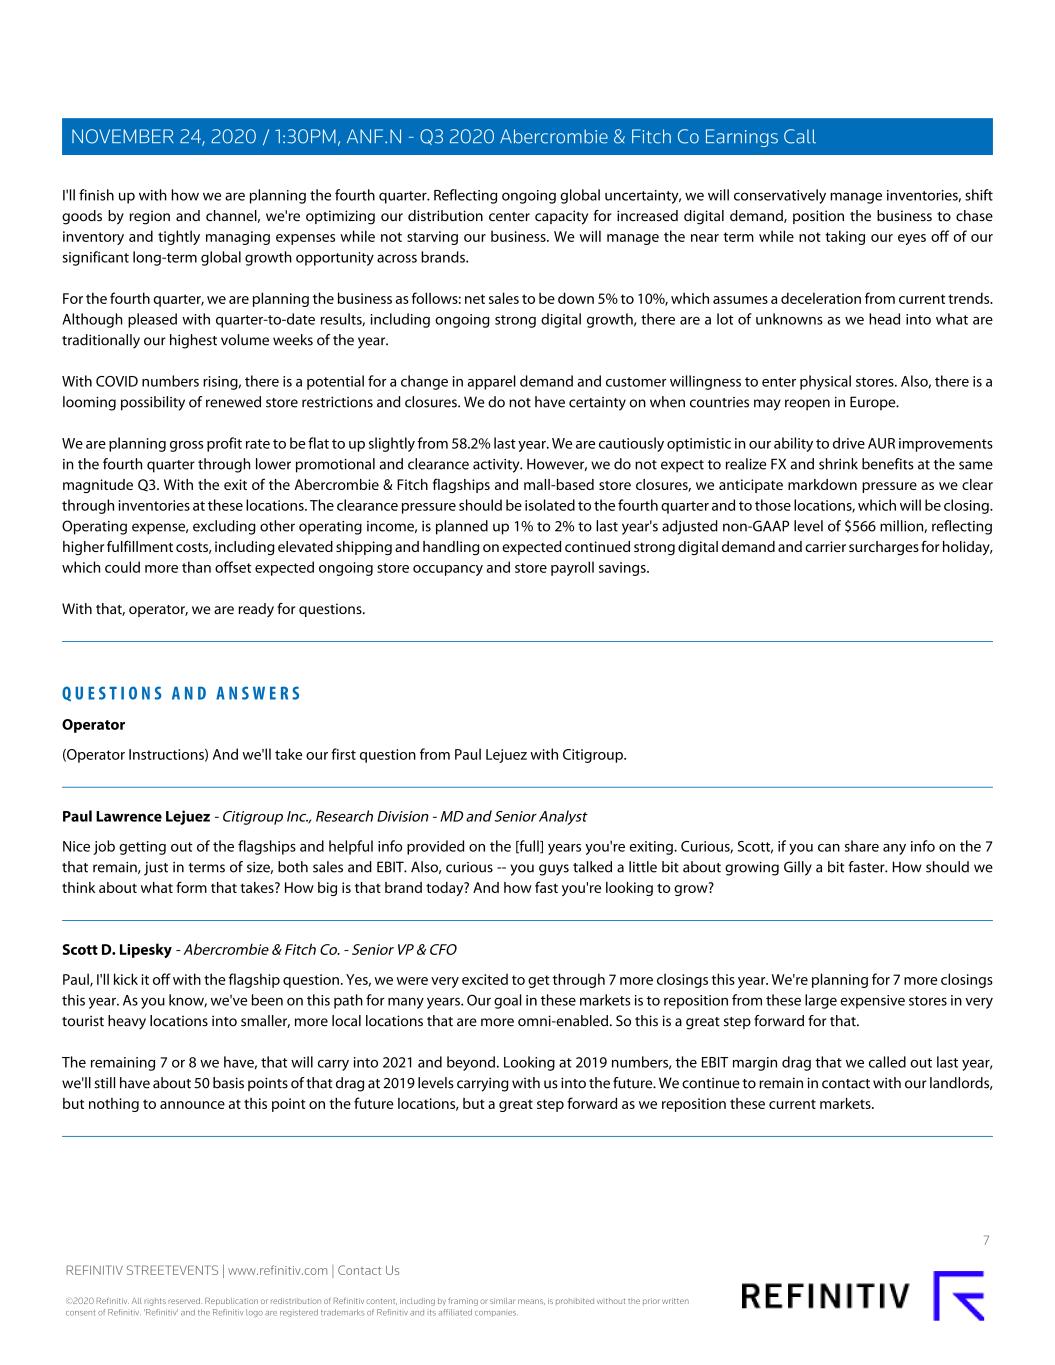
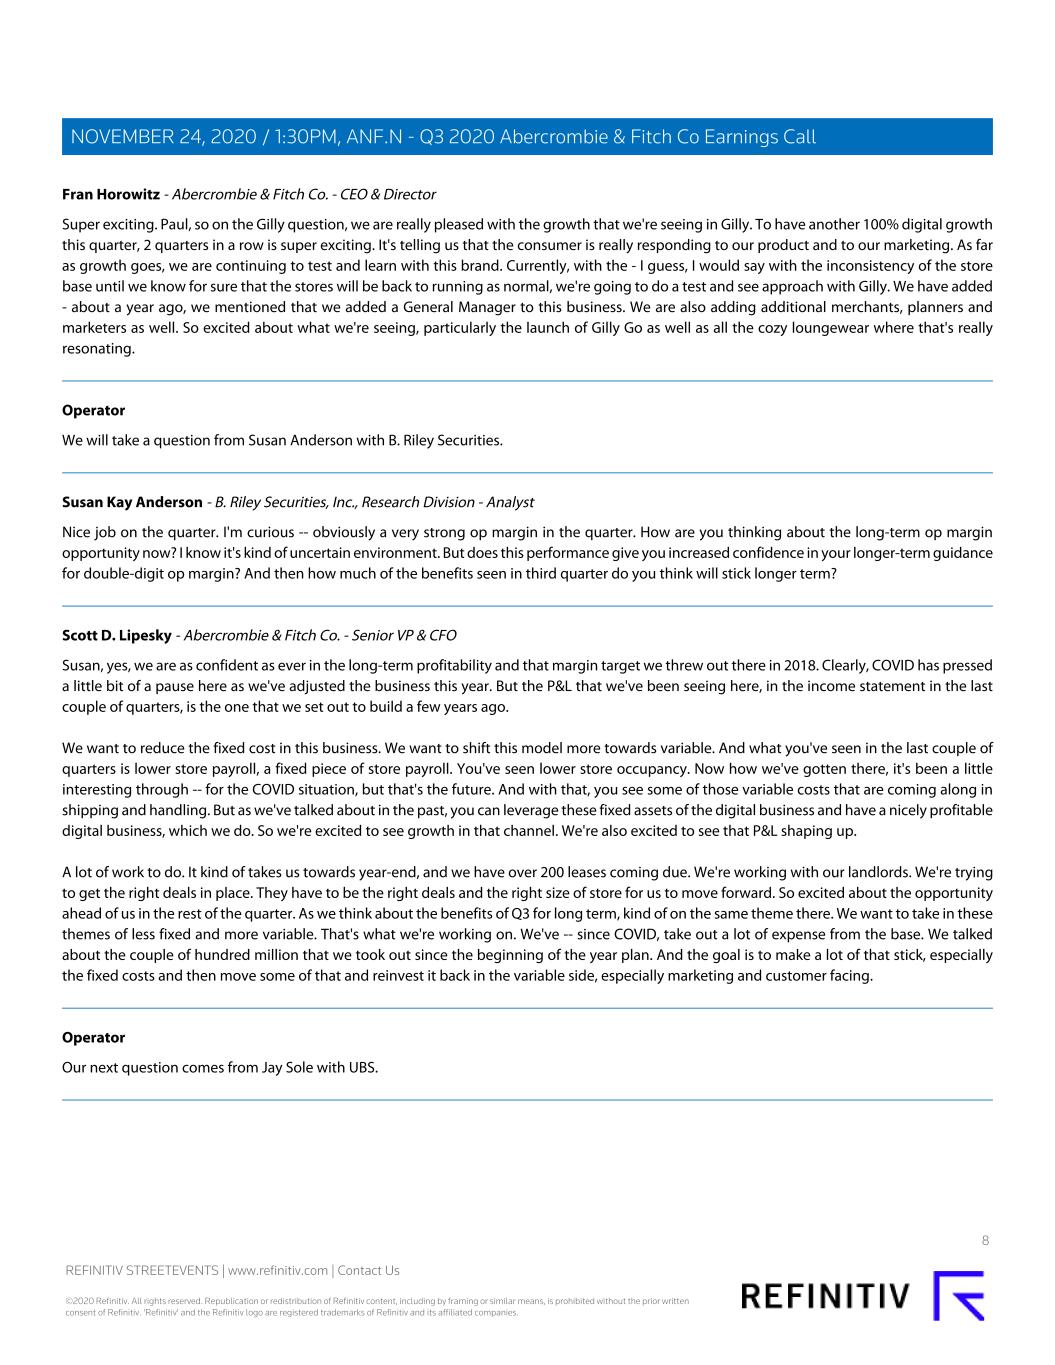
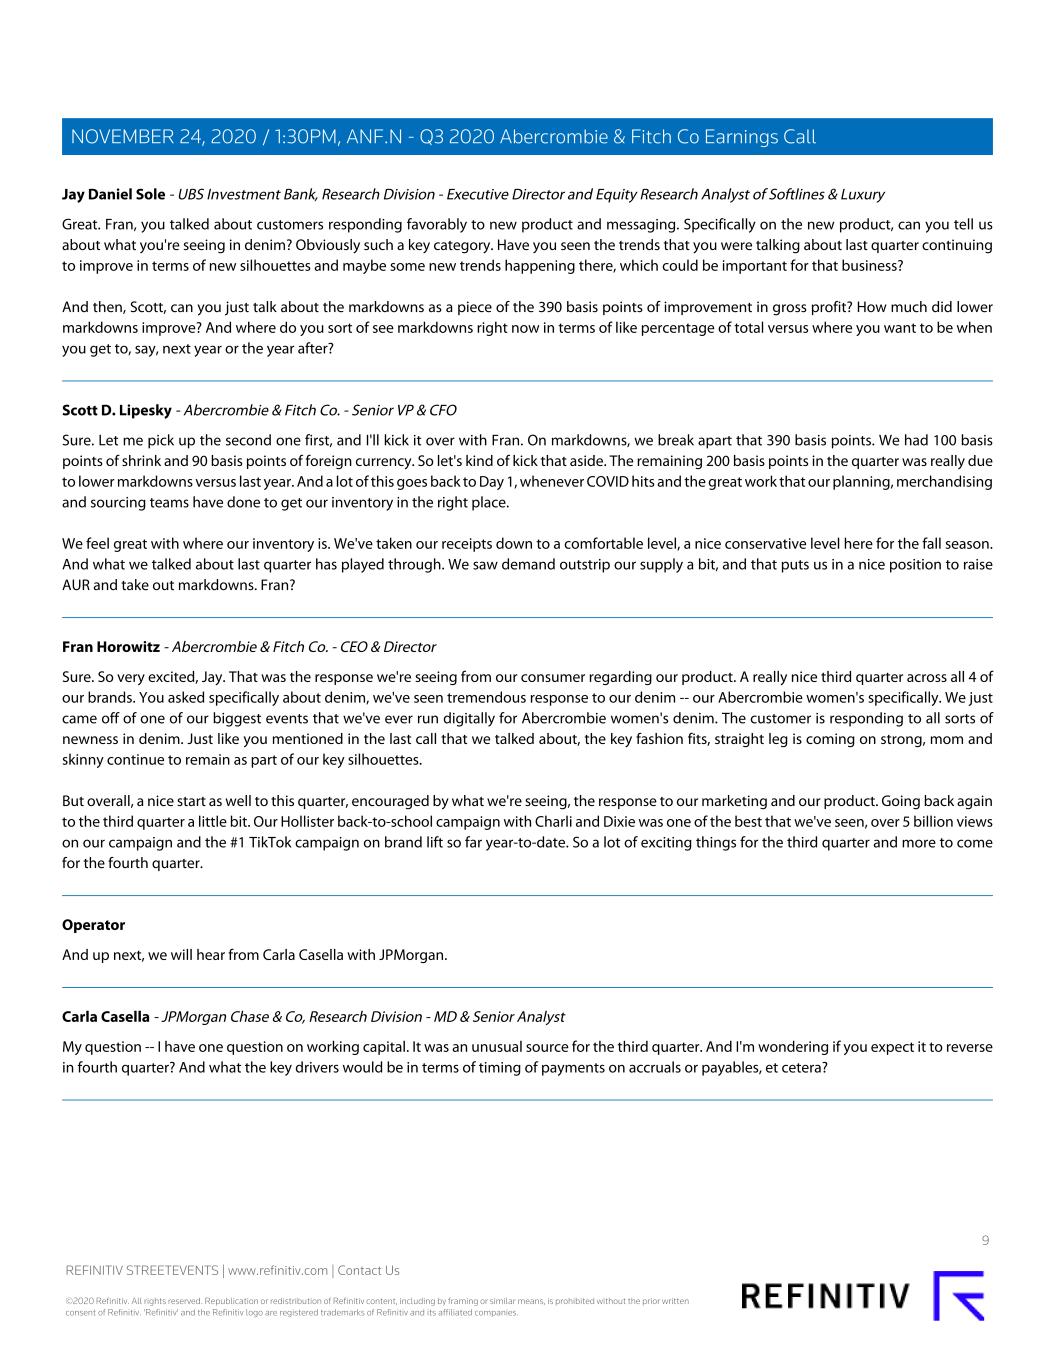
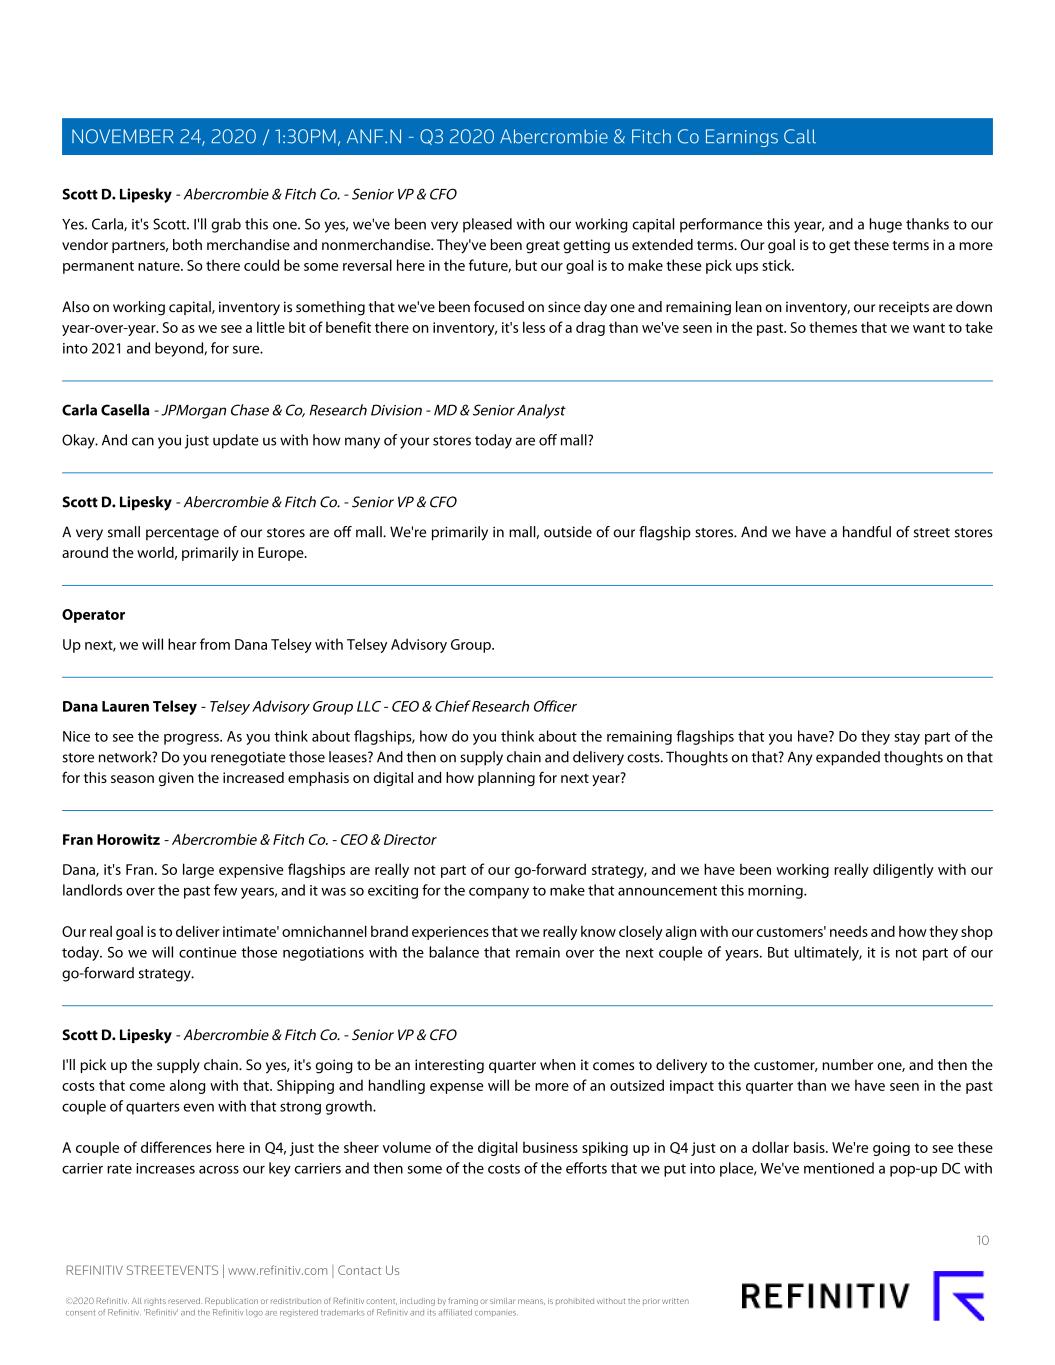
REFINITIV STREETEVENTS EDITED TRANSCRIPT ANF.N - Q3 2020 Abercrombie & Fitch Co Earnings Call EVENT DATE/TIME: NOVEMBER 24, 2020 / 1:30PM GMT REFINITIV STREETEVENTS | www.refinitiv.com | Contact Us ©2020 Refinitiv. All rights reserved. Republication or redistribution of Refinitiv content, including by framing or similar means, is prohibited without the prior written consent of Refinitiv. 'Refinitiv' and the Refinitiv logo are registered trademarks of Refinitiv and its affiliated companies.


C O R P O R A T E P A R T I C I P A N T S Fran Horowitz Abercrombie & Fitch Co. - CEO & Director Pamela Nagler Quintiliano Abercrombie & Fitch Co. - VP of IR Scott D. Lipesky Abercrombie & Fitch Co. - Senior VP & CFO C O N F E R E N C E C A L L P A R T I C I P A N T S Carla Casella JPMorgan Chase & Co, Research Division - MD & Senior Analyst Dana Lauren Telsey Telsey Advisory Group LLC - CEO & Chief Research Officer David Loughran Buckley BofA Merrill Lynch, Research Division - Analyst Janet Joseph Kloppenburg JJK Research Associates, Inc. - President Jay Daniel Sole UBS Investment Bank, Research Division - Executive Director and Equity Research Analyst of Softlines & Luxury Kate Bridget Fitzsimons RBC Capital Markets, Research Division - Assistant VP Marni Shapiro The Retail Tracker - Co-Founder Paul Lawrence Lejuez Citigroup Inc., Research Division - MD and Senior Analyst Sarah Goldberg Robert W. Baird & Co. Incorporated, Research Division - Research Analyst Susan Kay Anderson B. Riley Securities, Inc., Research Division - Analyst P R E S E N T A T I O N Operator Good day, and welcome to the Abercrombie & Fitch Third Quarter Fiscal Year 2020 Earnings Call. Today's conference is being recorded. (Operator Instructions) At this time, I would like to turn the conference over to Pam Quintiliano. Please go ahead. Pamela Nagler Quintiliano - Abercrombie & Fitch Co. - VP of IR Thank you. Good morning, and welcome to our third quarter 2020 earnings call. Joining me today on the call are Fran Horowitz, Chief Executive Officer; and Scott Lipesky, Chief Financial Officer. Earlier this morning, we issued our third quarter earnings release, which is available on our website at corporate.abercrombie.com under the Investors section. Also available on our website is an investor presentation. Please keep in mind that any forward-looking statements made on the call are subject to the Safe Harbor provisions of the Private Securities Litigation Reform Act of 1995. These forward-looking statements are subject to risks and uncertainties that could cause actual results to differ materially from the expectations and assumptions we mention today. A detailed discussion of these factors and uncertainties is contained in the company's filings with the Securities and Exchange Commission. In addition, we will be referring to certain non-GAAP financial measures during the call. Additional details and a reconciliation of GAAP to adjusted non-GAAP financial measures are included in the release issued earlier this morning. 2 REFINITIV STREETEVENTS | www.refinitiv.com | Contact Us ©2020 Refinitiv. All rights reserved. Republication or redistribution of Refinitiv content, including by framing or similar means, is prohibited without the prior written consent of Refinitiv. 'Refinitiv' and the Refinitiv logo are registered trademarks of Refinitiv and its affiliated companies. NOVEMBER 24, 2020 / 1:30PM, ANF.N - Q3 2020 Abercrombie & Fitch Co Earnings Call


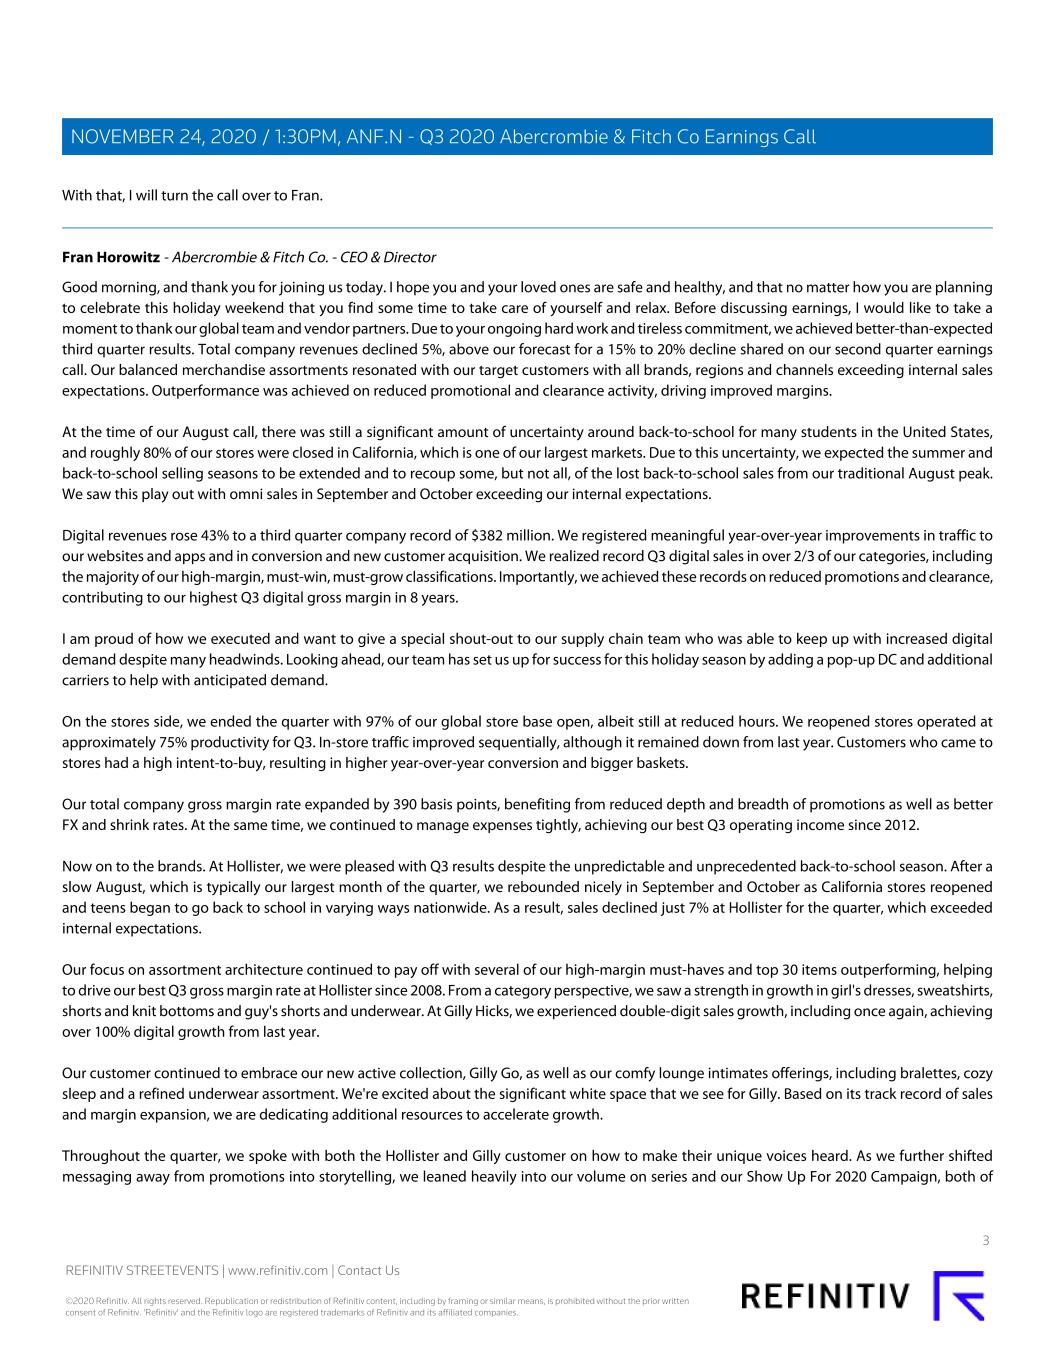
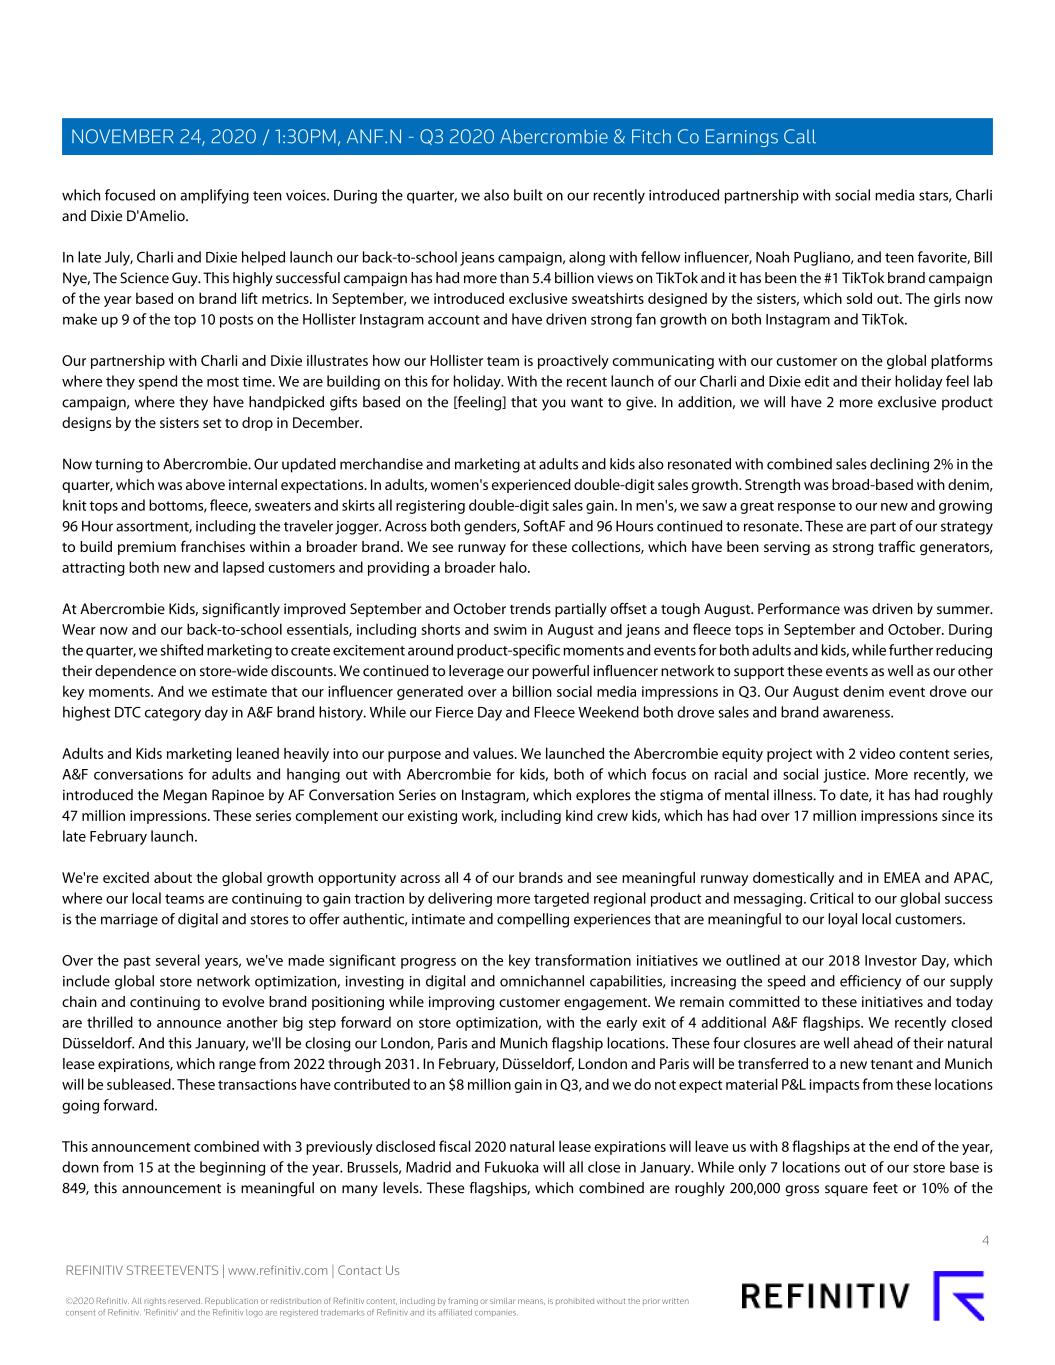
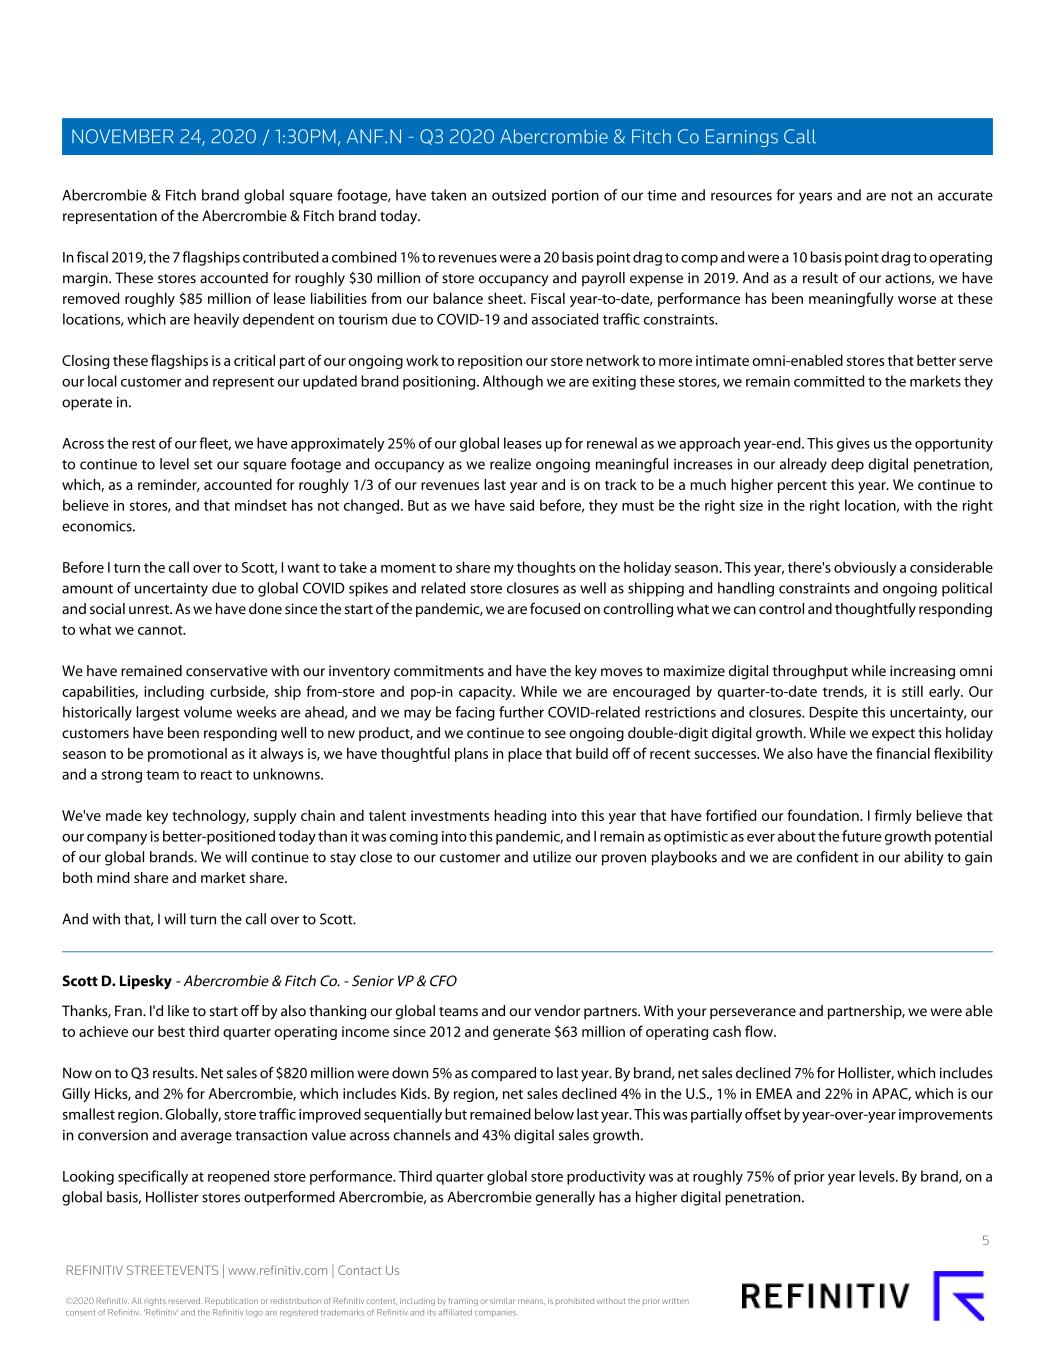
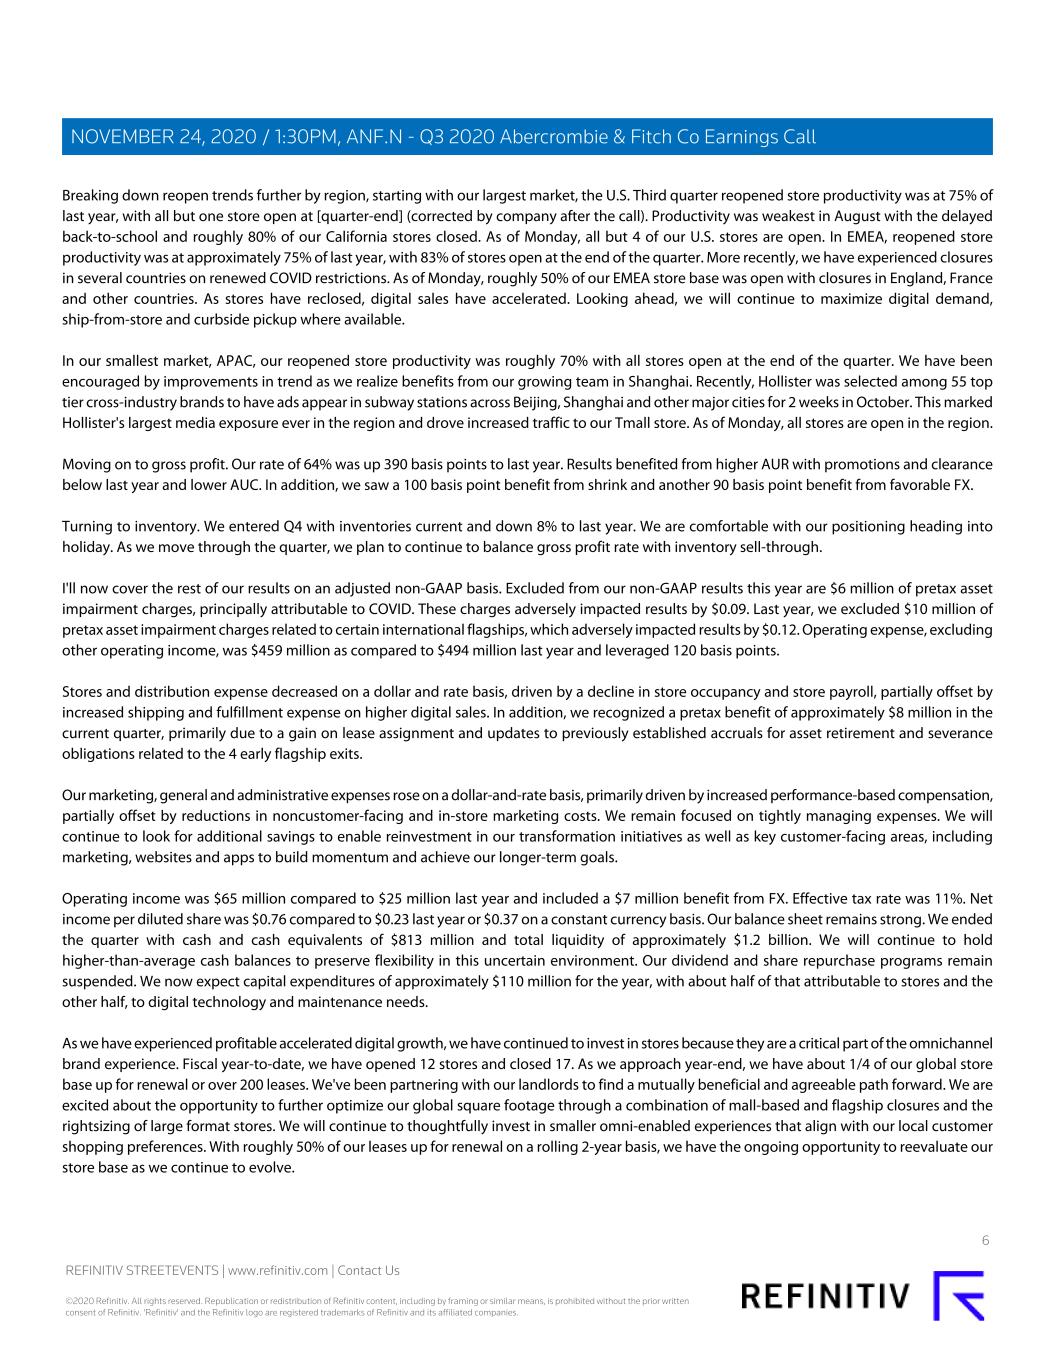
With that, I will turn the call over to Fran. Fran Horowitz - Abercrombie & Fitch Co. - CEO & Director Good morning, and thank you for joining us today. I hope you and your loved ones are safe and healthy, and that no matter how you are planning to celebrate this holiday weekend that you find some time to take care of yourself and relax. Before discussing earnings, I would like to take a moment to thank our global team and vendor partners. Due to your ongoing hard work and tireless commitment, we achieved better-than-expected third quarter results. Total company revenues declined 5%, above our forecast for a 15% to 20% decline shared on our second quarter earnings call. Our balanced merchandise assortments resonated with our target customers with all brands, regions and channels exceeding internal sales expectations. Outperformance was achieved on reduced promotional and clearance activity, driving improved margins. At the time of our August call, there was still a significant amount of uncertainty around back-to-school for many students in the United States, and roughly 80% of our stores were closed in California, which is one of our largest markets. Due to this uncertainty, we expected the summer and back-to-school selling seasons to be extended and to recoup some, but not all, of the lost back-to-school sales from our traditional August peak. We saw this play out with omni sales in September and October exceeding our internal expectations. Digital revenues rose 43% to a third quarter company record of $382 million. We registered meaningful year-over-year improvements in traffic to our websites and apps and in conversion and new customer acquisition. We realized record Q3 digital sales in over 2/3 of our categories, including the majority of our high-margin, must-win, must-grow classifications. Importantly, we achieved these records on reduced promotions and clearance, contributing to our highest Q3 digital gross margin in 8 years. I am proud of how we executed and want to give a special shout-out to our supply chain team who was able to keep up with increased digital demand despite many headwinds. Looking ahead, our team has set us up for success for this holiday season by adding a pop-up DC and additional carriers to help with anticipated demand. On the stores side, we ended the quarter with 97% of our global store base open, albeit still at reduced hours. We reopened stores operated at approximately 75% productivity for Q3. In-store traffic improved sequentially, although it remained down from last year. Customers who came to stores had a high intent-to-buy, resulting in higher year-over-year conversion and bigger baskets. Our total company gross margin rate expanded by 390 basis points, benefiting from reduced depth and breadth of promotions as well as better FX and shrink rates. At the same time, we continued to manage expenses tightly, achieving our best Q3 operating income since 2012. Now on to the brands. At Hollister, we were pleased with Q3 results despite the unpredictable and unprecedented back-to-school season. After a slow August, which is typically our largest month of the quarter, we rebounded nicely in September and October as California stores reopened and teens began to go back to school in varying ways nationwide. As a result, sales declined just 7% at Hollister for the quarter, which exceeded internal expectations. Our focus on assortment architecture continued to pay off with several of our high-margin must-haves and top 30 items outperforming, helping to drive our best Q3 gross margin rate at Hollister since 2008. From a category perspective, we saw a strength in growth in girl's dresses, sweatshirts, shorts and knit bottoms and guy's shorts and underwear. At Gilly Hicks, we experienced double-digit sales growth, including once again, achieving over 100% digital growth from last year. Our customer continued to embrace our new active collection, Gilly Go, as well as our comfy lounge intimates offerings, including bralettes, cozy sleep and a refined underwear assortment. We're excited about the significant white space that we see for Gilly. Based on its track record of sales and margin expansion, we are dedicating additional resources to accelerate growth. Throughout the quarter, we spoke with both the Hollister and Gilly customer on how to make their unique voices heard. As we further shifted messaging away from promotions into storytelling, we leaned heavily into our volume on series and our Show Up For 2020 Campaign, both of 3 REFINITIV STREETEVENTS | www.refinitiv.com | Contact Us ©2020 Refinitiv. All rights reserved. Republication or redistribution of Refinitiv content, including by framing or similar means, is prohibited without the prior written consent of Refinitiv. 'Refinitiv' and the Refinitiv logo are registered trademarks of Refinitiv and its affiliated companies. NOVEMBER 24, 2020 / 1:30PM, ANF.N - Q3 2020 Abercrombie & Fitch Co Earnings Call


which focused on amplifying teen voices. During the quarter, we also built on our recently introduced partnership with social media stars, Charli and Dixie D'Amelio. In late July, Charli and Dixie helped launch our back-to-school jeans campaign, along with fellow influencer, Noah Pugliano, and teen favorite, Bill Nye, The Science Guy. This highly successful campaign has had more than 5.4 billion views on TikTok and it has been the #1 TikTok brand campaign of the year based on brand lift metrics. In September, we introduced exclusive sweatshirts designed by the sisters, which sold out. The girls now make up 9 of the top 10 posts on the Hollister Instagram account and have driven strong fan growth on both Instagram and TikTok. Our partnership with Charli and Dixie illustrates how our Hollister team is proactively communicating with our customer on the global platforms where they spend the most time. We are building on this for holiday. With the recent launch of our Charli and Dixie edit and their holiday feel lab campaign, where they have handpicked gifts based on the [feeling] that you want to give. In addition, we will have 2 more exclusive product designs by the sisters set to drop in December. Now turning to Abercrombie. Our updated merchandise and marketing at adults and kids also resonated with combined sales declining 2% in the quarter, which was above internal expectations. In adults, women's experienced double-digit sales growth. Strength was broad-based with denim, knit tops and bottoms, fleece, sweaters and skirts all registering double-digit sales gain. In men's, we saw a great response to our new and growing 96 Hour assortment, including the traveler jogger. Across both genders, SoftAF and 96 Hours continued to resonate. These are part of our strategy to build premium franchises within a broader brand. We see runway for these collections, which have been serving as strong traffic generators, attracting both new and lapsed customers and providing a broader halo. At Abercrombie Kids, significantly improved September and October trends partially offset a tough August. Performance was driven by summer. Wear now and our back-to-school essentials, including shorts and swim in August and jeans and fleece tops in September and October. During the quarter, we shifted marketing to create excitement around product-specific moments and events for both adults and kids, while further reducing their dependence on store-wide discounts. We continued to leverage our powerful influencer network to support these events as well as our other key moments. And we estimate that our influencer generated over a billion social media impressions in Q3. Our August denim event drove our highest DTC category day in A&F brand history. While our Fierce Day and Fleece Weekend both drove sales and brand awareness. Adults and Kids marketing leaned heavily into our purpose and values. We launched the Abercrombie equity project with 2 video content series, A&F conversations for adults and hanging out with Abercrombie for kids, both of which focus on racial and social justice. More recently, we introduced the Megan Rapinoe by AF Conversation Series on Instagram, which explores the stigma of mental illness. To date, it has had roughly 47 million impressions. These series complement our existing work, including kind crew kids, which has had over 17 million impressions since its late February launch. We're excited about the global growth opportunity across all 4 of our brands and see meaningful runway domestically and in EMEA and APAC, where our local teams are continuing to gain traction by delivering more targeted regional product and messaging. Critical to our global success is the marriage of digital and stores to offer authentic, intimate and compelling experiences that are meaningful to our loyal local customers. Over the past several years, we've made significant progress on the key transformation initiatives we outlined at our 2018 Investor Day, which include global store network optimization, investing in digital and omnichannel capabilities, increasing the speed and efficiency of our supply chain and continuing to evolve brand positioning while improving customer engagement. We remain committed to these initiatives and today are thrilled to announce another big step forward on store optimization, with the early exit of 4 additional A&F flagships. We recently closed Düsseldorf. And this January, we'll be closing our London, Paris and Munich flagship locations. These four closures are well ahead of their natural lease expirations, which range from 2022 through 2031. In February, Düsseldorf, London and Paris will be transferred to a new tenant and Munich will be subleased. These transactions have contributed to an $8 million gain in Q3, and we do not expect material P&L impacts from these locations going forward. This announcement combined with 3 previously disclosed fiscal 2020 natural lease expirations will leave us with 8 flagships at the end of the year, down from 15 at the beginning of the year. Brussels, Madrid and Fukuoka will all close in January. While only 7 locations out of our store base is 849, this announcement is meaningful on many levels. These flagships, which combined are roughly 200,000 gross square feet or 10% of the 4 REFINITIV STREETEVENTS | www.refinitiv.com | Contact Us ©2020 Refinitiv. All rights reserved. Republication or redistribution of Refinitiv content, including by framing or similar means, is prohibited without the prior written consent of Refinitiv. 'Refinitiv' and the Refinitiv logo are registered trademarks of Refinitiv and its affiliated companies. NOVEMBER 24, 2020 / 1:30PM, ANF.N - Q3 2020 Abercrombie & Fitch Co Earnings Call


Abercrombie & Fitch brand global square footage, have taken an outsized portion of our time and resources for years and are not an accurate representation of the Abercrombie & Fitch brand today. In fiscal 2019, the 7 flagships contributed a combined 1% to revenues were a 20 basis point drag to comp and were a 10 basis point drag to operating margin. These stores accounted for roughly $30 million of store occupancy and payroll expense in 2019. And as a result of our actions, we have removed roughly $85 million of lease liabilities from our balance sheet. Fiscal year-to-date, performance has been meaningfully worse at these locations, which are heavily dependent on tourism due to COVID-19 and associated traffic constraints. Closing these flagships is a critical part of our ongoing work to reposition our store network to more intimate omni-enabled stores that better serve our local customer and represent our updated brand positioning. Although we are exiting these stores, we remain committed to the markets they operate in. Across the rest of our fleet, we have approximately 25% of our global leases up for renewal as we approach year-end. This gives us the opportunity to continue to level set our square footage and occupancy as we realize ongoing meaningful increases in our already deep digital penetration, which, as a reminder, accounted for roughly 1/3 of our revenues last year and is on track to be a much higher percent this year. We continue to believe in stores, and that mindset has not changed. But as we have said before, they must be the right size in the right location, with the right economics. Before I turn the call over to Scott, I want to take a moment to share my thoughts on the holiday season. This year, there's obviously a considerable amount of uncertainty due to global COVID spikes and related store closures as well as shipping and handling constraints and ongoing political and social unrest. As we have done since the start of the pandemic, we are focused on controlling what we can control and thoughtfully responding to what we cannot. We have remained conservative with our inventory commitments and have the key moves to maximize digital throughput while increasing omni capabilities, including curbside, ship from-store and pop-in capacity. While we are encouraged by quarter-to-date trends, it is still early. Our historically largest volume weeks are ahead, and we may be facing further COVID-related restrictions and closures. Despite this uncertainty, our customers have been responding well to new product, and we continue to see ongoing double-digit digital growth. While we expect this holiday season to be promotional as it always is, we have thoughtful plans in place that build off of recent successes. We also have the financial flexibility and a strong team to react to unknowns. We've made key technology, supply chain and talent investments heading into this year that have fortified our foundation. I firmly believe that our company is better-positioned today than it was coming into this pandemic, and I remain as optimistic as ever about the future growth potential of our global brands. We will continue to stay close to our customer and utilize our proven playbooks and we are confident in our ability to gain both mind share and market share. And with that, I will turn the call over to Scott. Scott D. Lipesky - Abercrombie & Fitch Co. - Senior VP & CFO Thanks, Fran. I'd like to start off by also thanking our global teams and our vendor partners. With your perseverance and partnership, we were able to achieve our best third quarter operating income since 2012 and generate $63 million of operating cash flow. Now on to Q3 results. Net sales of $820 million were down 5% as compared to last year. By brand, net sales declined 7% for Hollister, which includes Gilly Hicks, and 2% for Abercrombie, which includes Kids. By region, net sales declined 4% in the U.S., 1% in EMEA and 22% in APAC, which is our smallest region. Globally, store traffic improved sequentially but remained below last year. This was partially offset by year-over-year improvements in conversion and average transaction value across channels and 43% digital sales growth. Looking specifically at reopened store performance. Third quarter global store productivity was at roughly 75% of prior year levels. By brand, on a global basis, Hollister stores outperformed Abercrombie, as Abercrombie generally has a higher digital penetration. 5 REFINITIV STREETEVENTS | www.refinitiv.com | Contact Us ©2020 Refinitiv. All rights reserved. Republication or redistribution of Refinitiv content, including by framing or similar means, is prohibited without the prior written consent of Refinitiv. 'Refinitiv' and the Refinitiv logo are registered trademarks of Refinitiv and its affiliated companies. NOVEMBER 24, 2020 / 1:30PM, ANF.N - Q3 2020 Abercrombie & Fitch Co Earnings Call


Breaking down reopen trends further by region, starting with our largest market, the U.S. Third quarter reopened store productivity was at 75% of last year, with all but one store open at [quarter-end] (corrected by company after the call). Productivity was weakest in August with the delayed back-to-school and roughly 80% of our California stores closed. As of Monday, all but 4 of our U.S. stores are open. In EMEA, reopened store productivity was at approximately 75% of last year, with 83% of stores open at the end of the quarter. More recently, we have experienced closures in several countries on renewed COVID restrictions. As of Monday, roughly 50% of our EMEA store base was open with closures in England, France and other countries. As stores have reclosed, digital sales have accelerated. Looking ahead, we will continue to maximize digital demand, ship-from-store and curbside pickup where available. In our smallest market, APAC, our reopened store productivity was roughly 70% with all stores open at the end of the quarter. We have been encouraged by improvements in trend as we realize benefits from our growing team in Shanghai. Recently, Hollister was selected among 55 top tier cross-industry brands to have ads appear in subway stations across Beijing, Shanghai and other major cities for 2 weeks in October. This marked Hollister's largest media exposure ever in the region and drove increased traffic to our Tmall store. As of Monday, all stores are open in the region. Moving on to gross profit. Our rate of 64% was up 390 basis points to last year. Results benefited from higher AUR with promotions and clearance below last year and lower AUC. In addition, we saw a 100 basis point benefit from shrink and another 90 basis point benefit from favorable FX. Turning to inventory. We entered Q4 with inventories current and down 8% to last year. We are comfortable with our positioning heading into holiday. As we move through the quarter, we plan to continue to balance gross profit rate with inventory sell-through. I'll now cover the rest of our results on an adjusted non-GAAP basis. Excluded from our non-GAAP results this year are $6 million of pretax asset impairment charges, principally attributable to COVID. These charges adversely impacted results by $0.09. Last year, we excluded $10 million of pretax asset impairment charges related to certain international flagships, which adversely impacted results by $0.12. Operating expense, excluding other operating income, was $459 million as compared to $494 million last year and leveraged 120 basis points. Stores and distribution expense decreased on a dollar and rate basis, driven by a decline in store occupancy and store payroll, partially offset by increased shipping and fulfillment expense on higher digital sales. In addition, we recognized a pretax benefit of approximately $8 million in the current quarter, primarily due to a gain on lease assignment and updates to previously established accruals for asset retirement and severance obligations related to the 4 early flagship exits. Our marketing, general and administrative expenses rose on a dollar-and-rate basis, primarily driven by increased performance-based compensation, partially offset by reductions in noncustomer-facing and in-store marketing costs. We remain focused on tightly managing expenses. We will continue to look for additional savings to enable reinvestment in our transformation initiatives as well as key customer-facing areas, including marketing, websites and apps to build momentum and achieve our longer-term goals. Operating income was $65 million compared to $25 million last year and included a $7 million benefit from FX. Effective tax rate was 11%. Net income per diluted share was $0.76 compared to $0.23 last year or $0.37 on a constant currency basis. Our balance sheet remains strong. We ended the quarter with cash and cash equivalents of $813 million and total liquidity of approximately $1.2 billion. We will continue to hold higher-than-average cash balances to preserve flexibility in this uncertain environment. Our dividend and share repurchase programs remain suspended. We now expect capital expenditures of approximately $110 million for the year, with about half of that attributable to stores and the other half, to digital technology and maintenance needs. As we have experienced profitable accelerated digital growth, we have continued to invest in stores because they are a critical part of the omnichannel brand experience. Fiscal year-to-date, we have opened 12 stores and closed 17. As we approach year-end, we have about 1/4 of our global store base up for renewal or over 200 leases. We've been partnering with our landlords to find a mutually beneficial and agreeable path forward. We are excited about the opportunity to further optimize our global square footage through a combination of mall-based and flagship closures and the rightsizing of large format stores. We will continue to thoughtfully invest in smaller omni-enabled experiences that align with our local customer shopping preferences. With roughly 50% of our leases up for renewal on a rolling 2-year basis, we have the ongoing opportunity to reevaluate our store base as we continue to evolve. 6 REFINITIV STREETEVENTS | www.refinitiv.com | Contact Us ©2020 Refinitiv. All rights reserved. Republication or redistribution of Refinitiv content, including by framing or similar means, is prohibited without the prior written consent of Refinitiv. 'Refinitiv' and the Refinitiv logo are registered trademarks of Refinitiv and its affiliated companies. NOVEMBER 24, 2020 / 1:30PM, ANF.N - Q3 2020 Abercrombie & Fitch Co Earnings Call


I'll finish up with how we are planning the fourth quarter. Reflecting ongoing global uncertainty, we will conservatively manage inventories, shift goods by region and channel, we're optimizing our distribution center capacity for increased digital demand, position the business to chase inventory and tightly managing expenses while not starving our business. We will manage the near term while not taking our eyes off of our significant long-term global growth opportunity across brands. For the fourth quarter, we are planning the business as follows: net sales to be down 5% to 10%, which assumes a deceleration from current trends. Although pleased with quarter-to-date results, including ongoing strong digital growth, there are a lot of unknowns as we head into what are traditionally our highest volume weeks of the year. With COVID numbers rising, there is a potential for a change in apparel demand and customer willingness to enter physical stores. Also, there is a looming possibility of renewed store restrictions and closures. We do not have certainty on when countries may reopen in Europe. We are planning gross profit rate to be flat to up slightly from 58.2% last year. We are cautiously optimistic in our ability to drive AUR improvements in the fourth quarter through lower promotional and clearance activity. However, we do not expect to realize FX and shrink benefits at the same magnitude Q3. With the exit of the Abercrombie & Fitch flagships and mall-based store closures, we anticipate markdown pressure as we clear through inventories at these locations. The clearance pressure should be isolated to the fourth quarter and to those locations, which will be closing. Operating expense, excluding other operating income, is planned up 1% to 2% to last year's adjusted non-GAAP level of $566 million, reflecting higher fulfillment costs, including elevated shipping and handling on expected continued strong digital demand and carrier surcharges for holiday, which could more than offset expected ongoing store occupancy and store payroll savings. With that, operator, we are ready for questions. Q U E S T I O N S A N D A N S W E R S Operator (Operator Instructions) And we'll take our first question from Paul Lejuez with Citigroup. Paul Lawrence Lejuez - Citigroup Inc., Research Division - MD and Senior Analyst Nice job getting out of the flagships and helpful info provided on the [full] years you're exiting. Curious, Scott, if you can share any info on the 7 that remain, just in terms of size, both sales and EBIT. Also, curious -- you guys talked a little bit about growing Gilly a bit faster. How should we think about what form that takes? How big is that brand today? And how fast you're looking to grow? Scott D. Lipesky - Abercrombie & Fitch Co. - Senior VP & CFO Paul, I'll kick it off with the flagship question. Yes, we were very excited to get through 7 more closings this year. We're planning for 7 more closings this year. As you know, we've been on this path for many years. Our goal in these markets is to reposition from these large expensive stores in very tourist heavy locations into smaller, more local locations that are more omni-enabled. So this is a great step forward for that. The remaining 7 or 8 we have, that will carry into 2021 and beyond. Looking at 2019 numbers, the EBIT margin drag that we called out last year, we'll still have about 50 basis points of that drag at 2019 levels carrying with us into the future. We continue to remain in contact with our landlords, but nothing to announce at this point on the future locations, but a great step forward as we reposition these current markets. 7 REFINITIV STREETEVENTS | www.refinitiv.com | Contact Us ©2020 Refinitiv. All rights reserved. Republication or redistribution of Refinitiv content, including by framing or similar means, is prohibited without the prior written consent of Refinitiv. 'Refinitiv' and the Refinitiv logo are registered trademarks of Refinitiv and its affiliated companies. NOVEMBER 24, 2020 / 1:30PM, ANF.N - Q3 2020 Abercrombie & Fitch Co Earnings Call


Fran Horowitz - Abercrombie & Fitch Co. - CEO & Director Super exciting. Paul, so on the Gilly question, we are really pleased with the growth that we're seeing in Gilly. To have another 100% digital growth this quarter, 2 quarters in a row is super exciting. It's telling us that the consumer is really responding to our product and to our marketing. As far as growth goes, we are continuing to test and learn with this brand. Currently, with the - I guess, I would say with the inconsistency of the store base until we know for sure that the stores will be back to running as normal, we're going to do a test and see approach with Gilly. We have added - about a year ago, we mentioned that we added a General Manager to this business. We are also adding additional merchants, planners and marketers as well. So excited about what we're seeing, particularly the launch of Gilly Go as well as all the cozy loungewear where that's really resonating. Operator We will take a question from Susan Anderson with B. Riley Securities. Susan Kay Anderson - B. Riley Securities, Inc., Research Division - Analyst Nice job on the quarter. I'm curious -- obviously a very strong op margin in the quarter. How are you thinking about the long-term op margin opportunity now? I know it's kind of uncertain environment. But does this performance give you increased confidence in your longer-term guidance for double-digit op margin? And then how much of the benefits seen in third quarter do you think will stick longer term? Scott D. Lipesky - Abercrombie & Fitch Co. - Senior VP & CFO Susan, yes, we are as confident as ever in the long-term profitability and that margin target we threw out there in 2018. Clearly, COVID has pressed a little bit of a pause here as we've adjusted the business this year. But the P&L that we've been seeing here, in the income statement in the last couple of quarters, is the one that we set out to build a few years ago. We want to reduce the fixed cost in this business. We want to shift this model more towards variable. And what you've seen in the last couple of quarters is lower store payroll, a fixed piece of store payroll. You've seen lower store occupancy. Now how we've gotten there, it's been a little interesting through -- for the COVID situation, but that's the future. And with that, you see some of those variable costs that are coming along in shipping and handling. But as we've talked about in the past, you can leverage these fixed assets of the digital business and have a nicely profitable digital business, which we do. So we're excited to see growth in that channel. We're also excited to see that P&L shaping up. A lot of work to do. It kind of takes us towards year-end, and we have over 200 leases coming due. We're working with our landlords. We're trying to get the right deals in place. They have to be the right deals and the right size of store for us to move forward. So excited about the opportunity ahead of us in the rest of the quarter. As we think about the benefits of Q3 for long term, kind of on the same theme there. We want to take in these themes of less fixed and more variable. That's what we're working on. We've -- since COVID, take out a lot of expense from the base. We talked about the couple of hundred million that we took out since the beginning of the year plan. And the goal is to make a lot of that stick, especially the fixed costs and then move some of that and reinvest it back in the variable side, especially marketing and customer facing. Operator Our next question comes from Jay Sole with UBS. 8 REFINITIV STREETEVENTS | www.refinitiv.com | Contact Us ©2020 Refinitiv. All rights reserved. Republication or redistribution of Refinitiv content, including by framing or similar means, is prohibited without the prior written consent of Refinitiv. 'Refinitiv' and the Refinitiv logo are registered trademarks of Refinitiv and its affiliated companies. NOVEMBER 24, 2020 / 1:30PM, ANF.N - Q3 2020 Abercrombie & Fitch Co Earnings Call


Jay Daniel Sole - UBS Investment Bank, Research Division - Executive Director and Equity Research Analyst of Softlines & Luxury Great. Fran, you talked about customers responding favorably to new product and messaging. Specifically on the new product, can you tell us about what you're seeing in denim? Obviously such a key category. Have you seen the trends that you were talking about last quarter continuing to improve in terms of new silhouettes and maybe some new trends happening there, which could be important for that business? And then, Scott, can you just talk about the markdowns as a piece of the 390 basis points of improvement in gross profit? How much did lower markdowns improve? And where do you sort of see markdowns right now in terms of like percentage of total versus where you want to be when you get to, say, next year or the year after? Scott D. Lipesky - Abercrombie & Fitch Co. - Senior VP & CFO Sure. Let me pick up the second one first, and I'll kick it over with Fran. On markdowns, we break apart that 390 basis points. We had 100 basis points of shrink and 90 basis points of foreign currency. So let's kind of kick that aside. The remaining 200 basis points in the quarter was really due to lower markdowns versus last year. And a lot of this goes back to Day 1, whenever COVID hits and the great work that our planning, merchandising and sourcing teams have done to get our inventory in the right place. We feel great with where our inventory is. We've taken our receipts down to a comfortable level, a nice conservative level here for the fall season. And what we talked about last quarter has played through. We saw demand outstrip our supply a bit, and that puts us in a nice position to raise AUR and take out markdowns. Fran? Fran Horowitz - Abercrombie & Fitch Co. - CEO & Director Sure. So very excited, Jay. That was the response we're seeing from our consumer regarding our product. A really nice third quarter across all 4 of our brands. You asked specifically about denim, we've seen tremendous response to our denim -- our Abercrombie women's specifically. We just came off of one of our biggest events that we've ever run digitally for Abercrombie women's denim. The customer is responding to all sorts of newness in denim. Just like you mentioned in the last call that we talked about, the key fashion fits, straight leg is coming on strong, mom and skinny continue to remain as part of our key silhouettes. But overall, a nice start as well to this quarter, encouraged by what we're seeing, the response to our marketing and our product. Going back again to the third quarter a little bit. Our Hollister back-to-school campaign with Charli and Dixie was one of the best that we've seen, over 5 billion views on our campaign and the #1 TikTok campaign on brand lift so far year-to-date. So a lot of exciting things for the third quarter and more to come for the fourth quarter. Operator And up next, we will hear from Carla Casella with JPMorgan. Carla Casella - JPMorgan Chase & Co, Research Division - MD & Senior Analyst My question -- I have one question on working capital. It was an unusual source for the third quarter. And I'm wondering if you expect it to reverse in fourth quarter? And what the key drivers would be in terms of timing of payments on accruals or payables, et cetera? 9 REFINITIV STREETEVENTS | www.refinitiv.com | Contact Us ©2020 Refinitiv. All rights reserved. Republication or redistribution of Refinitiv content, including by framing or similar means, is prohibited without the prior written consent of Refinitiv. 'Refinitiv' and the Refinitiv logo are registered trademarks of Refinitiv and its affiliated companies. NOVEMBER 24, 2020 / 1:30PM, ANF.N - Q3 2020 Abercrombie & Fitch Co Earnings Call


Scott D. Lipesky - Abercrombie & Fitch Co. - Senior VP & CFO Yes. Carla, it's Scott. I'll grab this one. So yes, we've been very pleased with our working capital performance this year, and a huge thanks to our vendor partners, both merchandise and nonmerchandise. They've been great getting us extended terms. Our goal is to get these terms in a more permanent nature. So there could be some reversal here in the future, but our goal is to make these pick ups stick. Also on working capital, inventory is something that we've been focused on since day one and remaining lean on inventory, our receipts are down year-over-year. So as we see a little bit of benefit there on inventory, it's less of a drag than we've seen in the past. So themes that we want to take into 2021 and beyond, for sure. Carla Casella - JPMorgan Chase & Co, Research Division - MD & Senior Analyst Okay. And can you just update us with how many of your stores today are off mall? Scott D. Lipesky - Abercrombie & Fitch Co. - Senior VP & CFO A very small percentage of our stores are off mall. We're primarily in mall, outside of our flagship stores. And we have a handful of street stores around the world, primarily in Europe. Operator Up next, we will hear from Dana Telsey with Telsey Advisory Group. Dana Lauren Telsey - Telsey Advisory Group LLC - CEO & Chief Research Officer Nice to see the progress. As you think about flagships, how do you think about the remaining flagships that you have? Do they stay part of the store network? Do you renegotiate those leases? And then on supply chain and delivery costs. Thoughts on that? Any expanded thoughts on that for this season given the increased emphasis on digital and how planning for next year? Fran Horowitz - Abercrombie & Fitch Co. - CEO & Director Dana, it's Fran. So large expensive flagships are really not part of our go-forward strategy, and we have been working really diligently with our landlords over the past few years, and it was so exciting for the company to make that announcement this morning. Our real goal is to deliver intimate' omnichannel brand experiences that we really know closely align with our customers' needs and how they shop today. So we will continue those negotiations with the balance that remain over the next couple of years. But ultimately, it is not part of our go-forward strategy. Scott D. Lipesky - Abercrombie & Fitch Co. - Senior VP & CFO I'll pick up the supply chain. So yes, it's going to be an interesting quarter when it comes to delivery to the customer, number one, and then the costs that come along with that. Shipping and handling expense will be more of an outsized impact this quarter than we have seen in the past couple of quarters even with that strong growth. A couple of differences here in Q4, just the sheer volume of the digital business spiking up in Q4 just on a dollar basis. We're going to see these carrier rate increases across our key carriers and then some of the costs of the efforts that we put into place, We've mentioned a pop-up DC with 10 REFINITIV STREETEVENTS | www.refinitiv.com | Contact Us ©2020 Refinitiv. All rights reserved. Republication or redistribution of Refinitiv content, including by framing or similar means, is prohibited without the prior written consent of Refinitiv. 'Refinitiv' and the Refinitiv logo are registered trademarks of Refinitiv and its affiliated companies. NOVEMBER 24, 2020 / 1:30PM, ANF.N - Q3 2020 Abercrombie & Fitch Co Earnings Call


regional carriers. These are bits and pieces of costs that we're going to add up here in Q4. I'd say, looking forward to 2021 and beyond, your guess is probably as good as ours at this point and how that's going to play out in some of these surcharges into Q1. So we're focused on holiday right now and getting through this peak and delivering to our customers as quickly as we can, and then we'll address that once we get through the peak season. Operator And next, we will hear from Kate Fitzsimons with RBC Capital Markets. Kate Bridget Fitzsimons - RBC Capital Markets, Research Division - Assistant VP And I'll add my congrats as well. So I guess quickly on Europe, I believe in prior quarters, you said productivity was at 50%. In your commentary, I believe you said it's now 75%. Obviously understanding a lot of volatility in that market with restrictions. But I am curious on that sequential improvement in Europe. And just as we look out the holiday, how you're feeling about your ability to meet digital demand in that market and the pivot at that channel? And then, I guess next, Fran, just at a higher level. You guys exited last year with digital at roughly a 30 -- 1/3 of your business. Digital running year-to-date, call it, 50% of the business. You're exiting more flagships. You're speaking to 50% of the stores up for renewal. Curious, if any of the learnings in the last year are making you think about how much can you push this business to be online even compared to 12 months ago? And certainly with the strong profitability you're seeing on the gross margin front, at least in that channel, curious as you think about the mix shifts associated with digital, can rebase here at a higher level with merch margins in that channel and maybe absorb some of the incremental delivery costs when we look beyond, I guess, one of the other charges. Scott D. Lipesky - Abercrombie & Fitch Co. - Senior VP & CFO All right. Perfect. Let me pick up Europe first, and I'll let Fran take the digital business. So Europe, nice to see sequential improvement in the European store business. Things were starting to settle in a little bit in Europe as we went through Q3, good to see that. More recently, we mentioned seeing some of the closures in some of our key countries like England and France. So at this point, we're reading and reacting every day. Hopefully, there'll be some positive news here coming out soon, but we're not certain on when these stores might reopen. The nice thing is, in these countries where we've seen closures, we've seen a spike in the digital business, as you could imagine. We feel good sitting here today about fulfilling that demand. Our supply chain teams have been planning for this. We have been planning for this as an organization really since March and April, planning for this next wave of COVID. So hopefully, all of the things that we put in place will help bear fruit here in the quarter. I think that's it already. Fran Horowitz - Abercrombie & Fitch Co. - CEO & Director Sure. So regarding our digital business. We are incredibly excited about what we're seeing. I think the expression goes that crisis accelerates change, and that's certainly what we've seen throughout the year. We've really been able to lean into our omni capabilities and build on the strength of our digital business, as you mentioned, Kate, over $1 billion in 2019, a growth of 47% just in the third quarter. So the answer is that we have to continue to watch what's happening. We don't really know where the stores are going to end up. We've got a lot of leases due at the end of the year. So ultimately, our goal is to be a global omnichannel retailer, balancing both digital as well as stores. The stores do matter because you need both in order to be effective in omni. So we're going to continue to lean in, certainly for the fourth quarter and as we head into the first half of next year. 11 REFINITIV STREETEVENTS | www.refinitiv.com | Contact Us ©2020 Refinitiv. All rights reserved. Republication or redistribution of Refinitiv content, including by framing or similar means, is prohibited without the prior written consent of Refinitiv. 'Refinitiv' and the Refinitiv logo are registered trademarks of Refinitiv and its affiliated companies. NOVEMBER 24, 2020 / 1:30PM, ANF.N - Q3 2020 Abercrombie & Fitch Co Earnings Call


Operator (Operator Instructions) Next, we'll hear from Janet Kloppenburg with JJK Research. Janet Joseph Kloppenburg - JJK Research Associates, Inc. - President Congrats on a nice quarter. Fran, I'm wondering how you're thinking about the growth opportunities for Gilly. Will they continue to have a strong digital arm there and carve-outs in the existing stores? Or will you start to think about stand-alone stores as well? Maybe if you could just talk a little bit about how that model looks for you. And Scott, I was wondering on the gross margin, flat to up guidance. I think the AUC opportunity might be pretty significant, not sure, less -- some FX, some shrink opportunity. Does that weigh against an outlook for increased competitor promotions in the fourth quarter and also the liquidation of the flagship closings? Maybe you could just help me understand why it couldn't be better than flat to up? Fran Horowitz - Abercrombie & Fitch Co. - CEO & Director You want to answer? Scott D. Lipesky - Abercrombie & Fitch Co. - Senior VP & CFO Yes. I'll kick it off on the last part of the question, the gross margin guide. So yes, flat to up slightly. I mean this is historically the most promotional quarter of the year. It will be, I think, an interesting quarter. Sales are going to be on a different pattern than they probably ever have with the peaks and then what's going to happen in December in stores. So a lot of uncertainty out there. And that's really how we're thinking about the quarter. With where our inventory is, we're hopeful that, that demand is going to outstrip our supply. We feel good with how we planned into the fall season here. And then the points you brought up about store closures, there will be some liquidation there. And that will be a little bit of a hurt potentially to that ability to raise AUR. But we're excited about the assortment. We're excited about our inventory positioning, but it's going to be a very interesting quarter on how it plays out around the world. Janet Joseph Kloppenburg - JJK Research Associates, Inc. - President Have you said the (inaudible) -- cost increased promotions? Sorry. Scott D. Lipesky - Abercrombie & Fitch Co. - Senior VP & CFO Yes. I would say -- you've seen, just like we have, people have pulled forward promotions a little bit to try to spread demand. We've done a little bit of that. We've been comfortable with the promotions that we've pulled forward to do some of that demand spread. The biggest constraint here is digital shipping, so spreading out the promotions is a good thing to do for the industry. Fran Horowitz - Abercrombie & Fitch Co. - CEO & Director And regarding Gilly, Janet -- regarding Gilly. So we are excited about what we're seeing in Gilly. As I mentioned, 100% growth in digital is really helping us lean into our omni capabilities. Regarding the carve-out and the standalones, at this point, we have obviously taken a pause for the 12 REFINITIV STREETEVENTS | www.refinitiv.com | Contact Us ©2020 Refinitiv. All rights reserved. Republication or redistribution of Refinitiv content, including by framing or similar means, is prohibited without the prior written consent of Refinitiv. 'Refinitiv' and the Refinitiv logo are registered trademarks of Refinitiv and its affiliated companies. NOVEMBER 24, 2020 / 1:30PM, ANF.N - Q3 2020 Abercrombie & Fitch Co Earnings Call


moment on where we are with our store base because of the uncertainty out there. But we will continue, once that gets to some normalized pace, that we will continue certainly with the carve-outs with the in-store shop-in-shops. And at some point, we will have stand-alones. Operator And up next, we'll take a question from Mark Altschwager with Baird. Sarah Goldberg - Robert W. Baird & Co. Incorporated, Research Division - Research Analyst This is Sarah Goldberg on for Mark. As you build confidence in the reception to the product, how are you thinking about marketing spend for the holiday? Scott D. Lipesky - Abercrombie & Fitch Co. - Senior VP & CFO Yes. For holiday, we are -- our goal is to protect digital media, number one. And what we've done this year is we've taken out some costs on the back end. We mentioned that about Q3 in the prepared remarks where we -- some of that back office-type cost on marketing, we've been able to reduce. So the goal is to protect that digital customer-facing media. Fran mentioned the great program with Charli and Dixie in Q3, that will continue into Q4 here. And then the great work that we've done on the Abercrombie brand with influencers. So really excited about the marketing we've seen, and that is absolutely an expense that we want to protect here in holiday. Operator Up next, we'll hear from David Buckley with Bank of America. David Loughran Buckley - BofA Merrill Lynch, Research Division - Analyst Back to the e-com channel, can you talk about how much improved profitability in the channel contributed to third quarter operating margin expansion? And then with use in multiple vaccines, how are you putting the business for the first half of next year? Scott D. Lipesky - Abercrombie & Fitch Co. - Senior VP & CFO Yes. David, I'll grab this one. So the improved profitability, yes, it came primarily from the e-com channel with the great growth that we saw in the quarter. I talked a lot about leveraging those assets. So we were able to leverage those fixed assets even further with a big spike, the 43% digital growth that we saw. We also saw benefits in the quarter obviously on the store side. We mentioned store occupancy and store payroll as savings. So that helped soften the blow on some of those productivity numbers that we talk about from the store side. And thinking about the vaccine is, yes, this is great news for us. It's great news for the industry, many industries. But the timing at which this will hit, we really don't know. So at this point, we are planning the business in 2021, just like we planned throughout '20. We're going to be conservative. Inventory is our number one investment in this company. So we're going to plan it conservatively, and we're going to stay in chase mode for as long as possible. We've seen the benefits from being in chase mode as we've gone through 2020 here with the ability to take up the AUR, and see some gross margin growth fall to the bottom line. So that's going to be our plan as we go into 2021. 13 REFINITIV STREETEVENTS | www.refinitiv.com | Contact Us ©2020 Refinitiv. All rights reserved. Republication or redistribution of Refinitiv content, including by framing or similar means, is prohibited without the prior written consent of Refinitiv. 'Refinitiv' and the Refinitiv logo are registered trademarks of Refinitiv and its affiliated companies. NOVEMBER 24, 2020 / 1:30PM, ANF.N - Q3 2020 Abercrombie & Fitch Co Earnings Call


Operator Next, we'll take a question from Marni Shapiro with Retail Tracker. Marni Shapiro - The Retail Tracker - Co-Founder Congratulations. The stores look really beautiful for the holiday. I have 2 quick Abercrombie questions. As I've walked through the stores, it seems as if the age and really the style of the shopper feels different than it used to a year ago or even 2 years ago. Have you been successful reactivating lapsed shoppers who are now in their late teens or 20s and also in attracting new shoppers? And along those same lines, could you talk a little bit about your loyalty programs because as we come out of the pandemic that could be important heading into 2021 as we have some sort of normal life again, we hope. Fran Horowitz - Abercrombie & Fitch Co. - CEO & Director So Marni, thank you for the compliment on the store. We're incredibly proud of the teams and what they've been able to accomplish with all the complexities added to our business this year. Yes, the Abercrombie brand is really focused on that young millennial. We are getting a very strong reaction from the consumer, both in product as well as marketing. We have -- actually, reactivated some of our shoppers. We're seeing nice new, new-to-file growth as well. And our loyalty programs continue to grow. So those will be, to your point, important as we head into '21, but exciting what we're seeing in the brand. Operator That concludes our question-and-answer session. I will turn the call back to Fran Horowitz for any additional or closing remarks. Fran Horowitz - Abercrombie & Fitch Co. - CEO & Director Thank you all for participating in our call today. I hope you all have a safe and happy and healthy holiday season, and I look forward to talking to all of you in the new year. Operator And that concludes today's call. We thank you for your participation. You may now disconnect. D I S C L A I M E R Refinitiv reserves the right to make changes to documents, content, or other information on this web site without obligation to notify any person of such changes. In the conference calls upon which Event Transcripts are based, companies may make projections or other forward-looking statements regarding a variety of items. Such forward-looking statements are based upon current expectations and involve risks and uncertainties. Actual results may differ materially from those stated in any forward-looking statement based on a number of important factors and risks, which are more specifically identified in the companies' most recent SEC filings. Although the companies may indicate and believe that the assumptions underlying the forward-looking statements are reasonable, any of the assumptions could prove inaccurate or incorrect and, therefore, there can be no assurance that the results contemplated in the forward-looking statements will be realized. THE INFORMATION CONTAINED IN EVENT TRANSCRIPTS IS A TEXTUAL REPRESENTATION OF THE APPLICABLE COMPANY'S CONFERENCE CALL AND WHILE EFFORTS ARE MADE TO PROVIDE AN ACCURATE TRANSCRIPTION, THERE MAY BE MATERIAL ERRORS, OMISSIONS, OR INACCURACIES IN THE REPORTING OF THE SUBSTANCE OF THE CONFERENCE CALLS. IN NO WAY DOES REFINITIV OR THE APPLICABLE COMPANY ASSUME ANY RESPONSIBILITY FOR ANY INVESTMENT OR OTHER DECISIONS MADE BASED UPON THE INFORMATION PROVIDED ON THIS WEB SITE OR IN ANY EVENT TRANSCRIPT. USERS ARE ADVISED TO REVIEW THE APPLICABLE COMPANY'S CONFERENCE CALL ITSELF AND THE APPLICABLE COMPANY'S SEC FILINGS BEFORE MAKING ANY INVESTMENT OR OTHER DECISIONS. ©2020, Refinitiv. All Rights Reserved. 13469263-2020-11-25T00:21:36.753 14 REFINITIV STREETEVENTS | www.refinitiv.com | Contact Us ©2020 Refinitiv. All rights reserved. Republication or redistribution of Refinitiv content, including by framing or similar means, is prohibited without the prior written consent of Refinitiv. 'Refinitiv' and the Refinitiv logo are registered trademarks of Refinitiv and its affiliated companies. NOVEMBER 24, 2020 / 1:30PM, ANF.N - Q3 2020 Abercrombie & Fitch Co Earnings Call