UNITED STATES
SECURITIES AND EXCHANGE COMMISSION
Washington, D.C. 20549
_________________________________
FORM 10-K
_________________________________
(MARK ONE)
For the fiscal year ended June 30 , 2026
OR
FOR THE TRANSITION PERIOD FROM TO
Commission file number 001-34717
__________________________
(Exact name of Registrant as Specified in its Charter)

| (State or Other Jurisdiction of Incorporation or Organization) | (I.R.S. Employer Identification Number) | ||||
(Address of Principal Registered
Offices including Zip Code)
(408 ) 830-9742
(Registrant's Telephone Number, Including Area Code)
__________________________________________
Securities registered pursuant to Section 12(b) of the Act:
| Title of each class | Trading Symbol(s) | Name of each exchange on which registered | ||||||
Securities registered pursuant to Section 12(g) of the Act:
None
Indicate by check mark if the registrant is a well-known seasoned issuer, as defined in Rule 405 of the Securities Act. Yes ☐ No ☒
Indicate by check mark if the registrant is not required to file reports pursuant to Section 13 or Section 15(d) of the Act. Yes ☐ No ☒
Indicate by check mark whether the registrant (1) has filed all reports required to be filed by Section 13 or 15(d) of the Securities Exchange Act of 1934 during the preceding 12 months, (or for such shorter period that the registrant was required to file such reports), and (2) has been subject to such filing requirements for the past 90 days. Yes ☒ No ☐
Indicate by check mark whether the registrant has submitted electronically, every Interactive Data File required to be submitted and posted pursuant to Rule 405 of Regulation S-T (§ 232.405 of this chapter) during the preceding 12 months (or for such shorter period that the registrant was required to submit such files). Yes ☒ No ☐
Indicate by check mark whether the registrant is a large accelerated filer, an accelerated filer, a non-accelerated filer, a smaller reporting company or an emerging growth company. See definitions of “large accelerated filer,” “accelerated filer”, “smaller reporting company” and "emerging growth company" in Rule 12b-2 of the Exchange Act. (Check one):
| Large accelerated filer | ☐ | ☒ | Non-accelerated filer | ☐ | |||||||||||||
| (Do not check if a smaller reporting company) | |||||||||||||||||
| Smaller reporting company | Emerging growth company | ||||||||||||||||
If an emerging growth company, indicate by check mark if the registrant has elected not to use the extended transition period for complying with any new or revised financial accounting standards provided pursuant to Section 13(a) of the Exchange Act. ☐
Indicate by check mark whether the registrant has filed a report on and attestation to its management’s assessment of the effectiveness of its internal control over financial reporting under Section 404(b) of the Sarbanes-Oxley Act (15 U.S.C. 7262(b)) by the registered public accounting firm that prepared or issued its audit report. ☒
If securities are registered pursuant to Section 12(b) of the Act, indicate by check mark whether the financial statements of the registrant included in the filing reflect the correction of an error to previously issued financial statements. ☐
Indicate by check mark whether any of those error corrections are restatements that required a recovery analysis of incentive-based compensation received by any of the registrant’s executive officers during the relevant recovery period pursuant to §240.10D-1(b). ☐
Indicate by check mark whether the registrant is a shell company (as defined in Rule 12b-2 of the Exchange Act). Yes ☐ No ☒
The aggregate market value of the voting shares held by non-affiliates of the registrant as of December 31, 2025 was approximately $487 million based on the closing price of the registrant's common share as reported on the NASDAQ Global Select Market on December 31, 2025 (the last business day of the registrant's most recently completed second fiscal quarter). The common shares of the registrant held by each executive officer and director and certain affiliated shareholders who beneficially owned 10% or more of the outstanding common shares of the registrant have been excluded in such calculation as such persons and entities may be deemed to be affiliates of the registrant. This determination of affiliate status is not necessarily a conclusive determination for other purposes.
There were 30,259,255 shares of the registrant's common shares outstanding as of July 31, 2026.
DOCUMENTS INCORPORATED BY REFERENCE
Portions of the registrant's Proxy Statement for the registrant's 2026 Annual General Meeting of Shareholders are incorporated by reference into Part III of this Form 10-K to the extent stated herein. The Definitive Proxy Statement is expected to be filed within 120 days of the registrant's fiscal year ended June 30, 2026.
Alpha and Omega Semiconductor Limited
Form 10-K
For the Year Ended June 30, 2026
TABLE OF CONTENTS
| Page | ||||||||
| Part I. | ||||||||
| Item 1. | ||||||||
| Item 1A. | ||||||||
| Item 1B. | ||||||||
Item 1C. | ||||||||
| Item 2. | ||||||||
| Item 3. | ||||||||
| Item 4. | ||||||||
| Part II. | ||||||||
| Item 5. | ||||||||
| Item 6. | ||||||||
| Item 7. | ||||||||
| Item 7A. | ||||||||
| Item 8. | ||||||||
| Item 9. | ||||||||
| Item 9A. | ||||||||
| Item 9B. | ||||||||
| Item 9C. | ||||||||
| Part III. | ||||||||
| Item 10. | ||||||||
| Item 11. | ||||||||
| Item 12. | ||||||||
| Item 13. | ||||||||
| Item 14. | ||||||||
| Part IV. | ||||||||
| Item 15. | ||||||||
(This page intentionally left blank.)
PART I
Item 1.Business
Forward Looking Statements
This Annual Report on Form 10-K and the documents incorporated herein by reference contain forward-looking statements within the meaning of Section 27A of the Securities Act of 1933, as amended, and Section 21E of the Securities Exchange Act of 1934, as amended, which are subject to the “safe harbor” created by those sections. Forward-looking statements are based on our management's beliefs and assumptions and on information currently available to our management. In some cases, you can identify forward-looking statements by terms such as “may,” “will,” “should,” “could,” “intend,” “would,” “expect,” “plan,” “anticipate,” “believe,” “estimate,” “project,” “predict,” “potential” and similar expressions intended to identify forward-looking statements. These statements involve known and unknown risks, uncertainties and other factors, which may cause our actual results, performance, time frames or achievements to be materially different from any future results, performance, time frames or achievements expressed or implied by the forward-looking statements. We discuss many of these risks, uncertainties and other factors in this Annual Report on Form 10-K in greater detail in Item 1A.“Risk Factors.” Given these risks, uncertainties and other factors, you should not place undue reliance on these forward-looking statements. Also, these forward-looking statements represent our estimates and assumptions only as of the date of this filing. You should read this Annual Report on Form 10-K in its entirety and with the understanding that our actual future results may be materially different from what we expect. We hereby qualify our forward-looking statements by these cautionary statements. Except as required by law, we assume no obligation to update these forward-looking statements publicly, or to update the reasons actual results could differ materially from those anticipated in these forward-looking statements, even if new information becomes available in the future.
Overview
We are a designer, developer and global supplier of a broad portfolio of power semiconductors. Our portfolio of power semiconductors includes approximately 2,900 products, and has grown with the introduction of over 70 new products in the fiscal year ended June 30, 2026, and over 100 new products in each of the fiscal years ended June 30, 2025 and 2024, respectively. Our teams of scientists and engineers have developed extensive intellectual properties and technical knowledge that encompass major aspects of power semiconductors, which we believe enables us to introduce and develop innovative products to address the increasingly complex power requirements of advanced electronics. We have an extensive patent portfolio that consists of 961 issued patents and 78 pending patents in the United States as of June 30, 2026. We also have a total of 991 foreign patents, which were based primarily on our research and development efforts through June 30, 2026. We differentiate ourselves by integrating our expertise in technology, design and advanced manufacturing and packaging to optimize product performance and cost. Our portfolio of products targets high-volume applications, including personal computers, graphic cards, game consoles, home appliances, power tools, smart phones, battery packs, consumer and industrial motor controls and power supplies for computers, servers and telecommunications equipment.
During the fiscal year ended June 30, 2026, we continued our diversification strategy by developing new silicon and packaging platforms to expand our serviceable available market, or SAM, and offer higher performance products. Our metal-oxide-semiconductor field-effect transistors, or MOSFET, portfolio expanded significantly across a full range of voltage applications. We also developed new technologies and products designed to penetrate into markets beyond our MOSFET computing base, including the consumer, communications and industrial markets, Insulated Gate Bipolar Transistors, or IGBTs and integrated power modules for the home appliance market, as well as power integrated circuits (“ICs”) for personal computing (“PC”), advanced computing and gaming applications.
Our business model leverages global resources, including research and development and manufacturing in the United States and Asia. Our sales and technical support teams are localized in several growing markets. We operate an 8-inch wafer fabrication facility located in Hillsboro, Oregon, or the Oregon Fab, which is critical for us to accelerate proprietary technology development, new product introduction and improve our financial performance. To meet the market demand for the more mature high volume products, we also utilize the wafer manufacturing capacity of selected third party foundries. For assembly and test, we primarily rely upon our in-house facilities in China. In addition, we utilize subcontracting partners for industry standard packages. We believe our in-house packaging and testing capability provide us with a competitive advantage in proprietary packaging technology, product quality, cost and sales cycle time.
We hold a minority equity interest in a power semiconductor packaging, testing and 12-inch wafer fabrication facility (the “JV Company”) in the LiangJiang New Area of Chongqing, China, which provides us with significant level of foundry and packaging capacity to enable us to develop and manufacture our products. Pursuant to an agreement with the JV Company and other shareholders of the JV Company, the JV Company is committed to providing us with a specified level of monthly wafer production capacity. On July 14, 2025, we entered into an equity transfer agreement with a strategic investor to sell
1
approximately 20.3% of outstanding equity interest in the JV Company held by us for an aggregate cash consideration of $150 million paid in four installments, subject to satisfaction of certain conditions. On August 29, 2025, the amended Shareholders’ agreement for the JV Company was signed, which reduced our equity interest in the JV Company by 20.3% to an ownership percentage of 18.9%. During fiscal year 2026, all of the conditions for installments were satisfied, and we received all installment payments. We believe this sale provides additional and significant capital for us to continue investment in technology, new product development and acquisition of assets complementary to our business operations, which will facilitate and accelerate our efforts to develop and distribute innovative and diverse power semiconductor products to customers worldwide. As of June 30, 2026, the percentage of outstanding JV equity interest beneficially owned by us was 18.9%.
Our industry
Semiconductors are electronic devices that perform a variety of functions, such as converting or controlling signals, processing data and delivering or managing power. The functionality and performance of semiconductors have generally increased over time. These advances have led to a proliferation of more complex semiconductors being used in a wide variety of consumer, computing, communications and industrial markets and have contributed to the growth of the semiconductor industry. Regulations governing energy efficiency have accelerated this process in many applications.
Analog semiconductors
The semiconductor industry is segmented into analog and digital. Analog semiconductors process light, sound, motion, radio waves and electrical currents and voltages. In contrast, digital semiconductors process binary signals represented by a sequence of ones and zeros.
As a result of these fundamental differences, the analog semiconductor industry is distinct from the digital semiconductor industry in terms of the complexity of design and the length of product cycle. Improper interactions between analog circuit elements can potentially render an electronic system inoperable. Experienced engineers engaged in the design process are necessary because computer-aided design cannot fully model the behavior of analog circuitry. Therefore, experienced analog engineers with requisite knowledge are in great demand but short supply worldwide. In addition, analog semiconductors tend to have a longer product life cycle because original design manufacturers, or ODMs, and original equipment manufacturers, or OEMs typically design the analog portions of a system to span multiple generations of products. Once designed into an application, the analog portion is rarely modified because even small changes to the analog portion can trigger unanticipated consequences in other components, resulting in system instability.
Power semiconductors
Power semiconductors are a subset of the analog semiconductor sector with their own set of characteristics unique to system power architecture and function. Power semiconductors transfer, manage and switch electricity to deliver the appropriate amount of voltage or current to a broad range of electronic systems and also protect electronic systems from damage resulting from excessive or inadvertent electrical charges.
Power semiconductors can be either discrete devices, which typically comprise only a few transistors or diodes, or ICs, which incorporate a greater number of transistors. The function of power discrete devices is power delivery by switching, transferring or converting electricity. Power transistors comprise the largest portion of the power discrete device market. Power ICs, sometimes referred to as power management ICs, perform power delivery and power management functions, such as controlling and regulating voltage and current and controlling power discrete devices.
The power semiconductor market has been driven by several key factors in recent years. The proliferation of computer and consumer electronics, such as notebooks, tablets, smart phones, and portable media players created the need for sophisticated power management that increases power efficiency and extends battery life. The evolution of these products is characterized by increased functionality, thinner and smaller form factors and decreasing prices. Our Power IC and low voltage (5V-40V) MOSFET products address these markets. In the area of AC-DC power supplies for electronic equipment, data centers and servers, the market is characterized by a continuous demand for energy conservation through higher efficiency, which drives the market for our medium voltage (40V-400V) and high voltage (500V-1000V) MOSFET products. The increased application of power semiconductors to control motors in white goods and industrial applications is driving demand for IGBTs. IGBTs are also being used in renewable energy and automotive applications.
The evolution toward smaller form factors and complex power requirements in the low voltage areas has driven further integration in power semiconductors, resulting in power ICs that incorporate the functionalities of both power management and power delivery in a single device. Power ICs can be implemented by incorporating all necessary power functions either on one piece of silicon or multiple silicon chips encapsulated into a single device. Additionally, advancements in semiconductor packaging technology enable increased power density and shrinking form factors.
2
Our business and operational model is based on achieving a balance between technological advancement and cost effectiveness by using a dedicated in-house technology research and development team to drive rapid new product developments, while utilizing both in-house and third-party foundry capacity for our products. This is particularly important in the development of power semiconductor products due to the unique nature of their technology.
Our strategies
We seek to advance our position as a designer, developer and global supplier of a broad portfolio of power semiconductors. We have adopted strategies that allow us to balance the development of proprietary technology at in-house fabrication and packaging facilities and also utilize the capacity and manufacturing capability of third-party foundries and subcontractors. This enables us to bring new products to market faster, and improve our financial performance in the long run. This model also allows us to respond more quickly to our customer demands, enhances relationships with strategic customers, provides flexibility in capacity management, and enables geographic diversification of our supply chain. Our in-house manufacturing capability allows us to retain a higher level of control over the development and application of our proprietary process technology, thereby reducing certain supply chain and operational risks. In addition, we enhanced the manufacturing capability and capacity of our Oregon Fab by investing in new equipment and expanding factory facilities, which we expect will have a positive impact on our future new product development and revenue. We intend to continue exploring opportunities to expand our manufacturing capabilities, including acquisition of existing facilities, formation of joint ventures or partnerships with third parties or applying for government funding or grants in the semiconductor industry.
Although our largest end-market is the Computing market, we have successfully diversified our business by expanding into other markets, including consumer, communications, and power supply and industrial markets. While we have made progress in our diversification and expansion into additional applications, we continue to support and grow our computing business by expanding bill-of-material content, gaining market share, acquiring new customers, and expanding into new application areas such as AI.
We plan to further expand the breadth of our product portfolio to increase our total bill-of-materials within an electronic system and to address the power requirements of additional electronic systems. Our product portfolio currently consists of approximately 2,900 products and we have introduced over 70 new products in this past fiscal year. We will continue to leverage our expertise to further increase our product lines, including higher performance power ICs, IGBTs and high, medium and low voltage MOSFETs, in order to broaden our addressable market and improve our margin profile. This includes expanding our power IC portfolio with multiphase controllers and smart power stages to address advanced System on Chip (SoC) products used in personal computing, AI, graphics cards, and gaming.
Leverage our power semiconductor expertise to drive new technology platforms
We believe that the ever-increasing demand for power efficiency in power semiconductors requires expertise in and a deep understanding of the interrelationship among device physics, process technologies, design and packaging. We also believe that engineers with experience and understanding of these multiple disciplines are in great demand but short supply. Within this context, we believe that we are well positioned to be a leader in providing total power management solutions because of our extensive pool of experienced scientists and engineers and our strong IP portfolio. Accordingly, we intend to leverage our expertise to increase the number of power discrete technology platforms and power IC designs, including multiphase controller products to expand our product offerings and deliver complete power solutions for our targeted applications. In addition, our ability to develop new technology is enhanced by the operation of our own manufacturing facilities in Oregon and our close partnership with the JV Company.
Increase direct relationships and product penetration with OEM and ODM customers
We have developed direct relationships with key OEMs that are responsible for branding, designing and marketing a broad array of electronic products, as well as ODMs that have traditionally been responsible for manufacturing these products. We are also focusing on developing and solidifying relationships with certain Tier 1 customers, whose reputation, resources and market share may enable us to generate more significant sales and design wins, and we believe long-term relationships with Tier 1 customers will be a critical factor in our strategy to grow and expand our business operations. While OEMs typically focus design efforts on flagship products, ODMs are increasingly responsible for designing portions, or entire systems, of the products they manufacture for OEMs. In addition, several ODMs are beginning to design, manufacture and brand their own proprietary products which are sold directly to consumers. We intend to strengthen our existing relationships and form new ones with both OEMs and ODMs by aligning our product development efforts with their product requirements, thereby increasing the number of our products used within their systems, and leveraging relationships to penetrate other product applications. In addition, we are focusing our research and development efforts to respond more directly to market demand by designing and developing new products based on feedback from our customers, which also allows us to reduce time-to-market and sales cycles.
Leverage global business model for cost-effective growth
3
We intend to continue to leverage our global resources and regional strengths. We will continue to deploy marketing, sales and technical support teams in close proximity to our end customers. We will further expand and align our technical marketing and application support teams along with our sales team to better understand and address the needs of end customers and end-market applications, in particular for those with the new technology platforms developed in this past year and in the future. This will assist us in identifying and defining new technology trends and products and to help us gain additional design wins. While we no longer retain a controlling interest in the JV Company, we continue our strong relationship with the JV Company to support our manufacturing capacity. Also, we entered into an agreement with the JV Company, pursuant to which the JV Company agrees to provide us with a monthly wafer production capacity guarantee, subject to future increase when the JV Company’s production capacity reaches certain specified levels. In addition, we continue to seek potential partners and collaborators to develop new technologies and products, as well as to explore other strategic transactions that will enable us to expand our manufacturing capacity and establish a global footprint.
Our products
We have created a broad product portfolio consisting of two major categories: power discretes and power ICs that serve the large and diverse analog market for power semiconductors.
Our power discrete products consist of low, medium and high voltage power MOSFETs. Our low voltage MOSFET series is based on our proprietary silicon and package technologies, with deep application know-how in various markets. We have precisely defined technology platforms to address different requirements from various applications. Our medium voltage MOSFETs provide optimized performance with high efficiency, high robustness and high reliability, and are widely used in applications such as TV backlighting, telecom power supplies, and industrial applications. We expanded our high voltage 600V and 700V MOSFET portfolio based on our aMOS5 technology platform in order to address demanding consumer and industrial applications. Our high-voltage portfolio includes our proprietary IGBT technology, which provides highly robust and easy-to-use solutions for industrial motor control and white goods applications. We have also deployed our 1200V SiC (Silicon carbide) products based on our AlphaSiC platform, designed to address high efficiency, high density industrial applications such as solar inverters, UPS, and battery management systems.
Our power ICs deliver power as well as control and regulate the power management variables, such as the flow of current and level of voltage. Our DrMOS and smart power stage (SPS) family of products continue to grow as we pair our latest high performance MOSFET silicon with our latest Driver IC and smart driver technologies. We continue to expand our EZBuck power IC family with products that feature lower on-resistance, lower power consumption, smaller footprint and thermally enhanced packages as well. Our smart load switch products have expanded beyond basic load switches to include specialized applications like Type C and eFuse. Success has been driven by increased power density and protection for discrete solutions. Sales of power ICs continue to gain traction in recent years especially with the expansion of our driver and multiphase controller product lines. We introduced higher voltage drivers to expand success beyond PCs to motor drive applications such as power tools and garden equipment. We have also made a major investment in R&D to enter the multiphase controller market in 2020 with the introduction of the Intel IMVP 9.1 controller for notebooks. Since then, we have released or are designing in several multiphase controller families serving Intel, AMD and NVIDIA. Introduction of these multiphase controllers has enabled us to become a complete solution level provider, across multiple compute platforms from PCs, graphics cards to AI and datacenter.
The following table lists our product families and the principal end uses of our products:
4
| Product Family | Description | Product Categories within Product Type | Typical Application | ||||||||
| Power Discretes | Low on-resistance switch used for routing current and switching voltages in power control circuits High power switches used for power circuits | DC-DC for CPU/GPU DC-AC conversion AC-DC conversion Load switching Motor control Battery protection Power factor correction | Smart phones, chargers, notebooks, tablets, desktops, battery packs, servers, AI data centers, base stations, graphics cards, game consoles, TVs, AC adapters, power supplies, motor control, power tools, E-vehicles, and white goods industrial motor drives, and solar power inverters | ||||||||
| Power ICs | Integrated devices used for power management and power delivery | DC-DC Buck conversion DC-DC Boost conversion Smart load switching DrMOS power stage | Notebooks, desktops, graphic cards, servers, AI datacenters, game consoles, flat panel displays, TVs, and networking equipment | ||||||||
| Analog power devices used for circuit protection and signal switching | Transient voltage protection Analog switch Electromagnetic interference filter | Notebooks, desktop PCs, tablets, flat panel displays, TVs, smart phones, and portable electronic devices | |||||||||
Power discrete products
Power discretes are used across a wide voltage and current spectrum, requiring high efficiency and reliability under harsh conditions. Due to the diverse nature of end-market applications, we market both general purpose MOSFETs that are used in multiple applications as well as application specific MOSFETs.
Our current power discrete product line includes industry standard trench MOSFETs, Shielded-Gate low voltage and mid-voltage MOSFETs, SuperJunction high voltage MOSFETs, and trench-stop IGBTs, as well as application specific MOSFETs for smartphone battery management, dual MOSFETs for CPU power conversion, and high-power density MOSFETs for IBC power modules in AI data centers.
Power IC products
In addition to the traditional monolithic or single chip design, we employ a multi-chip approach for the majority of our power ICs. This multi-chip technique leverages our proprietary MOSFET and advanced packaging technologies to offer integrated solutions to our customers. This allows us to update product portfolios by interchanging only the MOSFETs without changing the power management IC, thereby reducing the time required for new product introduction and providing optimal solutions to our customers. We believe that our power IC products improve our competitive position by enabling us to provide higher power density solutions to our end customers than some of our competitors.
The incorporation of both power delivery and power management functions tends to make power ICs more application specific because these two functions have to be properly matched to a particular end product. We have local technical marketing and applications engineers who closely collaborate with our end customers to help ensure that power IC specifications are properly defined at the beginning of the design stage.
New Product Introduction
We introduced several new products based on our proprietary technology platform and continue to expand our product families.
During the fourth quarter of fiscal year of 2026, we unveiled total power solution for next-generation Intel panther lake and wildcat lake platforms. This technology bridges the gap between digital flexibility and analog efficiency, combining variable-frequency hysteretic peak-current mode control with advanced phase-current sensing. We also announced the launch of the SmartClamp™ family of protected DrMOS. Designed specifically for the extreme power demands of AI servers, data centers, and high-end graphics cards, the SmartClamp™ family offers high-accuracy over current protection and negative current protection.
During the third quarter of fiscal year of 2026, we introduced 25V and 80V MOSFETs in state-of-the-art packaging that meets increasing AI server power demands. This double-sided thermal interface is the optimal solution to reduce heat generation and thermal stress compared to sing-sided cooling devices. In addition, we unveiled our powerful αMOS E2™
5
600V super junction MOSFET platform. The design meets the growing demand for high efficiency and high-power density across a wide range of applications, including servers, workstations, telecom rectifiers, solar inverters, motor drives, and industrial power systems.
During the second quarter of fiscal year of 2026, we enabled 48V hot swap in AI servers with new high SOA MOSFET in LFPAK 8x8. This state-of-the-art MOSFET handles higher peak currents delivering a cost-effective, high-performance and enhanced reliability hot swap solution. In addition, we announced support for the power requirements of the innovative 800 VDC power architecture for next-generation AI factories with innovative SiC and GaN, power MOSFET, and power IC solutions. This architecture is set to power the next generation of AI data centers, which will feature megawatt-scale racks to meet the exponential growth of AI workloads.
During the first quarter of fiscal year of 2026, we announced two powerful Type-C sink and source protection switches. We designed these switches to increase the power delivery capability of USB Type-C ports to 240W, paving the way for Type-C extended power range (EPR) implementations. In addition, we announced advanced eFuse that meets high reliability server application requirements. We optimized this new eFuse product series for 12V power rails in servers, data centers, and telecom infrastructure.
Distributors and customers
We have established direct relationships with key OEMs, including Dell Inc., Hewlett-Packard Company, Samsung Group, and Stanley Black & Decker, Inc., most of whom we serve through our distributors and ODMs. In addition, based on our historical design win activities, our power semiconductors are also incorporated into products sold to many other leading OEMs.
Through our distributors, we provide products to ODMs who traditionally are contract manufacturers for OEMs. As the industry has evolved, ODMs are increasingly responsible for designing portions, or entire systems, of the products they manufacture for the OEMs. In addition, several ODMs are beginning to design, manufacture and brand their own proprietary products, which they sell directly to consumers. Our ODM customers include Compal Electronics, Inc., Foxconn, Quanta Computer Incorporated, Wistron Corporation and Delta Electronics.
In order to take advantage of the expertise of end-customer fulfillment logistics and shorter payment cycles, we sell most of our products through distributors. As of June 30, 2026, 2025 and 2024, our two largest distributors were WPG Holdings Limited, or WPG, and Promate Electronic Co. Ltd., or Promate. Sales to WPG and Promate accounted for 53.0% and 19.3% of our revenue, respectively, for the fiscal year ended June 30, 2026, 51.3% and 22.1% of our revenue, respectively, for the fiscal year ended June 30, 2025, and 46.0% and 25.0% of our revenue, respectively, for the fiscal year ended June 30, 2024.
Sales and marketing
Our marketing division is responsible for identifying high growth markets and applications where we believe our technology can be effectively deployed. We believe that the technical background of our marketing team, including application engineers, helps us better define new products and identify potential end customers and geographic and product market opportunities. For example, as part of our market diversification strategy, we have deployed and plan to recruit more, field application engineers, or FAEs, for our new product offerings, providing real-time and local response to our end customers' needs. FAEs work with our end customers to understand their requirements and resolve technical problems. FAEs also strive to anticipate future customer needs and facilitate the design-in of our products into the end products of our customers. We believe this strategy increases our share of revenue opportunities within the applications we currently serve, as well as in new end-market applications.
Our sales team consists of sales personnel, field application engineers, customer service representatives and customer quality engineers who are responsible for key accounts. We strategically position our team near our end customers through our offices in Taipei, Hong Kong, Shenzhen, Shanghai, Beijing, Chengdu, Qingdao, Suzhou, Tokyo, Seoul, Heilbronn, and Sunnyvale, California, complemented by our applications centers in Sunnyvale and Shanghai. In addition, our distributors and sales representatives assist us in our sales and marketing efforts by identifying potential customers, creating additional demand and promoting our products, in which case we may pay a sales commission.
Our sales cycle varies depending on the types of products and can range from six to eighteen months. In general, our power discrete products and Power IC products in Computing and Consumer segments progress more rapidly through the customer's design and marketing processes, and therefore they generally have a shorter sales cycle. In contrast, our IGBT and Module products, used mostly in the power supply, home appliance and industrial applications, require a more extended design and marketing timeline and thus have a longer sales cycle. Typically, our sales cycle for all products comprises the following steps:
6
•identification of a customer design opportunity;
•qualification of the design opportunity by our FAEs through comparison of the power requirements against our product portfolio;
•delivery of a product sample to the end customer to be included in the customer's pre-production model with the goal of being included in the final bill of materials; and
•placement by the customer, or through its distributor, of a full production order as the end customer transitions to full volume production.
Competition
The power semiconductor industry is characterized by fragmentation with many competitors. We compete with different power semiconductor suppliers, depending on the type of product lines and geographical area. Our key competitors in power discretes and power ICs are primarily headquartered in the United States, Japan, Europe, China and Taiwan. Our major competitors in power discretes include Infineon Technologies AG, ON Semiconductor Corp., STMicroelectronics N.V., Toshiba Corporation, Diodes Incorporated and Vishay Intertechnology, Inc. Our major competitors for our power ICs include Monolithic Power Systems, Inc., ON Semiconductor Corp., Richtek Technology Corp., Semtech Corporation, Texas Instruments Inc. and Vishay Intertechnology, Inc.
Our ability to compete depends on a number of factors, including:
•success in expanding and diversifying our serviceable markets, and our ability to develop technologies and product solutions for these markets;
•capability to quickly develop and introduce proprietary technology and best-in-class products;
•performance and cost-effectiveness of our products relative to that of our competitors;
•ability and capacity to manufacture, package and deliver products in large volume on a timely basis at a competitive price;
•success in utilizing new and proprietary technologies to offer products and features previously not available in the marketplace;
•ability to recruit and retain analog semiconductor designers and application engineers; and
•ability to protect our intellectual property.
Some of our competitors have longer operating histories, more brand recognition, and significantly greater financial, technical, research and development, sales and marketing, manufacturing and other resources. However, we believe that we can compete effectively through our integrated and innovative technology platform and design capabilities, including our strong and extensive patent portfolio, strategic global business model, expanding suites of new products, diversified and broad customer base, and excellent on-the-ground support and quick time to market for our products.
Seasonality
Our business is subject to seasonal fluctuations, primarily due to our involvement in the power semiconductor market for consumer electronic products. Sales seasonality is influenced by various factors, including global and regional economic conditions, trends within the personal computer (PC) market, revenue contributions from newly introduced products, variations in distributor ordering behavior driven by channel inventory adjustments, and end-customer demand. Additionally, fluctuations in consumer purchasing patterns—particularly leading up to major holiday seasons—also contribute to the seasonal nature of our revenue. Our revenue is subject to some seasonal variation. Historically, our sequential revenue growth rate tends to be weaker in the March and December quarters when compared with other quarters.
Research and development
We view technology as a competitive advantage, and we invest significant time and capital in research and development to address the technology-intensive needs of our end customers. Our research and development expenditures for fiscal years 2026, 2025 and 2024 were $103.9 million, $94.3 million and $89.9 million, respectively. We continue to invest in developing
7
new technologies and products utilizing our own fabrication and packaging facilities as it is critical to our long-term success. We also evaluate appropriate investment levels and stay focused on new product introductions to improve our competitiveness. We have research and development teams in Silicon Valley (Sunnyvale, California), Oregon, Texas, Arizona, Korea, Taiwan, United Kingdom, Serbia, India and China. We believe that these diverse research and development teams enable us to develop leading edge technology platforms and new products. Our areas of research and development focus include:
Packaging technologies: Consumer demand for smaller and more compact electronic devices with higher power density is driving the need for advanced packaging technology. Our group of dedicated packaging engineers focuses on smaller form factors, and higher power output with efficient heat dissipation and cost-effectiveness. We have invested resources in developing and enhancing our proprietary packaging technologies, including the establishment of our in-house packaging and testing facilities. Our efforts to develop innovative packaging technologies continues to provide new and cost-effective solutions with higher power density to our customers. During the fiscal year ended June 30, 2026, we continued our diversification strategies by developing new silicon and packaging platforms to expand our SAM and offer higher performance products.
Process technology and device physics: We focus on specialized process technology in the manufacturing of our products, including vertical DMOS, Shielded Gate Trench, Trench field stop IGBTs, charge-balance high voltage MOSFETs, Schottky Diode and BCDMOS processes. Our process engineers work closely with our design team to deploy and implement our proprietary manufacturing processes at our Oregon Fab, the Chongqing Fab as well as the third-party foundries that fabricate our wafers. To improve our process technology, we continue to develop and enhance our expertise in device physics in order to better understand the physical characteristics of materials and the interactions among these materials during the manufacturing process.
New products and new technology platforms: We invest significantly in the development of new technology platforms and introduction of new products. Because power management affects all electronic systems, we believe that developing a wide portfolio of products enables us to target new applications in addition to expanding our share of power management needs within existing applications.
As a technology company, we will continue our significant investment in research and development in our low voltage, medium voltage, and high voltage power discretes, IGBT and power modules and power ICs by developing new technology platforms and new products that allow for improved product performance, higher efficiency packages and higher levels of integration.
Operations
The manufacture of our products is divided into two major steps: wafer fabrication and packaging and testing.
Wafer fabrication
Our Oregon Fab allows us to accelerate the development of our technology and products, as well as to provide better service to our customers. We allocate our wafer production between our in-house facility and third-party foundries. Currently wafers from our third-party suppliers account for approximately 35% of AOS’s total wafer supply.
Packaging and testing
Completed wafers from the foundries are sent to our in-house packaging and testing facilities or to our subcontractors, where the wafers are cut into individual die, soldered to lead frames, wired to terminals and then encapsulated in protective packaging. After packaging, all devices are tested in accordance with our specifications and substandard or defective devices are rejected. We have established quality assurance procedures that are intended to control quality throughout the manufacturing process, including qualifying new parts for production at each packaging facility, conducting root cause analysis, testing for lots with process defects and implementing containment and preventive actions. The final tested products are then shipped to our distributors or customers.
Our in-house and wholly-owned packaging and testing facilities are located in Shanghai, China which handle most of our packaging and testing requirements for our products. In addition, the JV Company handles a portion of our packaging and testing requirement. We continuously increase the outsourcing portion of our packaging and testing requirements to other contract manufacturers to improve our ability to respond to changes in market demand. Our facilities have the combined capacity to package and test over 600 million parts per month and have available floor space for new package introductions. We believe our ability to package and test our products internally represents a strategic advantage as it protects our proprietary packaging technology, increases the rate of new package introductions, reduces operating expenses and ultimately improves our profit margins.
8
Quality assurance
Our quality assurance practices aim to consistently provide our end customers with products that are reliable, durable and free of defects. We strive to do so through design for manufacturing, and continuous improvement in our product design and manufacturing and close collaboration with our manufacturing partners. Our manufacturing operations in China and our manufacturing facility in Oregon are certified to the ISO9001 and IATF16949:2016. These Quality Management System certifications represent a recognition of our high quality assurance standards. Both ISO9001 and IATF16949:2016 are sets of criteria and procedures established by the International Organization of Standardization for developing a fundamental quality management system and focusing on continuous improvement, defect prevention and the reduction of variation and waste. Our products are also in compliance with Restrictions on the use of Hazardous Substances, or RoHS 3.0.
We maintain a supplier management and process engineering team in Shanghai that works with our third-party foundries and packaging and testing subcontractors to monitor the quality of our products, which is designed to ensure that manufacturing of our products is in strict compliance with our process controls, monitoring procedures and product requirements. We also conduct periodic reviews and annual audits to ensure supplier performance. For example, we examine the results of statistical process control systems, implement preventive maintenance, verify the status of quality improvement projects and review delivery time metrics. In addition, we rate and rank each of our suppliers every quarter based on factors such as their quality and performance. Our facility in Oregon integrates manufacturing process controls through our manufacturing execution system, coupled with wafer process controls that include monitoring procedures, preventative maintenance, statistical process control, and testing to ensure that finished wafers delivered will meet and exceed quality and reliability requirements. All materials used to manufacture wafers are controlled through a strict qualification process.
Our manufacturing processes use many raw materials, including silicon wafers, gold, copper, molding compound, petroleum and plastic materials and various chemicals and gases. We obtain our raw materials and supplies from a large number of sources. Although supplies for raw materials used by us are currently adequate, shortages could occur in various essential materials due to interruption of supply or increased demand in the industry.
Intellectual property rights
Intellectual property is a critical component of our business strategy, and we intend to continue to invest in the growth, maintenance and protection of our intellectual property portfolio. We own significant intellectual property in many aspects of power semiconductor technology, including device physics and structure, wafer processes, circuit designs, packaging, modules and subassemblies. We have also entered into intellectual property licensing agreements with other companies to use selected third-party technology for the development of our products, although we do not believe our business is dependent to any significant degree on any individual third-party license agreement.
While we focus our patent efforts in the United States, we file corresponding foreign patent applications in other jurisdictions, such as China and Taiwan, when filing is justified by cost and strategic importance. These patents are increasingly important to remain competitive in our industry, and a strong patent portfolio will facilitate the entry of our products into new markets. As of June 30, 2026, we had 961 patents issued in the United States, which were based on our research and development efforts. Of the 961 issued patents, 775 are active and these patents are set to expire between 2026 and 2044. We also had a total of 991 issued foreign patents, including 407 Chinese patents, 535 Taiwanese patents, 29 Korean patents, 5 Philippine patents, 8 Japanese patents, 3 Europe patents and 4 India patents as of June 30, 2026. Substantially all of our foreign patents were based on our research and development efforts. These foreign patents expire in the years between 2025 and 2044. In addition, as of June 30, 2026, we had a total of 208 patent applications, of which 78 patents were pending in the United States, 85 patents were pending in China, 42 patents were pending in Taiwan and 3 patents were pending in India.
As our technologies are deployed in new applications and as we diversify our product portfolio based on new technology platforms, we may be subject to potential infringement claims. As a technology company operating in a competitive environment, we are subject to intellectual disputes and legal claims, including patent litigations, which could result in substantial costs and a diversion of our management's attention and resources However, we are committed to vigorously defending and protecting our investment in our intellectual property. Therefore, the strength of our intellectual property program, including the breadth and depth of our portfolio, will be critical to our success in the new markets we intend to pursue.
In addition to patent protection, we also rely on a combination of trademark, copyright (including mask work protection), trade secret laws, contractual provisions and similar laws in other jurisdictions. We also enter into confidentiality and invention assignment agreements with our employees, consultants, suppliers, distributors and customers and seek to control access to, and distribution of, our proprietary information.
Human Capital Resources
9
As of June 30, 2026, we had 2,519 employees, of whom 817 were located in the United States, 1,472 were located in China, and 230 were located in other parts of the world. None of our employees is represented by a collective bargaining agreement. Notwithstanding our global footprint and various geographical locations, we have created an integrated workforce where employees worldwide work and collaborate as a team to advance our common business objectives, while retaining local and regional practices and cultures.
We are committed to providing a work environment in which our employees can realize fully their talents and develop successful careers. As our strength is in our people, we invest significantly in our employees by providing a wide range of training and development opportunities, including mentoring, coaching, tuition reimbursement, attendance at external seminars and professional conferences, and regular in-house training sessions on specific topics. We train our managers to become good stewards for our employees, balancing the need for quality of life with performance results. We believe that these efforts contribute to the growth, well-being and loyalty of our employees, as more than 50% of our managerial positions are filled through promotions of existing employees.
We also keep our employees engaged and informed by providing periodic all-staff communications, and semi-annual performance reviews to ensure that efforts and results are aligned with our business and strategic corporate objectives. We value feedback from our employees and promote an open-door policy which encourages employees to have regular conversations with their managers to share feedback and express concerns. We also solicit employee feedback informally through regular employee interactions such as one on one or functional team staff meetings. In addition, we conduct employee satisfaction surveys at certain locations to help management identify areas that may require improvement. As part of the AOS tradition, we organize regular and seasonal social events, such as team building activities, annual appreciation picnics, and holiday parties, inviting both employees and their families to join. We believe these efforts enable us to build a strong and solid group of dedicated and happy employees who form the core of our human capital resource.
We are committed to providing an environment where employees from all walks of life are treated with respect, care and dignity. We adhere strictly to the Company’s Code of Business Conduct and Ethics and other policies, and ensure that our employment practices respect human rights and comply with national, state and local regulatory requirements at all locations where we conduct business. To recruit new talent, we reach out to a broad range of sources, including employee referrals, on-line advertising, recruitment agencies, and other social media platforms to seek out the best qualified candidates regardless of their backgrounds. We are also focused on ensuring a diverse workforce, including our management team. Our Nominating and Corporate Governance Committee leads the effort in recruiting qualified directors to serve on our Board. Our employees appreciate and value the strength of our people-oriented culture and the benefits our workplace diversity brings.
We commit to a fair and living wage for all employees. We offer competitive compensation and benefits packages for our employees that include a combination of base salary, annual bonus, discretionary bonus for outstanding achievements, an employee stock purchase plan, time-based and performance-based long-term equity compensation and vacation benefits. Our equity related compensation programs are designed to motivate and incentivize our employees and align their rewards to financial and other business performance goals, while increasing our shareholder value. We have an established Employee Recognition Award program which is regularly utilized to recognize the outstanding achievements of employees and teams that go above and beyond to achieve AOS business goals. In addition, we have engaged nationally-recognized outside independent compensation consulting firms to independently evaluate the appropriateness and effectiveness of compensation for our executives and other officers and to provide benchmarks for executive compensation as compared to peer companies.
Environmental matters
The semiconductor production process, including the semiconductor wafer manufacturing and packaging process, generates air emissions, liquid wastes, waste water and other industrial wastes. We have installed various types of pollution control equipment for the treatment of air emissions and liquid waste and equipment for recycling and treatment of water in our packaging and testing facilities in China and wafer manufacturing facility in Oregon, USA. Waste generated at our manufacturing facilities, including but not limited to acid waste, alkaline waste, flammable waste, toxic waste, oxide waste and self-igniting waste, is collected and sorted for proper disposal. Our operations in China are subject to regulation and periodic monitoring by China’s State Environmental Protection Bureau, as well as local environmental protection authorities, including those under the Shanghai Municipal Government, which may in some cases establish stricter standards than those imposed by the State Environmental Protection Bureau. Our operation in Oregon is subject to Oregon Department of Environmental Regulations, Federal Environmental Protection Agency laws and regulations, and local jurisdictional regulations. We believe that we have been in material compliance with applicable environmental regulations and standards and have not had a material or adverse effect on our results of operations from complying with these regulations.
We have implemented an ISO 14001 environmental management system in our manufacturing facilities in China and Oregon. We also require our subcontractors, including foundries and assembly houses, to meet ISO 14001 standards. We believe that we have adopted pollution control measures for the effective maintenance of environmental protection standards consistent with the requirements applicable to the semiconductor industry in China and the U.S.
10
Our products sold worldwide are subject to RoHS in Electrical and Electronic Equipment, which requires that the products do not contain more than agreed levels of lead, cadmium, mercury, hexavalent chromium, polybrominated biphenyl and polybrominated diphenyl ether flame retardants. Our manufacturing facilities in China also obtained QC080000 certification, which is an IECQ Certificate of Conformity Hazardous Substance Process Management for European Directive 2002/95/EC requirements and a Certificate of Green Partner for Sony Green Partner Program. We avoid using these restricted materials to the extent possible when we design our products.
We are also subject to SEC rules that require diligence, disclosure and reporting on whether certain minerals and metals, known as conflict minerals, used in our products originate from the Democratic Republic of Congo and adjoining countries. As of June 30, 2026, 2025 and 2024, we were in compliance with the related conflict minerals rule.
Export Control
We are subject to export and import control laws, trade regulations and other trade requirements that limit which products we sell and where and to whom we sell our products. We are committed to complying with all applicable export control laws, regulations, and requirements, and we have implemented processes and procedures to ensure that our shipments to our customers remain compliant with applicable export laws. As part of our export control compliance process, we have also conducted extensive risk assessment on export control compliance and implemented training programs for our employees.
Executive Officers
The following table lists the names, ages and positions of our executive officers as of August 15, 2026. There are no family relationships between any executive officers.
| Name | Age | Position | ||||||
| Stephen C. Chang | 49 | Chief Executive Officer and Director | ||||||
| Yifan Liang | 62 | Chief Financial Officer and Corporate Secretary | ||||||
| Wenjun Li, Ph.D. | 57 | Chief Operating Officer | ||||||
| Bing Xue, Ph.D. | 62 | Executive Vice President of Worldwide Sales and Business Development | ||||||
Stephen C. Chang has served as our Chief Executive Officer since March 2023 and as a director since November 2022. Mr. Chang previously served as the Company’s President from January 2021 to February 2023. Prior to that, Mr. Chang served in various management positions, including Executive Vice President of Product Line Management, Senior VP of Marketing, VP of the MOSFET Product Line, and Senior Director of Product Marketing. Mr. Chang has over 20 years of industry experience and leads the Company’s business strategies, product and technology development, sales and marketing functions, manufacturing operation and supply chain management, and other managerial responsibilities. Mr. Chang received his B.A. in Electrical Engineering from University of California, Berkeley, and M.B.A. from Santa Clara University.
Yifan Liang has been serving as our Chief Financial Officer since August 2014 and Corporate Secretary since November 2013. Mr. Liang served as our Interim Chief Financial Officer from November 2013 to August 2014, our Chief Accounting Officer from October 2006 to November 2013, and our Assistant Corporate Secretary from November 2009 to November 2013. Mr. Liang became our company's corporate controller in August 2004. Prior to joining us, Mr. Liang held various positions at PricewaterhouseCoopers LLP, or PwC, from 1995 to 2004, including Audit Manager in PwC’s San Jose office. Mr. Liang received his B.S. in management information system from the People's University of China and M.A. in finance and accounting from the University of Alabama.
Wenjun. Li, Ph.D., has been serving as our Chief Operating Officer since August 2021. Prior to that, Dr. Li served in various management positions in our Company since 2012, including Executive Vice President of World-Wide Manufacturing, Senior Vice President of World-Wide Manufacturing, Vice President of Front-End Operation, the director of Process Integration and Senior Manager of Process Integration. Dr. Li holds a B.S. in Chemistry and a M.S. in Chemical Engineering from Taiyuan University of Technology, and a Ph.D. in Microelectronics & Solid-State Electronics from the Research Institute of Micro-Nanometer Technology at Shanghai Jiao Tong University.
Bing Xue, Ph.D., has been serving as our Executive Vice President of Worldwide Sales and Business Development since January 2021. Prior to that, Dr. Xue held various managerial positions in our company since 2003, including Senior Vice President of Global Sales, Vice President of Global Sales, Vice President of Worldwide Manufacturing, and General Manager of China Operation. Prior to joining us, Dr. Xue served as the Director of Engineering in Dowslake Microsystem from 2001 to
11
2003. Dr. Xue received his B.S. in Physics from Xiamen University, and Ph.D. in Physical Chemistry from University of Pennsylvania.
Corporate Information
We were incorporated in Bermuda on September 27, 2000 as an exempted limited liability company. The address of our registered office is Richmond House, 12 Par-la-Ville Road, Hamilton HM 08, Bermuda. The address of our U.S. office is Alpha and Omega Semiconductor Incorporated, 475 Oakmead Parkway, Sunnyvale, CA 94085. The telephone number of our U.S. office is (408) 830-9742. We have incorporated various wholly-owned subsidiaries in different jurisdictions. Please refer to Exhibit 21.1 to this Form 10-K for a complete list of our subsidiaries.
Available Information
Our filing documents and information with the Securities and Exchange Commission (the “SEC”) are available free of charge electronically through our Internet website, www.aosmd.com. as soon as reasonably practicable after we electronically file such material with, or furnish it to, the SEC. In addition, the SEC maintains a website (www.sec.gov) that contains reports, proxy statements, and other information that we file electronically.
12
Item 1A.Risk Factors
Our operations and financial results are subject to various risks and uncertainties, including those described below, that could adversely affect our business, financial condition, results of operations, cash flows, and the trading price of our common stock.
Risk Factor Summary
Risks Related to Our Business
•Our operating results and financial conditions are affected by downturns in the semiconductor industry, changes in end-market demand and other macro-economic trends.
•The decline of personal computing (“PC”) markets may have a material adverse effect on our results of operations.
•Our strategy of diversification into different market segments may not succeed according to our expectations and may expose us to new risks and place significant strains on our management, operational, financial and other resources.
•Our operating results may fluctuate from period to period due to many factors, which may make it difficult to predict our future performance.
•Geopolitical and economic conflicts between United States and China may adversely affect our business.
•Our revenue may fluctuate significantly from period to period due to ordering patterns from our distributors and seasonality.
•We may not be able to introduce or develop new and enhanced products that meet or are compatible with our customer’s product requirements in a timely manner.
•We may not win sufficient designs, or our design wins may not generate sufficient revenue for us to maintain or expand our business.
•Our success depends upon the ability of our OEM end customers to successfully sell products incorporating our products.
•The operation of our Oregon Fab subjects us to additional risks and the need for additional capital expenditures which may negatively impact our results of operations.
•Defects and poor performance in our products could result in loss of customers, decreased revenue, unexpected expenses and loss of market share, and we may face warranty and product liability claims arising from defective products.
•The average selling prices of products in our markets have historically decreased rapidly and will likely do so in the future, which could harm our revenue and gross margins.
•If we do not forecast demand for our products accurately, we may experience product shortages, delays in product shipment, excess product inventory, or difficulties in planning expenses, which will adversely affect our business and financial condition.
•We face intense competition and may not be able to compete effectively which could reduce our revenue and market share.
•Our reliance on third-party semiconductor foundries to manufacture our products subjects us to risks.
•Our lack of control over the JV Company may adversely affect our operations.
•Our reliance on distributors to sell a substantial portion of our products subjects us to a number of risks.
•We have made and may continue to make strategic acquisitions of other companies, assets or businesses and these acquisitions introduce significant risks and uncertainties.
•If we are unable to obtain raw materials in a timely manner or if the price of raw materials increases significantly, production time and product costs could increase, which may adversely affect our business.
•We may not be able to accurately estimate provisions at fiscal period end for price adjustment and stock rotation rights under our agreements with distributors, and our failure to do so may impact our operating results.
•Our operation of two wholly-owned packaging and testing facilities are subject to risks that could adversely affect our business and financial results.
•We may be adversely affected by any disruption in our information technology systems.
•We depend on the continuing services of our senior management team and other key personnel.
•Failure to protect our patents and our other proprietary information could harm our business and competitive position.
•Intellectual property disputes could result in lengthy and costly arbitration, litigation or licensing expenses or prevent us from selling our products.
•Evolving export control regulations may adversely affect our financial performance and business operations.
•Global or regional economic, political and social conditions could adversely affect our business and operating results.
•Our business operations could be significantly harmed by natural disasters or global epidemics.
•Our insurance may not cover all losses, including losses resulting from business disruption or product liability claims.
•Our international operations subject our company to risks not faced by companies without international operations.
•If we fail to maintain an effective internal control environment as well as adequate control procedures over our financial reporting, investor confidence may be adversely affected thereby affecting the value of our stock price.
•We are subject to the risk of increased income taxes and changes in existing tax rules.
13
•Our debt agreements include financial covenants that may limit our ability to pursue business and financial opportunities and subject us to risk of default.
•The imposition of U.S. corporate income tax on our Bermuda parent and non-U.S. subsidiaries could adversely affect our results of operations.
•We may be classified as a passive foreign investment company (“PFIC”), which could result in adverse U.S. federal income tax consequences for U.S. holders.
•Changes in our United States federal income tax classification, or that of our subsidiaries, could result in adverse tax consequences to our 10% or greater U.S. shareholders.
•Changes in tariffs and international trade policies affecting imports and exports may have a material adverse effect on our business operations and financial performance.
Risks Related to Doing Business in China
•China’s economic, political and social conditions, as well as government policies, could affect our business and growth.
•Changes in China’s laws, legal protections or government policies on foreign investment in China may harm our business.
•The continuing trade tensions between the U.S. and China may result in increased tariffs on imported goods from China could adversely affect our business operations.
•Our China subsidiaries’ current corporate structure and business operations may be affected by the Foreign Investment Law of the PRC and the New Company Law (defined below).
•Limitations on our ability to transfer funds to our China subsidiaries could adversely affect our ability to expand our operations, make investments that could benefit our businesses and otherwise fund and conduct our business.
•China's currency exchange control and government restrictions on investment repatriation may impact our ability to transfer funds outside of China.
•The M&A Rules and certain other PRC regulations establish complex procedures for some acquisitions of Chinese companies by foreign investors, which could make it more difficult for us to pursue growth through acquisitions in China.
•Our results of operations may be negatively impacted by fluctuations in foreign currency exchange rates between U.S. dollar and Chinese Yuan ("RMB").
•PRC labor laws may adversely affect our results of operations.
•Our business operations in China are subject to complex and evolving PRC data security, data privacy, and cybersecurity laws, and any non-compliance could subject us to severe penalties, operational disruptions, or structural changes.
•Strict regulatory oversight and evolving laws in China regarding data security, cyber security, and cross-border data transfers may restrict our operational data flows, increase compliance costs, or subject us to administrative penalties.
•Relations between Taiwan and China could negatively affect our business, financial condition and operating results and, therefore, the market value of our common shares.
Risks Related to Our Corporate Structure and Our Common Shares
•Our share price may be volatile and you may be unable to sell your shares at or above the purchase price, if at all.
•If securities or industry analysts do not publish research or reports about our business, or if they adversely change their recommendations regarding our common shares or if our operating results do not meet their expectations, the trading price of our common shares could decline.
•Anti-takeover provisions in our bye-laws could make an acquisition of us more difficult and may prevent attempts by our shareholders to replace or remove our current management.
•We are a Bermuda company and the rights of shareholders under Bermuda law may be different from U.S. laws.
Risks Related to Our Business
Our operating results and financial conditions are affected by downturns in the semiconductor industry, changes in end-market demand and other macro-economic trends.
The semiconductor industry periodically experiences significant economic downturns characterized by diminished product and end-market demand, production overcapacity, excess inventory, which can result in rapid significant decline in shipment and sales, which may harm our operating results and financial condition. The semiconductor market is also highly cyclical and is characterized by constant and rapid technological change such as product obsolescence and price erosion, evolving standards, uncertain product life cycles and wide fluctuations in product supply and demand. More recently, we have observed the impact of certain government regulations, such as tariffs or other related trade regulation, that can negatively affect the global semiconductor markets and cause a decline for the demand of our products. In addition, the broader semiconductor industry experienced a decline in calendar year 2023 with some recovery in 2024, but there is no
14
guarantee that further recovery will occur and a prolonged and extended downturn in the semiconductor industry will have a substantial impact on our operating results and financial conditions.
The decline of personal computing (“PC”) markets may have a material adverse effect on our results of operations.
A significant amount of our revenue is derived from sales of products in the PC markets such as notebooks, motherboards and notebook battery packs. Our revenue from the PC markets accounted for a significant portion of our total revenue in recent years. The increasing popularity of smaller, mobile computing devices such as tablets and smart phones with touch interfaces is rapidly changing the PC markets both in the United States and abroad. In the past we experienced a significant reduction in the demand for our products due to the declining PC markets, which negatively impacted our revenue, profitability and gross margin. For example, demand for PC declined due to an industry-wide inventory correction and the ensuing downturn in the semiconductor industry from late 2022 to the end of 2023 and early 2024. While the negative impact of inventory correction gradually subsided since mid-2024 and early 2025, in the first half of 2026, the semiconductor industry experienced a severe constraint in memory supplies (DRAM and NAND flash) driven by data center AI infrastructure demand, which adversely affected the demand in the PC market. We cannot predict when the current memory constraint will end and whether the PC market will return to a more normalized level. We have implemented measures and strategies to mitigate the effect of such a downturn. These measures and strategies may not be sufficient or successful, in which case our operating results may be adversely affected.
Our strategy of diversification into different market segments may not succeed according to our expectations and may expose us to new risks and place significant strains on our management, operational, financial and other resources.
As part of the growth strategy to diversify our product portfolio and in response to the decline of the PC markets, we have been developing new technologies and products designed to penetrate into other markets and applications, including merchant power supplies, power supplies, flat panel TVs, smart phones, tablets, AI datacenters, servers, graphics cards, gaming consoles, datacom, telecommunications, home appliances, power tools, and industrial motor controls. However, there is no guarantee that these diversification efforts will be successful. As a new entrant to some of these markets, we may face intense competition from existing and more established providers and encounter other unexpected difficulties, any of which may hinder or delay our efforts to achieve success. In addition, our new products may have long design and sales cycles. Therefore, if our diversification efforts fail to keep pace with the declining PC markets, we may not be able to alleviate its negative impact on our results of operations.
Our diversification into different market segments may place a significant strain on our management, operational, financial and other resources. To manage this diversification effectively, we will need to take various actions, including:
•enhancing management information systems, including forecasting procedures;
•further developing our operating, administrative, financial and accounting systems and controls;
•managing our working capital and sources of financing;
•maintaining close coordination among our engineering, accounting, finance, marketing, sales and operations organizations;
•retaining, training and managing our employee base;
•enhancing human resource operations and improving employee hiring and training programs;
•realigning our business structure to more effectively allocate and utilize our internal resources;
•improving and sustaining our supply chain capability; and
•managing both our direct and distribution sales channels in a cost-efficient and competitive manner.
Our failure to execute any of the above actions successfully or timely may have an adverse effect on our business and financial results.
Our operating results may fluctuate from period to period due to many factors, which may make it difficult to predict our future performance.
Our periodic operating results may fluctuate as a result of a number of factors, many of which are beyond our control. These factors include, among others:
•a deterioration in general demand for electronic products, particularly the PC market, as a result of global or regional financial crises and associated macro-economic slowdowns, and/or the cyclicality of the semiconductor industry;
15
•a deterioration in business conditions at our distributors and /or end customers;
•adverse general economic conditions in the countries where our products are sold or used;
•the emergence and growth of markets for products we are currently developing;
•our ability to successfully develop, introduce and sell new or enhanced products in a timely manner and the rate at which our new products replace declining orders for our older products;
•the anticipation, announcement or introduction of new or enhanced products by us or our competitors;
•changes in the selling prices of our products and in the relative mix in the unit shipments of our products, which have different average selling prices and profit margins;
•the amount and timing of operating costs and capital expenditures, including expenses related to the maintenance and expansion of our business operations and infrastructure;
•the announcement of significant acquisitions, disposition or partnership arrangements;
•changes in the utilization of our in-house manufacturing capacity and the availability of manufacturing capacity at third-party foundries and the JV Company;
•supply and demand dynamics and the resulting price pressure on the products we sell;
•the unpredictable volume and timing of orders, deferrals, cancellations and reductions for our products, which may depend on factors such as our end customers’ sales outlook, purchasing patterns and inventory adjustments based on general economic conditions or other factors;
•changes in laws and regulations affecting our business operations, including trade regulations and tariffs;
•changes in costs associated with manufacturing of our products, including pricing of wafer, raw materials and assembly services;
•our concentration of sales in consumer applications and changes in consumer purchasing patterns and confidence; and
•the adoption of new industry standards or changes in our regulatory environment.
Any one or a combination of the above factors and other risk factors described in this section may cause our operating results to fluctuate from period to period, making it difficult to predict our future performance. Therefore, comparing our operating results on a period-to-period basis may not be meaningful, and you should not rely on our past results as an indication of our future performance.
Geopolitical and economic conflicts between United States and China may adversely affect our business.
Geopolitical conflicts and tensions between the United States and China have threatened trading relationships and economic activities between the two countries. Because we have significant operations in both countries, such conflicts and tensions may negatively impact our business. At various times during recent years, the United States and China have had disagreements over political and economic issues, including, but not limited to, the recent imposition of tariffs by the U.S. on goods imported from China or sourced from China and imposition of retaliatory tariffs and other countermeasures (like government investigations, sanctions, etc.) by China, as well as the U.S. government’s efforts to restrict transfer and sharing of technologies, including semiconductor technologies, between the two countries. In addition, the U.S. government may enact new and more restrictive export control regulations that may reduce our ability to ship and sell products to certain customers in China and Asia and increase our cost to implement additional measures to comply with such new regulations. Disagreements between the United States and China with respect to their political, military or economic policies toward Taiwan may contribute to further controversies. These controversies and trade frictions could have a material adverse effect on our business by, among other things, making it more difficult for us to coordinate our operations between the United States and China, causing a reduction in the demand for our products by customers in the United States or China, and reducing our profitability due to increasing cost of compliance.
Our revenue may fluctuate significantly from period to period due to ordering patterns from our distributors and seasonality.
Demand for our products from our end customers fluctuates depending on their sales outlooks and market and economic conditions. Accordingly, our distributors place purchase orders with us based on their forecasts of end customer demand. Because these forecasts may not be accurate, channel inventory held at our distributors may fluctuate significantly due to the difference between the forecasts and actual demand. As a result, distributors adjust their purchase orders placed with us in response to changing channel inventory levels, as well as their assessment of the latest market demand trends. A significant
16
decrease in our distributors’ channel inventory in one period may lead to a significant rebuilding of channel inventory in subsequent periods, or vice versa, which may cause our quarterly revenue and operating results to fluctuate significantly.
In addition, because our power semiconductors are used in consumer electronics products, our revenue is subject to seasonality. Our sales seasonality is affected by a number of factors, including global and regional economic conditions as well as the PC market conditions, revenue generated from new products, changes in distributor ordering patterns in response to channel inventory adjustments and end customer demand for our products and fluctuations in consumer purchase patterns prior to major holiday seasons. In recent year, broad fluctuations in the semiconductor markets and the global economic conditions, in particular the decline of the PC market conditions, have had a more significant impact on our results of operations, than seasonality, and have made it difficult to assess the impact of seasonal factors on our business.
If we are unable to introduce or develop new and enhanced products that meet or are compatible with our customer’s product requirements in a timely manner, it may harm our business, financial position and operating results.
Our success depends upon our ability to develop and introduce new and enhanced products that meet or are compatible with our customer’s specifications, performance standards and other product requirements in a timely manner. The development of new and enhanced products involves highly complex processes, and at times we have experienced delays in the introduction of new products. Successful product development and introduction of new products depends on a number of factors, including the accurate product specification; timely completion of design; achievement of manufacturing yields; timely response to changes in customer’s product requirements; quality and cost-effective production; and effective marketing. Since many of our products are designed for specific applications, we must frequently develop new and enhanced products jointly with our customers. In the past, we have encountered product compatibility issues with a major OEM that have negatively impacted our financial results, and although we have resolved fully such issues with the OEM, there is no guarantee that the same compatibility issues will not occur in the future with other OEMs. In addition, our Tier 1 customers often have stringent standards and strict requirements that must be met before our products can be sold, which may create challenges and difficulties in our product development efforts. If we are unable to develop or acquire new products that meet or are compatible with our customer’s specification and other product requirements in a timely manner, we may lose revenue or market share with our customers, which could have a material adverse effect on our business, financial position and operating results.
We may not win sufficient designs, or our design wins may not generate sufficient revenue for us to maintain or expand our business.
We invest significant capital and resources to compete with other power semiconductor companies to win competitive bids for our products in selection processes, known as “design wins.” Our effort to obtain design wins may detract from or delay the completion of other important development projects, impair our relationships with existing end customers and negatively impact sales of products under development. In addition, we cannot be assured that these efforts would result in a design win, that our product would be incorporated into an end customer’s initial product design, or that any such design win would lead to production orders and generate sufficient revenue. Furthermore, even after we have qualified our products with a customer and made sales, subsequent changes to our products, manufacturing processes or suppliers may require a new qualification process, which may result in delay and excess inventory. If we cannot achieve sufficient design wins in the future, or if we fail to generate production orders following design wins, our ability to grow our business and improve our financial results will be harmed.
Our success depends upon the ability of our OEM end customers to successfully sell products incorporating our products.
The consumer end markets, in particular the PC market, in which our products are used are highly competitive. Our OEM end customers may not successfully sell their products for a variety of reasons, including:
•general global and regional economic conditions;
•late introduction or lack of market acceptance of their products;
•lack of competitive pricing;
•shortage of component supplies;
•excess inventory in the sales channels into which our end customers sell their products;
•changes in the supply chain; and
•changes as a result of regulatory restrictions applicable to China-exported products.
Our success depends on the ability of our OEM end customers to sell their products incorporating our products. In addition, we have expanded our business model to include more OEMs in our direct customer base. The failure of our OEM
17
end customers to achieve or maintain commercial success for any reason could harm our business, results of operations, and financial condition and prospects.
The operation of our Oregon Fab subjects us to additional risks and the need for additional capital expenditures which may negatively impact our results of operations.
The operation of the Oregon Fab requires significant fixed manufacturing cost. In order to manage the capacity of the wafer fabrication facility efficiently, we must perform a forecast of long-term market demand and general economic conditions for our products. Because market conditions may vary significantly and unexpectedly, our forecast may change significantly at any time, and we may not be able to make timely adjustments to our fabrication capacity in response to these changes. During periods of continued decline in market demand, in particular the decline of the PC market, we may not be able to absorb the excess inventory and additional costs associated with operating the facility at higher capacity, which may adversely affect our operating results. Similarly, during periods of unexpected increase in customer demand, we may not be able to ramp up production quickly to meet these demands, which may lead to the loss of significant revenue opportunities. The manufacturing processes of a fabrication facility are complex and subject to interruptions. We may experience production difficulties, including lower manufacturing yields or products that do not meet our or our customers’ specifications, and problems in ramping production and installing new equipment. These difficulties could result in delivery delays, quality problems and lost revenue opportunities. Any significant quality problems could also damage our reputation with our customers and distract us from the development of new and enhanced product which may have a significant negative impact on our financial results.
Defects and poor performance in our products could result in loss of customers, decreased revenue, unexpected expenses and loss of market share, and we may face warranty and product liability claims arising from defective products.
Our products are complex and must meet stringent quality requirements. Products as complex as ours may contain undetected errors or defects, especially when first introduced or when new versions are released. Errors, defects or poor performance can arise due to design flaws, defects in raw materials or components or manufacturing anomalies, which can affect both the quality and the yield of the product. It can also be potentially dangerous as defective power components, or improper use of our products by customers, may lead to power overloads, which could result in explosion or fire. Any actual or perceived errors, defects or poor performance in our products could result in the replacement or recall of our products, shipment delays, rejection of our products, damage to our reputation, lost revenue, diversion of our engineering personnel from our product development efforts in order to address or remedy any defects and increases in customer service and support costs, all of which could have a material adverse effect on our business and operations.
Furthermore, as our products are typically sold at prices much lower than the cost of the equipment or other devices incorporating our products, any defective, inefficient or poorly performing products, or improper use by customers of power components, may give rise to warranty and product liability claims against us that exceed any revenue or profit we receive from the affected products. We could incur significant costs and liabilities if we are sued and if damages are awarded against us. There is no guarantee that our insurance policies will be available or adequate to protect against such claims. Costs or payments we may make in connection with warranty and product liability claims or product recalls may adversely affect our financial condition and results of operations.
The average selling prices of products in our markets have historically decreased rapidly and will likely do so in the future, which could harm our revenue and gross margins.
As is typical in the semiconductor industry, the average selling price of a particular product has historically declined significantly over the life of the product. In the past, we have reduced the average selling prices of our products in anticipation of future competitive pricing pressures, new product introductions by us or our competitors and other factors. We expect that we will have to similarly reduce prices in the future for older generations of products. Reductions in our average selling prices to one customer could also impact our average selling prices to all customers. A decline in average selling prices would harm our gross margins for a particular product. If not offset by sales of other products with higher gross margins, our overall gross margins may be adversely affected. Our business, results of operations, financial condition and prospects will suffer if we are unable to offset any reductions in our average selling prices by increasing our sales volumes, reducing our costs and developing new or enhanced products on a timely basis, with higher selling prices or gross margins.
If we do not forecast demand for our products accurately, we may experience product shortages, delays in product shipment, excess product inventory, or difficulties in planning expenses, which will adversely affect our business and financial condition.
18
We manufacture our products according to our estimates of customer demand. This process requires us to make numerous forecasts and assumptions relating to the demand of our end customers, channel inventory, and general market conditions. Because we sell most of our products to distributors, who in turn sell to our end customers, we have limited visibility as to end customer demand. Furthermore, we do not have long-term purchase commitments from our distributors or end customers, and our sales are generally made by purchase orders that may be cancelled, changed or deferred without notice to us or penalty. As a result, it is difficult to forecast future customer demand to plan our operations.
The utilization of our manufacturing facilities and the provisions for inventory write-downs are important factors in our profitability. If we overestimate demand for our products, or if purchase orders are canceled or shipments delayed, we may have excess inventory, which may result in adjustments to our production plans. These adjustments to our productions may affect the utilization of our own wafer fabrication and packaging facilities. If we cannot sell certain portions of the excess inventory, it will affect our provisions for inventory write-downs. Our inventory write-down provisions are subject to adjustment based on events that may not be known at the time the provisions are made, and such adjustments could be material and impact our financial results negatively.
Our customers’ products often incorporate third-party memory components. The memory market has in the past experienced supply imbalances, capacity constraints, and pricing volatility, and the industry is currently experiencing a global shortage of certain memory components as a result of AI-driven demand. These conditions are likely to impact our customers and may limit their ability to manufacture their end products or may cause them to adjust production schedules, delay product launches, or revise demand forecasts, which in turn could lead them to reduce, delay, or cancel orders for our products, even when demand for their end products remains strong. The current shortage and resulting price increase for memory components also may lead our customers to increase prices of their end products, which could lead to decreased demand for those products, negatively impacting orders for our products in the longer term. In addition, uncertainty regarding the availability or pricing of memory components or other key components may impair our ability to accurately forecast demand, manage inventory levels, or plan production. Any of these factors could adversely affect our business, financial condition, and results of operations.
If we underestimate demand, we may not have sufficient inventory to meet end-customer demand, and we may lose market share and damage relationships with our distributors and end customers and we may have to forego potential revenue opportunities. Obtaining additional supply in the face of product shortages may be costly or impossible, particularly in the short term, which could prevent us from fulfilling orders in a timely manner or at all.
In addition, we plan our operating expenses, including research and development expenses, hiring needs and inventory investments, based in part on our estimates of customer demand and future revenue. If customer demand or revenue for a particular period is lower than we expect, we may not be able to proportionately reduce our fixed operating expenses for that period, which would harm our operating results.
We face intense competition and may not be able to compete effectively which could reduce our revenue and market share.
The power semiconductor industry is highly competitive and fragmented. If we do not compete successfully against current or potential competitors, our market share and revenue may decline. Our main competitors are primarily headquartered in the United States, Japan, Taiwan and Europe. Our major competitors in power discretes include Infineon Technologies AG, ON Semiconductor Corp., STMicroelectronics N.V., Toshiba Corporation, Diodes Incorporated and Vishay Intertechnology, Inc. Our major competitors for our power ICs include Monolithic Power Systems, Inc., ON Semiconductor Corp., Richtek Technology Corp., Semtech Corporation, Texas Instruments Inc. and Vishay Intertechnology, Inc..
We expect to face competition in the future from our competitors, other manufacturers, designers of semiconductors and start-up semiconductor design companies. Many of our competitors have competitive advantages over us, including:
•significantly greater financial, technical, research and development, sales and marketing and other resources, enabling them to invest substantially more resources than us to respond to the adoption of new or emerging technologies or changes in customer requirements;
•greater brand recognition and longer operating histories;
•larger customer bases and longer, more established relationships with distributors or existing or potential end customers, which may provide them with greater reliability and information regarding future trends and requirements that may not be available to us;
•the ability to provide greater incentives to end customers through rebates, and marketing development funds or similar programs;
19
•more product lines, enabling them to bundle their products to offer a broader product portfolio or to integrate power management functionality into other products that we do not sell;
•greater ability and more resources to influence and participate in the regulatory and legislative process for more favorable laws and regulations; and
•captive manufacturing facilities, providing them with guaranteed access to manufacturing facilities in times of global semiconductor shortages.
In addition, the semiconductor industry has experienced increased consolidation over the past several years that may adversely affect our competitive position. Consolidation among our competitors could lead to a less favorable competitive landscape, capabilities and market share, which could harm our business and results of operations.
If we are unable to compete effectively for any of the foregoing or other reasons, our business, results of operations, and financial condition and prospects will be harmed.
Our reliance on third-party semiconductor foundries to manufacture our products subject us to risks.
The allocation of our wafer production between in-house facility and third-party foundries may fluctuate from time to time. We expect to continue to rely in part on third party foundries to meet our wafer requirements.
If any third-party foundry does not provide competitive pricing or is not able to meet our required capacity for any reason, we may not be able to obtain the required capacity to manufacture our products timely or efficiently. From time to time, third party suppliers may extend lead-times, limit supplies or increase prices due to capacity constraints or other factors, and we may experience a shortage of capacity on an industry-wide basis that may last for an extended period of time. There are no assurances that we will be able to maintain sufficient capacity to meet the full demand from our customers, and failure to do so will adversely affect our results of operations. If we cannot maintain sufficient capacity or control pricing with our existing third-party foundries, we may need to increase our own manufacturing capacity, and there is no assurance that we can ramp up the production of the Oregon Fab timely to meet the increased demand. If not, we may need to seek alternative foundries, which may not be available on commercially reasonable terms, or at all. In addition, the process for qualifying a new foundry is time consuming, difficult and may not be successful, particularly if we cannot integrate our proprietary process technology with the process used by the new foundry. Using a foundry with which we have no established relationship could expose us to potentially unfavorable pricing, unsatisfactory quality or insufficient capacity allocation.
We also rely on third-party foundries to effectively implement certain of our proprietary technology and processes and also require their cooperation in developing new fabrication processes. Any failure to do so may impair our ability to introduce new products and on-time delivery of wafers for our existing products. In order to maintain our profit margins and to meet our customer demand, we need to achieve acceptable production yields and timely delivery of silicon wafers. As is common in the semiconductor industry, we have experienced, and may experience from time to time, difficulties in achieving acceptable production yields and timely delivery from third-party foundry vendors. Minute impurities in a silicon wafer can cause a substantial number of wafers to be rejected or cause numerous die on a wafer to be defective. Low yields often occur during the production of new products, the migration of processes to smaller geometries or the installation and start-up of new process technologies.
We face a number of other significant risks associated with outsourcing fabrication, including:
•limited control over delivery schedules, quality assurance and control and production costs;
•discretion of foundries to reduce deliveries to us on short notice, allocate capacity to other customers that may be larger or have long-term customer or preferential arrangements with foundries that we use;
•unavailability of, or potential delays in obtaining access to, key process technologies;
•limited warranties on wafers or products supplied to us;
•damage to equipment and facilities, power outages, equipment or materials shortages that could limit manufacturing yields and capacity at the foundries;
•potential unauthorized disclosure or misappropriation of intellectual property, including use of our technology by the foundries to make products for our competitors;
•financial difficulties and insolvency of foundries; and
•acquisition of foundries by third parties.
Any of the foregoing risks could delay shipment of our products, result in higher expenses and reduced revenue, damage our relationships with customers and otherwise adversely affect our business and operating results.
20
Our lack of control over the JV Company may adversely affect our operations.
As of June 30, 2026, our equity interest in the JV Company was approximately 18.9%. Because we no longer have a controlling interest in the JV Company, the JV Company is operating and will continue to operate independently, and our influence on all aspects of the JV Company’s business operations will be diminished. Accordingly, we might not be able to prevent the JV Company from taking actions adverse to our interests. For example, while we remain a major customer of the JV Company, the JV Company may decide to enter into business relationships with other customers and allocate foundry capacities to such customers, which may prevent us from securing a desirable or sufficient level of manufacturing capacity for our products. Although the JV Company has agreed to provide us with a specified level of monthly wafer production capacity, there is no guarantee that such capacity will be sufficient, which may adversely affect our results of operations.
Our lack of control over the JV Company may also make it more difficult for us to execute our broader business strategies in China, including our R&D, sales and marketing, product innovation efforts and protection of intellectual property rights, because the JV Company may decide not to cooperate with us in these matters.
In order to fund its capital expenditures and cost of operation, the JV Company has incurred a significant amount of indebtedness from third-party lenders under several loan and lease financing agreements, some of which are secured by substantially all of the assets of the JV Company. If the JV Company is not able to generate sufficient cash flow to make payments under these loans, the JV Company may be in default, which will adversely affect its ability to continue operations and provide foundry services to us. In addition, the JV Company requires additional funding to continue its operations and to refinance its existing indebtedness. There is no guarantee that the JV Company will be able to obtain financing on favorable terms, or at all, and any such failure may negatively impact our ability to access its wafer manufacturing capacity.
Any of the foregoing risks could materially reduce the expected return of our investment in the JV Company and adversely affect our business operations, our financial performance and the trading price of our shares.
Our reliance on distributors to sell a substantial portion of our products subjects us to a number of risks.
We sell a substantial portion of our products to distributors, who in turn sell to our end customers. Our distributors typically offer power semiconductor products from several different companies, including our direct competitors. The distributors assume collection risk and provide logistical services to end customers, including stocking our products. Two distributors, WPG and Promate, collectively accounted for 72.3%, 73.4% and 71.0% of our revenue for the fiscal years ended June 30, 2026, 2025 and 2024, respectively. We currently have effective agreements with Promate and WPG to serve as our distributors, and such agreement is renewed automatically for one-year period continuously unless terminated earlier pursuant to the terms of such agreements. We believe that our success will continue to depend upon these distributors. Our reliance on distributors subjects us to a number of risks, including:
•write-downs in inventories associated with stock rotation rights and increases in provisions for price adjustments granted to certain distributors;
•potential reduction or discontinuation of sales of our products by distributors;
•failure to devote resources necessary to sell our products at the prices, in the volumes and within the time frames that we expect;
•focusing their sales efforts on products of our competitors;
•dependence upon the continued viability and financial resources of these distributors, some of which are small organizations with limited working capital and all of which depend on general economic conditions and conditions within the semiconductor industry;
•dependence on the timeliness and accuracy of shipment forecasts and resale reports from our distributors;
•management of relationships with distributors, which can deteriorate as a result of conflicts with efforts to sell directly to our end customers; and
•our agreements with distributors which are generally terminable by either party on short notice.
If any significant distributor becomes unable or unwilling to promote and sell our products, or if we are not able to renew our contracts with the distributors on acceptable terms, we may not be able to find a replacement distributor on reasonable terms or at all and our business could be harmed.
21
We have made and may continue to make strategic acquisitions of other companies, assets or businesses or form joint ventures with partners to advance our business objectives. These acquisitions and joint ventures involve significant risks and uncertainties.
In order to position ourselves to take advantage of growth opportunities, we have made, and may continue to make, strategic acquisitions, mergers, partnership, joint ventures and alliances that involve significant risks and uncertainties. Successful acquisitions and alliances in the semiconductor industry are difficult to accomplish because they require, among other factors, efficient integration and aligning of product offerings and manufacturing operations and coordination of sales, marketing and research and development efforts. We may also seek to establish partnerships, joint ventures and acquisition of assets in various foreign jurisdictions where we may not have significant operating experience. In addition, we may encounter unanticipated challenges and difficulties, including regulatory and compliance issues, lack of local support and geopolitical tensions. The difficulties of integration and alignment may be increased by the necessity of coordinating geographically separated organizations, the complexity of the technologies being integrated and aligned and the necessity of integrating personnel with dissimilar business backgrounds. Furthermore, there is no guarantee that we will be able to identify viable targets for strategic acquisition. Also we may incur significant costs in efforts that may not result in a successful acquisition.
In addition, we may also issue equity securities to pay for future acquisitions or alliances, which could be dilutive to existing shareholders. We may also incur debt or assume contingent liabilities in connection with acquisitions and alliances, which could impose restrictions on our business operations and harm our operating results.
If we are unable to obtain raw materials in a timely manner or if the price of raw materials increases significantly, production time and product costs could increase, which may adversely affect our business.
Our fabrication and packaging processes depend on raw materials such as silicon wafers, gold, copper, molding compound, petroleum and plastic materials and various chemicals and gases. From time to time, suppliers may extend lead times, limit supplies or increase prices due to capacity constraints or other factors. If the prices of these raw materials rise significantly, we may be unable to pass on the increased cost to our customers. Our results of operations could be adversely affected if we are unable to obtain adequate supplies of raw materials in a timely manner or at reasonable price. In addition, from time to time, we may need to reject raw materials because they do not meet our specifications or the sourcing of such materials do not comply with our conflict mineral policies, resulting in potential delays or declines in output. Furthermore, problems with our raw materials may give rise to compatibility or performance issues in our products, which could lead to an increase in customer returns or product warranty claims. Errors or defects may arise from raw materials supplied by third parties that are beyond our detection or control, which could lead to additional customer returns or product warranty claims that may adversely affect our business and results of operations.
We may not be able to accurately estimate provisions at fiscal period end for price adjustment and stock rotation rights under our agreements with distributors, and our failure to do so may impact our operating results.
We sell a majority of our products to distributors under arrangements allowing price adjustments and returns under stock rotation programs, subject to certain limitations. As a result, we are required to estimate allowances for price adjustments and stock rotation for our products as inventory at distributors at each reporting period end.
We estimate the allowance for price adjustment based on factors such as distributor inventory levels, forecasted distributor selling prices, distributor margins and demand for our products. Our estimated allowances for price adjustments, which we offset against accounts receivable from distributors, were $38.7 million and $40.8 million at June 30, 2026 and 2025, respectively.
Our accruals for stock rotation are estimated based on historical returns and individual distributor agreement, and stock rotation rights, which are recorded as accrued liabilities on our consolidated balance sheets, are contractually capped based on the terms of each individual distributor agreement. Our estimated liabilities for stock rotation at June 30, 2026 and 2025 were $6.9 million and $6.2 million, respectively.
Our estimates for these allowances and accruals may be inaccurate. If we subsequently determine that any allowance and accrual based on our estimates is insufficient, we may be required to increase the size of our allowances and accrual in future periods, which would adversely affect our results of operations and financial condition.
Our operations of a packaging and testing facility are subject to risks that could adversely affect our business and financial results.
22
We have one wholly-owned packaging and testing facility located in Shanghai, China that handles the majority of our packaging and testing requirements. The operation of high-volume packaging and testing facility and implementation of our advanced packaging technology are complex and demand a high degree of precision and may require modification to improve yields and product performance. We have committed substantial resources to ensure that our packaging and testing facilities operate efficiently and successfully, including the acquisition of equipment and raw materials, and training and management of a large number of technical personnel and employees. Due to the fixed costs associated with operating our own packaging and testing facilities, if we are unable to utilize our in-house facility at a desirable level of production, our gross margin and results of operations may be adversely affected. For example, a significant decline in our market share or sales orders may negatively impact our factory utilization and reduce our ability to achieve profitability.
In addition, the operation of our packaging and testing facility is subject to a number of risks, including the following:
•unavailability of equipment, whether new or previously owned, at acceptable terms and prices;
•facility equipment failure, power outages or other disruptions;
•shortage of raw materials, including copper, gold and molding compound;
•failure to maintain quality assurance and remedy defects and impurities;
•changes in the packaging requirements of customers;
•compliance with local and regional legal and regulatory requirements; and
•unexpected customs, tax and other government audits and investigations concerning related party transactions, transfer pricing arrangements, IP license and royalty payments, etc.
Any of the foregoing risks could adversely affect our capacity to package and test our products, which could delay shipment of our products, result in higher expenses, reduce revenue, damage our relationships with customers and otherwise adversely affect our business, results of operations, financial condition and prospects.
Our business operations and financial conditions may be adversely affected by any disruption in our information technology systems, including any cyberattacks and breaches.
Our operations are dependent upon our information technology systems, which encompass all of our major business functions across offices internationally. We rely upon such information technology systems to manage and replenish inventory, complete and track customer orders, coordinate sales activities across all of our products and services, maintain vital data and information, perform financial and accounting tasks and manage and perform various administrative and human resources functions. A substantial disruption in our information technology systems for any extended time period (arising from, for example, system capacity limits from unexpected increases in our volume of business, outages or delays in our service) could result in delays in receiving inventory and supplies or filling customer orders and adversely affect our customer service and relationships. Our systems might be damaged or interrupted by natural or man−made events or by computer viruses, physical or electronic break−ins, cyber-attacks and similar disruptions affecting the global Internet.
In the past we have experienced cybersecurity incidents and threats against our information technology systems. While these incidents and attacks did not have a material adverse effect on our business operation or results of operations, they caused temporary disruptions and interfered with our operations. Any cybersecurity breach and financial loss may also have a negative impact on our internal control over financial reporting. While we have implemented additional measures to enhance our security protocol to protect our system and intend to do so in response to any threats, there is no guarantee that future attacks would be thwarted or prevented. We also expect to incur additional costs and expenses to upgrade our information technology system and establish additional protective measures to prevent future breaches. Furthermore, despite our efforts to investigate, improve and remediate the capability and performance of our information technology system, we may not be able to discover all weaknesses, breaches and vulnerabilities, and failure to do so may expose us to higher risk of data loss and adversely affect our business operations and results of operations.
We depend on the continuing services of our senior management team and other key personnel, and if we lose a member of our senior management or are unable to successfully retain, recruit and train key personnel, our ability to develop and market our products could be harmed.
Our success depends upon the continuing services of members of our senior management team and various engineering and other technical personnel. In particular, our engineers and other sales and technical personnel are critical to our future technological and product innovations. Our industry is characterized by high demand and intense competition for talent and the pool of qualified candidates is limited. In addition, we have dedicated significant resources and effort to retain and recruit talents in the semiconductor industry, but there is no guarantee that we will be able to successfully compete with our peer companies in attracting qualified talents. We have entered into employment agreements with certain senior executives, but
23
we do not have employment agreements with most of our employees. Many of these employees could leave our company with little or no prior notice and would be free to work for a competitor. If one or more of our senior executives or other key personnel are unable or unwilling to continue in their present positions, we may not be able to replace them easily or at all and other senior management may be required to divert attention from other aspects of our business. In addition, we do not have “key person” life insurance policies covering any member of our management team or other key personnel. The loss of any of these individuals or our inability to attract or retain qualified personnel, including engineers and others, could adversely affect our product introductions, overall business growth prospects, results of operations and financial condition.
Failure to protect our patents and our other proprietary information could harm our business and competitive position.
Our success depends, in part, on our ability to protect our intellectual property. We rely on a combination of patent, copyright (including mask work protection), trademark and trade secret laws, as well as nondisclosure agreements, license agreements and other methods to protect our intellectual property rights, which may not be sufficient to protect our intellectual property. As of June 30, 2026, we owned 961 issued U.S. patents expiring between 2026 and 2044 and had 78 pending patent applications with the United States Patent and Trademark Office. In addition, we own patents and have filed patent applications in several jurisdictions outside of the U.S, including China, Taiwan, Japan and Korea.
Our patents and patent applications may not provide meaningful protection from our competitors, and there is no guarantee that patents will be issued from our patent applications. The status of any patent or patent application involves complex legal and factual determinations and the breadth of a claim is uncertain. In addition, our efforts to protect our intellectual property may not succeed due to difficulties and risks associated with:
•policing any unauthorized use of or misappropriation of our intellectual property, which is often difficult and costly and could enable third parties to benefit from our technologies without paying us;
•others independently developing similar proprietary information and techniques, gaining authorized or unauthorized access to our intellectual property rights, disclosing such technology or designing around our patents;
•the possibility that any patent or registered trademark owned by us may not be enforceable or may be invalidated, circumvented or otherwise challenged in one or more countries, which may limit our competitive advantages;
•uncertainty as to whether patents will be issued from any of our pending or future patent applications with the scope of the claims sought by us, if at all; and
•the possibility that intellectual property laws and confidentiality laws may not adequately protect our intellectual property rights, including, for example, in China where enforcement of China intellectual property-related laws have historically been less effective, primarily because of difficulties in enforcement and low damage awards.
We also rely on customary contractual protection with our customers, suppliers, distributors, employees and consultants, and we implement security measures to protect our trade secrets. We cannot assure you that these contractual protections and security measures will not be breached, that we will have adequate remedies for any such breach or that our suppliers, employees, distributors or consultants will not assert rights to intellectual property arising out of such contracts.
In addition, we have a number of third-party patent and intellectual property license agreements, one of which requires us to make ongoing royalty payments. In the future, we may need to obtain additional licenses, renew existing license agreements or otherwise replace existing technology. We are unable to predict whether these license agreements can be obtained or renewed or the technology can be replaced on acceptable terms, or at all.
Intellectual property disputes could result in lengthy and costly arbitration, litigation or licensing expenses or prevent us from selling our products.
As is typical in the semiconductor industry, we or our customers have received and may continue to receive claims of infringement from time to time or otherwise become aware of potentially relevant patents or other intellectual property rights held by other parties that may cover some of our technology, products and services or those of our end customers. The semiconductor industry is characterized by vigorous protection and pursuit of intellectual property rights which has resulted in protracted and expensive arbitration and litigation for many companies. Patent litigation has increased in recent years due to increased assertions made by intellectual property licensing entities or non-practicing entities and increasing competition and overlap of product functionality in our markets.
Any litigation or arbitration regarding patents or other intellectual property could be costly and time consuming and could divert our management and key personnel from our business operations. We have in the past and may from time to time in the future become involved in litigation that requires our management to commit significant resources and time. In
24
addition, as part of our strategy to diversify our serviceable markets, we launched several key product families and technologies to enable high efficiency power conversion solutions and we plan to develop and commercialize new products in other power semiconductor markets. Our entry into the commercial markets for high-voltage power semiconductors and other markets as a result of our diversification strategy may subject us to additional and increased risk of disputes or litigation relating to these products.
Because of the complexity of the technology involved and the uncertainty of litigation generally, any intellectual property arbitration or litigation involves significant risks. Any claim of intellectual property infringement against us may require us to:
•incur substantial legal and personnel expenses to defend the claims or to negotiate for a settlement of claims;
•pay substantial damages or settlement to the party claiming infringement;
•refrain from further development or sale of our products;
•attempt to develop non-infringing technology, which may be expensive and time consuming, if possible at all;
•enter into costly royalty or license agreements that might not be available on commercially reasonable terms or at all;
•cross-license our technology with a competitor to resolve an infringement claim, which could weaken our ability to compete with that competitor; and
•indemnify our distributors, end customers, licensees and others from the costs of and damages of infringement claims by our distributors, end customers, licensees and others, which could result in substantial expenses for us and damage our business relationships with them.
Any intellectual property claim or litigation against us harm our business, results of operations, financial condition and prospects.
Evolving export control regulations may adversely affect our business operations.
We expect that the U.S. export control regulations to evolve and change in response to the political and economic tension between the U.S. and China, including potential new export control regulations that may impose additional restrictions on our ability to continue to do business with certain customers in China and Asia. If such changes occur, we may be required to reduce shipments to certain Asian customers, adjust our business practices and incur additional costs to implement new export control compliance procedures, policies and programs, each of which will adversely affect our financial conditions and results of operations.
Global or regional economic, political and social conditions could adversely affect our business and operating results.
External factors such as potential terrorist attacks, acts of war, financial crises, such as the global or regional economic recession, or geopolitical and social turmoil in those parts of the world that serve as markets for our products could have significant adverse effect on our business and operating results in ways that cannot presently be predicted. Any future economic downturn or recession in the global economy in general and, in particular, on the economies in China, Taiwan and other countries where we market and sell our products, will have an adverse effect on our results of operations.
Our business operations could be significantly harmed by natural disasters or global epidemics.
We have research and development facilities located in Taiwan and the Silicon Valley in Northern California. Historically, these regions have been vulnerable to natural disasters and other risks, such as earthquakes, fires and floods, which may disrupt the local economy and pose physical risks to our property. We also have sales offices located in Taiwan and Japan where similar natural disasters and other risks may disrupt the local economy and pose physical risks to our operations. We are not currently covered by insurance against business disruption caused by earthquakes. In addition, we have manufacturing facilities in Oregon and Shanghai, which may be subject to disruption due to natural disasters such as flood and fire. In August 2026, our packaging and testing facilities in Shanghai were flooded due to a strong typhoon, which caused us to suspend production temporarily, and we also incurred additional costs relating to cleanup and outsourcing packaging capacity. We currently do not have redundant, multiple site capacity in the event of a natural disaster or other catastrophic event, and we may not be able to locate suitable replacement capacity in the event we suspend production. In the event of such an occurrence, our business and financial performance would be adversely affected.
25
Our business could be adversely affected by natural disasters such as epidemics, outbreaks or other health crisis. An outbreak of avian flu or H1N1 flu in the human population, or another similar health crisis similar to the COVID-19 pandemic, could adversely affect the economies and financial markets of many countries, particularly in Asia. Moreover, any related disruptions to transportation or the free movement of persons could hamper our operations and force us to close our offices temporarily.
The occurrence of any of the foregoing or other natural or man-made disasters could cause damage or disruption to us, our employees, operations, distribution channels, markets and customers, which could result in significant delays in deliveries or substantial shortages of our products and adversely affect our business results of operations, financial condition or prospects.
Our insurance may not cover all losses, including losses resulting from business disruption or product liability claims.
We have limited product liability, business disruption or other business insurance coverage for our operations. In addition, we do not have any business insurance coverage for our operations to cover losses that may be caused by litigation or natural disasters. Any occurrence of uncovered loss could harm our business, results of operations, financial condition and prospects.
Our international operations subject our company to risks not faced by companies without international operations.
We have adopted a global business model under which we maintain significant operations and facilities through our subsidiaries located in the U.S., China, Taiwan and Hong Kong. Our main research and development center is located in Silicon Valley, and our manufacturing and supply chain is located in China. We also have sales offices and customers throughout Asia, the U.S. and elsewhere in the world. Our international operations may subject us to the following risks:
•economic and political instability, including trade tension between the U.S. and China;
•costs and delays associated with transportations and communications;
•coordination of operations through multiple jurisdictions and time zones;
•fluctuations in foreign currency exchange rates;
•trade restrictions, changes in laws and regulations relating to, amongst other things, import and export tariffs, taxation, environmental regulations, land use rights and property; and
•the laws of, including tax laws, and the policies of the U.S. toward, countries in which we operate.
If we fail to maintain an effective internal control environment as well as adequate control procedures over our financial reporting, investor confidence may be adversely affected thereby affecting the value of our stock price.
We are required to maintain proper internal control over our financial reporting and adequate controls related to our disclosures. As defined in Rule 13a-15(f) under the Exchange Act, internal control over financial reporting is a process designed by, or under the supervision of the Chief Executive Officer and Chief Financial Officer, to provide reasonable assurance regarding the reliability of financial reporting and the preparation of financial statements for external purposes in accordance with generally accepted accounting principles. If we fail to maintain adequate controls, our business, the results of operations, financial condition and/or the value of our stock may be adversely impacted. In addition, if we identify material weakness in our internal control process, we may be required to incur additional costs to implement remedial measures, and public disclosure of material weaknesses may adversely affect the investors’ confidence in the quality of our financial disclosures, which may negatively impact trading price of our stock.
We are subject to the risk of increased income taxes and changes in existing tax rules.
We conduct our business in multiple jurisdictions, including Hong Kong, Macau, the U.S., China, Taiwan, South Korea, Japan, India, the United Kingdom and Germany. The calculation of our tax liabilities involves dealing with uncertainties in the application of complex tax laws and regulations in various taxing jurisdictions. Any of these jurisdictions may assert that we have unpaid taxes. Our effective tax rate was (21.0)%, 31.0% and (138.1)% for the fiscal years ended June 30, 2026, 2025 and 2024, respectively.
Any tax rate changes in the tax jurisdictions in which we operate could result in adjustments to our deferred tax assets, if applicable, which would affect our effective tax rate and results of operations. We base our tax position upon the anticipated nature and conduct of our business and upon our understanding of the tax laws of the various countries in which we have assets or conduct activities. However, our tax position is subject to review and possible challenge by tax authorities
26
and to possible changes in law, which may have a retroactive effect. In particular, various proposals over the years have been made to change certain U.S. tax laws relating to foreign entities with U.S. connections. In addition, the U.S. government has proposed various other changes to the U.S. international tax system, certain of which could adversely impact foreign-based multinational corporate groups, and increased enforcement of U.S. international tax laws.
It is possible that these or other changes in the U.S. tax laws, foreign tax laws, or proposed actions by international bodies such as the Organization of Economic Cooperation and Development (OECD) could significantly increase our U.S. or foreign income tax liability in the future, including as described further below in this risk factor.
In December 2017, the European Union (“EU”) identified certain jurisdictions (including Bermuda and Cayman Islands) which it considered had a tax system that facilitated offshore structuring by attracting profits without commensurate economic activity. In order to avoid EU “blacklisting”, both Bermuda and Cayman Islands enacted laws that require Bermuda and Cayman companies carrying on one or more “relevant activity” (including: banking, insurance, fund management, financing, leasing, headquarters, shipping, distribution and service center, intellectual property or holding company) to maintain a substantial economic presence in Bermuda and Cayman Islands in order to comply with the economic substance requirements. Effective from December 31, 2019, we have structured our activities to comply with the new law. However, the legislation remains subject to further clarification and interpretation by Bermuda and Cayman Islands authorities and, accordingly, there is no guarantee that we will be deemed to be compliant. Furthermore, this legislation may require us to make additional changes to the activities we carry on in Bermuda or Cayman Islands, which could increase our costs either directly in those locations or indirectly as a result of increased costs related to moving our operations to other jurisdictions. As a result, we are not able to determine the impact on our operations and net income as of the current period.
In addition, our subsidiaries provide products and services to, and may from time to time undertake certain significant transactions with, us and other subsidiaries in different jurisdictions. We have adopted transfer pricing arrangements for transactions among our subsidiaries. Related party transactions are generally subject to close review by tax authorities, including requirements that transactions be priced at arm's length and be adequately documented. If any tax authorities were successful in challenging our transfer pricing policies or other tax judgments, our income tax expense may be adversely affected and we could also be subject to interest and penalty charges which may harm our business, financial condition and operating results.
Further, the U.S. Congress, the EU, the OECD, and other government agencies in jurisdictions where we and our affiliates do business have had an extended focus on issues related to the taxation of multinational corporations. Our parent company is incorporated under the laws of Bermuda and is subject to Bermuda law with respect to taxation. Under current Bermuda law, the Company is not subject to any income or capital gains taxes in Bermuda. As we have previously disclosed, the Government of Bermuda announced in December 2023 that it enacted the Corporate Income Tax Act 2023, potentially imposing a 15% corporate income tax (CIT) on Bermuda companies that are within the scope of the CIT, that will be effective for tax years beginning on or after January 1, 2025. In particular, the CIT applies to multinational companies with annual revenue of 750 million Euros or more in the consolidated financial statements of the ultimate parent entity for at least two of the four fiscal years immediately preceding the fiscal year when the CIT may apply.
The Company did not generate more than 750 million Euro revenue in any of the four fiscal years before the tax year starting July 1, 2025. The Company continues to monitor and assess if and when it may be within the scope of the CIT. If we become subject to the Bermuda CIT, we may be subject to additional income taxes, which may adversely affect our financial position, results of operations and our overall business.
Our debt agreements include financial covenants that may limit our ability to pursue business and financial opportunities and subject us to risk of default.
We have entered into various debt agreements with certain financial institutions, which generally require us to maintain certain financial covenants that have the effect of limiting our ability to take certain actions, including actions to incur debt, repurchase stock, make certain investments and capital expenditures. As we continue to grow our business and expand our operations, we expect to incur additional indebtedness, including loan agreement or equipment leases, in order to fund such capital expenditures. These restrictions may limit our ability to pursue business and financial opportunities that are available or beneficial to us in response to changing and competitive economic environment, which may have an adverse effect on our financial conditions. In addition, a breach of any of these financial covenants, if not waived by the lenders, could trigger an event of default under the debt agreements, which may result in the acceleration of our indebtedness or the loss of our collateral used to secure such indebtedness.
The imposition of U.S. corporate income tax on our Bermuda parent and non-U.S. subsidiaries could adversely affect our results of operations.
27
We believe that our Bermuda parent and non-U.S. subsidiaries each operate in a manner that they would not be subject to U.S. corporate income tax because they are not engaged in a trade or business in the United States. Nevertheless, there is a risk that the U.S. Internal Revenue Service may assert that our Bermuda parent and non-U.S. subsidiaries are engaged in a trade or business in the United States. If our Bermuda parent and non-U.S. subsidiaries were characterized as being so engaged, we would be subject to U.S. tax at the regular corporate rates on our income that is effectively connected with U.S. trade or business, plus an additional 30% “branch profits” tax on the dividend equivalent amount, which is generally effectively connected income with certain adjustments, deemed withdrawn from the United States. Any such tax could materially and adversely affect our results of operations.
We may be classified as a passive foreign investment company (“PFIC”), which could result in adverse U.S. federal income tax consequences for U.S. holders.
Based on the current and anticipated valuation of our assets and the composition of our income and assets, we do not expect to be considered a PFIC, for U.S. federal income tax purposes for the foreseeable future. However, we must make a separate determination for each taxable year as to whether we are a PFIC after the close of each taxable year and we cannot assure you that we will not be a PFIC for our June 30, 2025 taxable year or any future taxable year. Under current law, a non-U.S. corporation will be considered a PFIC for any taxable year if either (1) at least 75% of its gross income is passive income or (2) at least 50% of the value of its assets, generally based on an average of the quarterly values of the assets during a taxable year, is attributable to assets that produce or are held for the production of passive income. PFIC status depends on the composition of our assets and income and the value of our assets, including, among others, a pro rata portion of the income and assets of each subsidiary in which we own, directly or indirectly, at least 25% by value of the subsidiary's equity interests, from time to time. Because we currently hold and expect to continue to hold a substantial amount of cash or cash equivalents, and because the calculation of the value of our assets may be based in part on the value of our common shares, which may fluctuate considerably given that market prices of technology companies historically often have been volatile, we may be a PFIC for any taxable year. If we were treated as a PFIC for any taxable year during which a U.S. holder held common shares, certain adverse U.S. federal income tax consequences could apply for such U.S. holder.
Changes in our United States federal income tax classification, or that of our subsidiaries, could result in adverse tax consequences to our 10% or greater U.S. shareholders.
The Tax Cuts and Jobs Act of 2017 (the “Tax Act”) may have changed the consequences to U.S. shareholders that own, or are considered to own, as a result of the attribution rules, 10% or more of the voting power or value of the stock of a non-U.S. corporation (a 10% U.S. shareholder) under the U.S. Federal income tax law applicable to owners of U.S. controlled foreign corporations, or CFCs.
Prior to the Tax Act, we did not believe that we, or any of our non-U.S. subsidiaries, were considered a CFC, which is a determination made daily based on whether the 10% U.S. shareholders together own, or are considered to own under the attribution rules, more than 50% of the voting power or value of a non-U.S. corporation. Under the Tax Act, however, because our group includes one or more U.S. subsidiaries, certain of our non-U.S. subsidiaries may be classified as CFCs with respect to any single 10% U.S. shareholder, even without regard to whether 10% U.S. shareholders together own, directly or indirectly, more than 50% of the voting power or value of the Company. Our 10% or greater U.S. shareholders should consult their individual tax advisors for advice regarding the Tax Act’s revision to the U.S. Federal tax law applicable to owners of CFCs.
Changes in tariffs and international trade policies affecting imports and exports may have a material adverse effect on our business operations and financial performance.
The U.S. has implemented, proposed, and continues to evaluate changes to tariffs and other international trade measures affecting imports and exports. Although the tariffs imposed in 2025 under the International Emergency Economic Powers Act (IEEPA) on U.S. imports from virtually all countries were ultimately invalidated by the U.S. Supreme Court in 2026, a global tariff regime was largely preserved through alternative tariff authorities, including Section 122 and Section 301 of the Trade Act of 1974. In response to tariffs announced by the U.S., certain U.S. trading partners including Japan, Taiwan, and Korea, have entered into agreements with the U.S. establishing revised tariff frameworks, while negotiations with other countries, including China, remain ongoing, and it is unclear what the final tariff rate may be. The U.S. has also undertaken actions under Section 232 of the Trade Expansion Act relating to semiconductor imports and continues to evaluate additional trade measures affecting semiconductors and semiconductor manufacturing equipment, the scope and impact of which remain uncertain. Such uncertainties and risks may negatively affect our ability to enter into new business transactions with partners, vendors and customers because of the lack of clarity on the economic benefits of such transactions. Significant increase in U.S. tariffs may increase the costs of materials, goods and components that we purchase from suppliers from other countries for the manufacturing and distribution of our products, which may adversely affect our financial performance. Also, we may not be able to mitigate the impact of tariffs by identifying and securing alternative sources in the U.S. for similar materials, goods and components at comparable qualities or more favorable prices. Furthermore, tariffs, or the threat of tariffs or increased tariffs, could have a significant negative impact on our business
28
relationships with customers, suppliers and partners in Asia, including China, Hong Kong, Taiwan, Korea and Japan. In addition to tariffs, evolving export controls, import restrictions, sanctions, licensing requirements and other trade measures may increase compliance costs, disrupt supply chains, restrict customer access or otherwise adversely affect our business. Any significant changes in trade policies and tariffs may also affect the business operations of our customers, suppliers and partners, which may cause them to take actions or make decisions that adversely affect our business operations and results of operations.
Risks Related to Doing Business in China
China’s economic, political and social conditions, as well as government policies, could affect our business and growth.
Our financial results have been, and are expected to continue to be, affected by the economy in China. If China’s economy is slowing down, it may negatively affect our business operation and financial results. The China economy differs from the economies of most developed countries in many respects, including:
•higher level of government involvement;
•early stage of development of a market-oriented economy;
•rapid growth rate;
•higher level of control over foreign currency exchange; and
•less efficient allocation of resources.
The Chinese economy has been transitioning from a planned economy to a more market-oriented economy. Although in recent years the Chinese government has implemented measures emphasizing the utilization of market forces for economic reform, the reduction of state ownership of productive assets and the establishment of corporate governance in business enterprises, the Chinese government continues to retain significant control over the business and productive assets in China. Any changes in China’s government policy or China’s political, economic and social conditions, or in relevant laws and regulations, may adversely affect our current or future business, results of operations or financial condition. These changes in government policy may be implemented through various means, including changes in laws and regulations, implementation of anti-inflationary measures, change of basic interest rate, changes in the tax rate or taxation system and the imposition of additional restrictions on currency conversion and imports. Furthermore, given China’s largely export-driven economy, any changes in the economies of China’s principal trading partners and other export-oriented nations may adversely affect our business, results of operations, financial condition and prospects.
Our ability to successfully expand our business operations in China depends on a number of factors, including macroeconomic and other market conditions, and credit availability from lending institutions. In response to the recent global and Chinese economic recession, the Chinese government has promulgated several measures aimed at expanding credit and stimulating economic growth. We cannot assure you that the various macroeconomic measures, monetary policies and economic stimulus package adopted by the Chinese government to guide economic growth will be effective in maintaining or sustaining the growth rate of the Chinese economy. If measures adopted by the Chinese government fail to achieve further growth in the Chinese economy, it may adversely affect our growth, business strategies and operating results. In addition, changes in political and social conditions of China may adversely affect our ability to conduct our business in the region. For example, geopolitical disputes and increased tensions between China and its neighboring countries in which we conduct business could make it more difficult for us to coordinate and manage our international operations in such countries.
Changes in China’s laws, legal protections or government policies on foreign investment in China may harm our business.
Our business and corporate transactions, including our operations through the JV Company, are subject to laws and regulations applicable to foreign investment in China as well as laws and regulations applicable to foreign-invested enterprises. These laws and regulations frequently change, and their interpretation and enforcement involve uncertainties that could limit the legal protections available to us. Regulations and rules on foreign investments in China impose restrictions on the means that a foreign investor like us may apply to facilitate corporate transactions we may undertake. In addition, the Chinese legal system is based in part on government policies and internal rules, some of which are not published on a timely basis or at all, that may have a retroactive effect. As a result, we may not be aware of our violation of these policies and rules until sometime after the violation. If any of our past operations are deemed to be non-compliant with Chinese law, we may be subject to penalties and our business and operations may be adversely affected. If we cannot obtain approval from relevant authorities to engage in businesses which become prohibited or restricted for foreign investors, we may be forced to
29
sell or restructure a business which has become restricted or prohibited for foreign investment. Furthermore, the Chinese government has broad discretion in dealing with violations of laws and regulations, including levying fines, revoking business and other licenses and requiring actions necessary for compliance. In particular, licenses and permits issued or granted to us by relevant governmental bodies may be revoked at a later time by higher regulatory bodies. If we are forced to adjust our corporate structure or business as a result of changes in government policy on foreign investment or changes in the interpretation and application of existing or new laws, our business, financial condition, results of operations and prospects may be harmed. Moreover, uncertainties in the Chinese legal system may impede our ability to enforce contracts with our business partners, customers and suppliers, or otherwise pursue claims in litigation to recover damages or loss of property, which could adversely affect our business and operations.
The continuing trade tensions between the U.S. and China may result in increased tariffs on imported goods from China that could adversely affect our business operations.
Since 2018, U.S. and China trade tensions led to higher and increasing tariffs imposed by both countries on the import of goods from the other country. The U.S. government used various authorities to implement tariffs on a variety of Chinese goods and materials, which, absent exemptions, include products and applications, including consumer electronics, that incorporate our power discrete and power IC products. In response, China has imposed tariffs on certain American products, and warned of additional actions if the U.S. imposes new or increased tariffs.
Since February 2025, the current U.S. administration has proposed to increase the total tariff level for imported Chinese goods significantly, and additional tariff increases could be imposed as the trade tensions between the two countries continue to heighten. On February 1, 2025, the United States imposed additional tariffs of 10% on all Chinese-origin goods, which was increased to 20% on March 4, 2025. On April 2, 2025, the U.S. announced that it was imposing a 34% “reciprocal tariff” on top of the existing 20%, raising the tariff on Chinese goods to 54% (which stacks on top of preexisting tariffs of 7.5%-100% on most Chinese-origin goods imposed under previous U.S. administrations). On April 9, 2025, China responded to U.S. tariff threats by hiking its levies on U.S. imports from 34% to 84%, and the U.S. then increased new tariffs on Chinese goods to 125%. On April 11, 2025, the U.S. announced that semiconductors would be exempt from the reciprocal tariffs, but this exemption does not impact the 20% tariff imposed in March. Later that same day, in a further retaliatory move, China increased tariffs on U.S. imports to 125%.
On May 12, 2025, the U.S. and China agreed to temporarily suspend most tariffs on each other’s goods for a 90-day period (“the 90-day truce”) in trade talks in Geneva. After the Geneva meetings, the new US tariffs on Chinese goods were reduced from 145% to 30%, while China’s retaliatory tariffs dropped from 125% to 10%. On August 11, 2025, the 90-day truce was extended until November 10, 2025 while the countries continue to engage in negotiations.
The continuing trade tensions could have significant adverse effects on world trade and the world economy. While the two countries are having trade talks, including the London trade talk in June and Stockholm trade talk in late July, the ultimate level of tariffs, the ultimate scope of them, and whether or how any proposed additional tariffs will impact our business is uncertain. We believe that the imposition of additional tariffs by the U.S. government on products incorporating our power semiconductors could deter our customers from purchasing our products originating from China. If so, this would reduce demand for our power semiconductor products or result in pricing adjustments that would lower our gross margin, which could have a material adverse effect on our business and results of operations.
Further, we cannot predict what additional actions, if any, may be taken with respect to tariffs or trade relations between the United States and China, or what actions may be taken by the China in retaliation. The adoption and expansion of trade restrictions, the occurrence of a trade war, or other governmental action related to tariffs, trade agreements or related policies have the potential to adversely impact our supply chain, access to equipment, our costs and our product margins.
Our China subsidiaries’ current corporate structure and business operations may be affected by the Foreign Investment Law of the PRC.
On March 15, 2019, the National People’s Congress of the PRC promulgated the Foreign Investment Law, which took effect on January 1, 2020, and replaced the existing laws regulating foreign investment in China, namely, the Sino-foreign Equity Joint Venture Enterprise Law, the Sino-foreign Cooperative Joint Venture Enterprise Law and the Wholly Foreign-invested Enterprise Law, together with their implementation rules and ancillary regulations. The Foreign Investment Law embodies a PRC regulatory trend to rationalize its foreign investment regulatory regime in line with prevailing international practice and the legislative efforts to unify the corporate legal requirements for both foreign and domestic investments. The Foreign Investment Law establishes the basic framework for the access, promotion, protection and administration of foreign investments in China in view of investment protection and fair competition. For example, treatment of foreign investors on a national level will be no less favorable than the treatment received by domestic investors unless such investments fall within a “negative list”. Crucially, the five-year transitional period mandated by the Foreign Investment Law for foreign-invested
30
enterprises (FIEs) to rectify and align their corporate governance structures with the domestic company law officially expired on December 31, 2024. Consequently, all FIEs in China must now fully comply with the new PRC Company Law (the “New Company Law”), which came into effect on July 1, 2024.
On June 28, 2018, the National Development and Reform Commission (the “NDRC”) and the Ministry of Commerce of the PRC (the “MOC”) published the Special Administrative Measures for Market Access of Foreign Investment (Negative List) (2018 Edition), which identifies specific sectors where foreign investors will be subject to special administrative measures. The Negative List has been updated a few times since its enactment in 2018 and the current effective Negative List (2024 Edition) took effect on November 1, 2024.
Under this unified regime, FIEs face dual layers of compliance friction. First, the PRC Foreign Investment Law provides that foreign-invested entities operating in “restricted” or “prohibited” industries will require market entry clearance and other approvals from relevant PRC government authorities. As the Negative List is updated from time to time, there can be no assurance that the China government will not change its policies in a manner that would render part or all of our business to fall within the restricted or prohibited categories. Second, under the New Company Law, FIEs are subject to rigorous new corporate governance and capital maintenance mandates.
If future laws, administrative regulations or provisions, particularly evolving statutory interpretations under the New Company Law or foreign investment information reporting obligations, mandate further actions to be taken by companies with respect to our business operation, we may face substantial uncertainties as to whether we can complete such actions in a timely manner, or at all. Failure to take timely and appropriate measures to cope with any of these or similar regulatory compliance challenges could materially and adversely affect our current corporate structure, corporate governance and business operations.
In addition, under the Foreign Investment Law, foreign investors or the foreign invested enterprise should report investment information on the principle of necessity. Any company found to be non-complaint with such investment information reporting obligation might be potentially subject to fines or administrative liabilities.
Limitations on our ability to transfer funds to our China subsidiaries could adversely affect our ability to expand our operations, make investments that could benefit our businesses and otherwise fund and conduct our business.
The transfer of funds from us to our China subsidiaries, either as a shareholder loan or as an increase in registered capital, is subject to registration with or approval by the Chinese governmental authorities, including the State Administration of Foreign Exchange (SAFE), the State Administration for Market Regulation (SAMR), and/or the relevant examination and approval authority. Our subsidiaries may also experience difficulties in converting our capital contributions made in foreign currencies into RMB due to changes in China’s foreign exchange control policies. Therefore, it may be difficult to change capital expenditure plans once the relevant funds have been remitted from us to our China subsidiaries. These limitations and the difficulties our China subsidiaries may experience on the free flow of funds between us and our China subsidiaries could restrict our ability to act in response to changing market situations in a timely manner.
China’s currency exchange control and government restrictions on investment repatriation may impact our ability to transfer funds outside of China.
A significant portion of our business is conducted in China where the currency is the RMB. Regulations in China permit foreign owned entities to freely convert the RMB into foreign currency for transactions that fall under the “current account,” which includes trade related receipts and payments, interest and dividends. Accordingly, our Chinese subsidiaries may use RMB to purchase foreign exchange for settlement of such “current account” transactions without pre-approval. However, pursuant to applicable regulations, foreign‑invested enterprises in China may pay dividends only out of their accumulated profits, if any, determined in accordance with Chinese accounting standards and regulations. A Chinese company must pay 10% of its annual after-tax profits to fund its statutory reserve fund unless it has reached 50% of the registered capital of the company. Where the accumulative amount of the company’s statutory reserve is not enough to make up for the losses of the previous year, the current year’s profits must first be used to make up for the losses before the statutory reserve is accrued.
Other transactions that involve conversion of RMB into foreign currency are classified as “capital account” transactions; examples of “capital account” transactions include repatriations of investment by or loans to foreign owners, or direct equity investments in a foreign entity by a China domiciled entity. “Capital account” transactions require prior approval from, or registration with SAFE or its provincial branch or its authorized banks to convert a remittance into a foreign currency, such as U.S. dollars, and transmit the foreign currency outside of China.
31
As a result of these and other restrictions under Chinese laws and regulations, our China subsidiaries are restricted in their ability to transfer a portion of their net assets to the parent. Such restricted portion amounted to approximately $94.0 million, or 11.8% of our total consolidated net assets attributed to the Company as of June 30, 2026. We have no assurance that the relevant Chinese governmental authorities in the future will not limit further or eliminate the ability of our China subsidiaries to purchase foreign currencies and transfer such funds to us to meet our liquidity or other business needs. Any inability to access funds in China, if and when needed for use by the Company outside of China, could have a material and adverse effect on our liquidity and our business.
The M&A Rules and certain other PRC regulations establish complex procedures for some acquisitions of Chinese companies by foreign investors, which could make it more difficult for us to pursue growth through acquisitions in China.
The Regulations on Mergers and Acquisitions of Domestic Companies by Foreign Investors, or the M&A Rules, adopted by six PRC regulatory agencies in August 2006 and amended in 2009, and some other regulations and rules concerning mergers and acquisitions established additional procedures and requirements that could make merger and acquisition activities by foreign investors more time consuming and complex, including requirements in some instances that the Ministry of Commerce (“MOC”) be notified in advance of any change-of-control transaction in which a foreign investor takes control of a PRC domestic enterprise. Moreover, the Anti-Monopoly Law requires that the State Administration for Market Regulation (“SAMR”), the anti-monopoly enforcement agency of the PRC, shall be notified in advance of any concentration of undertaking if certain thresholds are triggered. In addition, under the Measures for the Security Review of Foreign Investments jointly issued by the NDRC and the MOC, any foreign investment, including mergers and acquisitions, joint ventures, or greenfield investments, that raise “national defense and security” concerns, or those through which foreign investors may acquire de facto control over domestic enterprises in key sectors (such as critical technology and semiconductors) that raise “national security” concerns, are subject to strict review by the working mechanism office led by the NDRC. These rules prohibit any activities attempting to bypass a security review, including by structuring the transaction through a proxy or contractual control arrangement. On July 1, 2015, the National Security Law of China took effect, which provided that China would establish rules and mechanisms to conduct national security review of foreign investments in China that may impact national security. China’s Foreign Investment Law, which became effective in January 2020, reiterates that China will establish a security review system for foreign investments. On December 19, 2020, the NDRC and the MOC jointly issued the Measures for the Security Review of Foreign Investments (the “New FISR Measures”), which was made according to the National Security Law and the Foreign Investment Law of China and became effective on January 18, 2021. The New FISR Measures further expand the scope of national security review on foreign investment compared to the existing rules, while leaving substantial room for interpretation and speculation. In the future, we may grow our business by acquiring complementary businesses. Complying with the requirements of the above-mentioned regulations and other relevant rules to complete such transactions could be time consuming, and any required approval processes, including obtaining approval from the competent Chinese authorities or its local counterparts may delay or inhibit our ability to complete such transactions, which could affect our ability to expand our business or maintain our market share.
Our results of operations may be negatively impacted by fluctuations in foreign currency exchange rates between U.S. dollar and RMB.
While U.S. dollars is our main functional currency and our revenue and a significant portion of our operating expenses are denominated in U.S. dollars, we are required to maintain local currencies, primarily the RMB, in our cash balances in connection with the funding of our overseas operations. As a result, our costs and operating expenses may be exposed to adverse movements in foreign currency exchange rates between the U.S. dollar and RMB. We also do not utilize any financial instruments to hedge or reduce potential losses due to the fluctuation of foreign currency exchange rates. In general, any appreciation of U.S. dollars against a weaker RMB could reduce the value of our cash and cash equivalent balance, which could increase our operating expenses and negatively affect our cash flow, income and profitability. The value of RMB against the U.S. dollars may fluctuate and is affected by many factors outside of our control, including changes in political and economic conditions, implementation of new monetary policies by the Chinese government and changes in banking regulations, and there is no guarantee that we will be able to mitigate or recoup any losses due to a significant fluctuation in the U.S. dollar/RMB exchange rates.
PRC labor laws may adversely affect our results of operations.
The Chinese government promulgated the Labor Contract Law of the PRC, effective on January 1, 2008, which was amended on December 28, 2012 and the amended law became effective on July 1, 2013, to govern the establishment of employment relationships between employers and employees, and the conclusion, performance, termination of and the amendment to employment contracts. The Labor Contract Law imposes greater liabilities on employers and significantly affects the cost of an employer’s decision to reduce its workforce. Further, it requires that certain termination decisions be based upon seniority and not merit. In the event our subsidiaries decide to significantly change or decrease their workforce in China, the Labor Contract Law could adversely affect their ability to effect such changes in a manner that is most
32
advantageous to our business or in a timely and cost-effective manner, thus materially and adversely affecting our financial condition and results of operations.
In recent years, compensation in various industries in China has increased and may continue to increase in the future. In order to attract and retain skilled personnel, we may need to increase the compensation of our employees. Compensation may, also, increase as inflationary pressure increases in China. In addition, under the Regulations on Paid Annual Leave for Employees, which became effective on January 1, 2008, employees who have served more than one year for a specific employer are entitled to a paid vacation ranging from 5 to 15 days, depending on length of service. Employees who waive such vacation time at the request of employers must be compensated for three times their normal salaries for each waived vacation day. This mandated paid-vacation regulation, coupled with the trend of increasing compensation, may result in increase in our employee-related costs and expenses and decrease in our profit margins.
Our business operations in China are subject to complex and evolving PRC data security, data privacy, and cybersecurity laws, and any non-compliance could subject us to severe penalties, operational disruptions, or structural changes.
In recent years, the PRC government has significantly tightened its regulatory framework governing cybersecurity, data security, and personal information protection. The PRC Data Security Law and the PRC Personal Information Protection Law (“PIPL”), impose stringent compliance requirements on data processing activities, including data collection, storage, usage, and particularly the cross-border transfer of data.
Under the Data Security Law, data is categorized based on its importance to national security and public interests. Companies handling “Important Data” (which may include critical operational, supply chain, or technical data within the semiconductor sector) are subject to heightened security obligations and must undergo mandatory security assessments before transferring such data outside of China. Furthermore, the Cyberspace Administration of China (“CAC”) enforces regulations regarding the cross-border transfer of personal information, requiring companies that meet certain thresholds to execute standard contracts formulated by the CAC or undergo a formal security assessment.
Because we operate through our subsidiaries in China, our daily operations involve continuous cross-border data flows, including the transmission of engineering data, customer order details, financial records, and employee personal information between China, the U.S., and other global jurisdictions. While the PRC regulatory authorities have introduced certain data facilitation measures for foreign-invested enterprises, the interpretation and enforcement of what constitutes “Important Data” or “critical infrastructure data” in the semiconductor industry involve significant uncertainties.
If our data processing and cross-border data transfer practices are deemed non-compliant with these evolving regulations, we could face severe administrative penalties, including:
•Substantial fines and monetary sanctions levied against our subsidiaries and executive officers;
•The suspension or revocation of our operating licenses and permits in China;
•Mandatory rectification orders that could force us to isolate our China-based IT systems and networks from our global corporate infrastructure; or
•Temporary or permanent restrictions on transferring necessary technical and operational data out of China, which would severely disrupt our global supply chain management, design collaborations, and financial reporting capabilities.
Additionally, the PRC Cybersecurity Review Measures require certain operators of critical information infrastructure or data processors to undergo a cybersecurity review when engaging in data processing activities that affect or may affect national security. Any future regulatory determination that places our operations, customers, or suppliers within the scope of these restrictive measures could materially and adversely affect our business, financial condition, results of operations, and the market value of our common shares.
Relations between Taiwan and China could negatively affect our business, financial condition and operating results and, therefore, the market value of our common shares.
Taiwan has a unique international political status. China does not recognize the sovereignty of Taiwan. Although significant economic and cultural relations have been established during recent years between Taiwan and China, relations have often been strained. A substantial number of our key customers and some of our essential sales and engineering personnel are located in Taiwan, and we have a large number of operational personnel and employees located in China.
33
Therefore, factors affecting military, political or economic relationship between China and Taiwan could have an adverse effect on our business, financial condition and operating results.
Risks Related to Our Corporate Structure and Our Common Shares
Our share price may be volatile and you may be unable to sell your shares at or above the purchase price, if at all.
Limited trading volumes and liquidity of our common shares on the NASDAQ Global Select Market may limit the ability of shareholders to purchase or sell our common shares in the amounts and at the times they wish. In addition, the financial markets in the United States and other countries have experienced significant price and volume fluctuations, and market prices of technology companies have been and continue to be extremely volatile. The trading price of our common shares on The NASDAQ Global Select Market ranged from a low of $17.47 to high of $53.32 from July 1, 2025 to June 30, 2026. At July 31, 2026, the trading price of our common shares was $31.74. Volatility in the price of our shares may be caused by factors outside our control and may be unrelated or disproportionate to our operating results.
The market price for our common shares may be volatile and subject to wide fluctuations in response to factors including:
•actual or anticipated fluctuations in our operating results;
•general economic, industry, regional and global market conditions, including the economic conditions of specific market segments for our products, including the PC markets;
•our failure to meet analysts’ expectations, including expectation regarding our revenue, gross margin and operating expenses;
•changes in financial estimates and outlook by securities research analysts;
•our ability to increase our gross margin;
•announcements by us or our competitors of new products, acquisitions, strategic partnerships, joint ventures or capital commitments;
•announcements of technological or competitive developments;
•announcement of acquisition, partnership and major corporate transactions;
•regulatory developments in our target markets affecting us, our customers or our competitors;
•our ability to enter into new market segments, gain market share, diversify our customer base and successfully secure manufacturing capacity;
•announcements regarding intellectual property disputes or litigation involving us or our competitors;
•changes in the estimation of the future size and growth rate of our markets;
•announcement of significant legal proceedings, litigation or government investigation;
•additions or departures of key personnel;
•repurchase of shares under our repurchase program;
•announcement of sales of our securities by us or by our major shareholders;
•general economic or political conditions in China and other countries in Asia; and
•other factors.
In the past, securities class action litigation has often been brought against a company following periods of volatility in such company’s share price. This type of litigation could result in substantial costs and divert our management's attention and resources which could negatively impact our business and financial conditions. See Item 3. Legal Proceeding.
If securities or industry analysts adversely change their recommendations regarding our common shares or if our operating results do not meet their expectations, the trading price of our common shares could decline.
The market price of our common shares is influenced by the research and reports that industry or securities analysts publish about us or our business. There is no guarantee that these analysts will understand our business and results, or that their reports will be accurate or correctly predict our operating results or prospects. If one or more of these analysts cease coverage of our company or fail to publish reports on us regularly, we could lose visibility in the financial markets, which in turn could cause the market price of our common shares or its trading volume to decline. Moreover, if one or more of the
34
analysts who cover our company downgrade our common shares or if our operating results or prospects do not meet their expectations, the market price of our common shares could decline significantly.
Anti-takeover provisions in our bye-laws could make an acquisition of us more difficult and may prevent attempts by our shareholders to replace or remove our current management.
Certain provisions in our bye-laws may delay or prevent an acquisition of us or a change in our management. In addition, by making it more difficult for shareholders to replace members of our board of directors, these provisions also may frustrate or prevent any attempts by our shareholders to replace or remove our current management because our board of directors is responsible for appointing the members of our management team. These provisions include:
•the ability of our board of directors to determine the rights, preferences and privileges of our preferred shares and to issue the preferred shares without shareholder approval;
•advance notice requirements for election to our board of directors and for proposing matters that can be acted upon at shareholder meetings; and
•the requirement to remove directors by a resolution passed by at least two-thirds of the votes cast by the shareholders having a right to attend and vote at the shareholder meeting.
These provisions could make it more difficult for a third-party to acquire us, even if the third-party’s offer may be considered beneficial by many shareholders. As a result, shareholders may be limited in their ability to obtain a premium for their shares.
We are a Bermuda company and the rights of shareholders under Bermuda law may be different from U.S. laws.
We are a Bermuda limited liability exempted company. As a result, the rights of holders of our common shares will be governed by Bermuda law and our memorandum of association and bye-laws. The rights of shareholders under Bermuda law may differ from the rights of shareholders of companies incorporated in other jurisdictions, including the U.S. For example, some of our directors are not residents of the United States, and a substantial portion of our assets are located outside the United States. As a result, it may be difficult for investors to effect service of process on those persons in the U.S. or to enforce in the U.S. judgments obtained in U.S. courts against us or those persons based on civil liability provisions of the U.S. securities laws. It is doubtful whether courts in Bermuda will enforce judgments obtained in other jurisdictions, including the U.S., against us or our directors or officers under the securities laws of those jurisdictions or entertain actions in Bermuda against us or our directors or officers under the securities laws of other jurisdictions.
35
Item 1B.Unresolved Staff Comments
None.
36
Item 1C Cybersecurity
Risk Management and Strategy
We use third-party service providers in various functions throughout our business. We have implemented stringent processes to oversee and manage cybersecurity risk with these third parties, which includes risk assessment activities, enforcement of policies to ensure compliance with current cybersecurity standards and monitoring activities, and periodic review of potential cyber breaches announcements made by the third-party service providers .
Governance
37
•Oversight of policies, procedures, plans, and execution intended to provide security, confidentiality, availability, and integrity of the information.
•Oversight of the quality and effectiveness of the Company’s policies and procedures with respect to its IT systems;
•Review and oversight on policies and procedures of the Company in preparation for responding to cybersecurity incidents.
•Oversight of risks related to IT systems and processes, including privacy, network security and data security, and any internal audits of such systems and processes.
•Review and oversight of preparation of the Company’s public disclosures, including SEC filings, relating to the Company’s IT systems, including privacy, network security, and data security, and
38
Item 2. Properties
As of July 31, 2026, our primary U.S. facility, which houses our research and design function, as well as elements of marketing and administration, is located in Sunnyvale, California. We conduct our manufacturing, research and development, sales and marketing and administration in Asia and North America. We lease all properties used in our business except the wafer fabrication facility in Oregon was acquired in January 2012. The following table sets forth the location, size and primary use of our principal properties that are material to our business operations:
| Location | Square Footage | Primary Use | ||||||||||||
| 475 Oakmead Parkway Sunnyvale, California, USA 94085 | 57,000 | Research and development, marketing, sales and administration | ||||||||||||
| 3131 Northeast Brookwood Parkway Hillsboro, Oregon, USA 97124 | 252,950 | Wafer fabrication facility | ||||||||||||
| Building 1/2 and 8/9, No. 91, Lane 109, Rongkang Road, Songjiang District, Shanghai, China 201614 | 221,301 | Packaging and testing, manufacturing support | ||||||||||||
| Building 1,2,3 No.135 Rongkang Road, Songjiang District, Shanghai,China 201614 | 250,978 | Packaging and testing, manufacturing support | ||||||||||||
We believe that our current facilities are adequate and that additional space will be available on commercially reasonable terms for the foreseeable future.
39
Item 3.Legal Proceedings
We have in the past, and may from time to time in the future, become involved in legal proceedings arising from the normal course of business activities. The semiconductor industry is characterized by frequent claims and litigation, including claims regarding patent and other intellectual property rights as well as improper hiring practices. Irrespective of the validity of such claims, we could incur significant costs in the defense thereof or could suffer adverse effects on our operations.
Item 4. Mine Safety Disclosures
Not Applicable.
40
PART II
Item 5.Market for Registrant's Common Equity, Related Stockholder Matters and Issuer Purchases of Equity Securities
Our common shares have traded on the NASDAQ Global Select Market since April 29, 2010 under the symbol AOSL. As of July 31, 2026, there were approximately 157 holders of record of our common shares, not including those shares held in a street or nominee name.
Dividend Policy
We have never declared or paid cash dividends on our common shares. We currently intend to retain all available funds and any future earnings for use in the operation of our business and do not anticipate paying any dividends on our common share in the foreseeable future. Any future determination to declare dividends will be made at the discretion of our board of directors and will depend on our financial condition, operating results, capital requirements, general business conditions and other factors that our board of directors may deem relevant.
Securities Authorized for Issuance Under Equity Compensation Plans
See Item 12 of Part III of this report regarding information about securities authorized for issuance under our equity compensation plans.
Share Performance Graph
The following graph compares the total cumulative shareholder return on our common shares with the total cumulative return of the NASDAQ Composite Index and the Philadelphia Semiconductor Index for the last five fiscal years ended June 30, 2026, assuming an investment of $100 at the beginning of such period and the reinvestment of any dividends.
The comparisons in the graph below are required by the SEC and are not intended to forecast or be indicative of possible future performance of our common shares.
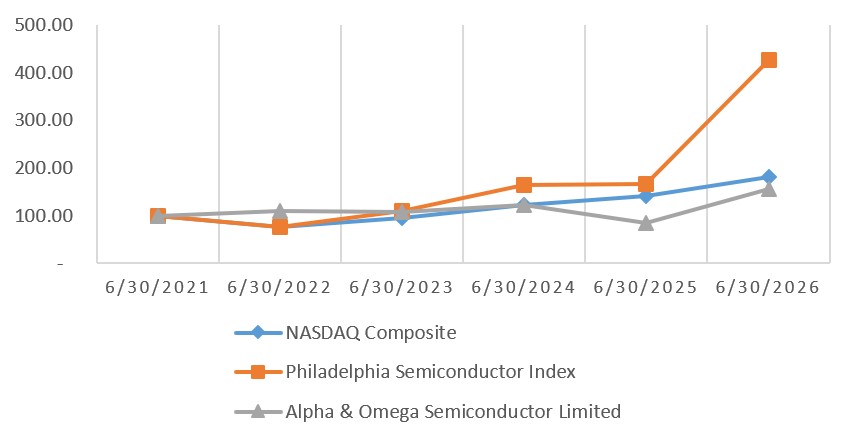
The above Share Performance Graph and related information shall not be deemed “soliciting material” or to be “filed” with the Securities and Exchange Commission, nor shall such information be incorporated by reference into any future filing under the Securities Act of 1933 or Securities Exchange Act of 1934, each as amended, except to the extent that the Company specifically incorporates it by reference into such filing.
Purchases of Equity Securities by the Issuer and Affiliated Purchasers
During the fourth quarter of fiscal year 2026, the Company did not repurchase any common shares.
41
Item 6. [Reserved]
42
Item 7.Management’s Discussion and Analysis of Financial Condition and Results of Operations
You should read the following discussion of the financial condition and results of our operations in conjunction with our consolidated financial statements and the notes to those statements included elsewhere in this annual report. Our consolidated financial statements contained in this annual report are prepared in accordance with U.S. GAAP.
Overview
We are a designer, developer, and global supplier of a broad range of discrete power devices, wide band gap power devices, power management ICs and modules, including a wide portfolio of Power MOSFET, SiC, IGBT, IPM, TVS, HV Gate Drivers, Power IC, and Digital Power products. Our portfolio of power semiconductors includes approximately 2,900 products, and has grown with the introduction of over 70 new products in the fiscal year ended June 30, 2026, and over 100 new products in the fiscal years ended June 30, 2025 and 2024, respectively. Our teams of scientists and engineers have developed extensive intellectual properties and technical knowledge that encompass major aspects of power semiconductors, which we believe enables us to introduce and develop innovative products to address the increasingly complex power requirements of advanced electronics. We have an extensive patent portfolio that consists of 961 patents and 78 patent applications in the United States as of June 30, 2026. We also have a total of 991 foreign patents, which primarily were based on our research and development efforts through June 30, 2026. We differentiate ourselves by integrating our expertise in technology, design and advanced manufacturing and packaging to optimize product performance and cost. Our portfolio of products targets high-volume applications, including personal computers, graphic cards, game consoles, home appliances, power tools, smart phones, battery packs, consumer and industrial motor controls and power supplies for computers, servers and telecommunications equipment. During fiscal year 2026, we accelerated the development of new technology platforms which allowed us to introduce 20 medium and high voltage MOSFET products, targeting primarily the power supply markets and industrial markets, 8 low voltage MOSFET products primarily for the communication market, as well as 32 Power IC products for computing applications market.
Our business model leverages global resources, including research and development and manufacturing in the United States and Asia. Our sales and technical support teams are localized in several growing markets. We operate an 8-inch wafer fabrication facility located in Hillsboro, Oregon, or the Oregon Fab, which is critical for us to accelerate proprietary technology development, new product introduction and improve our financial performance. To meet the market demand for the more mature high volume products, we also utilize the wafer manufacturing capacity of selected third party foundries. For assembly and test, we primarily rely upon our in-house facilities in China. In addition, we utilize subcontracting partners for industry standard packages. We believe our in-house packaging and testing capability provides us with a competitive advantage in proprietary packaging technology, product quality, cost and sales cycle time.
On March 29, 2016, we formed a joint venture (the “JV Company”) with two investment funds owned by the Municipality of Chongqing (the “Chongqing Funds”), for the purpose of constructing and operating a power semiconductor packaging, testing and 12-inch wafer fabrication facility (“Fab”) in the LiangJiang New Area of Chongqing, China in which we initially owned 50.9%, and the Chongqing Funds owned 49.1% of the equity interest in the JV Company. From December 2021 to June 2025, we completed several transactions to sell additional equity interests of the JV Company to third-party investors, while the JV Company also issued additional equity interests to new investors that diluted our ownership interest. Accordingly, as of June 30, 2025, the percentage of outstanding JV equity interest beneficially owned by us was further reduced to 39.2%.
On July 14, 2025, we entered into an equity transfer agreement with a strategic investor to sell approximately 20.3% of outstanding equity interest in the JV Company held by us for an aggregate cash consideration of $150 million to be paid in four installments, subject to satisfaction of certain conditions. On August 29, 2025, the amended Shareholders’ agreement for the JV Company was signed, which reduced our equity interest in the JV Company by 20.3% to an ownership percentage of 18.9%. As of June 30, 2026, all of the conditions were satisfied, and we received all installment payments. We believe this sale provides additional and significant capital for us to continue investment in technology, new product development and acquisition of assets complementary to our business operations, which will facilitate and accelerate our efforts to develop and distribute innovative and diverse power semiconductor products to customers worldwide.
In addition, the JV Company will continue to provide us with a significant level of foundry and packaging capacity to enable us to develop and manufacture our products. Pursuant to an agreement with the JV Company and other shareholders of the JV Company, the JV Company is committed to providing us with a specified level of monthly wafer production capacity.
Other Factors Affecting Our Performance
The global, regional economic and PC market conditions: Because our products primarily serve consumer electronic applications, any significant changes in global and regional economic conditions could materially affect our revenue and results of operations. A significant amount of our revenue is derived from sales of products in the PC markets, such as notebooks,
43
motherboards and notebook battery packs. Therefore, a substantial decline in the PC market could have a material adverse effect on our revenue and results of operations. The PC markets have experienced a modest global decline in recent years due to continued growth of demand in tablets and smart phones, worldwide economic conditions and the industry inventory correction which had and may continue to have a material impact on the demand for our products. In addition, the PC market may be affected by evolving laws and regulations governing international trade, such as export control regulations.
In 2024, the semiconductor industry was impacted by a global memory chip shortage, which has intensified through the first half of 2026, and such shortages have materially affected the market for power semiconductor products we sell. Driven by the concentration of manufacturing capacity — particularly for high-bandwidth memory used in AI applications — among a limited number of manufacturers, DRAM prices increased significantly. These cost increases have elevated the retail prices of personal computers, laptops, and related devices, reducing consumer affordability and contributing to an expected decline in the worldwide PC market.
A decline of the PC market may have a negative impact on our revenue, factory utilization, gross margin, our ability to resell excess inventory, and other performance measures. We have executed and continue to execute strategies to diversify our product portfolio, penetrate other market segments, including the consumer, communications and industrial markets, and improve gross margins and profit by implementing cost control measures. While making efforts to reduce our reliance on the computing market, we continue to support our computing business and capitalize on the opportunities in this market with a more focused and competitive PC product strategy to gain market share.
Manufacturing costs and capacity availability: Our gross margin is affected by a number of factors including our manufacturing costs, utilization of our manufacturing facilities, the product mixes of our sales, pricing of wafers from third party foundries and pricing of semiconductor raw materials. Capacity utilization affects our gross margin because we have certain fixed costs at our Shanghai facilities and our Oregon Fab. If we are unable to utilize our manufacturing facilities at a desired level, our gross margin may be adversely affected. In addition, from time to time, we may experience wafer capacity
constraints, particularly at third party foundries, that may prevent us from meeting fully the demand of our customers. While we can mitigate these constraints by increasing and re-allocating capacity at our own fab, we may not be able to do so quickly or at sufficient level, which could adversely affect our financial conditions and results of operations. We also rely on third parties to provide foundry capacity to manufacture our products, including the JV Company, therefore it is important that we maintain continuous access to such capacity, which may not be available at sufficient level or at pricing terms favorable. If these third-party foundries, take actions or make decisions that prevent us from accessing required capacity, our operations may be adversely affected.
Erosion and fluctuation of average selling price: Erosion of average selling prices of established products is typical in our industry. Consistent with this historical trend, we expect our average selling prices of our existing products to decline in the future. However, in the normal course of business, we seek to offset the effect of declining average selling price by introducing new and higher value products, expanding existing products for new applications and new customers and reducing the manufacturing cost of existing products. These strategies may cause the average selling price of our products to fluctuate significantly from time to time, thereby affecting our financial performance and profitability.
Product introductions and customers’ product requirements: Our success depends on our ability to introduce products on a timely basis that meet or are compatible with our customers' specifications and performance requirements, including our Tier 1 customers who often have stringent requirements. Both factors, timeliness of product introductions and conformance to customers' requirements, are equally important in securing design wins with our customers. As we accelerate the development of new technology platforms, we expect to increase the pace at which we introduce new products and seek and acquire design wins. If we were to fail to introduce new products on a timely basis that meet customers’ specifications and performance requirements, particularly those products with major OEM customers, and continue to expand our serviceable markets, then we would lose market share and our financial performance would be adversely affected.
Distributor ordering patterns, customer demand and seasonality: Our distributors place purchase orders with us based on their forecasts of end customer demand, and this demand may vary significantly depending on the sales outlook and market and economic conditions of end customers. Because these forecasts may not be accurate, channel inventory held at our distributors may fluctuate significantly, which in turn may prompt distributors to make significant adjustments to their purchase orders placed with us. As a result, our revenue and operating results may fluctuate significantly from quarter to quarter. In addition, because our products are used in consumer electronics products, our revenue is subject to seasonality. Our sales seasonality is affected by numerous factors, including global and regional economic conditions as well as the PC market conditions, revenue generated from new products, changes in distributor ordering patterns in response to channel inventory adjustments and end customer demand for our products and fluctuations in consumer purchase patterns prior to major holiday seasons. Typically, we generate lower revenue during the first quarter of the calendar year as compared to other quarters. However, broad fluctuations in the semiconductor markets and the global and regional economic conditions, in particular the changing PC market conditions, have had a more significant impact on our results of operations than seasonality. Furthermore, our revenue may be impacted by the level of demand from our major customers due to factors outside of our control. If these major customers
44
experience significant decline in the demand of their products, encounter difficulties or defects in their products, or otherwise fail to execute their sales and marketing strategies successfully, it may adversely affect our revenue and results of operations.
Principal line items of statements of operations
The following describes the principal line items set forth in our consolidated statements of operations:
Revenue
We generate revenue primarily from the sale of power semiconductors, consisting of power discretes and power ICs. Historically, a majority of our revenue has been derived from power discrete products. Because our products typically have three-year to five-year life cycles, the rate of new product introduction is an important driver of revenue growth over time. We believe that expanding the breadth of our product portfolio is important to our business prospects, because it provides us with an opportunity to increase our total bill-of-materials within an electronic system and to address the power requirements of additional electronic systems. In addition, a small percentage of our total revenue is generated by providing packaging and testing services to third parties through one of our in-house facilities.
Our product revenue is reported net of the effect of the estimated stock rotation returns and price adjustments that we expect to provide to our distributors. Stock rotation returns are governed by contract and are limited to a specified percentage of the monetary value of products purchased by the distributor during a specified period. At our discretion or upon our direct negotiations with the original design manufacturers or original equipment manufacturers, we may elect to grant special pricing that is below the prices at which we sold our products to the distributors. In certain situations, we will grant price adjustments to the distributors reflecting such special pricing. We estimate the price adjustments for inventory at the distributors based on factors such as distributor inventory levels, forecasted distributor selling prices, distributor margins and demand for our products.
In February 2023, we entered into a license agreement with a customer to license our proprietary SiC technology and provided 24-months of engineering and development services for a total fee of $45.0 million. The license and development fee required significant integration to create a combined output to the customer and was determined to be one performance obligation and was recognized over the 24 months during which we performed the engineering and development services. We use the input method to measure progress and recognize revenue, based on the effort expended relative to the estimated total effort to satisfy the performance obligation. As of June 30, 2025, all revenue has been recognized and all consideration was received associated with the license agreement, therefore we no longer have any obligations under the license agreement. During the fiscal years ended June 30, 2026, 2025 and 2024, we recorded $0.0 million, $13.8 million and $21.2 million of license and development revenue, respectively.
Cost of goods sold
Our cost of goods sold primarily consists of costs associated with semiconductor wafers, packaging and testing, personnel, including share-based compensation expense, overhead attributable to manufacturing, operations and procurement, and costs associated with yield improvements, capacity utilization, warranty and valuation of inventories. As the volume of sales increases, we expect cost of goods sold to increase. While our utilization rates cannot be immune to the market conditions, our goal is to make them less vulnerable to market fluctuations. We believe our market diversification strategy and product growth will drive higher volume of manufacturing which will improve our factory utilization rates and gross margin in the long run.
Operating expenses
Our operating expenses consist of research and development, and selling, general and administrative expenses. We expect our operating expenses as a percentage of revenue to fluctuate from period to period as we continue to exercise cost control measures in response to the declining PC market as well as align our operating expenses to the revenue level.
Research and development expenses. Our research and development expenses consist primarily of salaries, bonuses, benefits, share-based compensation expense, expenses associated with new product prototypes, travel expenses, fees for engineering services provided by outside contractors and consultants, amortization of software and design tools, depreciation of equipment and overhead costs. We continue to invest in developing new technologies and products utilizing our own fabrication and packaging facilities as it is critical to our long-term success. We also evaluate appropriate investment levels and stay focused on new product introductions to improve our competitiveness. We expect that our research and development expenses will fluctuate from time to time.
45
Selling, general and administrative expenses. Our selling, general and administrative expenses consist primarily of salaries, bonuses, benefits, share-based compensation expense, product promotion costs, occupancy costs, travel expenses, expenses related to sales and marketing activities, amortization of software, depreciation of equipment, maintenance costs, other expenses for general and administrative functions, and costs for outside professional services, including legal, audit and accounting services, as well as impairment of long-lived assets. We review all long-lived assets whenever events or changes in circumstance indicate that these assets may not be recoverable. When evaluating long-lived assets, if we conclude that the estimated undiscounted cash flows attributable to the assets are less than their carrying value, we recognize an impairment loss based on the excess of the carrying amount of the assets over their respective fair values. We expect our selling, general and administrative expenses to fluctuate in the near future as we continue to exercise cost control measures.
Income tax expense
We are subject to income taxes in various jurisdictions. Significant judgment and estimates are required in determining our worldwide income tax expense. The calculation of tax liabilities involves dealing with uncertainties in the application of complex tax regulations of different jurisdictions globally. We establish accruals for potential liabilities and contingencies based on a more likely than not threshold to the recognition and de-recognition of uncertain tax positions. If the recognition threshold is met, the applicable accounting guidance permits us to recognize a tax benefit measured at the largest amount of tax benefit that is more likely than not to be realized upon settlement with a taxing authority. If the actual tax outcome of such exposures is different from the amounts that were initially recorded, the differences will impact the income tax and deferred tax provisions in the period in which such determination is made. Changes in the location of taxable income (loss) could result in significant changes in our income tax expense.
We record a valuation allowance against deferred tax assets if it is more likely than not that a portion of the deferred tax assets will not be realized, based on historical profitability and our estimate of future taxable income in a particular jurisdiction. Our judgments regarding future taxable income may change due to changes in market conditions, changes in tax laws, tax planning strategies or other factors. If our assumptions and consequently our estimates change in the future, the deferred tax assets may increase or decrease, resulting in corresponding changes in income tax expense. Our effective tax rate is highly dependent upon the geographic distribution of our worldwide profits or losses, the tax laws and regulations in each geographical region where we have operations, the availability of tax credits and carry-forwards and the effectiveness of our tax planning strategies.
Bermuda Corporate Income Tax for Tax Years Beginning in 2025
The Company is subject to income tax expense or benefit based upon pre-tax income or loss reported in the consolidated statements of income (loss) and the provisions of currently enacted tax laws. The parent company is incorporated under the laws of Bermuda and is subject to Bermuda law with respect to taxation. Under current Bermuda law, the Company is not subject to any income or capital gains taxes in Bermuda. As we have previously disclosed, the Government of Bermuda announced in December 2023 that it enacted the Corporate Income Tax Act 2023, potentially imposing a 15% corporate income tax (CIT) on Bermuda companies that are within the scope of the CIT, that will be effective for tax years beginning on or after January 1, 2025. In particular, the CIT applies to multinational companies with annual revenue of 750 million euros or more in the consolidated financial statements of the ultimate parent entity for at least two of the four fiscal years immediately preceding the fiscal year when the CIT may apply.
The Company did not generate more than 750 million euro revenue in any of the four fiscal years before the tax year starting July 1, 2025. The Company continues to monitor and assess if and when it may be within the scope of the CIT. If we become subject to the Bermuda CIT, we may be subject to additional income taxes, which may adversely affect our financial position, results of operations and our overall business.
One Big Beautiful Bill Act, Enacted July 4, 2025
On July 4, 2025, H.R. 1, commonly known as the One Big Beautiful Bill Act (the “OBBB”), was signed into law. This includes significant changes to the federal corporate tax provisions and extends certain otherwise expiring provisions of the 2017 Tax Cuts and Jobs Act. The key provisions include allowing immediate expensing of domestic research and experimental expenditures, new limitations on interest expense deductibility, reinstatement of 100% bonus depreciation for qualified assets placed in service in the United States after January 19, 2025 as well as changes to the calculation of taxable income resulting from the foreign derived intangible income deduction.
Equity method investment income (loss)
We use the equity method of accounting when we have the ability to exercise significant influence, but we do not have control, as determined in accordance with generally accepted accounting principles, over the operating and financial policies of
46
the company. Effective December 2, 2021, we reduced our equity interest in the JV Company below 50% of outstanding equity ownership and experienced a loss of control of the JV Company. As a result, we record our investment under equity method of accounting. Since we are unable to obtain accurate financial information from the JV Company in a timely manner, we record our share of earnings or losses of such affiliate on a one quarter lag.
We record our interest in the net earnings of the equity method investee, along with adjustments for unrealized profits or losses on intra-entity transactions and amortization of basis differences, within earnings or loss from equity interests in the Consolidated Statements of Operations. Profits or losses related to intra-entity sales with the equity method investee are eliminated until realized by the investor or investee. Basis differences represent differences between the cost of the investment and the underlying equity in net assets of the investment and are generally amortized over the lives of the related assets that gave rise to them. Equity method goodwill is not amortized. Instead the total equity method investment balance, including equity method goodwill, is tested for impairment.
On July 14, 2025, we entered into an equity transfer agreement (“Agreement”) with the investor to sell approximately 20.3% of outstanding equity interest in the JV Company for an aggregate cash consideration of $150 million. We identified the negotiations of the equity transfer agreement throughout the fourth quarter of fiscal year 2025 as an impairment indicator and performed a quantitative impairment test as of June 30, 2025. Based on the implied valuation of the JV Company per the transaction price in the equity transfer agreement, the fair value of the equity method investment was determined to be lower than its carrying value, and a $76.8 million other-than-temporary impairment of the equity method investment was recognized as of June 30, 2025. The impairment loss is recorded within equity method investment loss in the consolidated statement of operations for the fiscal year ended June 30, 2025. There was no impairment loss of the equity method investment recorded during the fiscal year ended June 30, 2026.
Results of Operations
A discussion of our results of operations for the fiscal year ended June 30, 2026 as compared to June 30, 2025 is included below. For a discussion and comparison of the results of our operations for the fiscal year ended June 30, 2025 with the fiscal year ended June 30, 2024, refer to “Management’s Discussion and Analysis of Financial Conditions and Results of Operations” in our Form 10-K for the fiscal year ended June 30, 2025 filed with the SEC on August 28, 2025.
47
Operating results
The following tables set forth our results of operations and as a percentage of revenue for the fiscal years ended June 30, 2026 and 2025. Our historical results of operations are not necessarily indicative of the results for any future period.
Year Ended June 30, | |||||||||||||||||||||||
| 2026 | 2025 | 2026 | 2025 | ||||||||||||||||||||
| (in thousands) | (% of revenue) | ||||||||||||||||||||||
| Revenue | $ | 678,927 | $ | 696,162 | 100.0 | % | 100.0 | % | |||||||||||||||
| Cost of goods sold (1) | 527,383 | 535,158 | 77.7 | % | 76.9 | % | |||||||||||||||||
| Gross profit | 151,544 | 161,004 | 22.3 | % | 23.1 | % | |||||||||||||||||
| Operating expenses: | |||||||||||||||||||||||
| Research and development (1) | 103,858 | 94,265 | 15.3 | % | 13.5 | % | |||||||||||||||||
| Selling, general and administrative (1) | 90,881 | 95,175 | 13.4 | % | 13.7 | % | |||||||||||||||||
| Total operating expenses | 194,739 | 189,440 | 28.7 | % | 27.2 | % | |||||||||||||||||
Operating loss | (43,195) | (28,436) | (6.4) | % | (4.1) | % | |||||||||||||||||
Other income (loss), net | 4,381 | (1,004) | 0.7 | % | (0.1) | % | |||||||||||||||||
| Interest income | 3,958 | 4,283 | 0.6 | % | 0.6 | % | |||||||||||||||||
| Interest expenses | (775) | (2,639) | (0.1) | % | (0.4) | % | |||||||||||||||||
| Net loss before income taxes and equity method investment income (loss) | (35,631) | (27,796) | (5.2) | % | (4.0) | % | |||||||||||||||||
| Income tax expense (benefit) | 7,468 | (8,625) | 1.1 | % | (1.2) | % | |||||||||||||||||
| Net loss before equity method investment income (loss) | (43,099) | (19,171) | (6.3) | % | (2.8) | % | |||||||||||||||||
| Equity method investment income (loss) | 834 | (77,805) | 0.1 | % | (11.1) | % | |||||||||||||||||
Net loss | $ | (42,265) | $ | (96,976) | (6.2) | % | (13.9) | % | |||||||||||||||
(1) Includes share-based compensation expense as follows:
Year Ended June 30, | |||||||||||||||||||||||
| 2026 | 2025 | 2026 | 2025 | ||||||||||||||||||||
| (in thousands) | (% of revenue) | ||||||||||||||||||||||
| Cost of goods sold | $ | 4,469 | $ | 4,224 | 0.7 | % | 0.6 | % | |||||||||||||||
| Research and development | 7,071 | 8,123 | 1.0 | % | 1.2 | % | |||||||||||||||||
| Selling, general and administrative | 15,138 | 17,222 | 2.2 | % | 2.5 | % | |||||||||||||||||
| $ | 26,678 | $ | 29,569 | 3.9 | % | 4.3 | % | ||||||||||||||||
48
Revenue
The following is a summary of revenue by product type:
| Year Ended June 30, | Change | |||||||||||||||||||
| 2026 | 2025 | FY26 vs. FY25 | ||||||||||||||||||
| (in thousands) | (in thousands) | (in percentage) | ||||||||||||||||||
| Power discrete | $ | 437,787 | $ | 449,507 | $ | (11,720) | (2.6) | % | ||||||||||||
| Power IC | 233,870 | 229,926 | 3,944 | 1.7 | % | |||||||||||||||
Packaging and testing services and other | 7,270 | 2,888 | 4,382 | 151.7 | % | |||||||||||||||
| License and development services | — | 13,841 | (13,841) | (100.0) | % | |||||||||||||||
| $ | 678,927 | $ | 696,162 | $ | (17,235) | (2.5) | % | |||||||||||||
The following is a summary of revenue by end market:
| Year Ended June 30, | Change | |||||||||||||||||||
| 2026 | 2025 | FY26 vs. FY25 | ||||||||||||||||||
| (in thousands) | (in thousands) | (in percentage) | ||||||||||||||||||
| Computing | $ | 342,952 | $ | 324,127 | $ | 18,825 | 5.8 | % | ||||||||||||
| Consumer | 83,008 | 102,309 | (19,301) | (18.9) | % | |||||||||||||||
| Communication | 132,278 | 123,868 | 8,410 | 6.8 | % | |||||||||||||||
| Power Supply and Industrial | 113,419 | 129,129 | (15,710) | (12.2) | % | |||||||||||||||
Packaging and testing services and other | 7,270 | 2,888 | 4,382 | 151.7 | % | |||||||||||||||
| License and development services | — | 13,841 | (13,841) | (100.0) | % | |||||||||||||||
| $ | 678,927 | $ | 696,162 | $ | (17,235) | (2.5) | % | |||||||||||||
Total revenue was $678.9 million for fiscal year 2026, a decrease of $17.2 million, or 2.5%, as compared to $696.2 million for fiscal year 2025. The decrease was primarily due to a decrease of $11.7 million in sales of power discrete products and a decrease of $13.8 million in license and development services, offset by an increase of $3.9 million in sales of power IC products and an increase of $4.4 million in sales of packaging and testing services and other. The net decrease in combined power discrete and power IC product sales was primarily due to a 3.0% decrease in unit shipments, offset by a 2.0% increase in average selling price as compared to last fiscal year due to a shift in product mix. The increase in revenue from packaging and testing services and other for fiscal year 2026 as compared to the last fiscal year was primarily due to increased demand. The decrease in license and development services for fiscal year 2026 was related to the license agreement with a customer to license our proprietary SiC technology and provided 24-month engineering and development services, which was completed in February 2025.
Cost of goods sold and gross profit
| Year Ended June 30, | Change | |||||||||||||||||||
| 2026 | 2025 | FY26 vs. FY25 | ||||||||||||||||||
| (in thousands) | (in thousands) | (in percentage) | ||||||||||||||||||
| Cost of goods sold | $ | 527,383 | $ | 535,158 | $ | (7,775) | (1.5) | % | ||||||||||||
| Percentage of revenue | 77.7 | % | 76.9 | % | ||||||||||||||||
| Gross profit | $ | 151,544 | $ | 161,004 | $ | (9,460) | (5.9) | % | ||||||||||||
| Percentage of revenue | 22.3 | % | 23.1 | % | ||||||||||||||||
49
Cost of goods sold was $527.4 million for fiscal year 2026, a decrease of $7.8 million, or 1.5%, as compared to $535.2 million for fiscal year 2025. The decrease was primarily due to 2.5% decrease in revenue as a result of less unit shipments. Gross margin decreased by 0.8 percentage points to 22.3% for fiscal year 2026, as compared to 23.1% for fiscal year 2025. The decrease in gross margin was primarily due to higher material costs and lower unit shipment during fiscal year ended June 30, 2026. We expect our gross margin to continue to fluctuate in the future as a result of variations in our product mix, semiconductor wafer and raw material pricing, manufacturing labor cost and general economic and PC market conditions.
Research and development expenses
| Year Ended June 30, | Change | |||||||||||||||||||
| 2026 | 2025 | FY26 vs. FY25 | ||||||||||||||||||
| (in thousands) | (in thousands) | (in percentage) | ||||||||||||||||||
| Research and development | $ | 103,858 | $ | 94,265 | $ | 9,593 | 10.2 | % | ||||||||||||
Research and development expenses were $103.9 million for fiscal year 2026, an increase of $9.6 million, or 10.2%, as compared to $94.3 million for fiscal year 2025. The increase was primarily attributable to a $9.0 million increase in employee compensation and personnel related expenses mainly due to our focused investment in R&D, a $3.7 million increase in product prototyping engineering expense as a result of increased engineering activities, a $0.5 million increase in recruiting fees and a $2.1 million increase in allocation, partially offset by a $1.1 million decrease in share-based compensation as a result of the change in estimated achievement of the performance conditions associated with the MSUs granted in December 2021, as well as a $4.4 million decrease in amortization expense as a result of certain software licenses having been fully amortized in June 2025. We continue to evaluate and invest resources in developing new technologies and products utilizing our own fabrication and packaging facilities. We believe the investment in research and development is important to meet our strategic objectives.
Selling, general and administrative expenses
| Year Ended June 30, | Change | |||||||||||||||||||
| 2026 | 2025 | FY26 vs. FY25 | ||||||||||||||||||
| (in thousands) | (in thousands) | (in percentage) | ||||||||||||||||||
| Selling, general and administrative | $ | 90,881 | $ | 95,175 | $ | (4,294) | (4.5) | % | ||||||||||||
Selling, general and administrative expenses were $90.9 million for fiscal year 2026, a decrease of $4.3 million, or 4.5%, as compared to $95.2 million for fiscal year 2025. The decrease was primarily attributable to a one-time settlement fee of $4.3 million relating to the government investigation in fiscal year 2025, a $2.1 million decrease in share-based compensation expense as a result of the change in estimated achievement of the performance conditions associated with the MSUs granted in December 2021, and a $0.9 million decrease in allocation, partially offset by a $1.8 million increase in employee compensation and personnel related expenses, and a $1.2 million increase in professional service fees.
Other income (loss), net
| Year Ended June 30, | Change | |||||||||||||||||||
| 2026 | 2025 | FY26 vs. FY25 | ||||||||||||||||||
| (in thousands) | (in thousands) | (in percentage) | ||||||||||||||||||
Other income (loss), net | $ | 4,381 | $ | (1,004) | $ | 5,385 | (536.4) | % | ||||||||||||
Other income (loss), net increased by $5.4 million in fiscal year 2026 as compared to the last fiscal year primarily due to an increase in foreign currency exchange gain as a result of the appreciation of RMB against USD, as well as income of $1.9 million from certain services provided by the Company to the JV Company.
Interest income
50
| Year Ended June 30, | Change | |||||||||||||||||||
| 2026 | 2025 | FY26 vs. FY25 | ||||||||||||||||||
| (in thousands) | (in thousands) | (in percentage) | ||||||||||||||||||
Interest income | $ | 3,958 | $ | 4,283 | $ | (325) | (7.6) | % | ||||||||||||
Interest income decreased by $0.3 million in fiscal year 2026 as compared to fiscal year 2025 primarily due to lower interest rate during fiscal year 2026.
Interest expenses
| Year Ended June 30, | Change | |||||||||||||||||||
| 2026 | 2025 | FY26 vs. FY25 | ||||||||||||||||||
| (in thousands) | (in thousands) | (in percentage) | ||||||||||||||||||
Interest expenses | $ | (775) | $ | (2,639) | $ | 1,864 | (70.6) | % | ||||||||||||
Interest expenses decreased by $1.9 million in fiscal year 2026 as compared to fiscal year 2025 primarily due to lower outstanding loan balance during fiscal year 2026.
Equity method investment income (loss)
| Year Ended June 30, | Change | |||||||||||||||||||
| 2026 | 2025 | FY26 vs. FY25 | ||||||||||||||||||
| (in thousands) | (in thousands) | (in percentage) | ||||||||||||||||||
Equity method investment income (loss) | $ | 834 | $ | (77,805) | $ | 78,639 | (101.1) | % | ||||||||||||
Equity method investment income increased in fiscal year 2026 as compared to the last fiscal year primarily due to the $76.8 million equity method investment impairment charge recorded in fiscal year 2025 for which there was no corresponding impairment in fiscal year 2026.
Income tax expense (benefit)
| Year Ended June 30, | Change | |||||||||||||||||||
| 2026 | 2025 | FY26 vs. FY25 | ||||||||||||||||||
| (in thousands) | (in thousands) | (in percentage) | ||||||||||||||||||
Income tax expense (benefit) | $ | 7,468 | $ | (8,625) | $ | 16,093 | (186.6) | % | ||||||||||||
Income tax expense (benefit) for fiscal years 2026 and 2025 was $7.5 million and $(8.6) million, respectively. Income tax expense increased by $16.1 million in fiscal year 2026 as compared to fiscal year 2025. The $16.1 million change in fiscal year 2026 tax expense of $7.5 million vs. fiscal year 2025 tax benefit of $8.6 million was primarily related to the changes in the tax expense (benefit) reported in connection with the Company’s investment in the JV Company between the 2026 and 2025 fiscal years. In fiscal year 2026, the Company sold approximately 20.3% of outstanding equity interest in the JV Company for $150 million. The sale resulted in approximately $10.5 million of current tax expense and $9.9 million of deferred tax benefit. The Company also incurred $2.6 million of income tax withholding tax expense related to the investment in the JV Company. In fiscal year 2026, the Company reported $3.2 million in income tax expense related to the sale of the outstanding equity interest in the JV Company and the income tax withholdings related to the investment in the JV Company compared to a $12.5 million tax benefit in fiscal year 2025 as a result of the impairment on the equity method investment.
The remaining difference in tax expense between fiscal years 2026 and 2025 was primarily due to changes in various book-tax permanent differences, discrete tax adjustments between the two years, and changes in the mix of earnings in various geographic jurisdictions between the current year and last year.
Liquidity and Capital Resources
51
Our principal need for liquidity and capital resources is to maintain sufficient working capital to support our operations and to invest adequate capital expenditures to grow our business. To date, we finance our operations and capital expenditures primarily through funds generated from operations and borrowings under our term loans, financing lease and other debt agreements.
On July 14, 2025, we entered into an equity transfer agreement with a strategic investor to sell approximately 20.3% of outstanding equity interest in the JV Company held by us for an aggregate cash consideration of $150 million paid in four installments, subject to satisfaction of certain conditions. On August 29, 2025, the amended Shareholders’ agreement for the JV Company was signed, which reduced our equity interest in the JV Company by 20.3% to an ownership percentage of 18.9%. As of June 30, 2026, all of the conditions were satisfied, and we received all installment payments. We believe this sale provides additional and significant capital for us to continue investment in technology, new product development and acquisition of assets complementary to our business operations, which will facilitate and accelerate our efforts to develop and distribute innovative and diverse power semiconductor products to customers worldwide.
In September 2021, Jireh Semiconductor Incorporated (“Jireh”), one of the Company’s wholly-owned subsidiaries, entered into a financing arrangement agreement with a company (“Lender”) for the lease and purchase of a machinery equipment manufactured by a supplier. This agreement includes a payment term of five (5) years, pursuant to which Jireh commenced payments of interest and principal to the Lender in September 2022 when the final installation and acceptance of the equipment were completed. After the end of such payment term, Jireh has the option to purchase the equipment for $1. The implied interest rate was 4.75% per annum which was adjustable based on every five basis point increase in 60-month U.S. Treasury Notes. The total purchase price of this equipment was euro 12.0 million. In April 2021, Jireh made a down payment of euro 6.0 million, representing 50% of the total purchase price of the equipment, to the supplier. In June 2022, the equipment was delivered to Jireh after Lender paid 40% of the total purchase price, for euro 4.8 million, to the supplier on behalf of Jireh. In September 2022, Lender paid the remaining 10% payment for the total purchase price and reimbursed Jireh for the 50% down payment, after the installation and configuration of the equipment. The title of the equipment was transferred to Lender following such payment. The agreement was amended with fixed implied interest rate of 7.51% and monthly payment of principal and interest effective in October 2022. Other terms remain the same. In addition, Jireh purchased hardware for the machine under this financing arrangement. The purchase price of this hardware was $0.2 million. The financing arrangement is secured by this equipment and other equipment at Jireh, which had a net book value of $10.5 million as of June 30, 2026. As of June 30, 2026, the outstanding balance of this debt financing was $3.6 million.
On August 18, 2021, Jireh entered into a term loan agreement with a financial institution (the “Bank”) in an amount up to $45.0 million for the purpose of expanding and upgrading the Company’s fabrication facility located in Oregon. The obligation under the loan agreement is secured by substantially all assets of Jireh and guaranteed by the Company. The agreement has a 5.5-year term and matures on February 16, 2027. Jireh is required to make consecutive quarterly payments of principal and interest. The loan accrues interest based on the SOFR plus the applicable margin based on the outstanding balance of the loan. This agreement contains customary restrictive covenants and includes certain financial covenants that the Company is required to maintain. Jireh drew down $45.0 million on February 16, 2022 with the first payment of principal beginning in October 2022. As of June 30, 2025, Jireh was in compliance with these covenants and the outstanding balance of this loan was $20.3 million. In August 2025, the Company paid the outstanding balance in full. As of June 30, 2026, there was no outstanding balance.
On August 9, 2019, one of the Company's wholly-owned subsidiaries (the “Borrower”) entered into a factoring agreement with the Hongkong and Shanghai Banking Corporation Limited (“HSBC”), whereby the Borrower assigns certain of its accounts receivable with recourse. This factoring agreement allows the Borrower to borrow up to 70% of the net amount of its eligible accounts receivable of the Borrower with a maximum amount of $30.0 million. The interest rate is based on the Secured Overnight Financing Rate (“SOFR”), plus 2.01% per annum. The Company is the guarantor for this agreement. The Company is accounting for this transaction as a secured borrowing under the Transfers and Servicing of Financial Assets guidance. In addition, any cash held in the restricted bank account controlled by HSBC has a legal right of offset against the borrowing. This agreement, with certain financial covenants required, has no expiration date. On August 11, 2021, the Borrower signed an agreement with HSBC to decrease the borrowing maximum amount to $8.0 million with certain financial covenants required. Other terms remain the same. In August 2025, this factoring agreement was terminated. As of June 30, 2026, there was no outstanding balance.
The Chinese government imposes certain currency exchange controls on cash transfers out of China. Regulations in China permit foreign owned entities to freely convert the RMB into foreign currency for transactions that fall under the “current account,” which includes trade related receipts and payments, interests, and dividend payments. Accordingly, subject to the review and verification of the underlying transaction documents and supporting documents by the account banks in China, our Chinese subsidiaries may use RMB to purchase foreign exchange currency for settlement of such “current account” transactions without the pre-approval from SAFE or its provincial branch. Pursuant to applicable regulations, foreign-invested enterprises in China may pay dividends only out of their accumulated profits, if any, determined in accordance with Chinese accounting
52
standards and regulations. A Chinese company must pay 10% of its annual after-tax profits to fund its statutory reserve fund unless it has reached 50% of the registered capital of the company. Where the accumulative amount of the company’s statutory reserve is not enough to make up for the losses of the previous year, the current year’s profits must first be used to make up for the losses before the statutory reserve is accrued. While SAFE approval is not statutorily required for eligible dividend payments to the foreign parent, in practice, before making the dividend payment, the account bank may seek SAFE’s opinion with respect to a dividend payment if the payment involves a relatively large amount, which may delay the dividend payment depending on the then overall status of cross-border payments and receipts of China.
Transactions that involve conversion of RMB into foreign currency in relation to foreign direct investments and provision of debt financings in China are classified as “capital account” transactions. Examples of “capital account” transactions include repatriations of investments by foreign owners and repayments of loan principal to foreign lenders. "Capital account" transactions require prior approval from SAFE or its provincial branch or an account bank delegated by SAFE to convert a remittance into a foreign currency, such as U.S. dollars, and transmit the foreign currency outside of China. As a result of this and other restrictions under PRC laws and regulations, our China subsidiaries are restricted in their ability to transfer a portion of their net assets to us, and such restriction may adversely affect our ability to generate sufficient liquidity to fund our operations or other expenditures. As of June 30, 2026 and 2025, such restricted portion amounted to approximately $94.0 million and $93.9 million, or 11.8% and 11.4%, of our total consolidated net assets attributable to the Company, respectively.
We believe that our current cash and cash equivalents and cash flows from operations will be sufficient to meet our anticipated cash needs, including working capital and capital expenditures, for at least the next twelve months. In the long-term, we may require additional capital due to changing business conditions or other future developments, including any investments or acquisitions we may decide to pursue. If our cash is insufficient to meet our needs, we may seek to raise capital through debt financing. The incurrence of indebtedness would result in increased debt service obligations and may include operating and financial covenants that would restrict our operations. If we decide to raise capital through equity financing, the issuance of additional equity may result in dilution to our shareholders. We cannot be certain that any financing will be available in the amounts we need or on terms acceptable to us, if at all.
Cash, cash equivalents and restricted cash
As of June 30, 2026 and 2025, we had $181.4 million and $153.5 million of cash, cash equivalents and restricted cash, respectively. Our cash, cash equivalents and restricted cash primarily consisted of cash on hand, restricted cash and short-term bank deposits with original maturities of three months or less. Of the $181.4 million and $153.5 million cash and cash equivalents, $60.7 million and $40.7 million, respectively, were deposited with financial institutions outside the United States.
The following table shows our cash flows from operating, investing and financing activities for the periods indicated:
Year Ended June 30, | |||||||||||||||||
| 2026 | 2025 | ||||||||||||||||
| (in thousands) | |||||||||||||||||
Net cash (used in) provided by operating activities | $ | (16,320) | $ | 29,668 | |||||||||||||
Net cash provided by (used in) investing activities | 86,100 | (36,441) | |||||||||||||||
Net cash used in financing activities | (41,805) | (15,496) | |||||||||||||||
| Effect of exchange rate changes on cash, cash equivalents and restricted cash | (48) | 227 | |||||||||||||||
| Net increase (decrease) in cash, cash equivalents and restricted cash | $ | 27,927 | $ | (22,042) | |||||||||||||
Cash flows from operating activities
For the fiscal year ended June 30, 2026, the $46.0 million decrease in cash provided by operating activities compared to the fiscal year ended June 30, 2025 was primarily due to a decrease of net loss of $54.7 million and a decrease of non-cash expenses of $83.8 million, an increase of $17.8 million in inventory purchase, a decrease of accounts payable of $25.4 million primarily due to timing of payment, and a decrease of $9.2 million in payable related to equity investee, offset by a decrease of $14.2 million in accounts receivable due to timing of billings and collection of payments, a decrease of $1.9 million in other current and long term assets due to decrease in advance payments to suppliers, an increase of $2.0 million in income tax payable, an increase of $3.3 million in deferred revenue, and an increase of $14.1 million in accrued and other liabilities.
Cash flows from investing activities
For the fiscal year ended June 30, 2026, the $122.5 million increase in cash provided by investing activities compared to the fiscal year ended June 30, 2025 was primarily due to a $147.7 million in the proceeds of sales of equity interest in the JV
53
Company and $0.3 million in the proceeds of sale of privately-held investment, offset by a $14.6 million increase in purchases of property and equipment, a $0.6 million increase in purchases of intangible assets, a $0.5 million decrease in government grants related to equipment, and $9.7 million increase of a loan issued to a supplier.
Cash flows from financing activities
For the fiscal year ended June 30, 2026, the $26.3 million increase in cash used in financing activities compared to fiscal year 2025 was primarily due to $18.2 million of payment for repurchases of common shares and $11.5 million of repayment of loan borrowings, offset by $3.2 million decrease in withholding tax paid on behalf of employees for net share settlement, and $0.2 million increase in proceeds from exercise of stock options and the Employee Share Purchase Plan.
Commitments
See Note 15 of the Notes to the consolidated financial statements contained in this Annual Report on Form 10-K for a description of commitments.
54
Critical Accounting Estimates
General
Our accounting policies are more fully described in Note 1 of the Notes to the consolidated financial statements contained in this Annual Report on Form 10-K. As disclosed in Note 1, the preparation of consolidated financial statements in conformity with U.S. GAAP requires management to make estimates and assumptions about future events that affect the amounts reported in the financial statements and accompanying notes. Management believes it is unlikely that applying other estimates and assumptions would have a material impact on the financial statements. We consider the following accounting policies to be those that are most important to the portrayal of our financial condition and that require a higher degree of judgment.
Revenue recognition
We determine revenue recognition through the following steps: (1) identification of the contract with a customer; (2) identification of the performance obligations in the contract; (3) determination of the transaction price; (4) allocation of the transaction price to the performance obligations in the contract; and (5) recognition of revenue when, or as, a performance obligation is satisfied. We recognize product revenue at a point in time when product is shipped to the customer, as determined by the agreed upon shipping terms, net of estimated stock rotation returns and price adjustments that we expect to provide to certain distributors. We present revenue net of sales taxes and any similar assessments. Our standard payment terms range from 30 to 60 days.
We sell our products primarily to distributors, who in turn sell the products globally to various end customers. Sales to most distributors are made under terms allowing certain price adjustments of the Company’s products held in their inventory or upon sale to their end customers. Revenue from sales to distributors is recognized upon the transfer of control to the distributor. In the ordinary course of business, our distributors may need to sell our products to end customers at prices below the standard distribution price in order to remain competitive and secure sales. After the distributors sell the Company’s products to their end customers, the distributors submit a “ship-and-debit” price adjustment claim to the Company to adjust the distributor’s cost from the standard price to the pre-approved lower price. After the Company verifies that the claim was pre-approved, a credit memo is issued to the distributors for the ship-and-debit claim. In determining the transaction price, the Company considers ship-and-debit price adjustments to be variable consideration. The Company estimates the variable consideration of the allowance for price adjustments at the time revenue is recognized. Estimating the allowance for price adjustments requires management to make certain assumptions including distributor inventory levels, forecasted distributor selling prices, distributor margins and future demand for products. These assumptions could be affected by current and future economic and market conditions. We also allow stock rotation returns from certain distributors. Stock rotation returns are governed by contract and are limited to a specified percentage of the monetary value of products purchased by distributors during a specified period. We record an allowance for stock rotation returns based on historical returns, expected sales volumes and individual distributor agreements. Allowance for price adjustments is recorded against accounts receivable and the provision for stock rotation rights is included in accrued liabilities on the consolidated balance sheets.
Valuation of inventories
We evaluate our inventory for salability, obsolescence and other available applicable information. When evaluating the adequacy of our provision for excess and obsolete inventory, we identify excess and obsolete products and also analyze historical usage, forecasted demand, projected and current economic trends. Demand for our products can fluctuate significantly from period to period. A significant decrease in demand could result in an increase in the amount of excess inventory on hand. In addition, our industry is characterized by frequent new product development and technological changes that could result in an increase in the amount of obsolete inventory quantities on hand. Also, our estimates of forecasted demand and judgement to determine excess inventory may prove to be inaccurate, in which case we may have understated or overstated the reduction to the total carrying value of our inventory for excess and obsolete inventory. If actual economic trends are less favorable than those forecasted, additional future inventory write-downs may be required, which could adversely affect our operating results. Inventory adjustments, once established, are not reversed until the related inventory has been sold or scrapped. If actual economic trends are more favorable than expected and the products that have previously been written down are sold, our gross margin would be favorably impacted.
Recently Issued Accounting Pronouncements
See Note 1 of the Notes to the consolidated financial statements contained in this Annual Report on Form 10-K for a full description of recent accounting pronouncements, including the expected dates of adoption and estimated effects on results of operations and financial condition.
55
Item 7A.Quantitative and Qualitative Disclosures About Market Risk
Foreign currency risk
We and our principal subsidiaries use U.S. dollars as our functional currency because most of the transactions are conducted and settled in U.S. dollars. All of our revenue and a significant portion of our operating expenses are denominated in U.S. dollars. The functional currency for our in-house packaging and testing facilities in China is U.S. dollars and a significant portion of our capital expenditures are denominated in U.S. dollars. However, foreign currencies are required to fund our overseas operations, primarily in Taiwan and China. Operating expenses of overseas operations are denominated in their respective local currencies. In order to minimize exposure to foreign currencies, we maintained cash and cash equivalent balances in foreign currencies, including Chinese Yuan as operating funds for our foreign operating expenses. For our subsidiaries which use the local currency as the functional currency, the results and financial position are translated into U.S. dollars using exchange rates at balance sheet dates for assets and liabilities and using average exchange rates for income and expenses items. The resulting translation differences are presented as a separate component of accumulated other comprehensive income (loss) in the consolidated statements of equity. Our management believes that our exposure to foreign currency translation risk is not significant based on a 10% sensitivity analysis in foreign currencies due to the fact that the net assets denominated in foreign currencies pertaining to foreign operations, principally in Taiwan and China, are not significant to our consolidated net assets.
Interest rate risk
Our interest-bearing assets comprise mainly interest-bearing short-term bank balances. We manage our interest rate risk by placing such balances in instruments with various short-term maturities. As of June 30, 2026, we had $3.6 million outstanding under our loan and $1.3 million outstanding under our financing leases, which were subject to fixed interest rates. As a result, our interest rate exposure is immaterial.
Commodity Price Risk
We are subject to risk from fluctuating market prices of certain commodity raw materials, particularly gold and silver, that are used in our manufacturing process and incorporated into our end products. Supplies for such commodities may from time-to-time become restricted, or general market factors and conditions may affect the pricing of such commodities. Over the past few years, the price of gold increased significantly and certain of our supply chain partners assess surcharges to compensate for the rising commodity prices. We have been converting some of our products to use copper wires instead of gold wires. Our results of operations may be materially and adversely affected if we have difficulty obtaining these raw materials, the quality of available raw materials deteriorates, or there are significant price changes for these raw materials. For periods in which the prices of these raw materials are rising, we may be unable to pass on the increased cost to our customers which would result in decreased margins for the products in which they are used and could have a material adverse effect on our net earnings. We also may need to record losses for adverse purchase commitments for these materials in periods of declining prices. We do not enter into formal hedging arrangements to mitigate against commodity risk. We estimate that a 10% increase or decrease in the costs of raw materials subject to commodity price risk, such as gold and silver, would decrease or increase our current year's net earnings by $1.4 million, assuming that such changes in our costs have no impact on the selling prices of our products and that we have no pending commitments to purchase metals at fixed prices.
56
Item 8.Financial Statements and Supplementary Data
See Part IV, Item 15 “Exhibits and Financial Statement Schedules” for our consolidated financial statements and the notes and schedules thereto filed as part of this Annual Report.
Item 9.Changes in and Disagreements with Accountants on Accounting and Financial Disclosure
None.
Item 9A.Controls and Procedures
Evaluation of Disclosure Controls and Procedures
Our management, with the participation of our Chief Executive Officer and Chief Financial Officer, evaluated the effectiveness of our disclosure controls and procedures as of June 30, 2026, the end of the period covered by this Annual Report on Form 10-K. Disclosure controls and procedures (as defined in Rules 13a-15(e) and 15d-15(e) under the Securities Exchange Act of 1934, as amended (the “Exchange Act”) are designed to provide reasonable assurance that information required to be disclosed by a company in the reports that it files or submits under the Exchange Act is recorded, processed, summarized and reported, within the time periods specified in the SEC’s rules and forms, and that such information is accumulated and communicated to a company’s management, including its principal executive and principal financial officers, as appropriate to allow timely decisions regarding required disclosure.
Based upon that evaluation as of the end of the period covered in this Annual Report on Form 10-K, our Chief Executive Officer and Chief Financial Officer concluded that our disclosure controls and procedures were effective as of June 30, 2026.
Management’s Annual Report on Internal Control over Financial Reporting
Our management, including our Chief Executive Officer and Chief Financial Officer, is responsible for establishing and maintaining adequate internal control over financial reporting (as defined in Rule 13a-15(f) under the Exchange Act). Our internal control over financial reporting is a process designed to provide reasonable assurance regarding the reliability of financial reporting and the preparation of our financial statements for external purposes in accordance with generally accepted accounting principles, and includes those policies and procedures that (1) pertain to the maintenance of records that, in reasonable detail, accurately and fairly reflect the transactions and dispositions of our assets; (2) provide reasonable assurance that transactions are recorded to permit preparation of financial statements in accordance with generally accepted accounting principles, and that our receipts and expenditures are made only in accordance with authorizations of our management and directors; and (3) provide reasonable assurance regarding prevention or timely detection of unauthorized acquisition, use or disposition of our assets that could have a material effect on our financial statements.
Our management conducted an assessment of the effectiveness of our internal control over financial reporting based on the criteria set forth in Internal Control—Integrated Framework issued by the Committee of Sponsoring Organizations of the Treadway Commission (2013 framework), as amended from time to time. Based on the assessment, our management concluded that the Company's internal control over financial reporting was effective as of June 30, 2026.
The effectiveness of the Company’s internal control over financial reporting as of June 30, 2026 has been audited by Deloitte & Touche LLP, an independent registered public accounting firm, as stated in their report included in this Annual Report on Form 10-K.
Changes in Internal Control Over Financial Reporting
As required by Rule 13a-15(d) under the Exchange Act, our management, including our Chief Executive Officer and Chief Financial Officer, evaluated our internal control over financial reporting to determine whether any changes occurred during the fourth fiscal quarter covered by this Form 10-K that have materially affected or are reasonably likely to materially affect, our internal control over financial reporting. Based on that evaluation, there were no changes during the fourth fiscal quarter ended June 30, 2026.
Inherent Limitations on the Effectiveness of Controls
While our disclosure controls and procedures and internal control over financial reporting are designed to provide reasonable assurance that their respective objectives will be met, we do not expect that our disclosure controls and procedures or our internal control over financial reporting are or will be capable of preventing or detecting all errors and all fraud. Any
57
control system, no matter how well designed and operated, can provide only reasonable, not absolute, assurance that the control system's objectives will be met.
58
REPORT OF INDEPENDENT REGISTERED PUBLIC ACCOUNTING FIRM
To the shareholders and the Board of Directors of Alpha and Omega Semiconductor Limited:
Opinion on Internal Control over Financial Reporting
We have audited the internal control over financial reporting of Alpha and Omega Semiconductor Limited and subsidiaries (the "Company") as of June 30, 2026, based on criteria established in Internal Control — Integrated Framework (2013) issued by the Committee of Sponsoring Organizations of the Treadway Commission (COSO). In our opinion, the Company maintained, in all material respects, effective internal control over financial reporting as of June 30, 2026, based on criteria established in Internal Control — Integrated Framework (2013) issued by COSO.
We have also audited, in accordance with the standards of the Public Company Accounting Oversight Board (United States) (PCAOB), the consolidated financial statements as of and for the year ended June 30, 2026, of the Company and our report dated August 27, 2026, expressed an unqualified opinion on those financial statements.
Basis for Opinion
The Company's management is responsible for maintaining effective internal control over financial reporting and for its assessment of the effectiveness of internal control over financial reporting, included in the accompanying Management's Annual Report on Internal Control over Financial Reporting. Our responsibility is to express an opinion on the Company's internal control over financial reporting based on our audit. We are a public accounting firm registered with the PCAOB and are required to be independent with respect to the Company in accordance with the U.S. federal securities laws and the applicable rules and regulations of the Securities and Exchange Commission and the PCAOB.
We conducted our audit in accordance with the standards of the PCAOB. Those standards require that we plan and perform the audit to obtain reasonable assurance about whether effective internal control over financial reporting was maintained in all material respects. Our audit included obtaining an understanding of internal control over financial reporting, assessing the risk that a material weakness exists, testing and evaluating the design and operating effectiveness of internal control based on the assessed risk, and performing such other procedures as we considered necessary in the circumstances. We believe that our audit provides a reasonable basis for our opinion.
Definition and Limitations of Internal Control over Financial Reporting
A company's internal control over financial reporting is a process designed to provide reasonable assurance regarding the reliability of financial reporting and the preparation of financial statements for external purposes in accordance with generally accepted accounting principles. A company's internal control over financial reporting includes those policies and procedures that (1) pertain to the maintenance of records that, in reasonable detail, accurately and fairly reflect the transactions and dispositions of the assets of the company; (2) provide reasonable assurance that transactions are recorded as necessary to permit preparation of financial statements in accordance with generally accepted accounting principles, and that receipts and expenditures of the company are being made only in accordance with authorizations of management and directors of the company; and (3) provide reasonable assurance regarding prevention or timely detection of unauthorized acquisition, use, or disposition of the company's assets that could have a material effect on the financial statements.
Because of its inherent limitations, internal control over financial reporting may not prevent or detect misstatements. Also, projections of any evaluation of effectiveness to future periods are subject to the risk that controls may become inadequate because of changes in conditions, or that the degree of compliance with the policies or procedures may deteriorate.
/s/ Deloitte & Touche LLP
August 27, 2026
59
Item 9B.Other Information
Item 9C. Disclosure Regarding Foreign Jurisdictions that Prevent Inspections.
Not Applicable.
60
PART III
Certain information required by Part III is omitted from this Annual Report on Form 10-K because we intend to file our definitive proxy statement for our next annual general meeting of shareholders, pursuant to Regulation 14A of the Securities Exchange Act of 1934, as amended (the “2026 Proxy Statement”), no later than 120 days after the end of fiscal year 2026, and certain information to be included in the 2026 Proxy Statement is incorporated herein by reference.
Item 10.Directors, Executive Officers and Corporate Governance
The information required by this item concerning our directors, executive officers, Section 16 compliance and corporate governance matters is contained in part under the caption “Business - Executive Officers” in Part I of this report, and the remainder is incorporated by reference to the information set forth in the sections titled “Election of Directors” and “Delinquent Section 16(a) Reports” in the 2026 Proxy Statement.
Item 11.Executive Compensation
The information required by this item regarding executive compensation is incorporated by reference from the information set forth under the captions “Compensation of Non-Employee Directors” and “Executive Compensation,” in the 2026 Proxy Statement.
Item 12.Security Ownership of Certain Beneficial Owners and Management and Related Stockholder Matters
The information required by this item regarding security ownership of certain beneficial owners and management is incorporated by reference to the information set forth in the section titled “Security Ownership of Certain Beneficial Owners and Management” and “Equity Compensation Plan Information” in the 2026 Proxy Statement.
Item 13.Certain Relationships and Related Transactions, and Director Independence
The information required by this item regarding related party transactions and director independence is incorporated by reference from the information set forth under the captions “Board of Directors and Committees of the Board” and “Related Party Transactions” in the 2026 Proxy Statement.
Item 14.Principal Accountant Fees and Services
The information required by this item regarding principal accountant fees and services is incorporated by reference from the information set forth under the caption “Principal Accounting Fees and Services” in the 2026 Proxy Statement.
61
PART IV
Item 15.Exhibits and Financial Statement Schedules
(a) The following documents are filed as part of this annual report:
(1) Consolidated Financial Statements. The index to the consolidated financial statements is below.
| Item | Page | ||||
Report of Independent Registered Public Accounting Firm (Deloitte & Touche LLP - PCAOB Firm ID No. | |||||
Report of Independent Registered Public Accounting Firm (Baker Tilly US, LLP - PCAOB Firm ID No. | |||||
(2) Financial Statement Schedule.
(b) Exhibits
The exhibits listed on the accompanying Index to Exhibits in Item 15(b) below are filed as part of, or hereby incorporated by reference into, this Annual Report on Form 10-K.
62
REPORT OF INDEPENDENT REGISTERED PUBLIC ACCOUNTING FIRM
To the shareholders and the Board of Directors of Alpha and Omega Semiconductor Limited
Opinion on the Financial Statements
We have audited the accompanying consolidated balance sheets of Alpha and Omega Semiconductor Limited and subsidiaries (the "Company") as of June 30, 2026 and 2025, the related consolidated statements of operations, comprehensive loss, equity, and cash flows, for the years ended June 30, 2026 and 2025, and the related notes and the schedule listed in the Index at Item 15 (collectively referred to as the "financial statements"). In our opinion, the financial statements present fairly, in all material respects, the financial position of the Company as of June 30, 2026 and 2025, and the results of its operations and its cash flows for the years ended June 30, 2026 and 2025, in conformity with the accounting principles generally accepted in the United States of America.
We have also audited, in accordance with the standards of the Public Company Accounting Oversight Board (United States) (PCAOB), the Company's internal control over financial reporting as of June 30, 2026, based on criteria established in Internal Control — Integrated Framework (2013) issued by the Committee of Sponsoring Organizations of the Treadway Commission and our report dated August 27, 2026, expressed an unqualified opinion on the Company's internal control over financial reporting.
Basis for Opinion
These financial statements are the responsibility of the Company's management. Our responsibility is to express an opinion on the Company's financial statements based on our audits. We are a public accounting firm registered with the PCAOB and are required to be independent with respect to the Company in accordance with the U.S. federal securities laws and the applicable rules and regulations of the Securities and Exchange Commission and the PCAOB.
We conducted our audits in accordance with the standards of the PCAOB. Those standards require that we plan and perform the audit to obtain reasonable assurance about whether the financial statements are free of material misstatement, whether due to error or fraud. Our audits included performing procedures to assess the risks of material misstatement of the financial statements, whether due to error or fraud, and performing procedures that respond to those risks. Such procedures included examining, on a test basis, evidence regarding the amounts and disclosures in the financial statements. Our audits also included evaluating the accounting principles used and significant estimates made by management, as well as evaluating the overall presentation of the financial statements. We believe that our audits provide a reasonable basis for our opinion.
Critical Audit Matter
The critical audit matter communicated below is a matter arising from the current-period audit of the financial statements that was communicated or required to be communicated to the audit committee and that (1) relates to accounts or disclosures that are material to the financial statements and (2) involved our especially challenging, subjective, or complex judgments. The communication of critical audit matters does not alter in any way our opinion on the financial statements, taken as a whole, and we are not, by communicating the critical audit matter below, providing a separate opinion on the critical audit matter or on the accounts or disclosures to which it relates.
Inventories — Excess and Obsolete Inventory Reserve — Refer to Note 1 to the financial statements
Critical Audit Matter Description
The Company evaluates the adequacy of the excess and obsolete inventory reserve based upon a review of inventory quantities on hand compared to forecasted demand. Management’s estimates of forecasted demand are based upon analysis and assumptions including, but not limited to, historical usage, sales forecasts, customer backlog, and projected and current economic trends.
We identified the excess and obsolete inventory reserve as a critical audit matter due to the significant assumptions management makes with regards to estimating the forecasted demand. This required a high degree of auditor judgement and an increased extent of effort when performing audit procedures to evaluate the reasonableness of management’s estimates of forecasted demand.
How the Critical Audit Matter Was Addressed in the Audit
63
Our audit procedures related to management’s estimates of forecasted demand used in the excess and obsolete inventory reserve included the following, among others:
•We tested the effectiveness of internal controls over management’s review of the excess and obsolete inventory reserve, including internal controls designed to review and approve forecasted demand and the underlying inputs and assumptions regarding historical usage, sales forecasts, customer backlog, and projected and current economic trends.
•We evaluated management’s ability to accurately estimate forecasted demand by selecting a sample of inventory products as of June 30, 2025, and comparing usage in the current year to forecasted demand estimates made in the prior year.
•We selected a sample of inventory products as of June 30, 2026, and tested the forecasted demand by comparing internal and external information (e.g. historical usage, customer backlog, historical channel inventory levels held at distributors, communications with customers, expected product lifecycles, economic trends, and inquiries with sales personnel, as applicable) with the Company’s forecasted demand.
•We considered, when relevant, the existence of contradictory evidence based on reading of internal communications to management and the board of directors, Company press releases, and analyst reports, as well as our observations and inquiries as to changes within the business and information obtained through other areas of the audit.
/s/ Deloitte & Touche LLP
August 27, 2026
We have served as the Company's auditor since 2024.
64
REPORT OF INDEPENDENT REGISTERED PUBLIC ACCOUNTING FIRM
To the Shareholders and the Board of Directors of Alpha and Omega Semiconductor Limited:
Opinion on the Financial Statements
We have audited the accompanying consolidated statements of operations, comprehensive loss, equity, and cash flows of Alpha and Omega Semiconductor Limited (the “Company”) for the year ended June 30, 2024, and the related notes and schedule (collectively referred to as the "consolidated financial statements").
In our opinion, the consolidated financial statements present fairly, in all material respects, the results of its operations and its cash flows for the year ended June 30, 2024, in conformity with accounting principles generally accepted in the United States of America.
Basis for Opinion
These consolidated financial statements are the responsibility of the Company's management. Our responsibility is to express an opinion on the Company's consolidated financial statements based on our audit. We are a public accounting firm registered with the Public Company Accounting Oversight Board (United States) ("PCAOB") and are required to be independent with respect to the Company in accordance with the U.S. federal securities laws and the applicable rules and regulations of the Securities and Exchange Commission and the PCAOB.
We conducted our audit in accordance with the standards of the PCAOB. Those standards require that we plan and perform the audit to obtain reasonable assurance about whether the consolidated financial statements are free of material misstatement, whether due to error or fraud.
Our audit included performing procedures to assess the risks of material misstatement of the consolidated financial statements, whether due to error or fraud, and performing procedures that respond to those risks. Such procedures included examining, on a test basis, evidence regarding the amounts and disclosures in the consolidated financial statements. Our audit also included evaluating the accounting principles used and significant estimates made by management, as well as evaluating the overall presentation of the consolidated financial statements. We believe that our audit provides a reasonable basis for our opinion.
/s/ Baker Tilly US, LLP
We served as the Company's auditor from 2022 to 2024.
August 23, 2024 (August 28, 2025, as to the effects of the adoption of ASU 2023-07, Segment Reporting (Topic 280): Improvements to Reportable Segment Disclosures, described in Note 13)
65
ALPHA AND OMEGA SEMICONDUCTOR LIMITED
CONSOLIDATED BALANCE SHEETS
(in thousands, except par value per share)
June 30, | |||||||||||
| 2026 | 2025 | ||||||||||
| ASSETS | |||||||||||
| Current assets: | |||||||||||
| Cash and cash equivalents | $ | $ | |||||||||
| Restricted cash | |||||||||||
| Accounts receivable, net | |||||||||||
| Inventories | |||||||||||
| Other current assets | |||||||||||
| Total current assets | |||||||||||
| Property, plant and equipment, net | |||||||||||
| Operating lease right-of-use assets, net | |||||||||||
| Intangible assets, net | |||||||||||
| Equity method investment | |||||||||||
| Deferred income tax assets | |||||||||||
| Other long-term assets | |||||||||||
| Total assets | $ | $ | |||||||||
| LIABILITIES AND EQUITY | |||||||||||
| Current liabilities: | |||||||||||
| Accounts payable | $ | $ | |||||||||
| Accrued liabilities | |||||||||||
| Payable related to equity investee, net | |||||||||||
| Income taxes payable | |||||||||||
| Short-term debt | |||||||||||
| Deferred revenue | |||||||||||
| Finance lease liabilities | |||||||||||
| Operating lease liabilities | |||||||||||
| Total current liabilities | |||||||||||
| Long-term debt | |||||||||||
| Income taxes payable - long-term | |||||||||||
| Deferred income tax liabilities | |||||||||||
| Finance lease liabilities - long-term | |||||||||||
| Operating lease liabilities - long-term | |||||||||||
| Other long-term liabilities | |||||||||||
| Total liabilities | |||||||||||
| Commitments and contingencies (Note 15) | |||||||||||
| Equity: | |||||||||||
Preferred shares, par value $ | |||||||||||
Authorized: | |||||||||||
Common shares, par value $ | |||||||||||
Authorized: | |||||||||||
Treasury shares at cost; | ( | ( | |||||||||
| Additional paid-in capital | |||||||||||
| Accumulated other comprehensive loss | ( | ( | |||||||||
| Retained earnings | |||||||||||
| Total shareholders' equity | |||||||||||
| Total liabilities and shareholders' equity | $ | $ | |||||||||
The accompanying notes are an integral part of these consolidated financial statements.
66
ALPHA AND OMEGA SEMICONDUCTOR LIMITED
CONSOLIDATED STATEMENTS OF OPERATIONS
(in thousands, except per share data)
Year Ended June 30, | |||||||||||||||||
| 2026 | 2025 | 2024 | |||||||||||||||
| Revenue | $ | $ | $ | ||||||||||||||
Cost of goods sold 1 | |||||||||||||||||
| Gross profit | |||||||||||||||||
| Operating expenses: | |||||||||||||||||
| Research and development | |||||||||||||||||
| Selling, general and administrative | |||||||||||||||||
| Total operating expenses | |||||||||||||||||
| Operating loss | ( | ( | ( | ||||||||||||||
Other income (loss), net | ( | ( | |||||||||||||||
| Interest income | |||||||||||||||||
| Interest expenses | ( | ( | ( | ||||||||||||||
Net loss before income taxes and equity method investment income (loss) | ( | ( | ( | ||||||||||||||
| Income tax expense (benefit) | ( | ||||||||||||||||
Net loss before equity method investment income (loss) | ( | ( | ( | ||||||||||||||
Equity method investment income (loss) | ( | ( | |||||||||||||||
Net loss | $ | ( | $ | ( | $ | ( | |||||||||||
| Net loss per common share | |||||||||||||||||
| Basic | $ | ( | $ | ( | $ | ( | |||||||||||
| Diluted | $ | ( | $ | ( | $ | ( | |||||||||||
| Weighted average number of common share used to compute net loss per share: | |||||||||||||||||
| Basic | |||||||||||||||||
| Diluted | |||||||||||||||||
(1) - Amounts include related party transactions. Refer to footnote 3, Related Party Transactions.
The accompanying notes are an integral part of these consolidated financial statements.
67
ALPHA AND OMEGA SEMICONDUCTOR LIMITED
CONSOLIDATED STATEMENTS OF COMPREHENSIVE LOSS
(in thousands)
| Year ended June 30, | |||||||||||||||||
| 2026 | 2025 | 2024 | |||||||||||||||
Net loss | $ | ( | $ | ( | $ | ( | |||||||||||
| Other comprehensive income (loss), net of tax | |||||||||||||||||
Foreign currency translation adjustment, net of $ | ( | ||||||||||||||||
Comprehensive loss | $ | ( | $ | ( | $ | ( | |||||||||||
The accompanying notes are an integral part of these consolidated financial statements.
68
ALPHA AND OMEGA SEMICONDUCTOR LIMITED
CONSOLIDATED STATEMENTS OF EQUITY
(in thousands)
| Preferred Shares | Common Shares | Treasury Stock | Additional Paid-In Capital | Accumulated Other Comprehensive Loss | Retained Earnings | Total Shareholders' Equity | |||||||||||||||||||||||||||||||||||||||||||||||||||||
| Shares | Amount | Shares | Amount | Shares | Amount | ||||||||||||||||||||||||||||||||||||||||||||||||||||||
| Balance, June 30, 2023 | $ | $ | ( | $ | ( | $ | $ | ( | $ | $ | |||||||||||||||||||||||||||||||||||||||||||||||||
| Exercise of common stock options and release of RSUs | — | — | — | — | — | — | |||||||||||||||||||||||||||||||||||||||||||||||||||||
| Reissuance of treasury stock upon exercise of common stock options and release of RSUs | — | — | — | — | — | — | ( | ||||||||||||||||||||||||||||||||||||||||||||||||||||
| Withholding tax on restricted stock units | — | — | ( | — | — | — | ( | — | — | ( | |||||||||||||||||||||||||||||||||||||||||||||||||
| Issuance of shares under Employee Stock Purchase Plan | — | — | — | — | — | — | — | ||||||||||||||||||||||||||||||||||||||||||||||||||||
| Share-based compensation expense | — | — | — | — | — | — | — | — | |||||||||||||||||||||||||||||||||||||||||||||||||||
Net loss | — | — | — | — | — | — | — | — | ( | ( | |||||||||||||||||||||||||||||||||||||||||||||||||
| Foreign currency translation adjustment | — | — | — | — | — | — | — | ( | — | ( | |||||||||||||||||||||||||||||||||||||||||||||||||
| Balance, June 30, 2024 | ( | ( | ( | ||||||||||||||||||||||||||||||||||||||||||||||||||||||||
| Exercise of common stock options and release of RSUs | — | — | — | — | — | — | |||||||||||||||||||||||||||||||||||||||||||||||||||||
| Reissuance of treasury stock upon exercise of common stock options and release of RSUs | — | — | — | — | — | — | ( | ||||||||||||||||||||||||||||||||||||||||||||||||||||
| Withholding tax on restricted stock units | — | — | ( | — | — | — | ( | — | — | ( | |||||||||||||||||||||||||||||||||||||||||||||||||
| Issuance of shares under Employee Stock Purchase Plan | — | — | 1 | — | — | — | — | ||||||||||||||||||||||||||||||||||||||||||||||||||||
| Share-based compensation expense | — | — | — | — | — | — | — | — | |||||||||||||||||||||||||||||||||||||||||||||||||||
| Net loss | — | — | — | — | — | — | — | — | ( | ( | |||||||||||||||||||||||||||||||||||||||||||||||||
| Foreign currency translation adjustment | — | — | — | — | — | — | — | — | |||||||||||||||||||||||||||||||||||||||||||||||||||
| Balance, June 30, 2025 | ( | ( | ( | ||||||||||||||||||||||||||||||||||||||||||||||||||||||||
Release of RSUs | — | — | — | — | ( | — | — | ||||||||||||||||||||||||||||||||||||||||||||||||||||
Reissuance of treasury stock upon release of RSUs | — | — | — | — | — | — | ( | ||||||||||||||||||||||||||||||||||||||||||||||||||||
| Withholding tax on restricted stock units | — | — | ( | — | — | — | ( | — | — | ( | |||||||||||||||||||||||||||||||||||||||||||||||||
| Issuance of shares under Employee Stock Purchase Plan | — | — | 1 | — | — | — | — | ||||||||||||||||||||||||||||||||||||||||||||||||||||
| Repurchase of common shares under share repurchase program | — | — | — | — | ( | ( | — | — | — | ( | |||||||||||||||||||||||||||||||||||||||||||||||||
| Share-based compensation expense | — | — | — | — | — | — | — | — | |||||||||||||||||||||||||||||||||||||||||||||||||||
| Net loss | — | — | — | — | — | — | — | — | ( | ( | |||||||||||||||||||||||||||||||||||||||||||||||||
| Foreign currency translation adjustment | — | — | — | — | — | — | — | — | |||||||||||||||||||||||||||||||||||||||||||||||||||
Balance, June 30, 2026 | $ | $ | ( | $ | ( | $ | $ | ( | $ | $ | |||||||||||||||||||||||||||||||||||||||||||||||||
The accompanying notes are an integral part of these consolidated financial statements.
69
ALPHA AND OMEGA SEMICONDUCTOR LIMITED
CONSOLIDATED STATEMENTS OF CASH FLOWS
(in thousands)
| Year Ended June 30, | |||||||||||||||||
| 2026 | 2025 | 2024 | |||||||||||||||
| Cash flows from operating activities | |||||||||||||||||
Net loss | $ | ( | $ | ( | $ | ( | |||||||||||
Adjustments to reconcile net loss to net cash provided by (used in) operating activities: | |||||||||||||||||
| Depreciation and amortization | |||||||||||||||||
Equity method investment (income) loss | ( | ||||||||||||||||
Gain on recovery of privately-held investment | ( | ||||||||||||||||
| Share-based compensation expense | |||||||||||||||||
| Deferred income taxes, net | ( | ( | ( | ||||||||||||||
| Loss on disposal of property and equipment | |||||||||||||||||
| Impairment of property and equipment | |||||||||||||||||
| Impairment of privately-held investment | |||||||||||||||||
| Changes in operating assets and liabilities: | |||||||||||||||||
| Accounts receivable | ( | ( | |||||||||||||||
| Inventories | ( | ( | |||||||||||||||
| Other current and long-term assets | ( | ||||||||||||||||
| Payable related to equity investee, net | ( | ||||||||||||||||
| Accounts payable | ( | ( | |||||||||||||||
| Income taxes payable | ( | ( | |||||||||||||||
| Deferred revenue | ( | ( | |||||||||||||||
| Accrued and other liabilities | ( | ( | ( | ||||||||||||||
Net cash (used in) provided by operating activities | ( | ||||||||||||||||
| Cash flows from investing activities | |||||||||||||||||
| Proceeds from sale of equity interest in the JV Company | |||||||||||||||||
| Purchases of property and equipment | ( | ( | ( | ||||||||||||||
| Purchases of intangible assets | ( | ||||||||||||||||
| Proceeds from sale of property and equipment | |||||||||||||||||
Proceeds from sale of privately-held investment | |||||||||||||||||
| Government grants related to equipment | |||||||||||||||||
| Loan receivable from suppliers | ( | ||||||||||||||||
Net cash provided by (used in) investing activities | ( | ( | |||||||||||||||
| Cash flows from financing activities | |||||||||||||||||
| Withholding tax on restricted stock units | ( | ( | ( | ||||||||||||||
| Proceeds from exercise of stock options and ESPP | |||||||||||||||||
| Payments for repurchase of common shares | ( | ||||||||||||||||
| Repayments of borrowings | ( | ( | ( | ||||||||||||||
| Principal payments on finance leases | ( | ( | ( | ||||||||||||||
| Net cash used in financing activities | ( | ( | ( | ||||||||||||||
| Effect of exchange rate changes on cash, cash equivalents and restricted cash | ( | ( | |||||||||||||||
Net increase (decrease) in cash, cash equivalents and restricted cash | ( | ( | |||||||||||||||
| Cash, cash equivalents and restricted cash at beginning of year | |||||||||||||||||
| Cash, cash equivalents and restricted cash at end of year | $ | $ | $ | ||||||||||||||
70
ALPHA AND OMEGA SEMICONDUCTOR LIMITED
CONSOLIDATED STATEMENTS OF CASH FLOWS
(in thousands)
| Year Ended June 30, | |||||||||||||||||
| 2026 | 2025 | 2024 | |||||||||||||||
| Supplemental disclosures of cash flow information: | |||||||||||||||||
| Cash paid for interest | $ | $ | $ | ||||||||||||||
| Cash paid for income taxes | $ | $ | $ | ||||||||||||||
| Supplemental disclosures of non-cash investing and financing information: | |||||||||||||||||
| Property and equipment purchased but not yet paid | $ | $ | $ | ||||||||||||||
| Reissuance of treasury stock | $ | $ | $ | ||||||||||||||
| Reconciliation of cash, cash equivalents, and restricted cash: | |||||||||||||||||
| Cash and cash equivalents | $ | $ | $ | ||||||||||||||
| Restricted cash | |||||||||||||||||
| Total cash, cash equivalents, and restricted cash | $ | $ | $ | ||||||||||||||
The accompanying notes are an integral part of these consolidated financial statements.
71
ALPHA AND OMEGA SEMICONDUCTOR LIMITED
NOTES TO THE CONSOLIDATED FINANCIAL STATEMENTS
1. The Company and Significant Accounting Policies
The Company
Alpha and Omega Semiconductor Limited and its subsidiaries (the “Company”, “AOS”, “we” or “us”) design, develop and supply a broad range of power semiconductors. The Company's portfolio of products targets high-volume applications, including personal computers, graphic cards, game consoles, home appliances, power tools, smart phones, battery packs, consumer and industrial motor controls and power supplies for computers, servers and telecommunications equipment. The Company conducts its operations primarily in the United States, Hong Kong, China, and South Korea.
Basis of Preparation
Equity Method Investment Income (Loss)
The Company entered into a joint venture contract (the “JV Agreement”) with two investment funds owned by the Municipality of Chongqing (the “Chongqing Funds”), pursuant to which the Company and the Chongqing Funds formed a joint venture (the “JV Company”), which the Company records under the equity method of accounting in the periods presented because it has the ability to exercise significant influence, but not control, as determined in accordance with generally accepted accounting principles, over the operating and financial policies of the investee. Since the Company is unable to obtain accurate financial information from the JV Company in a timely manner, the Company’s share of earnings or losses of the JV Company is recorded on a one quarter lag. The Company discloses and recognizes intervening events at the JV Company in the lag period that could materially affect its consolidated financial statements, if applicable.
The Company records its interest in the net earnings or loss of the equity method investee, along with adjustments for unrealized profits or losses on intra-entity transactions and amortization of basis differences, within earnings or loss from equity interests in the Consolidated Statements of Operations. Profits or losses related to intra-entity sales with the equity method investee are eliminated until realized by the investor and investee. Basis differences represent differences between the cost of the investment and the underlying equity in net assets of the investment and are generally amortized over the lives of the related assets that gave rise to them. Equity method goodwill is not amortized; instead the equity method investment is tested for impairment. The Company reviews for impairment whenever factors indicate that the carrying amount of the investment is determined to be other than temporary. In such a case, the decrease in value is recognized in the period the impairment occurs in the Consolidated Statements of Operations.
Use of Estimates
The preparation of the consolidated financial statements in conformity with U.S. GAAP requires the Company to make estimates, judgments and assumptions that affect the reported amounts of assets, liabilities, revenue and expenses. To the extent there are material differences between these estimates and actual results, the Company's consolidated financial statements will be affected. On an ongoing basis, the Company evaluates the estimates, judgments and assumptions including those related to reserve of stock rotation returns, allowance for price adjustments, allowance for expected credit loss, inventory reserves, warranty accrual, income taxes, leases, share-based compensation, recoverability of and useful lives for property, plant and equipment.
Foreign Currency Transactions and Translation
Most of the Company's principal subsidiaries use U.S. dollars as their functional currency because their transactions are primarily conducted and settled in U.S. dollars. All of their revenues and a significant portion of their operating expenses are denominated in U.S. dollars. The functional currencies for the Company’s in-house packaging and testing facilities in China are U.S. dollars, and a majority of their capital expenditures are denominated in U.S. dollars. Foreign currency transactions are translated into the functional currencies using the exchange rates prevailing at the dates of the transactions. Foreign exchange gains and losses, resulting from the settlement of such transactions and from the re-measurement of monetary assets and liabilities denominated in foreign currencies using exchange rates at balance sheet date and non-monetary assets and liabilities using historical exchange rates, are recognized in the consolidated statements of operations.
72
For the Company’s subsidiaries which use the local currency as their functional currency, their results and financial position are translated into U.S. dollars using exchange rates at balance sheet dates for assets and liabilities and using average exchange rates for income and expenses items. The resulting translation differences are presented as a separate component of accumulated other comprehensive income (loss) in the consolidated statements of equity.
Cash, Cash Equivalents and Restricted Cash
Cash and cash equivalents primarily consist of cash on hand and short-term bank deposits with original maturities of three months or less. Cash equivalents are highly liquid investments with stated maturities of three months or less as of the dates of purchase. The carrying amounts reported for cash and cash equivalents are considered to approximate fair values based upon their short maturities.
Cash and cash equivalents are maintained with reputable major financial institutions. If, due to current economic conditions or other factors, one or more of the financial institutions with which the Company maintains deposits fails, the Company's cash and cash equivalents may be at risk. Deposits with these banks may exceed the amount of insurance provided on such deposits; however, these deposits typically may be redeemed upon demand and, therefore, bear minimal risk.
Accounts Receivable, net
Fair Value Measurements
Fair value is defined as the exchange price that would be received for an asset or paid to transfer a liability (an exit price) in the principal or most advantageous market for the asset or liability in an orderly transaction between market participants on the measurement date. Valuation techniques used to measure fair value must maximize the use of observable inputs and minimize the use of unobservable inputs. The fair value hierarchy is based on three levels of inputs, of which the first two are considered observable and the last unobservable, that may be used to measure fair value, which are the following:
•Level 1 - Quoted prices in active markets for identical assets or liabilities.
•Level 2 - Inputs other than Level 1 that are observable, either directly or indirectly, such as quoted prices for similar assets or liabilities; quoted prices in markets that are not active; or other inputs that are observable or can be corroborated by observable market data for substantially the full term of the assets or liabilities.
•Level 3 - Unobservable inputs that are supported by little or no market activity and that are significant to the fair value of the assets or liabilities.
Fair Value of Financial Instruments
The fair value of cash equivalents is based on observable market prices and have been categorized in Level 1 in the fair value hierarchy. Cash equivalents consist primarily of short-term bank deposits. The carrying values of financial instruments such as cash and cash equivalents, accounts receivable and accounts payable approximate their carrying values due to their short-term maturities. Level 2 inputs were used to estimate the fair value of the equity method investment for the purpose of recognizing the other than temporary impairment recorded in 2025. The carrying value of the Company’s debt is considered a reasonable estimate of fair value which is estimated by considering the current rates available to the Company for debt of the same remaining maturities, structure and terms of the debts.
Inventories
The Company carries inventories at the lower of cost (determined on a first-in, first-out basis) or net realizable value. Cost includes semiconductor wafer and raw materials, labor, depreciation expenses and other manufacturing expenses and
73
overhead, and packaging and testing fees paid to third parties if subcontractors are used. The Company evaluated its inventory for salability, obsolescence and other available applicable information. When evaluating the adequacy of its provision for excess and obsolete inventory, the Company identifies excess and obsolete products and also analyzes historical usage, forecasted demand, projected and current economic trends. If actual economic trends are less favorable than those forecasted, additional future inventory write-downs may be required, which could adversely affect our operating results.
Property, Plant and Equipment
Property, plant and equipment are stated at historical cost less accumulated depreciation. Historical cost includes expenditures that are directly attributable to the acquisition of the items and the costs incurred to make the assets ready for their intended use.
Depreciation is provided for on a straight-line basis over the estimated useful lives of the related assets as follows:
| Building and building improvements | ||||||||
| Manufacturing machinery and equipment | ||||||||
| Equipment and tooling | ||||||||
| Computer hardware and software | ||||||||
| Office furniture and equipment | ||||||||
| Leasehold improvements | ||||||||
| Vehicle | ||||||||
Equipment and construction in progress represent equipment received but the necessary installation has not been fully performed or building construction and leasehold improvements have been started but not yet completed. Equipment and construction in progress are stated at cost and transferred to the respective asset class when fully completed and ready for their intended use.
Internal-use software development costs are capitalized to the extent that the costs are directly associated with the development of identifiable and unique software products controlled by the Company that are expected to generate economic benefits beyond one year. Costs incurred during the application development stage are required to be capitalized. The application development stage is characterized by software design and configuration activities, coding, testing and installation. Training costs and maintenance are expensed as incurred, while upgrades and enhancements are capitalized if such expenditures will result in additional functionality. Costs include employee costs incurred and fees paid to outside consultants for the software development and implementation. Internally developed software is amortized over its estimated useful life of to five years starting from the date when it is ready for its intended use.
Gains and losses on disposals are determined by comparing the proceeds with the carrying amount and are recognized as selling, general and administrative expenses in the consolidated statements of operations. Costs of maintenance and repairs that do not improve or extend the lives of the respective assets are expensed as incurred.
Government Grants
Long-lived Assets
The Company reviews all long-lived assets whenever events or changes in circumstance indicate that these assets may not be recoverable. When evaluating long-lived assets, if the Company concludes that the estimated undiscounted cash flows
74
attributable to the assets are less than their carrying value, the Company recognizes an impairment loss based on the excess of the carrying amount of the assets over their respective fair values, which could adversely affect its results of operations.
During the fiscal year ended June 30, 2026 and 2025, the Company identified certain purchased manufacturing equipment that was unable to meet its production process requirements. Because the equipment had no alternative uses, the Company recorded an impairment of $0.3 million and $1.0 million, respectively, related to such equipment. There was no impairment of long-lived assets for fiscal year 2024.
Revenue Recognition
The Company determines revenue recognition through the following steps: (1) identification of the contract with a customer; (2) identification of the performance obligations in the contract; (3) determination of the transaction price; (4) allocation of the transaction price to the performance obligations in the contract; and (5) recognition of revenue when, or as, a performance obligation is satisfied. The Company recognizes revenue at a point in time when its performance obligation has been satisfied and control of the product is transferred to the customer, as determined by the agreed upon shipping terms, net of estimated stock rotation returns and price adjustments that it expects to provide to certain distributors. The Company presents revenue net of sales taxes and any similar assessments. Our standard payment terms range from 30 to 60 days.
The Company sells its products primarily to distributors, who in turn sell the products globally to various end customers. Sales to most distributors are made under terms allowing certain price adjustments of the Company’s products held in their inventory or upon sale to their end customers. Revenue from sales to distributors is recognized upon the transfer of control to the distributor. In the ordinary course of business, our distributors may need to sell our products to end customers at prices below the standard distribution price in order to remain competitive and secure sales. After the distributors sell the Company’s products to their end customers, the distributors submit a “ship-and-debit” price adjustment claim to the Company to adjust the distributor’s cost from the standard price to the pre-approved lower price. After the Company verifies that the claim was pre-approved, a credit memo is issued to the distributors for the ship-and-debit claim. In determining the transaction price, the Company considers ship-and-debit price adjustments to be variable consideration. The Company estimates the variable consideration of the allowance for price adjustments at the time revenue is recognized. The Company also allows stock rotation returns from certain distributors. Stock rotation returns are governed by contract and are limited to a specified percentage of the monetary value of products purchased by distributors during a specified period. The Company records an allowance for stock rotation returns based on historical returns, expected sales volumes and individual distributor agreements. Allowance for price adjustments is recorded against accounts receivable and the provision for stock rotation rights is included in accrued liabilities on the consolidated balance sheets.
The Company’s performance obligations relate to contracts with a duration of less than one year. The Company elected to apply the practical expedient provided in ASC 606, “Revenue from Contracts with Customers”. Therefore, the Company is not required to disclose the aggregate amount of transaction price allocated to performance obligations that are unsatisfied or partially unsatisfied at the end of the reporting period.
The Company recognizes the incremental direct costs of obtaining a contract, which consist of sales commissions, when control over the products they relate to transfers to the customer. Applying the practical expedient, the Company recognizes commissions as expense when incurred, as the amortization period of the commission asset the Company would have otherwise recognized is less than one year.
Packaging and testing services revenue is recognized at a point in time upon shipment of serviced products to the customer.
License and Development Services Revenue Recognition
Leases
75
The Company determines if an arrangement is a lease at inception. Operating leases are included in operating lease right-of-use (“ROU”) assets, current operating lease liabilities and long-term operating lease liabilities on the Company's consolidated balance sheets. Finance leases are included in property, plant and equipment, finance lease liabilities and long-term finance leases liabilities on the consolidated balance sheets.
Product Warranty
The Company provides a standard one-year warranty for products from the date of purchase by the end customers. The Company accrues for estimated warranty costs at the time revenue is recognized. The Company's warranty obligation is determined by product failure rates, labor and material costs for replacing defective parts, related freight costs for failed parts and other costs to fulfill warranty obligation. The Company monitors its warranty claims and maintains warranty reserves based on historical experiences and anticipated warranty claims known at the time of estimation.
Shipping and Handling Costs
Shipping and handling costs are included in cost of goods sold.
Research and Development
Provision for Income Taxes
Income tax expense or benefit is based on income or loss before taxes. Deferred tax assets and liabilities are recognized principally for the expected tax consequences of temporary differences between the tax basis of assets and liabilities and their reported amounts.
The Company is subject to income taxes in a number of jurisdictions. Significant judgment is required in determining the worldwide provision for income taxes. There are many transactions and calculations for which the ultimate tax determination is uncertain during the ordinary course of business. The Company establishes accruals for certain tax contingencies based on estimates of whether additional taxes may be due. While the final tax outcome of these matters may differ from the amounts that were initially recorded, such differences will impact the income tax and deferred tax provisions in the period in which such determination is made.
Significant management judgment is also required in determining whether deferred tax assets will be realized in full or in part. When it is more likely than not that all or some portion of specific deferred tax assets such as net operating losses or research and experimentation tax credit carryforwards will not be realized, a valuation allowance must be established for the amount of the deferred tax assets that cannot be realized. The Company considers all available positive and negative evidence on a jurisdiction-by-jurisdiction basis when assessing whether it is more likely than not that deferred tax assets are recoverable. The Company considers evidence such as our past operating results, the existence of cumulative losses in recent years and our forecast of future taxable income. The Company has concluded that it should report a full valuation allowance on its state research and development tax credit carryforwards as the Company annually generates more state R&D tax credits than it could use based on its forecasts.
The Financial Accounting Standards Board (FASB) issued guidance which clarifies the accounting for income taxes by prescribing a minimum probability threshold that a tax position must meet before a financial statement benefit is recognized. The minimum threshold is defined as a tax position that is more likely than not to be sustained upon examination by the applicable taxing authority, including resolution of any related appeals or litigation processes, based on the technical merits of the position. The tax benefit to be recognized is measured as the largest amount of benefit that is greater than fifty percent
76
likely to be realized upon ultimate settlement. Although the guidance on the accounting for uncertainty in income taxes prescribes the use of a recognition and measurement model, the determination of whether an uncertain tax position has met those thresholds will continue to require significant judgment by management. If the ultimate resolution of tax uncertainties is different from what is currently estimated, a material impact on income tax expense could result.
The Company's provision for income taxes is subject to volatility and could be adversely impacted by changes in earnings or tax laws and regulations in various jurisdictions. The Company is subject to the continuous examination of our income tax returns by the Internal Revenue Service and other tax authorities. The Company regularly assesses the likelihood of adverse outcomes resulting from these examinations to determine the adequacy of our provision for income taxes. To the extent that the final tax outcome of these matters is different from the amounts recorded, such differences will impact the provision for income taxes in the period in which such determination is made. The provision for income taxes includes the impact of changes to reserves, as well as the related net interest and penalties.
Share-based Compensation Expense
The Company maintains an equity-settled, share-based compensation plan to grant restricted share units. The Company recognizes expense related to share-based compensation awards that are ultimately expected to vest based on estimated fair values on the date of grant. The fair value of restricted share units is based on the fair value of the Company's common share on the date of grant. For restricted stock awards subject to market conditions, the fair value of each restricted stock award is estimated at the date of grant using the Monte-Carlo pricing model. Share-based compensation expense is recognized on the accelerated attribution basis over the requisite service period of the award, which generally equals the vesting period. In addition, judgment is also required in estimating the number of stock-based awards that are expected to be forfeited. Forfeitures are estimated based on historical experience.
Advertising
Advertising expenditures are expensed as incurred. Advertising expense was $0.5 million, $0.5 million and $0.6 million in the fiscal years ended June 30, 2026, 2025, and 2024, respectively.
Comprehensive Income (Loss)
Recent Accounting Pronouncements
Recently Adopted Accounting Standards
In December 2023, the FASB issued ASU No. 2023-09, Income Taxes (Topic 740): Improvements to Income Tax Disclosures (“ASU No. 2023-09”). The purpose of this guidance is to enhance the transparency and usefulness of income tax disclosures and provide comprehensive income tax information, particularly in relation to rate reconciliation and income taxes paid in the U.S. and foreign jurisdictions. ASU No. 2023-09 is effective for fiscal years beginning after December 15, 2024. This guidance impacts only the Company’s disclosures with no impacts to its financial condition or results of operations. The Company adopted this guidance for the year ended June 30, 2026 on a prospective basis. See Note 12. Income Taxes for additional information.
Recently Issued Accounting Standards not yet adopted
In November 2024, the FASB issued ASU No. 2024-03, “Income Statement – Reporting Comprehensive Income – Expense Disaggregation Disclosures”, which improves disclosure requirements and provides more detailed information about an entity’s expenses, specifically amounts related to purchases of inventory, employee compensation, depreciation, intangible asset amortization, and selling expenses, along with qualitative descriptions of certain other types of expenses. This guidance is effective for fiscal years beginning after December 15, 2026, and interim periods within fiscal years beginning after December 15, 2027, with early adoption permitted. The Company is currently evaluating the impact of the ASU on its consolidated financial statements.
In July 2025, the FASB issued ASU No. 2025-05, “Financial Instruments – Credit Losses (Topic 326): Measurement of Credit Losses for Accounts Receivable and Contract Assets”, which provides an optional practical expedient for estimating
77
future credit losses based on current conditions as of the balance sheet date and assuming those conditions do not change over the remaining life of the accounts receivable. The guidance will be effective for annual reporting periods beginning after December 15, 2025, and interim reporting periods within those annual reporting periods, with early adoption permitted. The Company does not expect this ASU to have a material impact on its consolidated financial statements.
In September 2025, the FASB issued ASU No. 2025-06, “Intangibles - Goodwill and Other - Internal-Use Software (Subtopic 350-40): Targeted Improvements to the Accounting for Internal-Use Software”. The ASU removes references to prescriptive software development stages and includes an updated framework for capitalizing internal software costs. The guidance will be effective for annual reporting periods beginning after December 15, 2027, and interim reporting periods within those annual reporting periods, with early adoption permitted. The Company is currently evaluating the impact of the ASU on its consolidated financial statements.
In December 2025, the FASB issued ASU No. 2025-10, “Accounting for Government Grants Received by Business Entities”. This amendment provides guidance on the recognition, measurement, and presentation of government grants. This amendment will be effective for annual reporting periods beginning after December 15, 2028, and interim reporting periods within those annual reporting periods, with early adoption permitted. The Company is currently evaluating the impact of the ASU on its consolidated financial statements.
In December 2025, the FASB issued ASU 2025-11, “Interim Reporting (Topic 270): Narrow-scope Improvements”. This update makes targeted, narrow-scope improvements to the interim reporting guidance in Topic 270 to clarify application and improve consistency in practice. The amendments do not change the underlying principles of interim reporting. The ASU is effective for interim reporting periods within annual reporting periods beginning after December 15, 2027. Early adoption is permitted. The Company is currently evaluating the impact of the ASU on its condensed consolidated financial statements and disclosures.
78
2. Equity Method Investment in Equity Investee
At the beginning of fiscal year 2024, we held 42.2 % interest in the JV company. In February 2024, the JV Company repurchased certain shares that were previously issued to employees under the employee equity incentive plan, which increased the Company’s percentage of equity ownership in the JV Company by 0.54 %.
On December 30, 2024, the JV Company signed an investment agreement with an investor, pursuant to which the third-party investor agreed to invest RMB 500 million (or $68.5 million based on the currency exchange rate between RMB and U.S. Dollar on December 31, 2024) in the JV Company in exchange for a 7.09 % interest. This transaction closed on January 15, 2025, at which time, the percentage of outstanding JV Company’s equity interest owned by the Company was reduced to approximately 39.2 %.
In the fourth quarter of fiscal year 2025, the Company began negotiations with a third-party strategic investor to sell a portion of its outstanding equity interest in the JV Company. On July 14, 2025, the Company entered into an equity transfer agreement with the investor to sell approximately 20.3 % of outstanding equity interest in the JV Company for an aggregate cash consideration of approximately $150 million to be paid in four installments, subject to satisfaction of certain conditions. As of June 30, 2026, all of the conditions were satisfied, and the Company received all installment payments.
The Company identified the negotiations of the equity transfer agreement throughout the fourth quarter of fiscal year 2025 as an impairment indicator and performed a quantitative impairment test as of June 30, 2025. Based on the implied valuation of the JV Company per the transaction price in the equity transfer agreement, the fair value of the equity method investment was determined to be lower than its carrying value, and a $76.8 million other-than-temporary impairment of the equity method investment was recognized as of June 30, 2025. The impairment loss is recorded within Equity method investment loss in the consolidated statement of operations for the year-ended June 30, 2025.
The Company accounts for its investment in the JV Company as an equity method investment and reports its equity in earnings or loss of the JV Company on a three-month lag due to an inability to timely obtain financial information of the JV Company. During the fiscal year ended June 30, 2026, the Company recorded $0.8 million of equity method investment income, including the $1.1 million gain on the related sale of a portion of its interest in the equity method investment and immaterial loss of its equity share of the JV Company, using lag reporting. During the fiscal years ended June 30, 2025 and 2024, the Company recorded $77.8 million including the impairment loss and $4.8 million of equity method investment loss, respectively, using lag reporting. As of June 30, 2026, the percentage of outstanding JV equity interest beneficially owned by the Company was 18.9 %. The difference between the investment’s carrying value on June 30, 2026 of $142.7 million and the underlying equity in net assets of approximately $54.8 million as of March 31, 2026 relates primarily to equity method goodwill.
Summarized Financial Information
The following table presents summarized financial information for the JV Company (in thousands):
| As of March 31, 2026 | As of March 31, 2025 | As of March 31, 2024 | ||||||||||||||||||
| Current assets | $ | $ | $ | |||||||||||||||||
| Non-current assets | $ | $ | $ | |||||||||||||||||
| Current liabilities | $ | $ | $ | |||||||||||||||||
| Non-current liabilities | $ | $ | $ | |||||||||||||||||
| For the period April 1, 2025 to March 31, 2026 | For the period April 1, 2024 to March 31, 2025 | For the period April 1, 2023 to March 31, 2024 | ||||||||||||||||||
| Revenue | $ | $ | $ | |||||||||||||||||
Gross profit | $ | $ | $ | |||||||||||||||||
| Operating expenses | $ | $ | $ | |||||||||||||||||
| Net loss | $ | $ | $ | |||||||||||||||||
79
3. Related Party Transactions
As of June 30, 2026, the Company owned 18.9 % equity interest in the JV Company, which, by definition, is a related party to the Company. The JV Company supplies 12-inch wafers and provides assembly and testing services to AOS. The JV Company reimbursed AOS for purchases made on its behalf of $1.1 million, $11.3 million and $9.8 million during the fiscal year ended June 30, 2026, 2025 and 2024, respectively. Due to the right of offset of receivables and payables with the JV Company, as of June 30, 2026 and 2025, AOS recorded the net amount of $8.7 million and $15.8 million, respectively, as a payable related to equity investee, net, on the Consolidated Balance Sheet. The purchases by AOS for the fiscal year ended June 30, 2026, 2025 and 2024 were $105.4 million, $109.1 million and $96.6 million, respectively.
80
4. Net Loss Per Common Share
Basic net income (loss) per share is computed using the weighted-average number of common shares outstanding during the period. Diluted net income (loss) per share is computed using the weighted-average number of common shares outstanding, plus potential shares of common stock during the period. Potential shares of common stock include dilutive shares attributable to the assumed exercise of share options, employee share purchase plan shares and vesting of restricted stock units using the treasury stock method. Under the treasury stock method, potential common shares outstanding are not included in the computation of diluted net income (loss) per share if their effect is anti-dilutive.
The following table presents the calculation of basic and diluted net loss per share:
| Year Ended June 30, | |||||||||||||||||
| 2026 | 2025 | 2024 | |||||||||||||||
| (in thousands, except per share data) | |||||||||||||||||
| Numerator: | |||||||||||||||||
Net loss | $ | ( | $ | ( | $ | ( | |||||||||||
| Denominator: | |||||||||||||||||
| Basic: | |||||||||||||||||
Weighted average number of common shares used to compute basic net loss per share | |||||||||||||||||
| Diluted: | |||||||||||||||||
Weighted average number of common shares used to compute diluted net loss per share | |||||||||||||||||
| Net loss per share: | |||||||||||||||||
| Basic | $ | ( | $ | ( | $ | ( | |||||||||||
| Diluted | $ | ( | $ | ( | $ | ( | |||||||||||
The following potential dilutive securities were excluded from the computation of diluted net loss per share as their effect would have been anti-dilutive:
| Year Ended June 30, | |||||||||||||||||
| 2026 | 2025 | 2024 | |||||||||||||||
| (in thousands) | |||||||||||||||||
| Employee stock options and RSUs | |||||||||||||||||
| ESPP | |||||||||||||||||
| Total potential dilutive securities | |||||||||||||||||
81
5. Concentration of Credit Risk and Significant Customers
The Company manages its credit risk associated with exposure to distributors and direct customers on outstanding accounts receivable through the application and review of credit approvals, credit ratings and other monitoring procedures. In some instances, the Company also obtains letters of credit from certain customers.
Credit sales, which are mainly on credit terms of 30 to 60 days, are only made to customers who meet the Company’s credit requirements, while sales to new customers or customers with low credit ratings are usually made on an advance payment basis. The Company considers its trade accounts receivable to be of good credit quality because its key distributors and direct customers have long-standing business relationships with the Company and the Company has not experienced any significant bad debt write-offs of accounts receivable in the past. The Company closely monitors the aging of accounts receivable from its distributors and direct customers, and regularly reviews their financial positions, where available.
Summarized below are individual customers whose revenue or accounts receivable balances were 10% or higher than the respective total consolidated amounts:
| Year Ended June 30, | ||||||||||||||||||||
| Percentage of revenue | 2026 | 2025 | 2024 | |||||||||||||||||
| Customer A | % | % | % | |||||||||||||||||
| Customer B | % | % | % | |||||||||||||||||
| June 30, | ||||||||||||||
| Percentage of accounts receivable | 2026 | 2025 | ||||||||||||
| Customer A | * | % | ||||||||||||
| Customer B | % | % | ||||||||||||
* Less than 10%
82
6. Balance Sheet Components
Accounts receivable, net
June 30, | |||||||||||
| 2026 | 2025 | ||||||||||
(in thousands) | |||||||||||
| Accounts receivable | $ | $ | |||||||||
| Less: Allowance for price adjustments | ( | ( | |||||||||
| Less: Allowance for credit losses | ( | ( | |||||||||
| Accounts receivable, net | $ | $ | |||||||||
Inventories
June 30, | |||||||||||
| 2026 | 2025 | ||||||||||
| (in thousands) | |||||||||||
| Raw materials | $ | $ | |||||||||
| Work in-process | |||||||||||
| Finished goods | |||||||||||
| $ | $ | ||||||||||
Other current assets
June 30, | |||||||||||
| 2026 | 2025 | ||||||||||
| (in thousands) | |||||||||||
| Value-added tax receivable | $ | $ | |||||||||
| Other prepaid expenses | |||||||||||
| Prepaid insurance | |||||||||||
| Prepaid maintenance | |||||||||||
| Deposit with supplier | |||||||||||
| Prepaid income tax | |||||||||||
| Interest receivable | |||||||||||
| Short term deposit | |||||||||||
| Other receivables | |||||||||||
| $ | $ | ||||||||||
83
Property, plant and equipment, net
June 30, | |||||||||||
| 2026 | 2025 | ||||||||||
| (in thousands) | |||||||||||
| Land | $ | $ | |||||||||
| Building and building improvements | |||||||||||
| Manufacturing machinery and equipment | |||||||||||
| Equipment and tooling | |||||||||||
| Computer equipment and software | |||||||||||
| Office furniture and equipment | |||||||||||
| Leasehold improvements | |||||||||||
| Less: accumulated depreciation and amortization | ( | ( | |||||||||
| Equipment and construction in progress | |||||||||||
| Property, plant and equipment, net | $ | $ | |||||||||
Total depreciation expense was $51.1 million, $54.2 million and $50.5 million for fiscal years 2026, 2025 and 2024, respectively.
The Company capitalized $0.0 million, $0.2 million and $0.6 million of software development costs during fiscal years 2026, 2025 and 2024, respectively. Amortization of capitalized software development costs was $0.3 million in fiscal year 2026, $0.5 million in fiscal year 2025 and $0.6 million in fiscal year 2024. Unamortized capitalized software development costs in each of the periods presented at June 30, 2026 and 2025 were $0.4 million and $0.7 million, respectively.
Other long-term assets
June 30, | |||||||||||
| 2026 | 2025 | ||||||||||
| (in thousands) | |||||||||||
| Prepayments for property and equipment | $ | $ | |||||||||
| Customs deposit | |||||||||||
| Deposit with supplier | |||||||||||
Long-term loan receivable | |||||||||||
| Office leases deposits | |||||||||||
| Other | |||||||||||
| $ | $ | ||||||||||
84
Intangible assets, net
June 30, | |||||||||||
| 2026 | 2025 | ||||||||||
| (in thousands) | |||||||||||
| Patents and technology rights | $ | $ | |||||||||
| Software license | |||||||||||
| Trade name | |||||||||||
| Customer relationships | |||||||||||
| Less: accumulated amortization | ( | ( | |||||||||
| Goodwill | |||||||||||
| Intangible assets, net | $ | $ | |||||||||
The Company is amortizing intangible assets of patents and technology rights related to a license agreement with STMicroelectronics International N.V. Amortization expense for intangible assets was $1.1 million, $3.2 million and $3.2 million for the years ended June 30, 2026, 2025 and 2024, respectively. The estimated useful lives for patents and technology rights and trade name were five years and ten years , respectively. All intangible assets, except software license were fully amortized as of June 30, 2026. The weighted average useful lives for software license was approximately three years .
Accrued liabilities
June 30, | |||||||||||
| 2026 | 2025 | ||||||||||
| (in thousands) | |||||||||||
| Accrued compensation and benefits | $ | $ | |||||||||
| Warranty accrual | |||||||||||
| Stock rotation accrual | |||||||||||
| Accrued professional fees | |||||||||||
| Accrued inventory | |||||||||||
| Accrued facilities related expenses | |||||||||||
| Accrued property, plant and equipment | |||||||||||
| Other accrued expenses | |||||||||||
| Customer deposits | |||||||||||
| ESPP payable | |||||||||||
| $ | $ | ||||||||||
Short-term customer deposits are payments received from customers for securing future product shipments. As of June 30, 2026, $5.0 million were from Customer A and $5.0 million were from other customers. As of June 30, 2025, $7.0 million were from Customer A, $2.0 million were from Customer B, and $8.0 million were from other customers.
85
The activity in the warranty accrual, included in accrued liabilities is as follows:
| Year Ended June 30, | |||||||||||||||||
| 2026 | 2025 | 2024 | |||||||||||||||
| (in thousands) | |||||||||||||||||
| Beginning balance | $ | $ | $ | ||||||||||||||
| Addition | |||||||||||||||||
| Released | ( | ||||||||||||||||
| Utilization | ( | ( | ( | ||||||||||||||
| Ending balance | $ | $ | $ | ||||||||||||||
| Year Ended June 30, | |||||||||||||||||
| 2026 | 2025 | 2024 | |||||||||||||||
| (in thousands) | |||||||||||||||||
| Beginning balance | $ | $ | $ | ||||||||||||||
| Addition | |||||||||||||||||
| Utilization | ( | ( | ( | ||||||||||||||
| Ending balance | $ | $ | $ | ||||||||||||||
Other long-term liabilities
June 30, | |||||||||||
| 2026 | 2025 | ||||||||||
(in thousands) | |||||||||||
Customer deposits | $ | $ | |||||||||
| Other | |||||||||||
| Other long-term liabilities | $ | $ | |||||||||
Customer deposits are payments received from customers for securing future product shipments. As of June 30, 2026, $3.5 million were from other customers. As of June 30, 2025, $5.0 million were from Customer A and $2.0 million were from other customers.
86
7. Bank Borrowing
Accounts receivable factoring agreement
On August 9, 2019, one of the Company's wholly-owned subsidiaries (the "Borrower") entered into a factoring agreement with the Hongkong and Shanghai Banking Corporation Limited (“HSBC”), whereby the Borrower assigns certain of its accounts receivable with recourse. This factoring agreement allows the Borrower to borrow up to 70% of the net amount of its eligible accounts receivable of the Borrower with a maximum amount of $30.0 million. The interest rate is based on the Secured Overnight Financing Rate ("SOFR)", plus 2.01% per annum. The Company is the guarantor for this agreement. The Company is accounting for this transaction as a secured borrowing under the Transfers and Servicing of Financial Assets guidance. In addition, any cash held in the restricted bank account controlled by HSBC has a legal right of offset against the borrowing. This agreement, with certain financial covenants required, has no expiration date. On August 11, 2021, the Borrower signed an agreement with HSBC to decrease the borrowing maximum amount to $8.0 million with certain financial covenants required. Other terms remain the same. In August 2025, this factoring agreement was terminated. As of June 30, 2026, there was no outstanding balance.
Debt financing
In September 2021, Jireh Semiconductor Incorporated (“Jireh”), one of the Company’s wholly-owned subsidiaries, entered into a financing arrangement agreement with a company (“Lender”) for the lease and purchase of a machinery equipment manufactured by a supplier. This agreement includes a payment term of five (5) years, pursuant to which Jireh commenced payments of interest and principal to the Lender in September 2022 when the final installation and acceptance of the equipment were completed. After the end of such payment term, Jireh has the option to purchase the equipment for $1. The implied interest rate was 4.75% per annum which was adjustable based on every five basis point increase in 60-month U.S. Treasury Notes. The total purchase price of this equipment was euro 12.0 million. In April 2021, Jireh made a down payment of euro 6.0 million, representing 50% of the total purchase price of the equipment, to the supplier. In June 2022, the equipment was delivered to Jireh after Lender paid 40% of the total purchase price, for euro 4.8 million, to the supplier on behalf of Jireh. In September 2022, Lender paid the remaining 10% payment for the total purchase price and reimbursed Jireh for the 50% down payment, after the installation and configuration of the equipment. The title of the equipment was transferred to Lender following such payment. The agreement was amended with fixed implied interest rate of 7.51% and monthly payment of principal and interest effective in October 2022. Other terms remain the same. In addition, Jireh purchased hardware for the machine under this financing arrangement. The purchase price of this hardware was $0.2 million. The financing arrangement is secured by this equipment and other equipment at Jireh, which had a net book value of $10.5 million as of June 30, 2026. As of June 30, 2026, the outstanding balance of this debt financing was $3.6 million.
Long-term bank borrowings
On August 18, 2021, Jireh entered into a term loan agreement with a financial institution (the "Bank") in an amount up to $45.0 million for the purpose of expanding and upgrading the Company’s fabrication facility located in Oregon. The obligation under the loan agreement is secured by substantially all assets of Jireh and guaranteed by the Company. The agreement has a term and matures on February 16, 2027. Jireh is required to make consecutive quarterly payments of principal and interest. The loan accrues interest based on the SOFR plus the applicable margin based on the outstanding balance of the loan. This agreement contains customary restrictive covenants and includes certain financial covenants that the Company is required to maintain. Jireh drew down $45.0 million on February 16, 2022 with the first payment of principal beginning in October 2022. As of June 30, 2025, Jireh was in compliance with these covenants and the outstanding balance of this loan was $20.3 million. In August 2025, the Company paid the outstanding balance in full. As of June 30, 2026, there was no outstanding balance.
At June 30, 2026, maturities of short-term debt and long-term debt were as follows (in thousands):
87
| Year ending June 30, | |||||||||||
| 2027 | $ | ||||||||||
| 2028 | |||||||||||
| Total principal | $ | ||||||||||
| Short-term Debt | Long-term Debt | Total | |||||||||||||||
| Principal amount | $ | $ | $ | ||||||||||||||
88
8. Leases
The Company evaluates contracts for lease accounting at contract inception and assesses lease classification at the lease commencement date. Operating leases are included in operating lease right-of-use (“ROU”) assets, operating lease liabilities and operating lease liabilities - long-term on the Company's consolidated balance sheets. Finance leases are included in property, plant and equipment, finance lease liabilities and finance lease liabilities-long-term on the consolidated balance sheets. The Company recognizes a ROU asset and corresponding lease obligation liability at the lease commencement date where the lease obligation liability is measured at the present value of the minimum lease payments. As most of the leases do not provide an implicit rate, the Company uses its incremental borrowing rate at lease commencement. The Company uses an interest rate commensurate with the interest rate to borrow on a collateralized basis over a similar term with an amount equal to the lease payments. Operating leases are primarily related to offices, research and development facilities, sales and marketing facilities, and manufacturing facilities. In addition, long-term supply agreements to lease gas tank equipment and purchase industrial gases are accounted for as operating leases. Lease agreements frequently include renewal provisions and require the Company to pay real estate taxes, insurance and maintenance costs. For operating leases, the amortization of the ROU asset and the accretion of its lease obligation liability result in a single straight-line expense recognized over the lease term. The finance lease is related to the $5.1 million of a machinery lease financing with a vendor. In September 2022, the lease was amended to make a monthly payment of principal and interest as a fixed amount effective in October 2022. Other terms remain the same. The amendment was accounted for as a lease modification and no gain or loss was recognized. The Company does not record leases on the consolidated balance sheet with a term of one year or less.
The components of the Company’s operating and finance lease expenses are as follows for the years presented (in thousands):
| Year Ended June 30, | ||||||||||||||||||||
| 2026 | 2025 | 2024 | ||||||||||||||||||
| Operating leases: | ||||||||||||||||||||
| Fixed rent expense | $ | $ | $ | 6,268 | ||||||||||||||||
| Variable rent expense | 1,095 | |||||||||||||||||||
| Finance lease: | ||||||||||||||||||||
Depreciation of equipment | 513 | |||||||||||||||||||
| Interest | 277 | |||||||||||||||||||
| Short-term leases: | ||||||||||||||||||||
| Short-term lease expenses | 161 | |||||||||||||||||||
| Total lease expenses | $ | $ | $ | 8,314 | ||||||||||||||||
89
Supplemental balance sheet information related to the Company’s operating and finance leases is as follows (in thousands, except lease term and discount rate):
June 30, | ||||||||||||||
| 2026 | 2025 | |||||||||||||
Operating Leases: | ||||||||||||||
| ROU assets associated with operating leases | $ | $ | ||||||||||||
| Finance Lease: | ||||||||||||||
| Property, plant and equipment, gross | $ | $ | ||||||||||||
| Accumulated depreciation | ( | ( | ||||||||||||
| $ | $ | |||||||||||||
| Weighted average remaining lease term (in years) | ||||||||||||||
| Operating leases | ||||||||||||||
| Finance lease | ||||||||||||||
| Weighted average discount rate | ||||||||||||||
| Operating leases | % | % | ||||||||||||
| Finance lease | % | % | ||||||||||||
Supplemental cash flow information related to the Company’s operating and finance leases is as follows (in thousands):
| Year Ended June 30, | ||||||||||||||||||||
| 2026 | 2025 | 2024 | ||||||||||||||||||
| Cash paid from amounts included in the measurement of lease liabilities: | ||||||||||||||||||||
| Operating cash flows from operating leases | $ | $ | $ | 6,330 | ||||||||||||||||
| Operating cash flows from finance lease | $ | $ | $ | 277 | ||||||||||||||||
| Financing cash flows from finance lease | $ | $ | $ | 867 | ||||||||||||||||
| Non-cash investing and financing information: | ||||||||||||||||||||
| Operating lease right-of-use assets obtained in exchange for lease obligations | $ | $ | $ | 5,884 | ||||||||||||||||
Future minimum lease payments are as follows as of June 30, 2026 (in thousands):
| Operating Leases | Finance Leases | ||||||||||
2027 | $ | $ | |||||||||
2028 | |||||||||||
2029 | |||||||||||
| 2030 | |||||||||||
2031 | |||||||||||
| Thereafter | |||||||||||
| Total minimum lease payments | |||||||||||
| Less amount representing interest | ( | ( | |||||||||
| Total lease liabilities | $ | $ | |||||||||
90
9. Shareholders’ Equity
Common Shares
The Company’s Bye-laws, as amended, authorized the Company to issue 100,000,000 common shares with par value of $0.002 . Each common share is entitled to one vote. The holders of common shares are also entitled to receive dividends whenever funds are legally available and when and if declared by the board of directors. No dividends had been declared as of June 30, 2026.
In November 2025, the Board of Directors of the Company approved a new share repurchase program (the “Repurchase Program”) that authorizes the Company to repurchase its common shares from the open market pursuant to a pre-established Rule 10b5-1 trading plan or through privately negotiated transactions up to an aggregate of $30.0 million. The amount and timing of any repurchases under the Repurchase Program depend on a number of factors, including but not limited to, the trading price, volume and availability of the Company’s common shares. Shares repurchased under this program are accounted
for as treasury shares and the total cost of shares repurchased is recorded as a reduction of shareholders' equity. From time to time, treasury shares may be reissued as part of the Company’s share-based compensation programs. Gains on the reissuance of treasury stock are credited to additional paid-in capital; losses are charged to additional paid-in capital to offset the net gains, if any, from previous sales or reissuance of treasury stock. Any remaining balance of the losses is charged to retained earnings.
During fiscal year 2026, the Company repurchased an aggregate of 941,883 shares from the open market, for a total cost of $18.2 million, excluding fees and related expenses, at an average price of $19.22 per share. As of June 30, 2026, approximately $11.9 million remained available under the Repurchase Program.
91
10. Share-based Compensation
2018 Omnibus Incentive Plan
The 2009 Share Option/Share Issuance Plan (the “2009 Plan”) was approved in September 2009 at the annual general meeting of shareholders in connection with the Company's IPO. At the annual general meeting of shareholders in November 2018, the 2009 Plan was approved to be terminated and the 2018 Omnibus Incentive Plan (the “2018 Plan”) was effective. No further awards will be made under the 2009 Plan. The 2018 Plan authorized the board of directors to grant incentive share options, non-statutory share options and restricted shares to employees, directors, non-employee directors and consultants of the Company and its subsidiaries for up to 2,065,000 common shares. The 2018 Plan does not include an evergreen authorization. Therefore, the Company is not permitted to increase the number of shares reserved in the share pool without obtaining further shareholder approval. Outstanding shares under the 2018 Plan and awards granted under the 2009 Plan that expire, are forfeited or cancelled or terminate prior to the issuance of the shares subject to those awards or are settled in cash will be available for subsequent issuance under the 2018 Plan. At the annual general meeting of shareholders from 2021 to 2025, the shares reserved for issuance under the 2018 Plan was approved to increase by a total of 3,137,000 shares, to 5,202,000 shares. As of June 30, 2026, 361,313 shares were available for grant under the 2018 Plan.
Beginning with the 2014 Annual Shareholders Meeting, on the date of each annual shareholders meeting, each individual who commences service as a non-employee Board member by reason of his or her election to the Board at such annual meeting and each individual who is to continue to serve as a non-employee Board member, whether or not that individual is standing for re-election to the Board at that particular annual meeting, will automatically be granted an award in the form of restricted share units covering that number of common shares determined by dividing one hundred sixty thousand dollars ($160,000 ) by the average fair market value per share for the ninety (90 )-day period preceding the grant date, up to a maximum of 10,000 shares.
Under the 2018 Plan, incentive share options and RSU are to be granted at a price that is not less than 100 85 % of the fair value of the common shares, at the date of grant for employees and consultants. Options and RSUs generally vest over a four-year to five-year period, and are exercisable for a maximum period of ten years after the date of grant.
The fair value of RSU, including time-based restricted stock units and performance-based restricted stock units is based on the market price of the Company's common shares on the date of grant.
Time-based Restricted Stock Units (“TRSU”)
The total fair value of TRSUs vested during the years ended June 30, 2026, 2025 and 2024 was $17.7 million, $17.9 million and $15.6 million, respectively. The following table summarizes the Company’s TRSU activities:
Number of Time-based Restricted Stock Units | Weighted Average Grant Date Fair Value Per Share | Weighted Average Remaining Recognition Period (Years) | Aggregate Intrinsic Value | |||||||||||||||||||||||
| Nonvested at June 30, 2023 | $ | $ | ||||||||||||||||||||||||
| Granted | $ | |||||||||||||||||||||||||
| Vested | ( | $ | ||||||||||||||||||||||||
| Forfeited | ( | $ | ||||||||||||||||||||||||
| Nonvested at June 30, 2024 | $ | $ | ||||||||||||||||||||||||
| Granted | $ | |||||||||||||||||||||||||
| Vested | ( | $ | ||||||||||||||||||||||||
| Forfeited | ( | $ | ||||||||||||||||||||||||
| Nonvested at June 30, 2025 | $ | $ | ||||||||||||||||||||||||
| Granted | $ | |||||||||||||||||||||||||
| Vested | ( | $ | ||||||||||||||||||||||||
| Forfeited | ( | $ | ||||||||||||||||||||||||
| Nonvested at June 30, 2026 | $ | $ | ||||||||||||||||||||||||
92
Performance-based Restricted Stock Units (“PRSU”)
In March each year since fiscal year 2017, the Company granted PRSU to certain personnel. The number of shares to be ultimately earned under the PRSU is determined based on the level of attainment of predetermined financial goals. The PRSU vests in four equal annual installments from the first anniversary date after the grant date if certain predetermined financial goals were met. The Company recorded $4.4 million, $4.0 million, and $2.8 million of expenses for these PRSUs during the years ended June 30, 2026, 2025 and 2024, respectively. The total fair value of PRSUs vested during the years ended June 30, 2026, 2025 and 2024 was $4.3 million, $4.5 million, and $3.8 million, respectively.
The following table summarizes the Company’s PRSU activities:
| Number of Performance-based Restricted Stock Units | Weighted Average Grant Date Fair Value Per Share | Weighted Average Remaining Recognition Period (Years) | Aggregate Intrinsic Value | |||||||||||||||||||||||
| Nonvested at June 30, 2023 | $ | $ | ||||||||||||||||||||||||
| Granted | $ | |||||||||||||||||||||||||
| Vested | ( | $ | ||||||||||||||||||||||||
| Forfeited | ( | $ | ||||||||||||||||||||||||
| Nonvested at June 30, 2024 | $ | $ | ||||||||||||||||||||||||
| Granted | $ | |||||||||||||||||||||||||
| Vested | ( | $ | ||||||||||||||||||||||||
| Forfeited | ( | $ | ||||||||||||||||||||||||
| Nonvested at June 30, 2025 | $ | $ | ||||||||||||||||||||||||
| Granted | $ | |||||||||||||||||||||||||
| Vested | ( | $ | ||||||||||||||||||||||||
| Forfeited | ( | $ | ||||||||||||||||||||||||
Nonvested at June 30, 2026 | $ | $ | ||||||||||||||||||||||||
Market-based Restricted Stock Units (“MSUs”)
In December 2021, the Company granted 1.0 million market-based restricted stock units to certain personnel. The number of shares to be earned at the end of the performance period was determined based on the Company’s achievement of specified stock prices and revenue thresholds during the performance period from January 1, 2022 to December 31, 2024 as well as the recipients remaining in continuous service with the Company through such period. The MSU vests in equal annual installments after the end of performance period. The Company estimated the grant date fair values of its MSUs using a Monte-Carlo simulation model. In September 2023, the Company determined it was no longer probable that it would achieve the minimum revenue threshold specified in the awards. Therefore, the Company reversed all of the previously recognized expenses of $6.4 million for these MSUs. In addition, on September 19, 2023, the Compensation Committee of the Board approved a modification of the terms of MSUs to extend the performance period through December 31, 2025, changed the commencement date for the four-year time-based service period to January 1, 2026, and reduced the achievement of specified stock prices and revenue thresholds. The fair value of these MSUs was revalued to reflect the change using a Monte-Carlo simulation model. In June 2024, the Company determined it was no longer probable that the revenue thresholds for the modified MSU would be achieved. Therefore, the Company reversed $2.4 million in the June 2024 quarter that was recorded during fiscal year 2024 related to the modification on September 19, 2023. On August 8, 2024, the Compensation Committee of the Board approved modifications of the terms of MSUs to extend the performance period through December 31, 2026, change the commencement date for the r time-based service period to January 1, 2027, and reduce the revenue thresholds. The fair value of these MSUs was revalued to reflect the change using a Monte-Carlo simulation model with the following assumptions: risk-free interest rate of 3.93 %, expected term of 2.40 years, expected volatility of 57.81 % and dividend yield of 0 %. During fiscal year 2026, the Company reassessed the estimated achievement of the performance conditions associated with these MSUs, and concluded that a lower outcome was estimated to be achieved. As a result, the Company reversed $3.9 million of expenses previously recognized in prior periods during the fiscal year ended June 30, 2026. The Company recorded approximately $(0.3 ) million, $5.0 million, and $(6.4 ) million of expenses for these MSUs during the fiscal years ended June 30, 2026, 2025 and 2024, respectively. On August 13, 2026, the Compensation Committee of the Board approved a modification to the terms of the MSUs to reduce the minimum revenue threshold. The modification did not change
93
the stock price targets, performance period, service condition, or other material terms of the awards. There was no impact to the estimated achievement of the performance condition as of June 30, 2026, and no impact to the financial statements for the year ended June 30, 2026, as a result of the modification.
During the quarter ended September 30, 2018, the Company granted 1.3 million MSUs to certain personnel. The number of shares to be earned at the end of the performance period is determined based on the Company’s achievement of specified stock prices and revenue thresholds during the performance period as well as the recipients remaining in continuous service with the Company through such period. The Company recorded approximately $0.3 million, $0.6 million, and $1.0 million of expense for these MSUs during the years ended June 30, 2026, 2025 and 2024, respectively. The total fair value of MSUs vested during the years ended June 30, 2026, 2025 and 2024 was $1.4 million, $1.4 million, and $1.4 million, respectively.
| The following table summarizes the Company’s MSUs activities: | ||||||||||||||||||||||||||
Number of Market-based Restricted Stock Units | Weighted Average Grant Date Fair Value Per Share | Weighted Average Remaining Recognition Period (Years) | Aggregate Intrinsic Value | |||||||||||||||||||||||
| Nonvested at June 30, 2023 | $ | $ | ||||||||||||||||||||||||
| Vested | ( | $ | ||||||||||||||||||||||||
| Forfeited | ( | $ | ||||||||||||||||||||||||
| Nonvested at June 30, 2024 | $ | $ | ||||||||||||||||||||||||
| Vested | ( | $ | ||||||||||||||||||||||||
| Forfeited | ( | $ | ||||||||||||||||||||||||
| Nonvested at June 30, 2025 | $ | $ | ||||||||||||||||||||||||
| Vested | ( | $ | ||||||||||||||||||||||||
| Forfeited | ( | $ | ||||||||||||||||||||||||
Nonvested at June 30, 2026 | $ | $ | ||||||||||||||||||||||||
Stock Option
The following table summarizes the Company's stock option activities:
| Weighted | ||||||||||||||||||||||||||
| Weighted | Average | |||||||||||||||||||||||||
| Average | Remaining | |||||||||||||||||||||||||
| Number of | Exercise Price | Contractual | Aggregate | |||||||||||||||||||||||
| Shares | Per Share | Term (in years) | Intrinsic Value | |||||||||||||||||||||||
| Outstanding at June 30, 2023 | $ | |||||||||||||||||||||||||
| Exercised | ( | $ | $ | |||||||||||||||||||||||
| Outstanding at June 30, 2024 | $ | |||||||||||||||||||||||||
| Exercised | ( | $ | $ | |||||||||||||||||||||||
| Outstanding at June 30, 2025 | $ | |||||||||||||||||||||||||
Exercised | $ | $ | ||||||||||||||||||||||||
Outstanding at June 30, 2026 | $ | $ | ||||||||||||||||||||||||
| Options vested and expected to vest | $ | $ | ||||||||||||||||||||||||
Exercisable at June 30, 2026 | $ | $ | ||||||||||||||||||||||||
The 2018 Employee Share Purchase Plan
At the annual general meeting of shareholders in November 2018, the 2018 Employee Share Purchase Plan (“Purchase Plan” or “ESPP”) was approved, under which 1,430,000 common shares are available for issuance. The Purchase Plan does not include an evergreen authorization, therefore the Company is not permitted to increase the number of shares reserved in the share pool without obtaining further shareholder approval. At the annual general meetings of shareholders in 2021 and 2023, the shares reserved for issuance under the ESPP was approved to increase by 1,070,000 and 1,200,000 shares, respectively to a total of 3,700,000 shares. The Purchase Plan provided for a series of overlapping offering periods with a duration of 24
94
months, generally beginning on May 15 and November 15 of each year. The Purchase Plan allows employees to purchase common shares through payroll deductions of up to 15 % of their eligible compensation. Such deductions will accumulate over a six-month accumulation period without interest. After such accumulation period, common shares will be purchased at a price equal to 85 % of the fair market value per share on either the first day of the offering period or the last date of the accumulation period, whichever is less. The maximum number of shares that may be purchased by a participant on any purchase date may not exceed 875 shares for a total of 3,500 shares per a 24-month offering period. In addition, no participant may purchase more than $25,000 worth of common stock in any one calendar year period. No more than 300,000 common shares may be purchased by all participants on any purchase date.
The ESPP is compensatory and results in compensation expense. The fair values of common shares to be issued under the ESPP were determined using the Black-Scholes option pricing model with the following assumptions:
| Year Ended June 30, | |||||||||||||||||
| 2026 | 2025 | 2024 | |||||||||||||||
| Volatility rate | |||||||||||||||||
| Risk-free interest rate | |||||||||||||||||
| Expected term | |||||||||||||||||
| Dividend yield | |||||||||||||||||
The weighted-average estimated fair value of employee stock purchase rights granted pursuant to the ESPP during the fiscal years ended June 30, 2026, 2025 and 2024 was $8.74 , $12.07 and $10.16 per share, respectively.
Share-based Compensation Expenses
The total share-based compensation expense related to TRSU, PRSUs, MSUs, and ESPP described above, recognized in the consolidated statements of operations for the years presented was as follows:
| Year Ended June 30, | |||||||||||||||||
| 2026 | 2025 | 2024 | |||||||||||||||
| (in thousands) | |||||||||||||||||
| Cost of goods sold | $ | $ | $ | ||||||||||||||
| Research and development | |||||||||||||||||
| Selling, general and administrative | |||||||||||||||||
| $ | $ | $ | |||||||||||||||
11. Employee Benefit Plans
The Company maintains a 401(k) retirement plan for the benefit of qualified employees in the U.S. Employees who participate may elect to make salary deferral contributions to the plan up to 100 % of the employees' eligible salary subject to annual Internal Revenue Code maximum limitations. The employer’s contribution is discretionary. Effective from April 1, 2022, the Company began to match 50 % of employee contribution up to 4 % of eligible compensation for a 2 % maximum match. During the fiscal years ended June 30, 2026, 2025 and 2024, the Company made employer match contributions of $1.9 million, $1.8 million and $1.8 million, respectively.
95
12. Income Taxes
| Year Ended June 30, | |||||||||||||||||
| 2026 | 2025 | 2024 | |||||||||||||||
| (in thousands) | |||||||||||||||||
| U.S. operations | $ | $ | $ | ||||||||||||||
| Non-U.S. operations | ( | ( | ( | ||||||||||||||
| Net loss before income taxes | $ | ( | $ | ( | $ | ( | |||||||||||
Year Ended June 30, | |||||||||||||||||
| 2026 | 2025 | 2024 | |||||||||||||||
| (in thousands) | |||||||||||||||||
| U.S. federal taxes: | |||||||||||||||||
| Current | $ | $ | $ | ||||||||||||||
| Deferred | ( | ||||||||||||||||
| Non-U.S. taxes: | |||||||||||||||||
| Current | |||||||||||||||||
| Deferred | ( | ( | ( | ||||||||||||||
| State taxes, net of federal benefit: | |||||||||||||||||
| Current | ( | ( | |||||||||||||||
| Total provision (benefit) for income taxes | $ | $ | ( | $ | |||||||||||||
The table below provides the income tax rate reconciliation for the years ended June 30, 2025 and June 30, 2024, prepared in accordance with the disclosure requirements in effect prior to the Company's adoption of ASU 2023-09. As the Company adopted ASU 2023-09 on a prospective basis, the rate reconciliation for periods prior to the year ended June 30, 2026 has not been recast to reflect the updated categories and disaggregation requirements of ASU 2023-09. See Note 1 Summary of Significant Accounting Policies—Recent Accounting Pronouncements for additional details on the adoption of ASU 2023-09.
The reconciliation of the federal statutory income tax rate to our effective income tax rate for the years ended June 30, 2025 and June 30, 2024 is as follows (in percentage):
| Year Ended June 30, | |||||||||||
| 2025 | 2024 | ||||||||||
| United States statutory rate | % | % | |||||||||
| Stock-based compensation | ( | ( | |||||||||
| Foreign taxes, net | ( | ( | |||||||||
| Outside basis difference on equity method investment | |||||||||||
| Tax credits | |||||||||||
| Non-deductible expenses | ( | ( | |||||||||
| Tax exempt income | |||||||||||
| Non-deductible executive compensation | ( | ( | |||||||||
| Foreign derived intangible income deduction | |||||||||||
| Other | |||||||||||
| % | ( | % | |||||||||
96
The Company adopted ASU 2023-09 guidance for the year ended June 30, 2026 on a prospective basis. The following table presents a reconciliation of income taxes computed at the statutory federal income tax rate to the effective tax rate implied by the accompanying Consolidated Statements of Operations for the year ended June 30, 2026 in accordance with ASU 2023-09. In preparing the rate reconciliation, the Company is using the United States federal tax rate of 21% as the starting point in the rate reconciliation. While the Company is incorporated in Bermuda with a zero percent statutory tax rate, the Company has significant operations in the United States. Furthermore, using the 21% United States federal tax rate is consistent with prior period rate reconciliation reporting.
The reconciliation of the effective tax rate for income taxes from the federal statutory rate were as follows (in thousands, except percentages):
| Year Ended June 30, 2026 | |||||||||||
| Amount (in thousands) | Percentages | ||||||||||
| Tax at federal statutory rate | $ | ( | % | ||||||||
| State and local income tax, net of federal (national) income tax effect * | ( | % | |||||||||
| Foreign tax effects: | |||||||||||
| Cayman - foreign rate differential between Cayman and U.S. | ( | % | |||||||||
| China | |||||||||||
| Withholding tax | ( | % | |||||||||
| Outside basis difference on equity method investment | ( | % | |||||||||
| Other | ( | % | |||||||||
| Hong Kong | |||||||||||
| Hong Kong - Foreign rate differential between Hong Kong and U.S. | ( | % | |||||||||
| Other | ( | % | |||||||||
| India | |||||||||||
| Withholding tax | ( | % | |||||||||
| Other | ( | % | |||||||||
| Other foreign jurisdictions | ( | % | |||||||||
| Effect of cross-border tax laws | |||||||||||
| FDII | ( | % | |||||||||
| Tax credits | |||||||||||
| Federal research and development credit | ( | % | |||||||||
| Nontaxable or nondeductible items | |||||||||||
| Non-deductible compensation | ( | % | |||||||||
| Other | ( | % | |||||||||
| Changes in unrecognized tax benefits (report all jurisdictions) | ( | % | |||||||||
| Provision for income taxes | $ | ( | % | ||||||||
*California and Oregon make up the majority of state tax expense in this category | |||||||||||
Analysis of Effective Tax Rate Between Fiscal Years
As shown in the above effective tax rate analysis, the Company’s effective tax rate was (21.0 )% , 31.0 %, and (138.1 )% for fiscal years 2026, 2025 and 2024, respectively, a 52 % difference between fiscal years 2026 and 2025. The primary reason for the large percentage differences in the overall effective tax rate reconciliation between fiscal year 2026 and fiscal year 2025 was a result of fiscal year 2025 reporting a tax benefit of $12.5 million (a 45.1 % effective tax rate impact in fiscal year 2025) vs. a fiscal year 2026 tax expense of $0.9 million (a negative 2.6 % effective tax rate impact) on the outside basis difference on the equity method investment, for a total 47.7 % effective tax rate impact between the two years. A secondary reason for the difference in the effective tax rate difference between fiscal year 2026 and fiscal year 2025 is that the Company incurred
97
$3.0 million (a negative 8.5 % effective tax rate impact) of withholding taxes in fiscal year 2026 vs $0 withholding taxes in fiscal year 2025.
The primary reason for the large percentage differences in the overall effective tax rate reconciliation between fiscal year 2024 and fiscal year 2026 as well as between the fiscal year 2024 and fiscal year 2025 is mainly due to the smaller amount of pretax book loss of $2.6 million as the denominator in the calculation of effective tax rate reconciliation in fiscal year 2024, as compared to the larger amount of pretax book loss of $35.6 million in fiscal year 2026 as the denominator as well as the pretax book loss of $27.8 million in fiscal year 2025 as the denominator in calculating the effective tax rates for these years. When comparing the effective tax rate impact on the differences in pretax book loss between fiscal year 2026 versus fiscal year 2024, the net value of fiscal year 2026 loss is approximately 13.5 times higher than the pretax book loss in fiscal year 2024. Therefore, the percentage impact on the effective tax rate in fiscal year 2026 is approximately 13.5 times higher than in fiscal year 2024, simply due to the large variance in pretax book loss between the two years. The impact of the pretax book loss denominator effect also largely explains the differences in the effective tax rate differences between fiscal years 2026 and 2024 for tax credits and non-deductible executive compensation expense. The differences between “Foreign Taxes, net” is a result of changes in the mix of earnings in various geographic jurisdictions between fiscal year 2026 and fiscal year 2024.
Similarly, when comparing the effective tax rate impact on the differences in pretax book loss between fiscal year 2025 versus fiscal year 2024, the net value of fiscal year 2025 loss is approximately 10.5 times higher than the pretax book loss in fiscal year 2024. Therefore, the percentage impact on the effective tax rate in fiscal year 2025 is approximately 10.5 times higher than in fiscal year 2024, simply due to the large variance in pretax book loss between the two years. The impact of the pretax book loss denominator effect also fully explains the differences in the effective tax rate differences between fiscal years 2025 and 2024 for tax credits and non-deductible executive compensation expense. The differences between “Foreign Taxes, net” is a result of changes in the mix of earnings in various geographic jurisdictions between fiscal year 2025 and fiscal year 2024. The differences concerning “Outside Basis Differences on Equity Method Investment” between the two years is a result of the larger amount of equity method loss in fiscal year 2025 in comparison with that of fiscal year 2024.
Deferred income taxes reflect the net tax effects of temporary differences between the carrying amounts of assets and liabilities for financial reporting purposes and the amounts used for income tax purposes. Significant components of our deferred tax assets and liabilities are as follows:
| June 30, | |||||||||||
| 2026 | 2025 | ||||||||||
| (in thousands) | |||||||||||
| Deferred tax assets: | |||||||||||
| Accrued compensation | $ | $ | |||||||||
| Net operating loss carryforwards | |||||||||||
| Depreciation | |||||||||||
| Tax credits | |||||||||||
| Operating lease liabilities | |||||||||||
| Capitalized R&D costs | |||||||||||
| Accruals and reserves | |||||||||||
| Total deferred tax assets | |||||||||||
| Valuation allowance | ( | ( | |||||||||
| Total deferred tax assets, net of valuation allowance | |||||||||||
| Deferred tax liabilities: | |||||||||||
| Depreciation and amortization | ( | ( | |||||||||
| Right of use assets | ( | ( | |||||||||
| Investments | ( | ( | |||||||||
| Total deferred tax liabilities | ( | ( | |||||||||
Net deferred tax liabilities | $ | ( | $ | ( | |||||||
The breakdown between deferred tax assets and liabilities is as follows:
98
| June 30, | |||||||||||
| 2026 | 2025 | ||||||||||
| (in thousands) | |||||||||||
| Deferred tax assets | $ | $ | |||||||||
| Deferred tax liabilities | ( | ( | |||||||||
| Net deferred tax liabilities | $ | ( | $ | ( | |||||||
The Company’s valuation allowance related to deferred income taxes as reflected in the consolidated balance sheets was $10.1 million and $8.8 million as of June 30, 2026 and 2025, respectively. The change in valuation allowance for June 30, 2026 and 2025 was an increase of $1.3 million and an increase of $1.5 million, respectively.
At June 30, 2026 and 2025, the Company provided a valuation allowance for its state research and development credit carryforward deferred tax assets of $10.1 million and $8.8 million, respectively, as it generated more state tax credits each year than it can utilize. The Company intends to maintain a valuation allowance equal to the state research and development credit carryforwards in excess of the state net deferred tax liabilities on all other state book and tax differences and net operating loss carryforward.
At June 30, 2026, the Company had federal research and development tax credit carryforwards of approximately $7.2 million. The federal tax credits begin to expire in 2043, if not utilized. At June 30, 2026, the Company had state tax credit carryforwards of approximately $12.7 million, of which $11.3 million carryforward indefinitely, $1.1 million have a 10 to 15 years life (beginning to expire in 2033) and $0.3 million with a 20 years life, (beginning to expire in 2038).
The Company intends to reinvest the undistributed earnings of its foreign subsidiaries indefinitely, except for Alpha and Omega Semiconductor (Cayman) Ltd. and AOS International LP. Should the Company decide to remit this income to its Bermuda parent company in a future period, its provision for income taxes may increase materially in that period. The determination of the unrecognized deferred tax liability on these earnings is not practicable due to the complexity and variety of assumptions necessary to estimate the tax. As of June 30, 2026, the Company has recorded a deferred tax liability of $7.2 million for the basis difference related to our investment in the JV Company.
The following table presents the net cash paid by the Company for income taxes during the year ended June 30, 2026.
| Dollars (in thousands) | |||||
| Domestic | |||||
| U.S. Federal | $ | ||||
| U.S. State | |||||
| Foreign | |||||
| China | |||||
| Other | |||||
| $ | |||||
A reconciliation of the beginning and ending amount of unrecognized tax benefits from July 1, 2023 to June 30, 2026 is as follows:
99
| Year Ended June 30, | |||||||||||||||||
| 2026 | 2025 | 2024 | |||||||||||||||
| (in thousands) | |||||||||||||||||
| Balance at beginning of year | $ | $ | $ | ||||||||||||||
| Additions based on tax positions related to the current year | |||||||||||||||||
| Reductions based on tax positions related to prior years | ( | ( | ( | ||||||||||||||
| Reductions due to lapse of applicable statute of limitations | ( | ( | |||||||||||||||
| Balance at end of year | $ | $ | $ | ||||||||||||||
At June 30, 2026, the total unrecognized tax benefits of $11.4 million included $7.6 million of unrecognized tax benefits that have been netted against the related deferred tax assets. The remaining $3.8 million of unrecognized tax benefits was recorded within long-term income tax payable on the Company's consolidated balance sheet as of June 30, 2026.
The total unrecognized tax benefits of $11.4 million at June 30, 2026 included $7.9 million that, if recognized, would reduce the effective income tax rate in future periods.
The Company recognizes interest and penalties related to uncertain tax positions in income tax expense. To the extent accrued interest and penalties do not ultimately become payable, amounts accrued will be reduced and reflected as a reduction of the overall income tax provision in the period that such determination is made. The amount of interest and penalties accrued at June 30, 2026 was $1.0 million, of which $0.2 million was recognized in the year ended June 30, 2026. The amount of interest and penalties accrued at June 30, 2025 was $0.8 million, of which $0.2 million was recognized in the year ended June 30, 2025.
The Company files its income tax returns in the United States and in various foreign jurisdictions. The tax years 2009 to 2026 remain open to examination by U.S. federal tax authorities due to tax attribute carryovers. The tax years 2006 to 2026 remain open to examination by U.S. state tax authorities due to tax attribute carryovers. The tax years 2020 to 2026 remain open to examination by foreign tax authorities.
The Company's income tax returns are subject to examinations by the Internal Revenue Service and other tax authorities in various jurisdictions. In accordance with the guidance on the accounting for uncertainty in income taxes, the Company regularly assesses the likelihood of adverse outcomes resulting from these examinations to determine the adequacy of its provision for income taxes. These assessments can require considerable estimates and judgments. If the Company's estimate of income tax liabilities proves to be less than the ultimate assessment, then a further charge to expense would be required. If events occur and the payment of these amounts ultimately proves to be unnecessary, the reversal of the liabilities would result in tax benefits being recognized in the period when the Company determines the liabilities are no longer necessary.
One Big Beautiful Bill Act, Enacted July 4, 2025
On July 4, 2025, H.R. 1, commonly known as the One Big Beautiful Bill Act (the “OBBB”), was signed into law. This includes significant changes to the federal corporate tax provisions and extends certain otherwise expiring provisions of the 2017 Tax Cuts and Jobs Act. The key provisions include allowing immediate expensing of domestic research and experimental expenditures, new limitations on interest expense deductibility, reinstatement of 100% bonus depreciation for qualified assets placed in service in the United States after January 19, 2025 as well as changes to the calculation of taxable income resulting from the foreign derived intangible income deduction. The Company has concluded that the impact of OBBB for the current year is immaterial.
100
13. Segment and Geographic Information
The Company is organized as, and operates in, one operating segment: the design, development and supply of power semiconductor products for computing, consumer electronics, communication and industrial applications. The chief operating decision-maker is the Chief Executive Officer. The financial information presented to the Company’s Chief Executive Officer is on a consolidated basis, accompanied by information about revenue by customer and geographic region, for purposes of evaluating financial performance and allocating resources. The Chief Executive Officer assesses performance of the Company, monitors budget versus actual results and determines how to allocated resources based on the consolidated net income or loss as reported on the Company’s Consolidated Statement of Operations. There are no other expense categories regularly provided to the Chief Executive Officer that are not already included in the Consolidated Statements of Operations. The Company has one business segment, and there are no segment managers who are held accountable for operations, operating results and plans for products or components below the consolidated unit level. Accordingly, the Company reports as a single operating segment.
The Company sells its products primarily to distributors in the Asia Pacific region, who in turn sell these products to end customers. Because the Company’s distributors sell their products to end customers which may have a global presence, revenue by geographical location is not necessarily representative of the geographical distribution of sales to end user markets.
The revenue by geographical location in the following tables is based on the country or region in which the products were shipped to:
| Year Ended June 30, | |||||||||||||||||
| 2026 | 2025 | 2024 | |||||||||||||||
| (in thousands) | |||||||||||||||||
| Hong Kong | $ | $ | $ | ||||||||||||||
| China | |||||||||||||||||
| South Korea | |||||||||||||||||
| United States | |||||||||||||||||
| Other countries | |||||||||||||||||
| $ | $ | $ | |||||||||||||||
The following is a summary of revenue by product type:
| Year Ended June 30, | |||||||||||||||||
| 2026 | 2025 | 2024 | |||||||||||||||
| (in thousands) | |||||||||||||||||
| Power discrete | $ | $ | $ | ||||||||||||||
| Power IC | |||||||||||||||||
Packaging and testing services and other | |||||||||||||||||
| License and development services | |||||||||||||||||
| $ | $ | $ | |||||||||||||||
Long-lived assets, net consisting of property, plant and equipment and land use rights, net, as well as operating lease right-of-use assets, net by geographical area are as follows:
| June 30, | |||||||||||
| 2026 | 2025 | ||||||||||
| (in thousands) | |||||||||||
| China | $ | $ | |||||||||
| United States | |||||||||||
| Other countries | |||||||||||
| $ | $ | ||||||||||
101
14. Restricted Net Assets
Laws and regulations in China permit payments of dividends by the Company's subsidiaries in China only out of their retained earnings, if any, as determined in accordance with China accounting standards and regulations. Each China subsidiary is also required to set aside at least 10 % of its after-tax profit, if any, based on China accounting standards each year to its statutory reserves until the cumulative amount of such reserves reaches 50 % of its registered capital. As a result of these China laws and regulations, the Company's subsidiaries in China are restricted in their abilities to transfer a portion of their net assets to the Company. As of June 30, 2026 and 2025, such restricted portion amounted to approximately $94.0 million and $93.9 million, or 11.8 % and 11.4 %, of our total consolidated net assets attributable to the Company, respectively. As the Company's subsidiaries in China are not revenue generating operating units, the Company does not expect to repatriate funds in the form of dividends, loans or advances from its subsidiaries in China for working capital and other funding purposes.
15. Commitments and Contingencies
Purchase commitments
As of June 30, 2026 and 2025, the Company had approximately $63.6 million and $85.9 million, respectively, of outstanding purchase commitments primarily for purchases of semiconductor raw materials, wafers, spare parts, packaging and testing services and others.
As of June 30, 2026 and 2025, the Company had approximately $8.6 million, and $14.1 million, respectively, of commitments for the purchase of property and equipment.
Other commitments
See Notes 1, 7 and 8 to the Consolidated Financial Statements contained in this annual Report on Form 10-K for descriptions of commitments including Joint Venture, bank borrowings and leases.
Contingencies and indemnities
The Company has in the past, and may from time to time in the future, become involved in legal proceedings arising from the normal course of business activities. The semiconductor industry is characterized by frequent claims and litigation, including claims regarding patent and other intellectual property rights as well as improper hiring practices. Irrespective of the validity of such claims, the Company could incur significant costs in the defense of such claims and suffer adverse effects on its operations.
The Company is a party to a variety of agreements that it has contracted with various third parties. Pursuant to these agreements, the Company may be obligated to indemnify another party to such an agreement with respect to certain matters. Typically, these obligations arise in the context of contracts entered into by the Company, under which the Company customarily agrees to hold the other party harmless against losses arising from a breach of representations and covenants related to such matters as title to assets sold, certain intellectual property rights, specified environmental matters and certain income taxes. In these circumstances, payment by the Company is customarily conditioned on the other party making a claim pursuant to the procedures specified in the particular contract, which procedures typically allow the Company to challenge the other party's claim. Further, the Company's obligations under these agreements may be limited in time and/or amount, and in some instances, the Company may have recourse against third parties for certain payments made by it under these agreements. The Company has not historically paid or recorded any material indemnifications, and no
The Company has agreed to indemnify its directors and certain employees as permitted by law and pursuant to its Bye-laws, and has entered into indemnification agreements with its directors and executive officers. The Company has not recorded a liability associated with these indemnification arrangements, as it historically has not incurred any material costs associated with such indemnification obligations. Costs associated with such indemnification obligations may be mitigated by insurance coverage that the Company maintains. However, such insurance may not cover any, or may cover only a portion of, the amounts the Company may be required to pay. In addition, the Company may not be able to maintain such insurance coverage at reasonable cost, if at all, in the future.
Environmental matters
The Company is subject to various federal, state, local, and foreign laws and regulations governing environmental
matters, including the use, handling, discharge, and disposal of hazardous materials. The Company believes that it has been in material compliance with applicable environmental regulations and standards. Complying with current laws and regulations
102
has not had a material adverse effect on the Company’s financial condition and results of operations. However, it is possible that additional environmental issues may arise in the future, which the Company cannot currently predict.
103
SCHEDULE II
ALPHA AND OMEGA SEMICONDUCTOR LIMITED
VALUATION AND QUALIFYING ACCOUNTS
(in thousands)
| Allowance | Allowance | Valuation Allowance | |||||||||||||||
| for Doubtful | for Price | for Deferred | |||||||||||||||
| Accounts | Adjustments | Tax Assets | |||||||||||||||
| June 30, 2023 | $ | $ | $ | ||||||||||||||
| Additions | |||||||||||||||||
| Reductions | ( | ||||||||||||||||
| June 30, 2024 | $ | $ | $ | ||||||||||||||
| Additions | |||||||||||||||||
| Reductions | ( | ||||||||||||||||
| June 30, 2025 | $ | $ | $ | ||||||||||||||
| Additions | |||||||||||||||||
| Reductions | ( | ||||||||||||||||
| June 30, 2026 | $ | $ | $ | ||||||||||||||
104
(b) Index to Exhibits:
| Number | Description | ||||
| 3.1 | |||||
| 3.2 | |||||
| 3.3 | |||||
| 4.1 | |||||
| 4.2 | |||||
10.1†† | |||||
10.2†† | |||||
10.3†† | |||||
10.4†† | |||||
| 10.5 | |||||
10.6†† | |||||
10.7†† | |||||
| 10.8 | |||||
10.9†† | |||||
10.10†† | |||||
| 10.11 | |||||
105
| 10.12 | |||||
| 10.13 | |||||
10.14 | |||||
10.15 (+) | |||||
10.16 | |||||
10.17 | |||||
10.18 | |||||
10.19 | |||||
10.20(+) | |||||
10.21(+) | |||||
10.22(+) | |||||
| 10.23* | |||||
10.24 | |||||
10.25 | |||||
| 10.26(+) | |||||
| 10.27(+) | |||||
10.28 | |||||
| 10.29 | |||||
106
| 10.30 | |||||
| 10.31 | |||||
| 10.32 | |||||
| 10.33 | |||||
| 10.34*(+) | |||||
16.1 | |||||
19.1 | |||||
| 21.1* | |||||
| 23.1* | |||||
| 23.2* | |||||
| 31.1* | |||||
| 31.2* | |||||
| 32.1* | |||||
| 32.2* | |||||
| 97 | |||||
| 99.1* | |||||
| 99.2* | |||||
| 101.INS | XBRL Instance | ||||
| 101.SCH | XBRL Taxonomy Extension Schema | ||||
| 101.CAL | XBRL Taxonomy Extension Calculation | ||||
| 101.DEF | XBRL Taxonomy Extension Definition | ||||
| 101.LAB | XBRL Taxonomy Extension Labels | ||||
| 101.PRE | XBRL Taxonomy Extension Presentation | ||||
* Filed with this Annual Report on Form 10-K.
†† Confidential treatment has been granted for certain information contained in this document pursuant to an order of the Securities and Exchange Commission. Such information has been omitted and filed separately with the Securities and Exchange Commission.
(+) Indicates management contract or compensatory plan or arrangement.
107
SIGNATURES
Pursuant to the requirements of Section 13 or 15(d) of the Securities Exchange Act of 1934, the Registrant has duly caused this report to be signed on its behalf by the undersigned, thereunto duly authorized.
August 27, 2026
| ALPHA AND OMEGA SEMICONDUCTOR LIMITED | |||||
| By: | /s/ STEPHEN C. CHANG | ||||
| Stephen C. Chang | |||||
| Chief Executive Officer | |||||
| (Principal Executive Officer) | |||||
108
POWER OF ATTORNEY
KNOW ALL PERSONS BY THESE PRESENTS, that each person whose signature appears below constitutes and appoints Stephen C. Chang and Yifan Liang, and each or any one of them, his or her true and lawful attorney-in-fact and agent, with full power of substitution and re-substitution, for him or her and in his or her name, place and stead, in any and all capacities, to sign any and all amendments to this report, and to file the same, with all exhibits thereto, and other documents in connection therewith, with the Securities and Exchange Commission, granting unto said attorneys-in-fact and agents, and each of them, full power and authority to do and perform each and every act and thing requisite and necessary to be done in connection therewith, as fully to all intents and purposes as he or she might or could do in person, hereby ratifying and confirming all that said attorneys-in-fact and agents, or any of them, or their or his or her substitutes or substitute, may lawfully do or cause to be done by virtue hereof.
Pursuant to the requirements of the Securities Exchange Act of 1934, this report has been signed below by the following persons on behalf of the Registrant and in the capacities and on the dates indicated.
| Signature | Title | Date | |||||||||
| /s/ STEPHEN C. CHANG | Chief Executive Officer and Director | August 27, 2026 | |||||||||
| Stephen C. Chang | (Principal Executive Officer) | ||||||||||
| /s/ YIFAN LIANG | Chief Financial Officer and Corporate Secretary | August 27, 2026 | |||||||||
Yifan Liang | (Principal Financial Officer and Principal Accounting Officer) | ||||||||||
| /s/ MIKE F. CHANG | Chairman of the Board and Executive Vice President of Strategic Initiatives | August 27, 2026 | |||||||||
Mike F. Chang, Ph.D. | |||||||||||
| /s/ CLAUDIA CHEN | Director | August 27, 2026 | |||||||||
Claudia Chen | |||||||||||
| /s/ JOSHUA CHIEN | Director | August 27, 2026 | |||||||||
| Joshua Chien | |||||||||||
| /s/ SO-YEON JEONG | Director | August 27, 2026 | |||||||||
| So-Yeon Jeong | |||||||||||
| /s/ HANQING (HELEN) LI | Director | August 27, 2026 | |||||||||
| Hanqing (Helen) Li | |||||||||||
| /s/ KING OWYANG | Director | August 27, 2026 | |||||||||
King Owyang | |||||||||||
| /s/ MICHAEL L. PFEIFFER | Director | August 27, 2026 | |||||||||
Michael L. Pfeiffer | |||||||||||
| /s/ MICHAEL J. SALAMEH | Director | August 27, 2026 | |||||||||
Michael J. Salameh | |||||||||||
109