Exhibit 99.1

American Public Education Reports Second Quarter 2022 Results
CHARLES TOWN, WV (August 09, 2022) – American Public Education, Inc. (Nasdaq: APEI) announced financial results for the quarter ended June 30, 2022.
Second Quarter Highlights:
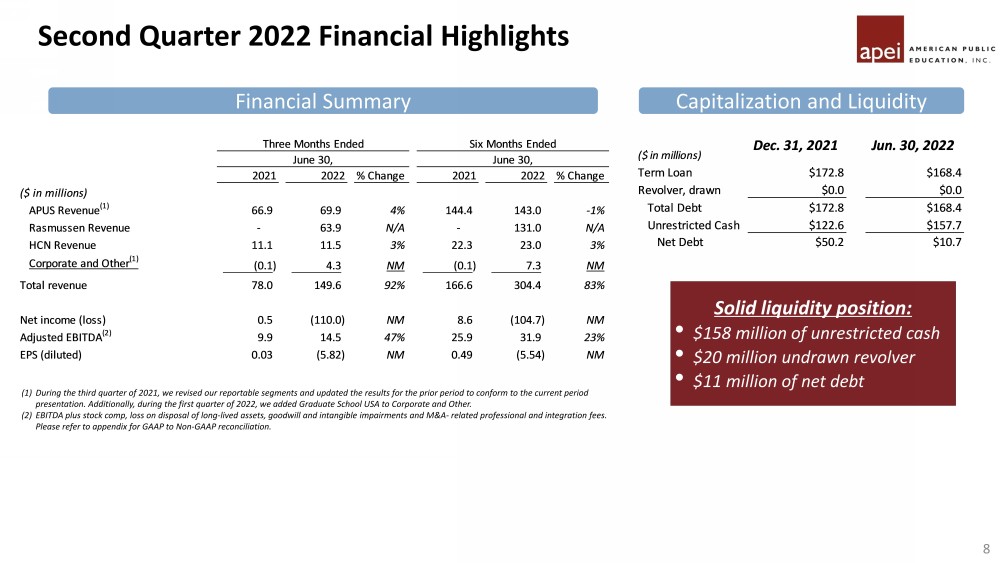
| · | Consolidated revenue increased 92% year-over-year to $149.6 million |
| · | Total cash and cash equivalents was approximately $184.5 million, compared to $149.6 million as of December 31, 2021, representing an increase of $34.9 million or 23.3%. |
| · | Results for the three months ended June 30, 2022 include a non-cash impairment charge of $144.9 million in our Rasmussen University (“RU”) Segment to reduce the carrying value of RU Segment goodwill and intangible assets, and to reflect the corresponding tax impact. |
| · | Net loss for the period was $110.0 million, compared to net income of $0.5 million for the three months ended June 30, 2021, a decrease of $110.6 million as a result of the non-cash impairment charge |
| · | Adjusted EBITDA increased 47% year-over-year to $14.5 million |
We completed the acquisitions of RU and Graduate School USA (“GSUSA”) on September 1, 2021, and January 1, 2022, respectively. We did not consolidate the financial results of these companies prior to their respective acquisition closing dates. Accordingly, the financial results for the three months ended June 30, 2021 do not include the results of operations of RU and GSUSA, and therefore the prior year period presented is not directly comparable to the current period.
Financial Results:
Three months ended June 30, 2022 compared to three months ended June 30, 2021:
| · | Total consolidated revenue for 2022 increased 91.8% to $149.6 million, compared to total revenue of $78 million in 2021, due to: |
| o | the inclusion of RU Segment revenue and GSUSA revenue for the three months ended June 30, 2022 of $63.9 million and $4.4 million; |
| o | an increase of $0.4 million, or 3.2%, in revenue from Hondros College of Nursing (“HCN”), reflecting an increase in enrollment of 2.7%; and |
| o | an increase of $3.0 million, or 4.4%, in revenue from American Public University System (“APUS”) due to an enrollment increase of 1.1% compared to prior year. |
| · | Total costs and expenses increased to $290.9 million for 2022, compared to $76 million for the same period in 2021, and include a non-cash impairment charge of $144.9 million to reduce the carrying value of RU segment goodwill and intangible assets, and to reflect the corresponding tax impact. The increase in costs and expenses for the three months ended June 30, 2022, was also the result of the inclusion of other RU Segment and GSUSA costs and expenses of $65.5 million and $6.1 million, respectively. |
| o | Instructional costs and services increased $41.7 million in 2022 to $72.1 million, compared to $30.4 million in 2021, primarily due to the inclusion of RU Segment and GSUSA instructional costs and services expenses of $35.6 million and $3.6 million, respectively, as well as an increase in faculty compensation costs in our HCN Segment. |
| o | Selling and promotional expenses increased $18.4 million to $35.8 million, compared to $17.5 million in 2021, primarily due to the inclusion of RU Segment and GSUSA selling and promotional expenses of $17.7 million and $1.2 million, respectively. |
| o | General and administrative (“G&A”) expenses increased $4.4 million to $29.9 million, compared to $25.5 million in 2021 primarily due to the inclusion of RU Segment and GSUSA G&A expenses of $6.2 million and $1.2 million, respectively, as well as an increase in employee compensation costs in Corporate and Other, partially offset by decreases in employee compensation costs and professional fees in our APUS Segment. |
| o | Depreciation and amortization expenses increased to $8.1 million in 2022, or 5.3% of revenue, compared to $2.5 million and 3.2% in 2021, primarily due to the addition of the RU Segment depreciation and amortization expenses of $6.2 million. |
| o | Costs and expenses in 2022 include a non-cash impairment charge of $144.9 million to reduce the carrying value of RU Segment goodwill and intangible assets, and to reflect the corresponding tax impact; $0.9 million in information technology costs related to our multi-year technology transformation program in our APUS Segment and M&A-related professional fees of $0.4 million. M&A-related professional fees, which are included within G&A expenses, were associated with the RU and GSUSA acquisitions, and compared to $3.3 million of M&A-related professional fees associated with the RU acquisition in 2021. |
| · | Interest expense increased to $3.4 million in 2022, compared to nominal interest income in 2021, due to the $175 million senior secured term loan issued in connection with the RU acquisition. |
| · | Net loss was $110.0 million in 2022, compared to net income of $0.5 million in 2021, primarily driven by the non-cash impairment charge of $144.9 million to reduce the carrying value of RU Segment goodwill and intangible assets, and to reflect the corresponding tax impact. |
| · | The net loss per diluted share was $5.82, compared to net income of $0.03 per diluted share in the same period of 2021. Excluding the goodwill and intangible asset impairment charge, and the related tax impact, the net loss per diluted share for the period was $0.06. |
| · | Adjusted EBITDA was $14.5 million in 2022, compared to $9.9 million in 2021. The 2022 period included a $144.9 million non-cash impairment charge to reduce the carrying amount of RU Segment goodwill and intangible assets, and to reflect the corresponding tax impact, $0.7 million adjustment to the gain on acquisition related to the GSUSA, $2.4 million of stock-based compensation expense, and $0.4 million of M&A-related professional fees, all of which were excluded from adjusted EBITDA. |
Balance Sheet and Liquidity:
| · | Total cash and cash equivalents as of June 30, 2022 was approximately $184.5 million, compared to $149.6 million as of December 31, 2021, representing an increase of $34.9 million or 23.3%. The increase in cash was due to cash provided by operating activities, partially offset by increases in capital expenditures and payments of principal and interest on our debt obligations. |
| · | During the three months ended June 30, 2022, we saw improvement in Army’s processing of invoices and payments to APUS. APUS received approximately $38.8 million in payments from the Army during the six months ended June 30, 2022. As of June 30, 2022, approximately $12.5 million in accounts receivable, of which $6.9 million is older than 60 days from the course start date, was due from the Army as a result of the disruption associated with the transition to ArmyIgnitED. ArmyIgnitED is transitioning to a new technology provider at the end of August 2022 while simultaneously upgrading the portal to a new version. While there has been recent improvements in accounts receivable from the Army, we expect future payments from Army to be impacted by this transition. |
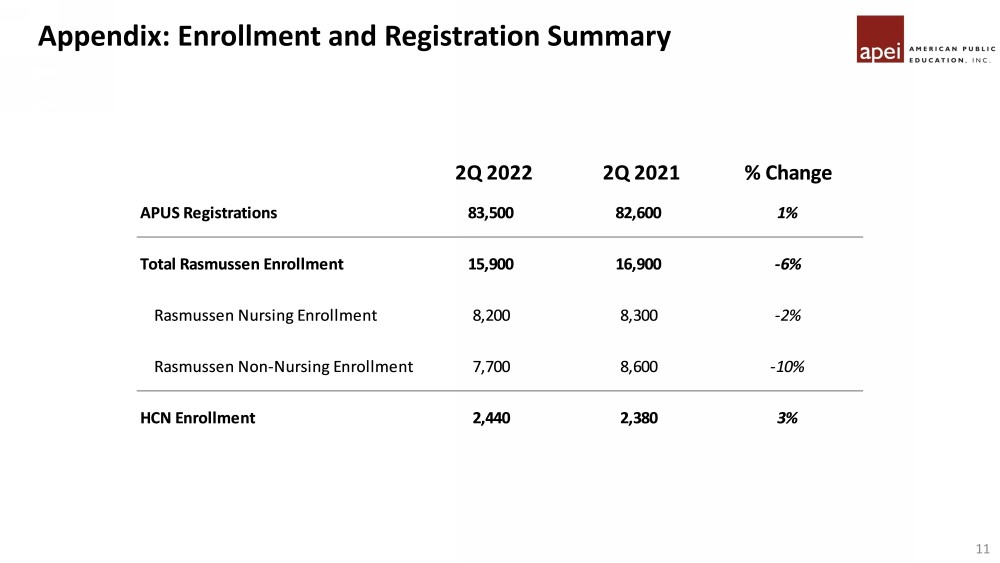
Registrations and Enrollment:
| 2022 | 2021 | % Change | |
| American Public University System1 | |||
| For the three months ended June 30, Net Course Registrations |
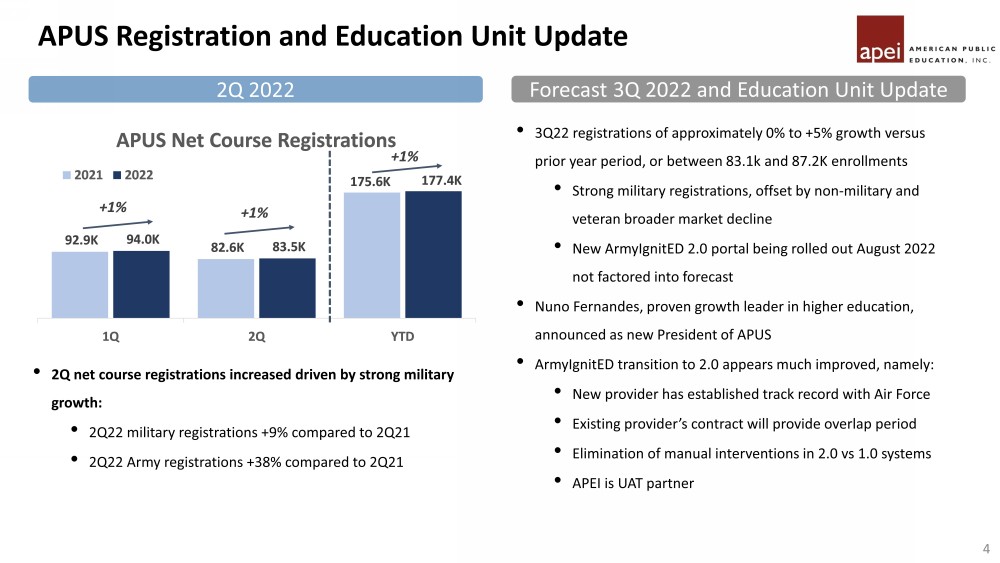
83,500 | 82,600 | 1% |
| For the six months ended June 30, Net Course Registrations |
177,400 | 175,600 | 1% |
| Rasmussen University2 | |||
| For the three months ended June 30, Total Student Enrollment |
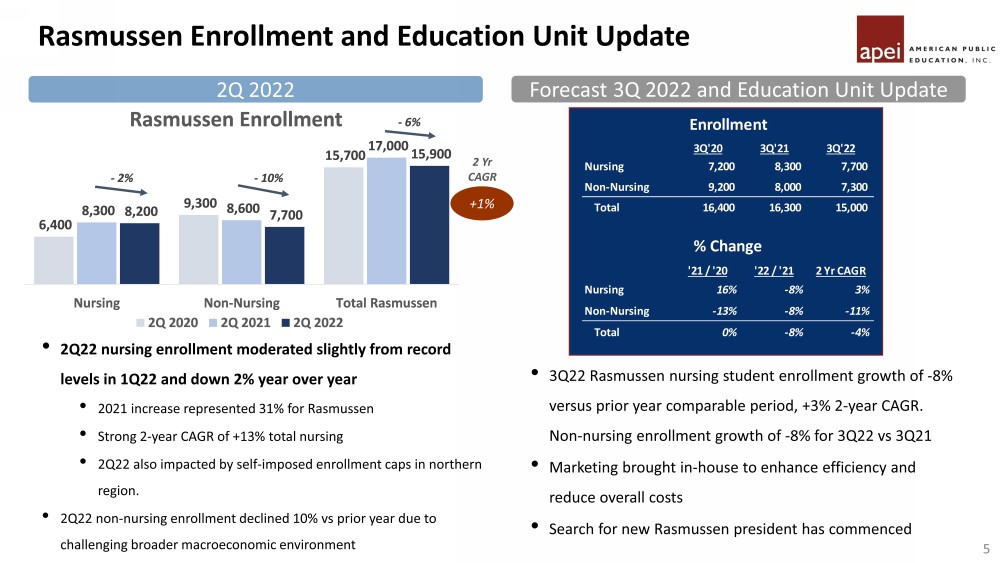
15,900 | 17,000 | -6% |
| Hondros College of Nursing3 | |||
| For the three months ended June 30, Total Student Enrollment |
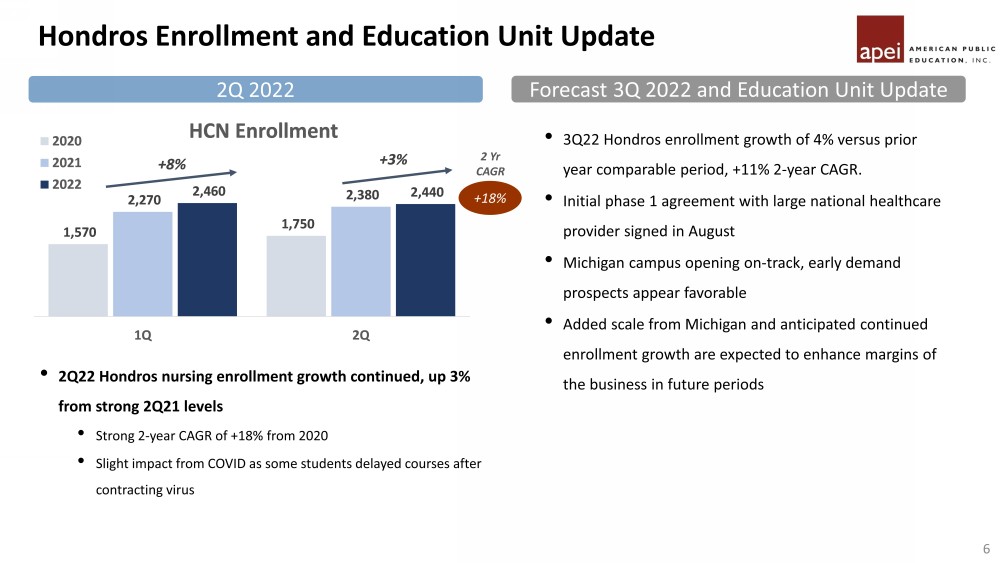
2,440 | 2,380 | 3% |
1APUS Net Course Registrations represents the approximate aggregate number of courses for which students remain enrolled after the date by which they may drop a course without financial penalty. Excludes students in doctoral programs.
2Rasmussen Student Enrollment represents students in an active status as of the full-term census or billing date.
3HCN Student Enrollment represents the approximate number of students enrolled in a course after the date by which students may drop a course without financial penalty.
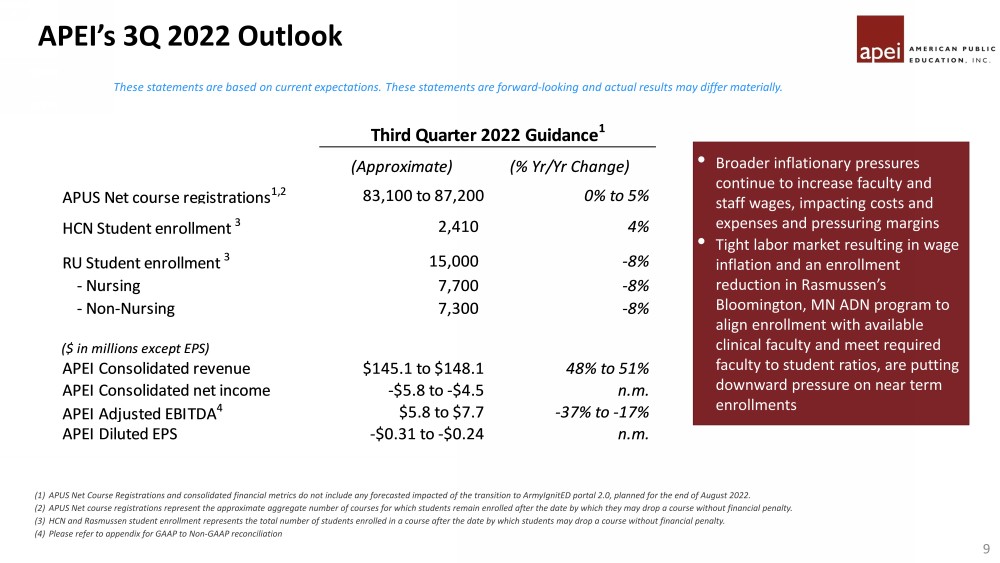
Third Quarter 2022 Outlook:
The following statements are based on APEI’s current expectations. These statements are forward-looking and actual results may differ materially. APEI undertakes no obligation to update publicly any forward-looking statements for any reason unless required by law. Refer to APEI’s earnings conference call and presentation for further details.
Third Quarter 2022 Guidance1 | ||||||||
| (Approximate) | (% Yr/Yr Change) | |||||||
| APUS Net course registrations | 83,100 to 87,200 | 0% to 5% | ||||||
| HCN Student enrollment | 2,410 | 4% | ||||||
| RU Student enrollment | 15,000 | -8% | ||||||
| - Nursing | 7,700 | -8% | ||||||
| - Non-Nursing | 7,300 | -8% | ||||||
| ($ in millions except EPS) | ||||||||
| APEI Consolidated revenue | $145.1 to $148.1 | 48% to 51% | ||||||
| APEI Consolidated net income | -$5.8 to -$4.5 | n.m. | ||||||
| APEI Adjusted EBITDA | $5.8 to $7.7 | -37% to -17% | ||||||
| APEI Diluted EPS | -$0.31 to -$0.24 | n.m | ||||||
1APUS Net Course Registrations and consolidated financial metrics do not include any forecasted impact of the transition to ArmyIgnitED portal 2.0, planned for the end of August 2022.
Non-GAAP Financial Measures:
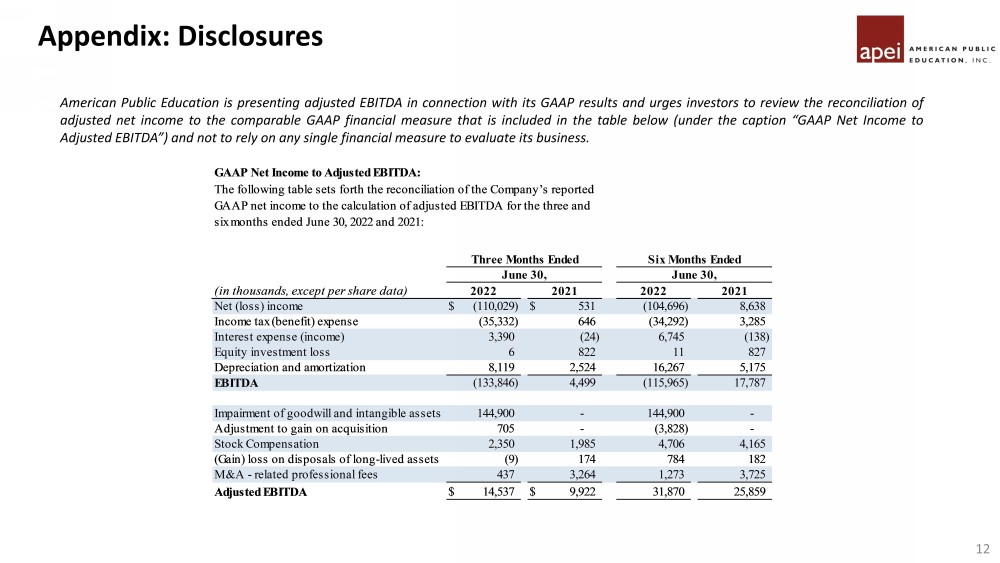
This press release contains the non-GAAP financial measures of EBITDA (earnings before interest, taxes, depreciation, and amortization) and Adjusted EBITDA (EBITDA less non-cash expenses such as stock compensation and non-recurring expenses). APEI believes that the use of these measures is useful because they allow investors to better evaluate APEI’s operating profit and cash generation capabilities.
For the three months ended June 30, 2022 and 2021, adjusted EBITDA excludes the non-cash impairment charge, the adjustment to the gain on acquisition, non-cash compensation expense, loss on disposals of long-lived assets, and M&A-related professional fees.
These non-GAAP measures should not be considered in isolation or as an alternative to measures determined in accordance with generally accepted accounting principles in the United States (GAAP). The principal limitation of our non-GAAP measures are that they exclude expenses that are required by GAAP to be recorded. In addition, non-GAAP measures are subject to inherent limitations as they reflect the exercise of judgment by management about which expenses are excluded.
APEI is presenting EBITDA and adjusted EBITDA in connection with its GAAP results and urges investors to review the reconciliation of EBITDA and adjusted EBITDA to the comparable GAAP financial measures that is included in the tables following this press release (under the captions “GAAP Net Income to Adjusted EBITDA,” and “GAAP Outlook Net Income to Outlook Adjusted EBITDA”) and not to rely on any single financial measure to evaluate its business.
Webcast:
A live webcast of the APEI’s second quarter 2022 earnings conference call will be held today at 5:00 p.m. Eastern time. This webcast will be open to listeners who log in through the APEI’s investor relations website, www.apei.com.
A replay of the live webcast will also be available starting approximately one hour after the conclusion of the live webcast. The replay will be archived and available to listeners through APEI’s investor relations website for one year.
About American Public Education
American Public Education, Inc. (Nasdaq: APEI), through its institutions American Public University System (APUS), Rasmussen University, Hondros College of Nursing, and Graduate School USA, educate the service-minded student by providing career-focused higher education and career learning.
APUS, which operates through American Military University and American Public University, is the leading educator to active-duty military and veteran students* and serves approximately 90,000 adult learners worldwide via accessible and affordable higher education. Rasmussen University is a 120-year-old nursing and health sciences-focused institution that serves approximately 15,000 students across its 23 campuses and student service centers in six states and online. It also has schools of Business, Technology, Design, Early Education and Justice Studies.
Hondros College of Nursing focuses on educating pre-licensure nursing students at its six campuses in Ohio and one in Indiana. It is the largest educator of PN (LPN) nurses in the state of Ohio** with approximately 2,440 students. Graduate School USA is a leading training provider to the federal workforce with an extensive portfolio of government agency customers. It serves the federal workforce through customized contract training (B2G) to federal agencies and through open enrollment (B2C) to government professionals.
Both APUS and Rasmussen are institutionally accredited by the Higher Learning Commission (HLC), an institutional accreditation agency recognized by the U.S. Department of Education. Hondros is accredited by the Accrediting Bureau of Health Education Schools (ABHES). GSUSA is accredited by the Accrediting Council for Continuing Education & Training (ACCET). For additional information, visit www.apei.com.
*Based on FY 2019 Department of Defense tuition assistance and Veterans Administration student enrollment data, as reported by Military Times, 2020.
**Based on information compiled by the National Council of State Boards of Nursing and Ohio Board of Nursing.
Forward Looking Statements
Statements made in this press release regarding APEI or its subsidiaries that are not historical facts are forward-looking statements based on current expectations, assumptions, estimates and projections about APEI and the industry. In some cases, forward-looking statements can be identified by words such as “anticipate,” “believe,” “seek,” “could,” “estimate,” “expect,” “intend,” “may,” “plan,” “should,” “will,” “would,” and similar words or their opposites. Forward-looking statements include, without limitation, statements regarding expected growth, registration and enrollments, revenues, income and adjusted EBITDA and EBITDA, benefits of the acquisition of Rasmussen University and plans with respect to recent, current and future initiatives.
Forward-looking statements are subject to risks and uncertainties that could cause actual results to differ materially from those expressed or implied by such statements. Such risks and uncertainties include, among others, risks related to: the effects, duration, and severity of and APEI’s response to the COVID-19 pandemic; adverse effects on demand as the pandemic abates; APEI’s dependence on the effectiveness of its ability to attract students who persist in its institutions’ programs; changing market demands; APEI’s inability to effectively market its institutions’ programs; APEI’s inability to maintain strong relationships with the military and maintain course registrations and enrollments from military students; APEI’s loss of its ability to receive funds under tuition assistance programs or the reduction, elimination, or suspension of tuition assistance; adverse effects of changes APEI makes to improve the student experience and enhance the ability to identify and enroll students who are likely to succeed; APEI’s need to successfully adjust to future market demands by updating existing programs and developing new programs; APEI’s failure to comply with regulatory and accrediting agency requirements and to maintain institutional accreditation; APEI’s loss of eligibility to participate in Title IV programs or ability to process Title IV financial aid; entering into and integrating acquisitions, including the integration of RU and GSUSA; APEI’s dependence on its technology infrastructure; and the various risks described in the “Risk Factors” section and elsewhere in APEI’s Quarterly Report on Form 10-Q for the period ended June 30, 2022 and Annual Report on Form 10-K for the year ended December 31, 2021, and in other filings with the SEC. You should not place undue reliance on any forward-looking statements. APEI undertakes no obligation to update publicly any forward-looking statements for any reason, unless required by law, even if new information becomes available or other events occur in the future.
Contacts:
Ryan Koren
AVP, Investor Relations & Corporate Development
(610) 428-7376
###
| American Public Education, Inc. |
| Consolidated Statement of Income |
| (In thousands, except per share data) |
| Three Months Ended | ||||||||
| June 30, | ||||||||
| 2022 | 2021 | |||||||
| (unaudited) | ||||||||
| Revenues | $ | 149,608 | $ | 78,014 | ||||
| Costs and expenses: | ||||||||
| Instructional costs and services | 72,089 | 30,394 | ||||||
| Selling and promotional | 35,846 | 17,490 | ||||||
| General and administrative | 29,923 | 25,457 | ||||||
| Impairment of goodwill and intangible assets | 144,900 | — | ||||||
| (Gain) loss on disposals of long-lived assets | (9 | ) | 174 | |||||
| Depreciation and amortization | 8,119 | 2,524 | ||||||
| Total costs and expenses | 290,868 | 76,039 | ||||||
| (Loss) income from operations before | ||||||||
| interest and income taxes | (141,260 | ) | 1,975 | |||||
| Gain on acquisition | (705 | ) | — | |||||
| Interest (expense) income | (3,390 | ) | 24 | |||||
| (Loss) income before income taxes | (145,355 | ) | 1,999 | |||||
| Income tax (benefit) expense | (35,332 | ) | 646 | |||||
| Equity investment loss | (6 | ) | (822 | ) | ||||
| Net (loss) income | $ | (110,029 | ) | $ | 531 | |||
| Net (loss) income per common share: | ||||||||
| Basic | $ | (5.83 | ) | $ | 0.03 | |||
| Diluted | $ | (5.82 | ) | $ | 0.03 | |||
| Weighted average number of | ||||||||
| common shares: | ||||||||
| Basic | 18,865 | 18,684 | ||||||
| Diluted | 18,907 | 18,840 | ||||||
| Three Months Ended | ||||||||
| Segment Information: | June 30, | |||||||
| 2022 | 2021 | |||||||
| Revenues: | ||||||||
| APUS Segment | $ | 69,904 | $ | 66,939 | ||||
| RU Segment | $ | 63,891 | $ | — | ||||
| HCN Segment | $ | 11,486 | $ | 11,134 | ||||
| Corporate and other1 | $ | 4,327 | $ | (59 | ) | |||
| Income (loss) from operations before | ||||||||
| interest and income taxes: | ||||||||
| APUS Segment | $ | 13,624 | $ | 9,113 | ||||
| RU Segment | $ | (146,553 | ) | $ | — | |||
| HCN Segment | $ | (630 | ) | $ | 117 | |||
| Corporate and other1 | $ | (7,701 | ) | $ | (7,255 | ) | ||
| Six Months Ended | ||||||||
| June 30, | ||||||||
| 2022 | 2021 | |||||||
| (unaudited) | ||||||||
| Revenues | $ | 304,355 | $ | 166,555 | ||||
| Costs and expenses: | ||||||||
| Instructional costs and services | 143,787 | 62,713 | ||||||
| Selling and promotional | 75,165 | 36,892 | ||||||
| General and administrative | 59,512 | 48,981 | ||||||
| Impairment of goodwill and intangible assets | 144,900 | — | ||||||
| Loss on disposals of long-lived assets | 784 | 182 | ||||||
| Depreciation and amortization | 16,267 | 5,175 | ||||||
| Total costs and expenses | 440,415 | 153,943 | ||||||
| (Loss) income from operations before | ||||||||
| interest income and income taxes | (136,060 | ) | 12,612 | |||||
| Gain on acquisition | 3,828 | — | ||||||
| Interest (expense) income | (6,745 | ) | 138 | |||||
| (Loss) income before income taxes | (138,977 | ) | 12,750 | |||||
| Income tax (benefit) expense | (34,292 | ) | 3,285 | |||||
| Equity investment income (loss) | (11 | ) | (827 | ) | ||||
| Net (loss) income | $ | (104,696 | ) | $ | 8,638 | |||
| Net income per common share: | ||||||||
| Basic | $ | (5.56 | ) | $ | 0.49 | |||
| Diluted | $ | (5.54 | ) | $ | 0.49 | |||
| Weighted average number of | ||||||||
| common shares: | ||||||||
| Basic | 18,835 | 17,454 | ||||||
| Diluted | 18,893 | 17,654 | ||||||
| Six Months Ended | ||||||||
| Segment Information: | June 30, | |||||||
| 2022 | 2021 | |||||||
| Revenues: | ||||||||
| APUS Segment | $ | 142,994 | $ | 144,415 | ||||
| RU Segment | $ | 130,990 | $ | — | ||||
| HCN Segment | $ | 23,027 | $ | 22,266 | ||||
| Corporate and other1 | $ | 7,344 | $ | (126 | ) | |||
| (Loss) income from operations before | ||||||||
| interest income and income taxes: | ||||||||
| APUS Segment | $ | 26,806 | $ | 23,144 | ||||
| RU Segment | $ | (145,662 | ) | $ | — | |||
| HCN Segment | $ | (1,625 | ) | $ | 900 | |||
| Corporate and other1 | $ | (15,579 | ) | $ | (11,432 | ) | ||
The RU Segment reflects the operations of RU, which was acquired on the RU Closing Date. The Company did not consolidate the financial results of the RU Segment prior to the RU Closing Date.
1. Corporate and Other includes tuition and contract training revenue earned by GSUSA from the GSUSA Closing Date through June 30, 2022. Contract training revenue represents both individual and customized training programs and is recognized when the services are performed. Additionally, the APUS Segment charges the HCN Segment and corporate employees for the value of courses taken by HCN Segment employees and corporate employees at APUS. The elimination of this intersegment revenue is included within Corporate and Other.
GAAP Net Income to Adjusted EBITDA:
The following table sets forth the reconciliation of the Company’s reported GAAP net income to the calculation of adjusted EBITDA for the three and six months ended June 30, 2022 and 2021:
| Three Months Ended | Six Months Ended | |||||||||||||||
| June 30, | June 30, | |||||||||||||||
| (in thousands, except per share data) | 2022 | 2021 | 2022 | 2021 | ||||||||||||
| Net (loss) income | $ | (110,029 | ) | $ | 531 | (104,696 | ) | 8,638 | ||||||||
| Income tax (benefit) expense | (35,332 | ) | 646 | (34,292 | ) | 3,285 | ||||||||||
| Interest expense (income) | 3,390 | (24 | ) | 6,745 | (138 | ) | ||||||||||
| Equity investment loss | 6 | 822 | 11 | 827 | ||||||||||||
| Depreciation and amortization | 8,119 | 2,524 | 16,267 | 5,175 | ||||||||||||
| EBITDA | (133,846 | ) | 4,499 | (115,965 | ) | 17,787 | ||||||||||
| Impairment of goodwill and intangible assets | 144,900 | - | 144,900 | - | ||||||||||||
| Adjustment to gain on acquisition | 705 | - | (3,828 | ) | - | |||||||||||
| Stock Compensation | 2,350 | 1,985 | 4,706 | 4,165 | ||||||||||||
| (Gain) loss on disposals of long-lived assets | (9 | ) | 174 | 784 | 182 | |||||||||||
| M&A - related professional fees | 437 | 3,264 | 1,273 | 3,725 | ||||||||||||
| Adjusted EBITDA | $ | 14,537 | $ | 9,922 | 31,870 | 25,859 | ||||||||||
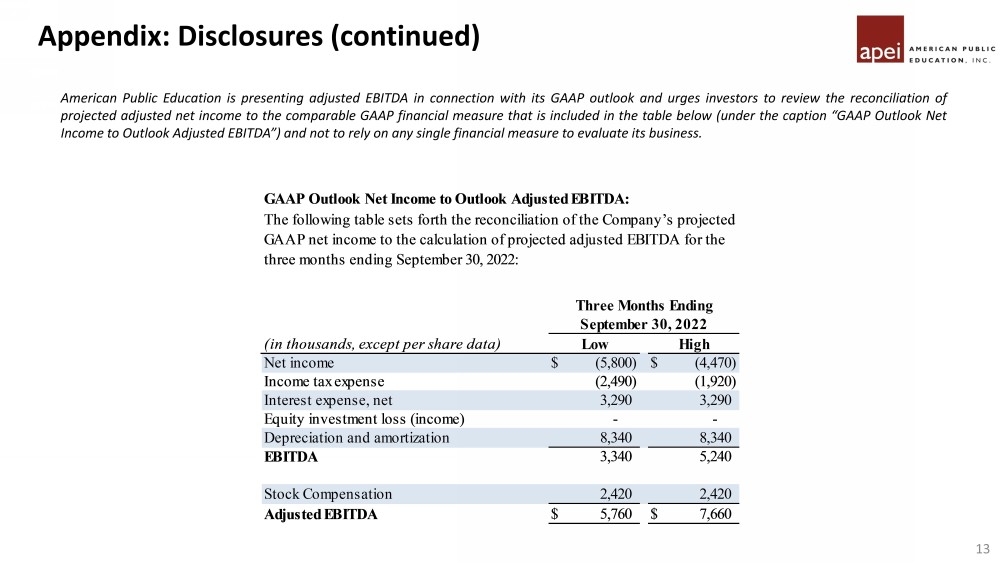
GAAP Outlook Net Income to Outlook Adjusted EBITDA:
The following table sets forth the reconciliation of the Company’s projected GAAP net income to the calculation of projected adjusted EBITDA for the three months ending September 30, 2022:
| Three Months Ending | ||||||||
| September 30, 2022 | ||||||||
| (in thousands, except per share data) | Low | High | ||||||
| Net income | $ | (5,800 | ) | $ | (4,470 | ) | ||
| Income tax expense | (2,490 | ) | (1,920 | ) | ||||
| Interest expense, net | 3,290 | 3,290 | ||||||
| Equity investment loss (income) | - | - | ||||||
| Depreciation and amortization | 8,340 | 8,340 | ||||||
| EBITDA | 3,340 | 5,240 | ||||||
| Stock Compensation | 2,420 | 2,420 | ||||||
| Adjusted EBITDA | $ | 5,760 | $ | 7,660 | ||||