Exhibit 99.3


UNITED STATES
SECURITIES AND EXCHANGE COMMISSION
WASHINGTON, D.C. 20549
FORM
CURRENT REPORT
Pursuant to Section 13 or 15(d) of the Securities Exchange Act of 1934
Date
of Report: (Date of Earliest Event Reported):
(Exact name of registrant as specified in its charter)
| (State or other jurisdiction | (Commission | (I.R.S. Employer |
| of incorporation) | File Number) | Identification No.) |
| (Address of principal executive offices) | (Zip code) |
(Registrant’s telephone number including area code)
(Former name or former address if changed since last report)
Securities registered pursuant in Section 12(b) of the Act:
| Title of each class | Trading Symbol(s) | Name of each exchange on which registered | ||
Check the appropriate box below if the Form 8-K filing is intended to simultaneously satisfy the filing obligation of the registrant under any of the following provisions (see General Instruction A.2. below):
| Written communications pursuant to Rule 425 under the Securities Act (17 CFR 230.425) | |
| Soliciting material pursuant to Rule 14a-12 under the Exchange Act (17 CFR 240.14a-12) | |
| Pre-commencement communications pursuant to Rule 14d-2(b) under the Exchange Act (17 CFR 240.14d-2(b)) | |
| Pre-commencement communications pursuant to Rule 13e-4(c) under the Exchange Act (17 CFR 240.13e-4(c)) |
Indicate by check mark whether the registrant is an emerging growth company as defined in Rule 405 of the Securities Act of 1933 (§230.405 of this chapter) or Rule 12b-2 of the Securities Exchange Act of 1934 (§240.12b-2 of this chapter).
Emerging
growth company
If an emerging growth company, indicate by check mark if the registrant has elected not to use the extended transition period for complying with any new or revised financial accounting standards provided pursuant to Section 13(a) of the Exchange Act. ☐
| Item 2.02 | Results of Operations and Financial Condition. |
On April 15, 2025, The Arena Group Holdings, Inc. (the “Company”) issued a press release announcing its financial results for the quarter and year ended December 31, 2024. A copy of the press release is furnished as Exhibit 99.1 to this Current Report on Form 8-K.
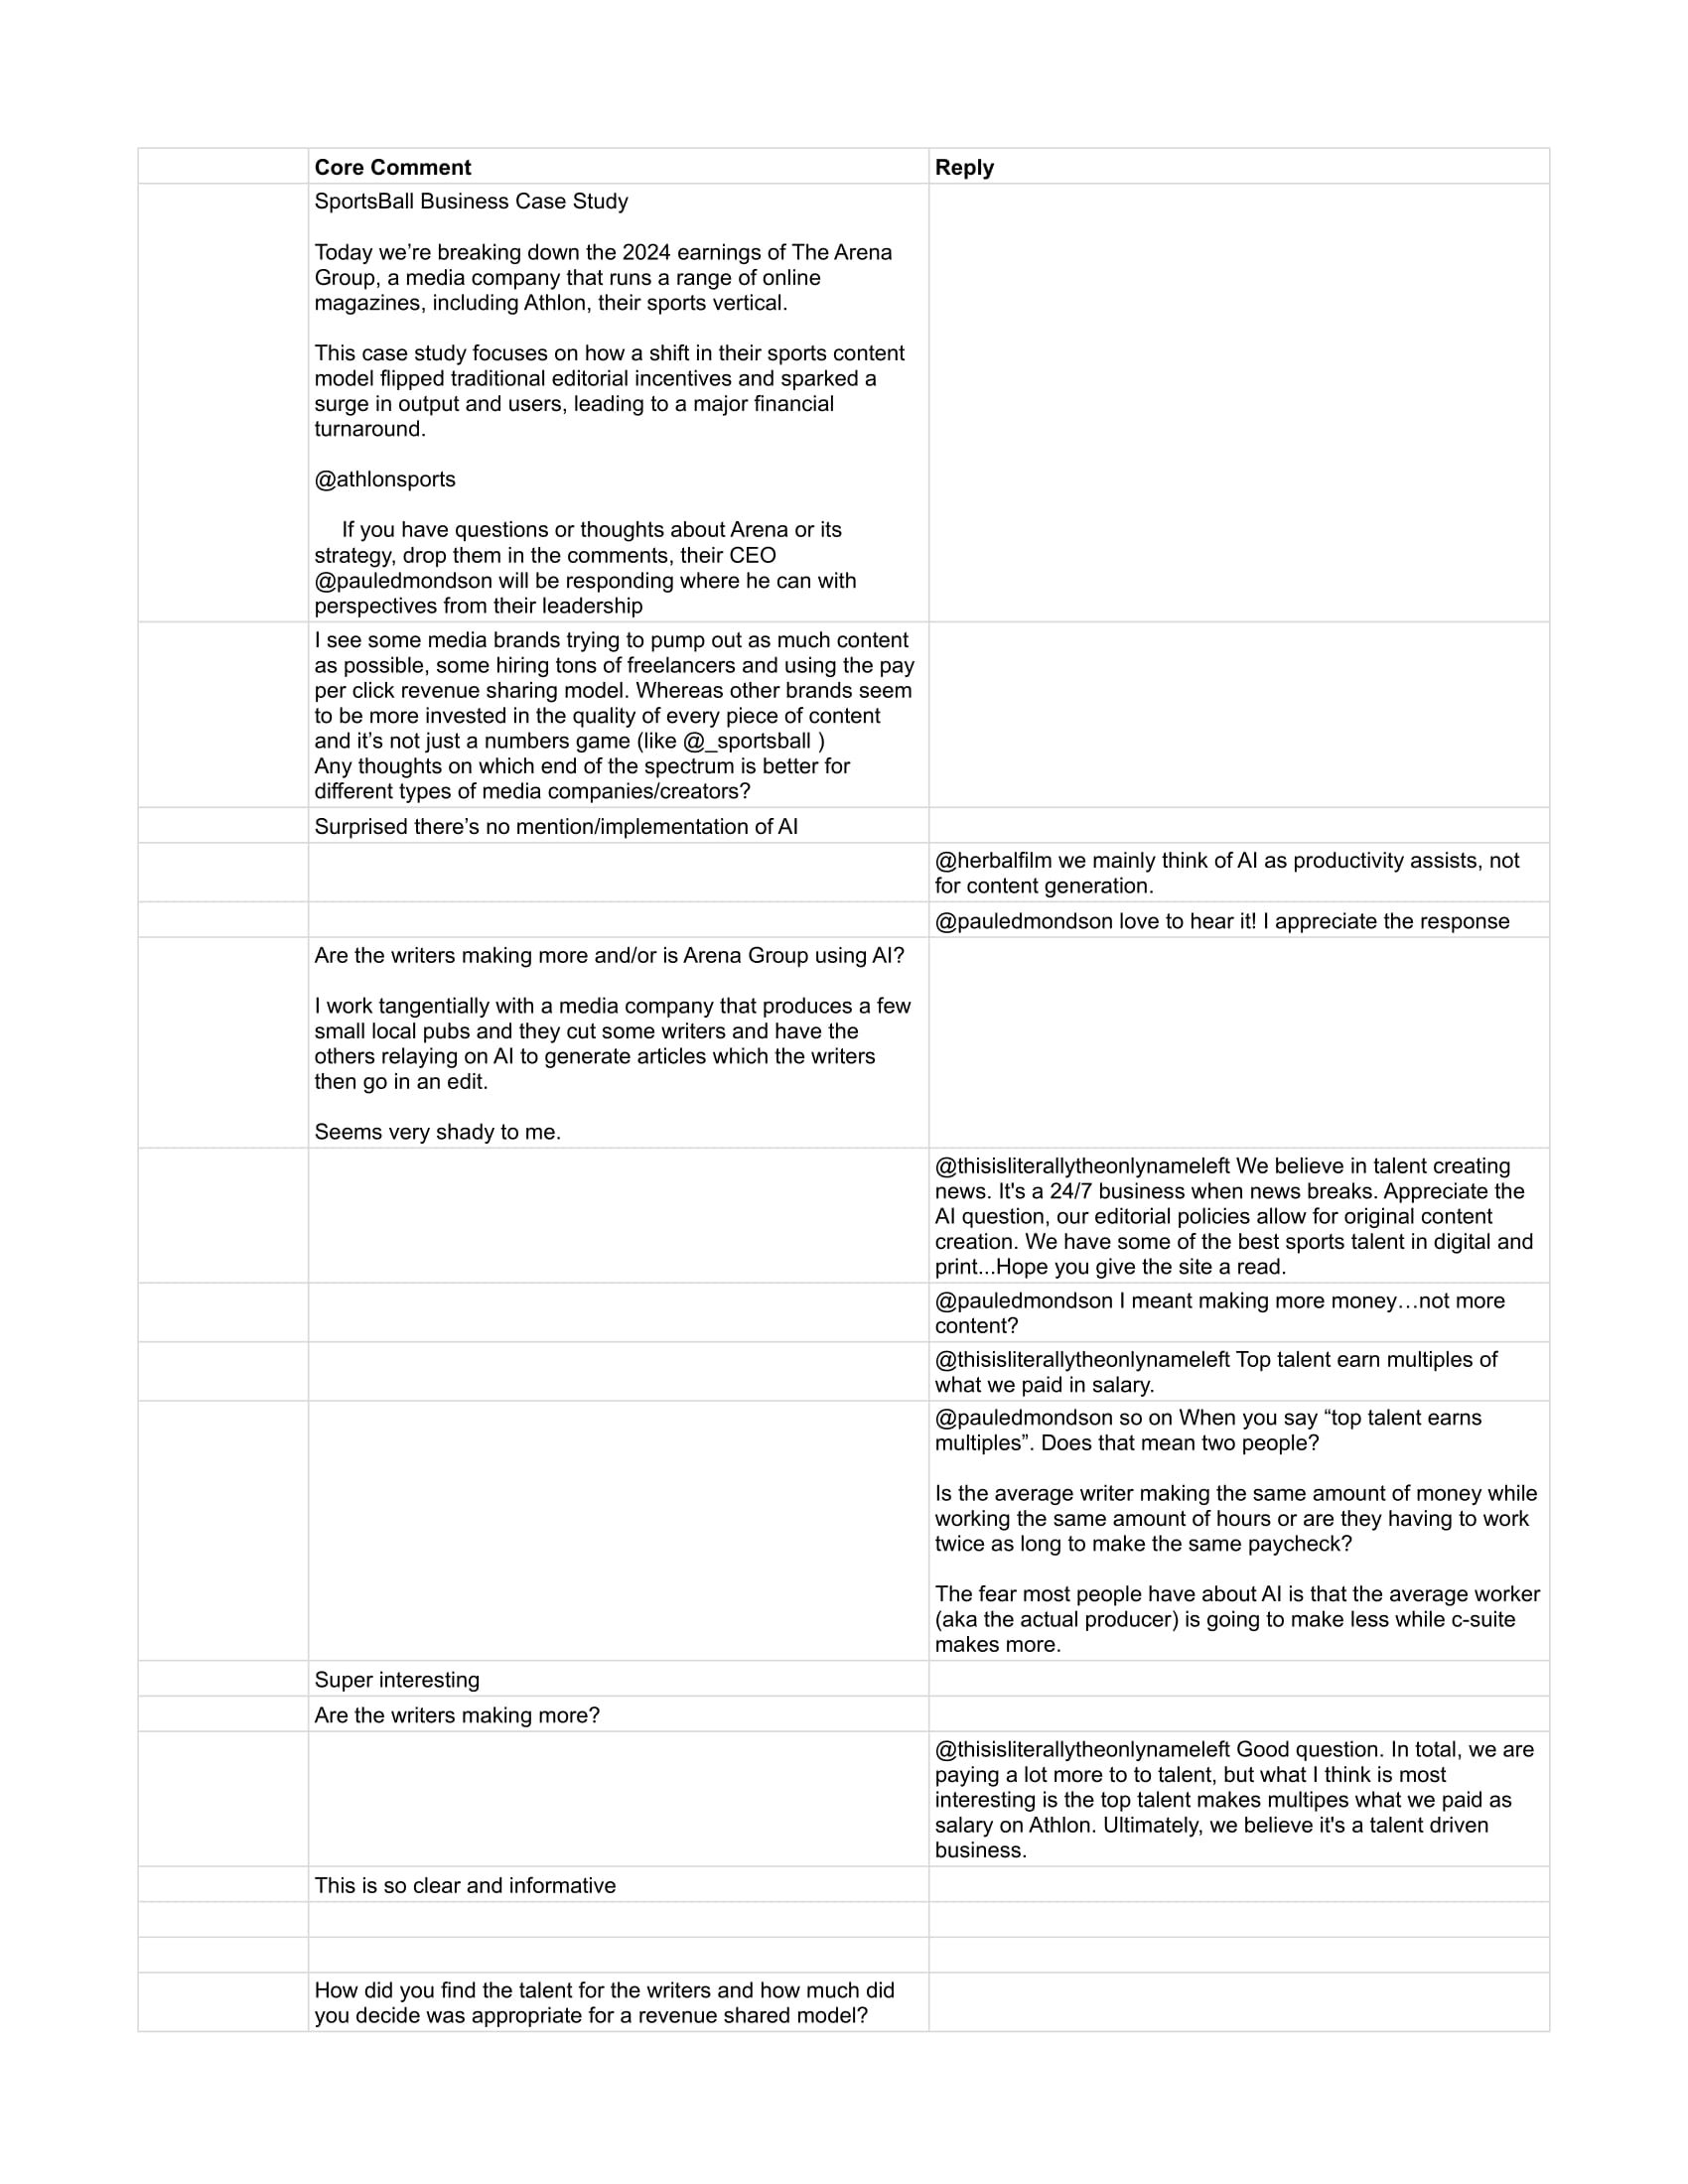
On April 15, 2025, the Company also posted to its investor relations website at https://investors.thearenagroup.net/events-and-presentations/presentations, as well as on its LinkedIn page, a video presentation by Paul Edmonson, the Company’s Chief Executive Officer, discussing the Company’s business and financial results for the quarter and year ended December 31, 2024. A copy of the transcript of Mr. Edmonson’s comments from the presentation and a copy of the slides from the presentation are furnished as Exhibit 99.2 and Exhibit 99.3 to this Current Report on Form 8-K, respectively, and are incorporated by reference herein in their entirety. The presentation, the transcript and the slides should be viewed and/or read in conjunction with the press release.
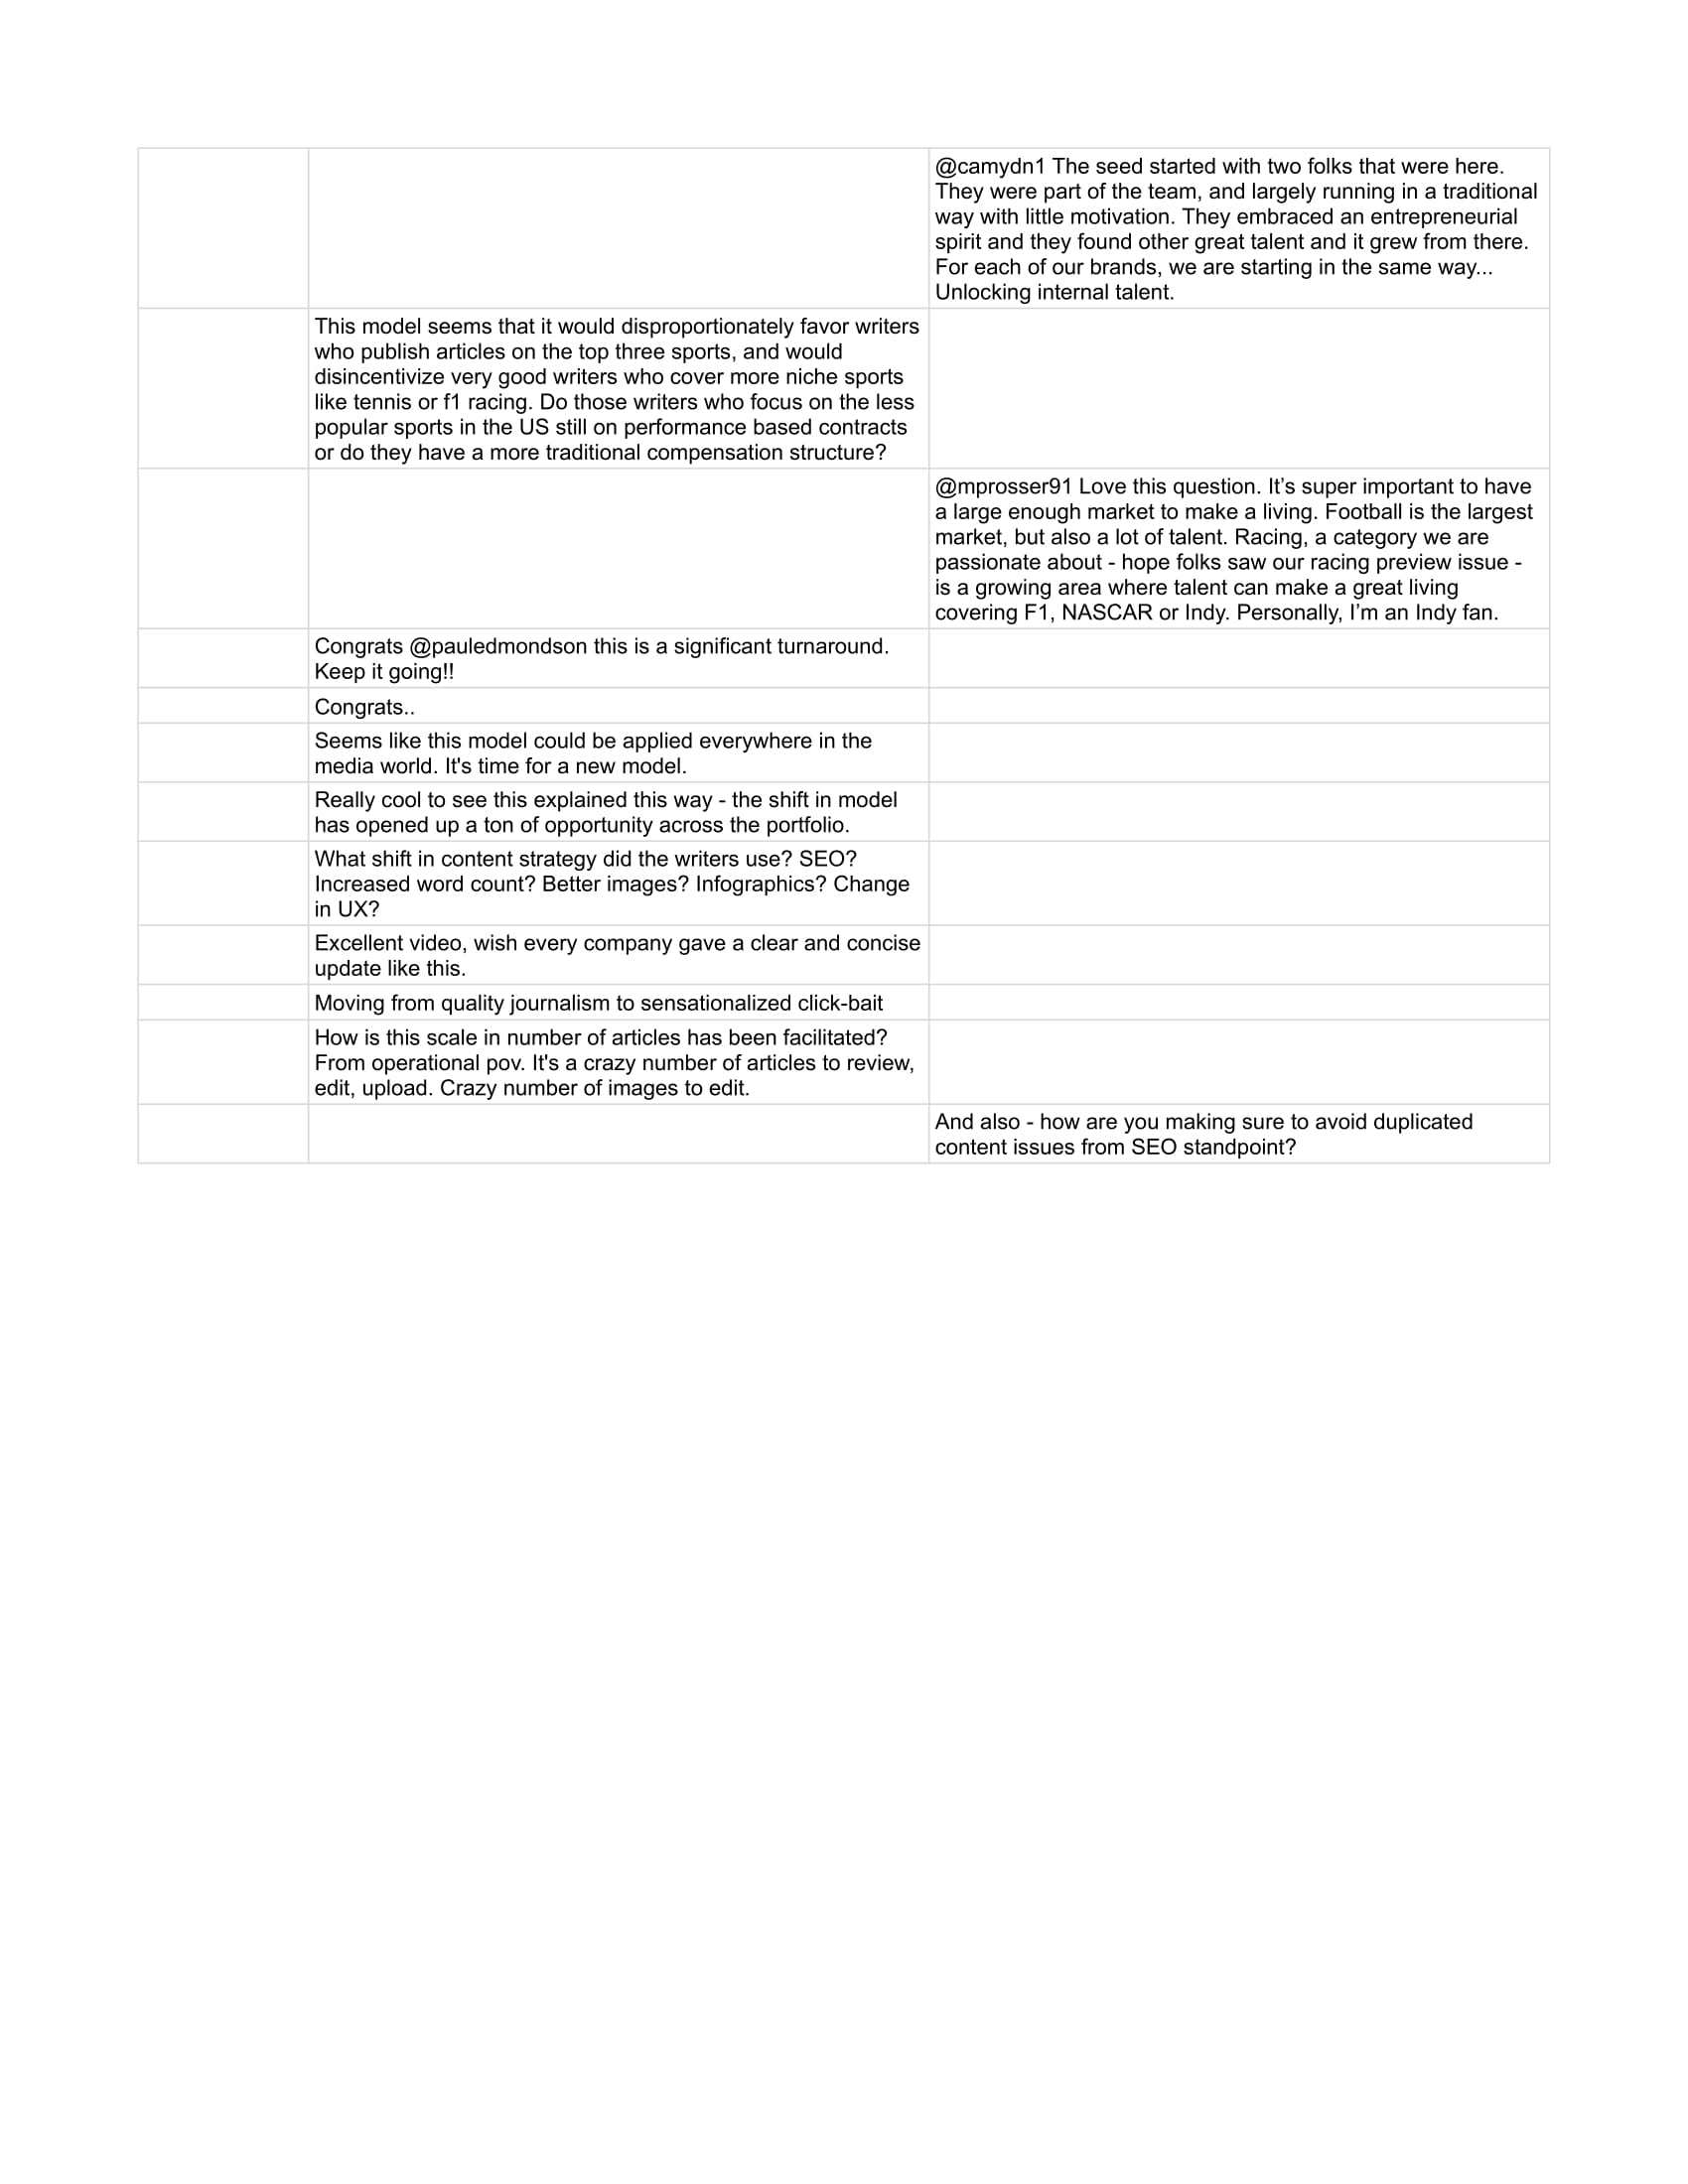
Additionally, Mr. Edmonson made himself available to respond to comments on an Instagram post made by @_sportsball on April 15, 2025 relating to the Company, its business and financial results for the quarter and year ended December 31, 2024. A copy of the transcript of the discussion in the Instagram post, a copy of the presentation included in the Instagram post and a copy of the comments and responses on the Instagram post provided by Mr. Edmonson are included as Exhibits 99.4, 99.5 and 99.6 to this Current Report on Form 8-K, respectively, and are incorporated by reference herein in their entirety. The presentation, the transcript and the comments should be viewed and/or read in conjunction with the press release.
The information furnished with this Item 2.02, including Exhibits 99.1, 99.2, 99.3, 99.4, 99.5 and 99.6 hereto, shall not be deemed “filed” for purposes of Section 18 of the Securities Exchange Act of 1934, as amended (the “Exchange Act”), or otherwise subject to the liabilities of that section, nor shall it be deemed incorporated by reference into any other filing under the Securities Act of 1933, as amended, or the Exchange Act, except as expressly set forth by specific reference in such a filing.
| Item 9.01. | Financial Statements and Exhibits. |
(d) Exhibits
SIGNATURE
Pursuant to the requirements of the Securities Exchange Act of 1934, as amended, the Registrant has duly caused this report to be signed on its behalf by the undersigned hereunto duly authorized.
| THE ARENA GROUP HOLDINGS, INC. | ||
Dated: April 18, 2025 |
By: | /s/ Paul Edmonson |
| Name: | Paul Edmonson | |
| Title: | Chief Executive Officer | |
Exhibit 99.1
The Arena Group Delivers Second Consecutive Profitable Quarter; Generates $7.2 Million in Income from Continuing Operations for Fourth Quarter of 2024
Athlon Sports’ Momentum Provides Blueprint for Scalable, Profitable Growth for Media Brands
Management Posts Video Reviewing Quarterly Results and Strategy
NEW YORK (BUSINESS WIRE) – The Arena Group Holdings, Inc. (NYSE American: AREN) (“Arena”), a technology platform and media company home to hundreds of media brands, including TheStreet, Parade Media (“Parade”), Men’s Journal, Surfer, Powder and Athlon Sports, today announced financial results for the three months ending December 31, 2024 (“Q4 2024”) and full year ended December 31, 2024 (“FY 2024”).
Financial Highlights for Q4 2024:
| ● | Quarterly revenue from continuing operations was $36.2 million, up 8% sequentially compared to Q3 2024. | |
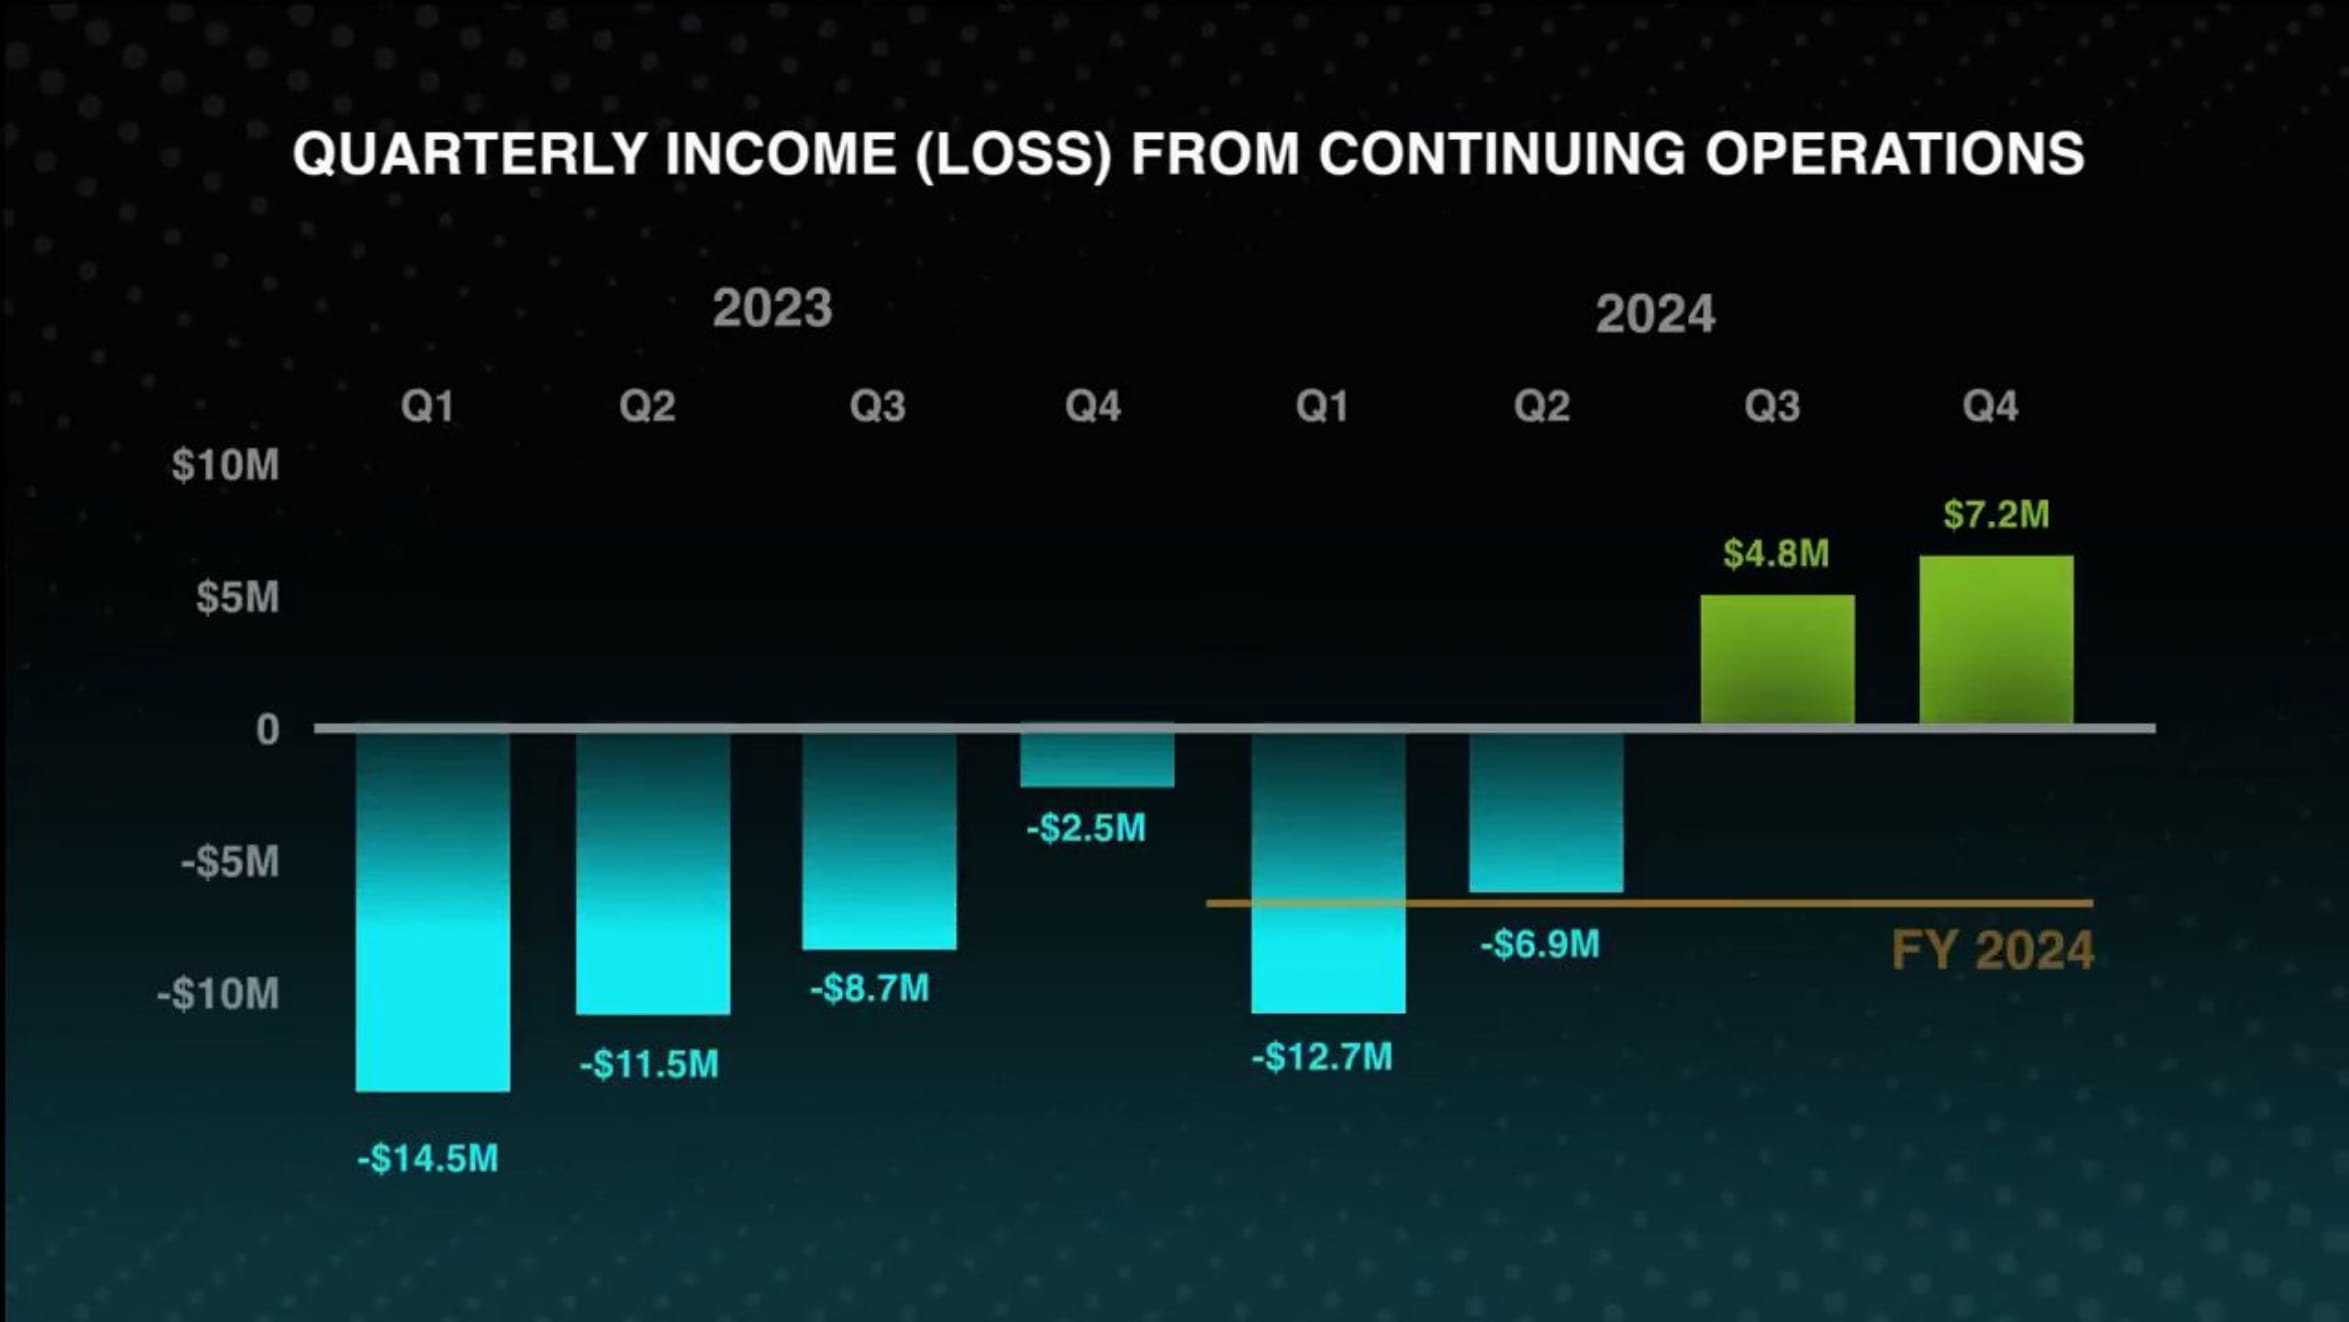
| ● | Income from continuing operations was $7.2 million, or $0.15 per diluted share for Q4 2024, compared to $4.8 million, or $0.13 per diluted share in Q3 2024. | |
| ● | Adjusted EBITDA for Q4 2024 was $13.0 million compared to $11.1 million for Q3 2024. |
Financial Highlights for fiscal year 2024:
| ● | Loss from continuing operations was $7.7 million in FY 2024 compared to $37.2 million in FY 2023. | |
| ● | Adjusted EBITDA was $27.0 million in FY 2024 compared to $13.2 million for FY 2023. |
“In 2024, we built a strong foundation with Athlon Sports. This started with premium content, expanding our print products at newsstands and growing our social footprint,” said Paul Edmondson, CEO of Arena. “We then coupled this with what we call ‘competitive publishing’ to expand our reach.”
“Competitive publishing is a new model designed for 24/7 breaking news coverage where multiple talented teams compete. It’s proven to grow audiences, pay talent better and more fairly, and be profitable for The Arena Group. A true win win.” Edmondson continued, “We launched this model on Men’s Journal in Q1 2025, and at Parade and The Street at the start of Q2 2025. The results are very promising. We expect to be profitable in every quarter of 2025.”
Operational highlights
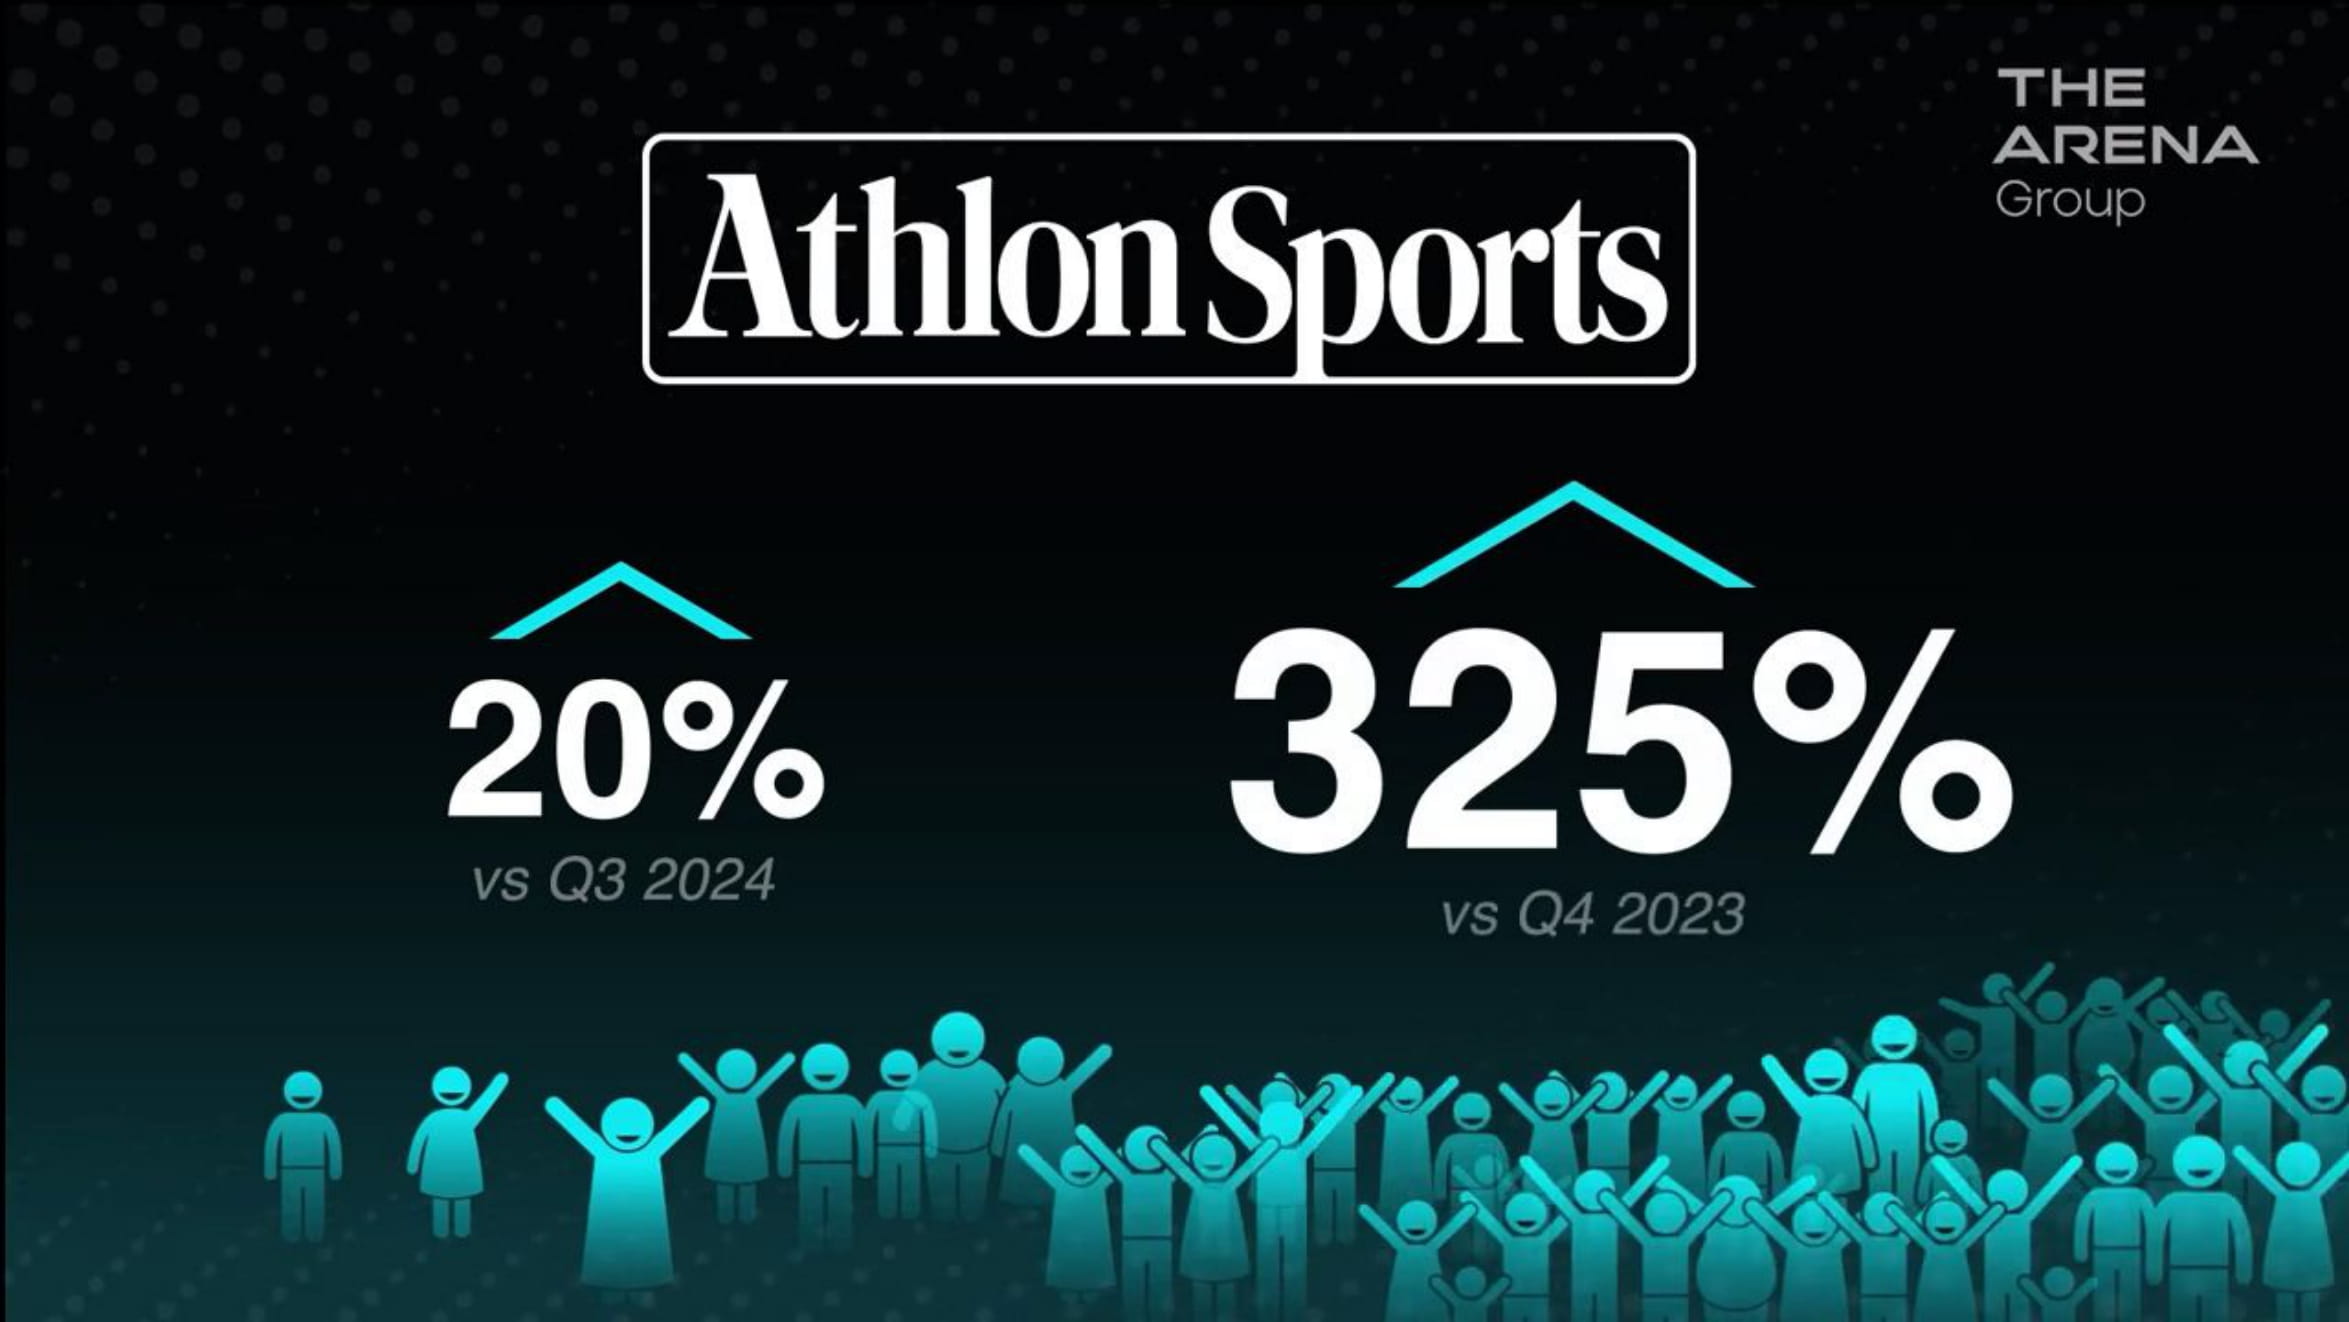
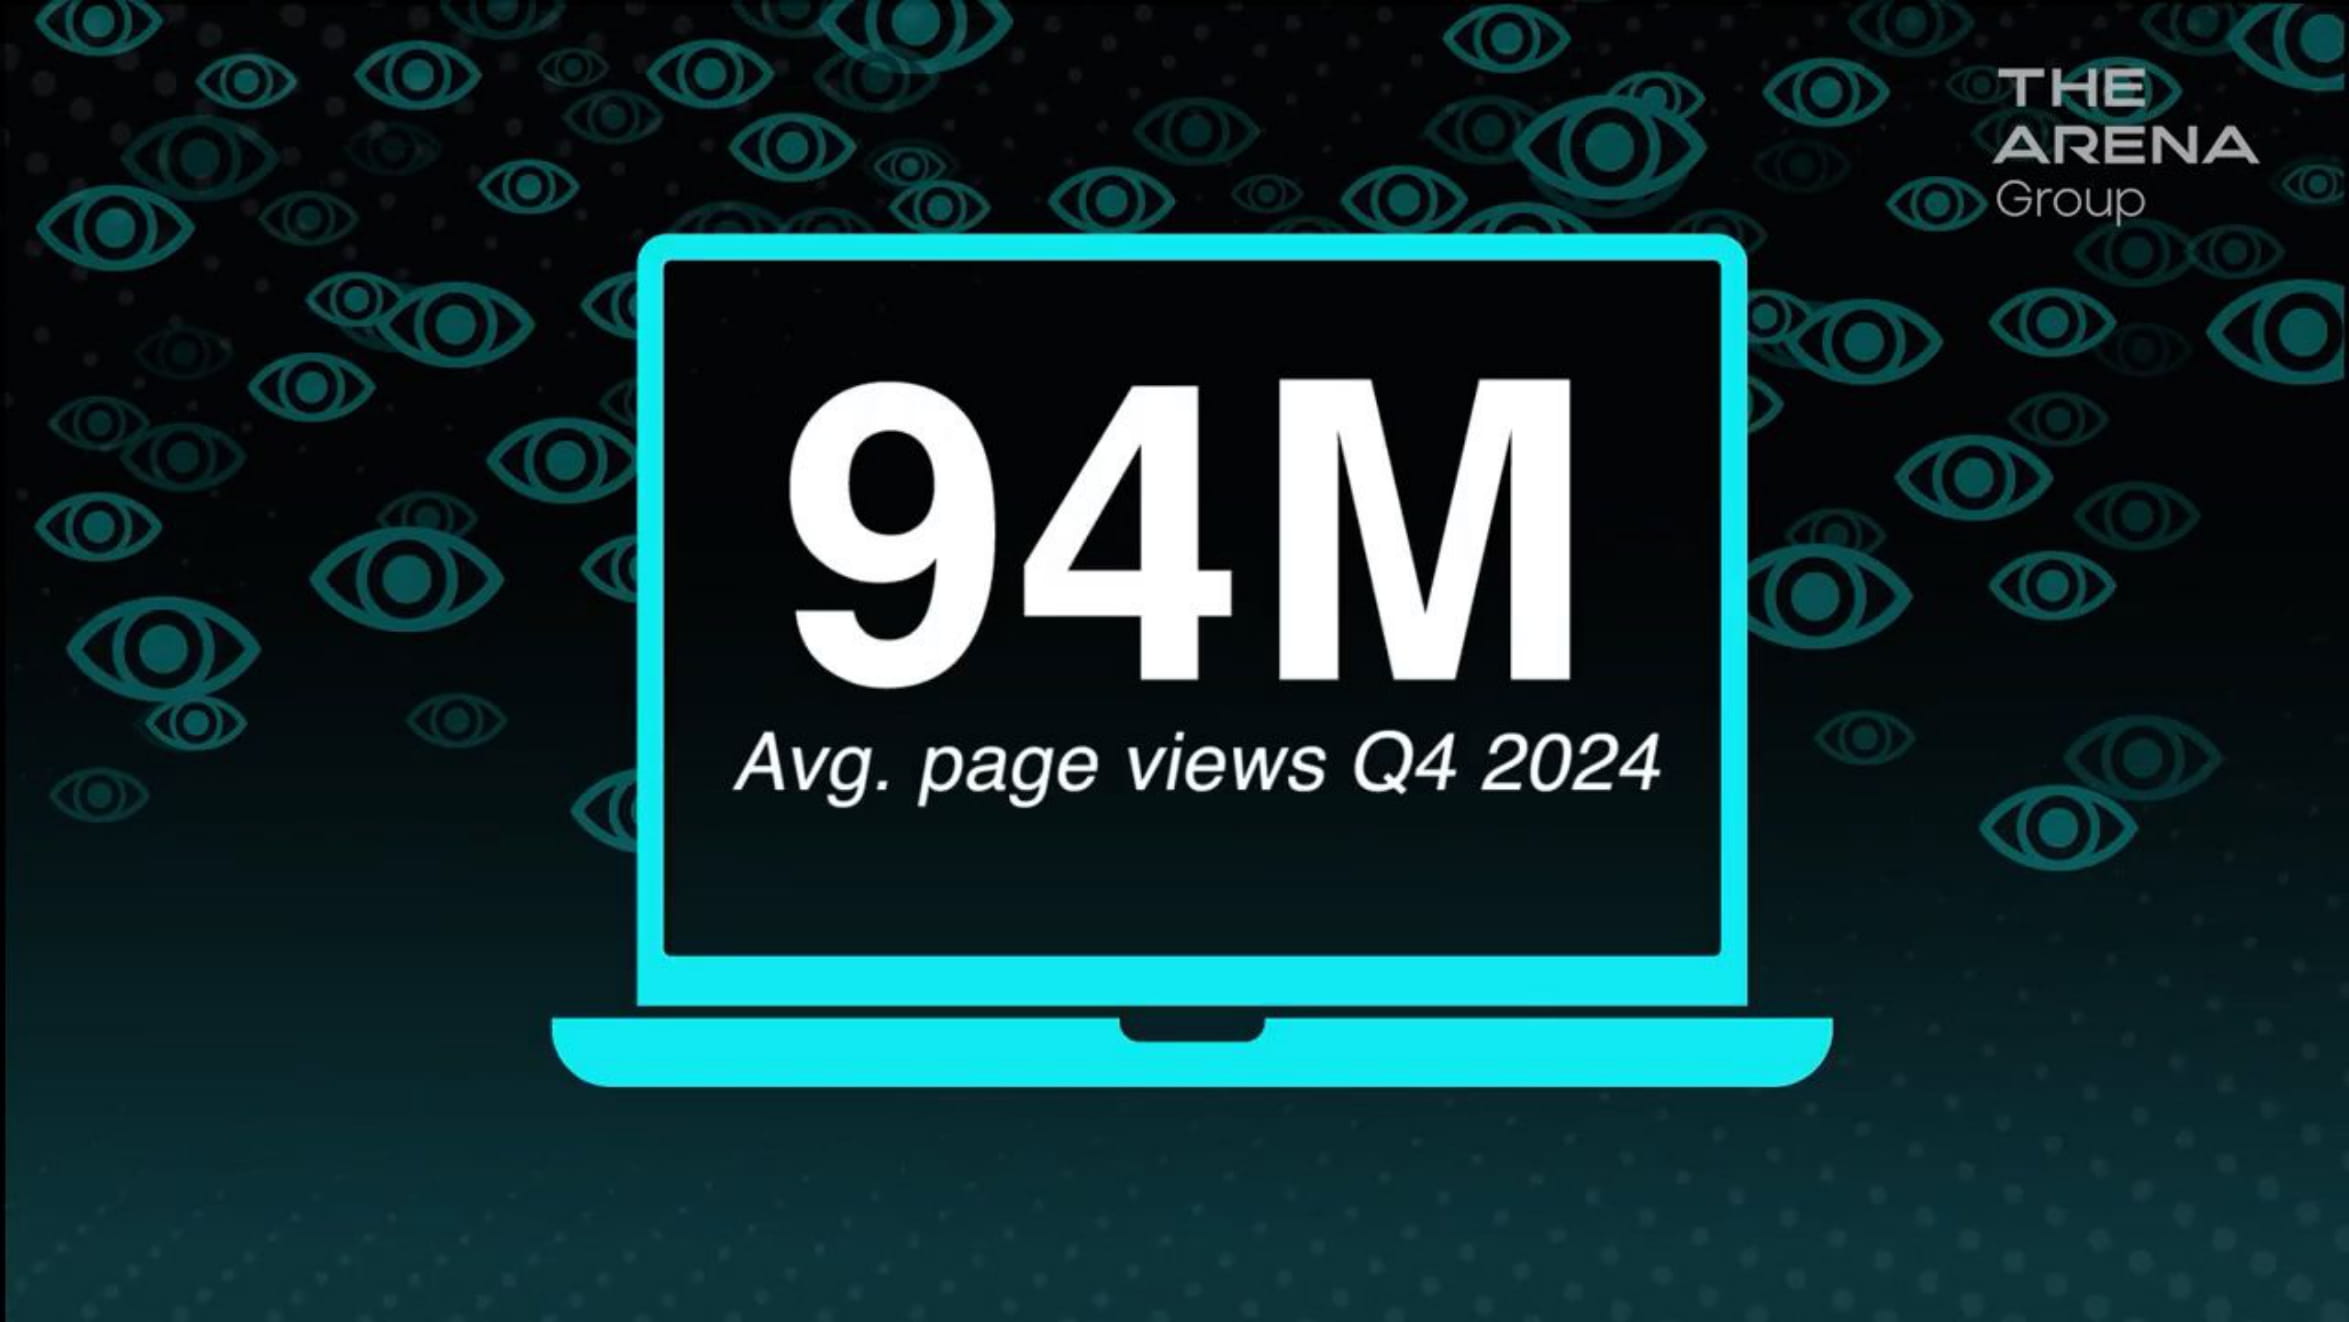
| ● | Athlon Sports: Audience traffic continues to grow substantially, increasing to 284M page views in Q4 2024 (up 20% vs Q3 2024, and 325% vs Q4 2023). The site averaged 94M page views a month in Q4 2024. | |
| ● | Parade: Digital traffic of Parade and Parade Pets also remained strong in Q4 2024 with more than 53M average monthly users and 74M average monthly page views (up 6% vs Q3 2024). It has balanced, diversified revenue as its performance marketing business and social media audience continue to grow. | |
| ● | The Street: The financial brand continues to reach a dedicated, high-net-worth, audience, delivering 36M average monthly page views in Q4 2024, up 1% vs Q3 2024. |
Video Message:
Paul Edmondson, The Arena Group’s Chief Executive Officer, has posted a video reviewing Arena’s quarterly results and business strategy. The video addresses selected questions previously submitted by investors and other interested parties. It has been shared across Arena’s social media channels and is available HERE.
About The Arena Group
The Arena Group (NYSE American: AREN) is an innovative technology platform and media company with a proven cutting-edge playbook that transforms media brands. Our unified technology platform empowers creators and publishers with tools to publish and monetize their content, while also leveraging quality journalism of anchor brands like TheStreet, Parade, Men’s Journal and Athlon Sports to build their businesses. We aggregate content across a diverse portfolio of brands, reaching over 100 million users monthly. Visit us at thearenagroup.net and discover how we are revolutionizing the world of digital media.
The Arena Group Contact:
Steve Janisse, The Arena Group
404-574-9206
The Arena Group Investor Contact:
Rob Fink
FNK IR
646-809-4048
Source: The Arena Group Holdings, Inc.
# # #
THE ARENA GROUP HOLDINGS, INC. AND SUBSIDIARIES
CONSOLIDATED STATEMENTS OF OPERATIONS
| Three Months Ended December 31, | Years Ended December 31, | |||||||||||||||
| 2024 | 2023 | 2024 | 2023 | |||||||||||||
| ($ in thousands, excpet share data) | ||||||||||||||||
| Revenue | $ | 36,228 | $ | 44,144 | $ | 125,907 | $ | 143,630 | ||||||||
| Cost of revenue (includes amortization of platform development and developed technology for 2024 and 2023 of $5,988 and $8,782, respectively) | 17,154 | 26,366 | 70,189 | 88,357 | ||||||||||||
| Gross profit | 19,074 | 17,778 | 55,718 | 55,273 | ||||||||||||
| Operating expenses | ||||||||||||||||
| Selling and marketing | 2,222 | 5,090 | 12,548 | 24,263 | ||||||||||||
| General and administrative | 5,683 | 8,267 | 30,399 | 43,783 | ||||||||||||
| Depreciation and amortization | 899 | 1,027 | 3,704 | 4,243 | ||||||||||||
| Loss on impairment of assets | - | - | 1,198 | 119 | ||||||||||||
| Loss on sale of assets | - | 325 | - | 325 | ||||||||||||
| Total operating expenses | 8,804 | 14,709 | 47,849 | 72,733 | ||||||||||||
| Income (loss) from operations | 10,270 | 3,069 | 7,869 | (17,460 | ) | |||||||||||
| Other (expense) income | ||||||||||||||||
| Change in valuation of contingent consideration | - | (541 | ) | (313 | ) | (1,010 | ) | |||||||||
| Interest expense, net | (2,921 | ) | (4,740 | ) | (14,668 | ) | (17,965 | ) | ||||||||
| Liquidated damages | (77 | ) | (128 | ) | (306 | ) | (583 | ) | ||||||||
| Total other expense | (2,998 | ) | (5,409 | ) | (15,287 | ) | (19,558 | ) | ||||||||
| Income (loss) before income taxes | 7,272 | (2,340 | ) | (7,418 | ) | (37,018 | ) | |||||||||
| Income tax provision | (132 | ) | (52 | ) | (249 | ) | (197 | ) | ||||||||
| Income (loss) from continuing operations | 7,140 | (2,392 | ) | (7,667 | ) | (37,215 | ) | |||||||||
| Loss from discontinued operations, net of tax | (282 | ) | (3,163 | ) | (93,043 | ) | (18,367 | ) | ||||||||
| Net income (loss) | $ | 6,858 | $ | (5,555 | ) | $ | (100,710 | ) | $ | (55,582 | ) | |||||
| Basic and diluted net income (loss) per common share: | ||||||||||||||||
| Continuing operations | $ | 0.15 | $ | (0.10 | ) | $ | (0.22 | ) | $ | (1.67 | ) | |||||
| Discontinued operations | (0.01 | ) | (0.13 | ) | (2.63 | ) | (0.82 | ) | ||||||||
| Basic and diluted net income (loss) per common share | $ | 0.14 | $ | (0.23 | ) | $ | (2.85 | ) | $ | (2.49 | ) | |||||
| Weighted average number of common shares outstanding – basic and diluted | 47,437,158 | 24,414,979 | 35,405,336 | 22,323,763 | ||||||||||||
THE ARENA GROUP HOLDINGS, INC., AND SUBSIDIARIES
CONSOLIDATED BALANCE SHEETS
| Years Ended December 31, | ||||||||
| 2024 | 2023 | |||||||
| ($ in thousands, excpet share data) | ||||||||
| Assets | ||||||||
| Current assets: | ||||||||
| Cash and cash equivalents | $ | 4,362 | $ | 9,284 | ||||
| Accounts receivables, net | 31,115 | 31,676 | ||||||
| Prepayments and other current assets | 4,757 | 5,791 | ||||||
| Current assets from discontinued operations | - | 43,648 | ||||||
| Total current assets | 40,234 | 90,399 | ||||||
| Property and equipment, net | 148 | 328 | ||||||
| Operating lease right-of-use assets | 2,340 | 176 | ||||||
| Platform development, net | 8,115 | 8,723 | ||||||
| Acquired and other intangible assets, net | 22,789 | 27,457 | ||||||
| Other long term assets | 151 | 1,003 | ||||||
| Goodwill | 42,575 | 42,575 | ||||||
| Noncurrent assets from discontinued operations | - | 18,217 | ||||||
| Total assets | $ | 116,352 | $ | 188,878 | ||||
| Liabilities, mezzanine equity and stockholders’ deficiency | ||||||||
| Current liabilities: | ||||||||
| Accounts payable | 4,844 | 7,803 | ||||||
| Accrued expenses and other | 10,990 | 28,903 | ||||||
| Line of credit | - | 19,609 | ||||||
| Unearned revenue | 6,349 | 16,938 | ||||||
| Subscription refund liability | 430 | 46 | ||||||
| Operating lease liability, current portion | 254 | 358 | ||||||
| Contingent consideration | - | 1,571 | ||||||
| Liquidating damages payable | 3,230 | 2,924 | ||||||
| Bridge notes | - | 7,887 | ||||||
| Debt | - | 102,309 | ||||||
| Current liabilities from discontinued operations | 96,159 | 47,673 | ||||||
| Total current liabilities | 122,256 | 236,021 | ||||||
| Unreaned revenue, net of current portion | 403 | 542 | ||||||
| Operating lease liability, net of current portion | 1,964 | - | ||||||
| Other long-term liabilities | - | 406 | ||||||
| Deferred tax liabilities | 802 | 599 | ||||||
| Simplify loan | 10,651 | - | ||||||
| Debt | 110,436 | - | ||||||
| Noncurrent liabilities from discontinued operations | - | 10,137 | ||||||
| Total liabilities | 246,512 | 247,705 | ||||||
| Mezzanine equity: | ||||||||
| Series G redeemable and convertible preferred stock, $0.01 par value, $1,000 per share liquidation value and 1,800 shares designated; aggregate liquidation value: $168; Series G shares issued and outstanding: 168; common shares issuable upon conversion: 8,582 at December 31, 2024 and December 31, 2023 | 168 | 168 | ||||||
| Total mezzanine equity | 168 | 168 | ||||||
| Stockholders’ deficiency: | ||||||||
| Common stock, $0.01 par value, authorized 1,000,000,000 shares; issued and outstanding: 47,556,267 and 23,836,706 shares at December 31, 2024 and December 31, 2023, respectively | 475 | 237 | ||||||
| Additional paid-in capital | 348,560 | 319,421 | ||||||
| Accumulated deficit | (479,363 | ) | (378,653 | ) | ||||
| Total stockholders’ deficiency | (130,328 | ) | (58,995 | ) | ||||
| Total liabilities, mezzanine equity and stockholders’ deficiency | $ | 116,352 | $ | 188,878 | ||||
Use of Non-GAAP Financial Measures
We report our financial results in accordance with generally accepted accounting principles in the United States of America (“GAAP”); however, management believes that certain non-GAAP financial measures provide users of our financial information with useful supplemental information that enables a better comparison of our performance across periods. We believe Adjusted EBITDA provides visibility to the underlying continuing operating performance by excluding the impact of certain items that are noncash in nature or not related to our core business operations. We calculate Adjusted EBITDA as net income (loss) as adjusted for loss from discontinued operations, with additional adjustments for (i) interest expense (net), (ii) income taxes, (iii) depreciation and amortization, (iv) stock-based compensation, (v) change in valuation of contingent consideration, (vi) liquidated damages, (vii) loss on impairment of assets, (viii) loss on sale of assets; (ix) employee retention credit, (x) employee restructuring payments, and (xi) professional and vendor fees. Our non-GAAP measure may not be comparable to similarly titled measures used by other companies, have limitations as an analytical tool, and should not be considered in isolation, or as a substitute for analysis of our operating results as reported under GAAP. Additionally, we do not consider our non-GAAP measure as superior to, or a substitute for, the equivalent measures calculated and presented in accordance with GAAP. Some of the limitations are that our presentation of Adjusted EBITDA:
| ● | does not reflect interest expense and financing fees, or the cash required to service our debt, which reduces cash available to us; | |
| ● | does not reflect income tax provision or benefit, which is a noncash income or expense; | |
| ● | does not reflect depreciation and amortization expense and, although this is a noncash expense, the assets being depreciated may have to be replaced in the future, increasing our cash requirements; | |
| ● | does not reflect stock-based compensation and, therefore, does not include all of our compensation costs; | |
| ● | does not reflect the change in valuation of contingent consideration and, although this is a noncash income or expense, the change in the valuations each reporting period are not impacted by our actual business operations but is instead strongly tied to the change in the market value of our common stock; | |
| ● | does not reflect liquidated damages and, therefore, does not include future cash requirements if we repay the liquidated damages in cash instead of shares of our common stock (which the investor would need to agree to); | |
| ● | does not reflect any losses from the impairment of assets, which is a noncash operating expense; | |
| ● | does not reflect any losses from the sale of assets, which is a noncash operating expense | |
| ● | does not reflect the employee retention credits recorded by us for payroll related tax credits under the CARES Act; | |
| ● | does not reflect payments related to employee severance and employee restructuring changes for our former executives; |
| ● | does not reflect the professional and vendor fees incurred by us for services provided by consultants, accountants, lawyers, and other vendors, which services were related to certain types of events that are not reflective of our business operations; and | |
| ● | may not reflect proper non direct cost allocations. |
The following table presents a reconciliation of Adjusted EBITDA to net income (loss), which is the most directly comparable GAAP measure, for the periods indicated:
| Q1 | Q2 | Q3 | Three
Months Ended December 31, | Years
Ended December 31, | ||||||||||||||||||||||||||||||||||||
| 2024 | 2023 | 2024 | 2023 | 2024 | 2023 | 2024 | 2023 | 2024 | 2023 | |||||||||||||||||||||||||||||||
| Net income (loss) | $ | (103,358 | ) | $ | (19,377 | ) | $ | (8,187 | ) | $ | (19,484 | ) | $ | 3,956 | $ | (11,166 | ) | $ | 6,879 | $ | (5,555 | ) | $ | (100,710 | ) | $ | (55,582 | ) | ||||||||||||
| Net loss from discontinued operations | 90,638 | 4,853 | 1,249 | 7,957 | 822 | 2,394 | 334 | 3,163 | 93,043 | 18,367 | ||||||||||||||||||||||||||||||
| Net income (loss) from continued operations | (12,720 | ) | (14,524 | ) | (6,938 | ) | (11,527 | ) | 4,778 | (8,772 | ) | 7,213 | (2,392 | ) | (7,667 | ) | (37,215 | ) | ||||||||||||||||||||||
| Add: | ||||||||||||||||||||||||||||||||||||||||
| Interest expense (net) | 4,339 | 4,182 | 4,249 | 5,001 | 3,159 | 4,042 | 2,921 | 4,740 | 14,668 | 17,965 | ||||||||||||||||||||||||||||||
| Income taxes | 41 | 7 | 35 | 86 | 40 | 52 | 133 | 52 | 249 | 197 | ||||||||||||||||||||||||||||||
| Depreciation ad amortization | 2,536 | 3,465 | 2,420 | 3,388 | 2,379 | 3,246 | 2,357 | 2,926 | 9,692 | 13,025 | ||||||||||||||||||||||||||||||
| Stock-based compensation | 913 | 6,237 | 499 | 5,118 | 732 | 3,762 | 281 | 1,175 | 2,425 | 16,292 | ||||||||||||||||||||||||||||||
| Change in valuation of contingent consideration | 313 | 499 | - | (90 | ) | - | 60 | - | 541 | 313 | 1,010 | |||||||||||||||||||||||||||||
| Liquidated damages | 76 | 127 | 76 | 177 | 77 | 151 | 77 | 128 | 306 | 583 | ||||||||||||||||||||||||||||||
| Loss on impairment of assets | 1,198 | 119 | - | - | - | - | - | - | 1,198 | 119 | ||||||||||||||||||||||||||||||
| Loss on sale of assets | - | - | - | - | - | - | - | 325 | - | 325 | ||||||||||||||||||||||||||||||
| Employee retention credit | - | (3,890 | ) | - | - | - | - | - | - | - | (3,890 | ) | ||||||||||||||||||||||||||||
| Employee restructuring payments | 2,456 | 1,675 | 3,328 | 973 | (8 | ) | 605 | - | 317 | 5,776 | 3,570 | |||||||||||||||||||||||||||||
| Professional and vendor fees | - | - | - | - | - | - | 1,194 | - | 1,194 | |||||||||||||||||||||||||||||||
| Adjusted EBITDA | $ | (848 | ) | $ | (2,103 | ) | $ | 3,669 | $ | 3,126 | $ | 11,157 | $ | 3,146 | $ | 12,982 | $ | 9,006 | $ | 26,960 | $ | 13,175 | ||||||||||||||||||
Forward-Looking Statements
This Press Release of The Arena Group Holdings, Inc. (the “Company,” “we,” “our,” and “us”) contains certain forward-looking statements within the meaning of Section 27A of the Securities Act of 1933, as amended (the “Securities Act”), and Section 21E of the Securities Exchange Act of 1934, as amended (the “Exchange Act”). Forward-looking statements relate to future events or future performance and include, without limitation, statements concerning our business strategy, future revenues and profitability, cost reductions, market growth, capital requirements, product introductions, expansion plans and the adequacy of our funding and our ability to alleviate the conditions that raise substantial doubt about our ability to continue as a going concern (as disclosed in our Annual Report on Form 10-K for the year ended December 31, 2024 filed with the SEC on April 15, 2025 (the “2024 10-K”)). Other statements contained in this Press Release that are not historical facts are also forward-looking statements. We have tried, wherever possible, to identify forward-looking statements by terminology such as “may,” “will,” “could,” “should,” “expects,” “anticipates,” “intends,” “plans,” “believes,” “seeks,” “estimates,” and other stylistic variants denoting forward-looking statements.
We caution investors that any forward-looking statements presented in this Press Release, or that we may make orally or in writing from time to time, are based on information currently available, as well as our beliefs and assumptions. The actual outcome related to forward-looking statements will be affected by known and unknown risks, trends, uncertainties, and factors that are beyond our control or ability to predict. Although we believe that our assumptions are reasonable, they are not guarantees of future performance, and some will inevitably prove to be incorrect. As a result, our actual future results can be expected to differ from our expectations, and those differences may be material. Accordingly, investors should use caution in relying on forward-looking statements, which are based only on known results and trends at the time they are made, to anticipate future results or trends. We detail other risks in our public filings with the Securities and Exchange Commission (the “SEC”), including in Part I, Item 1A, Risk Factors, in the 2024 10-K. The discussion in this Press Release should be read in conjunction with the consolidated financial statements and notes thereto included in Part II, Item 8 of the 2024 10-K.
This Press Release and all subsequent written and oral forward-looking statements attributable to us or any person acting on our behalf are expressly qualified in their entirety by the cautionary statements contained or referred to in this section. We do not undertake any obligation to release publicly any revisions to our forward-looking statements to reflect events or circumstances after the date of this Press Release except as may be required by law.
Contacts
The Arena Group Contact:
Steve Janisse, The Arena Group
404-574-9206
[email protected]
The Arena Group Investor Contact:
Rob Fink
FNK IR
646-809-4048
[email protected]
Exhibit 99.2
Paul Edmondson
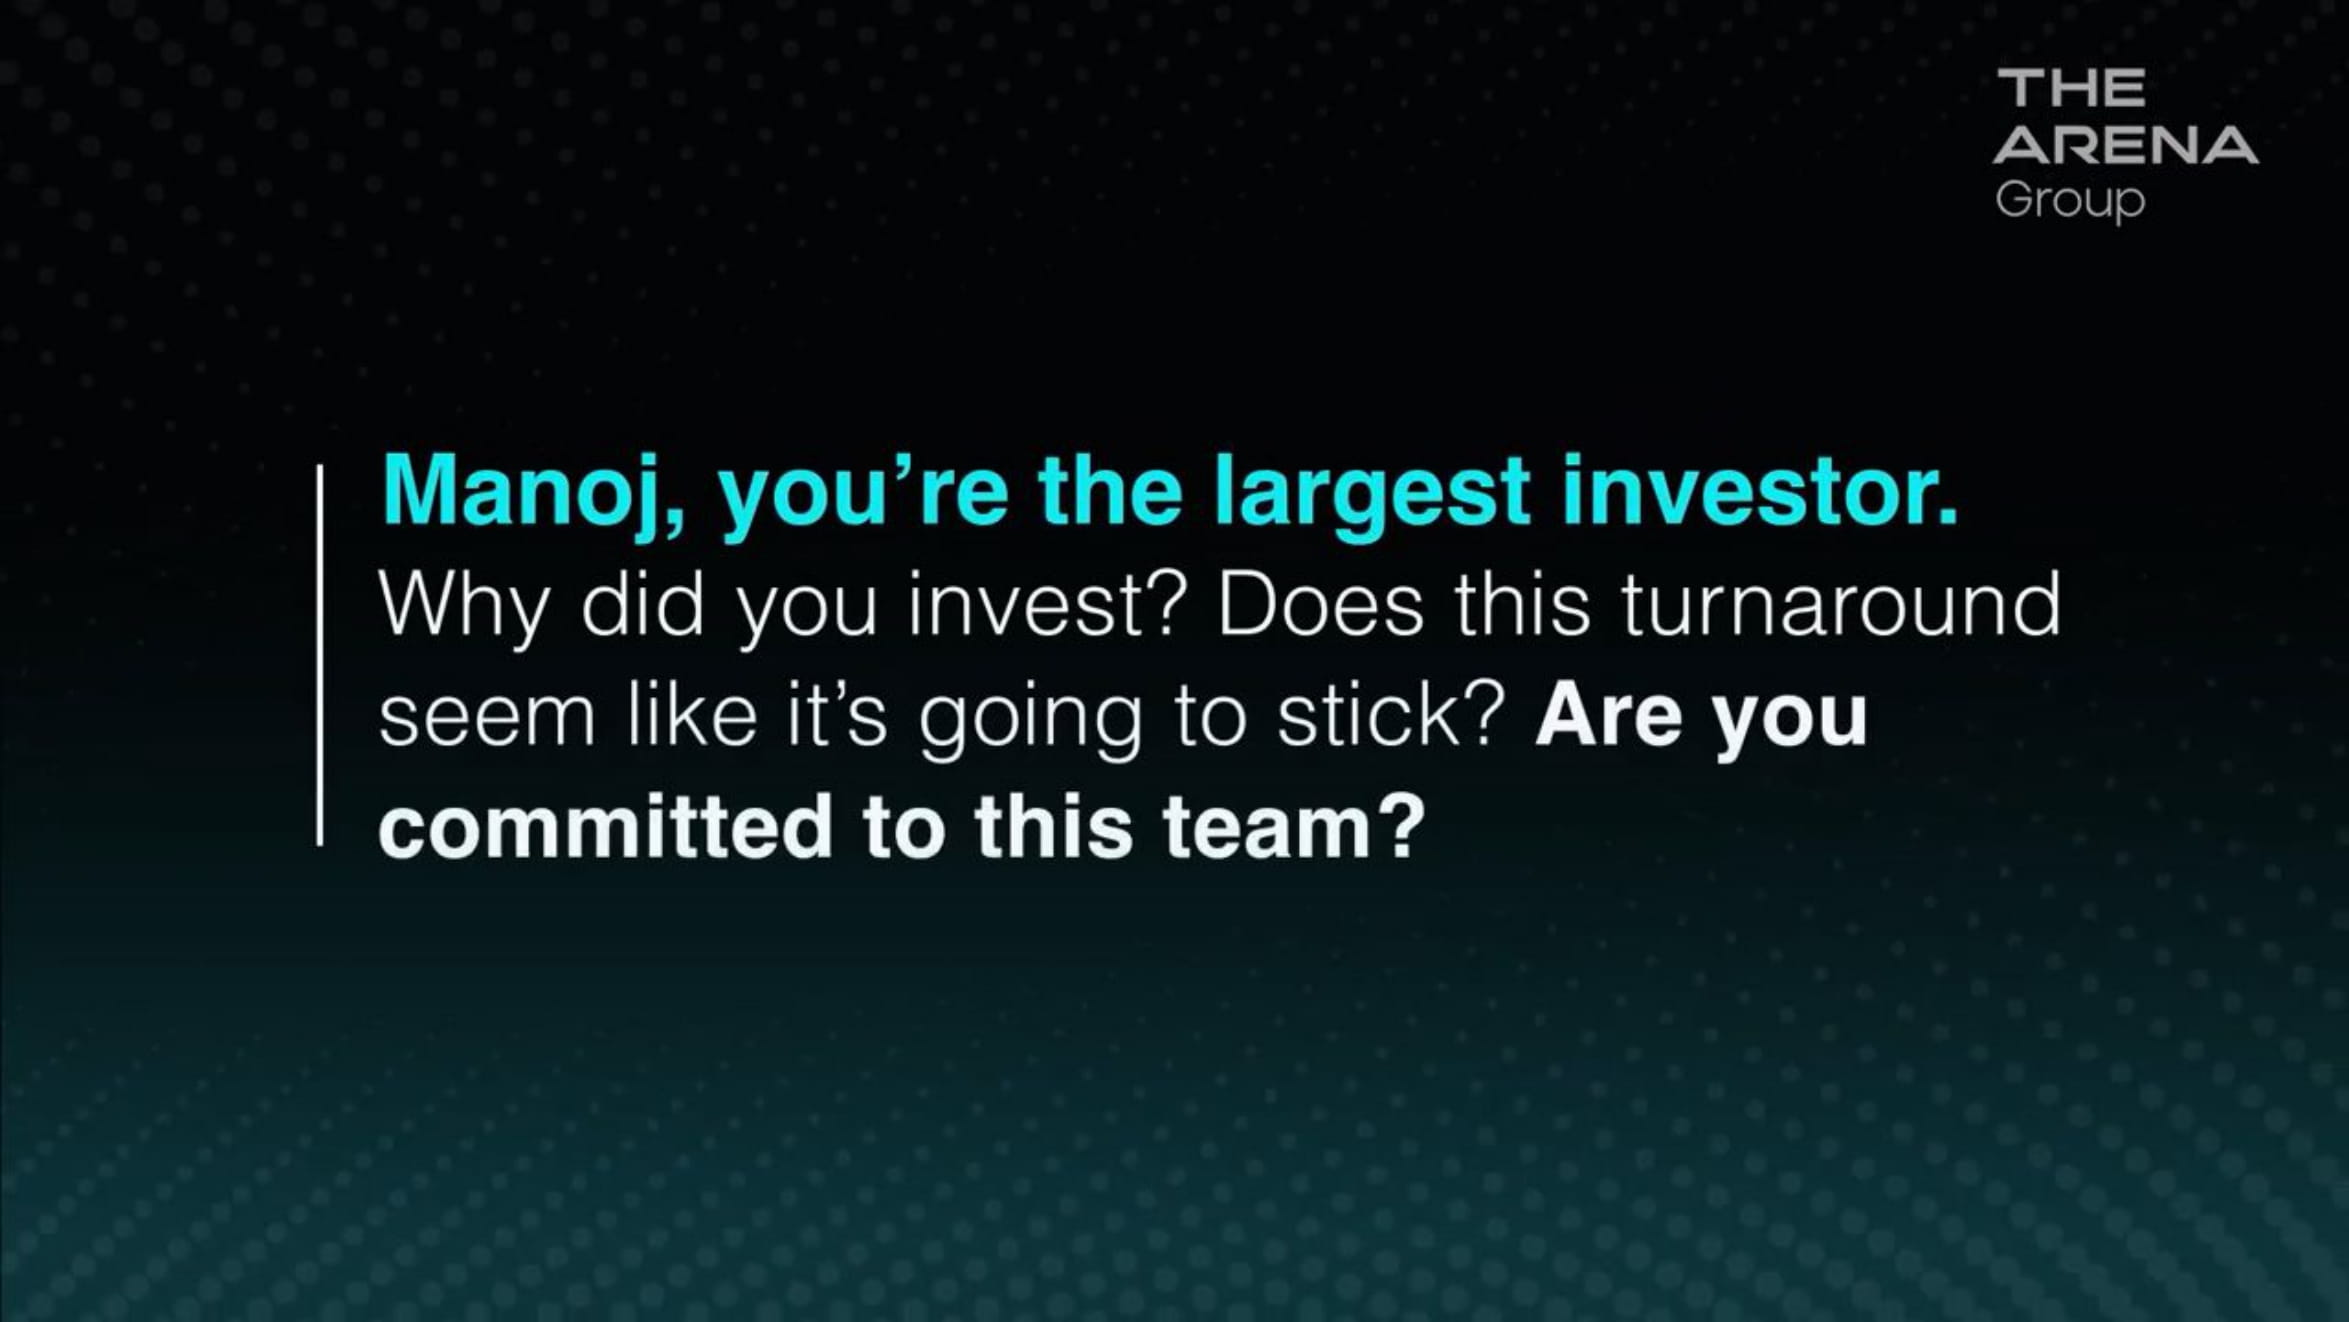
Hi, I’m Paul. I’m the CEO of The Arena Group today we have Manoj with us. Okay. Manoj. We went out and we’re trying to do things a little bit differently. We don’t want to just tell the world what a great company we are. We want to show that we’re doing things a bit differently. And so we went out and on X and on LinkedIn and we asked for some questions. And these were for people that are just curious about our business. Some of them are investors, and some of them people just want to know about what we do. So we know you have over 100 million bucks invested. Why did you invest? And does this turnaround seem like it’s going to stick? Are you committed to the team?
Manoj Bhargava
Well, I thought fundamentally it’s a great business run really poorly, because it was losing all kinds of money and we thought, you know, it’s kind of obvious what was wrong with it. And so we came in and within a year it was profitable. We’re also profitably growing, you know, so it’s not a lot of people make excuses where they say, well, we’re growing so we don’t have to make any money, right?No, no, no, I don’t believe in that. I’m not from the Bay Area. I don’t believe in that. For for me, it’s like I’m for to live in the Midwest. You don’t make money. You don’t make a profit. You’re not a business yet.
Paul Edmondson
Let me talk a little bit about the model we created. We started with Athlon Sports.We brought what we call competitive publishing and competitive publishing as two teams that work and compete head to head, covering news not just 9 to 5, but around the clock. And these are world class talent who are insightful, talented and driven. And they’re producing content that people love.
Manoj Bhargava
We get really great talent that is, cares about what the audience likes, and then we pay them based on if the audience likes it or not. If they don’t like it, they don’t get paid. So it turns into something that they serve the audience, which traditional publishing doesn’t. They serve themselves mostly of what my opinion is when nobody cares what journalists opinion is. And that that’s the crux of the business model. So they get paid based on the customer satisfaction rather than what their view on life is.
Paul Edmondson
And that’s changed everything. We’re bringing this to our other brands, and we’re seeing some early results that look super promising. But I think the most important thing to our business is we now expect to be profitable, from a, every quarter of 2025. What are your thoughts on acquisitions for The Arena Group?
Manoj Bhargava
Acquisitions, are totally opportunistic. I mean, what you’ve done is, is create a model which can take, any, almost any publishing, unit or any brand name publisher and turn it profitable. Right. So, yeah, at this point, since everybody’s losing money, we should we should, pile in and say, okay, give us your stuff so we can turn it profitable.
Paul Edmondson
Yeah. Yeah. I said we like to be opportunistic Like Maonj said, we like brands that have, a lot of untapped value in terms of what they are capable of both doing offline and digitally. And that’s what we really find as the best targets for what we do best. And we’re continuing to look for those, you know, at like what we think are really great prices, but fraud reports saying 40% of web traffic, maybe bots.How do you protect your advertisers? We just recently named one of the four publishers that don’t have any bot traffic, which we think is very important to the ad ecosystem.
Manoj Bhargava
One of the key things that I thought is that our platform is such, that all these bots are kicked out.
Paul Edmondson
Yeah. It’s a yeah, it it’s a combination of a technology ad placement and just making sure that you’re treating the advertisers with a ton of respect as well as the readers.
Manoj Bhargava
I think there’s a lot of advertisers that don’t realize that they’re buying stuff that is 40% bot. That gives us another place to go to, say, look, except for or five major guys. Everybody else is 40% bots. Why are you paying them that much? So it gives us another way to monetize better than everybody else.
Paul Edmondson
Can you speak about the ongoing lawsuits? It’s always an important question to ask about litigation. Our policy is not to make any comments about pending litigation, but we’ll let folks know as soon as, as soon as we have something to tell them. Thanks for tuning in today. Our hope isn’t to isn’t to talk and scream about what a wonderful company are and how great we are and what all our earnings is. It’s really for folks to understand what we’re doing, how we’re approaching the business and how we’re how we’re different than traditional media. Stay tuned. We’re going to be putting out regular updates for folks, and, you’ll see us active on social media and you’ll see us active here with Manoj frequently. So thanks for joining us, Manoj. And thanks for being an investor.
Manoj Bhargava
Thank you.
Exhibit 99.3
Exhibit 99.4
Today we’re doing a business case study on Arena Group, a publicly traded media company that just released its 2024 earnings. The company operates online magazines in different spaces from pop culture to finance but today we’re focusing just on their sports content brand Athlon.
Like most content websites a lot of Athlon’s money is made from advertising you see in print news. This comes in the form of direct ads sales teams working with brands to sell physical space between stories like in these red boxes. On the digital side the dominant model today is called programmatic advertising. These are those rotating ads you see in sidebars headers and banners on websites and instead of selling a fixed space new sites are paid based on the number of impressions those ads generate.
This chart shows Athlon’s monthly revenue from those programmatic ads over the last two years. For most of 2023 they made under $1 million per month from this channel but by the end of 2024 that had surged nearly tripling and hitting $3.2 million in December alone. But how did that happen? Well this next chart shows the number of new sports articles published on Athlon’s site each month. In 2023 they averaged around 1,600 then starting last spring that number jumped peaking at over 15,000 articles per month with more content and steady reader retention. Impressions also climbed shown with this blue line and topping 700 million in December which led to that higher programmatic ad revenue.
That volume of content generation is huge and to create at this scale. Athlon made a big shift in their editorial model. You see most traditional newsrooms rely on salaried writers with monthly quotas and Athlon was no different shown here with fixed editorial costs in red. In March of 2024 they removed those writers from direct payroll and introduced a revenue sharing model where writers were now paid based on the programmatic ad revenue they generated so the more good articles they could create the higher they would be paid.
Arena still hires and works closely with editorial leaders but the content creation incentives moved entirely to performance so as traffic and revenue increased so did their variable expenses shown here in blue. It was a major structural shift towards what Arena calls competitive publishing and so far it has worked on the balance sheet. This chart shows Arena Group’s income from continuing operations and you can see the company went from losing millions each quarter to turning a profit in Q3 and Q4.
This new publishing model shift was just a pilot for Athlon and now Arena Group is rolling out the same model to other brands under its umbrella starting with Men’s Journal, The Street for financial news, and then Parade for pop culture.
If you want to dive deeper into Arena Group’s latest quarterly earnings check out the link in our bio.
Exhibit 99.5
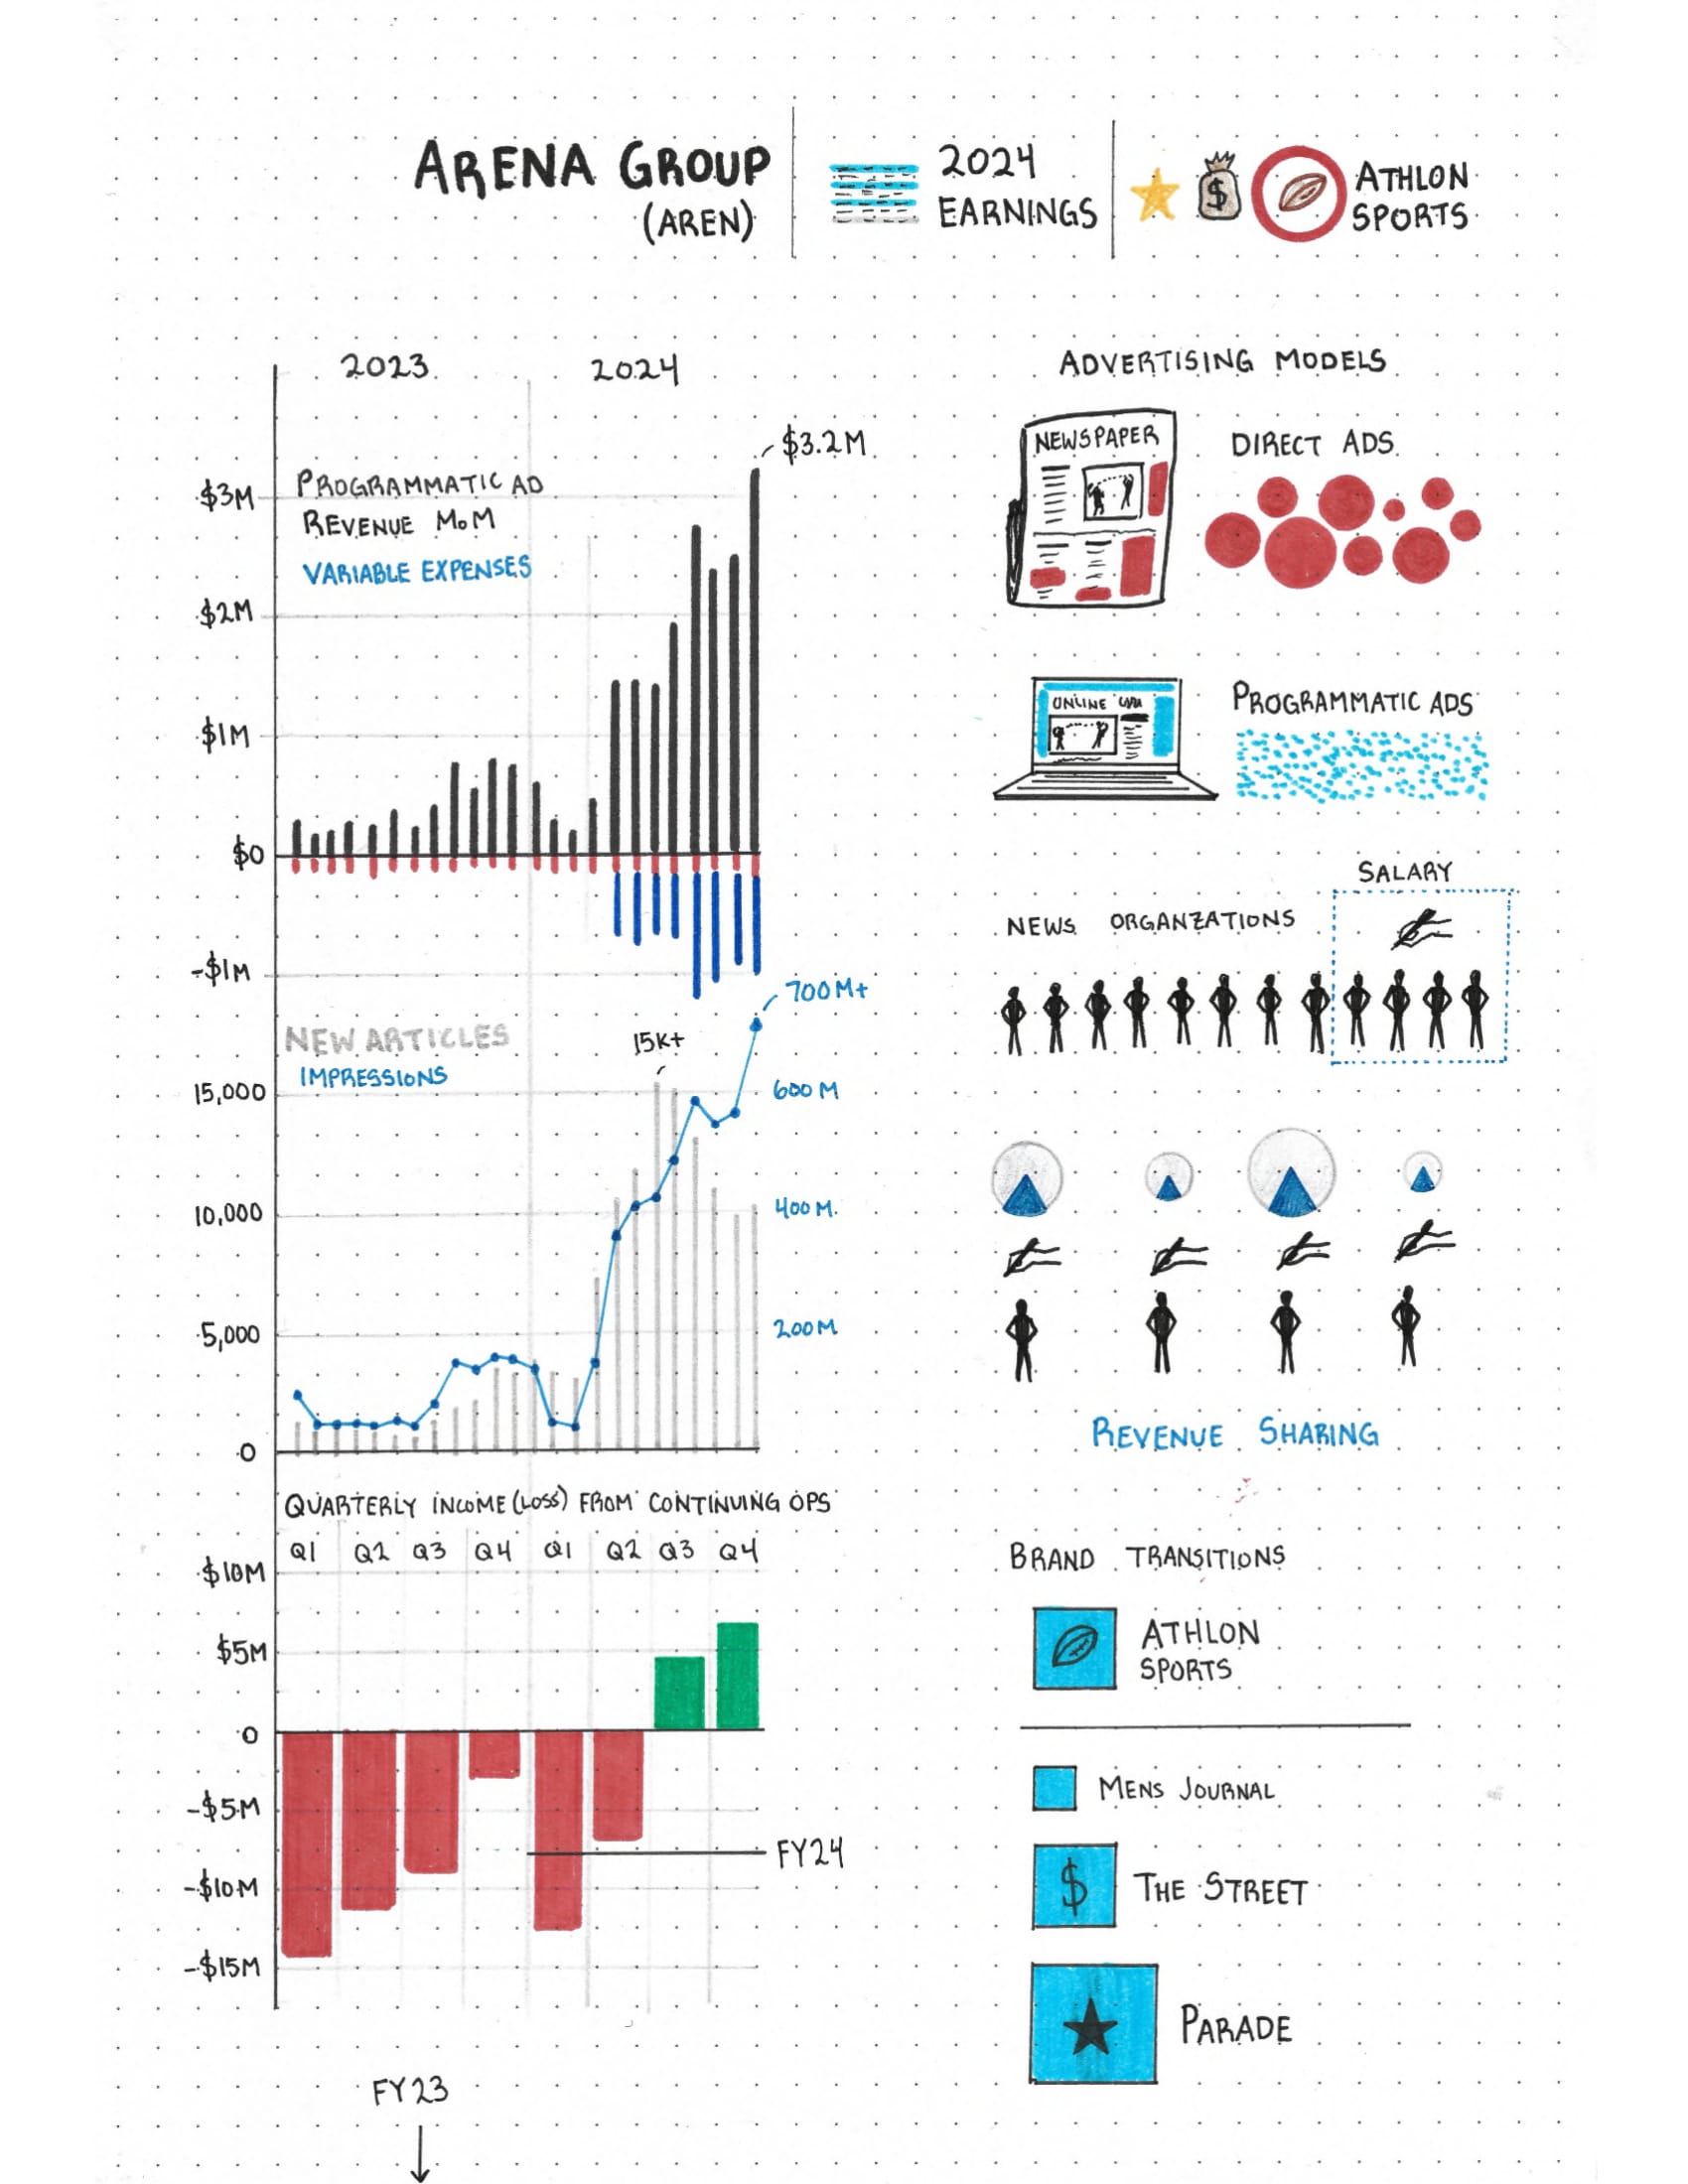
Exhibit 99.6