Document
false0000007536 0000007536 2020-02-06 2020-02-06


UNITED STATES
SECURITIES AND EXCHANGE COMMISSION
WASHINGTON, DC 20549


FORM 8-K


CURRENT REPORT
PURSUANT TO SECTION 13 OR 15(d) OF THE SECURITIES EXCHANGE ACT OF 1934

Date of Report (Date of earliest event reported): February 6, 2020

ARROW ELECTRONICS INC
(Exact Name of Registrant as Specified in charter)

 
New York
1-4482
11-1806155
(State or other jurisdiction
(Commission
(IRS Employer
of Incorporation)
File Number)
Identification No.)

9201 East Dry Creek Road,
Centennial,
CO
80112
(Address of principal executive offices)
(Zip Code)

Registrant's telephone number, including area code: (303) 824-4000

Not Applicable

(Former name or former address, if changed since last report)

Check the appropriate box below if the Form 8-K filing is intended to simultaneously satisfy the filing obligation of the registrant under any of the following provisions:

☐
Written communications pursuant to Rule 425 under the Securities Act (17 CFR 230.425)
 
 
☐
Soliciting material pursuant to Rule 14a-12 under the Exchange Act (17 CFR 240.14a-12)
 
 
☐
Pre-commencement communications pursuant to Rule 14d-2(b) under the Exchange Act (17 CFR 240.14d-2(b))
 
 
☐
Pre-commencement communications pursuant to Rule 13e-4(c) under the Exchange Act (17 CFR 240.13e-4(c))

Securities registered pursuant to Section 12(b) of the Act:
Title of each class
 
Trading Symbol(s)
 
Name of the exchange on which registered
Common Stock, $1 par value
 
ARW
 
New York Stock Exchange

Indicate by check whether the registrant is an emerging growth company as defined in Rule 405 of the Securities Act of 1933 (§230.405 of this chapter) or Rule 12b-2 of the Securities Exchange Act of 1934 (§240.12b-2 of this chapter).

Emerging growth company ☐
 
If an emerging growth company, indicate by check mark if the registrant has elected not to use the extended transition period for complying with any new or revised financial accounting standards provided pursuant to Section 13(a) of the Exchange Act.
☐


ITEM 2.02 RESULTS OF OPERATIONS AND FINANCIAL CONDITION

On February 6, 2020, the Registrant issued a press release announcing its fourth quarter and fiscal year 2019 earnings. A copy of the press release is attached hereto as an Exhibit (99.1).

On February 6, 2020, the Registrant also issued a press release containing a fourth quarter and fiscal year 2019 CFO commentary related to its fourth quarter and fiscal year 2019 earnings. A copy of that press release is attached hereto as an Exhibit (99.2).

The information in this Current Report on Form 8-K and the Exhibit attached hereto is being furnished and shall not be deemed "filed" for purposes of Section 18 of the Securities Exchange Act of 1934 (the "Exchange Act") or otherwise subject to the liabilities of that section, nor shall it be deemed incorporated by reference in any filing under the Securities Act of 1933 or the Exchange Act, regardless of any general incorporation language in such filing.

ITEM 9.01 FINANCIAL STATEMENTS AND EXHIBITS

(d)           EXHIBITS

99.1 Earnings press release dated February 6, 2020.

99.2 CFO commentary press release dated February 6, 2020.


SIGNATURES

Pursuant to the requirements of the Securities Exchange Act of 1934, the registrant has duly caused this report to be signed on its behalf by the undersigned hereunto duly authorized.


ARROW ELECTRONICS, INC.


Date: 
February 6, 2020
 
By:
/s/ Lily Hughes


Lily Hughes


Senior Vice President, Chief Legal Officer and Corporate Secretary

 
EXHIBIT INDEX

Exhibit
Description
 
 
99.1
 
 
99.2


ARROW ELECTRONICS, INC.
9201 E. DRY CREEK ROAD
CENTENNIAL, CO 80112
303-824-4000
 
NEWS

Exhibit 99.1
Arrow Electronics Reports Fourth-Quarter and Year-End 2019 Results
-- Full-Year Cash Provided by Operating Activities of $858 Million --
-- Returned Approximately $390 Million to Shareholders in 2019 --
CENTENNIAL, Colo.--(BUSINESS WIRE)-Feb. 6, 2020--Arrow Electronics, Inc. (NYSE:ARW) today reported fourth-quarter 2019 sales of $7.34 billion, a decrease of 7 percent from sales of $7.92 billion in the fourth quarter of 2018. Fourth-quarter sales as adjusted decreased 5%. The company reported fourth-quarter net income of $112 million, or $1.36 per share on a diluted basis, compared with net income of $231 million, or $2.63 per share on a diluted basis, in the fourth quarter of 2018. Excluding certain items1, net income would have been $181 million, or $2.20 per share on a diluted basis, in the fourth quarter of 2019, compared with net income of $227 million, or $2.59 per share on a diluted basis, in the fourth quarter of 2018. In the fourth quarter of 2019, changes in foreign currencies had negative impacts on growth of approximately $65 million or 1 percent on sales and $.04 or 1 percent on earnings per share on a diluted basis compared to the fourth quarter of 2018.
“Arrow’s commitment to delivering unmatched engineering and design services to customers on behalf of our suppliers is serving the company well during the ongoing industry correction,” said Michael J. Long, chairman, president, and chief executive officer. “Global components’ sales and margin performance continue to demonstrate greater resiliency compared to past economic and semiconductor industry corrections. As we prepare for economic recovery, we continue to increase the scale of our Asia components business, which we expect to lead to greater profit. Arrow is well positioned to accelerate profit growth and expansion as soon as demand from end-customers stabilizes and improves.”
Global components fourth-quarter sales of $4.74 billion decreased 10 percent year over year. Sales, as adjusted, decreased 8 percent year over year. Asia-Pacific components sales increased 4 percent year over year. Europe components sales decreased 16 percent year over year. Sales in the region, as adjusted, decreased 12 percent year over year. Americas components sales decreased 19 percent year over year. Sales in the region, as adjusted, decreased 16 percent year over year. Global components fourth-quarter operating income was $150 million. Fourth-quarter operating income, excluding amortization of intangibles expense, as adjusted, was $172 million.
“During the fourth quarter, and throughout 2019, Arrow’s enterprise computing solutions focused on accelerating the evolution toward selling advanced, next-generation software and hardware architectures,” added Mr. Long. “We believe our line card and capabilities are well positioned to assure mutual success for suppliers, VARs and MSPs, and their customers as we begin the new decade.”
Global enterprise computing solutions fourth-quarter sales of $2.60 billion decreased 2 percent year over year. Global enterprise computing solutions sales, as adjusted, decreased 1 percent year over year. Europe sales increased 1 percent year over year. Sales in the region, as adjusted, increased 4 percent year over year. Americas sales decreased 4 percent year over year. Sales in the region, as adjusted, decreased 3 percent year over year. Global enterprise computing solutions fourth-quarter operating income was $149 million. Fourth-quarter operating income, excluding amortization of intangibles expense, as adjusted, was $156 million. Fourth-quarter operating income as a percentage of sales increased 20 basis points year over year.

FULL-YEAR RESULTS
Full-year 2019 sales of $28.92 billion decreased 3 percent from sales of $29.68 billion in 2018. Net loss for 2019 was $204 million, or $(2.44) per share, compared with net income of $716 million, or $8.10 per share on a diluted basis, in 2018. Excluding certain items1, net income would have been $636 million, or $7.55 per share on a diluted basis, in 2019 compared with net income of $778 million, or $8.79 per share on a diluted basis, in 2018. In 2019, changes in foreign currencies had negative impacts on growth of approximately $513 million, or 2 percent on sales, and $.23, or 2 percent, on earnings per share on a diluted basis compared to 2018.
“With our flexibility, Arrow was able to adapt to changing market conditions in 2019,” said Chris Stansbury, senior vice president and chief financial officer. “Fourth-quarter and full-year 2019 cash flow provided by operating activities were $495 million and $858 million, respectively. Disciplined working capital management, continued profitability from our leading positions in the markets we serve, and efficiencies from our largely complete cost optimization activities, were all key drivers in generating our strong cash flow. We remain committed to returning excess cash to shareholders, and returned approximately $100 million to shareholders through our stock repurchase program during the fourth quarter, and approximately $390 million in 2019. At the end of the year, we had approximately $339 million of remaining authorization under our share repurchase program.”


1 A reconciliation of non-GAAP adjusted financial measures, including sales, as adjusted, gross profit, operating income, as adjusted, net income attributable to shareholders, as adjusted, and net income per share, as adjusted, to GAAP financial measures is presented in the reconciliation tables included herein.


1


FIRST-QUARTER 2020 OUTLOOK
•
Consolidated sales of $6.225 billion to $6.625 billion, with global components sales of $4.55 billion to $4.75 billion, and global enterprise computing solutions sales of $1.675 billion to $1.875 billion
•
Earnings per share on a diluted basis of $.99 to $1.29, and earnings per share on a diluted basis, excluding certain items1 of $1.29 to $1.39 per share, assuming an average tax rate of approximately 24.5 percent compared to the long-term range of 23 to 25 percent, and average diluted shares outstanding of 82 million
•
Interest expense of approximately $52 million
•
Expecting average USD-to-Euro exchange rate of $1.12 to €1; changes in foreign currencies to negatively impact sales growth by approximately $30 million, and earnings per share on a diluted basis by $.01 compared to the first quarter of 2019
“As we look to the first quarter, we are seeing some delays and extended lead times of products manufactured in China due to business and transportation shutdowns, as well the extension of the New Year Holiday week mandated by the Chinese government. The situation in that region remains uncertain, and we are monitoring conditions closely. Currently, we are not able to quantify the potential impacts to our first-quarter outlook, said Mr. Stansbury.”
“Separately, our first quarter of 2020 will close on the March 28, 2020, two days earlier than the first quarter of 2019, and three days before the end of the calendar month. We expect this will negatively impact sales by approximately $225 million, and earnings per share on a diluted basis by approximately $.11 compared to the first quarter of 2019. The earlier closing date will only impact global enterprise computing solutions. Additionally, while the second and third quarters of 2020 will close two days earlier than the second and third quarters of 2019, we expect impacts to year-over-year comparisons should be negligible. We anticipate the fourth quarter of 2020 will benefit by the corresponding amounts lost from the first quarter.”

Please refer to the CFO commentary, which can be found at investor.arrow.com, as a supplement to the company’s earnings release.
Arrow Electronics guides innovation forward for over 175,000 leading technology manufacturers and service providers. With 2019 sales of $29 billion, Arrow develops technology solutions that improve business and daily life. Learn more at fiveyearsout.com.
Information Relating to Forward-Looking Statements
This press release includes forward-looking statements that are subject to numerous assumptions, risks, and uncertainties, which could cause actual results or facts to differ materially from such statements for a variety of reasons, including, but not limited to: industry conditions, changes in product supply, pricing and customer demand, competition, other vagaries in the global components and global enterprise computing solutions markets, changes in relationships with key suppliers, increased profit margin pressure, changes in legal and regulatory matters, non-compliance with certain regulations, such as export, anti-trust, and anti-corruption laws, the company's ability to generate cash flow, , and disruptions in the company’s business due to epidemics (such as the coronavirus). Forward-looking statements are those statements which are not statements of historical fact.  These forward-looking statements can be identified by forward-looking words such as “expects,” “anticipates,” “intends,” “plans,” “may,” “will,” “believes,” “seeks,” “estimates,” and similar expressions. Shareholders and other readers are cautioned not to place undue reliance on these forward-looking statements, which speak only as of the date on which they are made. The company undertakes no obligation to update publicly or revise any of the forward-looking statements.
For a further discussion of factors to consider in connection with these forward-looking statements, investors should refer to Item 1A Risk Factors of the company’s Annual Report on Form 10-K for the year ended Dec. 31, 2019.
Certain Non-GAAP Financial Information
In addition to disclosing financial results that are determined in accordance with accounting principles generally accepted in the United States (“GAAP”), the company also provides certain non-GAAP financial information relating to sales, operating income, net income attributable to shareholders, and net income per basic and diluted share.
The company provides sales, gross profit, and operating expenses as adjusted for the impact of changes in foreign currencies (referred to as changes in foreign currencies) by re-translating prior-period results at current period foreign exchange rates, the impact of dispositions by adjusting the company's operating results for businesses disposed, as if the dispositions had occurred at the beginning of the earliest period presented (referred to as dispositions), the impact of the company's personal computer and mobility asset disposition business (referred to as wind down), the impact of inventory write-downs related to the digital business (referred to as “digital inventory write-downs and recoveries”), and the impact of the notes receivable reserves and inventory write-downs related to the AFS business (referred to as “AFS notes receivable reserves and credits” and “AFS inventory write-downs and recoveries,” respectively). Operating income is adjusted to exclude identifiable intangible asset amortization, restructuring, integration, and other charges, loss on disposition of businesses, net, AFS notes receivable reserves and credits and inventory write-downs and recoveries, digital inventory write-downs and recoveries, the impact of non-cash charges related to goodwill, trade names, and long-lived assets, and the impact of wind down. Net income attributable to shareholders as adjusted to exclude identifiable intangible asset amortization, restructuring, integration, and other charges, and loss on disposition of businesses, net, AFS notes receivable reserves and credits and inventory write-downs and recoveries, digital inventory write-downs and recoveries, the impact of non-cash charges related to goodwill, trade names, and long-lived assets, the impact of wind down, pension settlements, net gains and losses on investments, and certain tax adjustments including related interest expense. A reconciliation of the company’s non-GAAP financial information to GAAP is set forth in the tables below.


2


The company believes that such non-GAAP financial information is useful to investors to assist in assessing and understanding the company’s operating performance and underlying trends in the company’s business because management considers these items referred to above to be outside the company’s core operating results. This non-GAAP financial information is among the primary indicators management uses as a basis for evaluating the company’s financial and operating performance. In addition, the company’s Board of Directors may use this non-GAAP financial information in evaluating management performance and setting management compensation.
The presentation of this additional non-GAAP financial information is not meant to be considered in isolation or as a substitute for, or alternative to, sales, operating income, net income and net income per basic and diluted share determined in accordance with GAAP. Analysis of results and outlook on a non-GAAP basis should be used as a complement to, and in conjunction with, data presented in accordance with GAAP.


3


ARROW ELECTRONICS, INC.
CONSOLIDATED STATEMENTS OF OPERATIONS
(In thousands except per share data)


Quarter Ended
 
Year Ended
 
December 31, 2019
 
December 31, 2018
 
December 31, 2019
 
December 31, 2018
 
(Unaudited)
 
(Unaudited)


Sales
$
7,338,190

 
$
7,918,182

 
$
28,916,847

 
$
29,676,768

Cost of sales
6,515,247

 
6,942,812

 
25,618,466

 
25,975,856

Gross profit
822,943

 
975,370

 
3,298,381

 
3,700,912

Operating expenses:


Selling, general, and administrative expenses
513,878

 
583,943

 
2,191,612

 
2,303,051

Depreciation and amortization
50,051

 
47,183

 
189,790

 
186,384

Loss on disposition of businesses, net
5,813

 
—

 
21,252

 
3,604

Impairments
—

 
—

 
698,246

 
—

Restructuring, integration, and other charges
15,093

 
9,864

 
89,785

 
60,361

 
584,835

 
640,990

 
3,190,685

 
2,553,400

Operating income
238,108

 
334,380

 
107,696

 
1,147,512

Equity in earnings (losses) of affiliated companies
(610
)
 
(1,524
)
 
(2,765
)
 
(2,332
)
Gain (loss) on investments, net
3,967

 
(10,221
)
 
11,831

 
(14,166
)
Employee benefit plan expense
(21,500
)
 
(3,086
)
 
(24,849
)
 
(6,870
)
Interest and other financing expense, net
(50,317
)
 
(54,584
)
 
(203,743
)
 
(214,771
)
Income (loss) before income taxes
169,648

 
264,965

 
(111,830
)
 
909,373

Provision for income taxes
57,460

 
32,474

 
88,338

 
187,799

Consolidated net income (loss)
112,188

 
232,491

 
(200,168
)
 
721,574

Noncontrolling interests
175

 
1,838

 
3,919

 
5,379

Net income (loss) attributable to shareholders
$
112,013

 
$
230,653

 
$
(204,087
)
 
$
716,195


Net income (loss) per share:


Basic
$
1.37

 
$
2.66

 
$
(2.44
)
 
$
8.19

Diluted
$
1.36

 
$
2.63

 
$
(2.44
)
 
$
8.10


Weighted average shares outstanding:


Basic
81,613

 
86,559

 
83,568

 
87,476

Diluted
82,493

 
87,561

 
83,568

 
88,444


4


ARROW ELECTRONICS, INC.
CONSOLIDATED BALANCE SHEETS
(In thousands except par value)


December 31, 2019
 
December 31, 2018


ASSETS


Current assets:


Cash and cash equivalents
$
300,103

 
$
509,327

Accounts receivable, net
8,482,687

 
8,945,463

Inventories
3,477,120

 
3,878,678

Other current assets
266,249

 
274,832

Total current assets
12,526,159

 
13,608,300

Property, plant, and equipment, at cost:


Land
7,793

 
7,882

Buildings and improvements
173,370

 
158,712

Machinery and equipment
1,481,525

 
1,425,933

 
1,662,688

 
1,592,527

Less: Accumulated depreciation and amortization
(859,578
)
 
(767,827
)
Property, plant, and equipment, net
803,110

 
824,700

Investments in affiliated companies
86,942

 
83,693

Intangible assets, net
271,903

 
372,644

Goodwill
2,061,322

 
2,624,690

Other assets
651,360

 
270,418

Total assets
$
16,400,796

 
$
17,784,445

LIABILITIES AND EQUITY


Current liabilities:


Accounts payable
$
7,046,221

 
$
7,631,879

Accrued expenses
880,507

 
912,292

Short-term borrowings, including current portion of long-term debt
331,431

 
246,257

Total current liabilities
8,258,159

 
8,790,428

Long-term debt
2,640,129

 
3,239,115

Other liabilities
636,115

 
378,536

Equity:


Shareholders' equity:


Common stock, par value $1:


Authorized – 160,000 shares in both 2019 and 2018


Issued – 125,424 shares in both 2019 and 2018
125,424

 
125,424

Capital in excess of par value
1,150,006

 
1,135,934

Treasury stock (44,804 and 40,233 shares in 2019 and 2018, respectively), at cost
(2,332,548
)
 
(1,972,254
)
Retained earnings
6,131,248

 
6,335,335

Accumulated other comprehensive loss
(262,211
)
 
(299,449
)
Total shareholders' equity
4,811,919

 
5,324,990

Noncontrolling interests
54,474

 
51,376

Total equity
4,866,393

 
5,376,366

Total liabilities and equity
$
16,400,796

 
$
17,784,445


5


ARROW ELECTRONICS, INC.
CONSOLIDATED STATEMENTS OF CASH FLOWS
(In thousands)
(Unaudited)


Quarter Ended
 
December 31, 2019
 
December 31, 2018
Cash flows from operating activities:


Consolidated net income
$
112,188

 
$
232,491

Adjustments to reconcile consolidated net income to net cash provided by operations:


Depreciation and amortization
50,051

 
47,183

Amortization of stock-based compensation
6,321

 
8,134

Equity in (earnings) losses of affiliated companies
610

 
1,524

Deferred income taxes
15,196

 
(16,533
)
(Gain) loss on investment, net
(3,840
)
 
10,221

Loss on disposition of businesses, net
5,813

 
—

Pension settlement expense
20,111

 
—

Other
(155
)
 
3,142

Change in assets and liabilities, net of effects of acquired and disposed businesses:


Accounts receivable
(578,059
)
 
(752,891
)
Inventories
40,448

 
(162,825
)
Accounts payable
827,614

 
764,726

Accrued expenses
43,649

 
96,946

Other assets and liabilities
(45,145
)
 
31,016

Net cash provided by operating activities
494,802

 
263,134


Cash flows from investing activities:


Proceeds from (cash paid on) disposition of businesses
(11,769
)
 
—

Acquisition of property, plant, and equipment
(30,111
)
 
(30,439
)
Proceeds from sale of property, plant, and equipment
—

 
5,421

Cash paid for customer relationship intangible asset
(7,616
)
 
(20,000
)
Other
(4,127
)
 
(2,500
)
Net cash used for investing activities
(53,623
)
 
(47,518
)


Cash flows from financing activities:


Change in short-term and other borrowings
(20,794
)
 
88,034

Proceeds from (repayment of) long-term bank borrowings, net
(308,047
)
 
(114,120
)
Proceeds from exercise of stock options
5,201

 
900

Repurchases of common stock
(100,009
)
 
(150,132
)
Net cash used for financing activities
(423,649
)
 
(175,318
)
Effect of exchange rate changes on cash
20,319

 
(5,162
)
Net increase in cash and cash equivalents
37,849

 
35,136

Cash and cash equivalents at beginning of period
262,254

 
474,191

Cash and cash equivalents at end of period
$
300,103

 
$
509,327


6


ARROW ELECTRONICS, INC.
CONSOLIDATED STATEMENTS OF CASH FLOWS
(In thousands)
 
 
Year Ended
 
December 31, 2019
 
December 31, 2018
Cash flows from operating activities:


Consolidated net income (loss)
$
(200,168
)
 
$
721,574

Adjustments to reconcile consolidated net income to net cash provided by operations:


Depreciation and amortization
189,790

 
186,384

Amortization of stock-based compensation
41,070

 
46,238

Equity in (earnings) losses of affiliated companies
2,765

 
2,332

Deferred income taxes
(50,288
)
 
1,236

(Gain) loss on investment, net
(11,462
)
 
14,166

Loss on disposition of businesses, net
21,252

 
3,604

Pension settlement expense
20,111

 
1,665

Impairments
698,246

 
—

Other
10,659

 
9,198

Change in assets and liabilities, net of effects of acquired and disposed businesses:


Accounts receivable
338,849

 
(1,007,308
)
Inventories
383,058

 
(618,875
)
Accounts payable
(521,575
)
 
936,423

Accrued expenses
(27,475
)
 
112,123

Other assets and liabilities
(36,837
)
 
(136,070
)
Net cash provided by operating activities
857,995

 
272,690


Cash flows from investing activities:


Cash consideration paid for acquired businesses, net of cash acquired
—

 
(331,563
)
Proceeds from (cash paid on) disposition of businesses
(13,094
)
 
32,013

Acquisition of property, plant, and equipment
(143,191
)
 
(135,336
)
Proceeds from sale of property, plant and equipment
—

 
5,421

Cash paid for customer relationship intangible asset
(7,616
)
 
(20,000
)
Other
(9,682
)
 
(13,500
)
Net cash used for investing activities
(173,583
)
 
(462,965
)


Cash flows from financing activities:


Change in short-term and other borrowings
(113,923
)
 
192,192

Proceeds from (repayments of) long-term bank borrowings, net
(405,007
)
 
306,635

Redemption of notes
—

 
(300,000
)
Proceeds from exercise of stock options
16,911

 
8,819

Repurchases of common stock
(404,203
)
 
(243,305
)
Other
(147
)
 
(1,174
)
Net cash provided by (used for) financing activities
(906,369
)
 
(36,833
)
Effect of exchange rate changes on cash
12,733

 
6,352

Net decrease in cash and cash equivalents
(209,224
)
 
(220,756
)
Cash and cash equivalents at beginning of period
509,327

 
730,083

Cash and cash equivalents at end of period
$
300,103

 
$
509,327


7


ARROW ELECTRONICS, INC.
NON-GAAP SALES RECONCILIATION
(In thousands)
(Unaudited)
 
Quarter Ended


December 31, 2019
 
December 31, 2018
 
% Change


Consolidated sales, as reported
$
7,338,190

 
$
7,918,182

 
(7.3
)%
Impact of changes in foreign currencies
—

 
(65,384
)
 
 
Impact of dispositions and wind down
(19,375
)
 
(118,184
)
 
 
Consolidated sales, as adjusted
$
7,318,815

 
$
7,734,614

 
(5.4
)%


Global components sales, as reported
$
4,738,993

 
$
5,261,477

 
(9.9
)%
Impact of changes in foreign currencies
—

 
(40,608
)
 
 
Impact of dispositions and wind down
(19,375
)
 
(102,965
)
 
 
Global components sales, as adjusted
$
4,719,618

 
$
5,117,904

 
(7.8
)%


Americas components sales, as reported
$
1,644,757

 
$
2,021,033

 
(18.6
)%
Impact of changes in foreign currencies
—

 
(214
)
 
 
Impact of dispositions and wind down
(19,239
)
 
(78,246
)
 
 
Americas components sales, as adjusted
$
1,625,518

 
$
1,942,573

 
(16.3
)%


Europe components sales, as reported
$
1,189,016

 
$
1,407,429

 
(15.5
)%
Impact of changes in foreign currencies
—

 
(36,312
)
 
 
Impact of dispositions and wind down
(136
)
 
(24,719
)
 
 
Europe components sales, as adjusted
$
1,188,880

 
$
1,346,398

 
(11.7
)%


Asia components sales, as reported
$
1,905,220

 
$
1,833,015

 
3.9
 %
Impact of changes in foreign currencies
—

 
(4,082
)
 
 
Asia components sales, as adjusted
$
1,905,220

 
$
1,828,933

 
4.2
 %


Global ECS sales, as reported
$
2,599,197

 
$
2,656,705

 
(2.2
)%
Impact of changes in foreign currencies
—

 
(24,776
)
 
 
Impact of dispositions
—

 
(15,219
)
 
 
Global ECS sales, as adjusted
$
2,599,197

 
$
2,616,710

 
(0.7
)%


Europe ECS sales, as reported
$
959,449

 
$
954,343

 
0.5
 %
Impact of changes in foreign currencies
—

 
(20,834
)
 
 
Impact of dispositions
—

 
(15,219
)
 
 
Europe ECS sales, as adjusted
$
959,449

 
$
918,290

 
4.5
 %


Americas ECS sales, as reported
$
1,639,748

 
$
1,702,362

 
(3.7
)%
Impact of changes in foreign currencies
—

 
(3,942
)
 
 
Americas ECS sales, as adjusted
$
1,639,748

 
$
1,698,420

 
(3.5
)%


8


ARROW ELECTRONICS, INC.
NON-GAAP SALES RECONCILIATION
(In thousands)
(Unaudited)


Year Ended


December 31, 2019
 
December 31, 2018
 
% Change


Consolidated sales, as reported
$
28,916,847

 
$
29,676,768

 
(2.6
)%
Impact of changes in foreign currencies
—

 
(513,217
)
 
 
Impact of dispositions and wind down
(251,614
)
 
(496,108
)
 
 
Consolidated sales, as adjusted
$
28,665,233

 
$
28,667,443

 
flat


Global components sales, as reported
$
20,250,735

 
$
20,856,851

 
(2.9
)%
Impact of changes in foreign currencies
—

 
(337,828
)
 
 
Impact of dispositions and wind down
(240,473
)
 
(415,707
)
 
 
Global components sales, as adjusted
$
20,010,262

 
$
20,103,316

 
(0.5
)%


Americas components sales, as reported
$
7,167,295

 
$
7,816,533

 
(8.3
)%
Impact of changes in foreign currencies
—

 
(4,496
)
 
 
Impact of dispositions and wind down
(189,963
)
 
(310,198
)
 
 
Americas components sales, as adjusted
$
6,977,332

 
$
7,501,839

 
(7.0
)%


Europe components sales, as reported
$
5,412,379

 
$
5,733,222

 
(5.6
)%
Impact of changes in foreign currencies
—

 
(292,551
)
 
 
Impact of dispositions and wind down
(50,510
)
 
(105,509
)
 
 
Europe components sales, as adjusted
$
5,361,869

 
$
5,335,162

 
0.5
 %


Asia components sales, as reported
$
7,671,061

 
$
7,307,096

 
5.0
 %
Impact of changes in foreign currencies
—

 
(40,781
)
 
 
Asia components sales, as adjusted
$
7,671,061

 
$
7,266,315

 
5.6
 %


Global ECS sales, as reported
$
8,666,112

 
$
8,819,917

 
(1.7
)%
Impact of changes in foreign currencies
—

 
(175,389
)
 
 
Impact of dispositions
(11,141
)
 
(80,401
)
 
 
Global ECS sales, as adjusted
$
8,654,971

 
$
8,564,127

 
1.1
 %


Europe ECS sales, as reported
$
3,034,087

 
$
3,077,391

 
(1.4
)%
Impact of changes in foreign currencies
—

 
(145,468
)
 
 
Impact of dispositions
(11,141
)
 
(52,908
)
 
 
Europe ECS sales, as adjusted
$
3,022,946

 
$
2,879,015

 
5.0
 %


Americas ECS sales, as reported
$
5,632,025

 
$
5,742,526

 
(1.9
)%
Impact of changes in foreign currencies
—

 
(29,921
)
 
 
Impact of dispositions
—

 
(27,493
)
 
 
Americas ECS sales, as adjusted
$
5,632,025

 
$
5,685,112

 
(0.9
)%


9


ARROW ELECTRONICS, INC.
NON-GAAP EARNINGS RECONCILIATION
(In thousands except per share data)
(Unaudited)
 
Three months ended December 31, 2019

Reported
GAAP
measure
Intangible
amortization
expense
Restructuring
& Integration
charges
AFS Write Downs
Digital Write Downs
Impact of Wind Down(6)
Tax adjustments(7)
Other(1)
Non-GAAP
measure
Sales
$
7,338,190

$
—

$
—

$
—

$
—

$
(19,375
)
$
—

$
—

$
7,318,815

Gross Profit
822,943

—

—

—

1,117

5,388

—

—

829,448

Operating income
238,108

14,311

16,350

2,850

1,117

10,912

—

1,002

284,650

Income before income taxes
169,648

14,311

16,350

2,850

1,117

10,942

—

17,919

233,137

Provision for income taxes
57,460

4,050

3,042

607

156

(18,380
)
1,806

2,700

51,441

Consolidated net income
112,188

10,261

13,308

2,243

961

29,322

(1,806
)
15,219

181,696

Noncontrolling interests
175

138

—

—

—

—

—

—

313

Net income attributable to shareholders
$
112,013

$
10,123

$
13,308

$
2,243

$
961

$
29,322

$
(1,806
)
$
15,219

$
181,383

Net income per diluted share(5)
$
1.36

$
0.12

$
0.16

$
0.03

$
0.01

$
0.36

$
(0.02
)
$
0.18

$
2.20

Effective tax rate
33.9
%


22.1
%


Three months ended December 31, 2018

Reported
GAAP
measure
Intangible
amortization
expense
Restructuring
& Integration
charges
AFS Write Downs
Digital Write Downs
Impact of Wind Down(6)
Tax adjustments(7)
Other(2)
Non-GAAP
measure
Sales
$
7,918,182

$
—

$
—

$
—

$
—

$
(102,965
)
$
—

$
—

$
7,815,217

Gross Profit
975,370

—

—

—

—

(16,947
)
—

—

958,423

Operating income
334,380

9,493

11,126

—

—

4,471

—

—

359,470

Income before income taxes
264,965

9,493

11,126

—

—

4,114

—

11,886

301,584

Provision for income taxes
32,474

2,772

4,786

—

—

1,635

28,323

3,025

73,015

Consolidated net income
232,491

6,721

6,340

—

—

2,479

(28,323
)
8,861

228,569

Noncontrolling interests
1,838

142

—

—

—

—

—

—

1,980

Net income attributable to shareholders
$
230,653

$
6,579

$
6,340

$
—

$
—

$
2,479

$
(28,323
)
$
8,861

$
226,589

Net income per diluted share(5)
$
2.63

$
0.08

$
0.07

$
—

$
—

$
0.03

$
(0.32
)
$
0.10

$
2.59

Effective tax rate
12.3
%


24.2
%


10


NON-GAAP EARNINGS RECONCILIATION
(In thousands except per share data)
(Unaudited)
 
Year ended December 31, 2019
 
Reported
GAAP
measure
Intangible
amortization
expense
Restructuring
& Integration
charges
AFS Write Downs
Digital Write Downs
Impairments(4)
Impact of Wind Down(6)
Tax adjustments(7)
Other(1)
Non-GAAP
measure
Sales
$
28,916,847

$
—

$
—

$
—

$
—

$
—

$
(240,473
)
$
—

$
—

$
28,676,374

Gross Profit
3,298,381

—

—

1,868

22,332

—

(1,975
)
—

—

3,320,606

Operating income
107,696

42,383

78,429

18,037

22,332

623,796

162,244

—

1,868

1,056,785

Income before income taxes
(111,830
)
42,383

78,429

18,037

22,332

623,796

162,356

—

10,921

846,424

Provision for income taxes
88,338

11,913

19,540

4,339

5,390

64,246

12,631

(1,696
)
750

205,451

Consolidated net income
(200,168
)
30,470

58,889

13,698

16,942

559,550

149,725

1,696

10,171

640,973

Noncontrolling interests
3,919

558

—

—

—

—

—

—

—

4,477

Net income attributable to shareholders
$
(204,087
)
$
29,912

$
58,889

$
13,698

$
16,942

$
559,550

$
149,725

$
1,696

$
10,171

$
636,496

Net income per diluted share(5)
$
(2.44
)
$
0.36

$
0.70

$
0.16

$
0.20

$
6.70

$
1.79

$
0.02

$
0.12

$
7.55

Effective tax rate
(79.0
)%


24.3
%


Year ended December 31, 2018
 
Reported
GAAP
measure
Intangible
amortization
expense
Restructuring
& Integration
charges
AFS Write Downs
Digital Write Downs
Impairments
Impact of Wind Down(6)
Tax adjustments(7)
Other(3)
Non-GAAP
measure
Sales
$
29,676,768

$
—

$
—

$
—

$
—

$
—

$
(415,707
)
$
—

$
—

$
29,261,061

Gross Profit
3,700,912

—

—

—

—

—

(71,091
)
—

—

3,629,821

Operating income
1,147,512

38,215

49,297

—

—

—

19,910

—

3,604

1,258,538

Income before income taxes
909,373

38,215

49,297

—

—

—

19,675

—

19,435

1,035,995

Provision for income taxes
187,799

10,782

14,815

—

—

—

6,031

28,323

4,678

252,428

Consolidated net income
721,574

27,433

34,482

—

—

—

13,644

(28,323
)
14,757

783,567

Noncontrolling interests
5,379

589

—

—

—

—

—

—

—

5,968

Net income attributable to shareholders
$
716,195

$
26,844

$
34,482

$
—

$
—

$
—

$
13,644

$
(28,323
)
$
14,757

777,599

Net income per diluted share(5)
$
8.10

$
0.30

$
0.39

$
—

$
—

$
—

$
0.15

$
(0.32
)
$
0.17

$
8.79

Effective tax rate
20.7
 %


24.4
%


(1) Other includes loss on disposition of businesses, net, gain (loss) on investments, net, interest related to uncertain tax position related to the Tax Act and pension settlement.
(2) Other includes gain (loss) on investments, net, and pension settlement.
(3) Other includes loss on disposition of businesses, net, gain (loss) on investments, net, and pension settlement.
(4) Impairments include goodwill impairments of $570,175, tradename impairments of $46,000, and $7,621 in impairment charges related to various other long-lived assets.
(5) For the year ended December 31, 2019, the non-GAAP net income per diluted share calculation includes 752 thousand shares that were excluded from the GAAP net income per diluted share calculation. Additionally, in all periods presented the sum of the components for diluted EPS, as adjusted may not agree to totals, as presented, due to rounding.
(6) Amounts for restructuring, integration, and other charges, identifiable intangible asset amortization, loss on disposition of businesses, net, certain tax adjustments, and impairments related to the personal computer and mobility asset disposition business are included in “impact of wind down” above.
(7) Includes income tax expense related to repatriation of foreign earnings and the Tax Act.


11


ARROW ELECTRONICS, INC.
SEGMENT INFORMATION
(In thousands)
(Unaudited)


Quarter Ended
 
Year Ended
 
December 31, 2019
 
December 31, 2018
 
December 31, 2019
 
December 31, 2018
Sales:


Global components
$
4,738,993

 
$
5,261,477

 
$
20,250,735

 
$
20,856,851

Global ECS
2,599,197

 
2,656,705

 
8,666,112

 
8,819,917

Consolidated
$
7,338,190

 
$
7,918,182

 
$
28,916,847

 
$
29,676,768

Operating income (loss):


Global components
$
149,794

 
$
252,313

 
$
(10,199
)
 
$
1,007,638

Global ECS
148,711

 
152,195

 
426,192

 
427,605

Corporate (a)
(60,397
)
 
(70,128
)
 
(308,297
)
 
(287,731
)
Consolidated
$
238,108

 
$
334,380

 
$
107,696

 
$
1,147,512


(a)
Includes restructuring, integration, and other charges of $16.4 million and $79.0 million for the fourth quarter and year ended December 31, 2019 and $11.1 million and $49.3 million for the fourth quarter and year ended December 31, 2018, respectively. Also included is a net loss on disposition of $1.0 million and $1.9 million for the fourth quarter and year ended December 31, 2019 and $3.6 million for the year ended December 31, 2018, respectively.

NON-GAAP SEGMENT RECONCILIATION


Quarter Ended
 
Year Ended
 
December 31, 2019

December 31, 2018
 
December 31, 2019
 
December 31, 2018
Global components operating income, as reported
$
149,794

 
$
252,313

 
$
(10,199
)
 
$
1,007,638

Intangible assets amortization expense (b)
7,135

 
6,600

 
26,594

 
24,226

Impairments (b)
—

 
—

 
623,796

 
—

Impact of wind-down (b)
10,912

 
5,733

 
161,664

 
8,846

AFS notes receivable reserve
2,850

 
—

 
18,037

 
—

Digital inventory reserve
1,117

 
—

 
22,332

 
—

Global components operating income, as adjusted
$
171,808


$
264,646


$
842,224


$
1,040,710

Global ECS operating income, as reported
$
148,711

 
$
152,195

 
$
426,192

 
$
427,605

Intangible assets amortization expense
7,176

 
2,893

 
15,789

 
13,989

Global ECS operating income, as adjusted
$
155,887

 
$
155,088

 
$
441,981

 
$
441,594


(b) Restructuring, integration, and other charges, identifiable intangible asset amortization, loss on disposition of businesses, net, and impairments related to the personal computer and mobility asset disposition business are included in “impact of wind down” above.


Contact:            Steven O’Brien,
Vice President, Investor Relations
303-824-4544


Media Contact:        John Hourigan,
Vice President, Global Communications
303-824-4586


12
Fourth Quarter 2019 CFO Commentary As reflected in our earnings release, there are a number of items that impact the comparability of our results with those in the trailing quarter and prior quarter of last year. The discussion of our results may exclude these items to give you a Full-year 2019 better sense of our operating results. As always, the operating information we provide to you should be used as a complement to GAAP cash provided by numbers. For a complete reconciliation between our GAAP and non-GAAP results, please refer to operating activities our earnings release and the earnings reconciliation found at the end of this document. of $858 million. The following reported and adjusted information included in this CFO commentary is unaudited and should be read in conjunction with the company’s 2019 Annual Report on form 10-K as filed with the Securities and Exchange Commission. investor.arrow.com
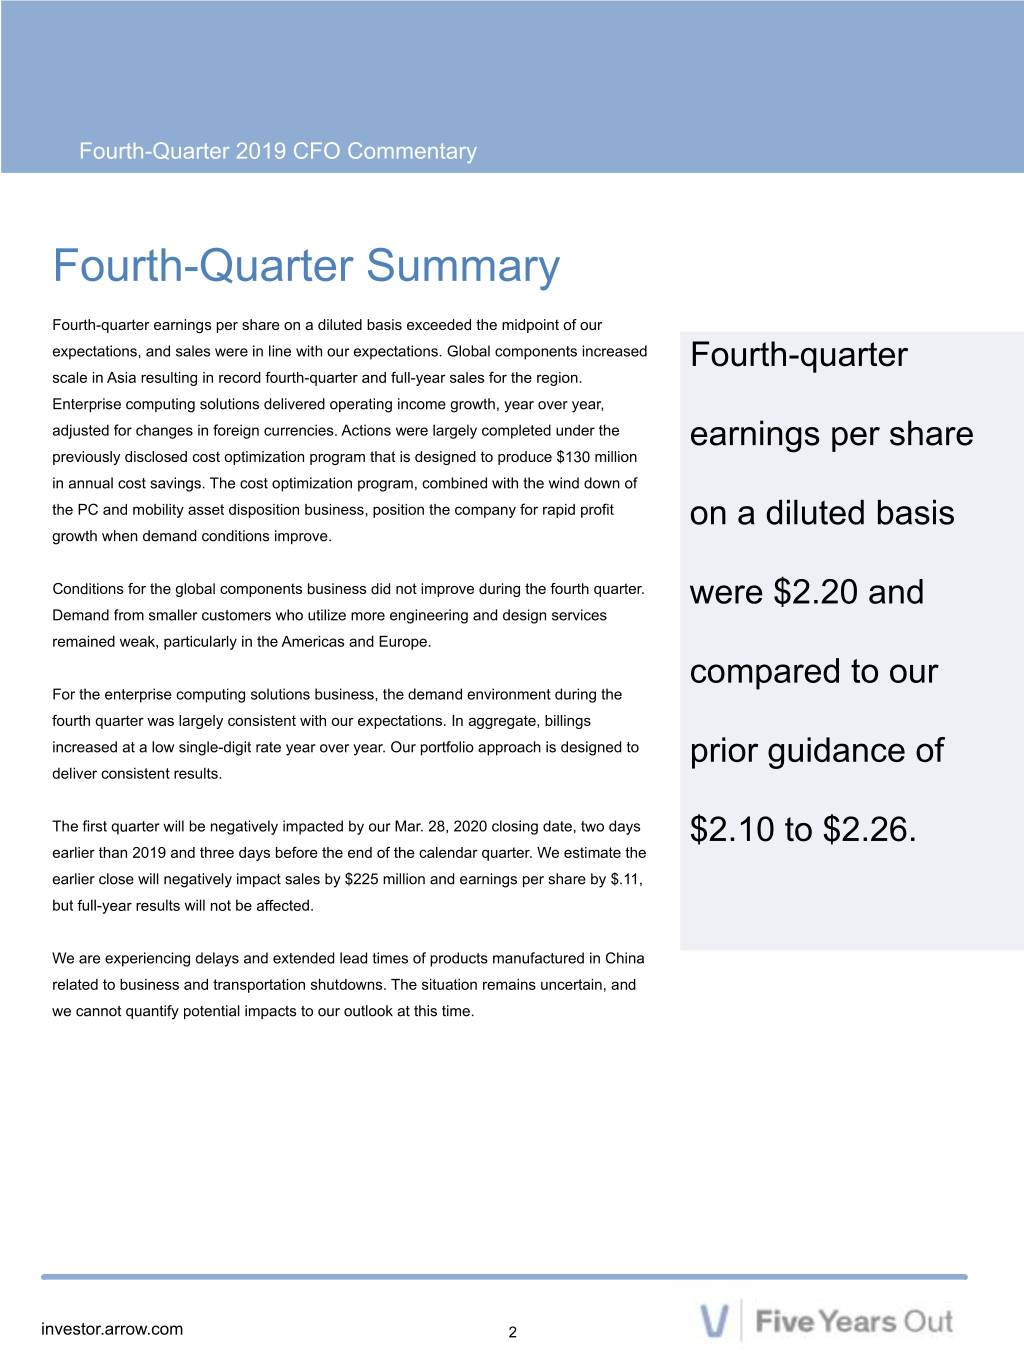

 
Fourth-Quarter 2019 CFO Commentary Fourth-Quarter Summary Fourth-quarter earnings per share on a diluted basis exceeded the midpoint of our expectations, and sales were in line with our expectations. Global components increased Fourth-quarter scale in Asia resulting in record fourth-quarter and full-year sales for the region. Enterprise computing solutions delivered operating income growth, year over year, adjusted for changes in foreign currencies. Actions were largely completed under the earnings per share previously disclosed cost optimization program that is designed to produce $130 million in annual cost savings. The cost optimization program, combined with the wind down of the PC and mobility asset disposition business, position the company for rapid profit on a diluted basis growth when demand conditions improve. Conditions for the global components business did not improve during the fourth quarter. were $2.20 and Demand from smaller customers who utilize more engineering and design services remained weak, particularly in the Americas and Europe. compared to our For the enterprise computing solutions business, the demand environment during the fourth quarter was largely consistent with our expectations. In aggregate, billings increased at a low single-digit rate year over year. Our portfolio approach is designed to prior guidance of deliver consistent results. The first quarter will be negatively impacted by our Mar. 28, 2020 closing date, two days $2.10 to $2.26. earlier than 2019 and three days before the end of the calendar quarter. We estimate the earlier close will negatively impact sales by $225 million and earnings per share by $.11, but full-year results will not be affected. We are experiencing delays and extended lead times of products manufactured in China related to business and transportation shutdowns. The situation remains uncertain, and we cannot quantify potential impacts to our outlook at this time. investor.arrow.com 2
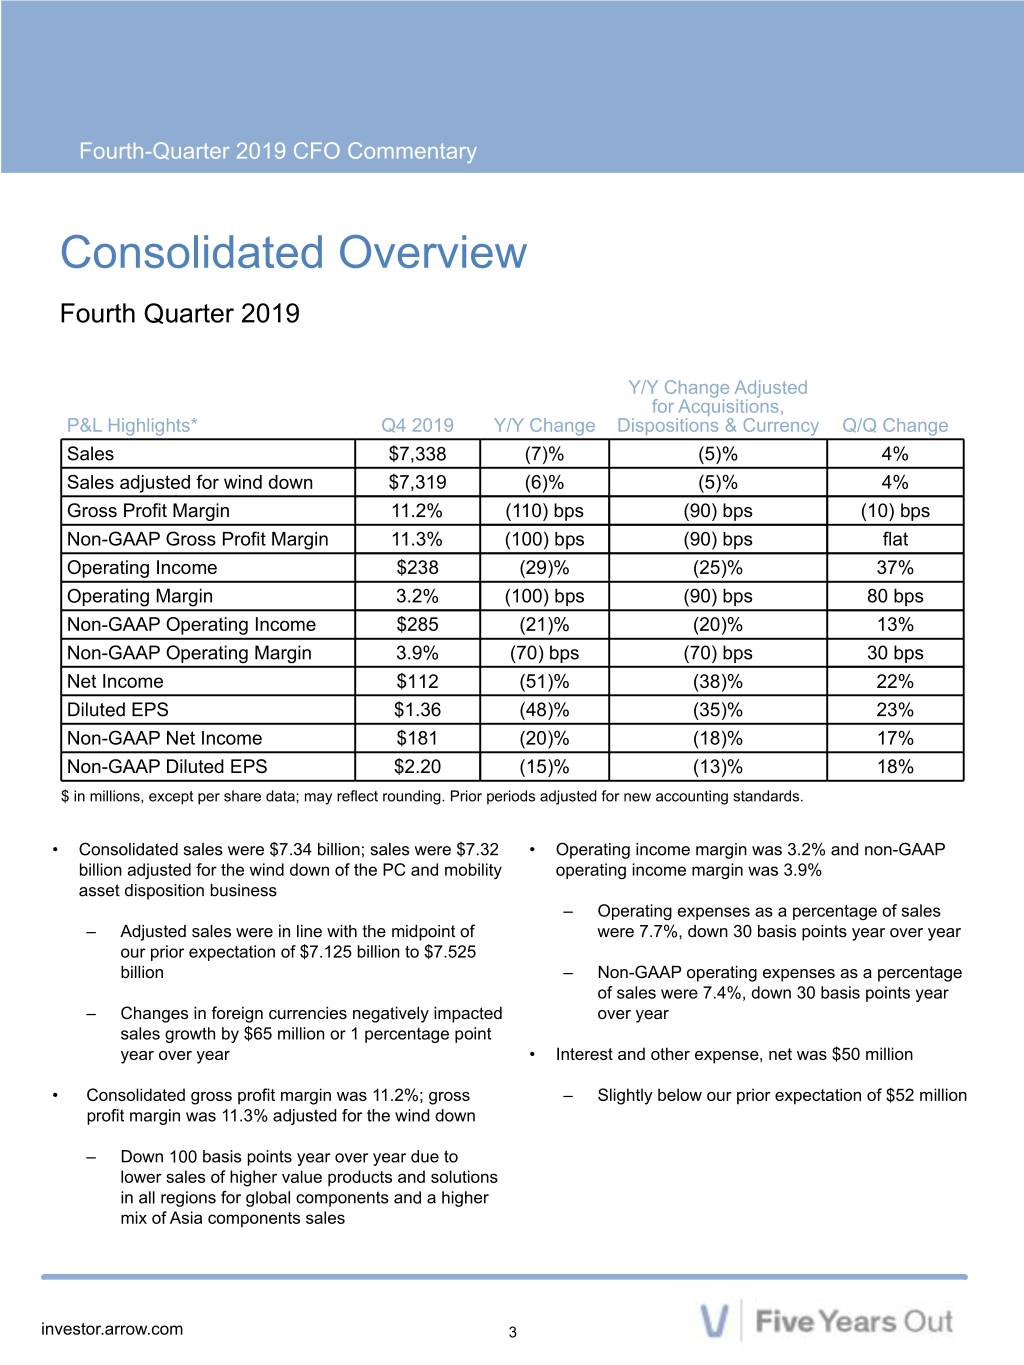

 
Fourth-Quarter 2019 CFO Commentary Consolidated Overview Fourth Quarter 2019 Y/Y Change Adjusted for Acquisitions, P&L Highlights* Q4 2019 Y/Y Change Dispositions & Currency Q/Q Change Sales $7,338 (7)% (5)% 4% Sales adjusted for wind down $7,319 (6)% (5)% 4% Gross Profit Margin 11.2% (110) bps (90) bps (10) bps Non-GAAP Gross Profit Margin 11.3% (100) bps (90) bps flat Operating Income $238 (29)% (25)% 37% Operating Margin 3.2% (100) bps (90) bps 80 bps Non-GAAP Operating Income $285 (21)% (20)% 13% Non-GAAP Operating Margin 3.9% (70) bps (70) bps 30 bps Net Income $112 (51)% (38)% 22% Diluted EPS $1.36 (48)% (35)% 23% Non-GAAP Net Income $181 (20)% (18)% 17% Non-GAAP Diluted EPS $2.20 (15)% (13)% 18% $ in millions, except per share data; may reflect rounding. Prior periods adjusted for new accounting standards. • Consolidated sales were $7.34 billion; sales were $7.32 • Operating income margin was 3.2% and non-GAAP billion adjusted for the wind down of the PC and mobility operating income margin was 3.9% asset disposition business – Operating expenses as a percentage of sales – Adjusted sales were in line with the midpoint of were 7.7%, down 30 basis points year over year our prior expectation of $7.125 billion to $7.525 billion – Non-GAAP operating expenses as a percentage of sales were 7.4%, down 30 basis points year – Changes in foreign currencies negatively impacted over year sales growth by $65 million or 1 percentage point year over year • Interest and other expense, net was $50 million • Consolidated gross profit margin was 11.2%; gross – Slightly below our prior expectation of $52 million profit margin was 11.3% adjusted for the wind down – Down 100 basis points year over year due to lower sales of higher value products and solutions in all regions for global components and a higher mix of Asia components sales investor.arrow.com 3
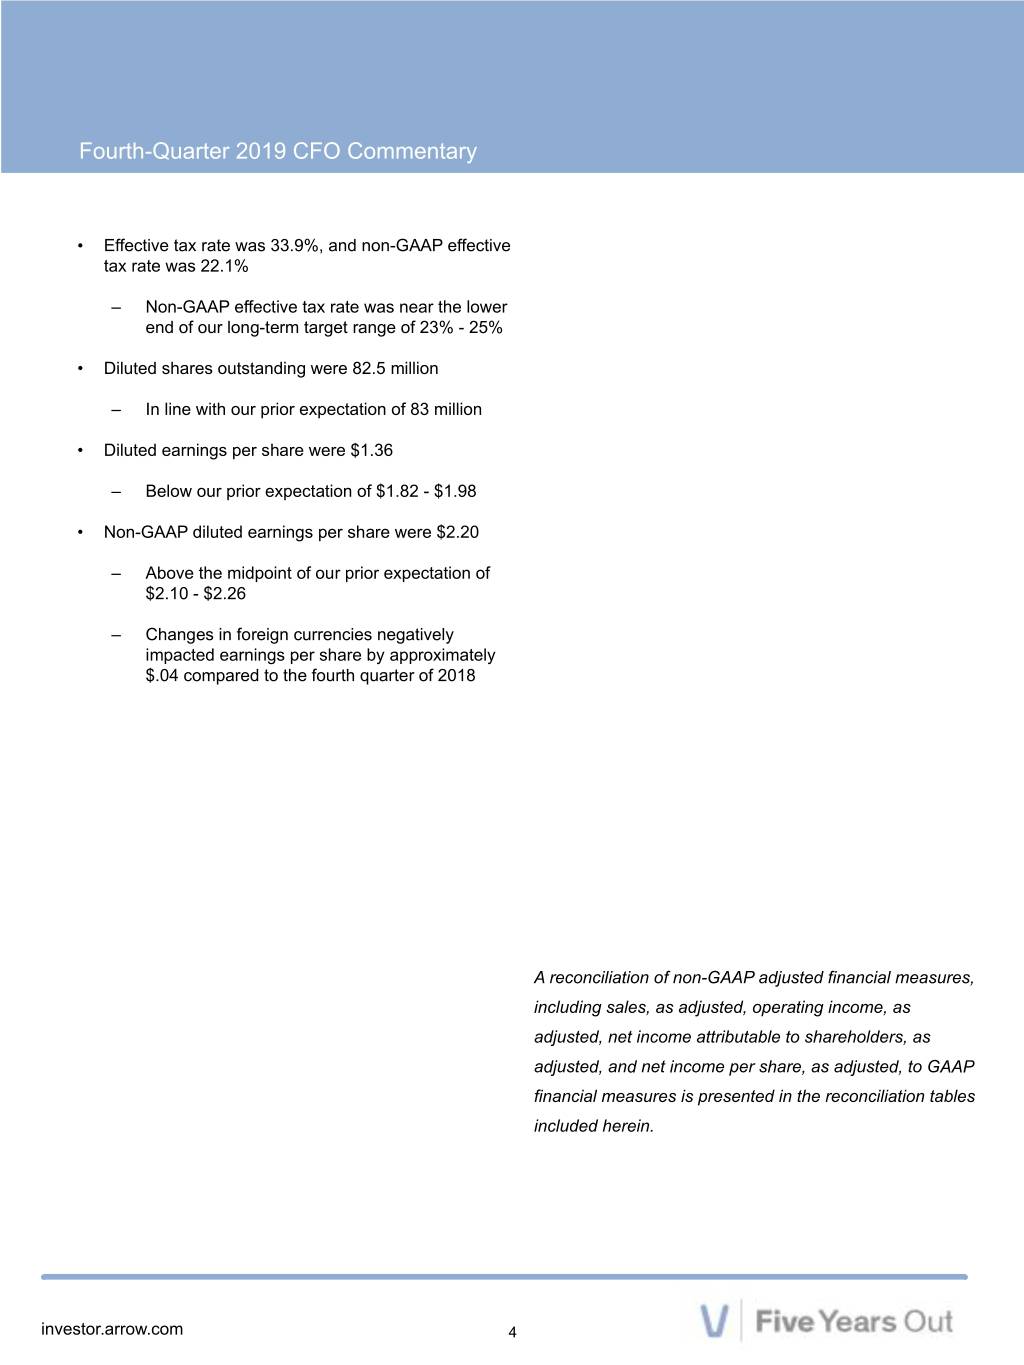

 
Fourth-Quarter 2019 CFO Commentary • Effective tax rate was 33.9%, and non-GAAP effective tax rate was 22.1% – Non-GAAP effective tax rate was near the lower end of our long-term target range of 23% - 25% • Diluted shares outstanding were 82.5 million – In line with our prior expectation of 83 million • Diluted earnings per share were $1.36 – Below our prior expectation of $1.82 - $1.98 • Non-GAAP diluted earnings per share were $2.20 – Above the midpoint of our prior expectation of $2.10 - $2.26 – Changes in foreign currencies negatively impacted earnings per share by approximately $.04 compared to the fourth quarter of 2018 A reconciliation of non-GAAP adjusted financial measures, including sales, as adjusted, operating income, as adjusted, net income attributable to shareholders, as adjusted, and net income per share, as adjusted, to GAAP financial measures is presented in the reconciliation tables included herein. investor.arrow.com 4
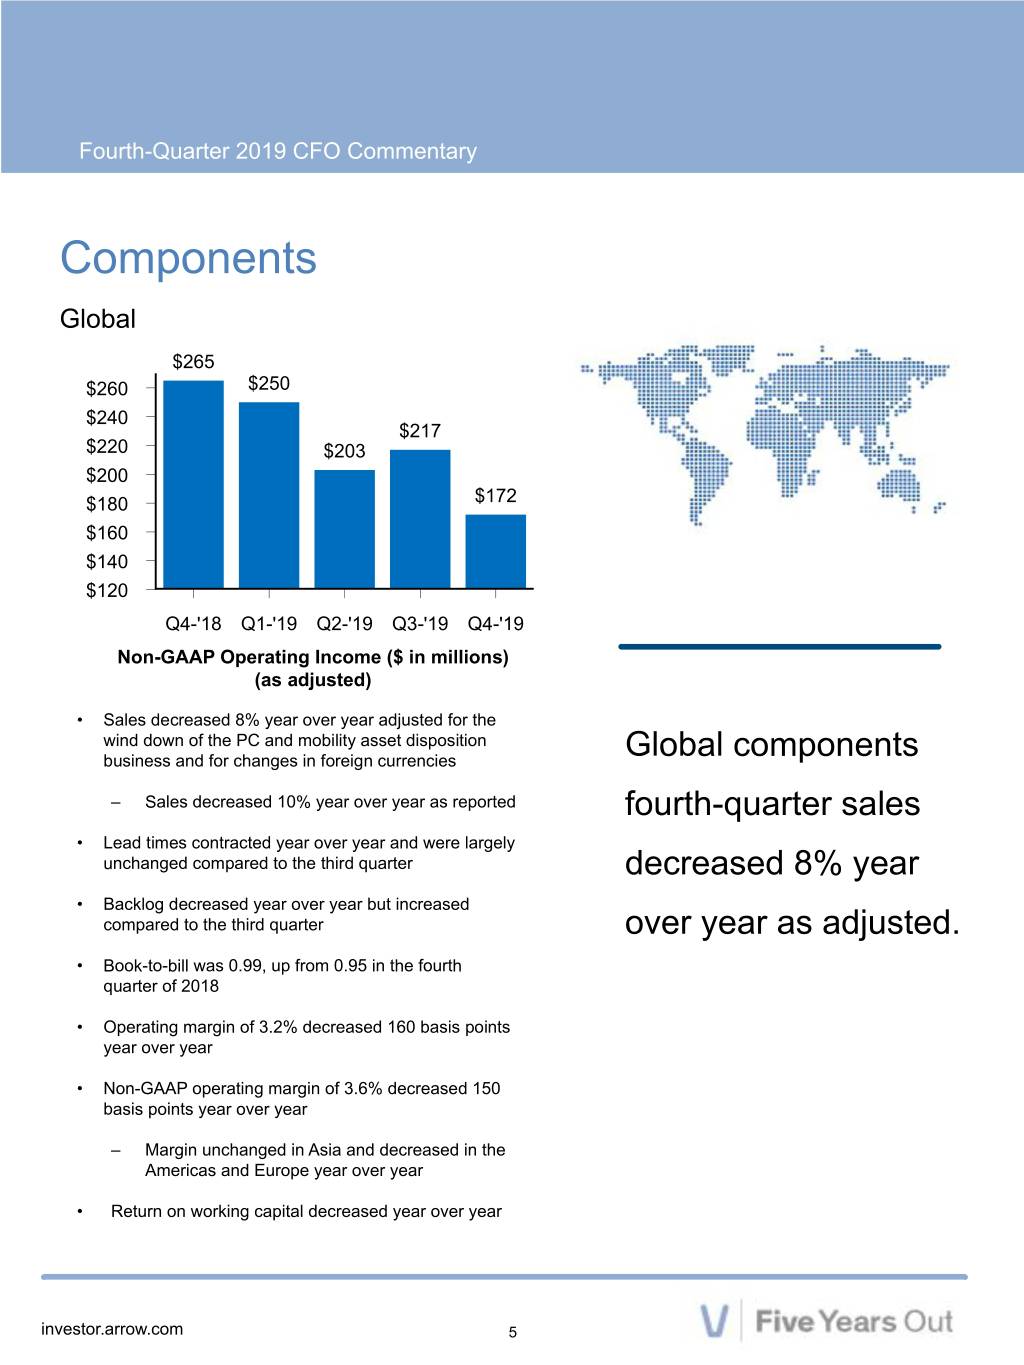

 
Fourth-Quarter 2019 CFO Commentary Components Global $265 $260 $250 $240 $217 $220 $203 $200 $180 $172 $160 $140 $120 Q4-'18 Q1-'19 Q2-'19 Q3-'19 Q4-'19 Non-GAAP Operating Income ($ in millions) (as adjusted) • Sales decreased 8% year over year adjusted for the wind down of the PC and mobility asset disposition business and for changes in foreign currencies Global components – Sales decreased 10% year over year as reported fourth-quarter sales • Lead times contracted year over year and were largely unchanged compared to the third quarter decreased 8% year • Backlog decreased year over year but increased compared to the third quarter over year as adjusted. • Book-to-bill was 0.99, up from 0.95 in the fourth quarter of 2018 • Operating margin of 3.2% decreased 160 basis points year over year • Non-GAAP operating margin of 3.6% decreased 150 basis points year over year – Margin unchanged in Asia and decreased in the Americas and Europe year over year • Return on working capital decreased year over year investor.arrow.com 5
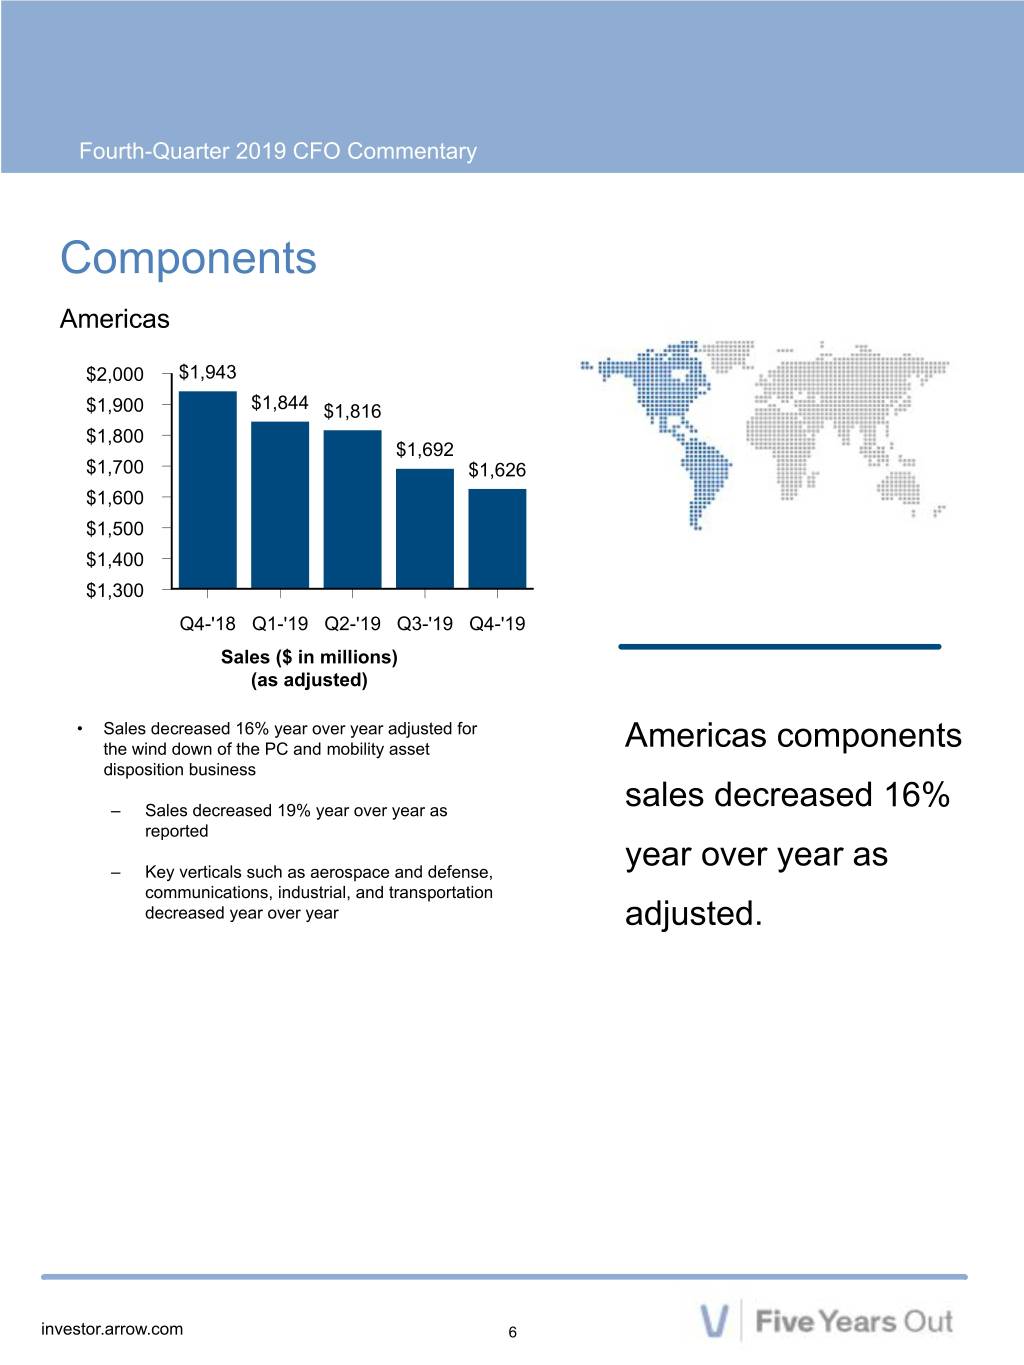

 
Fourth-Quarter 2019 CFO Commentary Components Americas $2,000 $1,943 $1,900 $1,844 $1,816 $1,800 $1,692 $1,700 $1,626 $1,600 $1,500 $1,400 $1,300 Q4-'18 Q1-'19 Q2-'19 Q3-'19 Q4-'19 Sales ($ in millions) (as adjusted) • Sales decreased 16% year over year adjusted for the wind down of the PC and mobility asset Americas components disposition business – Sales decreased 19% year over year as sales decreased 16% reported year over year as – Key verticals such as aerospace and defense, communications, industrial, and transportation decreased year over year adjusted. investor.arrow.com 6
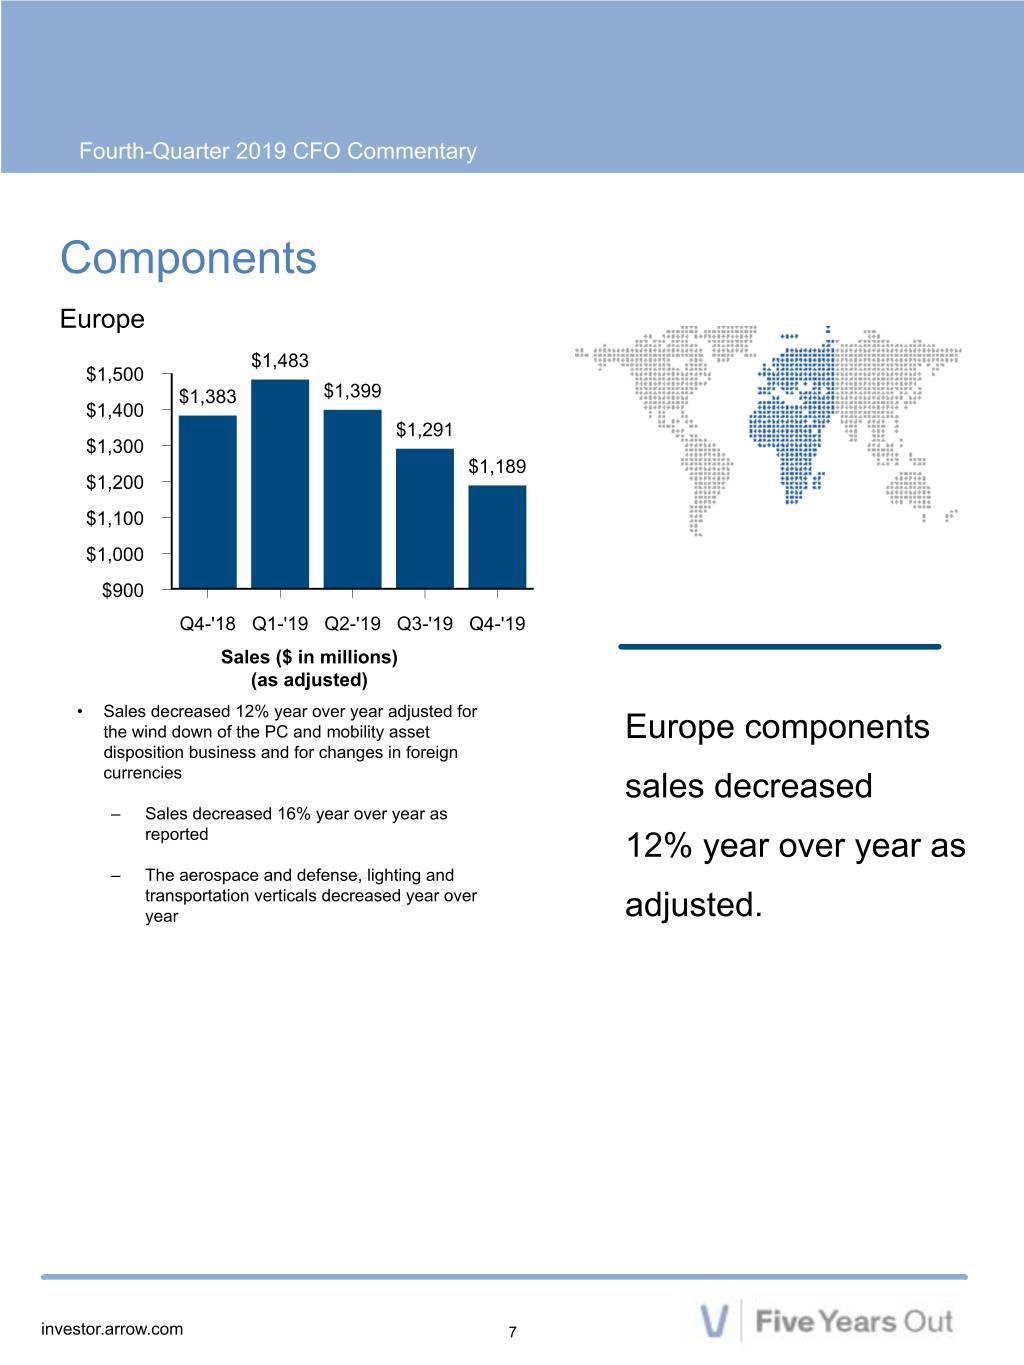

 
Fourth-Quarter 2019 CFO Commentary Components Europe $1,483 $1,500 $1,383 $1,399 $1,400 $1,291 $1,300 $1,189 $1,200 $1,100 $1,000 $900 Q4-'18 Q1-'19 Q2-'19 Q3-'19 Q4-'19 Sales ($ in millions) (as adjusted) • Sales decreased 12% year over year adjusted for the wind down of the PC and mobility asset Europe components disposition business and for changes in foreign currencies sales decreased – Sales decreased 16% year over year as reported 12% year over year as – The aerospace and defense, lighting and transportation verticals decreased year over year adjusted. investor.arrow.com 7
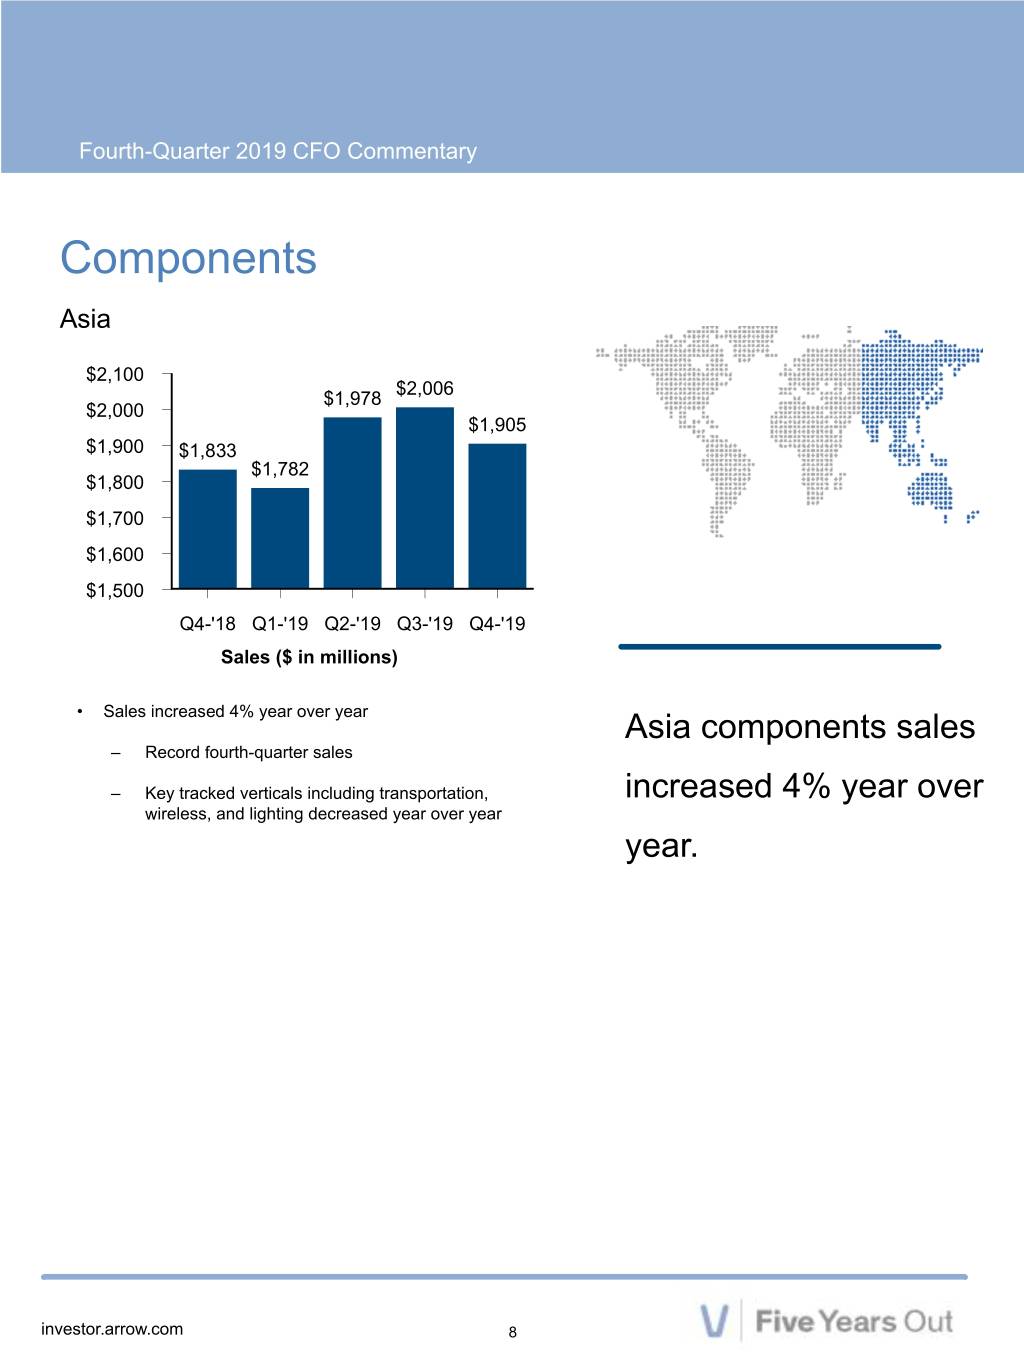

 
Fourth-Quarter 2019 CFO Commentary Components Asia $2,100 $2,006 $1,978 $2,000 $1,905 $1,900 $1,833 $1,782 $1,800 $1,700 $1,600 $1,500 Q4-'18 Q1-'19 Q2-'19 Q3-'19 Q4-'19 Sales ($ in millions) • Sales increased 4% year over year Asia components sales – Record fourth-quarter sales – Key tracked verticals including transportation, increased 4% year over wireless, and lighting decreased year over year year. investor.arrow.com 8
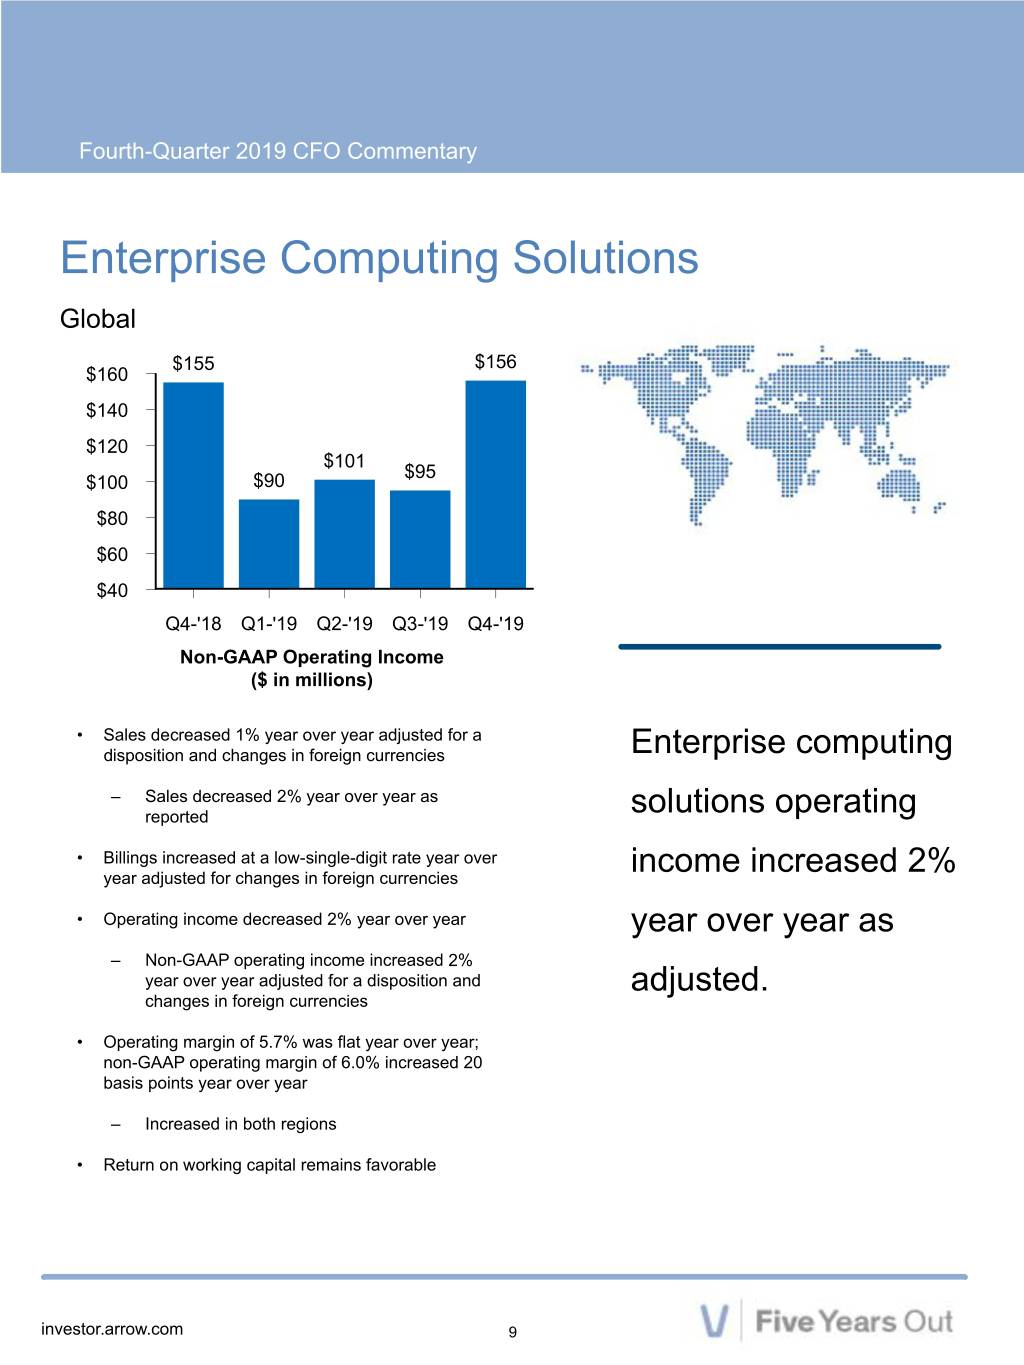

 
Fourth-Quarter 2019 CFO Commentary Enterprise Computing Solutions Global $155 $156 $160 $140 $120 $101 $95 $100 $90 $80 $60 $40 Q4-'18 Q1-'19 Q2-'19 Q3-'19 Q4-'19 Non-GAAP Operating Income ($ in millions) • Sales decreased 1% year over year adjusted for a disposition and changes in foreign currencies Enterprise computing – Sales decreased 2% year over year as reported solutions operating • Billings increased at a low-single-digit rate year over income increased 2% year adjusted for changes in foreign currencies • Operating income decreased 2% year over year year over year as – Non-GAAP operating income increased 2% year over year adjusted for a disposition and adjusted. changes in foreign currencies • Operating margin of 5.7% was flat year over year; non-GAAP operating margin of 6.0% increased 20 basis points year over year – Increased in both regions • Return on working capital remains favorable investor.arrow.com 9
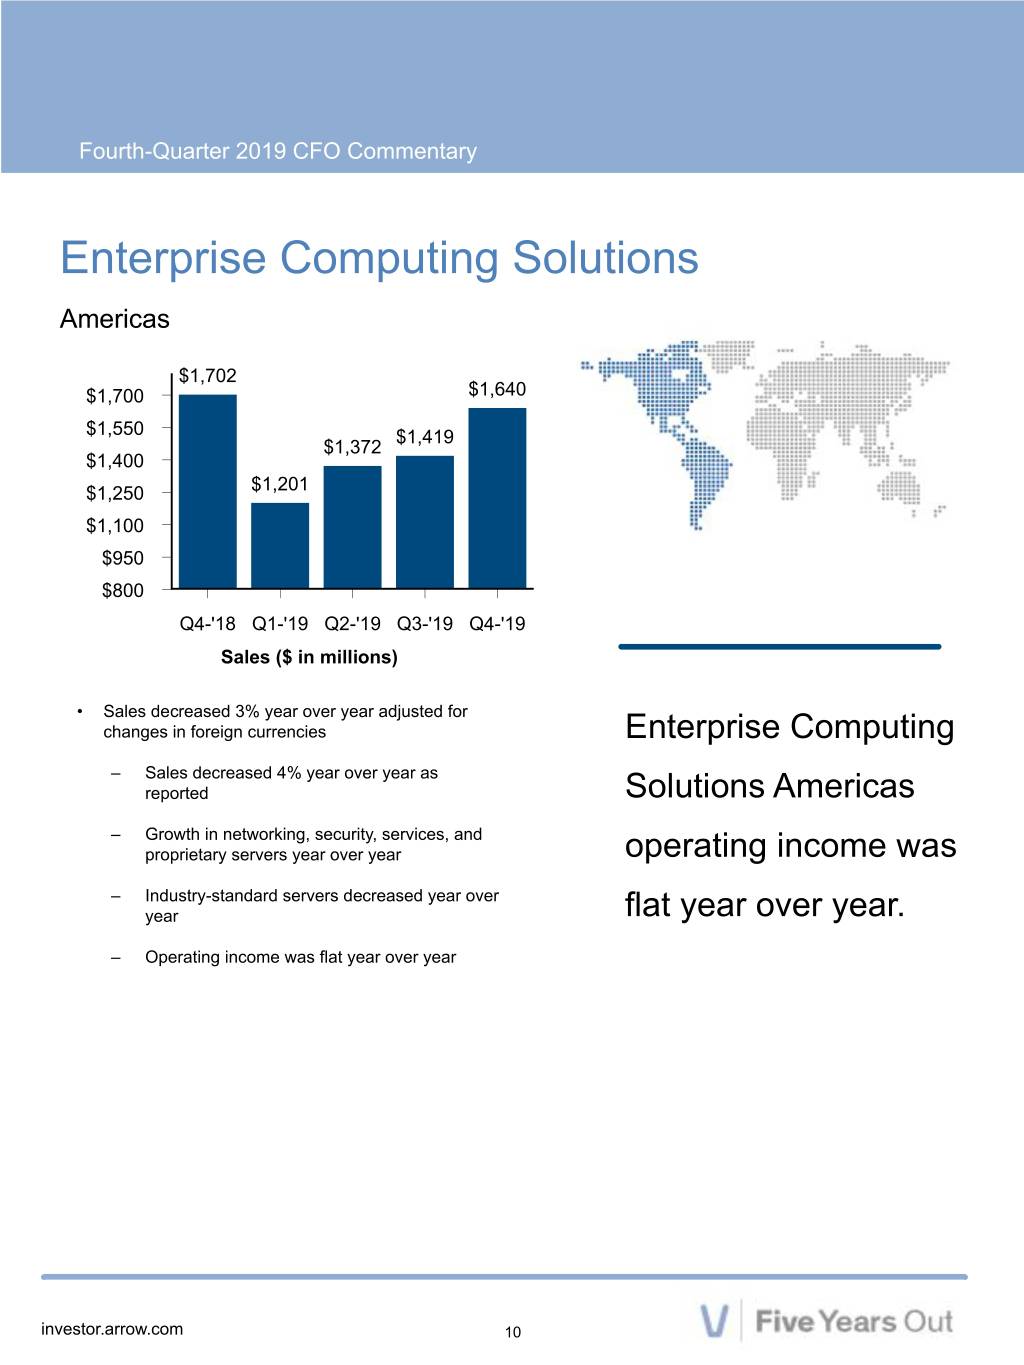

 
Fourth-Quarter 2019 CFO Commentary Enterprise Computing Solutions Americas $1,702 $1,700 $1,640 $1,550 $1,419 $1,372 $1,400 $1,250 $1,201 $1,100 $950 $800 Q4-'18 Q1-'19 Q2-'19 Q3-'19 Q4-'19 Sales ($ in millions) • Sales decreased 3% year over year adjusted for changes in foreign currencies Enterprise Computing – Sales decreased 4% year over year as reported Solutions Americas – Growth in networking, security, services, and proprietary servers year over year operating income was – Industry-standard servers decreased year over year flat year over year. – Operating income was flat year over year investor.arrow.com 10
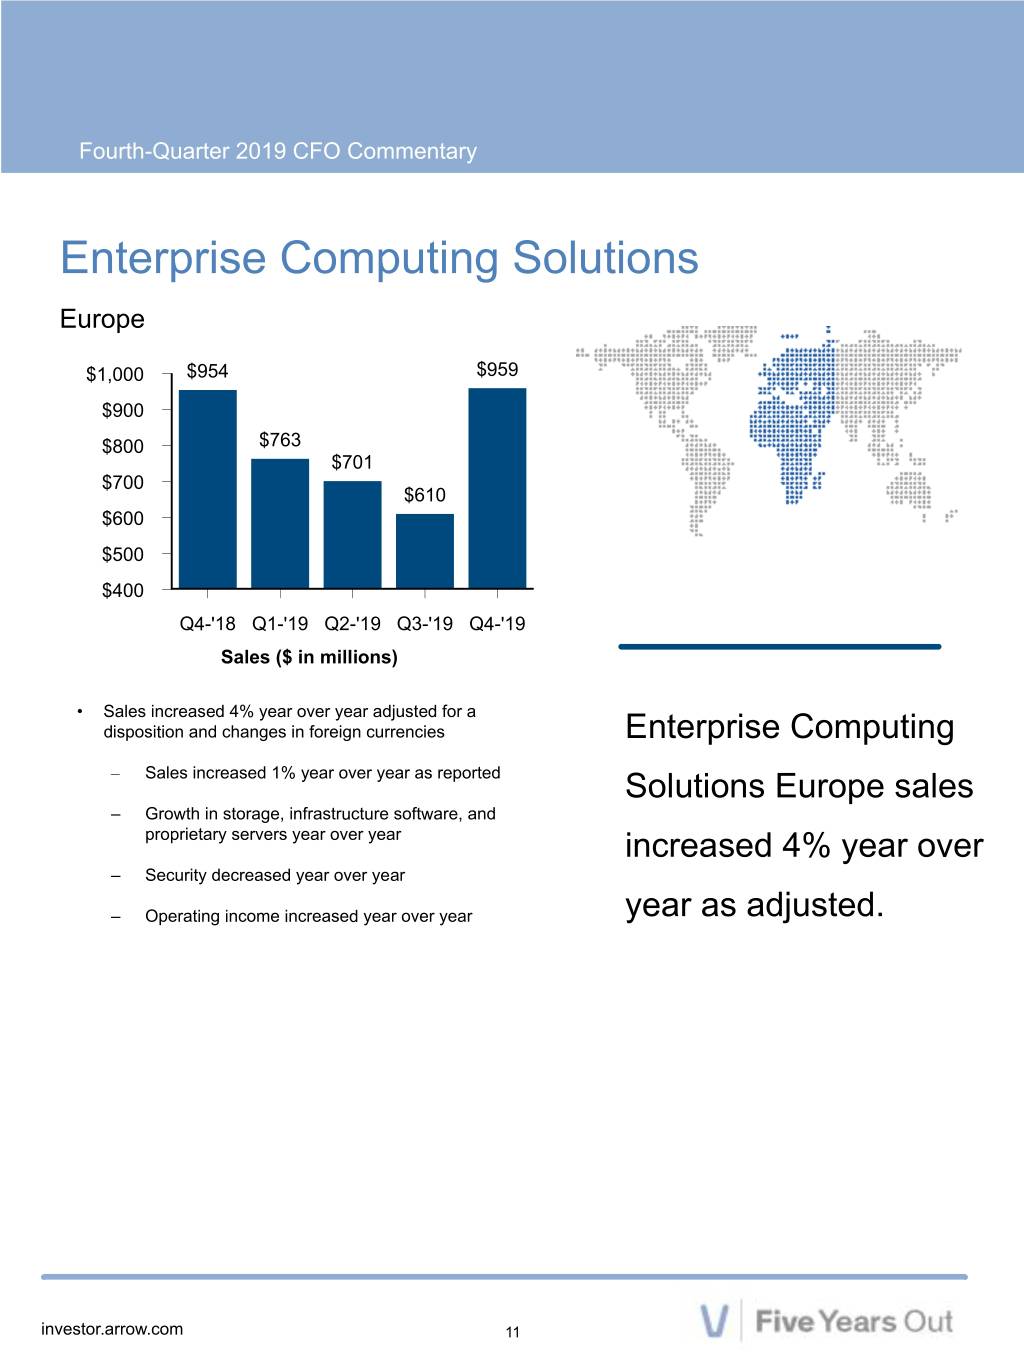

 
Fourth-Quarter 2019 CFO Commentary Enterprise Computing Solutions Europe $1,000 $954 $959 $900 $800 $763 $701 $700 $610 $600 $500 $400 Q4-'18 Q1-'19 Q2-'19 Q3-'19 Q4-'19 Sales ($ in millions) • Sales increased 4% year over year adjusted for a disposition and changes in foreign currencies Enterprise Computing – Sales increased 1% year over year as reported Solutions Europe sales – Growth in storage, infrastructure software, and proprietary servers year over year increased 4% year over – Security decreased year over year – Operating income increased year over year year as adjusted. investor.arrow.com 11
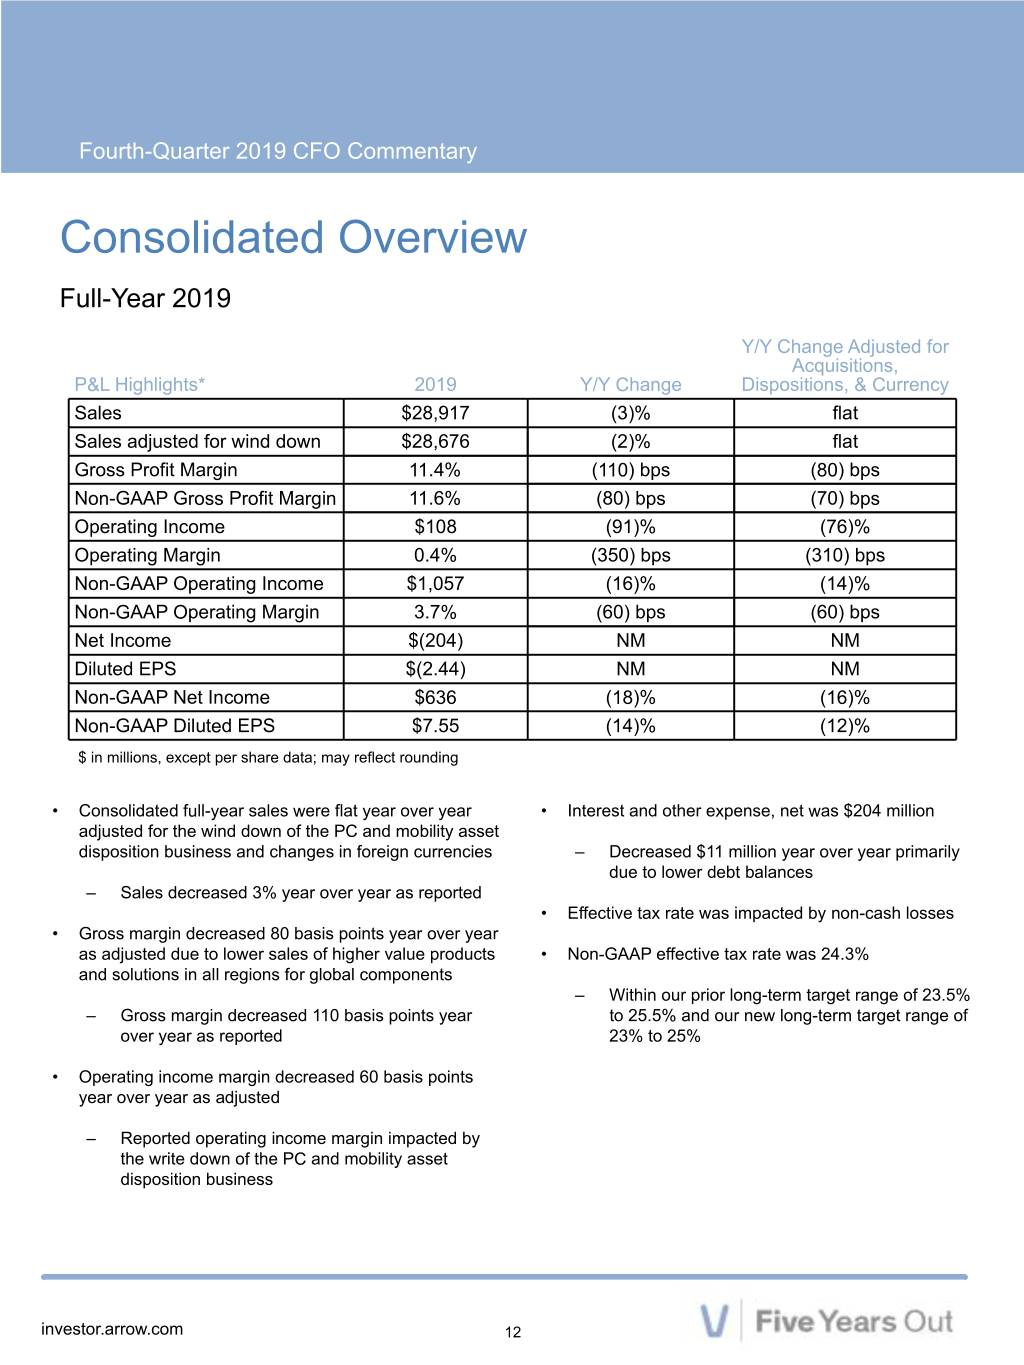

 
Fourth-Quarter 2019 CFO Commentary Consolidated Overview Full-Year 2019 Y/Y Change Adjusted for Acquisitions, P&L Highlights* 2019 Y/Y Change Dispositions, & Currency Sales $28,917 (3)% flat Sales adjusted for wind down $28,676 (2)% flat Gross Profit Margin 11.4% (110) bps (80) bps Non-GAAP Gross Profit Margin 11.6% (80) bps (70) bps Operating Income $108 (91)% (76)% Operating Margin 0.4% (350) bps (310) bps Non-GAAP Operating Income $1,057 (16)% (14)% Non-GAAP Operating Margin 3.7% (60) bps (60) bps Net Income $(204) NM NM Diluted EPS $(2.44) NM NM Non-GAAP Net Income $636 (18)% (16)% Non-GAAP Diluted EPS $7.55 (14)% (12)% $ in millions, except per share data; may reflect rounding • Consolidated full-year sales were flat year over year • Interest and other expense, net was $204 million adjusted for the wind down of the PC and mobility asset disposition business and changes in foreign currencies – Decreased $11 million year over year primarily due to lower debt balances – Sales decreased 3% year over year as reported • Effective tax rate was impacted by non-cash losses • Gross margin decreased 80 basis points year over year as adjusted due to lower sales of higher value products • Non-GAAP effective tax rate was 24.3% and solutions in all regions for global components – Within our prior long-term target range of 23.5% – Gross margin decreased 110 basis points year to 25.5% and our new long-term target range of over year as reported 23% to 25% • Operating income margin decreased 60 basis points year over year as adjusted – Reported operating income margin impacted by the write down of the PC and mobility asset disposition business investor.arrow.com 12
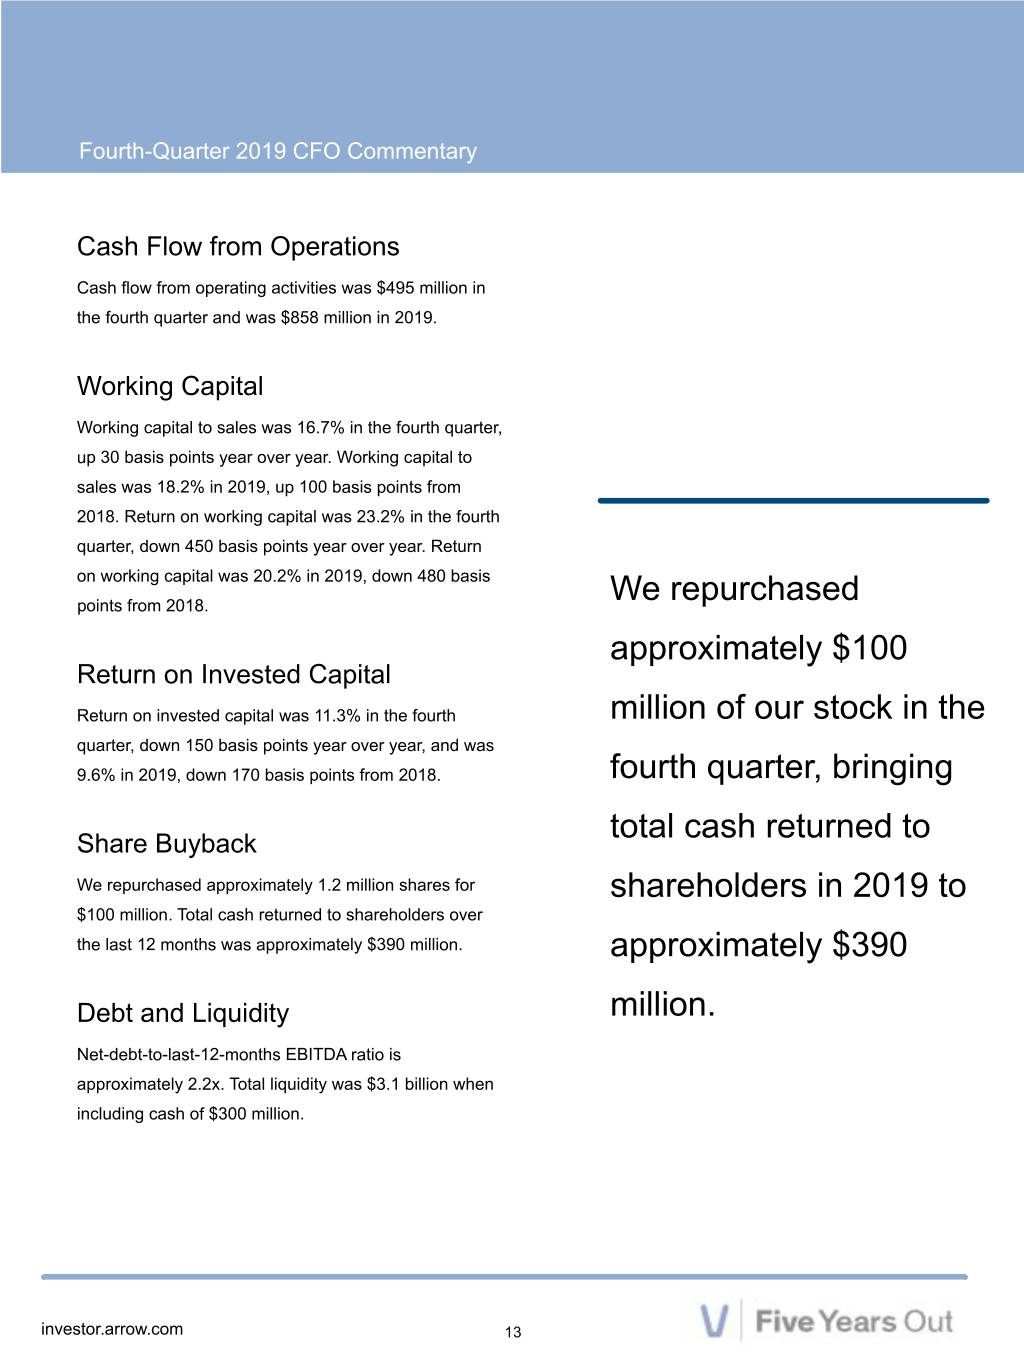

 
Fourth-Quarter 2019 CFO Commentary Cash Flow from Operations Cash flow from operating activities was $495 million in the fourth quarter and was $858 million in 2019. Working Capital Working capital to sales was 16.7% in the fourth quarter, up 30 basis points year over year. Working capital to sales was 18.2% in 2019, up 100 basis points from 2018. Return on working capital was 23.2% in the fourth quarter, down 450 basis points year over year. Return on working capital was 20.2% in 2019, down 480 basis points from 2018. We repurchased approximately $100 Return on Invested Capital Return on invested capital was 11.3% in the fourth million of our stock in the quarter, down 150 basis points year over year, and was 9.6% in 2019, down 170 basis points from 2018. fourth quarter, bringing total cash returned to Share Buyback We repurchased approximately 1.2 million shares for shareholders in 2019 to $100 million. Total cash returned to shareholders over the last 12 months was approximately $390 million. approximately $390 Debt and Liquidity million. Net-debt-to-last-12-months EBITDA ratio is approximately 2.2x. Total liquidity was $3.1 billion when including cash of $300 million. investor.arrow.com 13
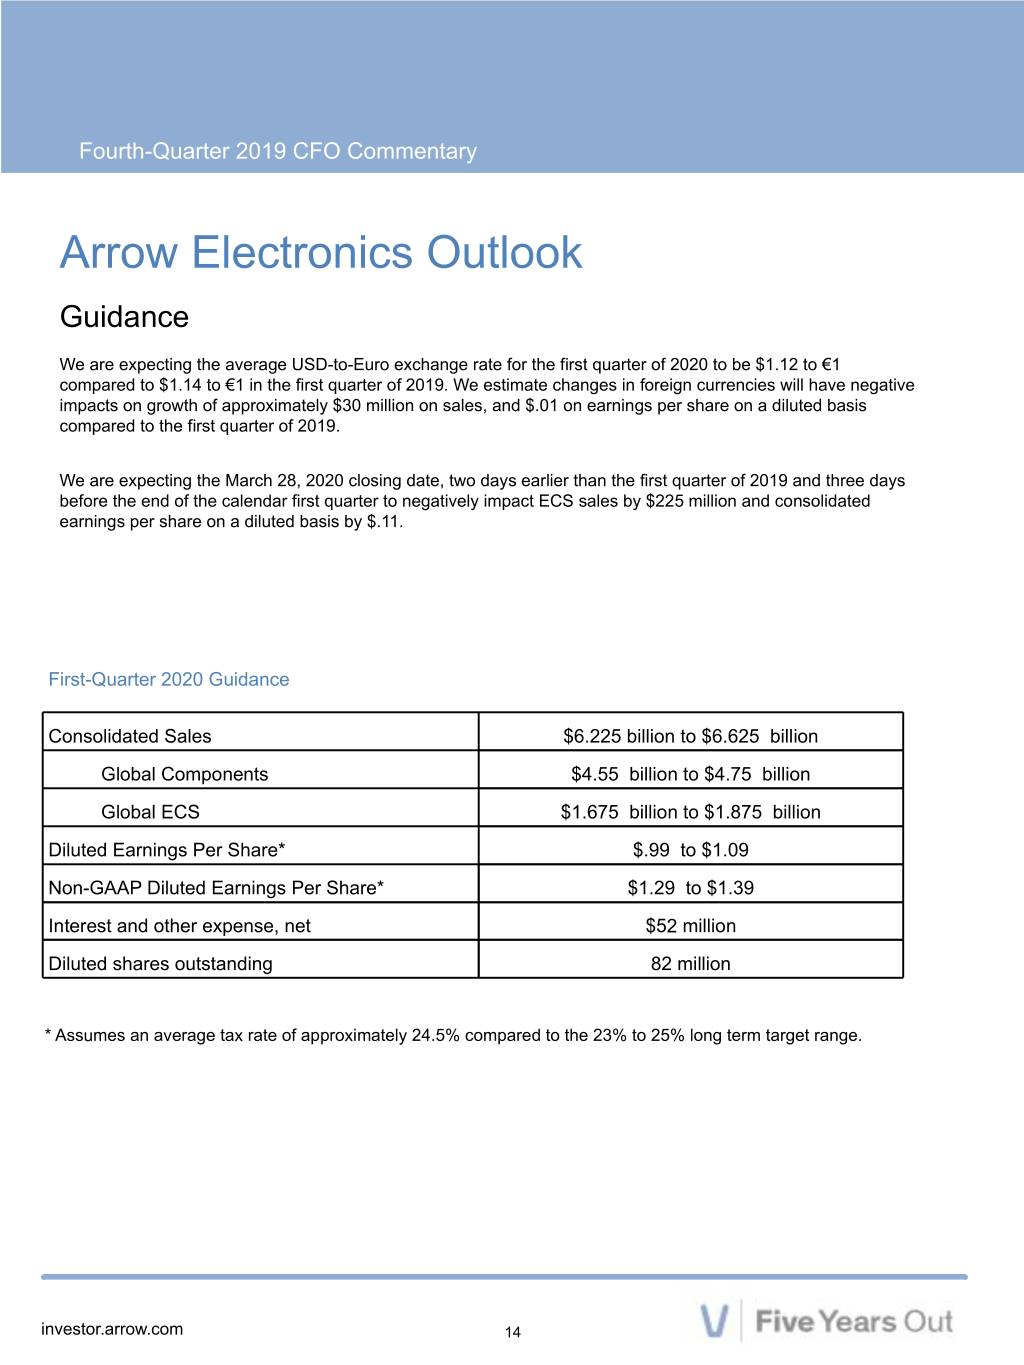

 
Fourth-Quarter 2019 CFO Commentary Arrow Electronics Outlook Guidance We are expecting the average USD-to-Euro exchange rate for the first quarter of 2020 to be $1.12 to €1 compared to $1.14 to €1 in the first quarter of 2019. We estimate changes in foreign currencies will have negative impacts on growth of approximately $30 million on sales, and $.01 on earnings per share on a diluted basis compared to the first quarter of 2019. We are expecting the March 28, 2020 closing date, two days earlier than the first quarter of 2019 and three days before the end of the calendar first quarter to negatively impact ECS sales by $225 million and consolidated earnings per share on a diluted basis by $.11. First-Quarter 2020 Guidance Consolidated Sales $6.225 billion to $6.625 billion Global Components $4.55 billion to $4.75 billion Global ECS $1.675 billion to $1.875 billion Diluted Earnings Per Share* $.99 to $1.09 Non-GAAP Diluted Earnings Per Share* $1.29 to $1.39 Interest and other expense, net $52 million Diluted shares outstanding 82 million * Assumes an average tax rate of approximately 24.5% compared to the 23% to 25% long term target range. investor.arrow.com 14

 
Fourth-Quarter 2019 CFO Commentary Risk Factors Information Relating to Forward-Looking The discussion of the company’s Statements business and operations should be read together with the risk factors This press release includes forward-looking statements that are subject to numerous assumptions, risks, and contained in Item 1A of its 2019 Annual uncertainties, which could cause actual results or facts to differ materially from such statements for a variety of Report on Form 10-K, filed with the reasons, including, but not limited to: industry conditions, changes in product supply, pricing and Securities and Exchange Commission, customer demand, competition, other vagaries in the global components and global ECS markets, changes which describe various risks and in relationships with key suppliers, increased profit margin pressure, changes in legal and regulatory uncertainties to which the company is matters, non-compliance with certain regulations, such as export, anti-trust, and anti-corruption laws, and the or may become subject. If any of the company's ability to generate cash flow.  Forward- looking statements are those statements which are not described events occur, the company’s statements of historical fact.  These forward-looking statements can be identified by forward-looking words such as “expects,” “anticipates,” “intends,” “plans,” business, results of operations, “may,” “will,” “believes,” “seeks,” “estimates,” and similar expressions.  Shareholders and other readers financial condition, liquidity, or access are cautioned not to place undue reliance on these forward-looking statements, which speak only as of the to the capital markets could be date on which they are made.  The company undertakes no obligation to update publicly or revise materially adversely affected. any of the forward-looking statements. For a further discussion of factors to consider in connection with these forward-looking statements, investors should refer to Item 1A Risk Factors of the company’s Annual Report on Form 10-K for the year ended Dec. 31, 2019. investor.arrow.com 15

 
Fourth-Quarter 2019 CFO Commentary Certain Non-GAAP Financial Information In addition to disclosing financial results that are The company believes that such non-GAAP financial determined in accordance with accounting principles information is useful to investors to assist in assessing and generally accepted in the United States (“GAAP”), the understanding the company’s operating performance and company also provides certain non-GAAP financial underlying trends in the company’s business because information relating to sales, operating income, net income management considers these items referred to above to attributable to shareholders, and net income per basic and be outside the company’s core operating results. This non- diluted share. GAAP financial information is among the primary indicators management uses as a basis for evaluating the The company provides sales, gross profit, and operating company’s financial and operating performance. In expenses as adjusted for the impact of changes in foreign addition, the company’s Board of Directors may use this currencies (referred to as changes in foreign currencies) non-GAAP financial information in evaluating by re-translating prior period results at current period management performance and setting management foreign exchange rates, the impact of dispositions by compensation. adjusting the company's operating results for businesses disposed, as if the dispositions had occurred at the The presentation of this additional non-GAAP financial beginning of the earliest period presented (referred to as information is not meant to be considered in isolation or dispositions), the impact of the company's personal as a substitute for, or alternative to, operating income, net computer and mobility asset disposition business income attributable to shareholders and net income per (referred to as wind down), the impact of inventory write- basic and diluted share determined in accordance with downs related to the digital business (referred to as “digital GAAP. Analysis of results and outlook on a non-GAAP inventory write-downs and recoveries”), and the impact of basis should be used as a complement to, and in the notes receivable reserves and inventory write-downs conjunction with, data presented in accordance with related to the AFS business (referred to as “AFS notes GAAP. receivable reserves and credits” and “AFS inventory write- downs and recoveries,” respectively). Operating income, net income attributable to shareholders, and net income per basic and diluted share are adjusted to exclude The company believes that identifiable intangible asset amortization, restructuring, integration, and other charges, loss on disposition of such non-GAAP financial businesses, net, AFS notes receivable reserves and credits and inventory write-downs and recoveries, digital information is useful to inventory write-downs and recoveries, the impact of non- cash charges related to goodwill, trade names, and long- investors to assist in lived assets, and the impact of wind down. Net income attributable to shareholders, and net income per basic and assessing and understanding diluted share are also adjusted to exclude pension settlements, net gains and losses on investments, and the company’s operating certain tax adjustments including related interest expense. A reconciliation of the company’s non-GAAP financial performance. information to GAAP is set forth in the tables below. investor.arrow.com 16
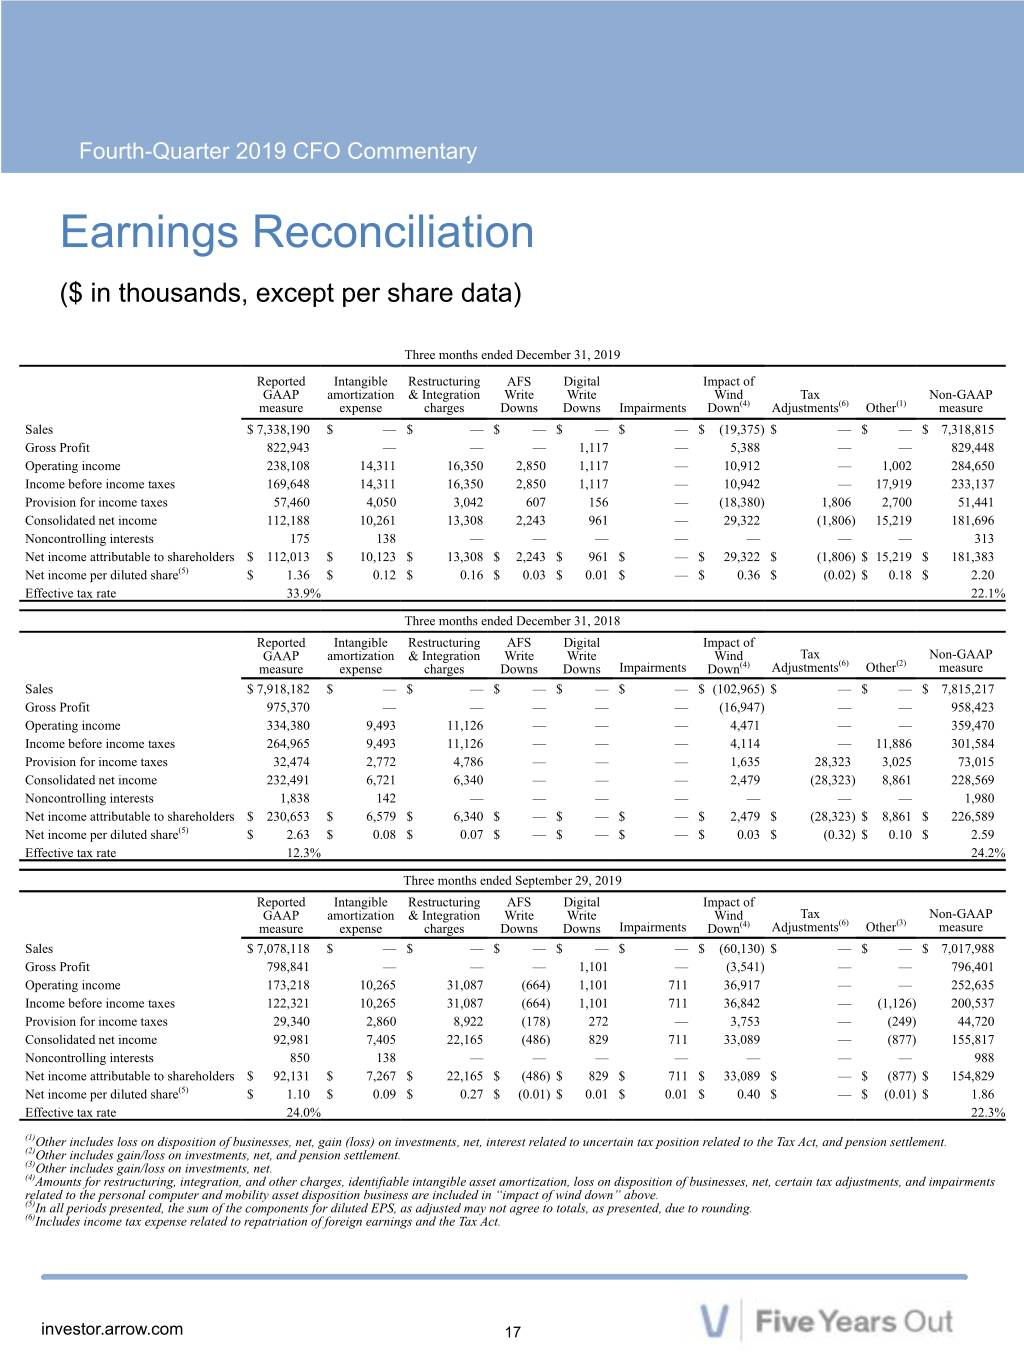

 
Fourth-Quarter 2019 CFO Commentary Earnings Reconciliation ($ in thousands, except per share data) Three months ended December 31, 2019 Reported Intangible Restructuring AFS Digital Impact of GAAP amortization & Integration Write Write Wind Tax Non-GAAP measure expense charges Downs Downs Impairments Down(4) Adjustments(6) Other(1) measure Sales $ 7,338,190 $ — $ — $ — $ — $ — $ (19,375) $ — $ — $ 7,318,815 Gross Profit 822,943 — — — 1,117 — 5,388 — — 829,448 Operating income 238,108 14,311 16,350 2,850 1,117 — 10,912 — 1,002 284,650 Income before income taxes 169,648 14,311 16,350 2,850 1,117 — 10,942 — 17,919 233,137 Provision for income taxes 57,460 4,050 3,042 607 156 — (18,380) 1,806 2,700 51,441 Consolidated net income 112,188 10,261 13,308 2,243 961 — 29,322 (1,806) 15,219 181,696 Noncontrolling interests 175 138 — — — — — — — 313 Net income attributable to shareholders $ 112,013 $ 10,123 $ 13,308 $ 2,243 $ 961 $ — $ 29,322 $ (1,806) $ 15,219 $ 181,383 Net income per diluted share(5) $ 1.36 $ 0.12 $ 0.16 $ 0.03 $ 0.01 $ — $ 0.36 $ (0.02) $ 0.18 $ 2.20 Effective tax rate 33.9% 22.1% Three months ended December 31, 2018 Reported Intangible Restructuring AFS Digital Impact of GAAP amortization & Integration Write Write Wind Tax Non-GAAP measure expense charges Downs Downs Impairments Down(4) Adjustments(6) Other(2) measure Sales $ 7,918,182 $ — $ — $ — $ — $ — $ (102,965) $ — $ — $ 7,815,217 Gross Profit 975,370 — — — — — (16,947) — — 958,423 Operating income 334,380 9,493 11,126 — — — 4,471 — — 359,470 Income before income taxes 264,965 9,493 11,126 — — — 4,114 — 11,886 301,584 Provision for income taxes 32,474 2,772 4,786 — — — 1,635 28,323 3,025 73,015 Consolidated net income 232,491 6,721 6,340 — — — 2,479 (28,323) 8,861 228,569 Noncontrolling interests 1,838 142 — — — — — — — 1,980 Net income attributable to shareholders $ 230,653 $ 6,579 $ 6,340 $ — $ — $ — $ 2,479 $ (28,323) $ 8,861 $ 226,589 Net income per diluted share(5) $ 2.63 $ 0.08 $ 0.07 $ — $ — $ — $ 0.03 $ (0.32) $ 0.10 $ 2.59 Effective tax rate 12.3% 24.2% Three months ended September 29, 2019 Reported Intangible Restructuring AFS Digital Impact of GAAP amortization & Integration Write Write Wind Tax Non-GAAP measure expense charges Downs Downs Impairments Down(4) Adjustments(6) Other(3) measure Sales $ 7,078,118 $ — $ — $ — $ — $ — $ (60,130) $ — $ — $ 7,017,988 Gross Profit 798,841 — — — 1,101 — (3,541) — — 796,401 Operating income 173,218 10,265 31,087 (664) 1,101 711 36,917 — — 252,635 Income before income taxes 122,321 10,265 31,087 (664) 1,101 711 36,842 — (1,126) 200,537 Provision for income taxes 29,340 2,860 8,922 (178) 272 — 3,753 — (249) 44,720 Consolidated net income 92,981 7,405 22,165 (486) 829 711 33,089 — (877) 155,817 Noncontrolling interests 850 138 — — — — — — — 988 Net income attributable to shareholders $ 92,131 $ 7,267 $ 22,165 $ (486) $ 829 $ 711 $ 33,089 $ — $ (877) $ 154,829 Net income per diluted share(5) $ 1.10 $ 0.09 $ 0.27 $ (0.01) $ 0.01 $ 0.01 $ 0.40 $ — $ (0.01) $ 1.86 Effective tax rate 24.0% 22.3% (1)Other includes loss on disposition of businesses, net, gain (loss) on investments, net, interest related to uncertain tax position related to the Tax Act, and pension settlement. (2)Other includes gain/loss on investments, net, and pension settlement. (3)Other includes gain/loss on investments, net. (4)Amounts for restructuring, integration, and other charges, identifiable intangible asset amortization, loss on disposition of businesses, net, certain tax adjustments, and impairments related to the personal computer and mobility asset disposition business are included in “impact of wind down” above. (5)In all periods presented, the sum of the components for diluted EPS, as adjusted may not agree to totals, as presented, due to rounding. (6)Includes income tax expense related to repatriation of foreign earnings and the Tax Act. investor.arrow.com 17