ASTEC INDUSTRIES REPORTS FIRST QUARTER 2020 RESULTS
First Quarter 2020 Highlights (all comparisons are made to the prior year first quarter):
|
•
|
Net Sales decreased 11.3% to $288.8M
|
|
•
|
Gross margin of 25.6 % increased 200 bps
|
|
•
|
EPS of $0.91 compared to $0.63 a year ago; adjusted EPS of $1.00 increased 53.8%; $0.42 benefit to EPS attributed to the CARES
Act
|
|
•
|
Adjusted EBITDA of $24.3M decreased 4.7%; adjusted EBITDA margin of 8.4% increased 60 bps
|
|
•
|
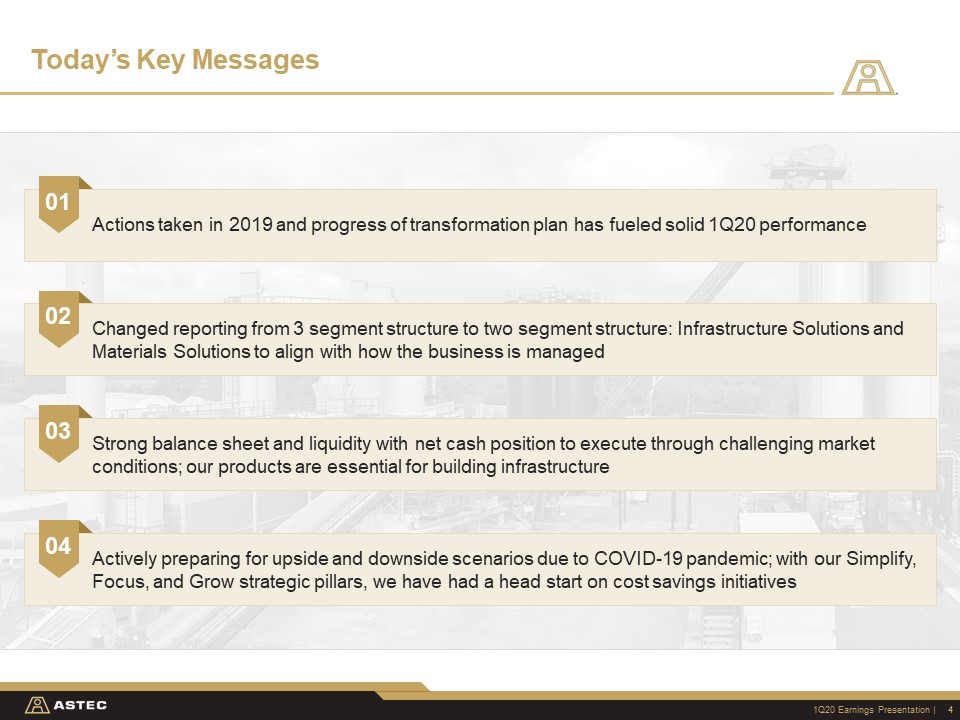
Simplified operations into two business segments: Infrastructure Solutions and Materials Solutions
|
CHATTANOOGA, Tenn. (May 6, 2020) – Astec Industries, Inc. (Nasdaq: ASTE) announced today its financial results for first quarter 2020 ending March 31,
2020.
First quarter of 2020 net sales of $288.8 million decreased 11.3% compared to $325.8 million for the first quarter of 2019. Domestic sales of $233.9
million decreased 11.0% from $262.9 million a year ago, while international sales of $55.0 million decreased 12.7% from $63.0 million in the first quarter of 2019. The domestic sales decreased as dealers were slow to convert rentals to retail sales
and the pace of restocking orders. International sales declined primarily as a result of the COVID-19-related softness, the wildfires in Australia and the temporary shutdown of our Johannesburg, South Africa and Omagh, Northern Ireland facilities
nearing the end of March. Excluding the impact of foreign currency, net sales decreased 10.5%.
Backlog as of March 31, 2020 of $245.4 million increased by $8.9 million, or 3.8% compared to the backlog of $236.5 million a year ago. An increase in the
backlog of Infrastructure Solutions was partially offset by a decline in Materials Solutions. Domestic backlog increased by 14.4% to $185.2 million from $161.8 million in 2019. International backlog of $60.2 million decreased compared to $74.7
million last year.
Operating income of $15.1 million in the first quarter of 2020 decreased 16.7% compared $18.2 million in the first quarter 2019. In relation to the
company’s efforts to simplify the organization, the company incurred a $1.1 million pre-tax restructuring charge and a pre-tax goodwill impairment charge of $1.6 million. These restructuring items were related to the closing of our Albuquerque
facility, employee severance payments and the transfer of CEI products to Chattanooga, Tennessee and Burlington, Wisconsin sites. The goodwill impairment charge was in the Infrastructure Solutions group. First quarter of 2020 adjusted operating
income of $17.9 million, decreased 4.5% compared to $18.7 million a year ago. Adjusted operating margin of 6.2% increased 50 basis points from 5.7% in first quarter 2019 largely driven by a 200 basis point improvement in gross margin due to our
transformation initiatives put in place beginning in late 2019. SG&A expenses declined 3.4% on a dollar basis but increased 150 basis points as a percent of net sales to 19.4% from 17.9% in the first quarter of 2019 due primarily to the decline
in sales, partially offset by cost savings related to the company’s strategic transformation.
Adjusted EBITDA of $24.3 million decreased 4.7% compared to $25.5 million a year ago. Adjusted EBITDA margin of 8.4% increased 60 basis points from 7.8%
in first quarter 2019.
The company reported a tax benefit of $5.1 million and on an adjusted basis the tax benefit was $4.5 million compared to a tax expense of $3.8 million a
year ago. The tax benefit resulted from use of NOL carryback as allowed by the CARES Act, leading to a $9.5 million tax reduction in the quarter. Excluding this reduction, our tax expense would have been $4.3 million for an effective tax rate of 28%.
Net income of $20.6 million, or $0.91 per diluted share, compared to net income of $14.3 million, or $0.63 per diluted share, for the first quarter of
2019. Excluding restructuring charges and goodwill impairment charges mentioned above, adjusted net income of $22.7 million increased 53.7% compared to the same period a year ago. Adjusted EPS of $1.00 for the first quarter of 2020 increased 53.8%
compared to $0.65 for first quarter 2019; inclusive of $0.42 benefit to EPS attributed to the CARES Act.
Segment Reporting
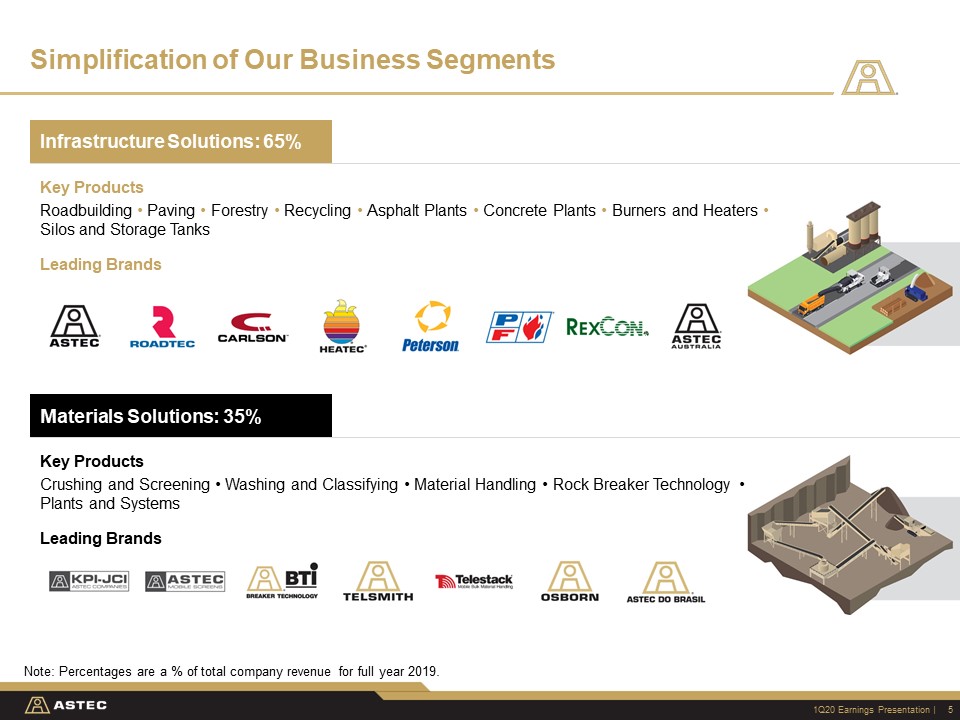
As part of the company’s continued transformation under its strategic pillars for profitable growth – Simplify, Focus and Grow, during the first quarter we
completed an internal reorganization into two segments and the company is now operated and managed on that basis. Infrastructure Solutions includes road building, asphalt and concrete plant equipment, thermal and storage solutions as well as wood
grinding equipment and Materials Solutions includes crushing and screening, washing and classifying, plants and systems and material handling equipment.
“During the first quarter, we made significant progress against our initiatives to simplify the organization, the team executed our transformation plans
despite the ongoing impact of COVID-19. The transition to a two-segment organizational structure ensures that our products are better aligned to our end markets and customers,” said Barry Ruffalo, CEO of Astec Industries, Inc. “First quarter
financial results also demonstrated traction on our strategic transformation with a 60 basis point expansion in adjusted EBITDA margin, despite the decrease in net sales, a direct result of the restructuring initiatives taken in 2019 and 2020. While
we remain cautious given the global pandemic, we are well positioned to navigate the economic challenges ahead of us with a more efficient organizational structure, a strong balance sheet and ample liquidity.”
We have provided a spreadsheet recasting two years of historical segment financials that have been made available under the Investor Relations section of
the Astec Industries, Inc. website.
COVID-19 Business Continuity and Operations Update
On April 1, 2020, Astec Industries issued a COVID-19 Business Update. In that update, we provided the measures we are taking to ensure the health and
wellbeing of our employees, their families and communities in which we operate, while continuing to serve our customers’ critical needs. Below is a COVID-related update by category:
Balance Sheet and Liquidity
The Company remains focused on liquidity and cash preservation. We ended the quarter with a net cash position of $43.9 million with total debt of $1.2
million. The Company has available liquidity in excess of $186.0 million as of March 31, 2020.
Operations
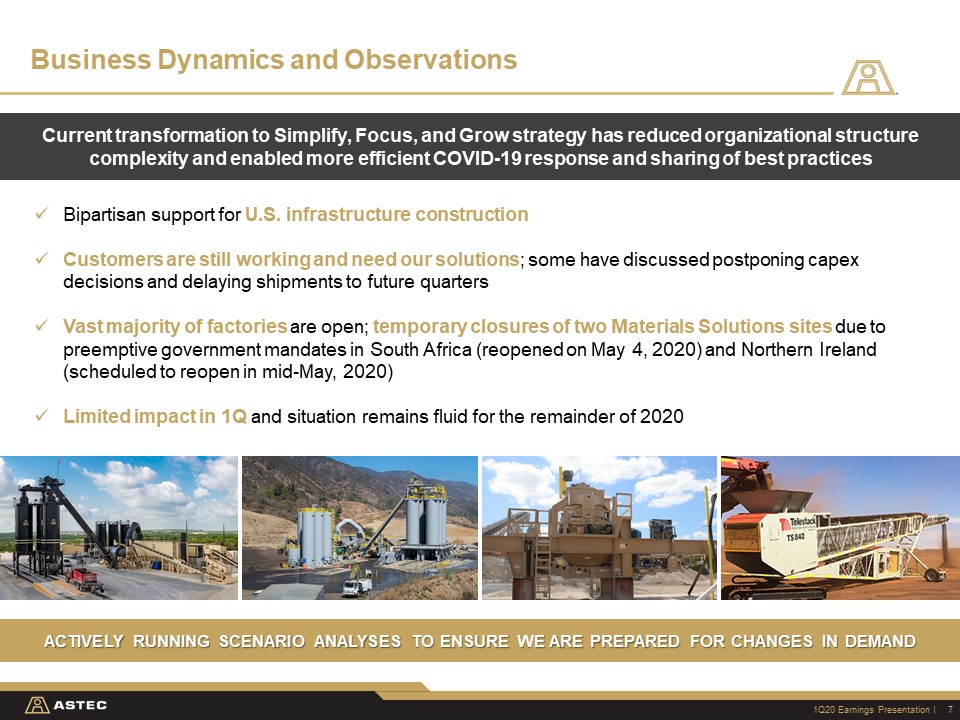
As of May 6, 2020, all but one of our facilities, Omagh, Northern Ireland, are operational and able to meet current demand levels. We continue to
manufacture our products, as they are deemed essential to building and maintaining the infrastructure used to move goods to market, facilitate the transportation needs of communities and for public health and safety.
During the first quarter of 2020, we experienced a temporary suspension of operations at two of our facilities, Johannesburg, South Africa, and Omagh,
Northern Ireland, in observance of government mandates. These two facilities were closed for approximately one month. South Africa resumed
operations on May 4, 2020 and our Omagh plans to resume operations by mid-May, 2020.
Supply Chain
We have not experienced any interruption to our supply chain and are able to source the necessary materials needed to meet our customers’ needs. We are
closely monitoring our supply chain and are ready to take proactive actions as needed to mitigate any potential disruptions. We have increased the frequency of communications with our suppliers and customers to ensure business continuity, anticipate,
and prepare for any new developments.
Cost Management
We have implemented additional actions to help mitigate the financial and operations impacts of COVID-19, including reducing expenses and conserving cash.
These actions include:
|
•
|
Suspension of all hiring, except for critical positions
|
|
•
|
Discretionary spending reductions
|
|
•
|
Working capital management to ensure efficient accounts receivable processing with our customers
|
|
•
|
Reductions in force as appropriate
|
Mr. Ruffalo continued, “I am proud of how our team members have adapted to the quickly changing environment. As an organization, we took immediate actions
to effectively and efficiently cope with the challenges and we are taking additional proactive steps to help mitigate the impact of COVID-19 while maintaining financial flexibility. I look forward to emerging from the COVID-19 pandemic a stronger
organization as a result.”
Investor Conference Call and Web Simulcast
Astec will conduct a conference call and live webcast today, May 6, 2020, at
10:00 A.M. Eastern Time, to review its first quarter 2020 results as well as current business conditions. The number to call for this interactive teleconference is (877) 407-9210 (at least 10 minutes prior to the scheduled time for the call).
International callers should dial (201) 689-8049. You may also access a live webcast of the call by visiting www.webcaster4.com/Webcast/Page/2146/34348 . You will need to give your name and company affiliation and reference Astec Industries.
An archived webcast will be available for ninety days at www.astecindustries.com.
A replay of the conference call will be available through May 20, 2020 by dialing (877) 481-4010 or (919) 882-2331 for international callers, Conference ID
# 34348. A transcript of the conference call will be made available under the Investor Relations section of the Astec Industries, Inc. website within five business days after the call.
About Astec Industries, Inc.
Astec Industries, Inc., (www.astecindustries.com), is a
manufacturer of specialized equipment for asphalt road building, aggregate processing and concrete production. Astec’s manufacturing operations are divided into two primary business segments: Infrastructure Solutions that includes road building,
asphalt and concrete plant, thermal and storage solutions; and Materials Solutions that include our aggregate processing and mining equipment.
Forward-Looking Statements
The information contained in this presentation and discussion contains “forward-looking statements” (within the meaning of the Private Securities
Litigation Reform Act of 1995) regarding the future performance of the Company, including statements about the effects on the Company from (i) restructuring initiatives, (ii) changes in the business segments (iii) the effect of changes in backlog
(iv) the potential sale of the Enid (GEFCO) business, (iii) increases in international demand, (iv) domestic and international product demand in North America , and (v) the impacts of the coronavirus (COVID-19) on the Company’s financial condition
and business operations. These forward-looking statements reflect management’s expectations and are based upon currently available information, and the Company undertakes no obligation to update or revise such statements. These statements are not
guarantees of performance and are inherently subject to risks and uncertainties, many of which cannot be predicted or anticipated. Future events and actual results, financial or otherwise, could differ materially from those expressed in or implied by
the forward-looking statements. Important factors that could cause future events or actual results to differ materially include: general uncertainty in the economy, oil, gas and liquid asphalt prices, rising steel prices, decreased funding for
highway projects, the relative strength/weakness of the dollar to foreign currencies, production capacity, general business conditions in the industry, demand for the Company’s products, seasonality and cyclicality in operating results, seasonality
of sales volumes or lower than expected sales volumes, lower than expected margins on custom equipment orders, competitive activity, tax rates and the impact of future legislation thereon, and those other factors listed from time to time in the
Company’s reports filed with the Securities and Exchange Commission, including but not limited to the Company’s annual report on Form 10-K for the year ended December 31, 2019.
For Additional Information Contact:
Steve Anderson
Senior Vice President of Administration and Investor Relations
Phone: (423) 899-5898
Fax: (423) 899-4456
E-mail:
[email protected]