Astec Industries, Inc.
1725 Shepherd Rd.
Chattanooga TN 37421
News Release
ASTEC INDUSTRIES REPORTS FOURTH QUARTER AND FULL YEAR 2019 RESULTS
Fourth Quarter 2019 Highlights (all comparisons are made to the prior year fourth quarter):
|
•
|
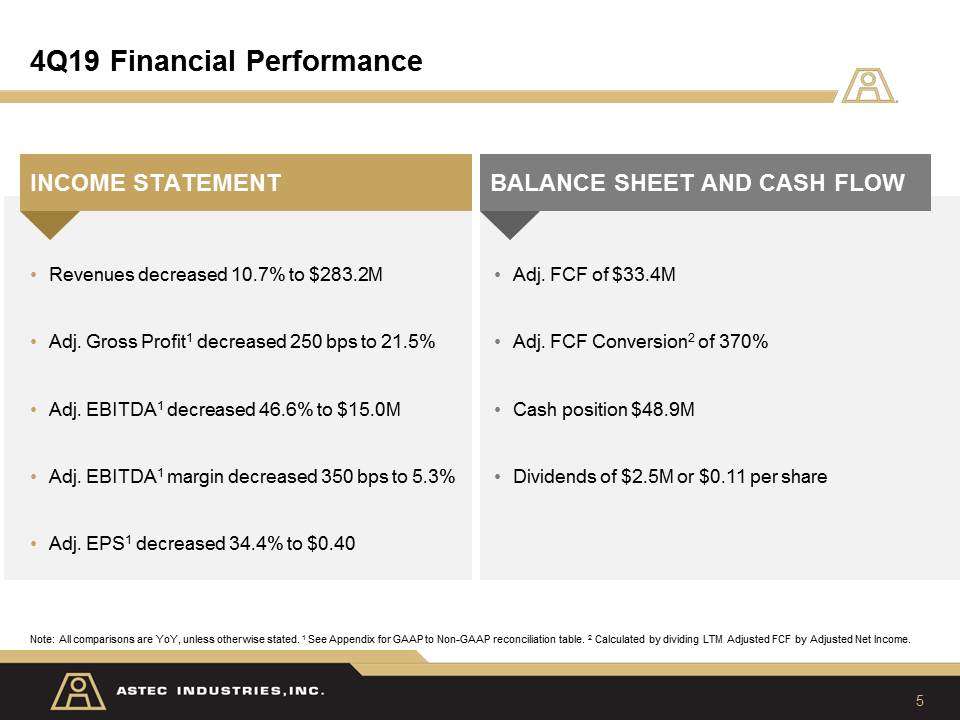
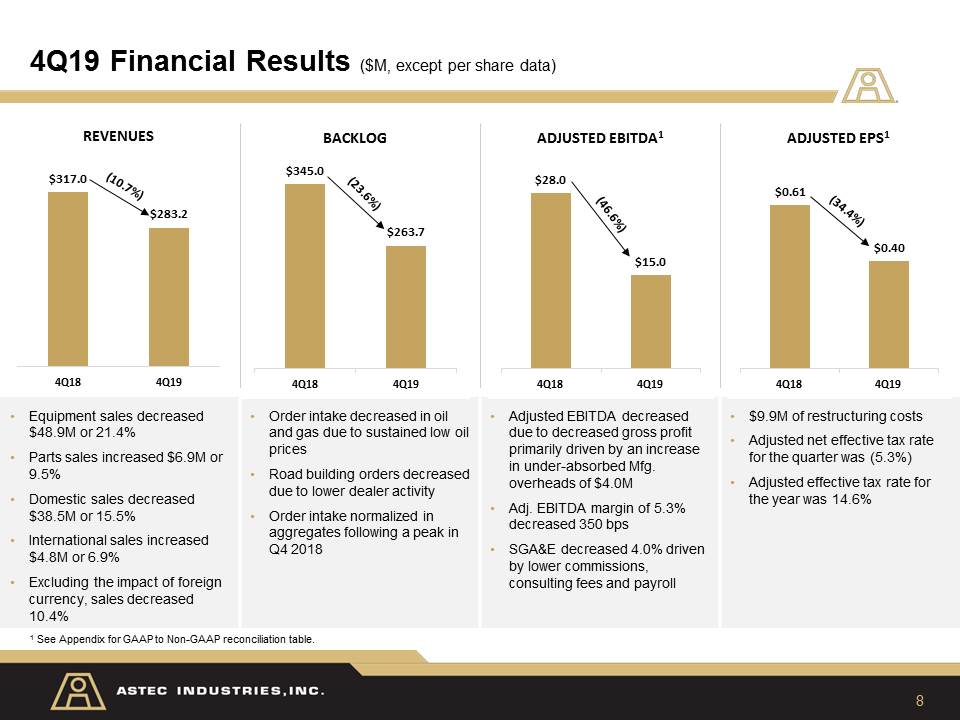
Net Sales decreased 10.7% to $283.2M
|
|
•
|
Gross profit of 12.2%; adjusted gross profit of 21.5% decreased 250bps
|
|
•
|
EPS loss of $0.85; adjusted EPS of $0.40 decreased from $0.61 a year ago
|
|
•
|
Adjusted EBITDA of $15.0M decreased 46.6%; adjusted EBITDA margin of 5.3% declined 350bps
|
2019 Highlights (all comparisons are made to the prior year):
|
•
|
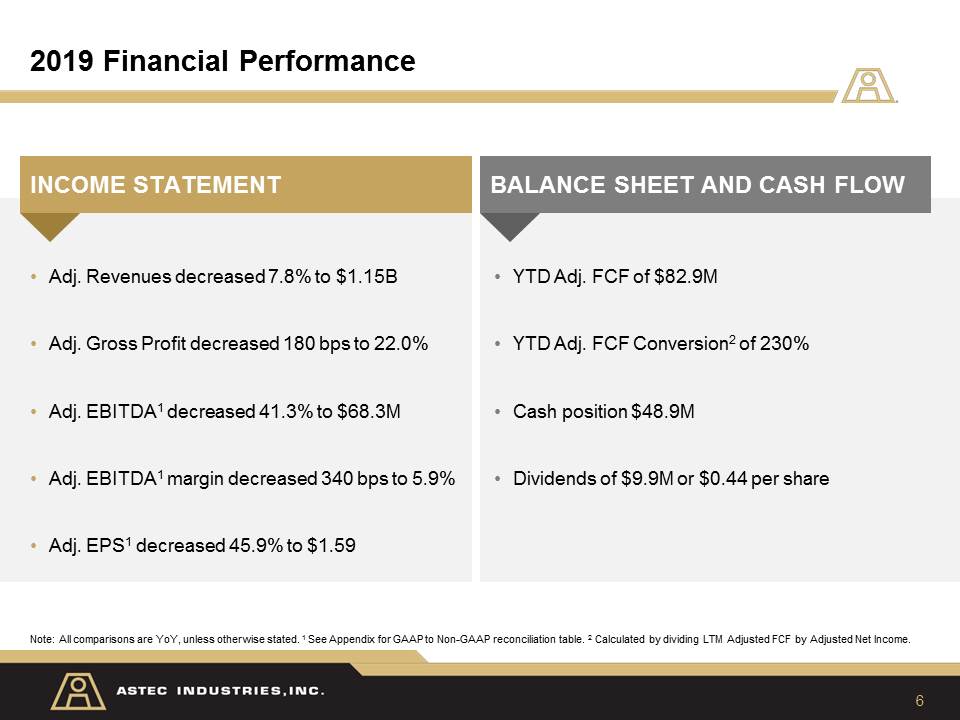
Net sales were relatively flat; adjusted net sales decreased 7.8% to $1.15B
|
|
•
|
Gross profit of 21.1%; adjusted gross profit of 22.0% decreased 180bps
|
|
•
|
EPS of $0.95; adjusted EPS of $1.59 decreased from $2.94 a year ago
|
|
•
|
Adjusted EBITDA of $68.3M decreased 41.3%; adjusted EBITDA margin of 5.9% declined 340bps
|
|
•
|
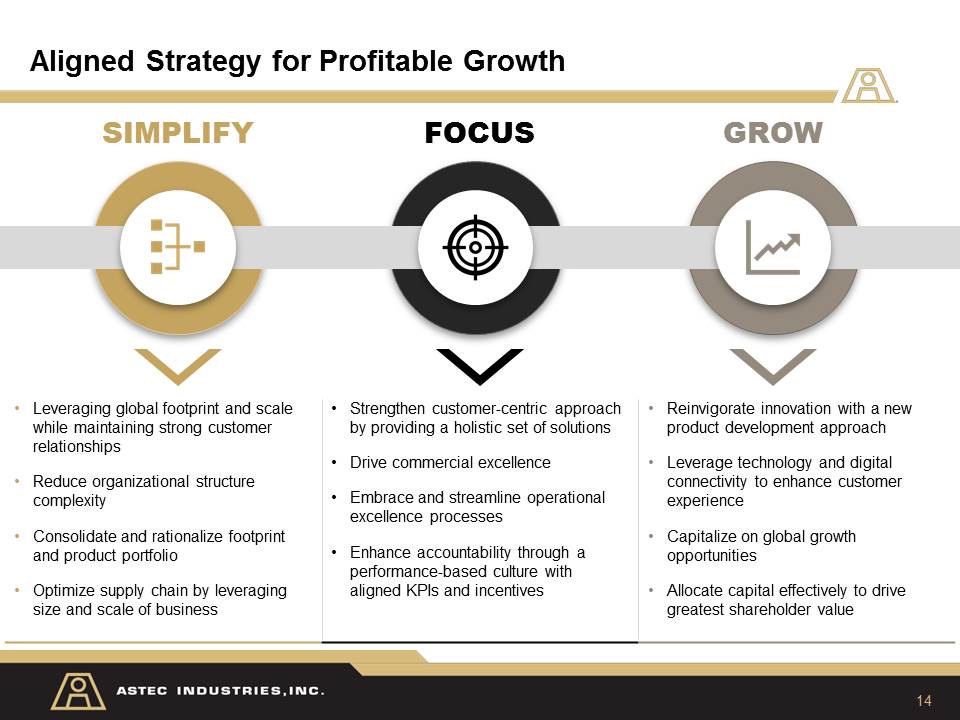
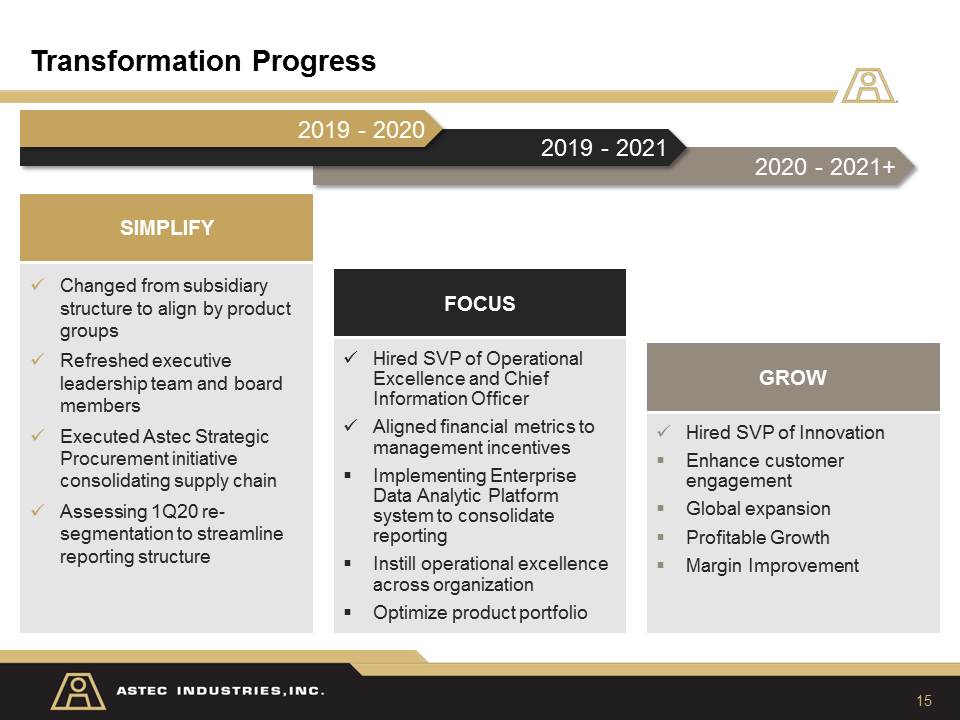
Began restructuring initiatives related to strategic pillars for profitable growth – Simplify, Focus and Grow
|
CHATTANOOGA, Tenn. (March 3, 2020) – Astec Industries, Inc. (Nasdaq: ASTE) announced today its financial results for fourth quarter and full-year ended
December 31, 2019.
Fourth Quarter 2019 Results
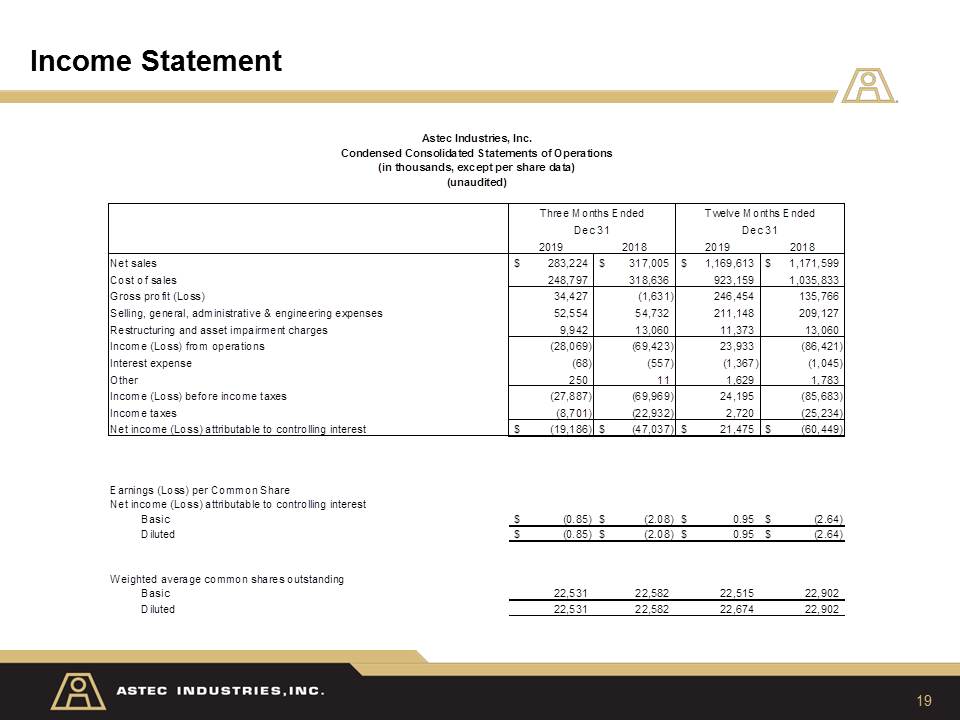
Fourth quarter net sales of $283.2 million decreased 10.7% compared to $317.0 million for the fourth quarter of 2018. Domestic sales of $209.6 million
decreased 15.5% from $248.2 million a year ago, while International sales of $73.6 million increased 7.0% from $68.8 million in the fourth quarter of 2018. Excluding the impact of foreign currency, net sales decreased 10.4%.
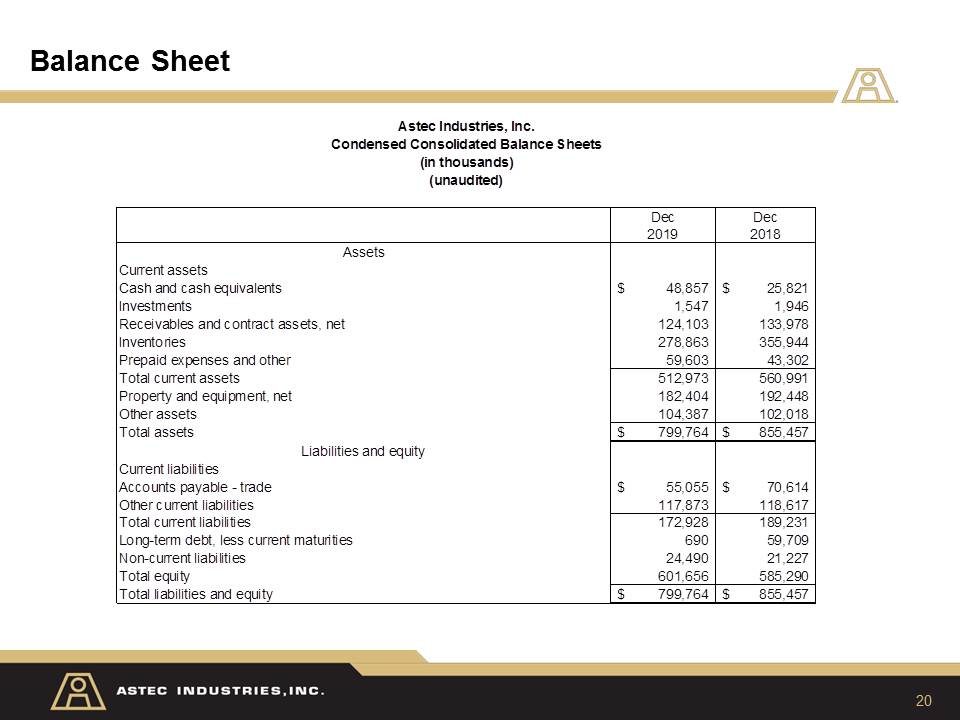
Backlog as of December 31, 2019 of $263.7 million decreased by $81.3 million, or 23.6% compared to the backlog of $344.9 million a year ago. Domestic
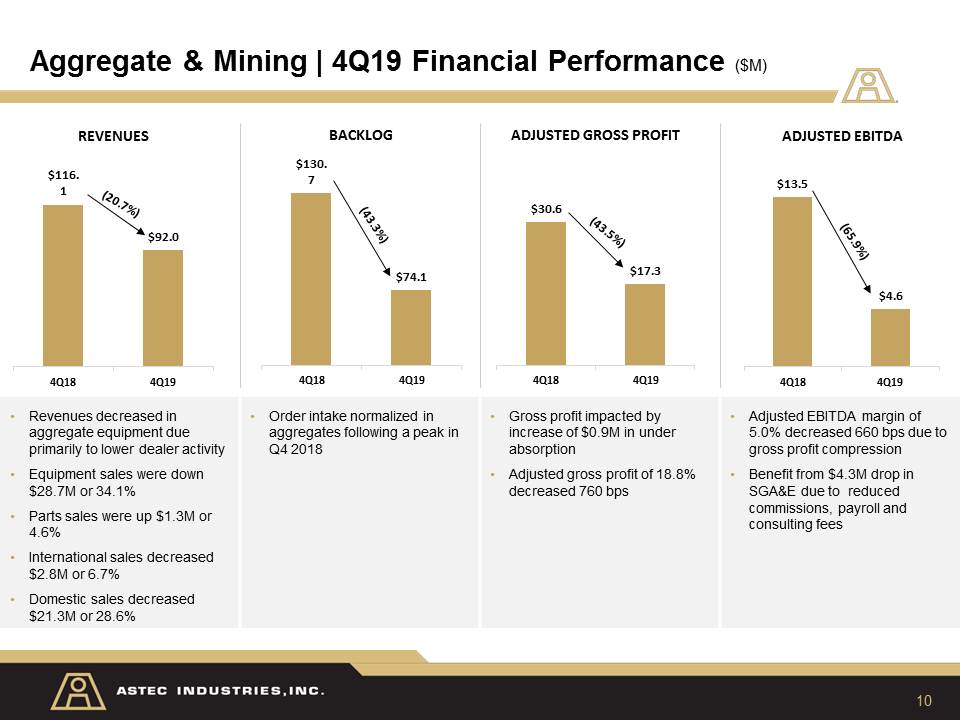
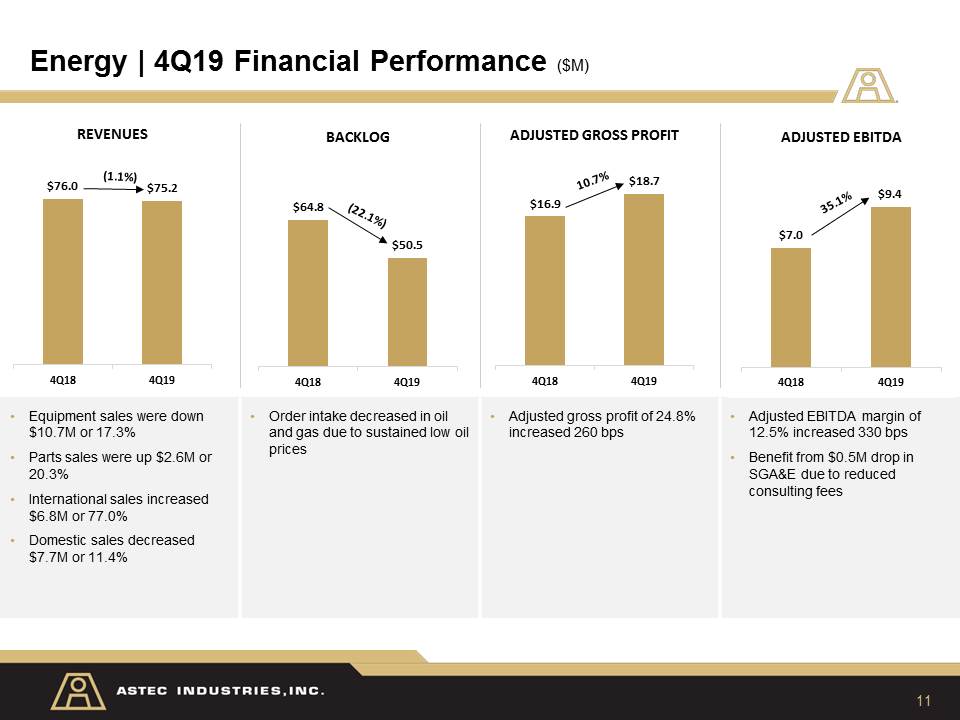
backlog decreased by 25.4% to $194.5 million from $260.7 million in 2018. International backlog of $69.2 million decreased compared to $84.2 million last year. Although we experienced a decline in each segment, weakness was concentrated in the
Aggregate and Mining Group as dealers had increased their inventory levels throughout 2018 to meet demand but then began to destock in 2019.
An operating loss of $28.1 million compared to a loss of $69.4 million in the fourth quarter 2018. In relation to the company’s efforts to simplify the
organization, the company incurred a $9.9 million pre-tax restructuring charge, or $0.34 per diluted share for the fourth quarter. The restructuring items are related to the expected sale of the GEFCO subsidiary, closure of our German operation and
the transfer of the CEI products to Heatec and RexCon. In the fourth quarter of 2019, after considering new management’s revised inventory control and working capital
control objectives and the Company’s assessment of the age, quantities on hand, market acceptance of the equipment, and other related factors, it was determined that various specific equipment models in each of the Company’s business units required
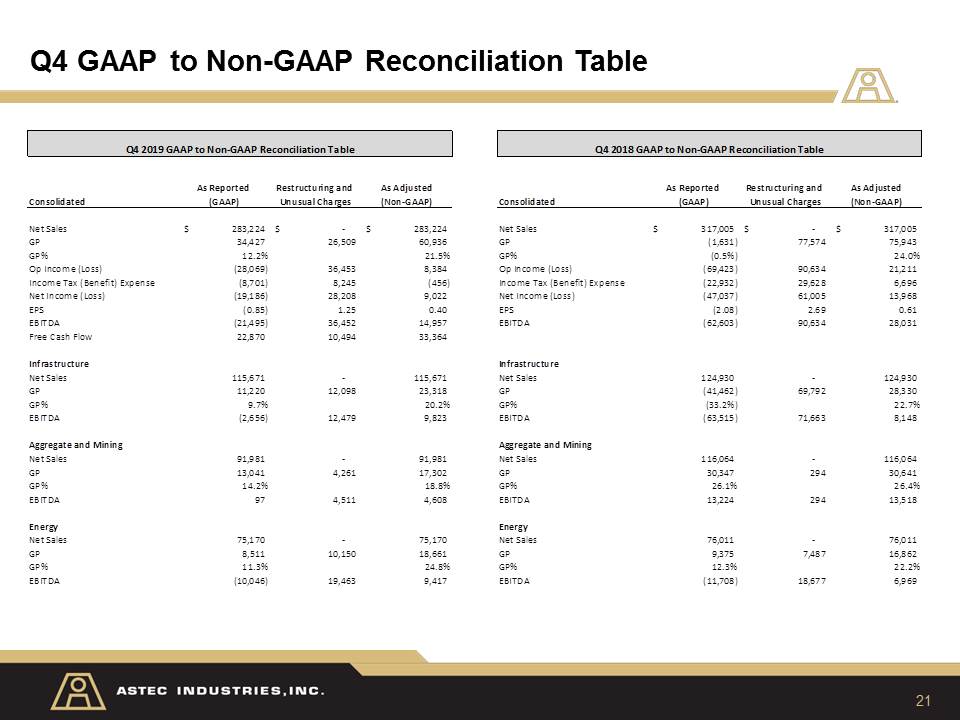
additions to their net realizable value reserves. The fourth quarter results include a pre-tax inventory write-down of $26.5 million or $0.91 per diluted share. Fourth quarter adjusted operating income of $8.4 million decreased 60.5%
compared to $21.2 million a year ago. Adjusted operating margin of 3.0% declined 370 basis points from 6.7% in fourth quarter 2018. Adjusted operating income declined primarily due to the lower volumes. SGA&E expenses declined 4.0% on a
dollar basis but increased as a percent of sales 130 basis points to 18.6% from 17.3% in the fourth quarter of 2018 due to the decline in sales.
Adjusted EBITDA of $15.0 million decreased 46.6% compared to $28.0 million a year ago. Adjusted EBITDA margin of 5.3% declined 350 basis points from 8.8%
in fourth quarter 2018.
Net loss of $19.2 million or $0.85 per diluted share, compared to a net loss of $47.0 million or $2.08 per diluted share for the fourth quarter of 2018.
Excluding unusual items and restructuring charges mentioned above, adjusted net income of $9.0 million decreased 35.4% compared to the same period a year ago. Adjusted EPS of $0.40 decreased 34.4% compared to $0.61 last year.
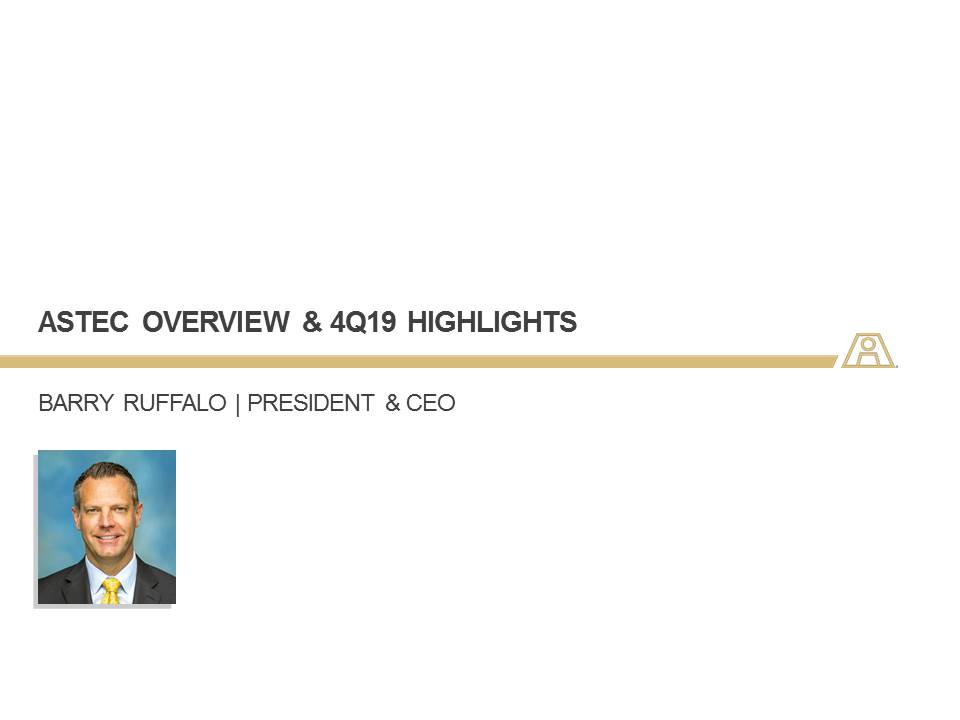
“Fourth quarter results showed continued softness in North America that was partially offset by an increase in international sales. Despite the temporary
headwinds, I am encouraged by the progress we are making towards our strategic initiatives to Simplify, Focus and Grow the organization,” stated Barry Ruffalo, CEO of Astec Industries, Inc. “As recently announced, we are in the process of marketing
the GEFCO business for sale. This will further simplify the organization, strengthen our financial position and release additional capital to deploy toward strategic growth opportunities. Additionally, we have taken important steps to restructure
the company and streamline business units to increase internal transparency and improve the decision-making process. These collective actions are important in building the foundation for the future success of Astec Industries.”
Full Year 2019 Results
Net sales for 2019 were $1,169.6 million, or relatively flat when compared to 2018. Domestic sales decreased 0.8% to $908.5 million from $915.8 million a
year ago, while International sales increased 2.1% to $261.1 million from $255.8 million in 2018. Excluding the impact of foreign currency, net sales increased 0.5%.
Operating income of $23.9 million compares to a loss of $86.4 million in 2018. The company incurred a total of $37.9 million in pre-tax restructuring
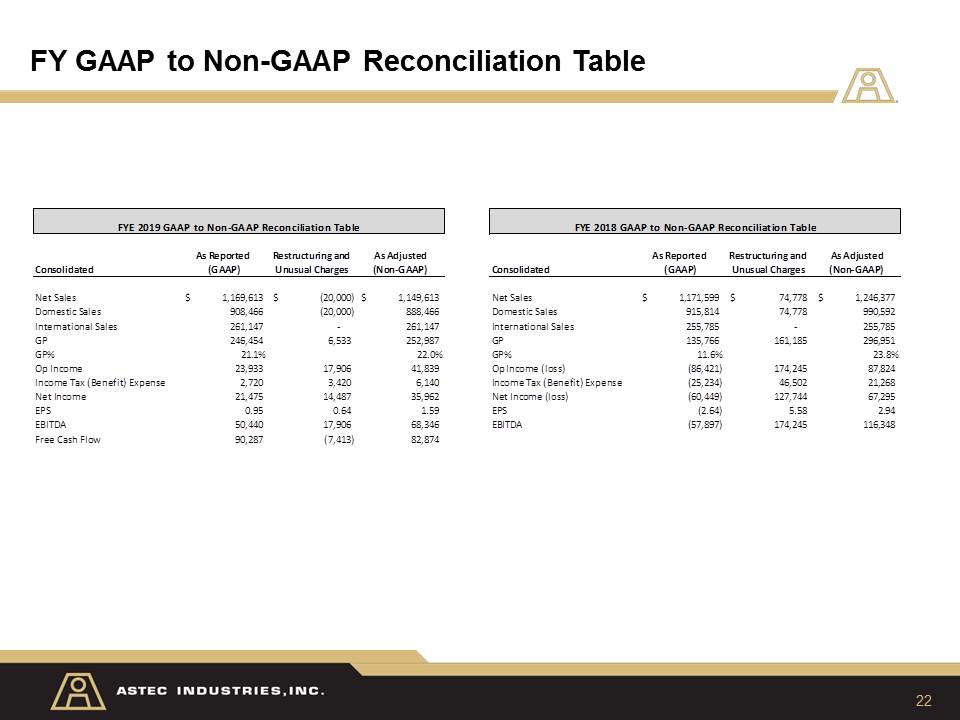
charges and inventory write-downs for 2019, or $1.36 per diluted share. Adjusted operating income of $41.8 million decreased 52.4% compared to $87.8 million in 2018. Adjusted operating margin of 3.6% declined 340 basis points from 7.0% in 2018.
Adjusted operating income declined primarily because of a reduction in gross margin of 180 basis points to 22.0% from 23.8% in 2018.
Adjusted EBITDA of $68.3 million decreased 41.3% compared to $116.3 million in 2018. Adjusted EBITDA margin of 5.9% declined 340 basis points from 9.3% in
2018.
Net income of $21.5 million or $0.95 per diluted share, compared to a net loss of $60.4 million or $2.64 per diluted share in 2018. Adjusted net income of
$36.0 million decreased 46.6% compared to 2018. Adjusted EPS of $1.59 decreased 45.9% compared to $2.94 last year.
The Company identified certain material weaknesses in its internal control over financial reporting. As a result, the Company needs additional time to
complete the compilation of information and finalization of its assessment of the effectiveness of internal control over financial reporting for its consolidated financial statements and related disclosures to be filed as part of the 2019 Form 10-K.
The Company has filed a Form 12b-25 with the Securities and Exchange Commission in order to extend the due date of its 2019 Annual Report on Form 10-K for 15 days, as permitted by Rule 12b-25 under the Securities Exchange Act.
Investor Conference Call and Web Simulcast
Astec will conduct a conference call and live webcast today, March 4, 2020, at 10:00 A.M. Eastern Time, to review its fourth quarter and year end results
as well as current business conditions. The number to call for this interactive teleconference is (877) 407-9210 (at least 10 minutes prior to the scheduled time for the call). International callers should dial (201) 689-8049. You may also access a
live webcast of the call by visiting https//www.webcaster4.com/Webcast/Page/2146/33412. You will need to give your name and company affiliation and reference Astec
Industries. An archived webcast will be available for ninety days at www.astecindustries.com.
A replay of the conference call will be available through March 17, 2020 by dialing (877) 481-4010, or (919) 882-2331 for international callers, Conference
ID #33412. A transcript of the conference call will be made available under the Investor Relations section of the Astec Industries, Inc. website within 5 business days after the call.
About Astec Industries, Inc.
Astec Industries, Inc., (www.astecindustries.com), is a
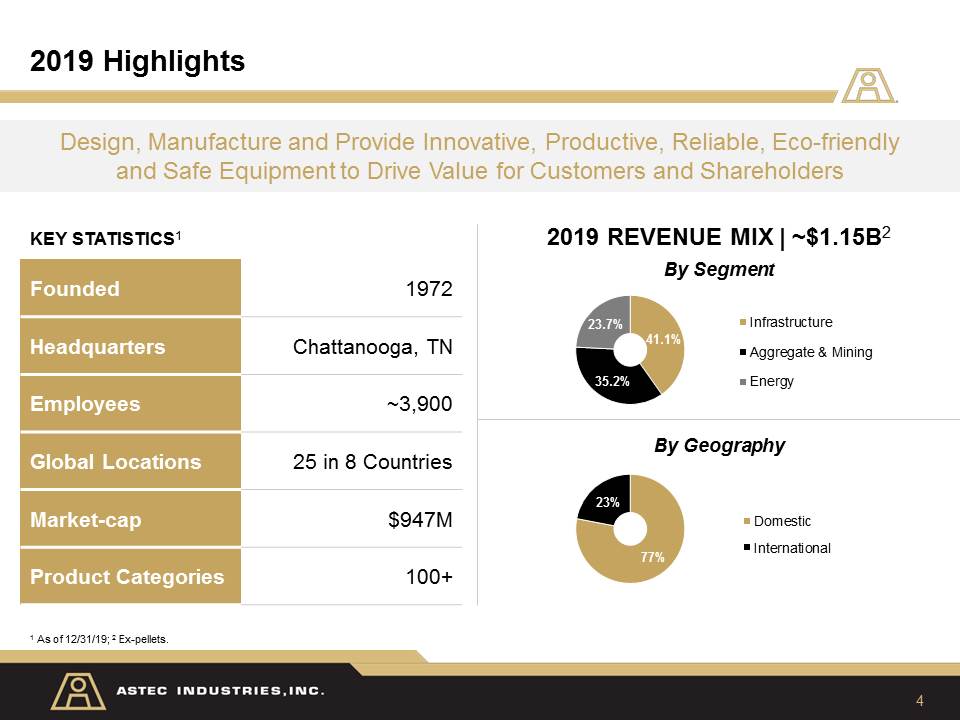
manufacturer of specialized equipment for asphalt road building, aggregate processing and concrete production. Astec’s manufacturing operations are divided into three primary business segments: road building, (Infrastructure Group); aggregate
processing and mining equipment (Aggregate and Mining Group); and a diversified portfolio of equipment used in various industries including energy-related markets (Energy Group).
Forward-Looking Statements
The information contained in this press release contains “forward-looking statements” (within the meaning of the Private Securities Litigation Reform Act
of 1995) regarding the future performance of the Company, including statements about the effects on the Company from (i) restructuring initiatives, (ii) the potential sale of the GEFCO business, (iii) increases in international demand, and (iv)
product demand in North America. These forward-looking statements reflect management’s expectations and are based upon currently available information, and the Company undertakes no obligation to update or revise such statements. These statements
are not guarantees of performance and are inherently subject to risks and uncertainties, many of which cannot be predicted or anticipated. Future events and actual results, financial or otherwise, could differ materially from those expressed in or
implied by the forward-looking statements. Important factors that could cause future events or actual results to differ materially include: general uncertainty in the economy, oil, gas and liquid asphalt prices, rising steel prices, decreased
funding for highway projects, the relative strength/weakness of the dollar to foreign currencies, production capacity, general business conditions in the industry, demand for the Company’s products, seasonality and cyclicality in operating results,
seasonality of sales volumes or lower than expected sales volumes, lower than expected margins on custom equipment orders, competitive activity, tax rates and the impact of future legislation thereon, and those other factors listed from time to time
in the Company’s reports filed with the Securities and Exchange Commission, including but not limited to the Company’s annual report on Form 10-K for the year ended December 31, 2018.
For Additional Information Contact:
Steve Anderson
Senior Vice President Administration, Investor Relations & Corporate Secretary
Phone: (423) 899-5898
Fax: (423) 899-4456
E-mail:
[email protected]