UNITED STATES
SECURITIES AND EXCHANGE COMMISSION
Washington, DC 20549
FORM
CURRENT REPORT
Pursuant to Section 13 or 15(d) of the
Securities Exchange Act of 1934
Date of report (Date of earliest event
reported):
(Exact Name of Registrant as Specified in Charter)
| (State or Other Jurisdiction | (Commission | (I.R.S. Employer |
| of Incorporation) | File Number) | Identification No.) |
(Address of Principal Executive Offices) (Zip Code)
(
Registrant’s Telephone Number, Including Area Code
(Former Name or Former Address, if Changed Since Last Report)
Check the appropriate box below if the Form 8-K filing is intended to simultaneously satisfy the filing obligation of the registrant under any of the following provisions:
| Written communications pursuant to Rule 425 under the Securities Act (17 CFR 230.425) |
| Soliciting material pursuant to Rule 14a-12 under the Exchange Act (17 CFR 240.14a-12) |
| Pre-commencement communications pursuant to Rule 14d-2(b) under the Exchange Act (17 CFR 240.14d-2(b)) |
| Pre-commencement communications pursuant to Rule 13e-4(c) under the Exchange Act (17 CFR 240.13e-4(c)) |
Securities registered pursuant to Section 12(b) of the Act:
| Title of each class | Trading symbol(s) | Name of each exchange on which registered | ||
Indicate by check mark whether the registrant is an emerging growth company as defined in Rule 405 of the Securities Act of 1933 (§230.405 of this chapter) or Rule 12b-2 of the Securities Exchange Act of 1934 (§240.12b-2 of this chapter).
Emerging growth company
If an emerging growth company, indicate by check mark if the registrant has elected not to use the extended transition period for complying with any new or revised financial accounting standards provided pursuant to Section 13(a) of the Exchange Act. ¨
| Item 2.02 | Results of Operations and Financial Condition. |
On November 7, 2024, Astrana Health, Inc. (the “Company”) issued a press release announcing its financial results for the three and nine months ended September 30, 2024. A copy of the press release and supplemental data is furnished with this Current Report on Form 8-K as Exhibit 99.1 and Exhibit 99.2, respectively, and incorporated herein by reference.
In accordance with General Instruction B.2 of Form 8-K, the information furnished pursuant to this Item 2.02, including Exhibit 99.1 and Exhibit 99.2 furnished herewith, shall not be deemed “filed” for purposes of Section 18 of the Securities Exchange Act of 1934, as amended (the “Exchange Act”), nor shall it be deemed incorporated by reference in any filing under the Securities Act of 1933, as amended, or the Exchange Act, except as shall be expressly set forth by specific reference in such filing.
| Item 9.01 | Financial Statements and Exhibits. |
(d) Exhibits.
| Exhibit No. | Description | |
| 99.1 | Press Release of Astrana Health, Inc. Regarding its Financial Results for the Three and Nine Months Ended September 30, 2024, dated November 7, 2024. | |
| 99.2 | Supplemental Data of Astrana Health, Inc., dated November 7, 2024. | |
| 104 | Cover Page Interactive Data File (the cover page XBRL tags are embedded within the inline XBRL document). |
SIGNATURES
Pursuant to the requirements of the Securities Exchange Act of 1934, the registrant has duly caused this report to be signed on its behalf by the undersigned hereunto duly authorized.
| ASTRANA HEALTH, INC. | ||
| Date: November 7, 2024 | By: | /s/ Brandon K. Sim |
| Name: | Brandon K. Sim | |
| Title: | Chief Executive Officer and President | |
Exhibit 99.1
Astrana Health, Inc. Reports Third Quarter 2024 Results
Company to Host Conference Call on Thursday, November 7, 2024, at 2:30 p.m. PT/5:30 p.m. ET
ALHAMBRA, Calif., November 7, 2024 /PRNewswire/ -- Astrana Health, Inc. (“Astrana,” and together with its subsidiaries and affiliated entities, the “Company”) (NASDAQ: ASTH), a leading provider-centric, technology-powered healthcare company enabling providers to deliver accessible, high-quality, and high-value care to all, today announced its consolidated financial results for the third quarter ended September 30, 2024.
"Astrana's strong third quarter continues to reflect the outcomes we are driving with the Astrana care model and value-based care enablement platform. We continued to see strong organic and inorganic growth across our businesses while delivering high-quality care and managing costs effectively in the quarter. We are confident in our platform’s ability to continue improving access, quality, and coordination of care for around 1.1 million patients in local communities nationwide,” said President and CEO of Astrana, Brandon K. Sim.
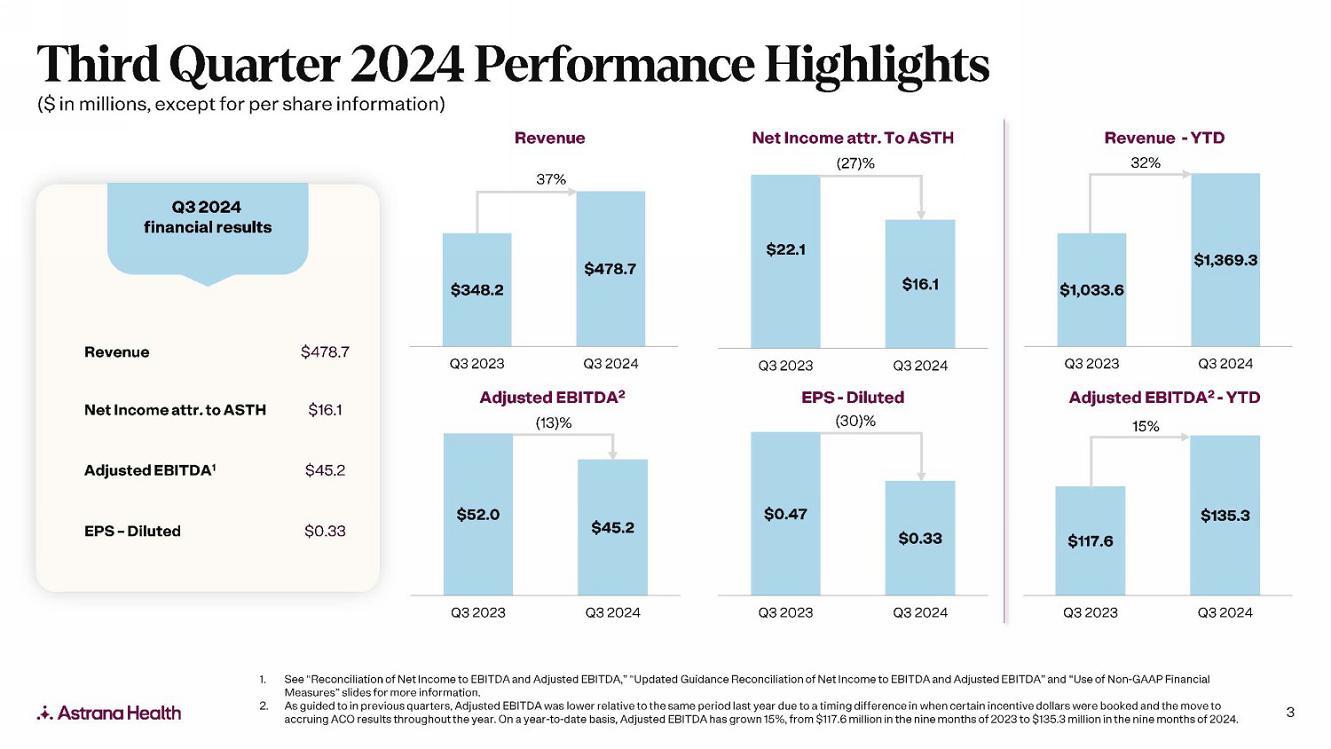
Financial Highlights for three months ended September 30, 2024:
All comparisons are to the three months ended September 30, 2023 unless otherwise stated.
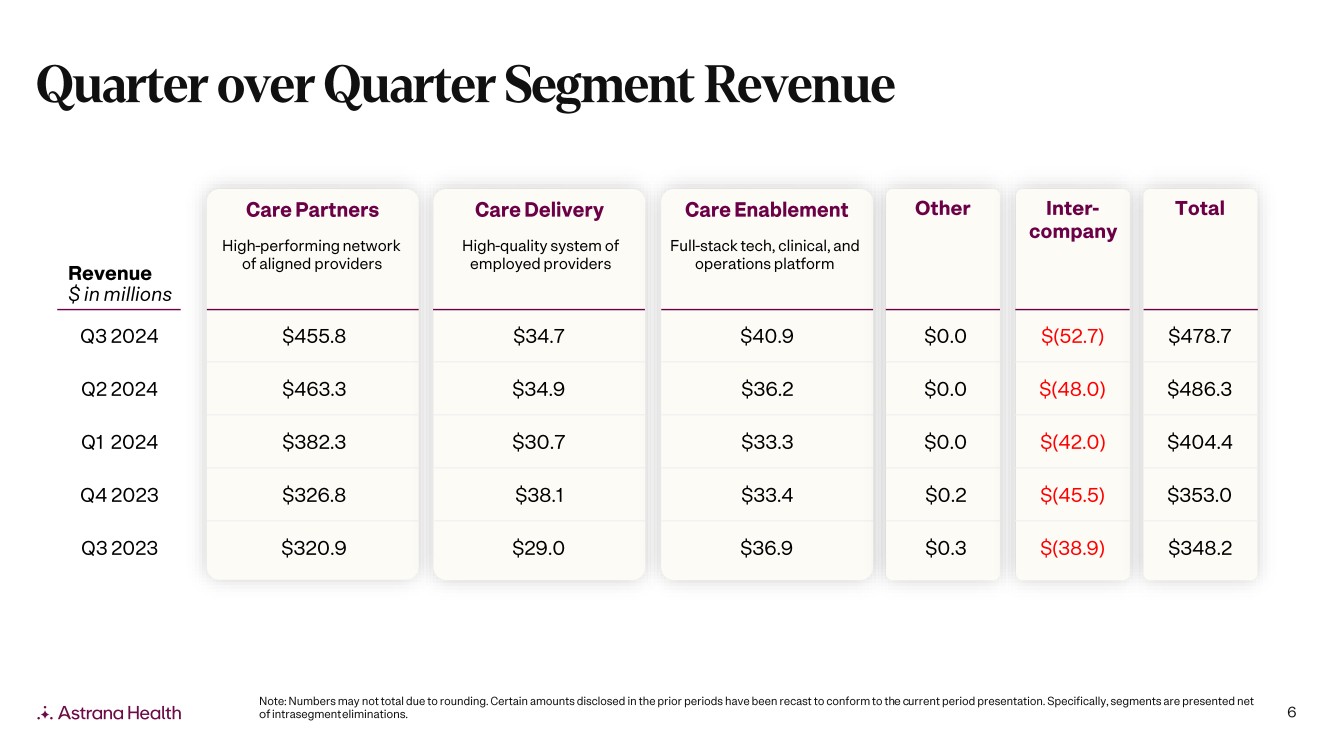
| · | Total revenue of $478.7 million, up 37% from $348.2 million |
| · | Care Partners revenue of $455.8 million, up 42% from $320.9 million |
| · | Net income attributable to Astrana of $16.1 million, down 27% from $22.1 million |
| · | Earnings per share - diluted (“EPS - diluted”) of $0.33, down 30% from $0.47 |
| · | Adjusted EBITDA of $45.2 million, down 13% from $52.0 million |
Financial Highlights for the nine months ended September 30, 2024:
All comparisons are to the nine months ended September 30, 2023 unless otherwise stated.
| · | Total revenue of $1,369.3 million, up 32% from $1,033.6 million |
| · | Care Partners revenue of $1,301.4 million, up 36% from $957.3 million |
| · | Net income attributable to Astrana of $50.1 million, up 4% from $48.4 million |
| · | Earnings per share - diluted (“EPS - diluted”) of $1.04, up 1% from $1.03 |
| · | Adjusted EBITDA of $135.3 million, up 15% from $117.6 million |
Recent Operating Highlights
| · | On October 4, 2024, the Company closed the acquisition of all of the outstanding membership interest in Collaborative Health Systems, LLC (“CHS”) and all of the outstanding equity interests in Golden Triangle Physician Alliance and Heritage Physician Networks for an aggregate purchase price of $37.5 million, subject to customary adjustments, plus earnout payments in an aggregate amount of up to $21.5 million. |
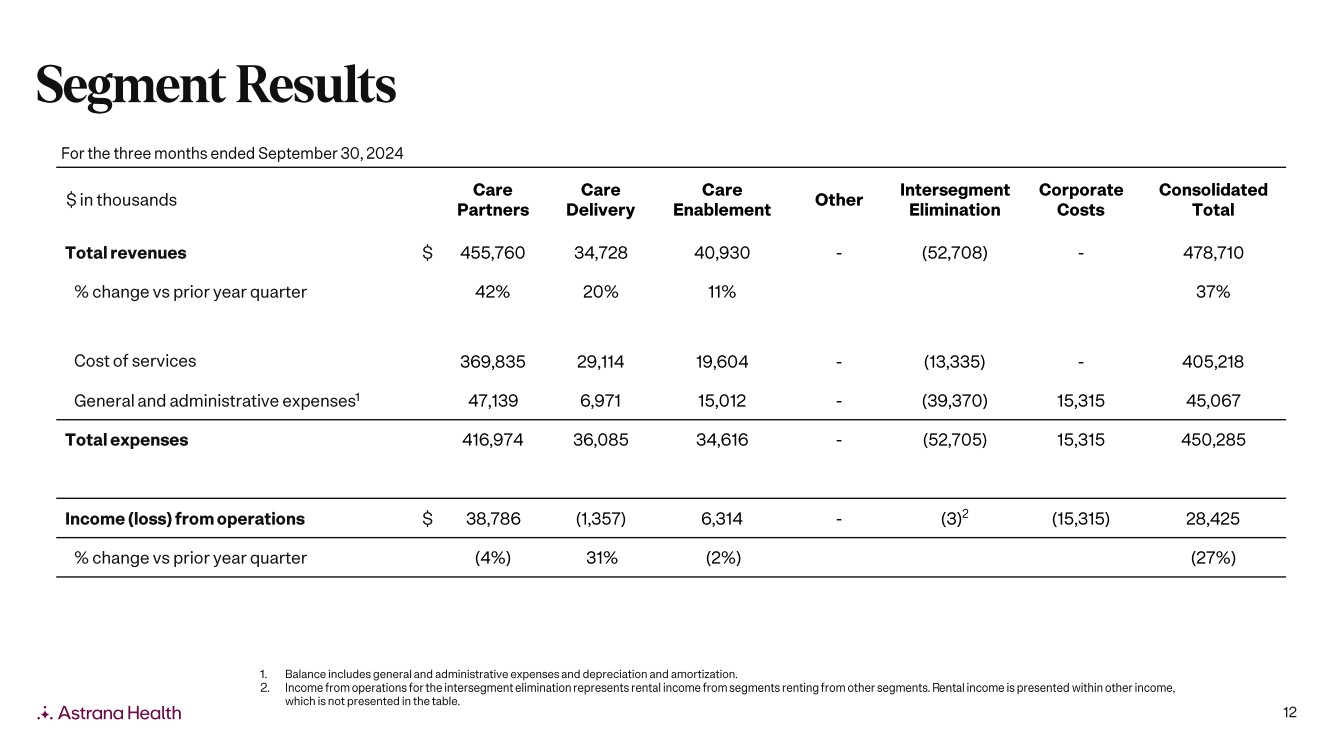
Segment Results for three months ended September 30, 2024:
| Three Months Ended September 30, 2024 | ||||||||||||||||||||||||||||
| (in thousands) | Care Partners | Care Delivery | Care Enablement | Other | Intersegment Elimination | Corporate Costs | Consolidated Total | |||||||||||||||||||||
| Total revenues | $ | 455,760 | $ | 34,728 | $ | 40,930 | $ | — | $ | (52,708 | ) | $ | — | $ | 478,710 | |||||||||||||
| % change vs. prior year quarter | 42 | % | 20 | % | 11 | % | ||||||||||||||||||||||
| Cost of services | 369,835 | 29,114 | 19,604 | — | (13,335 | ) | — | 405,218 | ||||||||||||||||||||
| General and administrative(1) | 47,139 | 6,971 | 15,012 | — | (39,370 | ) | 15,315 | 45,067 | ||||||||||||||||||||
| Total expenses | 416,974 | 36,085 | 34,616 | — | (52,705 | ) | 15,315 | 450,285 | ||||||||||||||||||||
| Income (loss) from operations | $ | 38,786 | $ | (1,357 | ) | $ | 6,314 | $ | — | $ | (3 | )(2) | $ | (15,315 | ) | $ | 28,425 | |||||||||||
| % change vs. prior year quarter | (4 | )% | 31 | % | (2 | )% | ||||||||||||||||||||||
(1) Balance includes general and administrative expenses and depreciation and amortization.
(2) Income from operations for the intersegment elimination represents rental income from segments renting from other segments. Rental income is presented within other income which is not presented in the table.
2024 Guidance:
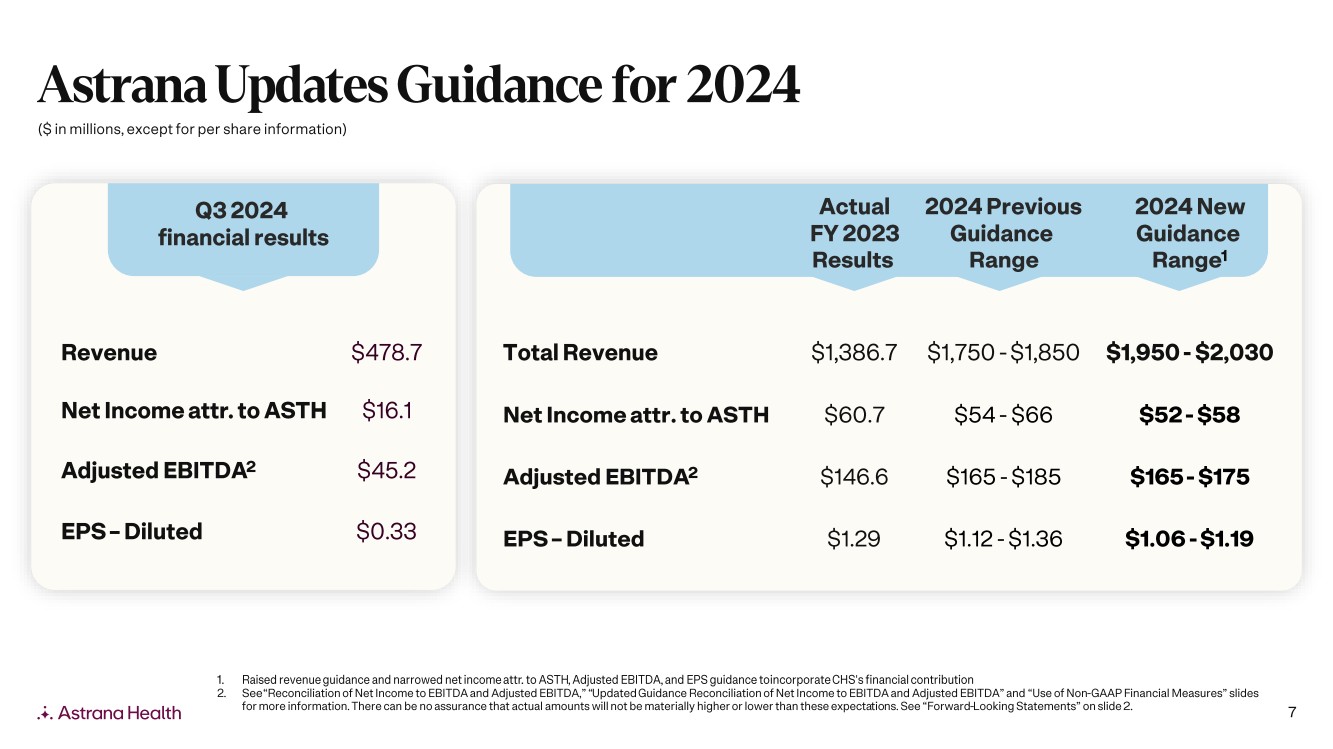
As we adjust our full-year outlook to incorporate CHS's financial contribution, we are raising our revenue guidance and narrowing our net income attributable to Astrana, Adjusted EBITDA, and EPS guidance for the year ending December 31, 2024.
| 2024 Guidance Range | ||||||||
| ($ in millions, except per share amounts) | Low | High | ||||||
| Total revenue | $ | 1,950 | $ | 2,030 | ||||
| Net income attributable to Astrana Health, Inc. | $ | 52 | $ | 58 | ||||
| Adjusted EBITDA | $ | 165 | $ | 175 | ||||
| EPS – diluted | $ | 1.06 | $ | 1.19 | ||||
See “Guidance Reconciliation of Net Income to EBITDA and Adjusted EBITDA” and “Use of Non-GAAP Financial Measures” below for additional information. There can be no assurance that actual amounts will not be materially higher or lower than these expectations. See “Forward-Looking Statements” below for additional information.
Conference Call and Webcast Information:
Astrana will host a conference call at 2:30 p.m. PT/5:30 p.m. ET today (Thursday, November 7, 2024), during which management will discuss the results of the third quarter ended September 30, 2024. To participate in the conference call, please use the following dial-in numbers about 5 minutes prior to the scheduled conference call time:
| U.S. & Canada (Toll-Free): | +1 (888) 272-8703 |
| International (Toll): | +1 (713) 481-1320 |
The conference call can also be accessed via webcast at: https://event.choruscall.com/mediaframe/webcast.html?webcastid=qeu83NWd
An accompanying slide presentation will be available in PDF format on the “IR Calendar” page of the Company’s website (https://ir.astranahealth.com/news-events/ir-calendar) after issuance of the earnings release and will be furnished as an exhibit to Astrana’s current report on Form 8-K to be filed with the SEC, accessible at www.sec.gov.
Those who are unable to attend the live conference call may access the recording at the above webcast link, which will be made available shortly after the conclusion of the call.
Note About Consolidated Entities
The Company consolidates entities in which it has a controlling financial interest. The Company consolidates subsidiaries in which it holds, directly or indirectly, more than 50% of the voting rights, and variable interest entities (“VIEs”) in which the Company is the primary beneficiary. Noncontrolling interests represent third party equity ownership interests in the Company’s consolidated entities (including certain VIEs). The amount of net income attributable to noncontrolling interests is disclosed in the Company’s consolidated statements of income.
Note About Stockholders’ Equity, Certain Treasury Stock and Earnings Per Share
As of the date of this press release, 41,048 holdback shares have not been issued to certain former shareholders of the Company’s subsidiary, Astrana Health Management, Inc. (“AHM”), formerly known as Network Medical Management, Inc., who were AHM shareholders at the time of closing of the merger, as they have yet to submit properly completed letters of transmittal to Astrana in order to receive their pro rata portion of Astrana’s common stock and warrants as contemplated under that certain Agreement and Plan of Merger, dated December 21, 2016, among Astrana, AHM, Apollo Acquisition Corp. (“Merger Subsidiary”) and Kenneth Sim, M.D., as amended, pursuant to which Merger Subsidiary merged with and into AHM, with AHM as the surviving corporation. Pending such receipt, such former AHM shareholders have the right to receive, without interest, their pro rata share of dividends or distributions with a record date after the effectiveness of the merger. The Company’s consolidated financial statements have treated such shares of common stock as outstanding, given the receipt of the letter of transmittal is considered perfunctory and Astrana is legally obligated to issue these shares in connection with the merger.
Shares of Astrana’s common stock owned by Allied Physicians of California, a Professional Medical Corporation (“APC”), a VIE of the Company, are legally issued and outstanding but excluded from shares of common stock outstanding in the Company’s consolidated financial statements, as such shares are treated as treasury shares for accounting purposes. Such shares, therefore, are not included in the number of shares of common stock outstanding used to calculate the Company’s earnings per share.
About Astrana Health, Inc.
Astrana is a leading physician-centric, technology-powered, risk-bearing healthcare management company. Leveraging its proprietary population health management and healthcare delivery platform, Astrana operates an integrated, value-based healthcare model, which aims to empower the providers in its network to deliver the highest quality of care to its patients in a cost-effective manner. Together with our affiliated physician groups and consolidated entities, we provide coordinated outcomes-based medical care in a cost-effective manner.
Headquartered in Alhambra, California, Astrana serves over 12,000 providers and approximately 1.1 million patients in value-based care arrangements. Its subsidiaries and affiliates include management services organizations (MSOs), a network of risk-bearing organizations ("RBOs") that encompasses independent practice associations ("IPAs"), accountable care organizations ("ACOs"), and state-specific entities such as Restricted Knox-Keene licensed health plans in California, and care delivery entities across primary, multi-specialty, and ancillary care. For more information, please visit www.astranahealth.com.
Forward-Looking Statements
This press release contains forward-looking statements within the meaning of the Private Securities Litigation Reform Act of 1995, such as statements about the Company’s guidance for the year ending December 31, 2024, ability to meet operational goals, ability to meet expectations in deployment of care coordination and management capabilities, ability to decrease cost of care while improving quality and outcomes, ability to deliver sustainable revenue and EBITDA growth as well as long-term value, ability to respond to the changing environment, and successful implementation of strategic growth plans, acquisition strategy, and merger integration efforts. Forward-looking statements reflect current views with respect to future events and financial performance and therefore cannot be guaranteed. Such statements are based on the current expectations and certain assumptions of the Company’s management, and some or all of such expectations and assumptions may not materialize or may vary significantly from actual results. Actual results may also vary materially from forward-looking statements due to risks, uncertainties and other factors, known and unknown, including the risk factors described from time to time in the Company’s reports filed or furnished with the Securities and Exchange Commission, including, without limitation the risk factors discussed in the Company’s Annual Report on Form 10-K for the year ended December 31, 2023, and any subsequent quarterly reports on Form 10-Q.
FOR MORE INFORMATION, PLEASE CONTACT:
Investor
Relations
(626) 943-6491
[email protected]
ASTRANA HEALTH, INC.
CONDENSED CONSOLIDATED BALANCE SHEETS
(IN THOUSANDS, EXCEPT SHARE AND PER SHARE DATA)
| September 30, 2024 | December 31, 2023 | |||||||
| (Unaudited) | ||||||||
| Assets | ||||||||
| Current assets | ||||||||
| Cash and cash equivalents | $ | 347,994 | $ | 293,807 | ||||
| Investment in marketable securities | 2,354 | 2,498 | ||||||
| Receivables, net | 132,237 | 76,780 | ||||||
| Receivables, net – related parties | 76,568 | 58,980 | ||||||
| Income taxes receivable | 16,211 | 10,657 | ||||||
| Other receivables | 1,120 | 1,335 | ||||||
| Prepaid expenses and other current assets | 20,506 | 17,450 | ||||||
| Total current assets | 596,990 | 461,507 | ||||||
| Non-current assets | ||||||||
| Land, property and equipment, net | 12,172 | 7,171 | ||||||
| Intangible assets, net | 109,108 | 71,648 | ||||||
| Goodwill | 409,711 | 278,831 | ||||||
| Income taxes receivable | 15,943 | 15,943 | ||||||
| Loans receivable, non-current | 55,284 | 26,473 | ||||||
| Investments in other entities – equity method | 34,629 | 25,774 | ||||||
| Investments in privately held entities | 8,896 | 6,396 | ||||||
| Restricted cash | 646 | 345 | ||||||
| Operating lease right-of-use assets | 33,119 | 37,396 | ||||||
| Other assets | 8,878 | 1,877 | ||||||
| Total non-current assets | 688,386 | 471,854 | ||||||
| Total assets(1) | $ | 1,285,376 | $ | 933,361 | ||||
| Liabilities, mezzanine equity and equity | ||||||||
| Current liabilities | ||||||||
| Accounts payable and accrued expenses | $ | 94,811 | $ | 59,949 | ||||
| Fiduciary accounts payable | 6,041 | 7,737 | ||||||
| Medical liabilities | 160,279 | 106,657 | ||||||
| Dividend payable | 638 | 638 | ||||||
| Finance lease liabilities | 554 | 646 | ||||||
| Operating lease liabilities | 5,241 | 4,607 | ||||||
| Current portion of long-term debt | 15,000 | 19,500 | ||||||
| Other liabilities | 30,364 | 18,940 | ||||||
| Total current liabilities | 312,928 | 218,674 | ||||||
| Non-current liabilities | ||||||||
| Deferred tax liability | 2,857 | 4,072 | ||||||
| Finance lease liabilities, net of current portion | 743 | 1,033 | ||||||
| Operating lease liabilities, net of current portion | 31,162 | 36,289 | ||||||
| Long-term debt, net of current portion and deferred financing costs | 423,119 | 258,939 | ||||||
| Other long-term liabilities | 7,460 | 3,586 | ||||||
| Total non-current liabilities | 465,341 | 303,919 | ||||||
| Total liabilities(1) | 778,269 | 522,593 | ||||||
| Commitments and contingencies | ||||||||
| Mezzanine equity | ||||||||
| Noncontrolling interest in Allied Physicians of California, a Professional Medical Corporation ("APC") | (202,512 | ) | (205,883 | ) | ||||
| Stockholders’ equity | ||||||||
| Preferred stock, $0.001 par value per share; 5,000,000 shares authorized as of September 30, 2024 and December 31, 2023 | ||||||||
| Series A Preferred stock, zero authorized and issued and zero outstanding as of September 30, 2024 and 1,111,111 authorized and issued and zero outstanding as of December 31, 2023 | — | — | ||||||
| Series B Preferred stock, zero authorized and issued and zero outstanding as of September 30, 2024 and 555,555 authorized and issued and zero outstanding as of December 31, 2023 | — | — | ||||||
| Common stock, $0.001 par value per share; 100,000,000 shares authorized, 47,780,523 and 46,843,743 shares issued and outstanding, excluding 10,598,749 and 10,584,340 treasury shares, as of September 30, 2024 and December 31, 2023, respectively | 48 | 47 | ||||||
| Additional paid-in capital | 411,334 | 371,037 | ||||||
| Retained earnings | 293,234 | 243,134 | ||||||
| Total stockholders’ equity | 704,616 | 614,218 | ||||||
| Non-controlling interest | 5,003 | 2,433 | ||||||
| Total equity | 709,619 | 616,651 | ||||||
| Total liabilities, mezzanine equity and equity | $ | 1,285,376 | $ | 933,361 | ||||
(1) The Company’s condensed consolidated balance sheets include the assets and liabilities of its consolidated VIEs. The condensed consolidated balance sheets include total assets that can be used only to settle obligations of the Company’s consolidated VIEs totaling $701.1 million and $540.8 million as of September 30, 2024 and December 31, 2023, respectively, and total liabilities of the Company’s consolidated VIEs for which creditors do not have recourse to the general credit of the primary beneficiary of $194.1 million and $146.0 million as of September 30, 2024 and December 31, 2023, respectively. These VIE balances do not include $413.3 million of investment in affiliates and $76.3 million of amounts due to affiliates as of September 30, 2024, and $273.2 million of investment in affiliates and $107.3 million of amounts due to affiliates as of December 31, 2023, as these are eliminated upon consolidation and not presented within the condensed consolidated balance sheets.
ASTRANA HEALTH, INC.
CONSOLIDATED STATEMENTS OF INCOME
(IN THOUSANDS, EXCEPT PER SHARE AMOUNTS)
(UNAUDITED)
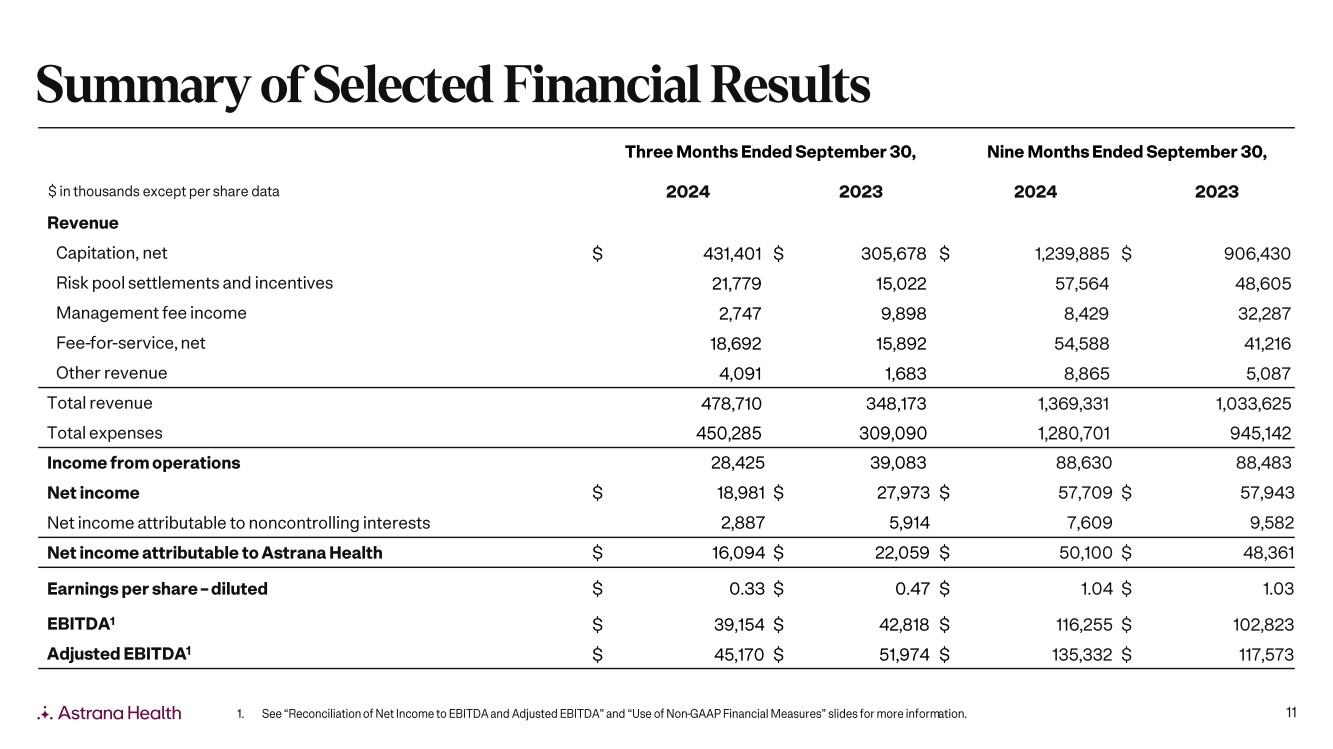
| Three Months Ended September 30, | Nine Months Ended September 30, | |||||||||||||||
| 2024 | 2023 | 2024 | 2023 | |||||||||||||
| Revenue | ||||||||||||||||
| Capitation, net | $ | 431,401 | $ | 305,678 | $ | 1,239,885 | $ | 906,430 | ||||||||
| Risk pool settlements and incentives | 21,779 | 15,022 | 57,564 | 48,605 | ||||||||||||
| Management fee income | 2,747 | 9,898 | 8,429 | 32,287 | ||||||||||||
| Fee-for-service, net | 18,692 | 15,892 | 54,588 | 41,216 | ||||||||||||
| Other revenue | 4,091 | 1,683 | 8,865 | 5,087 | ||||||||||||
| Total revenue | 478,710 | 348,173 | 1,369,331 | 1,033,625 | ||||||||||||
| Operating expenses | ||||||||||||||||
| Cost of services, excluding depreciation and amortization | 405,218 | 275,375 | 1,148,422 | 857,648 | ||||||||||||
| General and administrative expenses | 37,803 | 29,410 | 112,478 | 74,648 | ||||||||||||
| Depreciation and amortization | 7,264 | 4,305 | 19,801 | 12,846 | ||||||||||||
| Total expenses | 450,285 | 309,090 | 1,280,701 | 945,142 | ||||||||||||
| Income from operations | 28,425 | 39,083 | 88,630 | 88,483 | ||||||||||||
| Other income (expense) | ||||||||||||||||
| Income (loss) from equity method investments | 1,353 | (2,104 | ) | 2,887 | 3,104 | |||||||||||
| Interest expense | (8,856 | ) | (3,779 | ) | (25,028 | ) | (10,680 | ) | ||||||||
| Interest income | 3,778 | 3,281 | 11,287 | 9,617 | ||||||||||||
| Unrealized (loss) gain on investments | (561 | ) | (342 | ) | 415 | (5,875 | ) | |||||||||
| Other income | 2,673 | 1,876 | 4,522 | 4,265 | ||||||||||||
| Total other (expense) income, net | (1,613 | ) | (1,068 | ) | (5,917 | ) | 431 | |||||||||
| Income before provision for income taxes | 26,812 | 38,015 | 82,713 | 88,914 | ||||||||||||
| Provision for income taxes | 7,831 | 10,042 | 25,004 | 30,971 | ||||||||||||
| Net income | 18,981 | 27,973 | 57,709 | 57,943 | ||||||||||||
| Net income attributable to non-controlling interest | 2,887 | 5,914 | 7,609 | 9,582 | ||||||||||||
| Net income attributable to Astrana Health, Inc. | $ | 16,094 | $ | 22,059 | $ | 50,100 | $ | 48,361 | ||||||||
| Earnings per share – basic | $ | 0.34 | $ | 0.47 | $ | 1.05 | $ | 1.04 | ||||||||
| Earnings per share – diluted | $ | 0.33 | $ | 0.47 | $ | 1.04 | $ | 1.03 | ||||||||
EBITDA
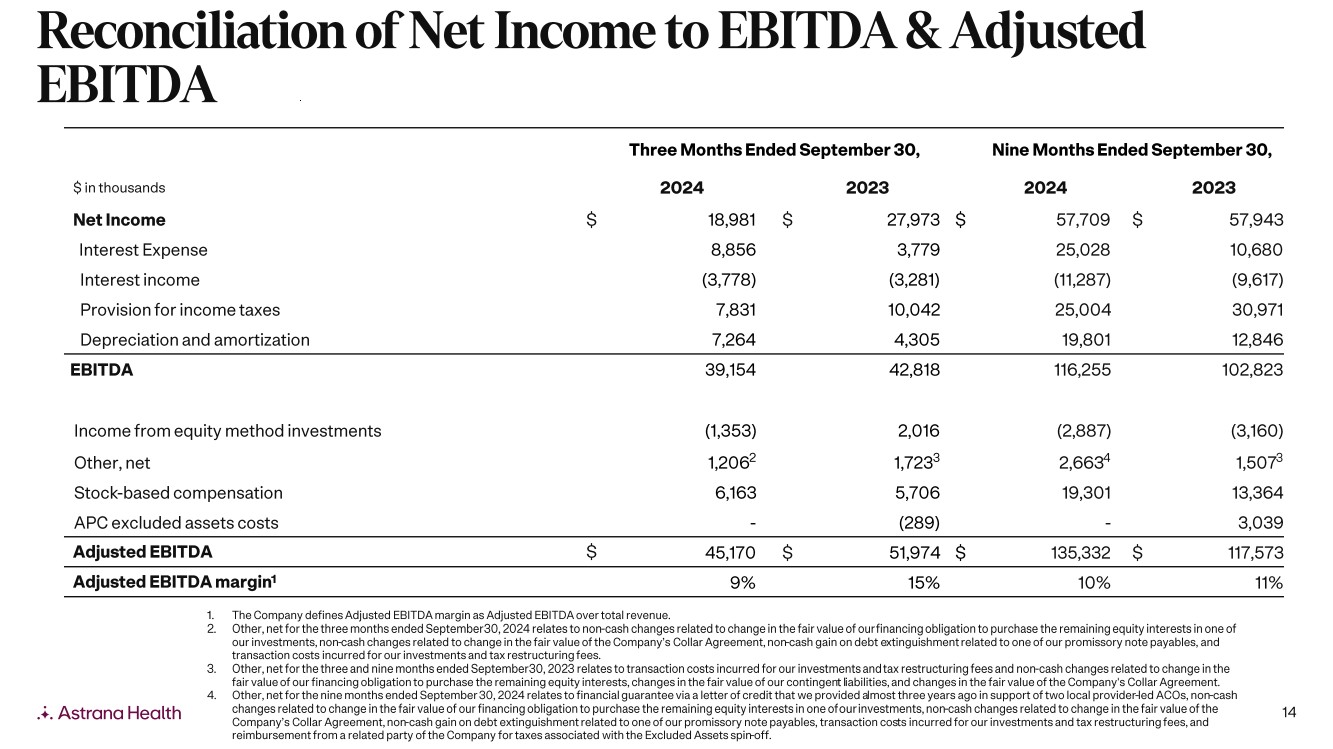
Set forth below are reconciliations of Net Income to EBITDA and Adjusted EBITDA as well as the reconciliation to Adjusted EBITDA margin for the three and nine months ended September 30, 2024 and 2023. The Company defines Adjusted EBITDA margin as Adjusted EBITDA over total revenue.
| Three Months Ended September 30, | Nine Months Ended September 30, | |||||||||||||||
| (in thousands) | 2024 | 2023 | 2024 | 2023 | ||||||||||||
| Net income | $ | 18,981 | $ | 27,973 | $ | 57,709 | $ | 57,943 | ||||||||
| Interest expense | 8,856 | 3,779 | 25,028 | 10,680 | ||||||||||||
| Interest income | (3,778 | ) | (3,281 | ) | (11,287 | ) | (9,617 | ) | ||||||||
| Provision for income taxes | 7,831 | 10,042 | 25,004 | 30,971 | ||||||||||||
| Depreciation and amortization | 7,264 | 4,305 | 19,801 | 12,846 | ||||||||||||
| EBITDA | 39,154 | 42,818 | 116,255 | 102,823 | ||||||||||||
| (Income) loss from equity method investments | (1,353 | ) | 2,016 | (2,887 | ) | (3,160 | ) | |||||||||
| Other, net | 1,206 | (1) | 1,723 | (2) | 2,663 | (3) | 1,507 | (2) | ||||||||
| Stock-based compensation | 6,163 | 5,706 | 19,301 | 13,364 | ||||||||||||
| APC excluded asset costs | — | (289 | ) | — | 3,039 | |||||||||||
| Adjusted EBITDA | $ | 45,170 | $ | 51,974 | $ | 135,332 | $ | 117,573 | ||||||||
| Total revenue | $ | 478,710 | $ | 348,173 | $ | 1,369,331 | $ | 1,033,625 | ||||||||
| Adjusted EBITDA margin | 9 | % | 15 | % | 10 | % | 11 | % | ||||||||
| (1) | Other, net for the three months ended September 30, 2024 relates to non-cash changes related to change in the fair value of our financing obligation to purchase the remaining equity interests in one of our investments, non-cash changes related to change in the fair value of the Company’s Collar Agreement, non-cash gain on debt extinguishment related to one of our promissory note payables, and transaction costs incurred for our investments and tax restructuring fees. |
| (2) | Other, net for the three and nine months ended September 30, 2023 relates to transaction costs incurred for our investments and tax restructuring fees and non-cash changes related to change in the fair value of our financing obligation to purchase the remaining equity interests, changes in the fair value of our contingent liabilities, and changes in the fair value of the Company's Collar Agreement. |
| (3) | Other, net for the nine months ended September 30, 2024 relates to financial guarantee via a letter of credit that we provided almost three years ago in support of two local provider-led ACOs, non-cash changes related to change in the fair value of our financing obligation to purchase the remaining equity interests in one of our investments, non-cash changes related to change in the fair value of the Company’s Collar Agreement, non-cash gain on debt extinguishment related to one of our promissory note payables, transaction costs incurred for our investments and tax restructuring fees, and reimbursement from a related party of the Company for taxes associated with the Excluded Assets spin-off. |
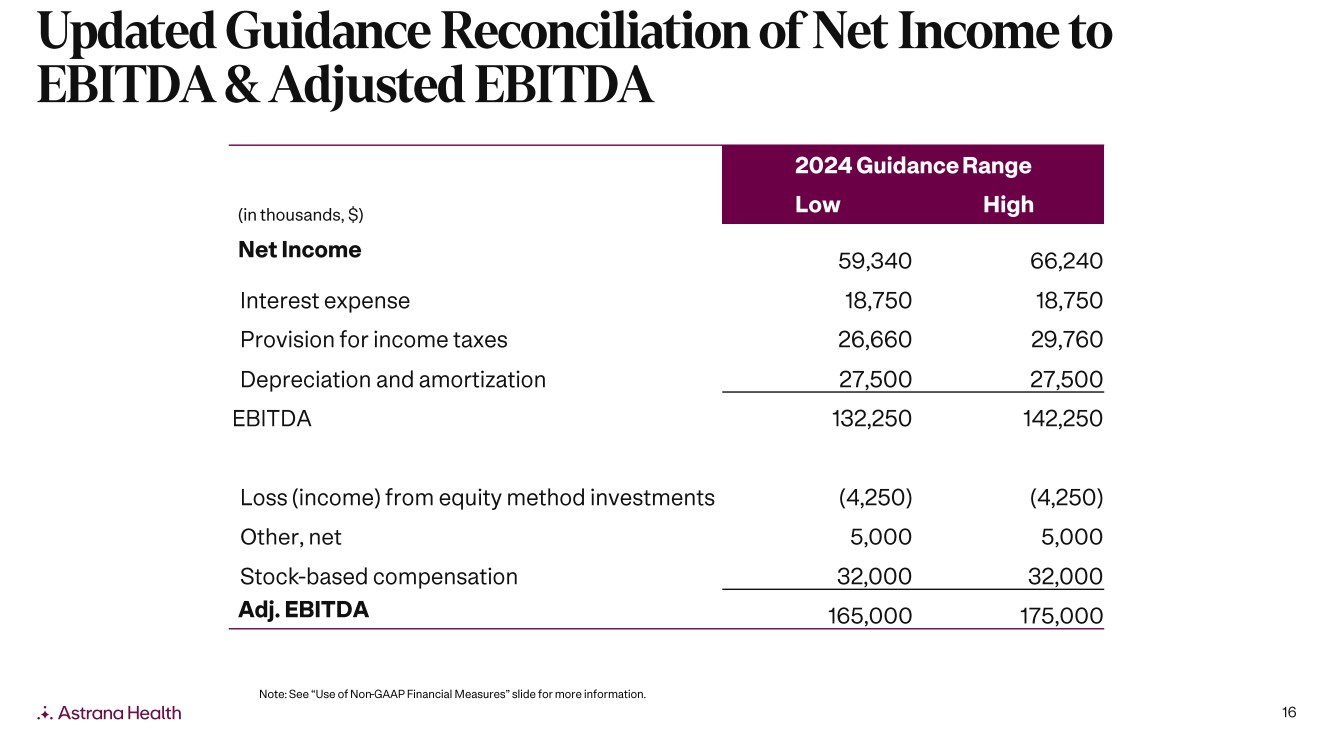
Guidance Reconciliation of Net Income to EBITDA and Adjusted EBITDA
| 2024 Guidance Range | ||||||||
| (in thousands) | Low | High | ||||||
| Net income | $ | 59,340 | $ | 66,240 | ||||
| Interest expense | 18,750 | 18,750 | ||||||
| Provision for income taxes | 26,660 | 29,760 | ||||||
| Depreciation and amortization | 27,500 | 27,500 | ||||||
| EBITDA | 132,250 | 142,250 | ||||||
| Income from equity method investments | (4,250 | ) | (4,250 | ) | ||||
| Other, net | 5,000 | 5,000 | ||||||
| Stock-based compensation | 32,000 | 32,000 | ||||||
| Adjusted EBITDA | $ | 165,000 | $ | 175,000 | ||||
Use of Non-GAAP Financial Measures
This press release contains the non-GAAP financial measures EBITDA and Adjusted EBITDA, of which the most directly comparable financial measure presented in accordance with U.S. generally accepted accounting principles (“GAAP”) is net income. These measures are not in accordance with, or alternatives to GAAP, and may be calculated differently from similar non-GAAP financial measures used by other companies. The Company uses Adjusted EBITDA as a supplemental performance measure of our operations, for financial and operational decision-making, and as a supplemental means of evaluating period-to-period comparisons on a consistent basis. Adjusted EBITDA is calculated as earnings before interest, taxes, depreciation, and amortization, excluding income or loss from equity method investments, non-recurring and non-cash transactions, stock-based compensation, and APC excluded assets costs. The Company defines Adjusted EBITDA margin as Adjusted EBITDA over total revenue.
The Company believes the presentation of these non-GAAP financial measures provides investors with relevant and useful information, as it allows investors to evaluate the operating performance of the business activities without having to account for differences recognized because of non-core or non-recurring financial information. When GAAP financial measures are viewed in conjunction with non-GAAP financial measures, investors are provided with a more meaningful understanding of the Company’s ongoing operating performance. In addition, these non-GAAP financial measures are among those indicators the Company uses as a basis for evaluating operational performance, allocating resources, and planning and forecasting future periods. Non-GAAP financial measures are not intended to be considered in isolation, or as a substitute for, GAAP financial measures. Other companies may calculate both EBITDA and Adjusted EBITDA differently, limiting the usefulness of these measures for comparative purposes. To the extent this release contains historical or future non-GAAP financial measures, the Company has provided corresponding GAAP financial measures for comparative purposes. The reconciliation between certain GAAP and non-GAAP measures is provided above.

| Third Quarter 2024 Earnings Supplement November 2024 , :s / k A I of di Astrana Health |
| Forward Looking Statements This presentation contains forward-looking statements within the meaning of the Private Securities Litigation Reform Act of 1995, Section 27A of the Securities Act and Section 21E of the Exchange Act. Forward-looking statements include any statements about the Company's business, financial condition, operating results, plans, objectives, expectations and intentions, expansion plans, estimates of our total addressable market, our ability to successfully complete and realize the benefits of anticipated acquisitions, integration of acquired companies and any projections of earnings, revenue, EBITDA, Adjusted EBITDA or other financial items, such as the Company's projected capitation and future liquidity, and may be identified by the use of forward-looking terms such as "anticipate," "could," "can," "may," "might," "potential," "predict," "should," "estimate," "expect," "project," "believe," "plan," "envision," "intend," "continue," "target," "seek," "will," "would," and the negative of such terms, other variations on such terms or other similar or comparable words, phrases or terminology. Forward-looking statements reflect current views with respect to future events and financial performance and therefore cannot be guaranteed. Such statements are based on the current expectations and certain assumptions of the Company's management, and some or all of such expectations and assumptions may not materialize or may vary significantly from actual results. Actual results may also vary materially from forward-looking statements due to risks, uncertainties and other factors, known and unknown, including the risk factors described from time to time in the Company's reports to the U.S. Securities and Exchange Commission (the "SEC"), including without limitation the risk factors discussed in the Company's Annual Report on Form 10-K for the year ended December 31, 2023, and subsequent Quarterly Reports on Form 10-Q. Because the factors referred to above could cause actual results or outcomes to differ materially from those expressed or implied in any forward-looking statements, you should not place undue reliance on any such forward-looking statements. Any forward-looking statements speak only as of the date of this presentation and, unless legally required, the Company does not undertake any obligation to update any forward-looking statement, as a result of new information, future events or otherwise. This presentation may contain statistics and other data that in some cases has been obtained from or compiled from information made available by third-party service providers. The Company makes no representation or warranty, express or implied, with respect to the accuracy, reasonableness or completeness of such information. Use of Non-GAAP Financial Measures This presentation contains the non-GAAP financial measures EBITDA and Adjusted EBITDA, of which the most directly comparable financial measure presented in accordance with U.S. generally accepted accounting principles ("GAAP") is net income. These measures are not in accordance with, or alternatives to, GAAP, and may be calculated differently from similar non-GAAP financial measures used by other companies. The Company uses Adjusted EBITDA as a supplemental performance measure of our operations, for financial and operational decision-making, and as a supplemental means of evaluating period-to-period comparisons on a consistent basis. Adjusted EBITDA is calculated as earnings before interest, taxes, depreciation, and amortization, excluding income or loss from equity method investments, non-recurring and non-cash transactions, stock-based compensation, and APC excluded assets costs. Beginning in the third quarter ended September 30, 2022, the Company has revised the calculation for Adjusted EBITDA to exclude provider bonus payments and losses from recently acquired IPAs, which it believes to be more reflective of its business. The Company believes the presentation of these non-GAAP financial measures provides investors with relevant and useful information, as it allows investors to evaluate the operating performance of the business activities without having to account for differences recognized because of non-core or non-recurring financial information. When GAAP financial measures are viewed in conjunction with non-GAAP financial measures, investors are provided with a more meaningful understanding of the Company's ongoing operating performance. In addition, these non-GAAP financial measures are among those indicators the Company uses as a basis for evaluating operational performance, allocating resources, and planning and forecasting future periods. Non-GAAP financial measures are not intended to be considered in isolation, or as a substitute for, GAAP financial measures. Other companies may calculate both EBITDA and Adjusted EBITDA differently, limiting the usefulness of these measures for comparative purposes. To the extent this Presentation contains historical or future non-GAAP financial measures, the Company has provided corresponding GAAP financial measures for comparative purposes. The reconciliation between certain GAAP and non-GAAP measures is provided in the Appendix. The Company has not provided a quantitative reconciliation of applicable non-GAAP measures, such as the projected adjusted EBITDA and adjusted EBITDA margin in 2024 and in future years for planned acquisitions, to the most comparable GAAP measure, such as net income, on a forward-looking basis within this presentation because the Company is unable, without unreasonable efforts, to provide reconciling information with respect to certain line items that cannot be calculated. These items, which could materially affect the computation of forward-looking GAAP net income, are inherently uncertain and depend on various factors, some of which are outside of the Company's control. Astrana Health 2 |
| Third Quarter 2024 Performance Highlights ($ in millions, except for per share information) Q32024 financial results Revenue $478.7 Net Income attr. to ASTH $16.1 Adjusted EBITDA1 $45.2 EPS - Diluted $0.33 Astrana Health $348.2 Revenue 37% $478.7 Net Income attr. To ASTH (27)% $22.1 $16.1 Q3 2023 Q3 2024 Q3 2023 Q3 2024 Adjusted EBITDA2 EPS - Diluted (13)% (30)% $52.0 $45.2 $0.47 $0.33 Q3 2023 Q3 2024 Q3 2023 Q3 2024 1. See "Reconciliation of Net Income to EBITDA and Adjusted EBITDA," "Updated Guidance Reconciliation of Net Income to EBITDA and Adjusted EBITDA" and "Use of Non-GAAP Financial Measures" slides for more information. 2. As guided to in previous quarters, Adjusted EBITDA was lower relative to the same period last year due to a timing difference in when certain incentive dollars were booked and the move to accruing ACO results throughout the year. On a year-to-date basis, Adjusted EBITDA has grown 15%, from $117.6 million in the nine months of 2023 to $135.3 million in the nine months of 2024. 3 |
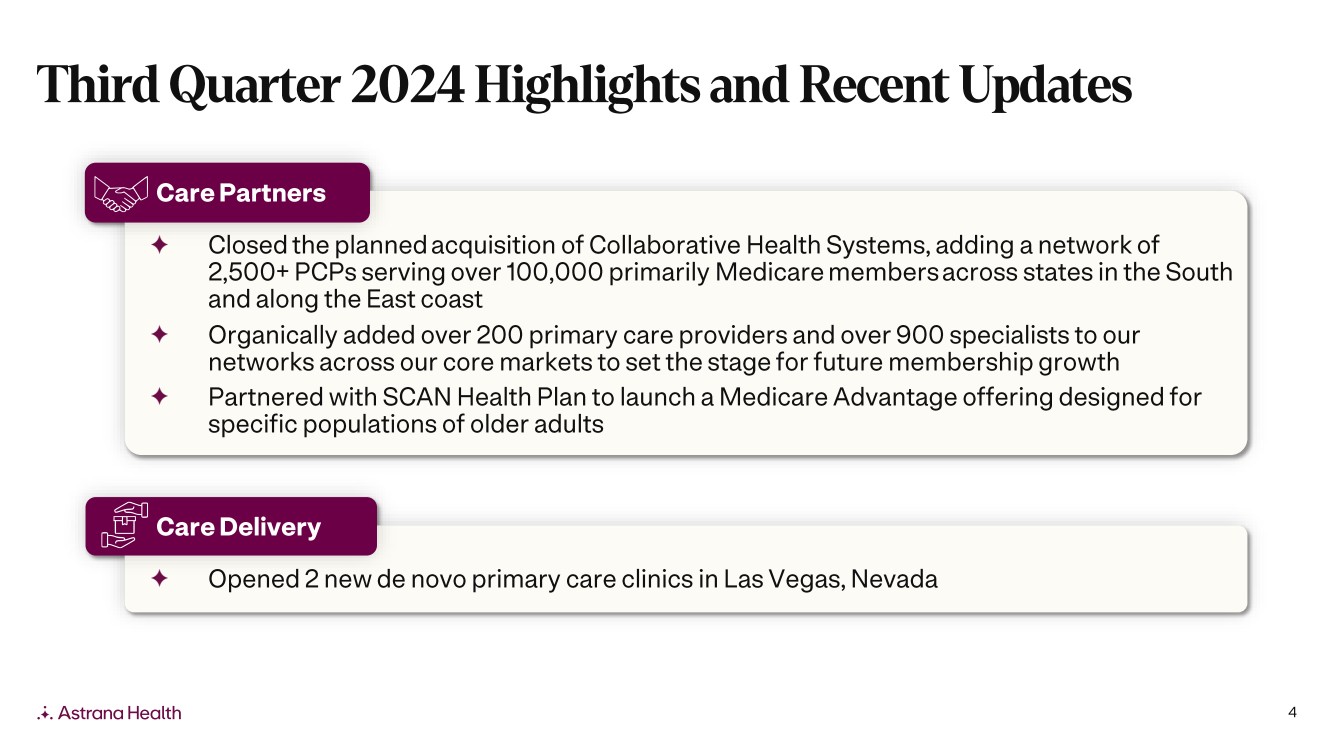
| Third Quarter 2024 Highlights and Recent Updates Care Partners Closed the planned acquisition of Collaborative Health Systems, adding a network of 2,500+ PCPs serving over 100,000 primarily Medicare members across states in the South and along the East coast + Organically added over 200 primary care providers and over 900 specialists to our networks across our core markets to set the stage for future membership growth + Partnered with SCAN Health Plan to launch a Medicare Advantage offering designed for specific populations of older adults .. 20 Care Delivery I] . + Opened 2 new de novo primary care clinics in Las Vegas, Nevada .. . Astrana Health 4 |
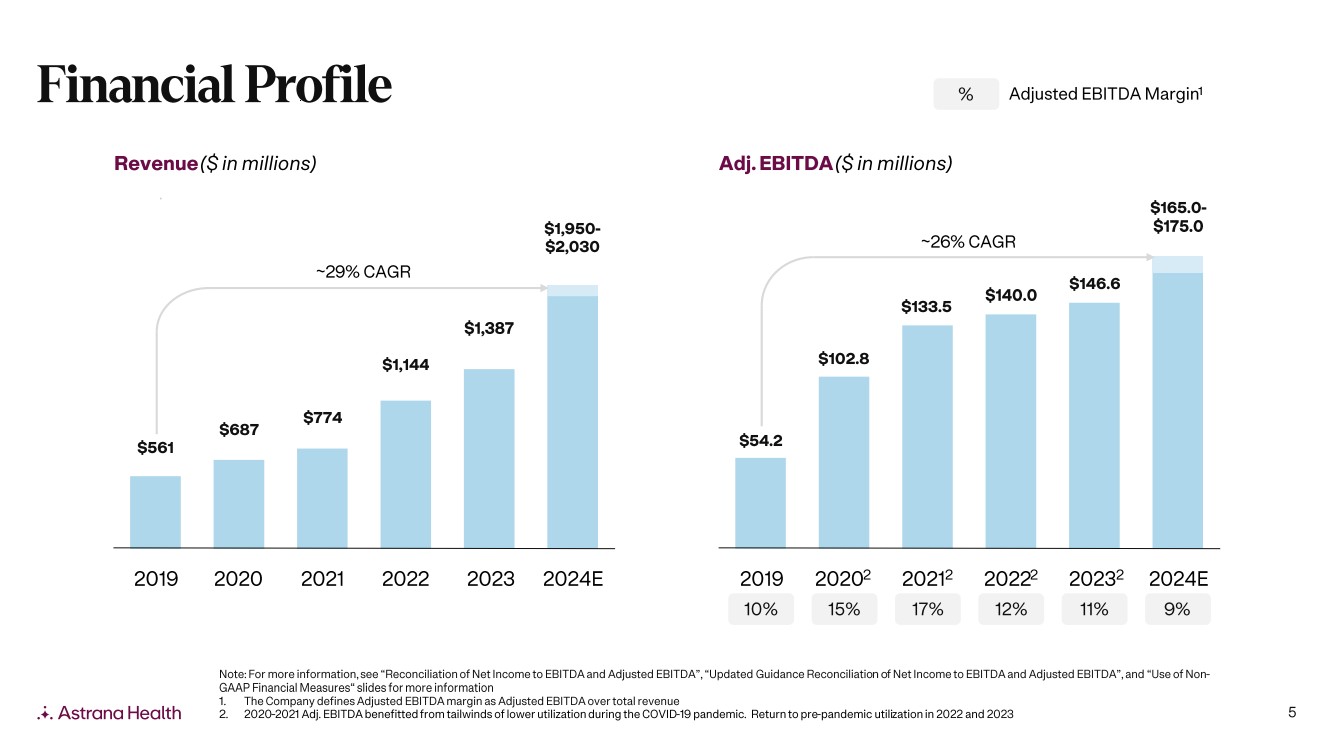
| Financial Profile Revenue ($ in millions) Adj. EBITDA ($ in millions) $561 $687 -29% CAGR $774 $1,144 $1,387 % Adjusted EBITDA Margins $165.0- $1,950- $175.0 $2,030 -26% CAGR $54.2 $102.8 $140.0 $146.6 $133.5 2019 2020 2021 2022 2023 2024E 2019 20202 20212 20222 20232 2024E Astrana Health 10% 15% 17% 12% 11% 9% Note: For more information, see "Reconciliation of Net Income to EBITDA and Adjusted EBITDA", "Updated Guidance Reconciliation of Net Income to EBITDA and Adjusted EBITDA", and "Use of Non-GAAP Financial Measures" slides for more information 1. The Company defines Adjusted EBITDA margin as Adjusted EBITDA over total revenue 2. 2020-2021 Adj. EBITDA benefitted from tailwinds of lower utilization during the COVID-19 pandemic. Return to pre-pandemic utilization in 2022 and 2023 5 |
| Quarter over Quarter Segment Revenue Revenue $ in millions Care Partners High-performing network of aligned providers Care Delivery High-quality system of employed providers Care Enablement Full-stack tech, clinical, and operations platform Other Inter-company Total Q3 2024 Q2 2024 Q1 2024 Q4 2023 Q3 2023 $455.8 $34.7 $40.9 $0.0 $(52.7) $478.7 $463.3 $34.9 $36.2 $0.0 $(48.0) $486.3 $382.3 $30.7 $33.3 $0.0 $(42.0) $404.4 $326.8 $38.1 $33.4 $0.2 $(45.5) $353.0 $320.9 $29.0 $36.9 $0.3 $(38.9) $348.2 .. . Astrana Health Note: Numbers may not total due to rounding. Certain amounts disclosed in the prior periods have been recast to conform to the current period presentation. Specifically, segments are presented net of intrasegment eliminations. 6 |
| Astrana Updates Guidance for 2024 ($ in millions, except for per share information) Q32024 financial results Actual 2024 Previous 2024 New FY 2023 Guidance Guidance Results Range Ranges Revenue $478.7 Total Revenue $1,386.7 $1,750 - $1,850 $1,950 - $2,030 Net Income attr. to ASTH $16.1 Net Income attr. to ASTH $60.7 $54 - $66 $52 - $58 Adjusted EBITDA2 $45.2 Adjusted EBITDA2 $146.6 $165 - $185 $165 - $175 EPS - Diluted $0.33 EPS - Diluted $1.29 $1.12 - $1.36 $1.06 - $1.19 Astrana Health 1. Raised revenue guidance and narrowed net income attr. to ASTH, Adjusted EBITDA, and EPS guidance to incorporate CHS's financial contribution 2. See "Reconciliation of Net Income to EBITDA and Adjusted EBITDA," "Updated Guidance Reconciliation of Net Income to EBITDA and Adjusted EBITDA" and "Use of Non-GAAP Financial Measures" slides for more information. There can be no assurance that actual amounts will not be materially higher or lower than these expectations. See "Forward-Looking Statements" on slide 2. 7 |
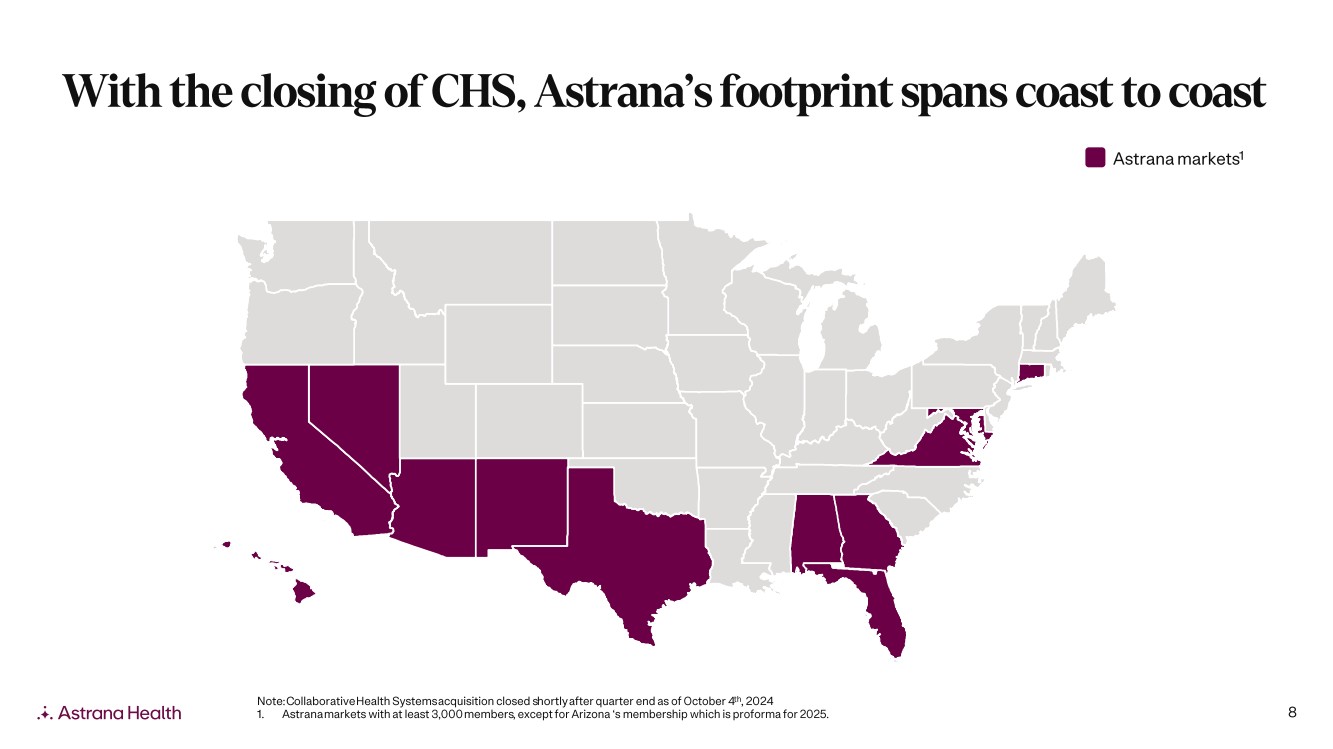
| With the closing of CHS, Astrana's footprint spans coast to coast Astrana marketsl Jil ,At _ mew Astrana Health Note: Collaborative Health Systems acquisition closed shortly after quarter end as of October 4th, 2024 1. Astrana markets with at least 3,000 members, except for Arizona 's membership which is proforma for 2025. 8 |
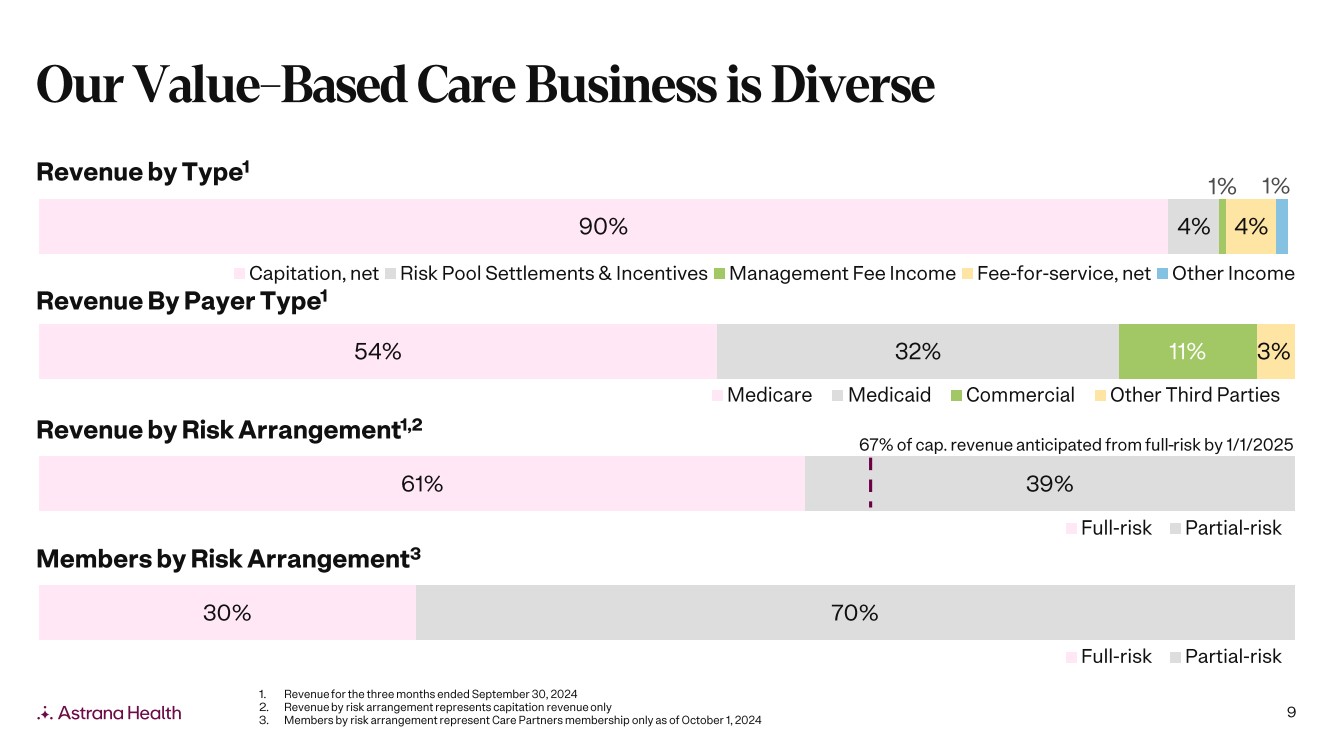
| Our Value-Based Care Business is Diverse Revenue by Typel 90% 4% 4% Capitation, net Risk Pool Settlements & Incentives Management Fee Income Fee-for-service, net Other Income Revenue By Payer Typel 54% 32% 11% 3% Revenue by Risk Arrangementu Medicare Medicaid Commercial Other Third Parties 67% of cap. revenue anticipated from full-risk by 1/1/2025 61% i I 39% Full-risk Partial-risk Members by Risk Arrangement3 30% 70% .. . Astrana Health 1. Revenue for the three months ended September 30, 2024 2. Revenue by risk arrangement represents capitation revenue only 3. Members by risk arrangement represent Care Partners membership only as of October 1, 2024 Full-risk Partial-risk 9 |
| Selected Financial Results .. . Astrana Health |
| Summary of Selected Financial Results $ in thousands except per share data Revenue Three Months Ended September 30, 2024 2023 Nine Months Ended September 30, 2024 2023 Capitation, net 431,401 $ 305,678 $ 1,239,885 $ 906,430 Risk pool settlements and incentives 21,779 15,022 57,564 48,605 Management fee income 2,747 9,898 8,429 32,287 Fee-for-service, net 18,692 15,892 54,588 41,216 Other revenue 4,091 1,683 8,865 5,087 Total revenue 478,710 348,173 1,369,331 1,033,625 Total expenses 450,285 309,090 1,280,701 945,142 Income from operations 28,425 39,083 88,630 88,483 Net income 18,981 $ 27,973 $ 57,709 $ 57,943 Net income attributable to noncontrolling interests 2,887 5,914 7,609 9,582 Net income attributable to Astrana Health 16,094 $ 22,059 $ 50,100 $ 48,361 Earnings per share - diluted 0.33 $ 0.47 $ 1.04 $ 1.03 EBITDA1 39,154 $ 42,818 $ 116,255 $ 102,823 Adjusted EBITDA1 45,170 $ 51,974 $ 135,332 $ 117,573 Astrana Health 1. See "Reconciliation of Net Income to EBITDA and Adjusted EBITDA" and "Use of Non-GAAP Financial Measures" slides for more information. 11 |
| Segment Results For the three months ended September 30, 2024 $ in thousands Care Partners Care Delivery Care Enablement Other Intersegment Elimination Corporate Costs Consolidated Total Total revenues $ 455,760 34,728 40,930 - (52,708) - 478,710 % change vs prior year quarter 42% 20% 11% 37% Cost of services 369,835 29,114 19,604 (13,335) 405,218 General and administrative expenses' 47,139 6,971 15,012 (39,370) 15,315 45,067 Total expenses 416,974 36,085 34,616 (52,705) 15,315 450,285 Income (loss) from operations $ 38,786 (1,357) 6,314 (3)2 (15,315) 28,425 % change vs prior year quarter (4%) 31% (2%) (27%) Astrana Health 1. Balance includes general and administrative expenses and depreciation and amortization. 2. Income from operations for the intersegment elimination represents rental income from segments renting from other segments. Rental income is presented within other income, which is not presented in the table. 12 |
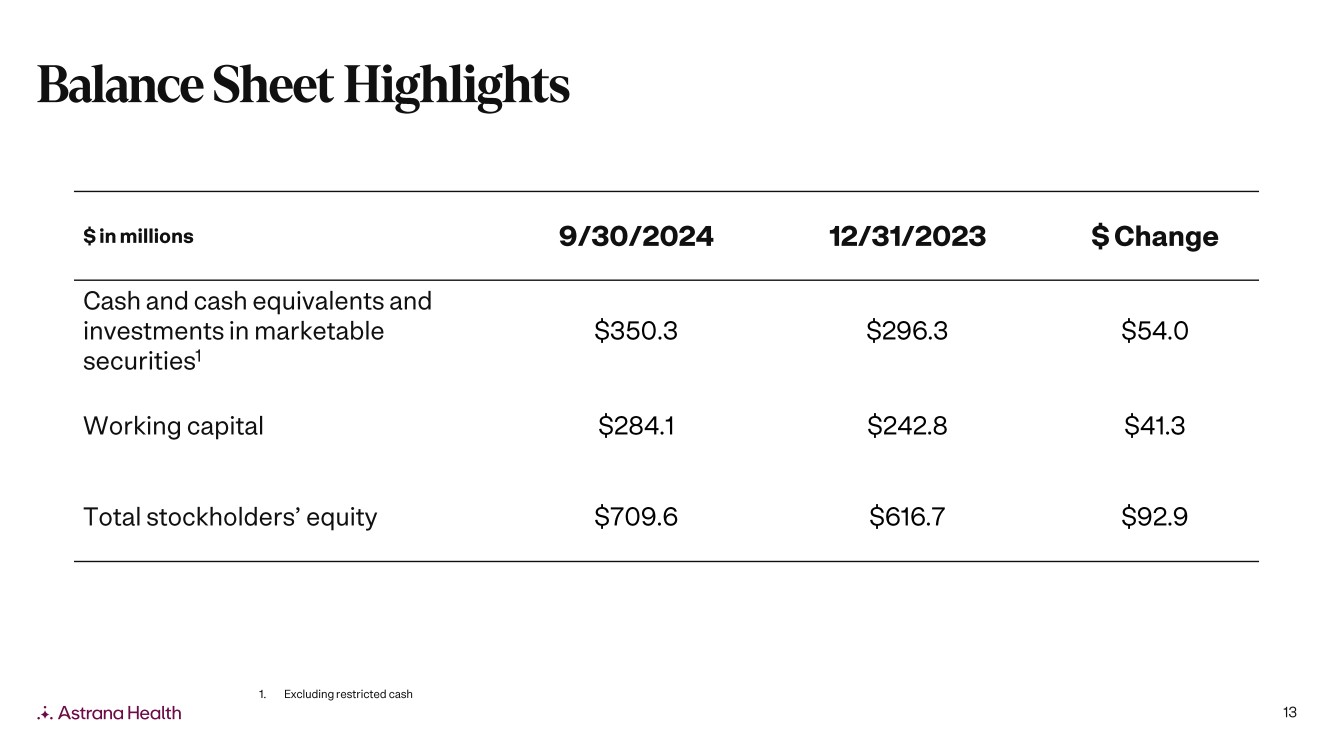
| Balance Sheet Highlights $ in millions 9/30/2024 12/31/2023 $ Change Cash and cash equivalents and investments in marketable $350.3 $296.3 $54.0 securities1 Working capital $284.1 $242.8 $41.3 Total stockholders' equity $709.6 $616.7 $92.9 1. Excluding restricted cash .. . Astrana Health 13 |
| Reconciliation of Net Income to EBITDA & Adjusted EBITDA $ in thousands Three Months Ended September 30, 2024 2023 Nine Months Ended September 30, 2024 2023 Net Income 18,981 27,973 57,709 57,943 Interest Expense 8,856 3,779 25,028 10,680 Interest income (3,778) (3,281) (11,287) (9,617) Provision for income taxes 7,831 10,042 25,004 30,971 Depreciation and amortization 7,264 4,305 19,801 12,846 EBITDA 39,154 42,818 116,255 102,823 Income from equity method investments (1,353) 2,016 (2,887) (3,160) Other, net 1,2062 1,7233 2,6634 1,5073 Stock-based compensation 6,163 5,706 19,301 13,364 APC excluded assets costs (289) 3,039 Adjusted EBITDA 45,170 $ 51,974 $ 135,332 $ 117,573 Adjusted EBITDA margin' 9% 15% 10% 11% Astrana Health 1. The Company defines Adjusted EBITDA margin as Adjusted EBITDA over total revenue. 2. Other, net for the three months ended September 30, 2024 relates to non-cash changes related to change in the fair value of our financing obligation to purchase the remaining equity interests in one of our investments, non-cash changes related to change in the fair value of the Company's Collar Agreement, non-cash gain on debt extinguishment related to one of our promissory note payables, and transaction costs incurred for our investments and tax restructuring fees. 3. Other, net for the three and nine months ended September 30, 2023 relates to transaction costs incurred for our investments and tax restructuring fees and non-cash changes related to change in the fair value of our financing obligation to purchase the remaining equity interests, changes in the fair value of our contingent liabilities, and changes in the fair value of the Company's Collar Agreement. 4. Other, net for the nine months ended September 30, 2024 relates to financial guarantee via a letter of credit that we provided almost three years ago in support of two local provider-led ACOs, non-cash changes related to change in the fair value of our financing obligation to purchase the remaining equity interests in one of our investments, non-cash changes related to change in the fair value of the Company's Collar Agreement, non-cash gain on debt extinguishment related to one of our promissory note payables, transaction costs incurred for our investments and tax restructuring fees, and reimbursement from a related party of the Company for taxes associated with the Excluded Assets spin-off. |
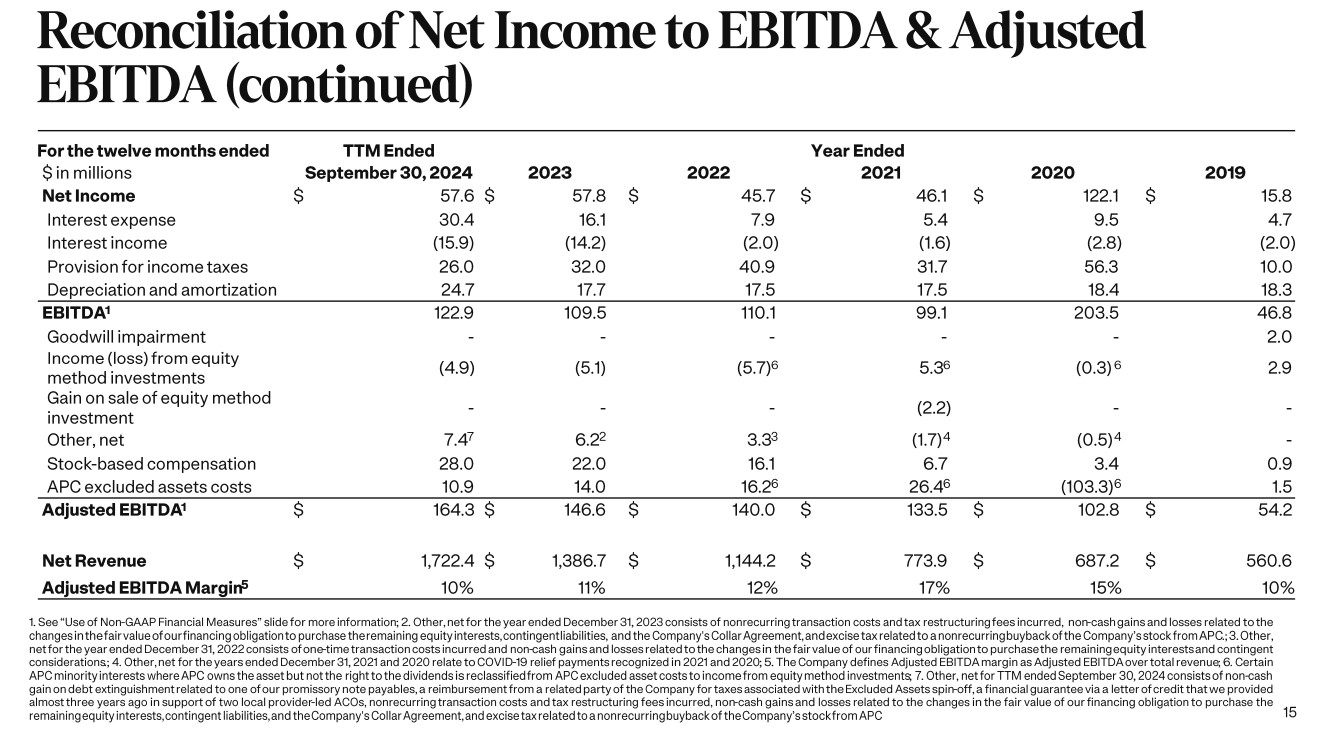
| Reconciliation of Net Income to EBITDA & Adjusted EBITDA (continued) For the twelve months ended TTM Ended Year Ended $ in millions September 30, 2024 2023 2022 2021 2020 2019 Net Income $ 57.6 $ 57.8 $ 45.7 $ 46.1 $ 122.1 15.8 Interest expense 30.4 16.1 7.9 5.4 9.5 4.7 Interest income (15.9) (14.2) (2.0) (1.6) (2.8) (2.0) Provision for income taxes 26.0 32.0 40.9 31.7 56.3 10.0 Depreciation and amortization 24.7 17.7 17.5 17.5 18.4 18.3 EBITDA' 122.9 109.5 110.1 99.1 203.5 46.8 Goodwill impairment - - - - 2.0 Income (loss) from equity method investments (4.9) (5.1) (5.7)6 5.36 (0.3) 6 2.9 Gain on sale of equity method investment - - (2.2) Other, net 7.47 6.22 3.33 (1.7) 4 (0.5) 4 - Stock-based compensation 28.0 22.0 16.1 6.7 3.4 0.9 APC excluded assets costs 10.9 14.0 16.26 26.46 (103.3)6 1.5 Adjusted EBITDA1 164.3 $ 146.6 $ 140.0 $ 133.5 $ 102.8 $ 54.2 Net Revenue 1,722.4 $ 1,386.7 $ 1,144.2 $ 773.9 $ 687.2 $ 560.6 Adjusted EBITDA Margins 10% 11% 12% 17% 15% 10% 1. See "Use of Non-GAAP Financial Measures" slide for more information; 2. Other, net for the year ended December 31, 2023 consists of nonrecurring transaction costs and tax restructuring fees incurred, non-cash gains and losses related to the changes in the fair value of our financing obligation to purchase the remaining equity interests, contingent liabilities, and the Company's Collar Agreement, and excise tax related to a nonrecurring buyback of the Company's stock from APC.; 3. Other, net for the year ended December 31, 2022 consists of one-time transaction costs incurred and non-cash gains and losses related to the changes in the fair value of our financing obligation to purchase the remaining equity interests and contingent considerations.; 4. Other, net for the years ended December 31, 2021 and 2020 relate to COVID-19 relief payments recognized in 2021 and 2020; 5. The Company defines Adjusted EBITDA margin as Adjusted EBITDA over total revenue; 6. Certain APC minority interests where APC owns the asset but not the right to the dividends is reclassified from APC excluded asset costs to income from equity method investments; 7. Other, net for TTM ended September 30, 2024 consists of non-cash gain on debt extinguishment related to one of our promissory note payables, a reimbursement from a related party of the Company for taxes associated with the Excluded Assets spin-off, a financial guarantee via a letter of credit that we provided almost three years ago in support of two local provider-led ACOs, nonrecurring transaction costs and tax restructuring fees incurred, non-cash gains and losses related to the changes in the fair value of our financing obligation to purchase the remaining equity interests, contingent liabilities, and the Company's Collar Agreement, and excise tax related to a nonrecurring buyback of the Company's stock from APC 15 |
| Updated Guidance Reconciliation of Net Income to EBITDA & Adjusted EBITDA 2024 Guidance Range (in thousands, $) Low High Net Income 59,340 66,240 Interest expense 18,750 18,750 Provision for income taxes 26,660 29,760 Depreciation and amortization 27,500 27,500 EBITDA 132,250 142,250 Loss (income) from equity method investments (4,250) (4,250) Other, net 5,000 5,000 Stock-based compensation 32,000 32,000 Adj. EBITDA 165,000 175,000 Note: See "Use of Non-GAAP Financial Measures" slide for more information. Astrana Health 16 |
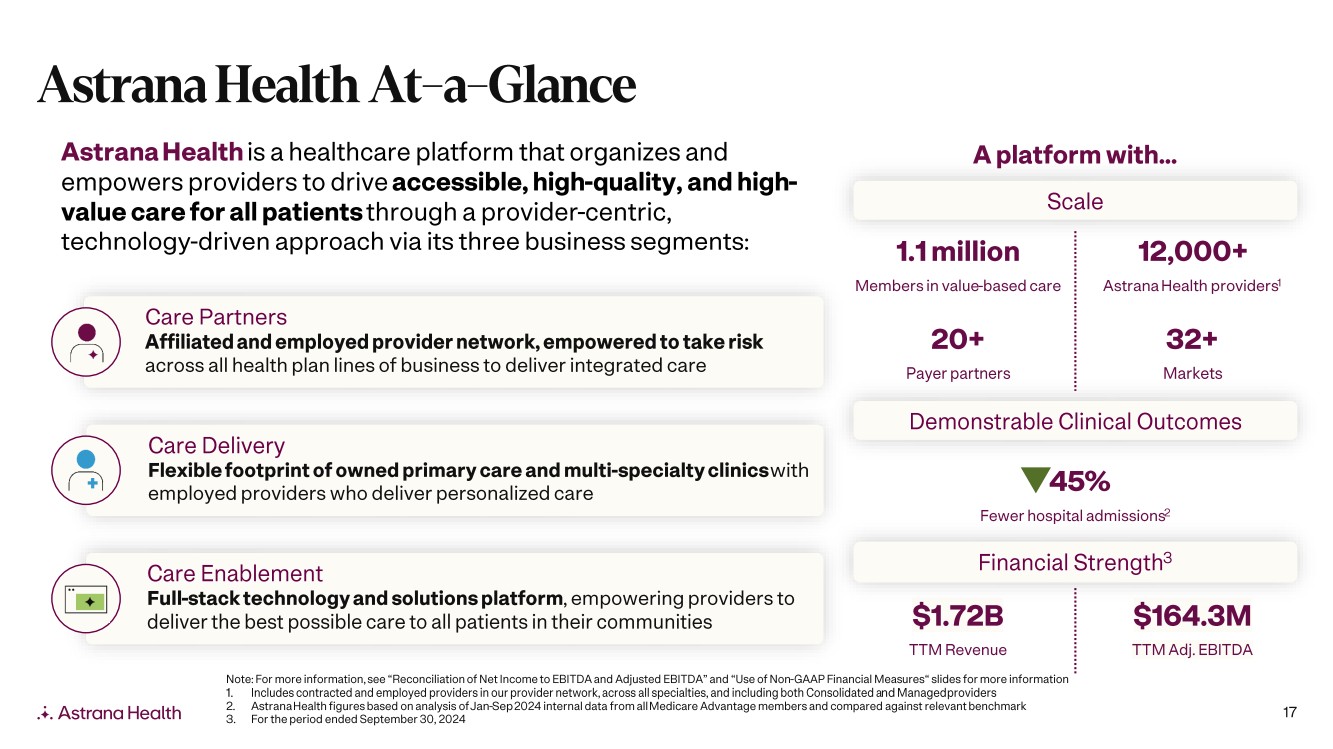
| Astrana Health At-a-Glance Astrana Health is a healthcare platform that organizes and empowers providers to drive accessible, high-quality, and high-value care for all patients through a provider-centric, technology-driven approach via its three business segments: • n+) Care Partners Affiliated and employed provider network, empowered to take risk across all health plan lines of business to deliver integrated care Care Delivery Flexible footprint of owned primary care and multi-specialty clinics with employed providers who deliver personalized care Care Enablement Full-stack technology and solutions platform, empowering providers to deliver the best possible care to all patients in their communities Astrana Health A platform with... Scale 1.1million Members in value-based care 20+ Payer partners 12,000+ Astrana Health providers' 32+ Markets Demonstrable Clinical Outcomes v45% Fewer hospital admissions2 Financial Strength3 $1.72B TTM Revenue Note: For more information, see "Reconciliation of Net Income to EBITDA and Adjusted EBITDA" and "Use of Non-GAAP Financial Measures" slides for more information 1. Includes contracted and employed providers in our provider network, across all specialties, and including both Consolidated and Managed providers 2. Astrana Health figures based on analysis of Jan-Sep 2024 internal data from all Medicare Advantage members and compared against relevant benchmark 3. For the period ended September 30, 2024 $164.3M TTM Adj. EBITDA 17 |
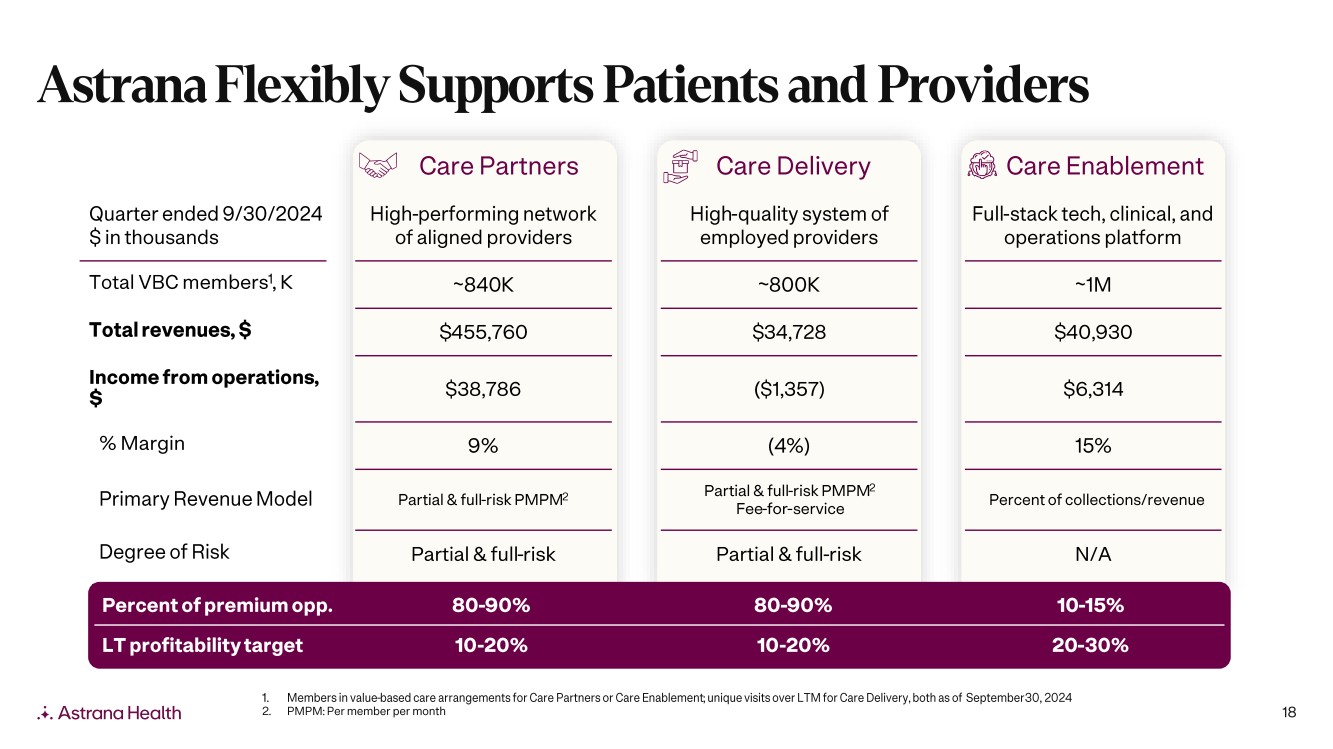
| Astrana Flexibly Supports Patients and Providers Quarter ended 9/30/2024 $ in thousands Total VBC membersl, K Total revenues, $ Income from operations, % Margin Primary Revenue Model Degree of Risk Care Partners High-performing network of aligned providers in Care Delivery High-quality system of employed providers 47) Care Enablement Full-stack tech, clinical, and operations platform -840K -800K -1M $455,760 $34,728 $40,930 $38,786 ($1,357) $6,314 9% (4%) 15% Partial & full-risk PM PM2 Partial & full-risk Partial & full-risk PM PM2 Fee-for-service Partial & full-risk Percent of collections/revenue N/A Percent of premium opp. 80-90% 80-90% 10-15% LT profitability target 10-20% 10-20% 20-30% Astrana Health 1. Members in value-based care arrangements for Care Partners or Care Enablement; unique visits over LTM for Care Delivery, both as of September 30, 2024 2. PMPM: Per member per month 18 |
| 0 AMR inve rr o Investor Relations Asher Dewhurst (626) 943-6491 a anahealth.com Agtrana Health |