Exhibit 99.1

Astrana Health, Inc. Reports Fourth Quarter and Year-End 2024 Results
Company to Host Conference Call on Thursday, February 27, 2025, at 2:30 p.m. PT/5:30 p.m. ET
ALHAMBRA, Calif., February 27, 2025 /PRNewswire/ -- Astrana Health, Inc. (“Astrana,” and together with its subsidiaries and affiliated entities, the “Company”) (NASDAQ: ASTH), a leading provider-centric, technology-powered healthcare company enabling providers to deliver accessible, high-quality, and high-value care to all, today announced its consolidated financial results for the fourth quarter and year ended December 31, 2024.
“Astrana Health’s strong performance in 2024 highlights the strength of our patient-centered, payer-agnostic platform and our unwavering commitment to delivering high-quality, accessible care. Our significant growth and geographic expansion, alongside robust financial performance, are a direct result of our disciplined execution across the four pillars of the Astrana playbook, " said President and CEO of Astrana, Brandon K. Sim.
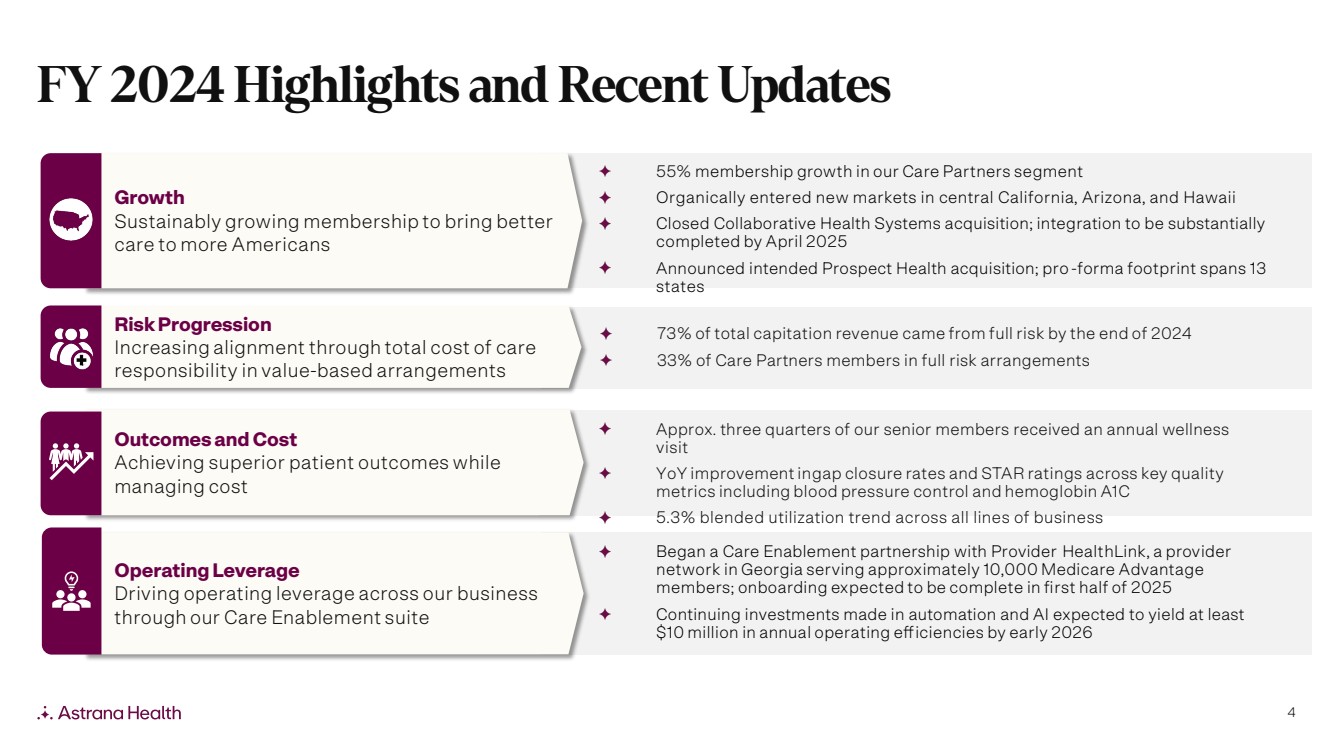
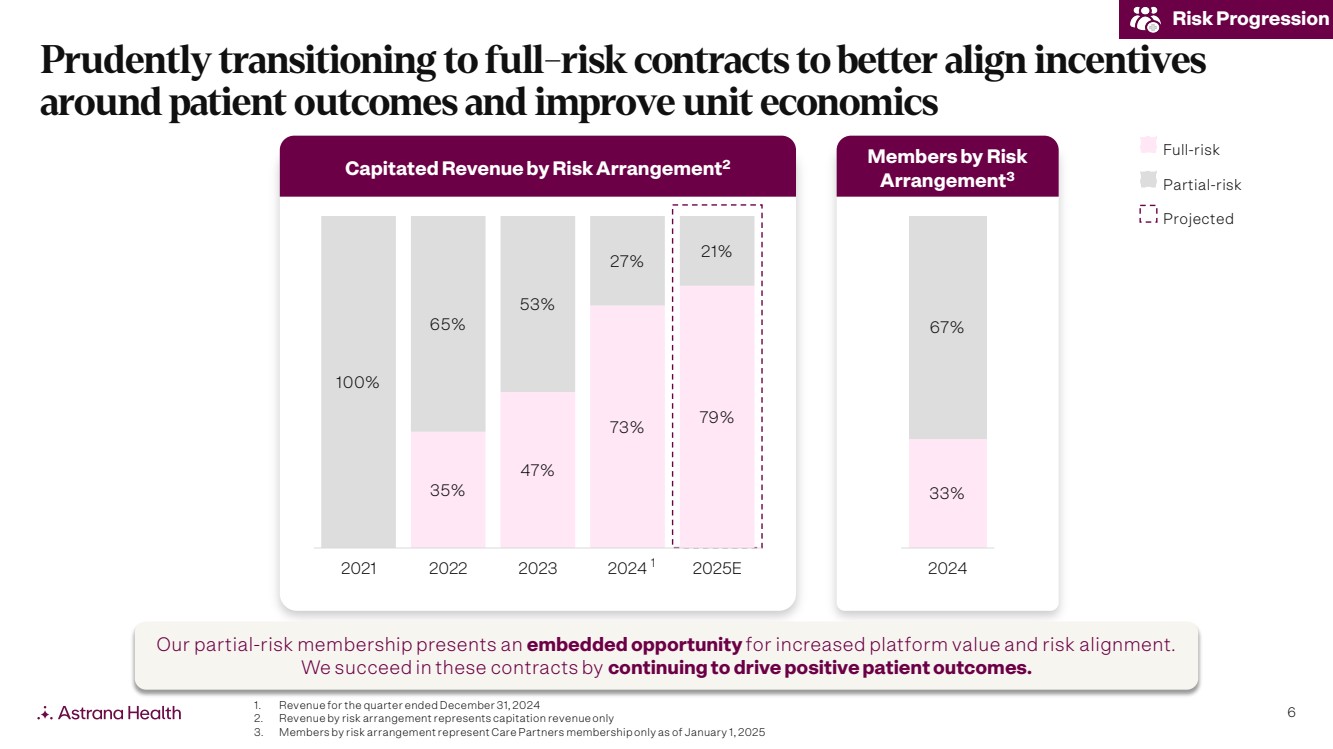
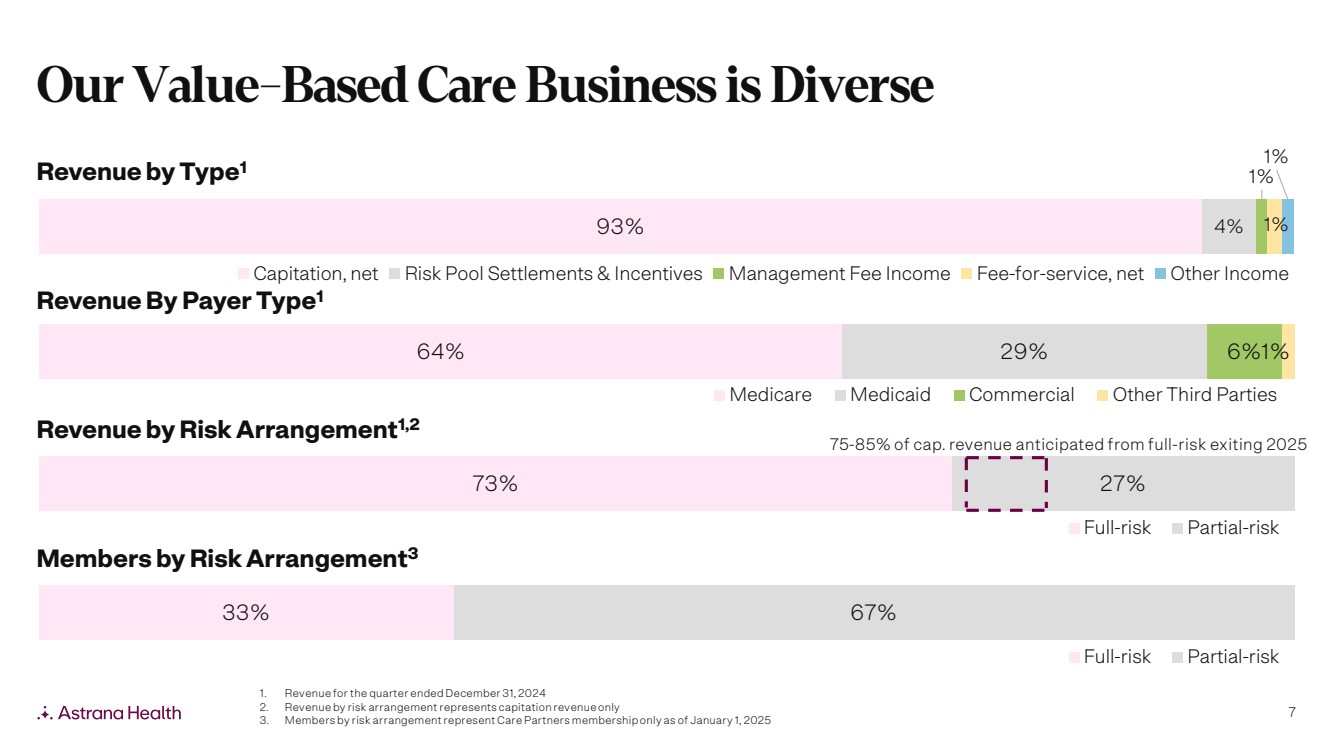
"Looking ahead, we remain focused on growing membership sustainably, further improving quality of care for our membership while responsibly managing costs, growing the 73% of our capitated revenue that now comes from full-risk arrangements, and driving operating leverage and integration of recently acquired assets. We are confident that our platform, combined with our proven ability to navigate industry headwinds and a favorable outlook on future reimbursement rates, will continue delivering sustainable, long-term value for all our stakeholders - patients, physicians, providers, payers, and shareholders."
Financial Highlights for Year Ended December 31, 2024:
All comparisons are to the year ended December 31, 2023 unless otherwise stated.
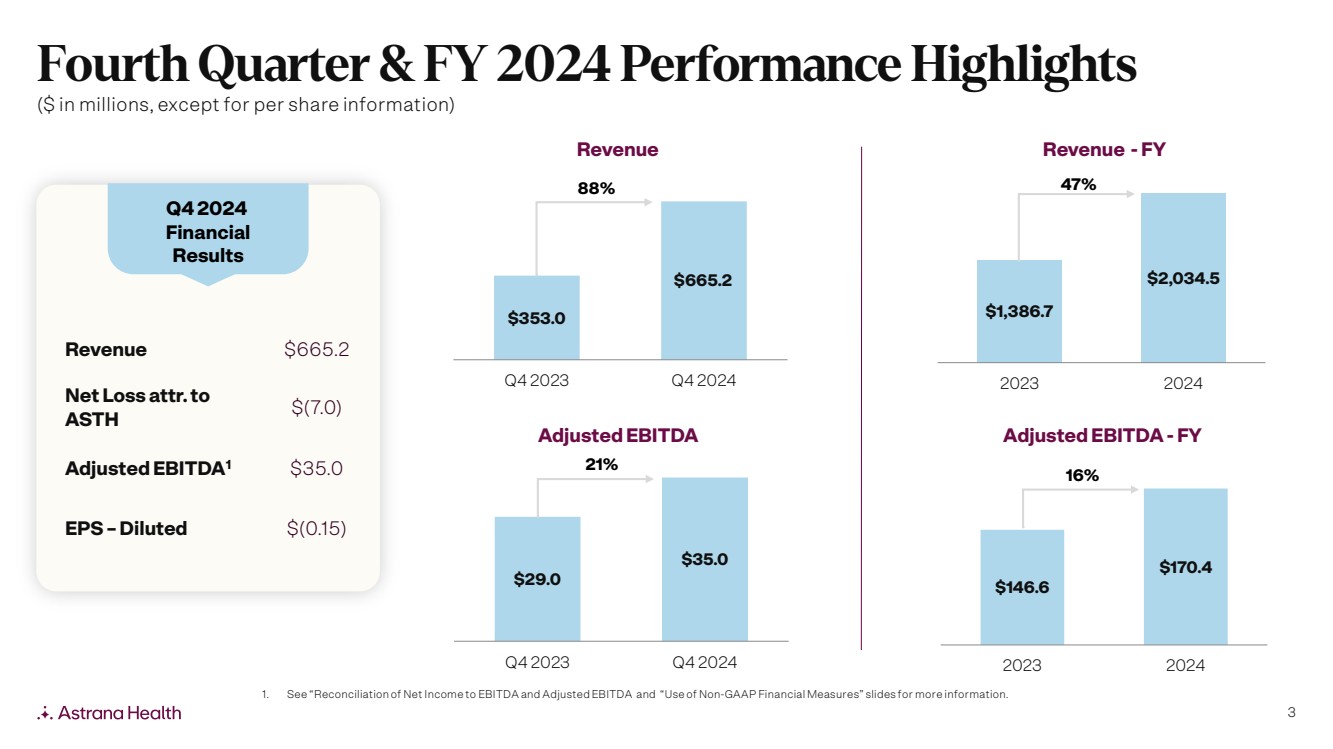
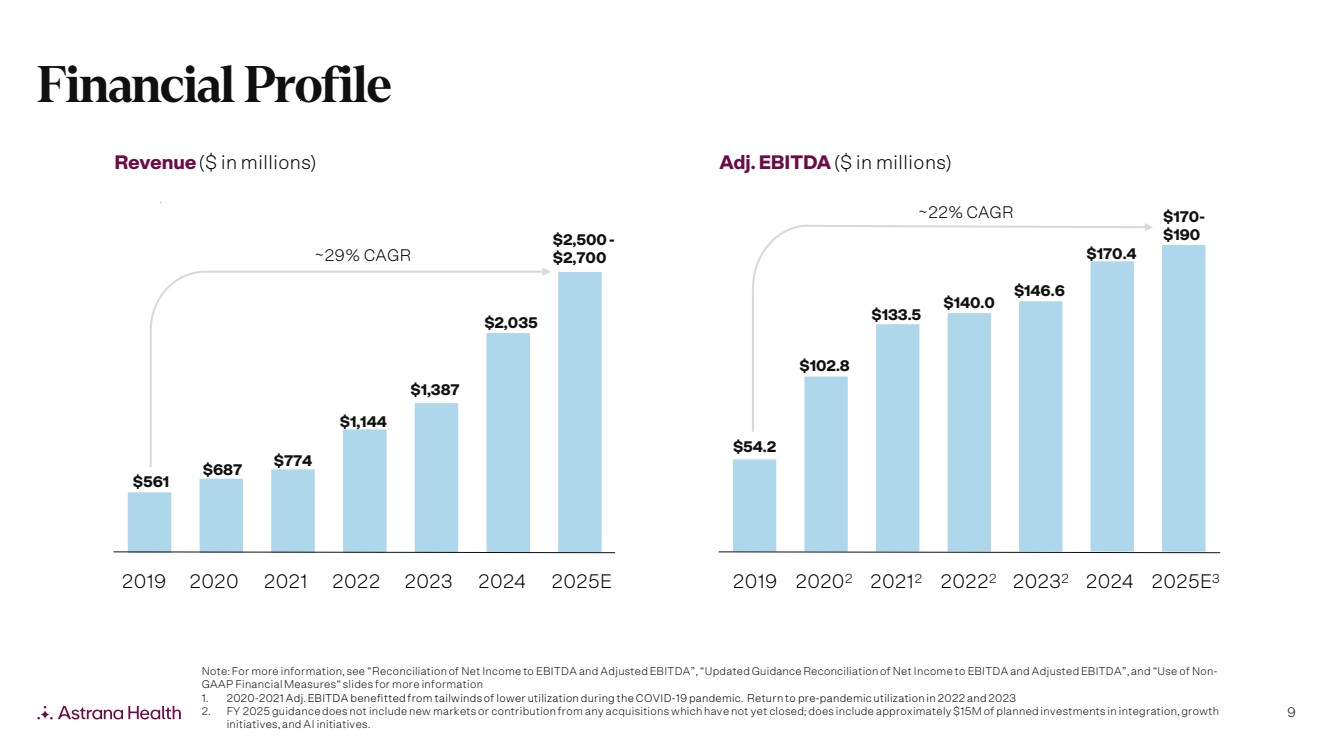
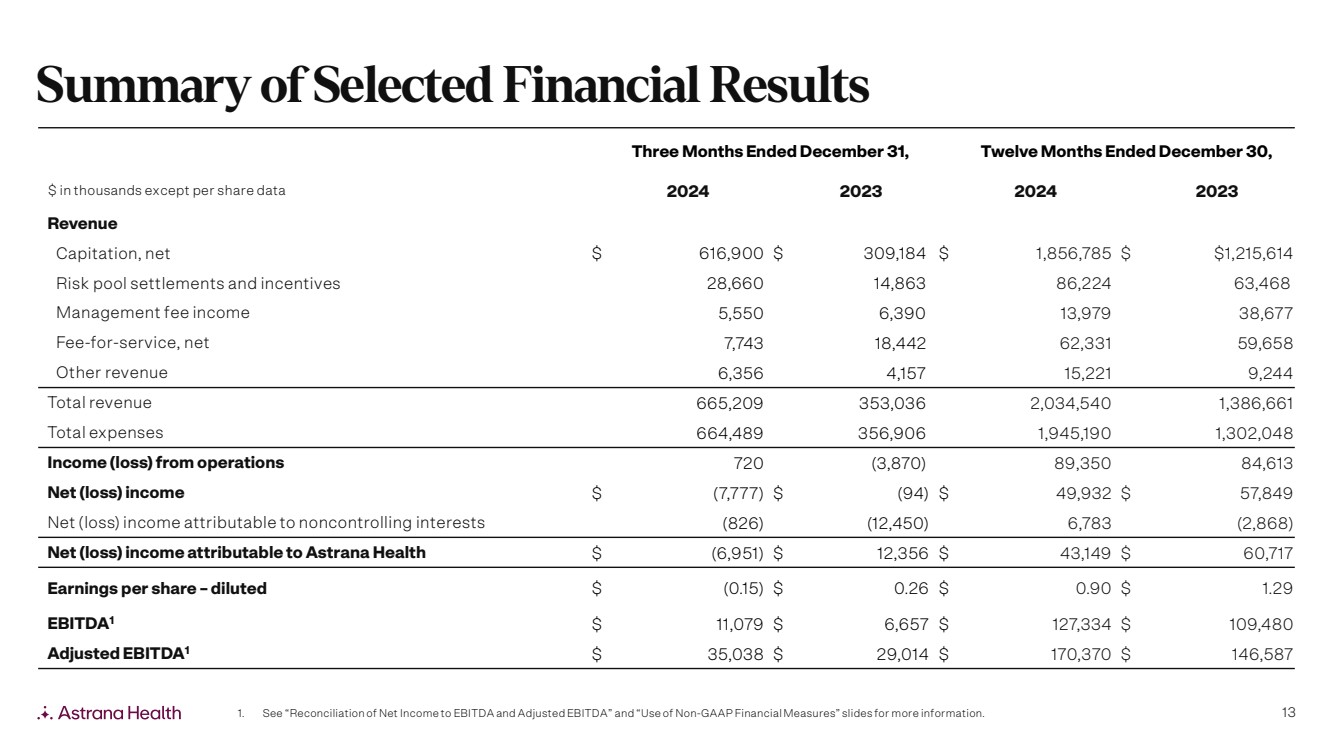
| • | Total revenue of $2,034.5 million, up 47% from $1,386.7 million |
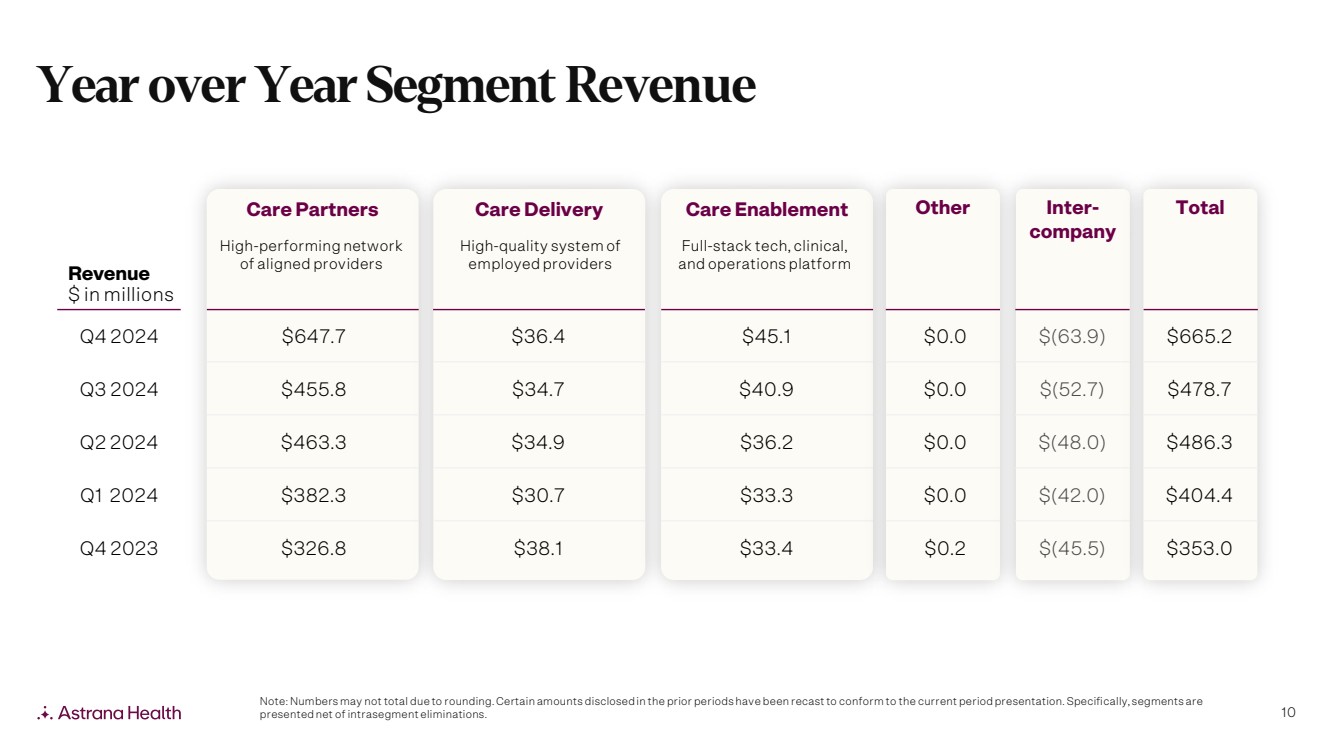
| • | Care Partners revenue of $1,949.0 million, up 52% from $1,284.1 million |
| • | Net income attributable to Astrana of $43.1 million, compared to $60.7 million |
| • | Earnings per share - diluted (“EPS - diluted”) of $0.90, compared to $1.29 per share |
| • | Adjusted EBITDA(1) of $170.4 million, up 16% from $146.6 million |
(1) See “Reconciliation of Net Income to EBITDA, Adjusted EBITDA and Adjusted EBITDA Margin” and “Use of Non-GAAP Financial Measures” below for additional information.
Financial Highlights for the Fourth Quarter 2024:
All comparisons are to the quarter ended December 31, 2023 unless otherwise stated.
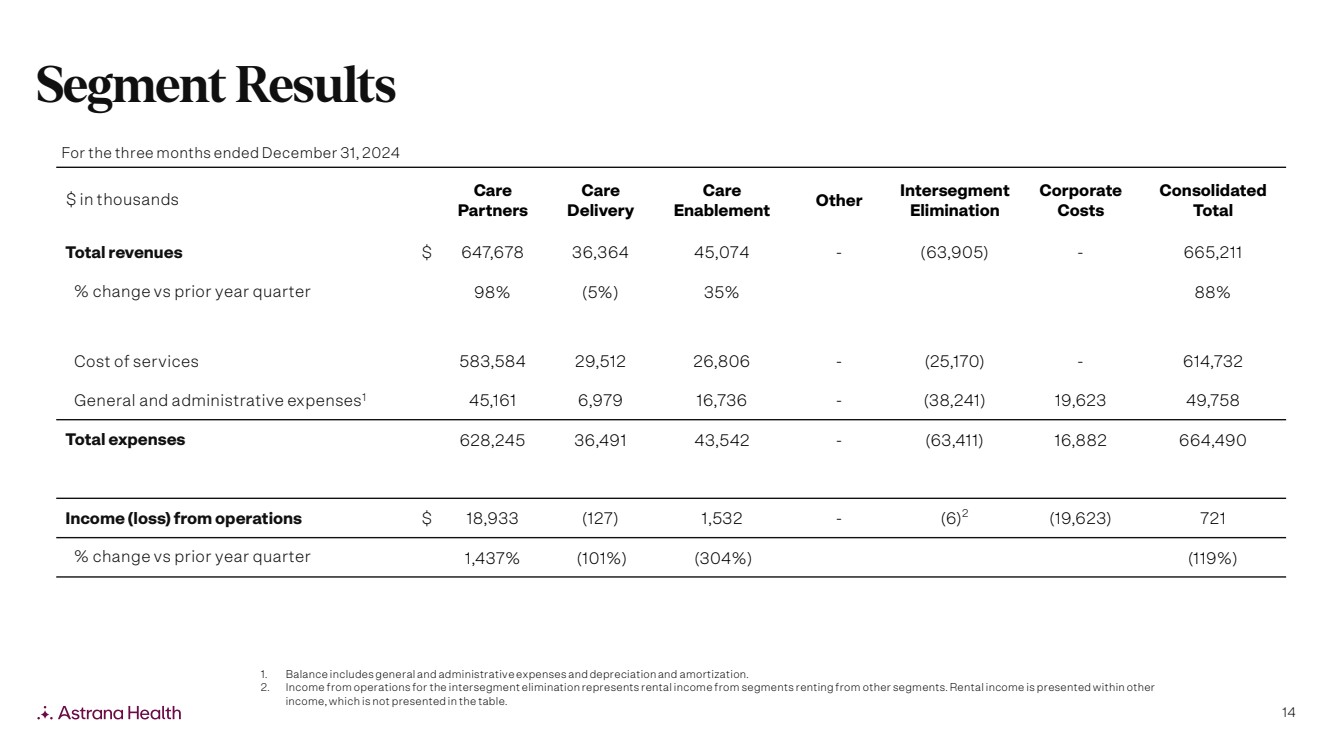
| • | Total revenue of $665.2 million, up 88% from $353.0 million |
| • | Care Partners revenue of $647.7 million, up 98% from $326.8 million |
| • | Net loss attributable to Astrana of $7.0 million, compared to income of $12.4 million |
| • | (Loss) earnings per share - basic and diluted (“EPS - basic and diluted”) of $(0.15), compared to $0.26 per share |
| • | Adjusted EBITDA(1) of $35.0 million, up 21% from $29.0 million |
(1) See “Reconciliation of Net Income to EBITDA, Adjusted EBITDA and Adjusted EBITDA Margin” and “Use of Non-GAAP Financial Measures” below for additional information.
Recent Operating Highlights
| • | In late 2024, Astrana began a Care Enablement partnership with Provider HealthLink, or PHL, a provider network in Georgia. Astrana plans to support PHL in serving approximately 10,000 Medicare Advantage members, and the group is expected to be onboarded onto Astrana's Care Enablement platform in the first half of 2025. |
| • | On February 26, 2025, the Company amended its credit agreement with Truist Bank, in its capacities as administrative agent for the lenders (the “Second Amended and Restated Credit Agreement”). The Second Amended and Restated Credit Agreement provides for (a) a five-year revolving credit facility to the Company of $300.0 million which includes a letter of credit sub-facility of up to $100.0 million and a swingline loan sub-facility of $25.0 million, (b) a five-year term loan A credit facility to the Company of $250.0 million and (c) a five-year delayed draw term loan credit facility to the Company of $745.0 million. The term loan A and revolving credit facilities will be used to, among other things, refinance certain existing indebtedness of the Company and certain subsidiaries, pay transactions costs and expenses arising in connection with the Second Amended and Restated Credit Agreement, and provide for working capital needs and other general corporate purposes, and, in addition to the foregoing, the revolving credit facility will also be used to finance certain future permitted acquisitions and permitted investments and capital expenditures. The delayed draw term loan facility will be used to finance the acquisition of certain assets contemplated by that certain asset and equity purchase agreement, dated November 8, 2024, by and among the Company, Prospect Medical Holdings, Inc., in its capacity as the seller representative, and certain other parties party thereto, and to pay any fees and expenses associated therewith. |
| • | Eight of Astrana’s affiliates have been recognized as Elite status recipients in the 2024 Standards of Excellence (“SOE”) survey by America’s Physician Groups (“APG”), attaining the highest Elite five-star status in all categories. This annual comprehensive survey is administered by APG to evaluate which physician groups are best positioned to provide coordinated, patient-centered, and cost-effective care. |
| • | On January 17, 2025, the Company repurchased 300,000 shares of the Company’s common stock from Allied Physicians of California ("APC"), pursuant to a stock repurchase agreement, for an aggregate purchase price of approximately $10.6 million, based on a purchase price per share of $35.17, which was the closing price of the Company’s common stock on Nasdaq on the date the agreement was executed. APC is a consolidated affiliate of the Company. |
Segment Results for the Year Ended December 31, 2024:
All comparisons are to the year ended December 31, 2023 unless otherwise stated.
| Years Ended December 31, 2024 | ||||||||||||||||||||||||||||
| (in thousands) | Care Partners |
Care Delivery |
Care Enablement |
Other | Intersegment Elimination |
Corporate Costs |
Consolidated Total |
|||||||||||||||||||||
| Total revenues | $ | 1,949,033 | $ | 136,668 | $ | 155,448 | $ | — | $ | (206,609 | ) | $ | — | $ | 2,034,540 | |||||||||||||
| % change vs. prior year | 52 | % | 16 | % | 14 | % | ||||||||||||||||||||||
| Cost of services | 1,633,021 | 109,672 | 83,720 | — | (63,261 | ) | — | 1,763,152 | ||||||||||||||||||||
| General and administrative(1) | 174,774 | 26,893 | 53,461 | — | (143,433 | ) | 70,343 | 182,038 | ||||||||||||||||||||
| Total expenses | 1,807,795 | 136,565 | 137,181 | — | (206,694 | ) | 70,343 | 1,945,190 | ||||||||||||||||||||
| Income (loss) from operations | $ | 141,238 | $ | 103 | $ | 18,267 | $ | — | $ | 85 | (2) | $ | (70,343 | ) | $ | 89,350 | ||||||||||||
| % change vs. prior year | 54 | % | (98 | )% | (4 | )% | ||||||||||||||||||||||
(1) Balance includes general and administrative expenses and depreciation and amortization.
(2) Income from operations for the intersegment elimination represents rental income from segments renting from other segments. Rental income is presented within other income which is not presented in the table.
2025 Guidance:
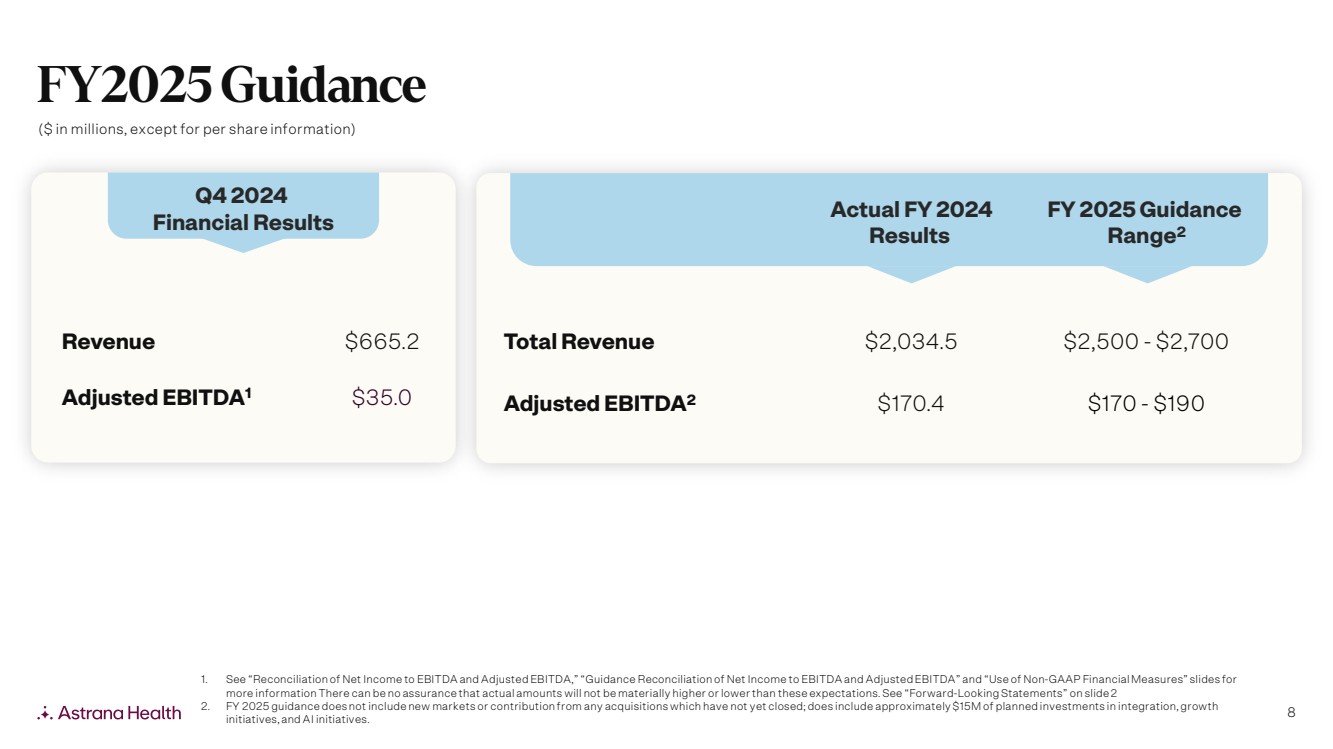
Astrana is providing the following guidance for total revenue and Adjusted EBITDA, based on the Company’s existing business, current view of existing market conditions and assumptions for the year ending December 31, 2025. The following guidance includes approximately $15 million in expected costs associated with continued strategic investments in automation and AI, as well as ongoing and expected integration costs associated with planned acquisitions, but does not include contributions from any acquisitions which have not yet closed.
| 2025 Guidance Range | ||||||||
| ($ in millions) | Low | High | ||||||
| Total revenue | $ | 2,500 | $ | 2,700 | ||||
| Adjusted EBITDA | $ | 170 | $ | 190 | ||||
See “Guidance Reconciliation of Net Income to EBITDA and Adjusted EBITDA” and “Use of Non-GAAP Financial Measures” below for additional information. There can be no assurance that actual amounts will not be materially higher or lower than these expectations. See “Forward-Looking Statements” below for additional information.
Conference Call and Webcast Information:
Astrana will host a conference call at 2:30 p.m. PT/5:30 p.m. ET today (February 27, 2025), during which management will discuss the results of the fourth quarter and year ended December 31, 2024. To participate in the conference call, please use the following dial-in numbers about 5 minutes prior to the scheduled conference call time:
U.S. & Canada (Toll-Free): +1 (877) 858-9810
International (Toll): +1 (201) 689-8517
The conference call can also be accessed via webcast at:
https://event.choruscall.com/mediaframe/webcast.html?webcastid=VvYSvHe6
An accompanying slide presentation will be available in PDF format on the “IR Calendar” page of the Company’s website (https://ir.astranahealth.com/news-events/ir-calendar) after issuance of the earnings release and will be furnished as an exhibit to Astrana’s current report on Form 8-K to be filed with the SEC, accessible at www.sec.gov.
Those who are unable to attend the live conference call may access the recording at the above webcast link, which will be made available shortly after the conclusion of the call.
Note About Consolidated Entities
The Company consolidates entities in which it has a controlling financial interest. The Company consolidates subsidiaries in which it holds, directly or indirectly, more than 50% of the voting rights, and variable interest entities (“VIEs”) in which the Company is the primary beneficiary. Noncontrolling interests represent third party equity ownership interests in the Company’s consolidated entities (including certain VIEs). The amount of net income attributable to noncontrolling interests is disclosed in the Company’s consolidated statements of income.
Note About Stockholders’ Equity, Certain Treasury Stock and Earnings Per Share
As of the date of this press release, 41,048 holdback shares have not been issued to certain former shareholders of the Company’s subsidiary, Astrana Health Management, Inc. (“AHM”), formerly known as Network Medical Management, Inc., who were AHM shareholders at the time of closing of the merger, as they have yet to submit properly completed letters of transmittal to Astrana in order to receive their pro rata portion of Astrana’s common stock and warrants as contemplated under that certain Agreement and Plan of Merger, dated December 21, 2016, among Astrana, AHM, Apollo Acquisition Corp. (“Merger Subsidiary”) and Kenneth Sim, M.D., as amended, pursuant to which Merger Subsidiary merged with and into AHM, with AHM as the surviving corporation. Pending such receipt, such former AHM shareholders have the right to receive, without interest, their pro rata share of dividends or distributions with a record date after the effectiveness of the merger. The Company’s consolidated financial statements have treated such shares of common stock as outstanding, given the receipt of the letter of transmittal is considered perfunctory and Astrana is legally obligated to issue these shares in connection with the merger.
Shares of Astrana’s common stock owned by Allied Physicians of California, a Professional Medical Corporation (“APC”), a VIE of the Company, are legally issued and outstanding but excluded from shares of common stock outstanding in the Company’s consolidated financial statements, as such shares are treated as treasury shares for accounting purposes. Such shares, therefore, are not included in the number of shares of common stock outstanding used to calculate the Company’s earnings per share.
About Astrana Health, Inc.
Astrana Health, Inc. (“Astrana”) is a leading physician-centric, technology-powered, risk-bearing healthcare management company. Leveraging its proprietary population health management and healthcare delivery platform, Astrana operates an integrated, value-based healthcare model, which aims to empower the providers in its network to deliver the highest quality of care to its patients in a cost-effective manner. Together with our affiliated physician groups and consolidated entities, we provide coordinated outcomes-based medical care in a cost-effective manner.
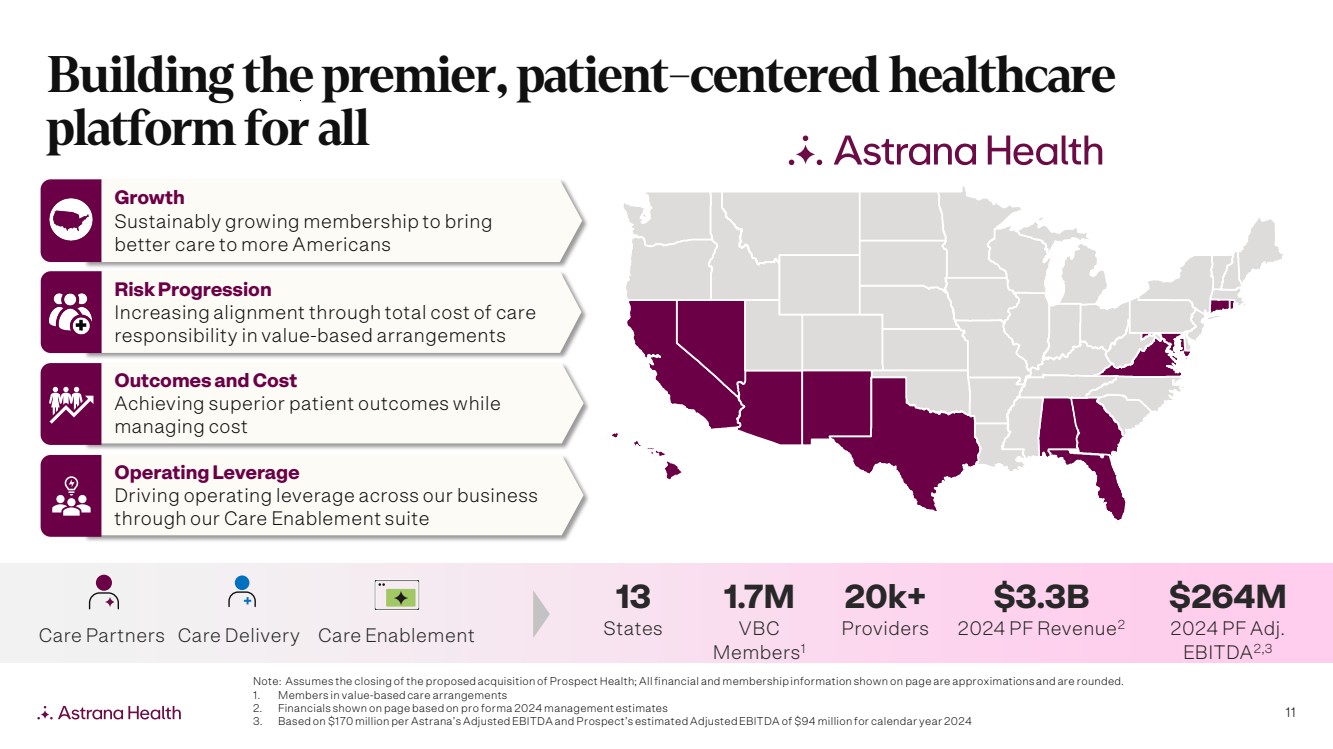
Headquartered in Alhambra, California, Astrana serves over 10,000 providers and approximately 1.1 million patients in value-based care arrangements. Its subsidiaries and affiliates include management services organizations (MSOs), a network of risk-bearing organizations ("RBOs") that encompasses independent practice associations ("IPAs"), accountable care organizations ("ACOs"), and state-specific entities such as Restricted Knox-Keene licensed health plans in California, and care delivery entities across primary, multi-specialty, and ancillary care. For more information, please visit www.astranahealth.com.
Forward-Looking Statements
This press release contains forward-looking statements within the meaning of the Private Securities Litigation Reform Act of 1995, such as statements about the Company’s guidance for the year ending December 31, 2025, ability to meet operational goals, ability to meet expectations in deployment of care coordination and management capabilities, ability to decrease cost of care while improving quality and outcomes, ability to deliver sustainable revenue and EBITDA growth as well as long-term value, ability to respond to the changing environment, and successful implementation of strategic growth plans, acquisition strategy, and merger integration efforts. Forward-looking statements reflect current views with respect to future events and financial performance and therefore cannot be guaranteed. Such statements are based on the current expectations and certain assumptions of the Company’s management, and some or all of such expectations and assumptions may not materialize or may vary significantly from actual results. Actual results may also vary materially from forward-looking statements due to risks, uncertainties and other factors, known and unknown, including the risk factors described from time to time in the Company’s reports to the SEC, including, without limitation the risk factors discussed in the Company’s last Annual Report on Form 10-K and any subsequent quarterly reports on Form 10-Q filed with the SEC. Any forward-looking statement made by the Company in this release speaks only as of the date on which it is made. The Company undertakes no obligation to publicly update any forward-looking statement, whether as a result of new information, future developments or otherwise, except as may be required by any applicable securities laws.
FOR MORE INFORMATION, PLEASE CONTACT:
Investor Relations
(626) 943-6491
Asher Dewhurst, ICR Westwicke
[email protected]
ASTRANA HEALTH, INC.
CONDENSED CONSOLIDATED BALANCE SHEETS
(IN THOUSANDS, EXCEPT SHARE AND PER SHARE DATA)
| December 31, 2024 | December 31, 2023 | |||||||
| (Unaudited) | ||||||||
| Assets | ||||||||
| Current assets | ||||||||
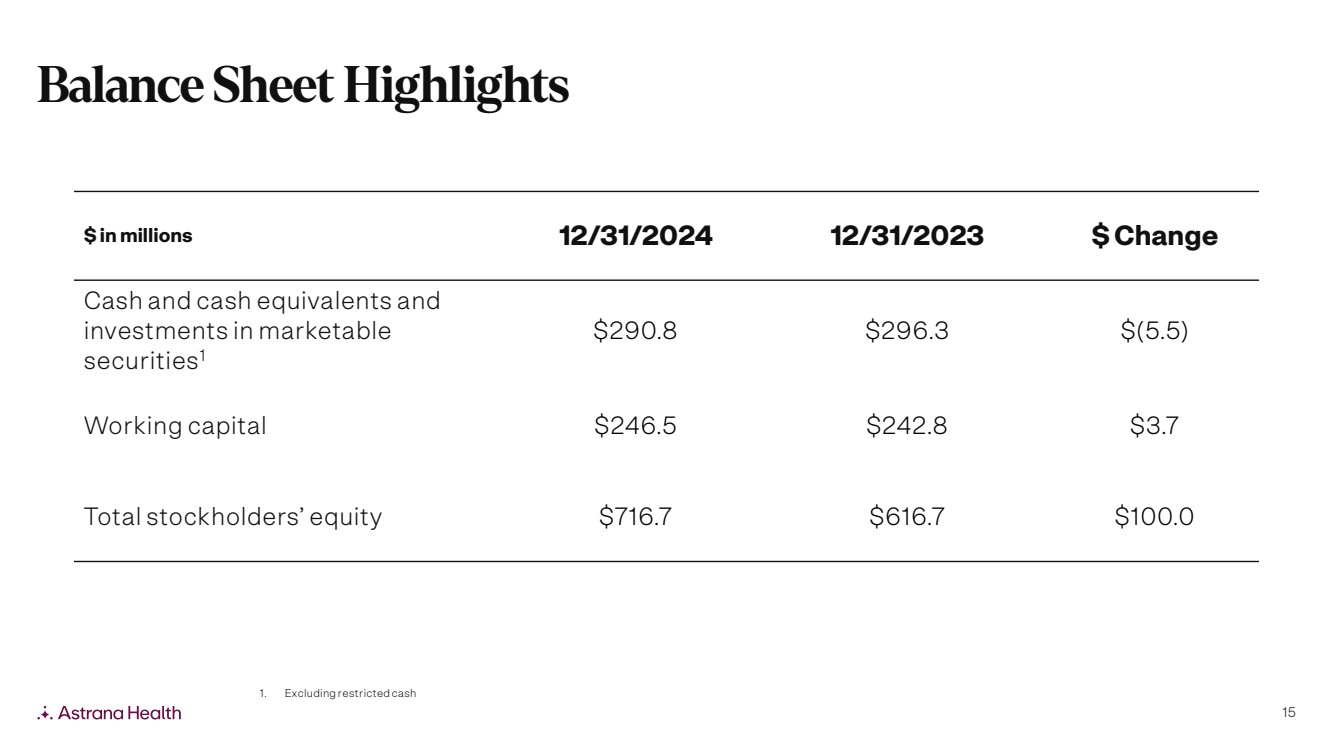
| Cash and cash equivalents | $ | 288,455 | $ | 293,807 | ||||
| Investment in marketable securities | 2,378 | 2,498 | ||||||
| Receivables, net | 226,739 | 76,780 | ||||||
| Receivables, net – related parties | 50,257 | 58,980 | ||||||
| Income taxes receivable | 19,316 | 10,657 | ||||||
| Other receivables | 3,656 | 1,335 | ||||||
| Prepaid expenses and other current assets | 22,861 | 17,450 | ||||||
| Total current assets | 613,662 | 461,507 | ||||||
| Non-current assets | ||||||||
| Property and equipment, net | 14,274 | 7,171 | ||||||
| Intangible assets, net | 126,179 | 71,648 | ||||||
| Goodwill | 437,651 | 278,831 | ||||||
| Income taxes receivable | 15,943 | 15,943 | ||||||
| Loans receivable, non-current | 51,266 | 26,473 | ||||||
| Investments in other entities – equity method | 39,319 | 25,774 | ||||||
| Investments in privately held entities | 8,896 | 6,396 | ||||||
| Restricted cash | 646 | 345 | ||||||
| Operating lease right-of-use assets | 32,601 | 37,396 | ||||||
| Other assets | 16,021 | 1,877 | ||||||
| Total non-current assets | 742,796 | 471,854 | ||||||
| Total assets(1) | $ | 1,356,458 | $ | 933,361 | ||||
| Liabilities, Mezzanine Deficit, and Stockholders’ Equity | ||||||||
| Current liabilities | ||||||||
| Accounts payable and accrued expenses | $ | 114,650 | $ | 59,949 | ||||
| Fiduciary accounts payable | 8,223 | 7,737 | ||||||
| Medical liabilities | 209,039 | 106,657 | ||||||
| Dividend payable | 638 | 638 | ||||||
| Finance lease liabilities | 554 | 646 | ||||||
| Operating lease liabilities | 5,350 | 4,607 | ||||||
| Current portion of long-term debt | 9,375 | 19,500 | ||||||
| Other liabilities | 19,343 | 18,940 | ||||||
| Total current liabilities | 367,172 | 218,674 | ||||||
| December 31, 2024 | December 31, 2023 | |||||||
| (Unaudited) | ||||||||
| Non-current liabilities | ||||||||
| Deferred tax liability | 4,555 | 4,072 | ||||||
| Finance lease liabilities, net of current portion | 607 | 1,033 | ||||||
| Operating lease liabilities, net of current portion | 30,654 | 36,289 | ||||||
| Long-term debt, net of current portion and deferred financing costs | 425,299 | 258,939 | ||||||
| Other long-term liabilities | 14,003 | 3,586 | ||||||
| Total non-current liabilities | 475,118 | 303,919 | ||||||
| Total liabilities(1) | 842,290 | 522,593 | ||||||
| Commitments and contingencies | ||||||||
| Mezzanine deficit | ||||||||
| Non-controlling interest in Allied Physicians of California, a Professional Medical Corporation (“APC”) |
(202,558 | ) | (205,883 | ) | ||||
| Stockholders’ equity | ||||||||
| Preferred stock, $0.001 par value per share; 5,000,000 shares authorized as of December 31, 2024 and December 31, 2023 | ||||||||
| Series A Preferred stock, zero authorized and issued and zero outstanding as of December 31, 2024 and 1,111,111 authorized and issued and zero outstanding as of December 31, 2023 | — | — | ||||||
| Series B Preferred stock, zero authorized and issued and zero outstanding as of December 31, 2024 and 555,555 authorized and issued and zero outstanding as of December 31, 2023 | — | — | ||||||
| Common stock, $0.001 par value per share; 100,000,000 shares authorized, 47,929,872 and 46,843,743 shares issued and outstanding, excluding 10,603,849 and 10,584,340 treasury shares, as of December 31, 2024 and December 31, 2023, respectively | 48 | 47 | ||||||
| Additional paid-in capital | 426,389 | 371,037 | ||||||
| Retained earnings | 286,283 | 243,134 | ||||||
| Total stockholders’ equity | 712,720 | 614,218 | ||||||
| Non-controlling interest | 4,006 | 2,433 | ||||||
| Total equity | 716,726 | 616,651 | ||||||
| Total liabilities, mezzanine deficit, and stockholders’ equity | $ | 1,356,458 | $ | 933,361 | ||||
(1) The Company’s condensed consolidated balance sheets include the assets and liabilities of its consolidated VIEs. The condensed consolidated balance sheets include total assets that can be used only to settle obligations of the Company’s consolidated VIEs totaling $761.4 million and $540.8 million as of December 31, 2024 and December 31, 2023, respectively, and total liabilities of the Company’s consolidated VIEs for which creditors do not have recourse to the general credit of the primary beneficiary of $253.7 million and $146.0 million as of December 31, 2024 and December 31, 2023, respectively. These VIE balances do not include $224.9 million of investment in affiliates and $48.5 million of amounts due to affiliates as of December 31, 2024, and $273.2 million of investment in affiliates and $107.3 million of amounts due to affiliates as of December 31, 2023, as these are eliminated upon consolidation and not presented within the condensed consolidated balance sheets.
ASTRANA HEALTH, INC.
CONSOLIDATED STATEMENTS OF INCOME
(IN THOUSANDS, EXCEPT PER SHARE AMOUNTS)
(UNAUDITED)
| Three Months Ended December 31, | Year Ended December 31, | |||||||||||||||
| 2024 | 2023 | 2024 | 2023 | |||||||||||||
| Revenue | ||||||||||||||||
| Capitation, net | $ | 616,900 | $ | 309,184 | $ | 1,856,785 | $ | 1,215,614 | ||||||||
| Risk pool settlements and incentives | 28,660 | 14,863 | 86,224 | 63,468 | ||||||||||||
| Management fee income | 5,550 | 6,390 | 13,979 | 38,677 | ||||||||||||
| Fee-for-service, net | 7,743 | 18,442 | 62,331 | 59,658 | ||||||||||||
| Other revenue | 6,356 | 4,157 | 15,221 | 9,244 | ||||||||||||
| Total revenue | 665,209 | 353,036 | 2,034,540 | 1,386,661 | ||||||||||||
| Operating expenses | ||||||||||||||||
| Cost of services, excluding depreciation and amortization | 614,730 | 314,055 | 1,763,152 | 1,171,703 | ||||||||||||
| General and administrative expenses | 41,633 | 37,949 | 154,111 | 112,597 | ||||||||||||
| Depreciation and amortization | 8,126 | 4,902 | 27,927 | 17,748 | ||||||||||||
| Total expenses | 664,489 | 356,906 | 1,945,190 | 1,302,048 | ||||||||||||
| Income from operations | 720 | (3,870 | ) | 89,350 | 84,613 | |||||||||||
| Other income (expense) | ||||||||||||||||
| Income from equity method investments | 1,564 | 2,475 | 4,451 | 5,579 | ||||||||||||
| Interest expense | (8,069 | ) | (5,422 | ) | (33,097 | ) | (16,102 | ) | ||||||||
| Interest income | 3,221 | 4,591 | 14,508 | 14,208 | ||||||||||||
| Unrealized gain (loss) on investments | 316 | 1,294 | 731 | (4,581 | ) | |||||||||||
| Other income | 353 | 1,856 | 4,875 | 6,121 | ||||||||||||
| Total other (expense) income, net | (2,615 | ) | 4,794 | (8,532 | ) | 5,225 | ||||||||||
| (Loss) income before provision for income taxes | (1,895 | ) | 924 | 80,818 | 89,838 | |||||||||||
| Provision for income taxes | 5,882 | 1,018 | 30,886 | 31,989 | ||||||||||||
| Net (loss) income | (7,777 | ) | (94 | ) | 49,932 | 57,849 | ||||||||||
| Net (loss) income attributable to noncontrolling interests | (826 | ) | (12,450 | ) | 6,783 | (2,868 | ) | |||||||||
| Net (loss) income attributable to Astrana Health, Inc. | $ | (6,951 | ) | $ | 12,356 | $ | 43,149 | $ | 60,717 | |||||||
| (Loss) earnings per share – basic | $ | (0.15 | ) | $ | 0.26 | $ | 0.91 | $ | 1.30 | |||||||
| (Loss) earnings per share – diluted | $ | (0.15 | ) | $ | 0.26 | $ | 0.90 | $ | 1.29 | |||||||
EBITDA
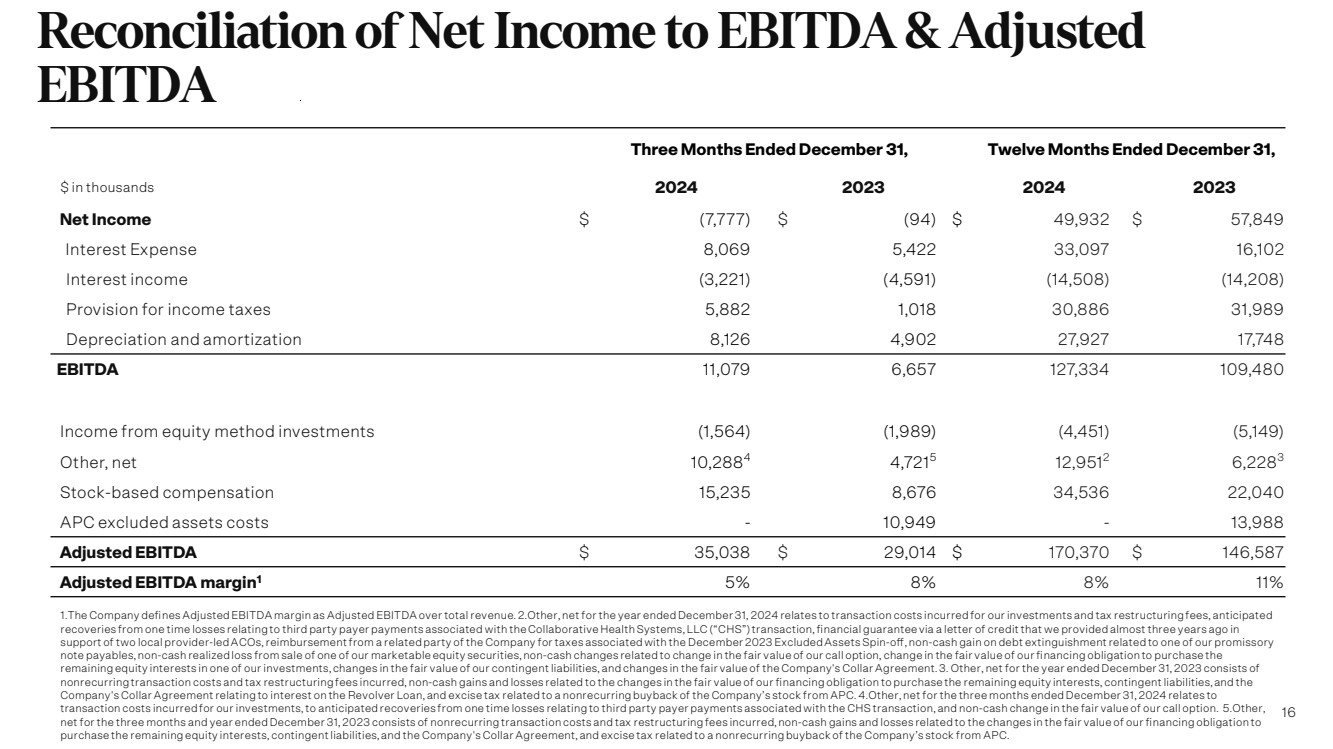
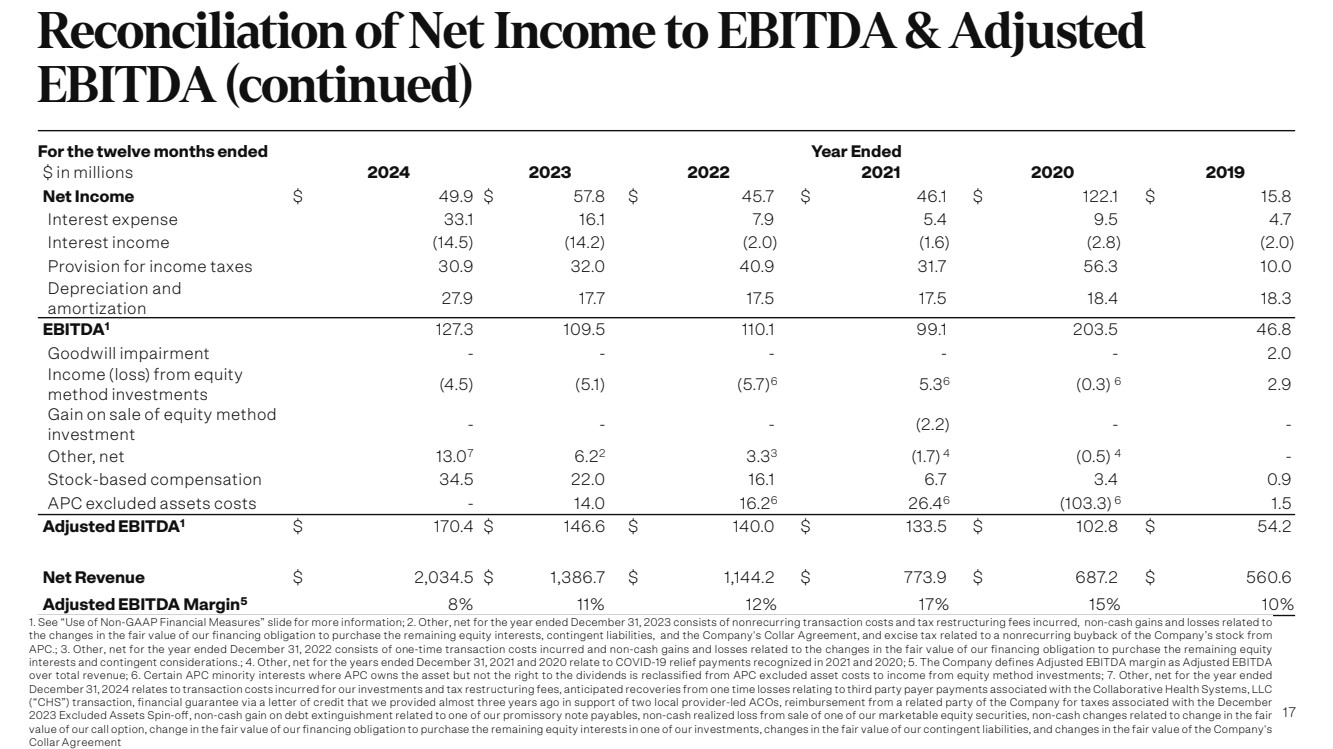
Set forth below are reconciliations of Net Income to EBITDA and Adjusted EBITDA as well as the reconciliation to Adjusted EBITDA margin for the three months and years ended December 31, 2024 and 2023. The Company defines Adjusted EBITDA margin as Adjusted EBITDA over total revenue.
| Three Months Ended December 31, | Year Ended December 31, | ||||||||||||||||
| (in thousands) | 2024 | 2023 | 2024 | 2023 | |||||||||||||
| Net (loss) income | $ | (7,777 | ) | $ | (94 | ) | $ | 49,932 | $ | 57,849 | |||||||
| Interest expense | 8,069 | 5,422 | 33,097 | 16,102 | |||||||||||||
| Interest income | (3,221 | ) | (4,591 | ) | (14,508 | ) | (14,208 | ) | |||||||||
| Provision for income taxes | 5,882 | 1,018 | 30,886 | 31,989 | |||||||||||||
| Depreciation and amortization | 8,126 | 4,902 | 27,927 | 17,748 | |||||||||||||
| EBITDA | $ | 11,079 | $ | 6,657 | $ | 127,334 | $ | 109,480 | |||||||||
| Income from equity method investments | (1,564 | ) | (1,989 | ) | (4,451 | ) | (5,149 | ) | |||||||||
| Other, net | 10,288 | (4) | 4,721 | (5) | 12,951 | (2) | 6,228 | (3) | |||||||||
| Stock-based compensation | 15,235 | 8,676 | 34,536 | 22,040 | |||||||||||||
| APC excluded assets costs | — | 10,949 | — | 13,988 | |||||||||||||
| Adjusted EBITDA | $ | 35,038 | $ | 29,014 | $ | 170,370 | $ | 146,587 | |||||||||
| Total Revenue | $ | 665,209 | $ | 353,036 | $ | 2,034,540 | $ | 1,386,661 | |||||||||
| Adjusted EBITDA margin(1) | 5 | % | 8 | % | 8 | % | 11 | % | |||||||||
| (1) | The Company defines Adjusted EBITDA margin as Adjusted EBITDA over total revenue. |
| (2) | Other, net for the year ended December 31, 2024 relates to transaction costs incurred for our investments and tax restructuring fees, anticipated recoveries from one time losses relating to third party payer payments associated with the Collaborative Health Systems, LLC (“CHS”) transaction, financial guarantee via a letter of credit that we provided almost three years ago in support of two local provider-led ACOs, reimbursement from a related party of the Company for taxes associated with the December 2023 Excluded Assets Spin-off, non-cash gain on debt extinguishment related to one of our promissory note payables, non-cash realized loss from sale of one of our marketable equity securities, non-cash changes related to change in the fair value of our call option, change in the fair value of our financing obligation to purchase the remaining equity interests in one of our investments, changes in the fair value of our contingent liabilities, and changes in the fair value of the Company's Collar Agreement. |
| (3) | Other, net for the year ended December 31, 2023 consists of nonrecurring transaction costs and tax restructuring fees incurred, non-cash gains and losses related to the changes in the fair value of our financing obligation to purchase the remaining equity interests, contingent liabilities, and the Company's Collar Agreement relating to interest on the Revolver Loan, and excise tax related to a nonrecurring buyback of the Company’s stock from APC. |
| (4) | Other, net for the three months ended December 31, 2024 relates to transaction costs incurred for our investments, to anticipated recoveries from one time losses relating to third party payer payments associated with the CHS transaction, and non-cash change in the fair value of our call option. |
| (5) | Other, net for the three months and year ended December 31, 2023 consists of nonrecurring transaction costs and tax restructuring fees incurred, non-cash gains and losses related to the changes in the fair value of our financing obligation to purchase the remaining equity interests, contingent liabilities, and the Company's Collar Agreement, and excise tax related to a nonrecurring buyback of the Company’s stock from APC. |
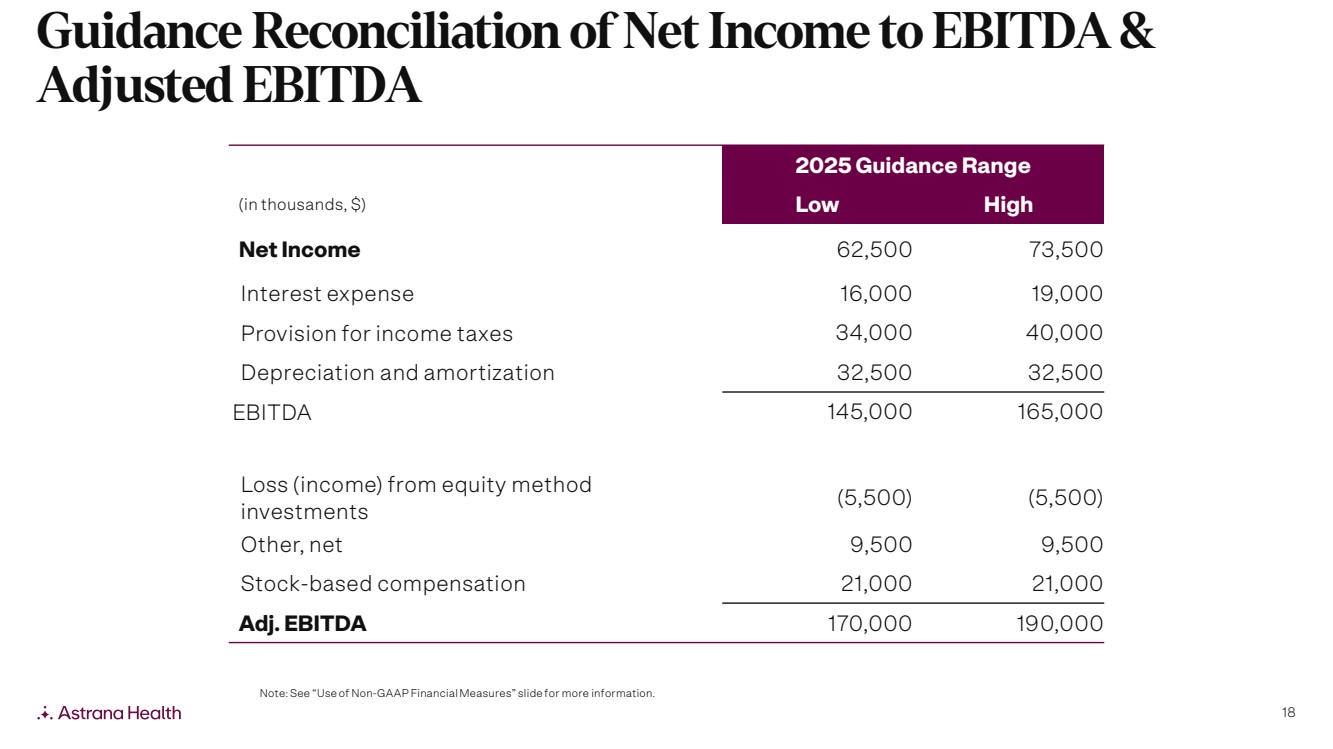
Guidance Reconciliation of Net Income to EBITDA and Adjusted EBITDA
| 2025 Guidance Range | ||||||||
| (in thousands) | Low | High | ||||||
| Net income | $ | 62,500 | $ | 73,500 | ||||
| Interest expense, net | 16,000 | 19,000 | ||||||
| Provision for income taxes | 34,000 | 40,000 | ||||||
| Depreciation and amortization | 32,500 | 32,500 | ||||||
| EBITDA | 145,000 | 165,000 | ||||||
| Income from equity method investments | (5,500 | ) | (5,500 | ) | ||||
| Other, net | 9,500 | 9,500 | ||||||
| Stock-based compensation | 21,000 | 21,000 | ||||||
| Adjusted EBITDA | $ | 170,000 | $ | 190,000 | ||||
Use of Non-GAAP Financial Measures
This press release contains the non-GAAP financial measures EBITDA and Adjusted EBITDA, of which the most directly comparable financial measure presented in accordance with U.S. generally accepted accounting principles (“GAAP”) is net income. These measures are not in accordance with, or alternatives to GAAP, and may be calculated differently from similar non-GAAP financial measures used by other companies. The Company uses Adjusted EBITDA as a supplemental performance measure of our operations, for financial and operational decision-making, and as a supplemental means of evaluating period-to-period comparisons on a consistent basis. Adjusted EBITDA is calculated as earnings before interest, taxes, depreciation, and amortization, excluding income or loss from equity method investments, non-recurring and non-cash transactions, stock-based compensation, and APC excluded assets costs. The Company defines Adjusted EBITDA margin as Adjusted EBITDA over total revenue.
The Company believes the presentation of these non-GAAP financial measures provides investors with relevant and useful information, as it allows investors to evaluate the operating performance of the business activities without having to account for differences recognized because of non-core or non-recurring financial information. When GAAP financial measures are viewed in conjunction with non-GAAP financial measures, investors are provided with a more meaningful understanding of the Company’s ongoing operating performance. In addition, these non-GAAP financial measures are among those indicators the Company uses as a basis for evaluating operational performance, allocating resources, and planning and forecasting future periods. Non-GAAP financial measures are not intended to be considered in isolation, or as a substitute for, GAAP financial measures. Other companies may calculate both EBITDA and Adjusted EBITDA differently, limiting the usefulness of these measures for comparative purposes. To the extent this release contains historical or future non-GAAP financial measures, the Company has provided corresponding GAAP financial measures for comparative purposes. The reconciliation between certain GAAP and non-GAAP measures is provided above.