aten-20250805false000158080800015808082025-08-052025-08-05
UNITED STATES
SECURITIES AND EXCHANGE COMMISSION
Washington, D.C. 20549
____________________________________________________________________________
FORM 8-K
____________________________________________________________________________
CURRENT REPORT
Pursuant to Section 13 or 15(d)
of The Securities Exchange Act of 1934
August 5, 2025
Date of Report (Date of earliest event reported)
____________________________________________________________________________
A10 NETWORKS, INC.
(Exact name of the registrant as specified in its charter)
____________________________________________________________________________
| | | | | | | | |
| Delaware | 001-36343 | 20-1446869 |
| (State or Other Jurisdiction of Incorporation or Organization) | (Commission File Number) | (I.R.S. Employer Identification Number) |
2300 Orchard Parkway
San Jose, CA 95131
(Address of principal executive offices, including zip code)
(408) 325-8668
(Name and telephone number, including area code, of the person to contact in connection with this report)
Not Applicable
(Former name or former address, if changed since last report)
Check the appropriate box below if the Form 8-K filing is intended to simultaneously satisfy the filing obligation of the registrant under any of the following provisions (see General Instruction A.2. below):
☐ Written communications pursuant to Rule 425 under the Securities Act (17 CFR 230.425)
☐ Soliciting material pursuant to Rule 14a-12 under the Exchange Act (17 CFR 240.14a-12)
☐ Pre-commencement communications pursuant to Rule 14d-2(b) under the Exchange Act (17 CFR 240.14d-2(b))
☐ Pre-commencement communications pursuant to Rule 13e-4(c) under the Exchange Act (17 CFR 240.13e-4(c))
____________________________________________________________________________
Securities registered pursuant to Section 12(b) of the Act:
| | | | | | | | | | | | | | |
| Title of each class | | Trading symbol(s) | | Name of each exchange on which registered |
| Common stock, $0.00001 par value per share | | ATEN | | New York Stock Exchange |
Indicate by check mark whether the registrant is an emerging growth company as defined in Rule 405 of the Securities Act of 1933 (§230.405 of this chapter) or Rule 12b-2 of the Securities Exchange Act of 1934 (§240.12b-2 of this chapter).
Emerging growth company ☐
If an emerging growth company, indicate by check mark if the registrant has elected not to use the extended transition period for complying with any new or revised financial accounting standards provided pursuant to Section 13(a) of the Exchange Act. ☐
Item 2.02 Results of Operations and Financial Condition
On August 5, 2025, A10 Networks, Inc. (the “Company”) issued a press release regarding financial results for the quarter ended June 30, 2025. A copy of the press release is furnished herewith as Exhibit 99.1.
Item 7.01 Regulation FD Disclosure
On August 5, 2025, the Company posted on its website (www.a10networks.com) slides regarding the financial results for the quarter ended June 30, 2025. A copy of the slides is attached as Exhibit 99.2 and the information in Exhibit 99.2 is incorporated herein by reference.
The information in Item 2.02, Item 7.01 and Item 9.01 in this Current Report on Form 8-K and the exhibits attached hereto shall not be deemed “filed” for the purposes of Section 18 of the Securities Exchange Act of 1934, as amended, or otherwise subject to the liabilities of that Section, nor shall it be deemed incorporated by reference into any filing under the Securities Act of 1933, as amended, or the Securities Exchange Act of 1934, as amended. The information in Item 2.02 shall not be incorporated by reference in any filing under the Securities Act of 1933 or the Exchange Act, except as shall be expressly set forth by specific reference in such filing.
Item 8.01 Other Events.
On August 5, 2025, the Company announced that its Board of Directors (the “Board”) approved a quarterly dividend. The quarterly dividend, in the amount of $0.06 per share, will be payable, subject to any prior revocation, on September 2, 2025 to stockholders of record on August 15, 2025. Future dividends will be subject to further review and approval by the Board in accordance with applicable law. The Board reserves the right to adjust or withdraw the quarterly dividend in future periods as it reviews the Company’s capital allocation strategy from time-to-time.
Forward Looking Statements
Item 8.01 contains forward-looking statements within the meaning of Section 27A of the Securities Act of 1933, as amended, and Section 21E of the Exchange Act, including statements regarding the Company’s dividend program. These forward-looking statements involve risks and uncertainties. These forward-looking statements may be identified by terms such as “will,” “may,” “plans,” or the negative of these terms, and similar expressions intended to identify forward-looking statements. These forward-looking statements include, but are not limited to, statements regarding the anticipated amount, duration, methods, timing, term and other aspects of our dividend program and any anticipated benefits or value resulting from such program. These statements involve known and unknown risks, uncertainties and other factors which may cause actual results, performance or achievements to differ materially from those expressed or implied by such forward-looking statements. These risks and uncertainties include, but are not limited to, any unforeseen need for capital which may require us to divert funds we may have otherwise used for the dividend program, which may in turn negatively impact our ability to administer the quarterly dividends. In addition, the timing and amount of future dividends, if any, will be made as management deems appropriate and will depend on a variety of factors including stock price, market conditions, corporate and regulatory requirements (including applicable securities laws and regulations and the rules of The New York Stock Exchange), any additional constraints related to material inside information the Company may possess, and capital availability. More information regarding these and other risks, uncertainties and factors is contained in the Company’s Annual Report on Form 10-K for the year ended December 31, 2024, as filed with the SEC, and in other reports filed by the Company with the SEC from time to time. You are cautioned not to unduly rely on these forward-looking statements, which speak only as of the date of this press release. All information in this press release and its attachments is as of the date stated and unless required by law, The Company undertakes no obligation to publicly revise any forward-looking statement to reflect circumstances or events after the date of this press release or to report the occurrence of unanticipated events other than as required by law or regulation.
Item 9.01 Financial Statements and Exhibits
(d) Exhibits
| | | | | | | | |
| Exhibit | Description |
| 99.1 | |
| 99.2 | |
SIGNATURE
Pursuant to the requirements of the Securities Exchange Act of 1934, the registrant has duly caused this report to be signed on its behalf by the undersigned hereunto duly authorized.
Date: August 5, 2025
| | | | | |
| A10 NETWORKS, INC. |
| By: /s/ Brian Becker |
| Brian Becker |
| Chief Financial Officer (Principal Accounting and Financial Officer) |
EXHIBIT 99.1
A10 Networks Reports Financial Results for the Second Quarter of 2025
Company Grows Revenue and Earnings Per Share;
Cybersecurity and AI Tailwinds Reinforce Strategic Positioning
SAN JOSE, Calif., August 5, 2025 -- A10 Networks, Inc. (NYSE: ATEN), a leading provider of secure application services and solutions, today announced financial results for its second quarter ended June 30, 2025.
Second Quarter 2025 Financial Summary
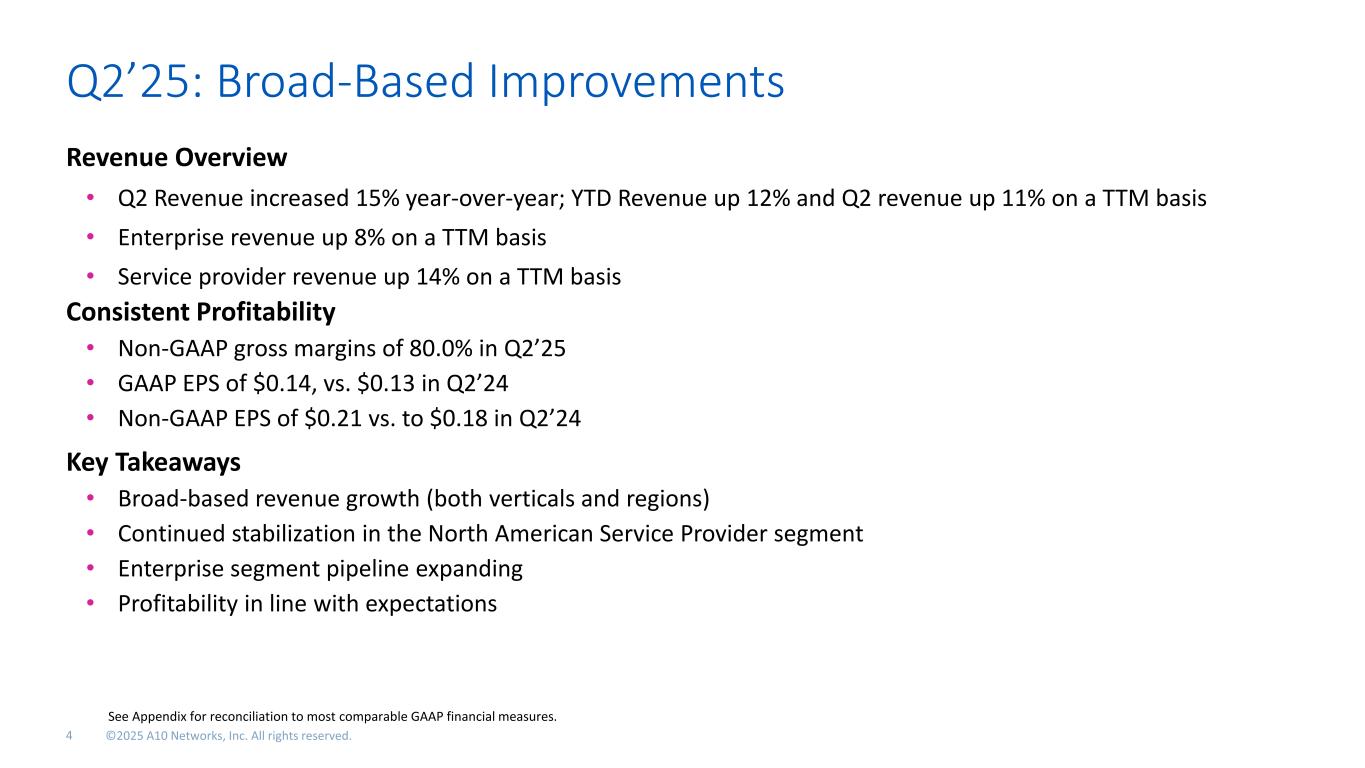
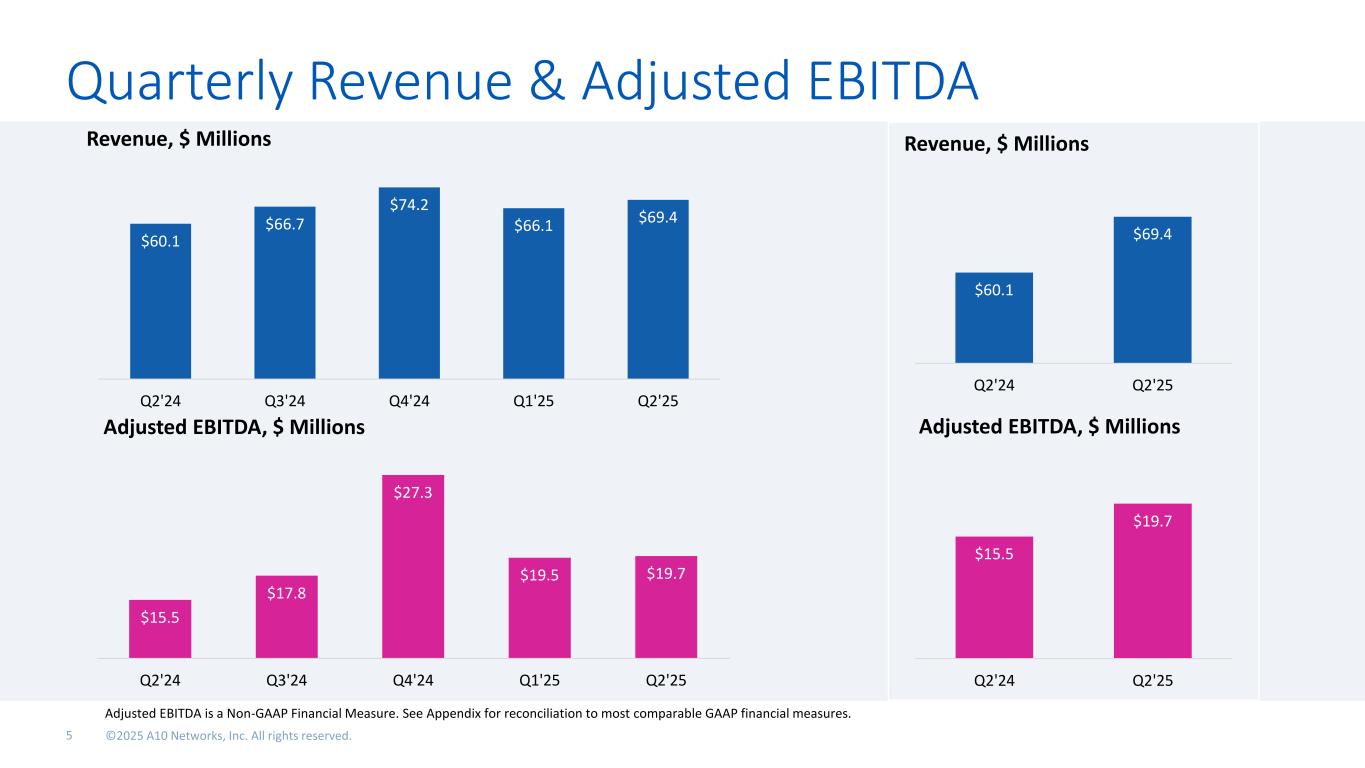
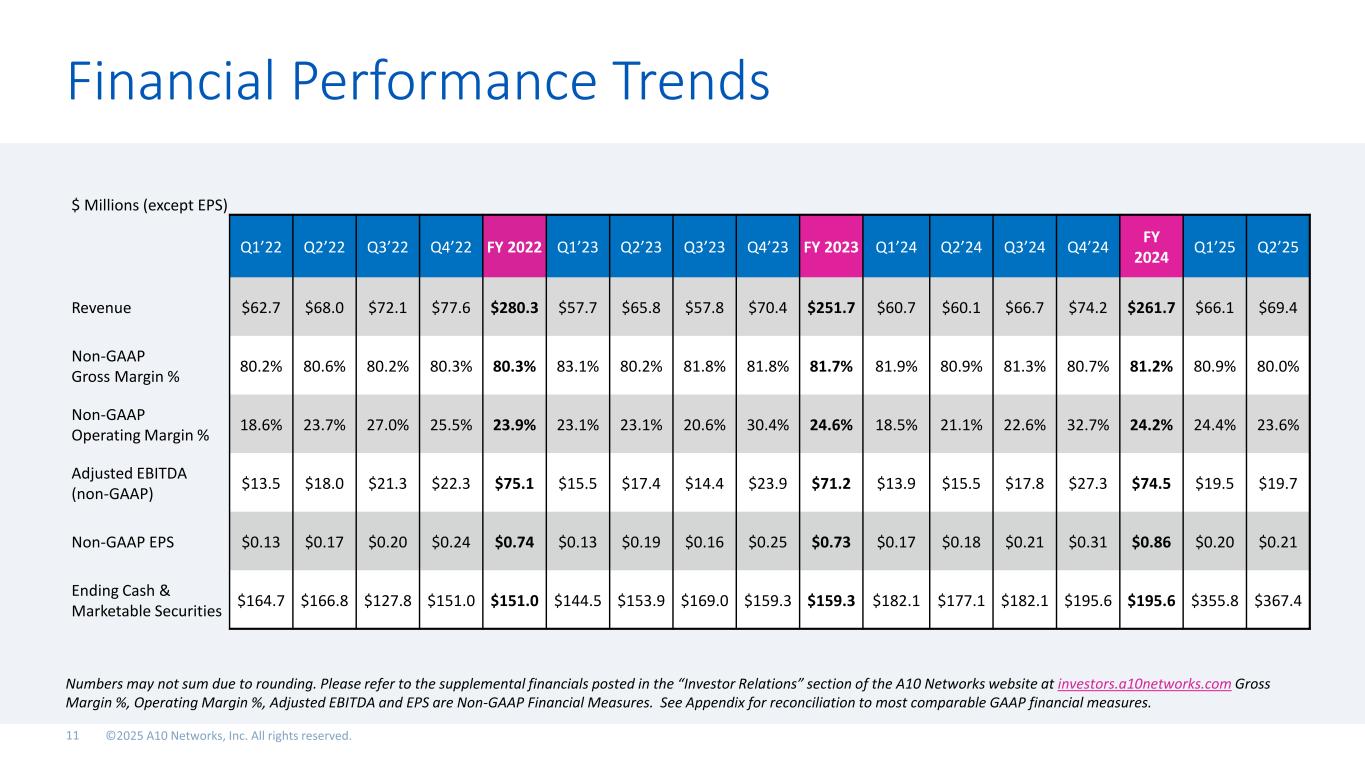
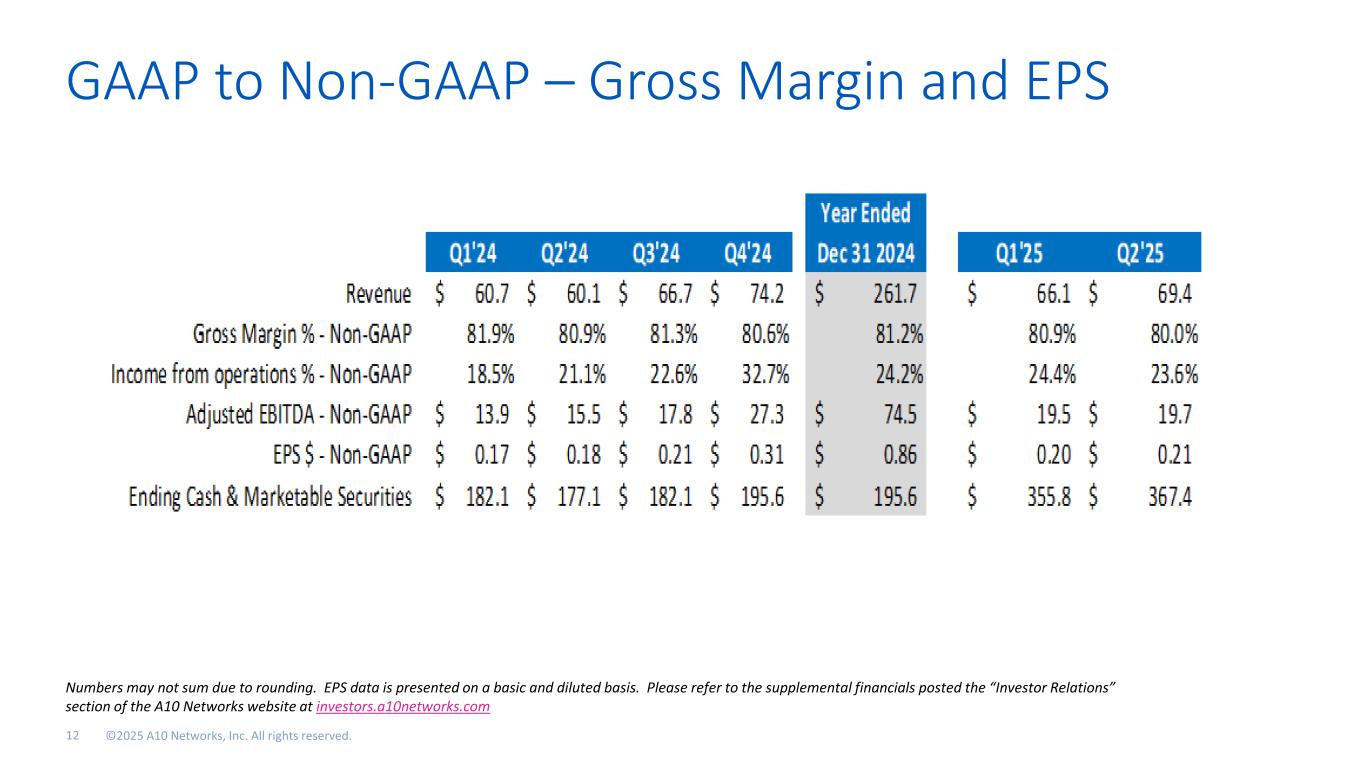
•Revenue of $69.4 million, up 15% year-over-year compared to $60.1 million in the second quarter of 2024. Revenue for the first six months of 2025 was $135.5 million compared to $120.8 million for the first six months of 2024, an increase of approximately 12%.
•GAAP gross margin of 78.9%; non-GAAP gross margin of 80.0%.
•GAAP net income of $10.5 million (15.2% of revenue), or $0.14 per diluted share, compared to net income of $9.5 million (15.8% of revenue), or $0.13 per diluted share, in the second quarter of 2024.
•Non-GAAP net income of $15.5 million (22.3% of revenue), or $0.21 per diluted share, compared to non-GAAP net income of $13.2 million (22.0% of revenue), or $0.18 per diluted share in the second quarter of 2024.
•The Company returned $8.3 million to investors, having repurchased 229 thousand shares at an average price of $17.22 for a total of $3.9 million and having paid $4.3 million in cash dividends in the quarter. The Company has $71.1 million remaining on its $75.0 million share repurchase authorization.
•The Board of Directors approved a quarterly cash dividend of $0.06 per share, payable September 2, 2025 to stockholders of record at the close of business on August 15, 2025.
A reconciliation between GAAP and non-GAAP information is contained in the financial statements below.
“Demand for our security and infrastructure solutions continues to grow as end markets normalized compared to same period last year, driving year-over-year revenue growth,” said Dhrupad Trivedi, President and Chief Executive Officer of A10 Networks. “The second quarter benefited from improving demand from data center expansions and AI infrastructure investments. This includes the recent selection of A10 by global leaders in AI data centers, which serves as an important validation of our security-led innovation and growing relevance in AI-centric environments.”
“A10 maintains strong operational discipline, effectively translating revenue growth into improved profitability and cash flow,” continued Trivedi. “We achieved expansion in both GAAP and non-GAAP net margins, grew earnings per share, and delivered robust cash flow from operations. We expect operating leverage to remain a key advantage moving forward.”
“The strength of our business model and customer intimacy, combined with favorable market dynamics in AI and cybersecurity, positions A10 to deliver long-term value as we continue to navigate evolving market conditions,” said Trivedi. “We remain focused on disciplined execution to drive sustained top- and bottom-line growth.”
Conference Call
Management will host a call at 1:30 p.m. Pacific time (4:30 p.m. Eastern time) today, August 5, 2025, to discuss these results. Interested parties may access the conference call by dialing (888) 506-0062 (toll-free) or (973) 528-0011 (international) and referencing access code: 117352.
A live audio webcast of the conference call will be accessible from the “Investor Relations” section of A10 Network’s website at investors.a10networks.com. The webcast will be archived for one year. A telephonic replay of the conference call will be available until August 19, 2025 and may be accessed by dialing (877) 481-4010 (toll-free) or (919) 882-2331 (international) and entering the passcode: 52680.
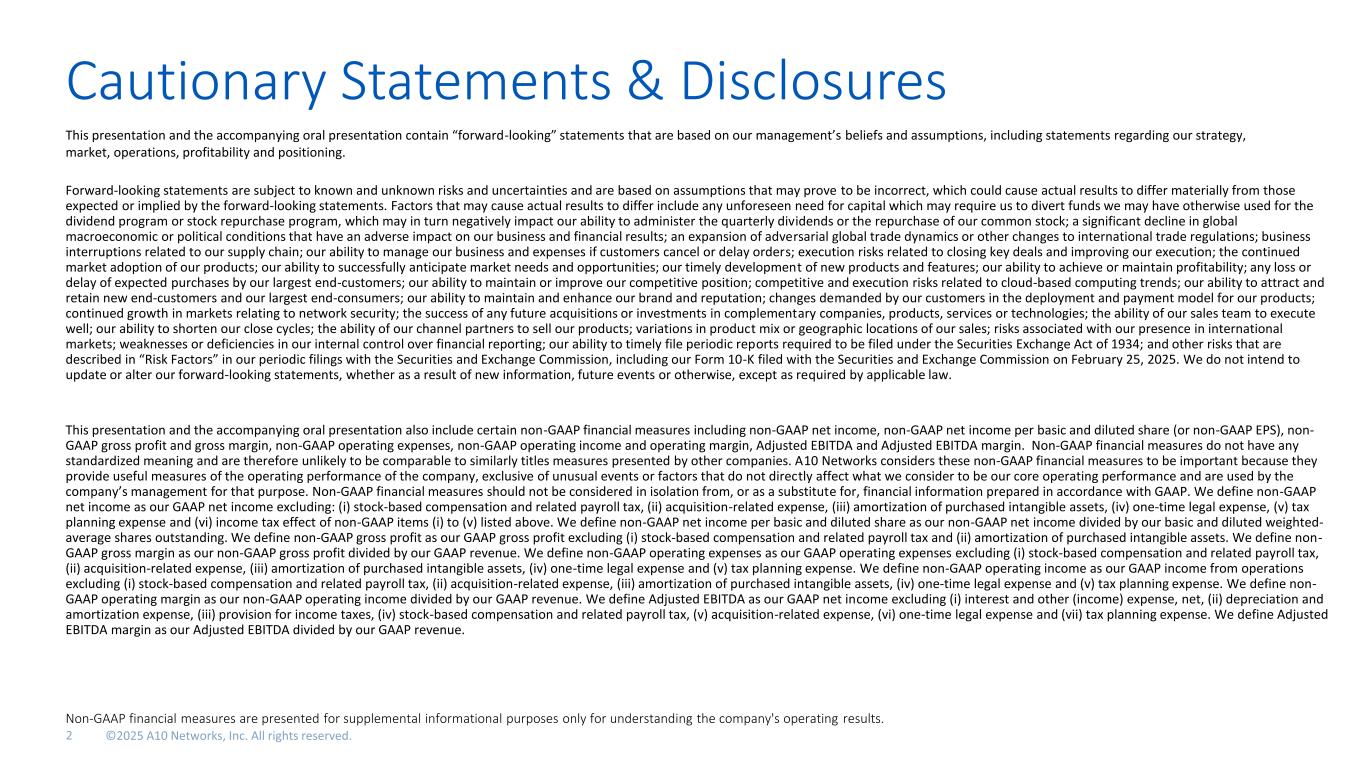
Forward-Looking Statements
This press release contains “forward-looking statements,” including statements regarding our quarterly dividend payments, strategy, positioning, demand, growth rate, margin profile, operating leverage, profitability and return of capital. Forward-looking statements are subject to known and unknown risks and uncertainties and are based on assumptions that may prove to be incorrect, which could cause actual results to differ materially from those expected or implied by the forward-looking statements. Factors that may cause actual results to differ include any unforeseen need for capital which may require us to divert funds we may have otherwise used for the dividend program or stock repurchase program, which may in turn negatively impact our ability to administer the quarterly dividends or the repurchase of our common stock; a significant decline in global macroeconomic or political conditions that have an adverse impact on our business and financial results; an expansion of adversarial global trade dynamics or other changes to international trade regulations; business interruptions related to our supply chain; our ability to manage our business and expenses if customers cancel or delay orders; execution risks related to closing key deals and improving our execution; the continued market adoption of our products; our ability to successfully anticipate market needs and opportunities; our timely development of new products and features; our ability to achieve or maintain profitability; any loss or delay of expected purchases by our largest end-customers; our ability to maintain or improve our competitive position; competitive and execution risks related to cloud-based computing trends; our ability to attract and retain new end-customers and our largest end-consumers; our ability to maintain and enhance our brand and reputation; changes demanded by our customers in the deployment and payment model for our products; continued growth in markets relating to network security; the success of any future acquisitions or investments in complementary companies, products, services or technologies; the ability of our sales team to execute well; our ability to shorten our close cycles; the ability of our channel partners to sell our products; variations in product mix or geographic locations of our sales; risks associated with our presence in international markets; weaknesses or deficiencies in our internal control over financial reporting; our ability to timely file periodic reports required to be filed under the Securities Exchange Act of 1934; and other risks that are described in “Risk Factors” in our periodic filings with the Securities and Exchange Commission, including our Form 10-K filed with the Securities and Exchange Commission on February 25, 2025. We do not intend to update or alter our forward-looking statements, whether as a result of new information, future events or otherwise, except as required by applicable law.
Non-GAAP Financial Measures
In addition to disclosing financial measures prepared in accordance with U.S. generally accepted accounting principles (GAAP), we refer to certain non-GAAP financial measures, including non-GAAP net income, non-GAAP net income per basic and diluted share (or non-GAAP EPS), non-GAAP gross profit and gross margin, non-GAAP operating expenses, non-GAAP operating income and operating margin, Adjusted EBITDA and Adjusted EBITDA margin. Non-GAAP financial measures do not have any standardized meaning and are therefore unlikely to be comparable to similarly titled measures presented by other companies.
A10 Networks considers these non-GAAP financial measures to be important because they provide useful measures of the operating performance of the company, exclusive of unusual events or factors that do not directly affect what we consider to be our core operating performance and are used by the company's management for that purpose.
Non-GAAP financial measures should not be considered in isolation from, or as a substitute for, financial information prepared in accordance with GAAP.
We define non-GAAP net income as our GAAP net income excluding: (i) stock-based compensation and related payroll tax, (ii) acquisition-related expense, (iii) amortization of purchased intangible assets, (iv) one-time legal expense, (v) tax planning expense and (vi) income tax effect of non-GAAP items (i) to (v) listed above. We define non-GAAP net income per basic and diluted share as our non-GAAP net income divided by our basic and diluted weighted-average shares outstanding. We define non-GAAP gross profit as our GAAP gross profit excluding (i) stock-based compensation and related payroll tax and (ii) amortization of purchased intangible assets. We define non-GAAP gross margin as our non-GAAP gross profit divided by our GAAP revenue. We define non-GAAP operating expenses as our GAAP operating expenses excluding (i) stock-based compensation and related payroll tax, (ii) acquisition-related expense, (iii) amortization of purchased intangible assets, (iv) one-time legal expense and (v) tax planning expense. We define non-GAAP operating income as our GAAP income from operations excluding (i) stock-based compensation and related payroll tax, (ii) acquisition-related expense, (iii) amortization of purchased intangible assets, (iv) one-time legal expense and (v) tax planning expense. We define non-GAAP operating margin as our non-GAAP operating income divided by our GAAP revenue. We define Adjusted EBITDA as our GAAP net income excluding (i) interest and other (income) expense, net, (ii) depreciation and amortization expense, (iii) provision for income taxes, (iv) stock-based compensation and related payroll tax, (v) acquisition-related expense, (vi) one-time legal expense and (vii) tax planning expense. We define Adjusted EBITDA margin as our Adjusted EBITDA divided by our GAAP revenue.
Non-GAAP financial measures are presented for supplemental informational purposes only for understanding the company's operating results.
About A10 Networks
A10 Networks (NYSE: ATEN) provides security and infrastructure solutions for on-premises, hybrid cloud, and edge-cloud environments. Our 7000+ customers span global large enterprises and communications, cloud and web service providers who must ensure business-critical applications and networks are secure, available, and efficient. Founded in 2004, A10 Networks is based in San Jose, Calif. and serves customers globally. For more information, visit A10networks.com and follow us at A10Networks.
The A10 logo and A10 Networks are trademarks or registered trademarks of A10 Networks, Inc. in the United States and other countries. All other trademarks are the property of their respective owners.
Investor Contact:
Rob Fink / Tom Baumann
FNK IR
646.809.4048 / 646.349.6641
Brian Becker
Chief Financial Officer
Source: A10 Networks, Inc.
A10 NETWORKS, INC.
CONDENSED CONSOLIDATED STATEMENTS OF OPERATIONS
(unaudited, in thousands, except per share amounts, on a GAAP Basis)
| | | | | | | | | | | | | | | | | | | | | | | |
| Three Months Ended June 30, | | Six Months Ended June 30, |
| 2025 | | 2024 | | 2025 | | 2024 |
| Net revenue: | | | | | | | |
| Products | $ | 39,173 | | | $ | 29,533 | | | $ | 75,152 | | | $ | 59,602 | |
| Services | 30,210 | | | 30,563 | | | 60,368 | | | 61,169 | |
| Total net revenue | 69,383 | | | 60,096 | | | 135,520 | | | 120,771 | |
| Cost of net revenue: | | | | | | | |
| Products | 8,197 | | | 6,813 | | | 15,460 | | | 13,612 | |
| Services | 6,475 | | | 5,225 | | | 12,654 | | | 9,870 | |
| Total cost of net revenue | 14,672 | | | 12,038 | | | 28,114 | | | 23,482 | |
| Gross profit | 54,711 | | | 48,058 | | | 107,406 | | | 97,289 | |
| Operating expenses: | | | | | | | |
| Sales and marketing | 20,964 | | | 19,453 | | | 40,509 | | | 40,667 | |
| Research and development | 16,256 | | | 14,737 | | | 32,156 | | | 28,800 | |
| General and administrative | 7,180 | | | 5,952 | | | 15,652 | | | 12,693 | |
| Total operating expenses | 44,400 | | | 40,142 | | | 88,317 | | | 82,160 | |
| Income from operations | 10,311 | | | 7,916 | | | 19,089 | | | 15,129 | |
| Non-operating income (expense): | | | | | | | |
| Interest income | 2,994 | | | 1,761 | | | 4,784 | | | 3,442 | |
| Interest and other income (expense), net | (1,376) | | | 1,306 | | | (1,466) | | | 3,632 | |
| Total non-operating income, net | 1,618 | | | 3,067 | | | 3,318 | | | 7,074 | |
| Income before income taxes | 11,929 | | | 10,983 | | | 22,407 | | | 22,203 | |
| Provision for income taxes | 1,391 | | | 1,507 | | | 2,326 | | | 3,001 | |
| Net income | $ | 10,538 | | | $ | 9,476 | | | $ | 20,081 | | | $ | 19,202 | |
| Net income per share: | | | | | | | |
| Basic | $ | 0.15 | | | $ | 0.13 | | | $ | 0.28 | | | $ | 0.26 | |
| Diluted | $ | 0.14 | | | $ | 0.13 | | | $ | 0.27 | | | $ | 0.25 | |
| Weighted-average shares used in computing net income per share: | | | | | | | |
| Basic | 72,009 | | | 74,366 | | | 72,777 | | | 74,401 | |
| Diluted | 73,117 | | | 75,497 | | | 74,109 | | | 75,432 | |
A10 NETWORKS, INC.
RECONCILIATION OF GAAP NET INCOME TO NON-GAAP NET INCOME
(unaudited, in thousands, except per share amounts)
| | | | | | | | | | | | | | | | | | | | | | | |
| Three Months Ended June 30, | | Six Months Ended June 30, |
| 2025 | | 2024 | | 2025 | | 2024 |
| | | | | | | |
| GAAP net income | $ | 10,538 | | | $ | 9,476 | | | $ | 20,081 | | | $ | 19,202 | |
| Non-GAAP items: | | | | | | | |
| Stock-based compensation and related payroll tax | 4,586 | | | 4,309 | | | 10,878 | | | 8,298 | |
| Acquisition-related expense | 574 | | | — | | | 918 | | | — | |
| Amortization of purchased intangible assets | 380 | | | — | | | 583 | | | — | |
| | | | | | | |
| One-time legal expense | 721 | | | 71 | | | 1,247 | | | 71 | |
| Tax planning expense | 150 | | | 400 | | | 150 | | | 400 | |
| Income tax-effect of non-GAAP items | (1,496) | | | (1,046) | | | (3,369) | | | (2,017) | |
| Total non-GAAP items | 4,915 | | | 3,734 | | | 10,407 | | | 6,752 | |
| Non-GAAP net income | $ | 15,453 | | | $ | 13,210 | | | $ | 30,488 | | | $ | 25,954 | |
| | | | | | | |
| GAAP net income per share: | | | | | | | |
| Basic | $ | 0.15 | | | $ | 0.13 | | | $ | 0.28 | | | $ | 0.26 | |
| Diluted | $ | 0.14 | | | $ | 0.13 | | | $ | 0.27 | | | $ | 0.25 | |
| Non-GAAP items: | | | | | | | |
| Stock-based compensation and related payroll tax | 0.06 | | | 0.05 | | | 0.15 | | | 0.11 | |
| Acquisition-related expense | 0.01 | | | — | | | 0.01 | | | — | |
| Amortization of purchased intangible assets | 0.01 | | | — | | | 0.01 | | | — | |
| | | | | | | |
| One-time legal expense | 0.01 | | | — | | | 0.02 | | | — | |
| Tax planning expense | — | | | 0.01 | | | — | | | 0.01 | |
| Income tax-effect of non-GAAP items | (0.02) | | | (0.01) | | | (0.05) | | | (0.03) | |
| Total non-GAAP items | 0.07 | | | 0.05 | | | 0.14 | | | 0.09 | |
| | | | | | | |
| Non-GAAP net income per share: | | | | | | | |
| Basic | $ | 0.21 | | | $ | 0.18 | | | $ | 0.42 | | | $ | 0.35 | |
| Diluted | $ | 0.21 | | | $ | 0.18 | | | $ | 0.41 | | | $ | 0.34 | |
| Weighted average shares used in computing net income per share: | | | | | | | |
| Basic | 72,009 | | | 74,366 | | | 72,777 | | | 74,401 | |
| Diluted | 73,117 | | | 75,497 | | | 74,109 | | | 75,432 | |
Net income and earnings per share excluding adjustments are non-GAAP financial measures presented as supplemental financial measures to enable a user of the financial information to understand the impact of these adjustments on reported results. These financial measures should not be considered an alternative to net income, operating income, cash flows provided by operating activities, or any other measure of financial performance or liquidity presented in accordance with U.S. GAAP. Our adjusted net income and earnings per share may not be comparable to similarly titled measures of another company because companies may not all calculate adjusted net income and earnings per share in the same manner.
A10 NETWORKS, INC.
CONDENSED CONSOLIDATED BALANCE SHEETS
(unaudited, in thousands, except par value, on a GAAP Basis)
| | | | | | | | | | | |
| As of June 30, 2025 | | As of December 31, 2024 |
| ASSETS |
| Current assets: | | | |
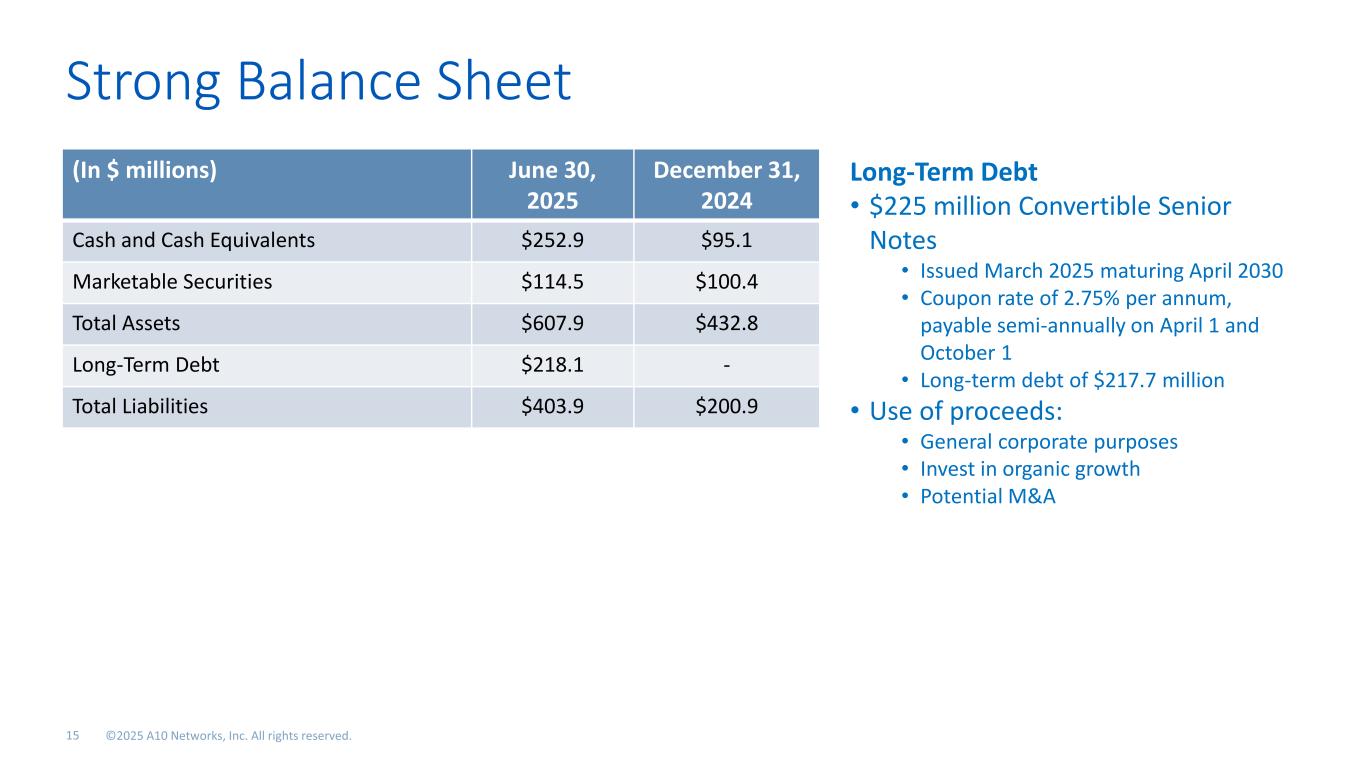
| Cash and cash equivalents | $ | 252,924 | | | $ | 95,129 | |
| Marketable securities | 114,459 | | | 100,429 | |
| Accounts receivable, net of allowances of $357 and $465, respectively | 52,364 | | | 76,687 | |
| Inventory | 20,082 | | | 22,005 | |
| Prepaid expenses and other current assets | 17,233 | | | 13,038 | |
| Total current assets | 457,062 | | | 307,288 | |
| Property and equipment, net | 44,458 | | | 39,142 | |
| Goodwill | 15,070 | | | 1,307 | |
| Intangible assets, net | 7,018 | | | — | |
| Deferred tax assets, net | 62,362 | | | 62,364 | |
| Other non-current assets | 21,945 | | | 22,714 | |
| Total assets | $ | 607,915 | | | $ | 432,815 | |
| LIABILITIES AND STOCKHOLDERS’ EQUITY |
| Current liabilities: | | | |
| Accounts payable | $ | 6,999 | | | $ | 12,542 | |
| Accrued and other liabilities | 27,815 | | | 32,696 | |
| Deferred revenue, current | 73,345 | | | 78,335 | |
| Total current liabilities | 108,159 | | | 123,573 | |
| Deferred revenue, non-current | 71,021 | | | 69,924 | |
| Long-term debt | 218,086 | | | — | |
| Other non-current liabilities | 6,661 | | | 7,489 | |
| Total liabilities | 403,927 | | | 200,986 | |
| | | |
| Stockholders' equity: |
| Common stock, $0.00001 par value: 500,000 shares authorized; 91,450 and 90,520 shares issued and 71,992 and 73,693 shares outstanding, respectively | 1 | | | 1 | |
| Treasury stock, at cost: 19,458 and 16,827 shares, respectively | (231,965) | | | (180,992) | |
| Additional paid-in-capital | 520,524 | | | 508,387 | |
| Dividends paid | (64,172) | | | (55,417) | |
| Accumulated other comprehensive income (loss) | (137) | | | 194 | |
| Accumulated deficit | (20,263) | | | (40,344) | |
| Total stockholders' equity | 203,988 | | | 231,829 | |
| Total liabilities and stockholders' equity | $ | 607,915 | | | $ | 432,815 | |
A10 NETWORKS, INC.
CONDENSED CONSOLIDATED STATEMENTS OF CASH FLOWS
(unaudited, in thousands, on a GAAP Basis)
| | | | | | | | | | | |
| Six Months Ended June 30, |
| 2025 | | 2024 |
| Cash flows from operating activities: | | | |
| Net income | $ | 20,081 | | | $ | 19,202 | |
| Adjustments to reconcile net income to net cash provided by operating activities: | | | |
| Depreciation and amortization | 7,077 | | | 5,507 | |
| Stock-based compensation | 10,427 | | | 8,105 | |
| Other non-cash items | 685 | | | (403) | |
| Changes in operating assets and liabilities: | | | |
| Accounts receivable | 24,031 | | | 16,695 | |
| Inventory | 1,609 | | | (3,318) | |
| Prepaid expenses and other assets | (5,865) | | | (541) | |
| Accounts payable | (6,379) | | | (2,859) | |
| Accrued liabilities | (5,937) | | | 3,640 | |
| Deferred revenue | (6,345) | | | (1,378) | |
| | | |
| Net cash provided by operating activities | 39,384 | | | 44,650 | |
| Cash flows from investing activities: | | | |
| Proceeds from sales of marketable securities | — | | | 22,536 | |
| Proceeds from maturities of marketable securities | 54,744 | | | 47,699 | |
| Purchases of marketable securities | (68,148) | | | (106,293) | |
| Acquisition | (19,100) | | | — | |
| Capital expenditures | (8,737) | | | (6,414) | |
| Net cash used in investing activities | (41,241) | | | (42,472) | |
| Cash flows from financing activities: | | | |
| Proceeds from issuance of common stock under employee equity incentive plans | 1,710 | | | 1,854 | |
| Proceeds from the issuance of convertible notes | 225,000 | | | — | |
| Payment of debt issuance costs | (7,330) | | | — | |
| Repurchase of common stock | (50,973) | | | (14,876) | |
| Payments for dividends | (8,755) | | | (8,943) | |
| Net cash provided by (used in) financing activities | 159,652 | | | (21,965) | |
| Net increase (decrease) in cash and cash equivalents | 157,795 | | | (19,787) | |
| Cash and cash equivalents—beginning of period | 95,129 | | | 97,244 | |
| Cash and cash equivalents—end of period | $ | 252,924 | | | $ | 77,457 | |
| | | |
| Non-cash investing and financing activities: | | | |
| Transfers between inventory and property and equipment | $ | 314 | | | $ | 1,628 | |
| Capital expenditures included in accounts payable | $ | 289 | | | $ | 1,477 | |
A10 NETWORKS, INC.
RECONCILIATION OF GAAP GROSS PROFIT TO NON-GAAP GROSS PROFIT
(unaudited, in thousands, except percentages)
| | | | | | | | | | | | | | | | | | | | | | | |
| Three Months Ended June 30, | | Six Months Ended June 30, |
| 2025 | | 2024 | | 2025 | | 2024 |
| | | | | | | |
| GAAP gross profit | $ | 54,711 | | | $ | 48,058 | | | $ | 107,406 | | | $ | 97,289 | |
| GAAP gross margin | 78.9 | % | | 80.0 | % | | 79.3 | % | | 80.6 | % |
| Non-GAAP adjustments: | | | | | | | |
| Stock-based compensation and related payroll tax | 502 | | | 563 | | | 1,148 | | | 1,034 | |
| Amortization of purchased intangible assets | 281 | | | — | | | 431 | | | — | |
| | | | | | | |
| Non-GAAP gross profit | $ | 55,494 | | | $ | 48,621 | | | $ | 108,985 | | | $ | 98,323 | |
| Non-GAAP gross margin | 80.0 | % | | 80.9 | % | | 80.4 | % | | 81.4 | % |
A10 NETWORKS, INC.
RECONCILIATION OF GAAP TOTAL OPERATING EXPENSES
TO NON-GAAP TOTAL OPERATING EXPENSES
(unaudited, in thousands)
| | | | | | | | | | | | | | | | | | | | | | | |
| Three Months Ended June 30, | | Six Months Ended June 30, |
| 2025 | | 2024 | | 2025 | | 2024 |
| | | | | | | |
| GAAP total operating expenses | $ | 44,400 | | | $ | 40,142 | | | $ | 88,317 | | | $ | 82,160 | |
| | | | | | | |
| Non-GAAP adjustments: | | | | | | | |
| Stock-based compensation and related payroll tax | (4,084) | | | (3,746) | | | (9,730) | | | (7,264) | |
| Acquisition-related expense | (210) | | | — | | | (554) | | | — | |
| Amortization of purchased intangible assets | (99) | | | — | | | (152) | | | — | |
| | | | | | | |
| One-time legal expense | (721) | | | (71) | | | (1,247) | | | (71) | |
| Tax planning expense | (150) | | | (400) | | | (150) | | | (400) | |
| Non-GAAP total operating expenses | $ | 39,136 | | | $ | 35,925 | | | $ | 76,484 | | | $ | 74,425 | |
A10 NETWORKS, INC.
RECONCILIATION OF GAAP INCOME FROM OPERATIONS
TO NON-GAAP OPERATING INCOME
(unaudited, in thousands, except percentages)
| | | | | | | | | | | | | | | | | | | | | | | |
| Three Months Ended June 30, | | Six Months Ended June 30, |
| 2025 | | 2024 | | 2025 | | 2024 |
| | | | | | | |
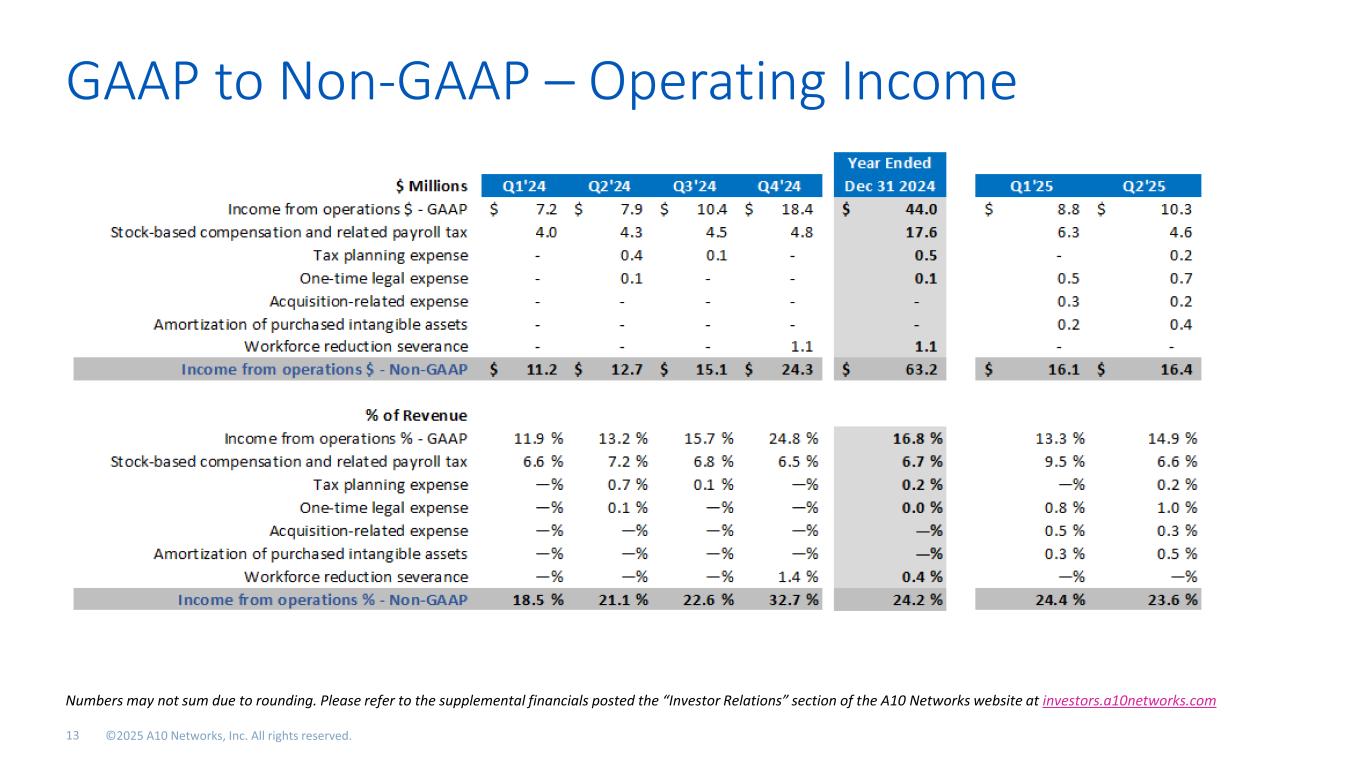
| GAAP income from operations | $ | 10,311 | | | $ | 7,916 | | | $ | 19,089 | | | $ | 15,129 | |
| GAAP operating margin | 14.9 | % | | 13.2 | % | | 14.1 | % | | 12.5 | % |
| Non-GAAP adjustments: | | | | | | | |
| Stock-based compensation and related payroll tax | 4,586 | | | 4,309 | | | 10,878 | | | 8,298 | |
| Acquisition-related expense | 210 | | | — | | | 554 | | | — | |
| Amortization of purchased intangible assets | 380 | | | — | | | 583 | | | — | |
| | | | | | | |
| One-time legal expense | 721 | | | 71 | | | 1,247 | | | 71 | |
| Tax planning expense | 150 | | | 400 | | | 150 | | | 400 | |
| Non-GAAP operating income | $ | 16,358 | | | $ | 12,696 | | | $ | 32,501 | | | $ | 23,898 | |
| Non-GAAP operating margin | 23.6 | % | | 21.1 | % | | 24.0 | % | | 19.8 | % |
A10 NETWORKS, INC.
RECONCILIATION OF GAAP NET INCOME TO
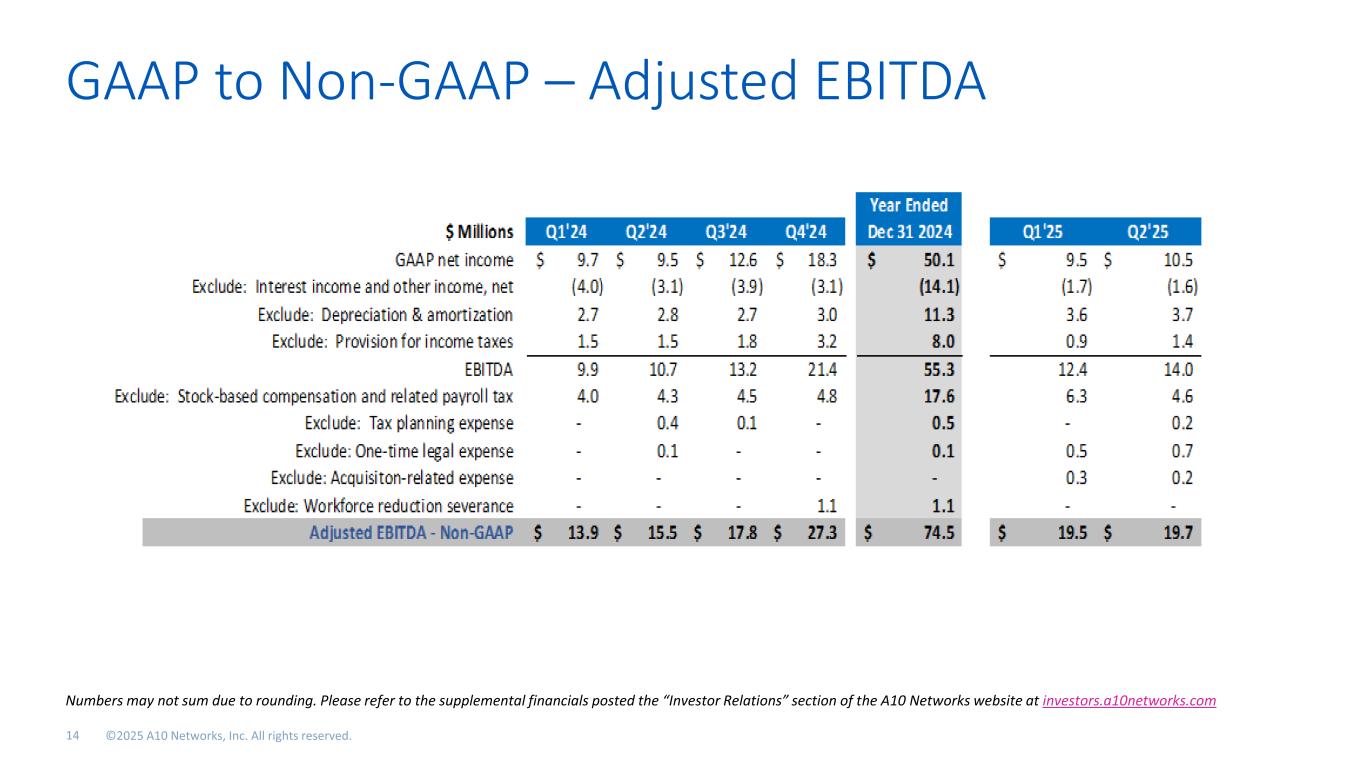
EBITDA AND ADJUSTED EBITDA (NON-GAAP)
(unaudited, in thousands, except percentages)
| | | | | | | | | | | | | | | | | | | | | | | |
| Three Months Ended June 30, | | Six Months Ended June 30, |
| 2025 | | 2024 | | 2025 | | 2024 |
| | | | | | | |
| GAAP net income | $ | 10,538 | | | $ | 9,476 | | | $ | 20,081 | | | $ | 19,202 | |
| GAAP net income margin | 15.2 | % | | 15.8 | % | | 14.8 | % | | 15.9 | % |
| | | | | | | |
| Exclude: Interest and other income, net | (1,618) | | | (3,067) | | | (3,318) | | | (7,074) | |
| Exclude: Depreciation and amortization | 3,681 | | | 2,815 | | | 7,280 | | | 5,507 | |
| Exclude: Provision for income taxes | 1,391 | | | 1,507 | | | 2,326 | | | 3,001 | |
| EBITDA | 13,992 | | | 10,731 | | | 26,369 | | | 20,636 | |
| Exclude: Stock-based compensation and related payroll tax | 4,586 | | | 4,309 | | | 10,878 | | | 8,298 | |
| Exclude: Acquisition-related expense | 210 | | | — | | | 554 | | | — | |
| | | | | | | |
| | | | | | | |
| Exclude: One-time legal expense | 721 | | | 71 | | | 1,247 | | | 71 | |
| Exclude: Tax planning expense | 150 | | | 400 | | | 150 | | | 400 | |
| Adjusted EBITDA | $ | 19,659 | | | $ | 15,511 | | | $ | 39,198 | | | $ | 29,405 | |
| Adjusted EBITDA margin | 28.3 | % | | 25.8 | % | | 28.9 | % | | 24.3 | % |