Athene Fixed Income Investor Presentation August 2024
Disclaimer This presentation does not constitute an offer to sell, or the solicitation of an offer to buy, any security of Athene Holding Ltd. (“AHL” and together with its consolidated subsidiaries, “Athene”). This presentation is not intended to constitute a solicitation of any insurance policy or contract or application therefor. Unless the context requires otherwise, references in this presentation to “Apollo" and "AGM" refer to Apollo Global Management, Inc., together with its subsidiaries, references in this presentation to "AGM HoldCo" refer to Apollo Global Management, Inc., and references in this presentation to “AAM” refer to Apollo Asset Management, Inc., a subsidiary of Apollo Global Management, Inc. This presentation contains, and certain oral statements made by Athene’s representatives from time to time may contain, forward-looking statements within the meaning of the Private Securities Litigation Reform Act of 1995, Section 27A of the Securities Act of 1933, as amended, and Section 21E of the Securities Exchange Act of 1934, as amended. Such statements are subject to risks, uncertainties and assumptions that could cause actual results, events and developments to differ materially from those set forth in, or implied by, such statements. These statements are based on the beliefs and assumptions of Athene’s management. Generally, forward-looking statements include actions, events, results, strategies and expectations and are often identifiable by use of the words “believes,” “expects,” “intends,” “anticipates,” “plans,” “seeks,” “estimates,” “projects,” “may,” “will,” “could,” “might,” or “continues” or similar expressions. Forward- looking statements within this presentation include, but are not limited to, benefits to be derived from Athene's capital allocation decisions; the anticipated performance of Athene's portfolio in certain stress or recessionary environments; the performance of Athene's business; general economic conditions; expected future operating results; Athene's liquidity and capital resources; and other non-historical statements. Although Athene management believes that the expectations reflected in these forward-looking statements are reasonable, it can give no assurance that these expectations will prove to be correct. For a discussion of other risks and uncertainties related to Athene's forward-looking statements, see its annual report on Form 10-K for the year ended December 31, 2023 and quarterly report on Form 10-Q filed for the period ended June 30, 2024, which can be found at the SEC’s website at www.sec.gov. All forward- looking statements described herein are qualified by these cautionary statements and there can be no assurance that the actual results, events or developments referenced herein will occur or be realized. Athene does not undertake any obligation to update or revise forward-looking statements to reflect changed assumptions, the occurrence of unanticipated events or changes to future operating results. Athene adopted the US GAAP accounting standard related to Targeted Improvements to the Accounting for Long-Duration Contracts (LDTI) as of January 1, 2023, which required Athene to apply the new standard retrospectively back to January 1, 2022, the date of Athene’s merger with AGM. Certain 2022 US GAAP financial metrics and disclosures in this presentation have been retrospectively adjusted in accordance with the requirements of the adoption guidance of LDTI. Please refer to the discussion of Non-GAAP Measures and Definitions herein for additional information on items that are excluded from Athene’s non-GAAP measure of spread related earnings, which was retrospectively adjusted in accordance with the requirements of the adoption guidance of LDTI. Information contained herein may include information respecting prior performance of Athene. Information respecting prior performance, while a useful tool, is not necessarily indicative of actual results to be achieved in the future, which is dependent upon many factors, many of which are beyond Athene's control. The information contained herein is not a guarantee of future performance by Athene, and actual outcomes and results may differ materially from any historic, pro forma or projected financial results indicated herein. Certain of the financial information contained herein is unaudited or based on the application of non-GAAP financial measures. These non-GAAP financial measures should be considered in addition to and not as a substitute for, or superior to, financial measures presented in accordance with GAAP. Furthermore, certain financial information is based on estimates of management. These estimates, which are based on the reasonable expectations of management, are subject to change and there can be no assurance that they will prove to be correct. The information contained herein does not purport to be all-inclusive or contain all information that an evaluator may require in order to properly evaluate the business, prospects or value of Athene. Athene does not have any obligation to update this presentation and the information may change at any time without notice. Models that may be contained herein (the “Models”) are being provided for illustrative and discussion purposes only and are not intended to forecast or predict future events. Information provided in the Models may not reflect the most current data and is subject to change. The Models are based on estimates and assumptions that are also subject to change and may be subject to significant business, economic and competitive uncertainties, including numerous uncontrollable market and event driven situations. There is no guarantee that the information presented in the Models is accurate. Actual results may differ materially from those reflected and contemplated in such hypothetical, forward- looking information. Undue reliance should not be placed on such information and investors should not use the Models to make investment decisions. Athene has no duty to update the Models in the future. Certain of the information used in preparing this presentation was obtained from third parties or public sources. No representation or warranty, express or implied, is made or given by or on behalf of Athene or any other person as to the accuracy, completeness or fairness of such information, and no responsibility or liability is accepted for any such information. The contents of any website referenced in this presentation are not incorporated by reference and only speak as of the date listed thereon. This document is not intended to be, nor should it be construed or used as, financial, legal, tax, insurance or investment advice. There can be no assurance that Athene will achieve its objectives. Past performance is not indicative of future success. All information is as of the dates indicated herein. 2

Perspectives on Recent Performance
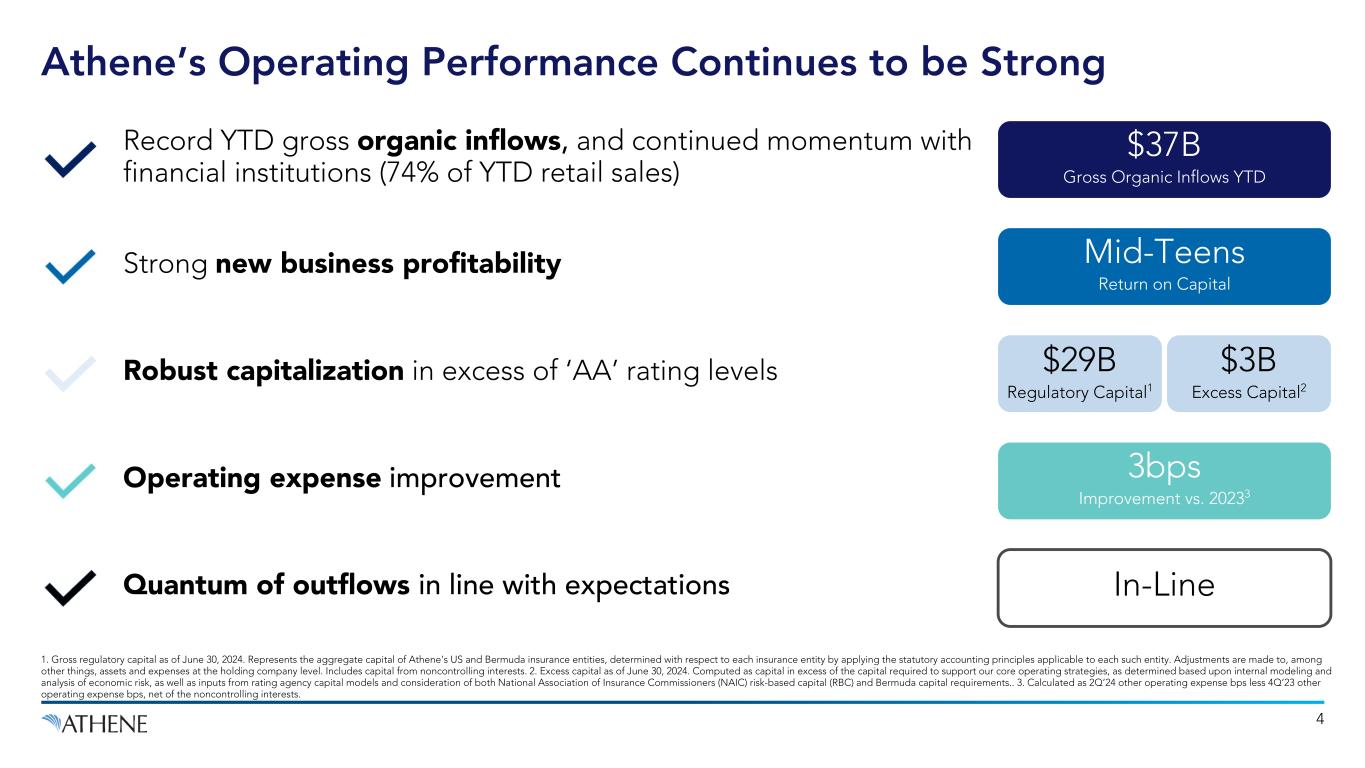
Record YTD gross organic inflows, and continued momentum with financial institutions (74% of YTD retail sales) Strong new business profitability Robust capitalization in excess of ‘AA’ rating levels Operating expense improvement Quantum of outflows in line with expectations 4 Athene’s Operating Performance Continues to be Strong 1. Gross regulatory capital as of June 30, 2024. Represents the aggregate capital of Athene's US and Bermuda insurance entities, determined with respect to each insurance entity by applying the statutory accounting principles applicable to each such entity. Adjustments are made to, among other things, assets and expenses at the holding company level. Includes capital from noncontrolling interests. 2. Excess capital as of June 30, 2024. Computed as capital in excess of the capital required to support our core operating strategies, as determined based upon internal modeling and analysis of economic risk, as well as inputs from rating agency capital models and consideration of both National Association of Insurance Commissioners (NAIC) risk-based capital (RBC) and Bermuda capital requirements.. 3. Calculated as 2Q’24 other operating expense bps less 4Q’23 other operating expense bps, net of the noncontrolling interests. $37B Gross Organic Inflows YTD Mid-Teens Return on Capital 3bps Improvement vs. 20233 In-Line $3B Excess Capital2 $29B Regulatory Capital1
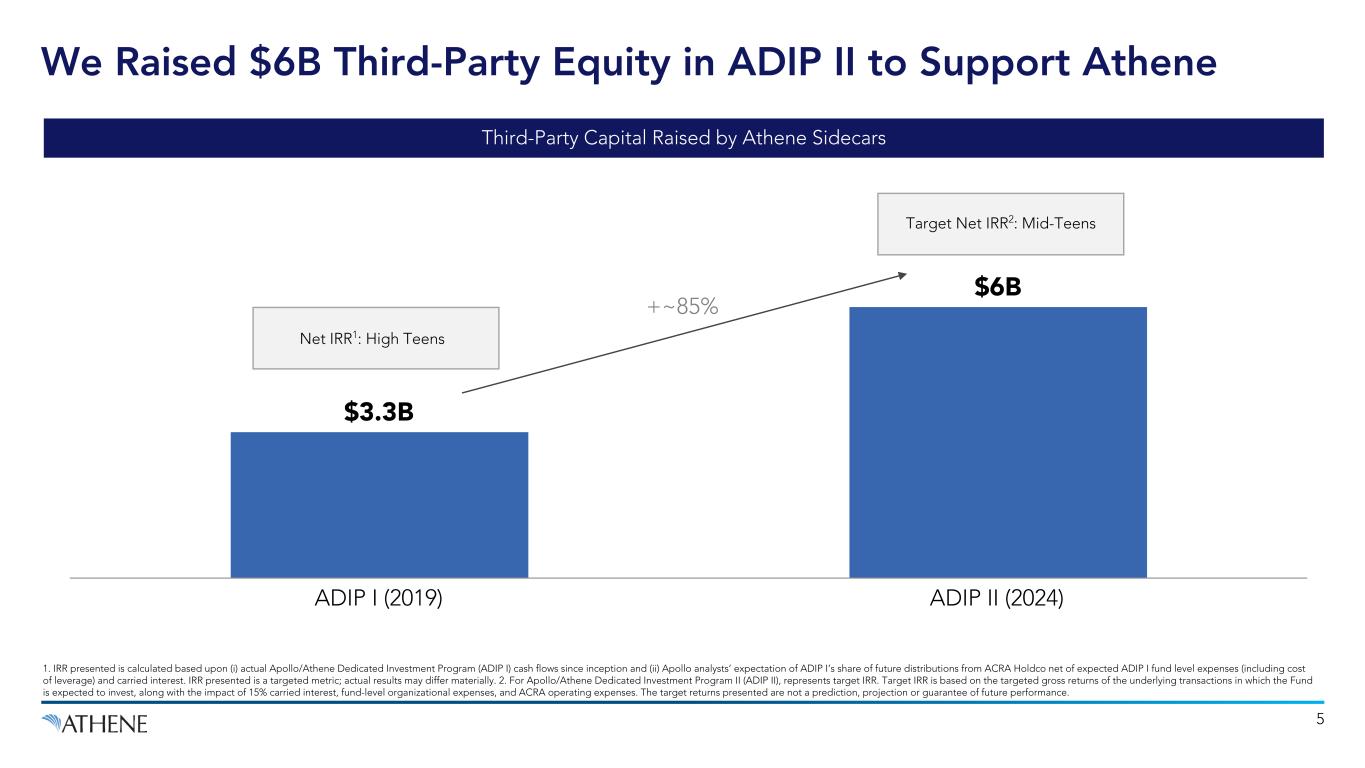
$3.3B $6B ADIP I (2019) ADIP II (2024) Third-Party Capital Raised by Athene Sidecars +~85% Net IRR1: High Teens Target Net IRR2: Mid-Teens 1. IRR presented is calculated based upon (i) actual Apollo/Athene Dedicated Investment Program (ADIP I) cash flows since inception and (ii) Apollo analysts’ expectation of ADIP I’s share of future distributions from ACRA Holdco net of expected ADIP I fund level expenses (including cost of leverage) and carried interest. IRR presented is a targeted metric; actual results may differ materially. 2. For Apollo/Athene Dedicated Investment Program II (ADIP II), represents target IRR. Target IRR is based on the targeted gross returns of the underlying transactions in which the Fund is expected to invest, along with the impact of 15% carried interest, fund-level organizational expenses, and ACRA operating expenses. The target returns presented are not a prediction, projection or guarantee of future performance. We Raised $6B Third-Party Equity in ADIP II to Support Athene 5
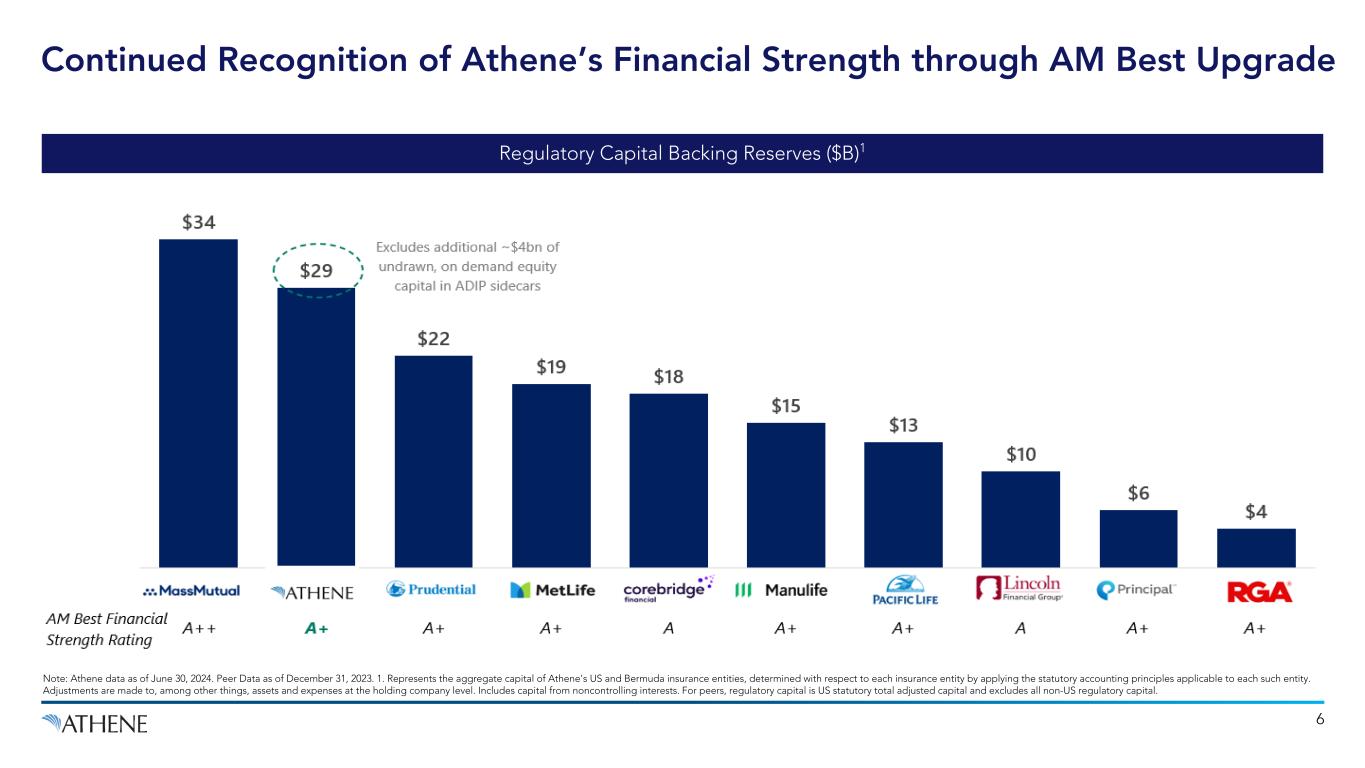
Continued Recognition of Athene’s Financial Strength through AM Best Upgrade Note: Athene data as of June 30, 2024. Peer Data as of December 31, 2023. 1. Represents the aggregate capital of Athene's US and Bermuda insurance entities, determined with respect to each insurance entity by applying the statutory accounting principles applicable to each such entity. Adjustments are made to, among other things, assets and expenses at the holding company level. Includes capital from noncontrolling interests. For peers, regulatory capital is US statutory total adjusted capital and excludes all non-US regulatory capital. Regulatory Capital Backing Reserves ($B)1 6
Review of Special Business Topics 2 3 1 Interest Rate Hedging and Floating Rate Portfolio Run-off of Profitable COVID Business Alternatives Portfolio Update 7
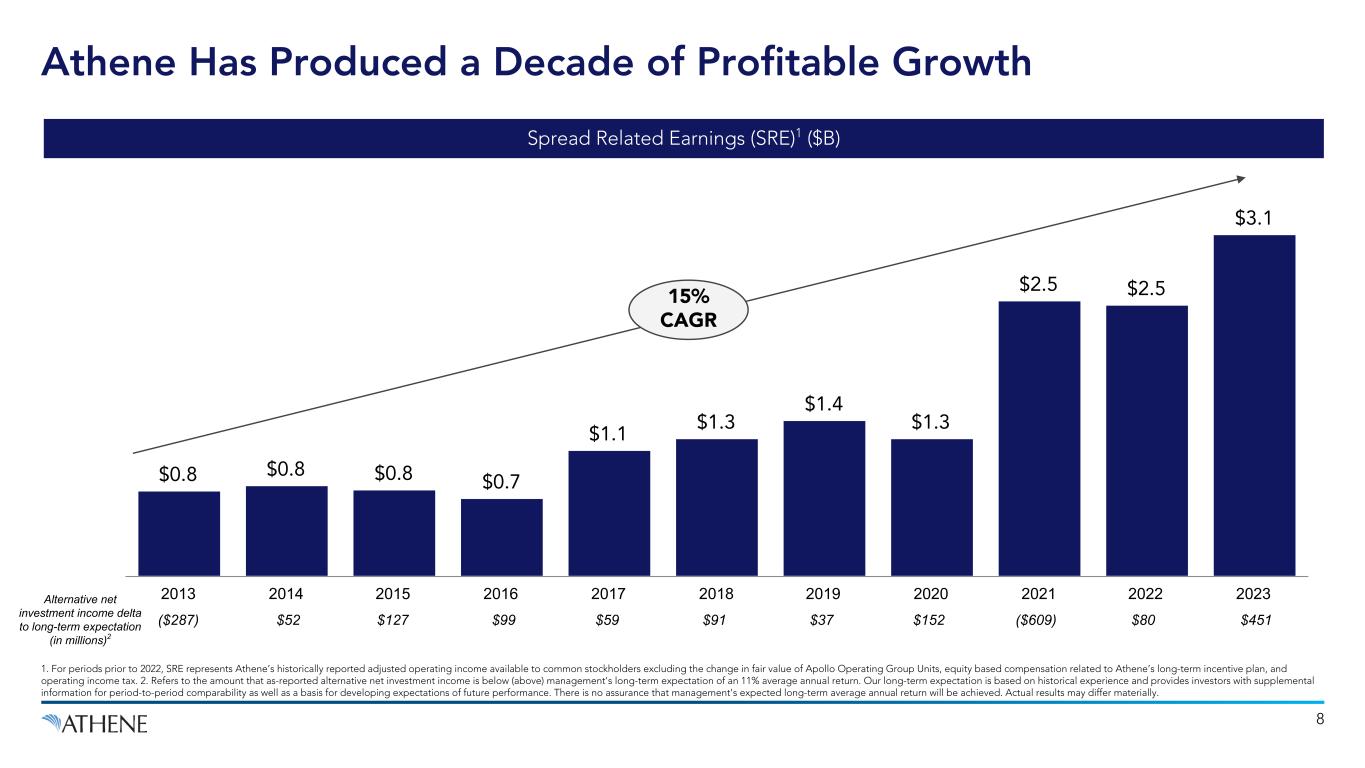
$0.8 $0.8 $0.8 $0.7 $1.1 $1.3 $1.4 $1.3 $2.5 $2.5 $3.1 2013 2014 2015 2016 2017 2018 2019 2020 2021 2022 2023 Athene Has Produced a Decade of Profitable Growth Spread Related Earnings (SRE)1 ($B) 15% CAGR 8 Alternative net investment income delta to long-term expectation (in millions)2 ($287) $52 $127 $99 $59 $91 $37 $152 ($609) $80 $451 1. For periods prior to 2022, SRE represents Athene’s historically reported adjusted operating income available to common stockholders excluding the change in fair value of Apollo Operating Group Units, equity based compensation related to Athene’s long-term incentive plan, and operating income tax. 2. Refers to the amount that as-reported alternative net investment income is below (above) management's long-term expectation of an 11% average annual return. Our long-term expectation is based on historical experience and provides investors with supplemental information for period-to-period comparability as well as a basis for developing expectations of future performance. There is no assurance that management's expected long-term average annual return will be achieved. Actual results may differ materially.
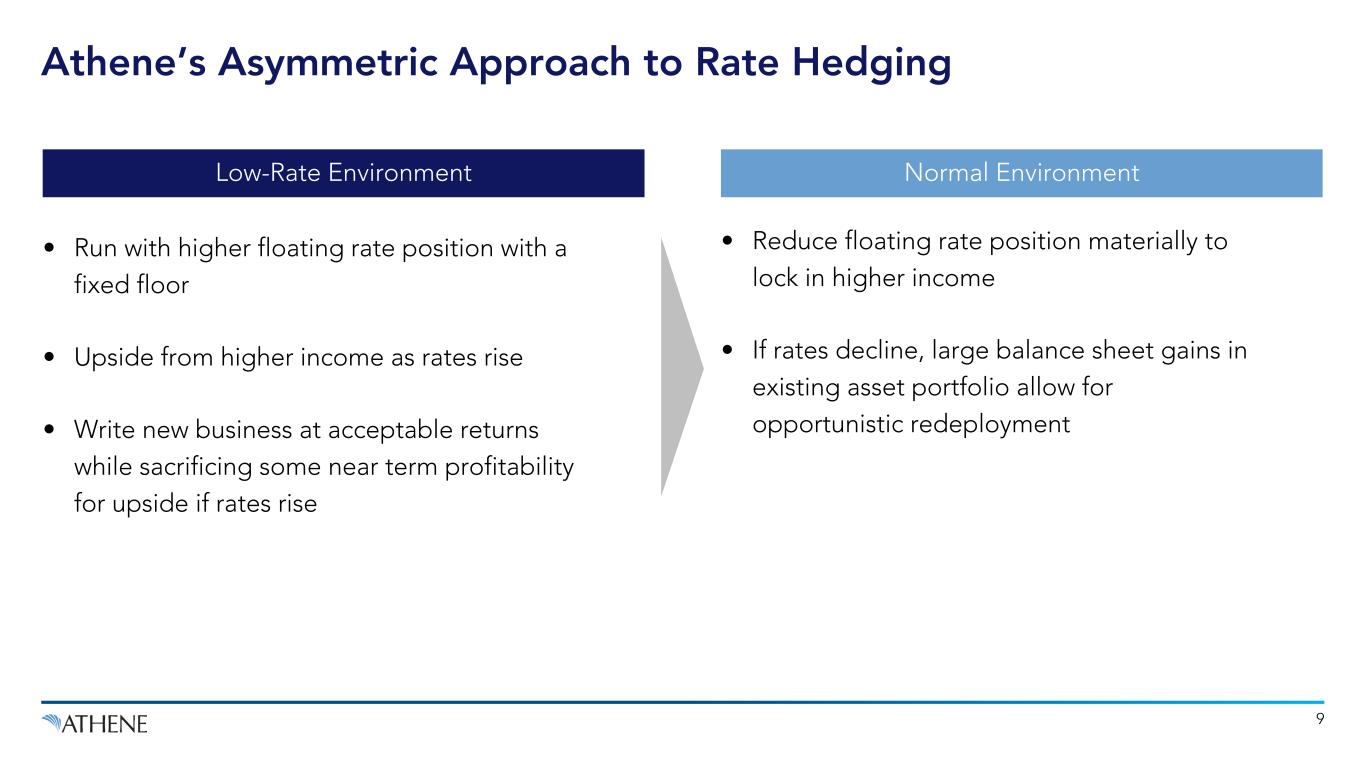
Low-Rate Environment Normal Environment • Run with higher floating rate position with a fixed floor • Upside from higher income as rates rise • Write new business at acceptable returns while sacrificing some near term profitability for upside if rates rise • Reduce floating rate position materially to lock in higher income • If rates decline, large balance sheet gains in existing asset portfolio allow for opportunistic redeployment 9 Athene’s Asymmetric Approach to Rate Hedging
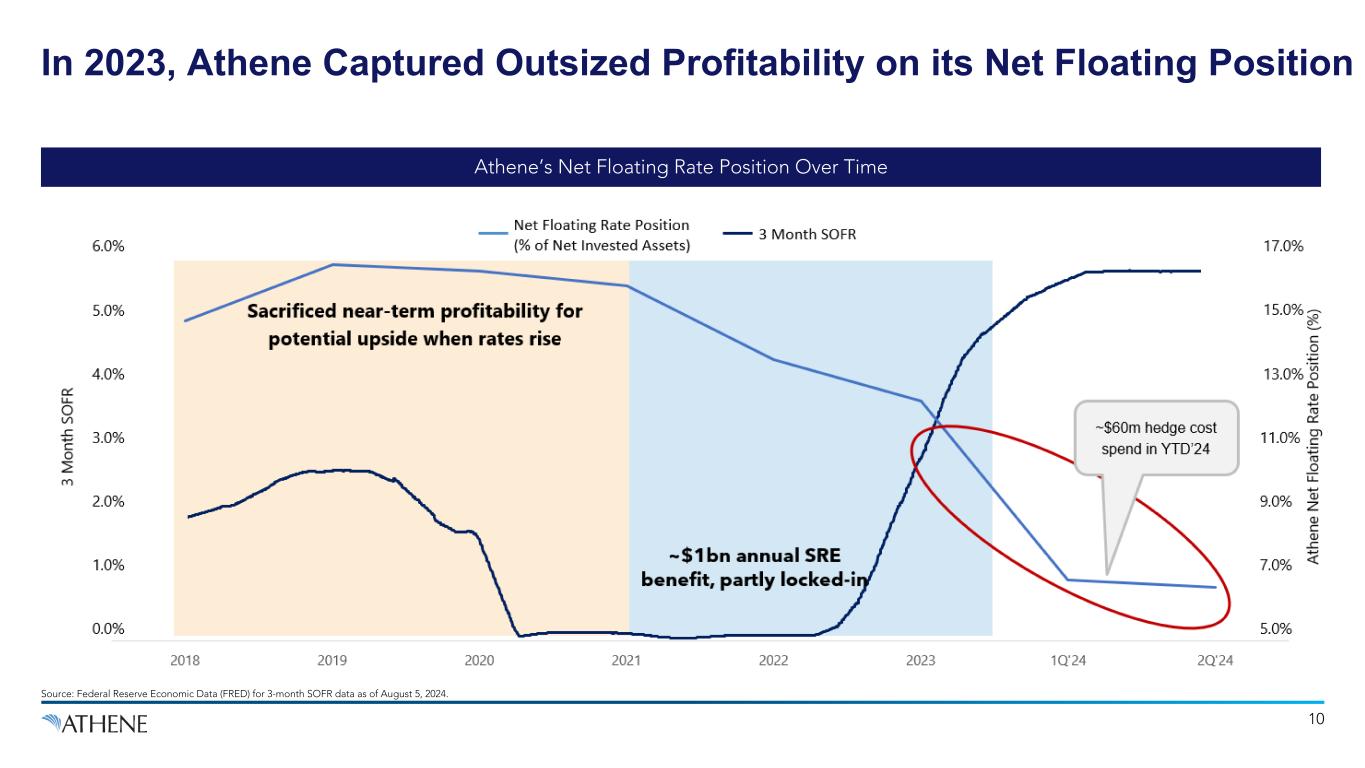
Source: Federal Reserve Economic Data (FRED) for 3-month SOFR data as of August 5, 2024. Athene’s Net Floating Rate Position Over Time In 2023, Athene Captured Outsized Profitability on its Net Floating Position 10
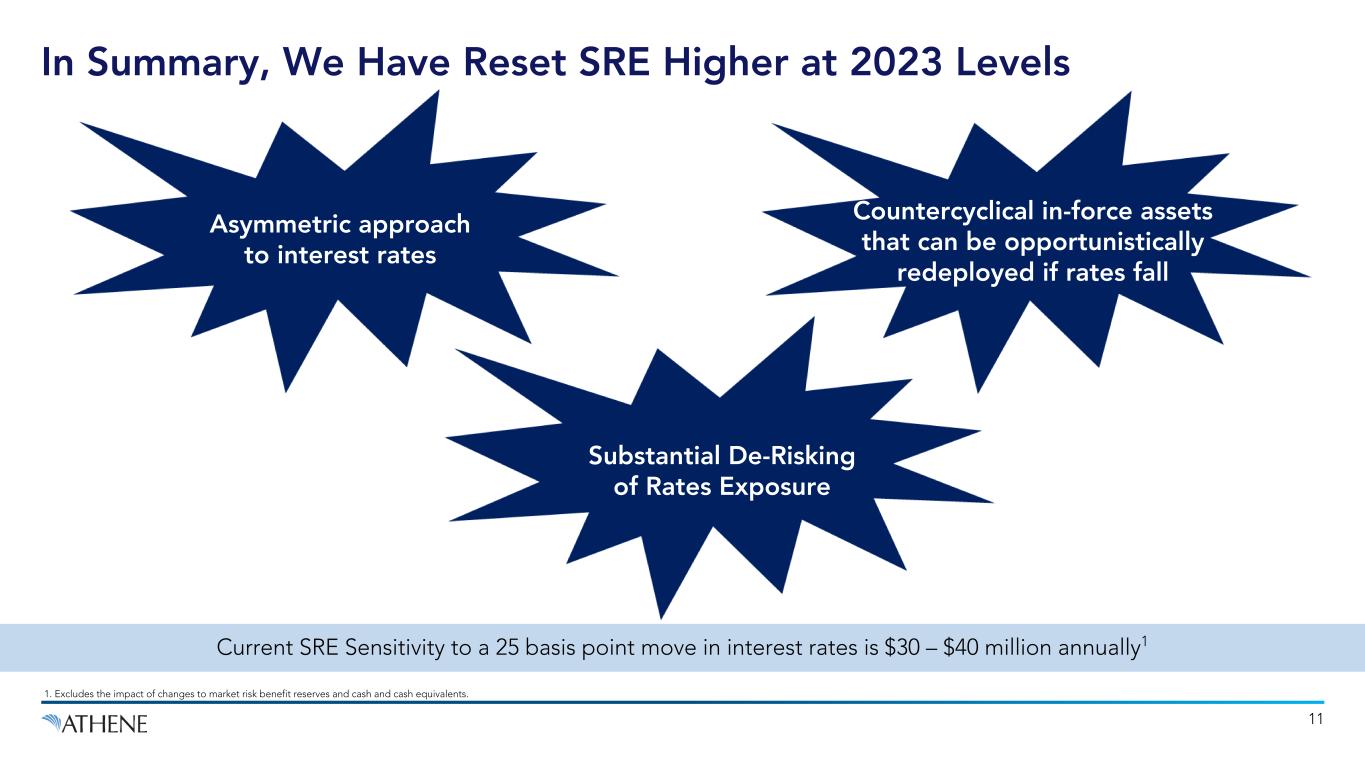
Current SRE Sensitivity to a 25 basis point move in interest rates is $30 – $40 million annually1 In Summary, We Have Reset SRE Higher at 2023 Levels Asymmetric approach to interest rates Countercyclical in-force assets that can be opportunistically redeployed if rates fall Substantial De-Risking of Rates Exposure 11 1. Excludes the impact of changes to market risk benefit reserves and cash and cash equivalents.
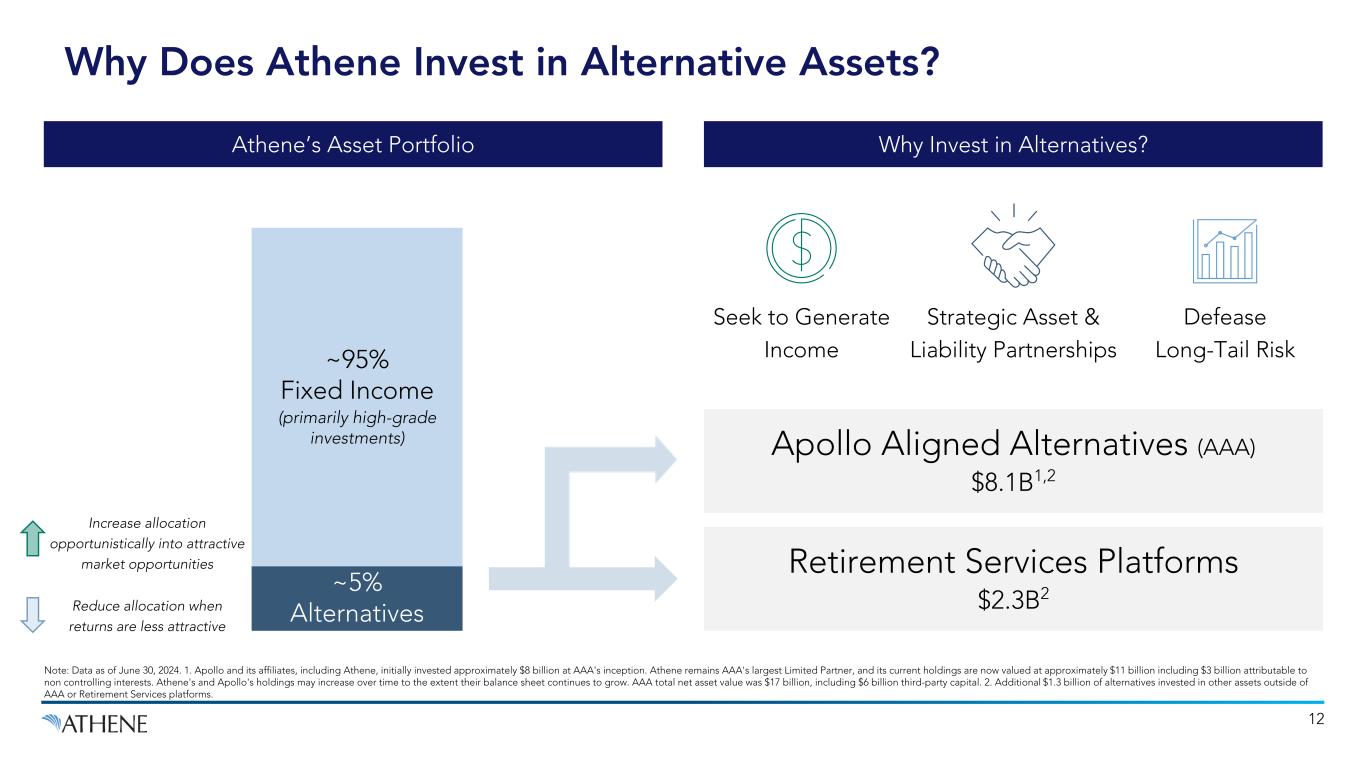
Why Does Athene Invest in Alternative Assets? Athene’s Asset Portfolio Why Invest in Alternatives? Increase allocation opportunistically into attractive market opportunities Reduce allocation when returns are less attractive Seek to Generate Income Strategic Asset & Liability Partnerships Defease Long-Tail Risk Apollo Aligned Alternatives (AAA) $8.1B1,2 ~95% Fixed Income (primarily high-grade investments) ~5% Alternatives Retirement Services Platforms $2.3B2 Note: Data as of June 30, 2024. 1. Apollo and its affiliates, including Athene, initially invested approximately $8 billion at AAA's inception. Athene remains AAA's largest Limited Partner, and its current holdings are now valued at approximately $11 billion including $3 billion attributable to non controlling interests. Athene's and Apollo's holdings may increase over time to the extent their balance sheet continues to grow. AAA total net asset value was $17 billion, including $6 billion third-party capital. 2. Additional $1.3 billion of alternatives invested in other assets outside of AAA or Retirement Services platforms. 12
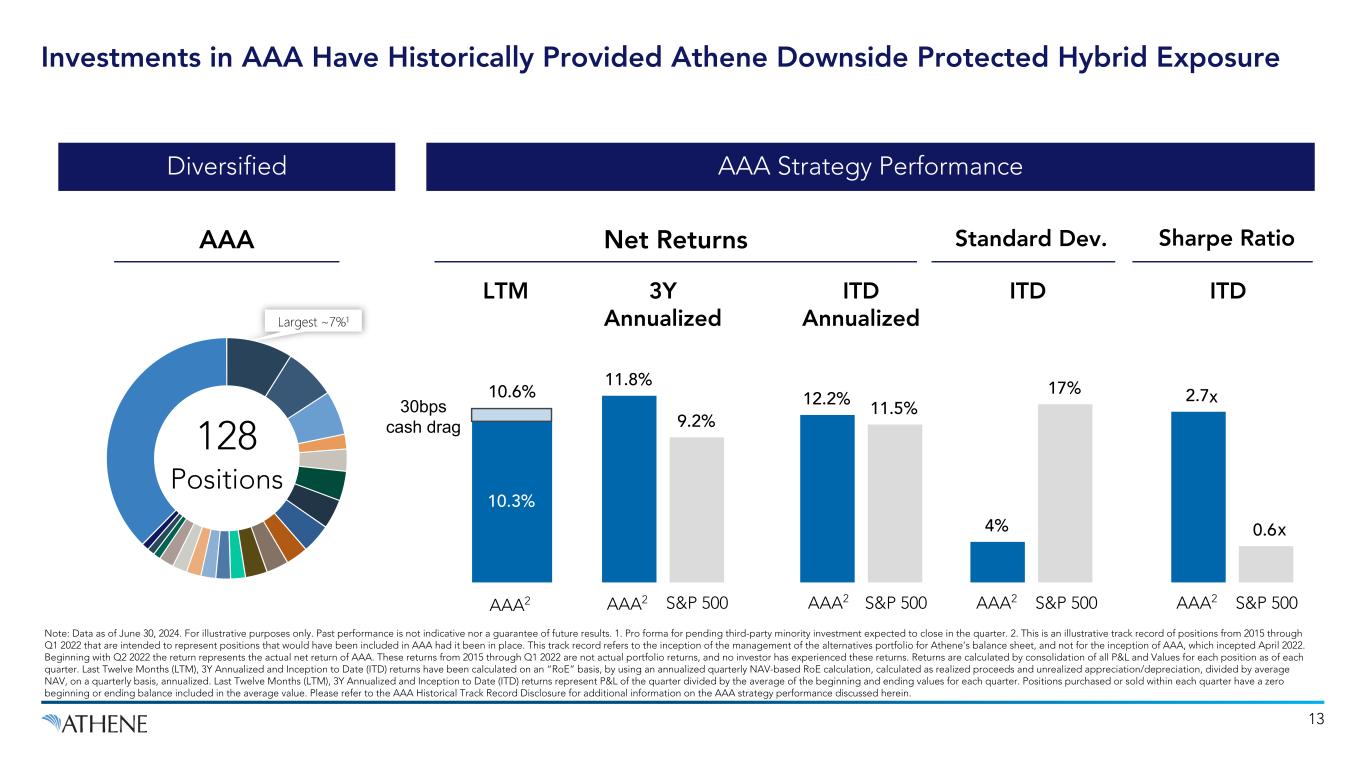
Sharpe RatioStandard Dev. 11.8% 9.2% 30bps cash drag 12.2% 11.5% 4% 17% 2.7 0.6 10.3% 128 Positions Investments in AAA Have Historically Provided Athene Downside Protected Hybrid Exposure AAA Strategy Performance AAA2 S&P 500 Net Returns Note: Data as of June 30, 2024. For illustrative purposes only. Past performance is not indicative nor a guarantee of future results. 1. Pro forma for pending third-party minority investment expected to close in the quarter. 2. This is an illustrative track record of positions from 2015 through Q1 2022 that are intended to represent positions that would have been included in AAA had it been in place. This track record refers to the inception of the management of the alternatives portfolio for Athene’s balance sheet, and not for the inception of AAA, which incepted April 2022. Beginning with Q2 2022 the return represents the actual net return of AAA. These returns from 2015 through Q1 2022 are not actual portfolio returns, and no investor has experienced these returns. Returns are calculated by consolidation of all P&L and Values for each position as of each quarter. Last Twelve Months (LTM), 3Y Annualized and Inception to Date (ITD) returns have been calculated on an “RoE” basis, by using an annualized quarterly NAV-based RoE calculation, calculated as realized proceeds and unrealized appreciation/depreciation, divided by average NAV, on a quarterly basis, annualized. Last Twelve Months (LTM), 3Y Annualized and Inception to Date (ITD) returns represent P&L of the quarter divided by the average of the beginning and ending values for each quarter. Positions purchased or sold within each quarter have a zero beginning or ending balance included in the average value. Please refer to the AAA Historical Track Record Disclosure for additional information on the AAA strategy performance discussed herein. 13 Diversified AAA AAA2 3Y Annualized LTM 10.6% ITD Annualized AAA2 S&P 500 ITD ITD AAA2 S&P 500 AAA2 S&P 500 x x
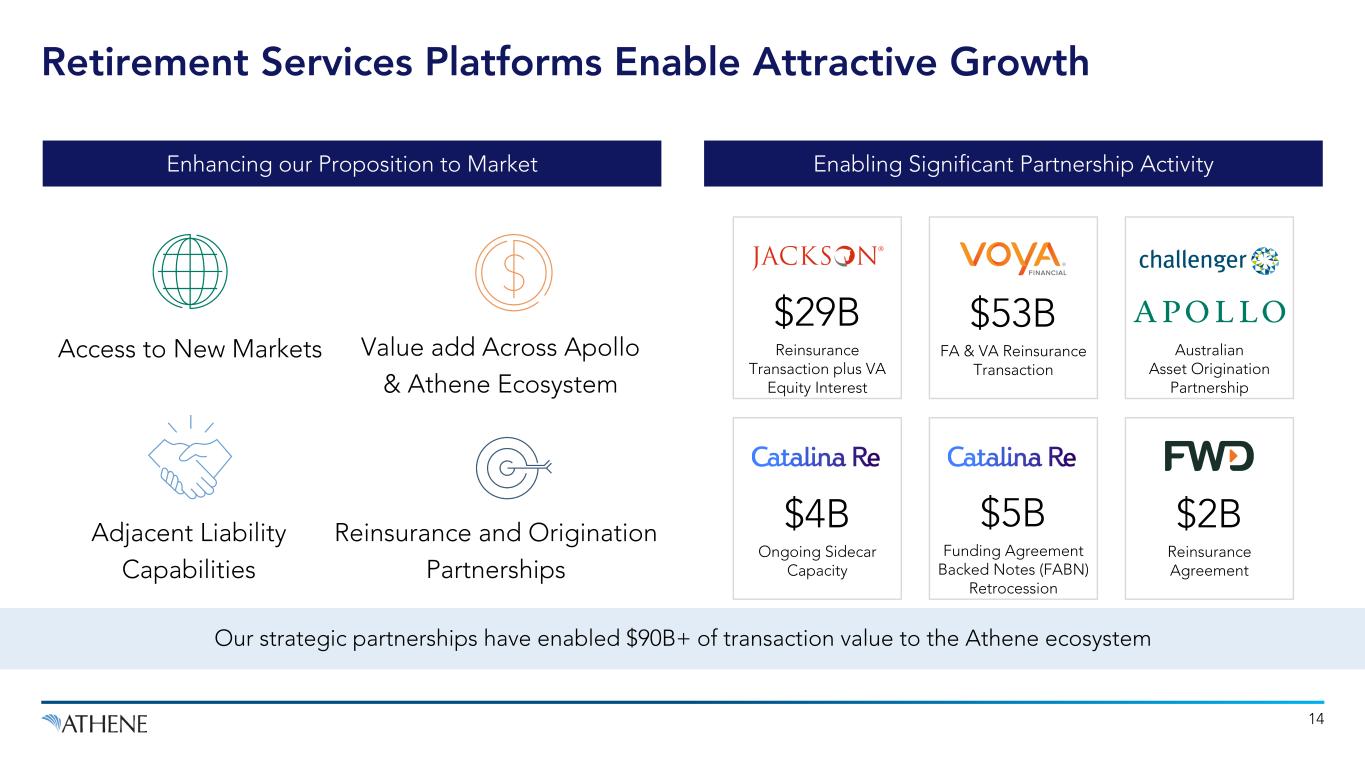
Retirement Services Platforms Enable Attractive Growth Our strategic partnerships have enabled $90B+ of transaction value to the Athene ecosystem $29B Reinsurance Transaction plus VA Equity Interest Australian Asset Origination Partnership $53B FA & VA Reinsurance Transaction $5B Funding Agreement Backed Notes (FABN) Retrocession $2B Reinsurance Agreement $4B Ongoing Sidecar Capacity 14 Enhancing our Proposition to Market Enabling Significant Partnership Activity Adjacent Liability Capabilities Value add Across Apollo & Athene Ecosystem Reinsurance and Origination Partnerships Access to New Markets
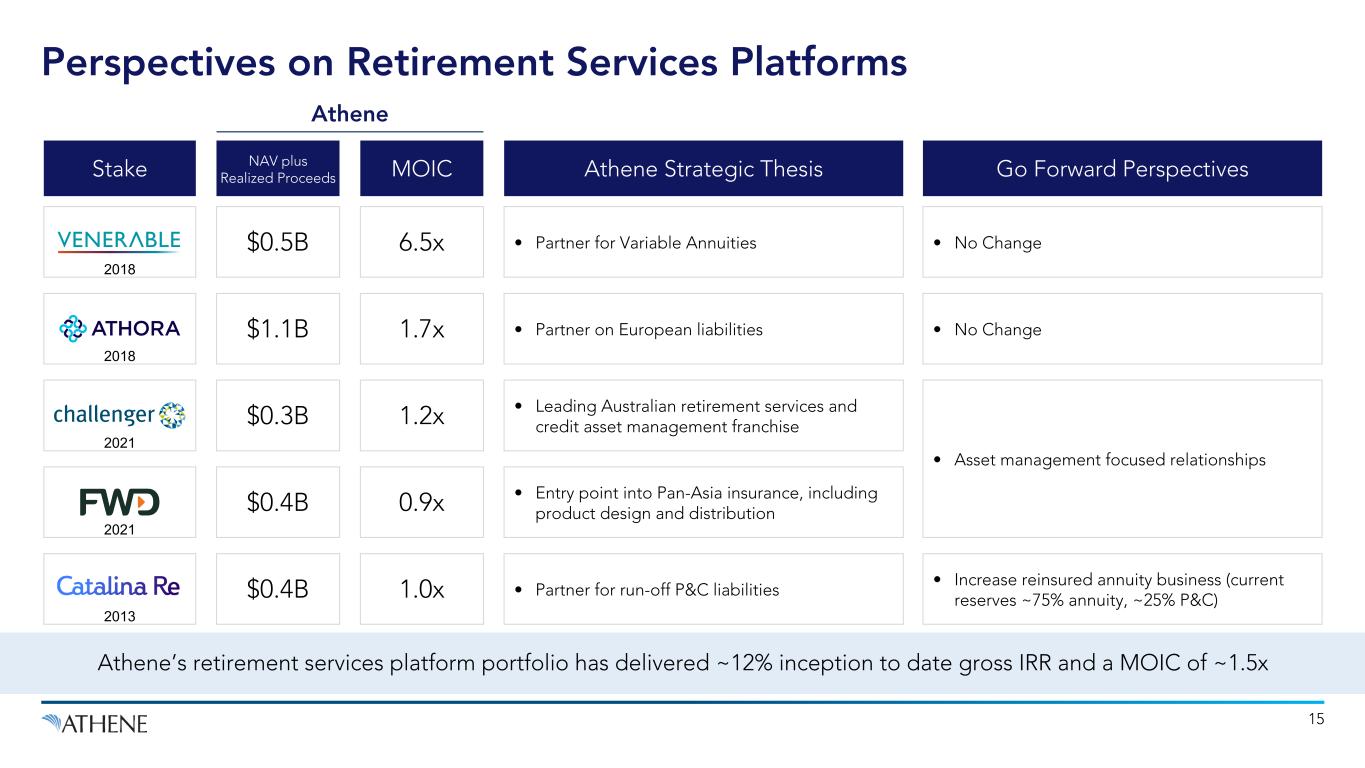
Perspectives on Retirement Services Platforms 2021 2021 Athene Strategic Thesis Go Forward Perspectives Athene’s retirement services platform portfolio has delivered ~12% inception to date gross IRR and a MOIC of ~1.5x • Partner for Variable Annuities • No Change • Partner on European liabilities • No Change • Leading Australian retirement services and credit asset management franchise • Asset management focused relationships NAV plus Realized Proceeds $0.5B $1.1B $0.3B • Entry point into Pan-Asia insurance, including product design and distribution$0.4B • Increase reinsured annuity business (current reserves ~75% annuity, ~25% P&C) • Partner for run-off P&C liabilities$0.4B Stake 2018 2018 2013 MOIC 6.5x 1.7x 1.2x 0.9x 1.0x Athene 15
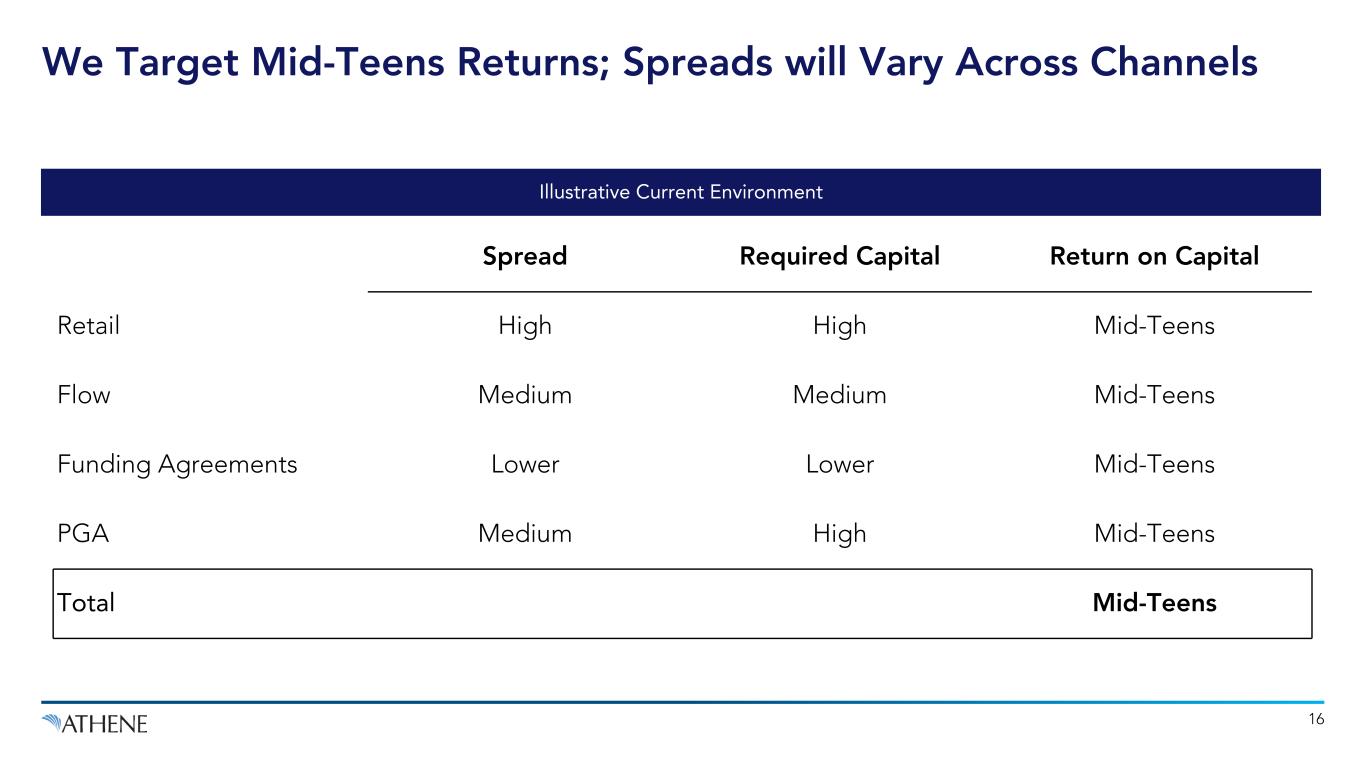
Spread Required Capital Return on Capital Retail High High Mid-Teens Flow Medium Medium Mid-Teens Funding Agreements Lower Lower Mid-Teens PGA Medium High Mid-Teens Total Mid-Teens Illustrative Current Environment We Target Mid-Teens Returns; Spreads will Vary Across Channels 16
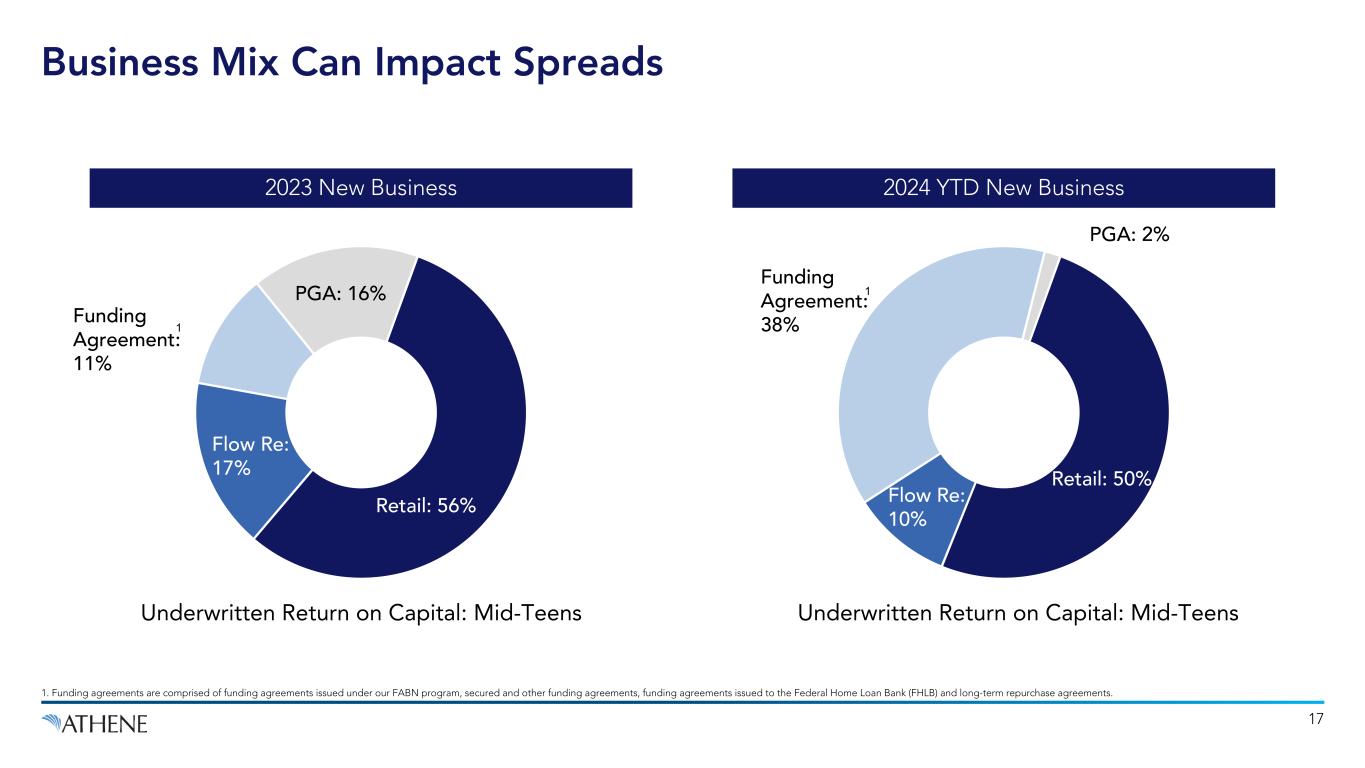
Business Mix Can Impact Spreads Retail: 56% Flow Re: 17% Funding Agreement: 11% PGA: 16% 2023 New Business 2024 YTD New Business Underwritten Return on Capital: Mid-Teens Retail: 50% Flow Re: 10% Funding Agreement: 38% PGA: 2% 17 1. Funding agreements are comprised of funding agreements issued under our FABN program, secured and other funding agreements, funding agreements issued to the Federal Home Loan Bank (FHLB) and long-term repurchase agreements. 1 1 Underwritten Return on Capital: Mid-Teens
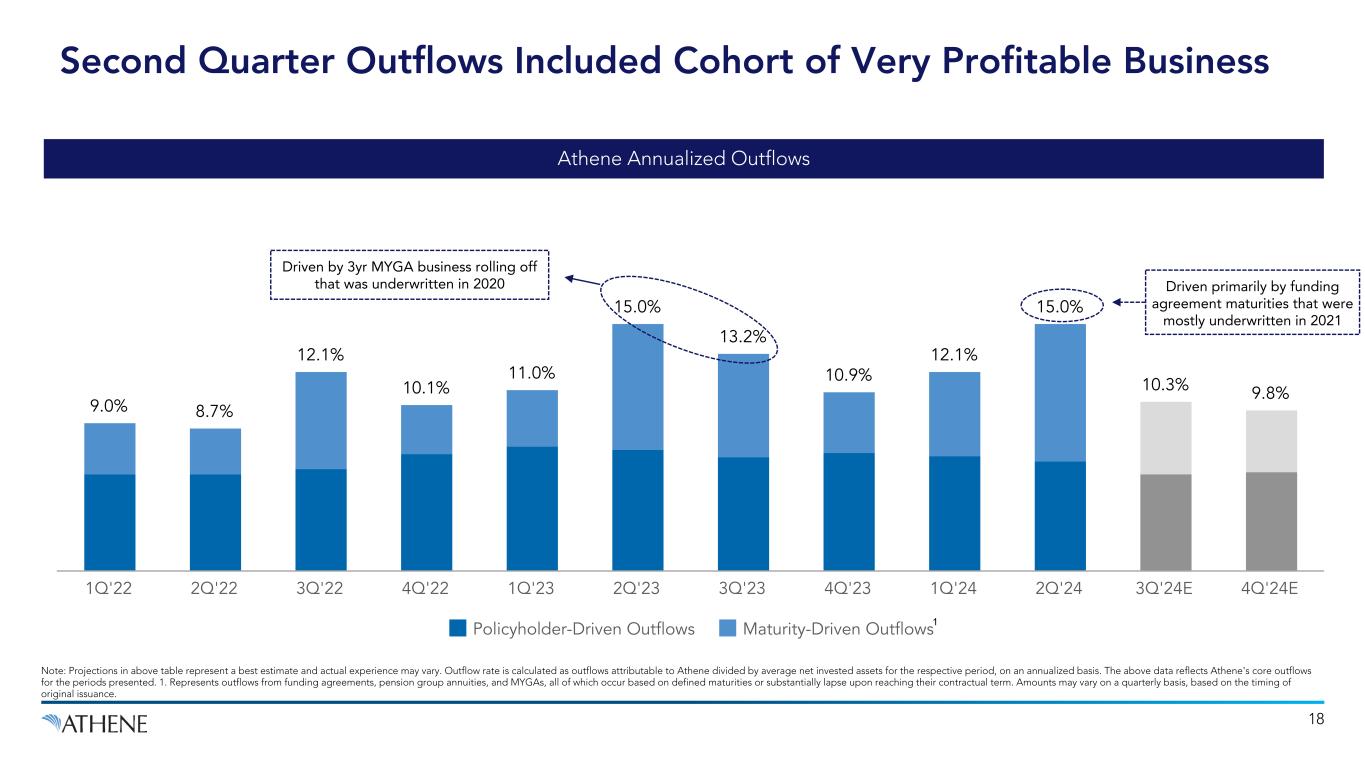
18 Note: Projections in above table represent a best estimate and actual experience may vary. Outflow rate is calculated as outflows attributable to Athene divided by average net invested assets for the respective period, on an annualized basis. The above data reflects Athene's core outflows for the periods presented. 1. Represents outflows from funding agreements, pension group annuities, and MYGAs, all of which occur based on defined maturities or substantially lapse upon reaching their contractual term. Amounts may vary on a quarterly basis, based on the timing of original issuance. Second Quarter Outflows Included Cohort of Very Profitable Business 9.0% 8.7% 12.1% 10.1% 11.0% 15.0% 13.2% 10.9% 12.1% 15.0% 10.3% 9.8% Policyholder-Driven Outflows Maturity-Driven Outflows 1Q'22 2Q'22 3Q'22 4Q'22 1Q'23 2Q'23 3Q'23 4Q'23 1Q'24 2Q'24 3Q'24E 4Q'24E 1 Driven primarily by funding agreement maturities that were mostly underwritten in 2021 Driven by 3yr MYGA business rolling off that was underwritten in 2020 Athene Annualized Outflows

Second Quarter Update
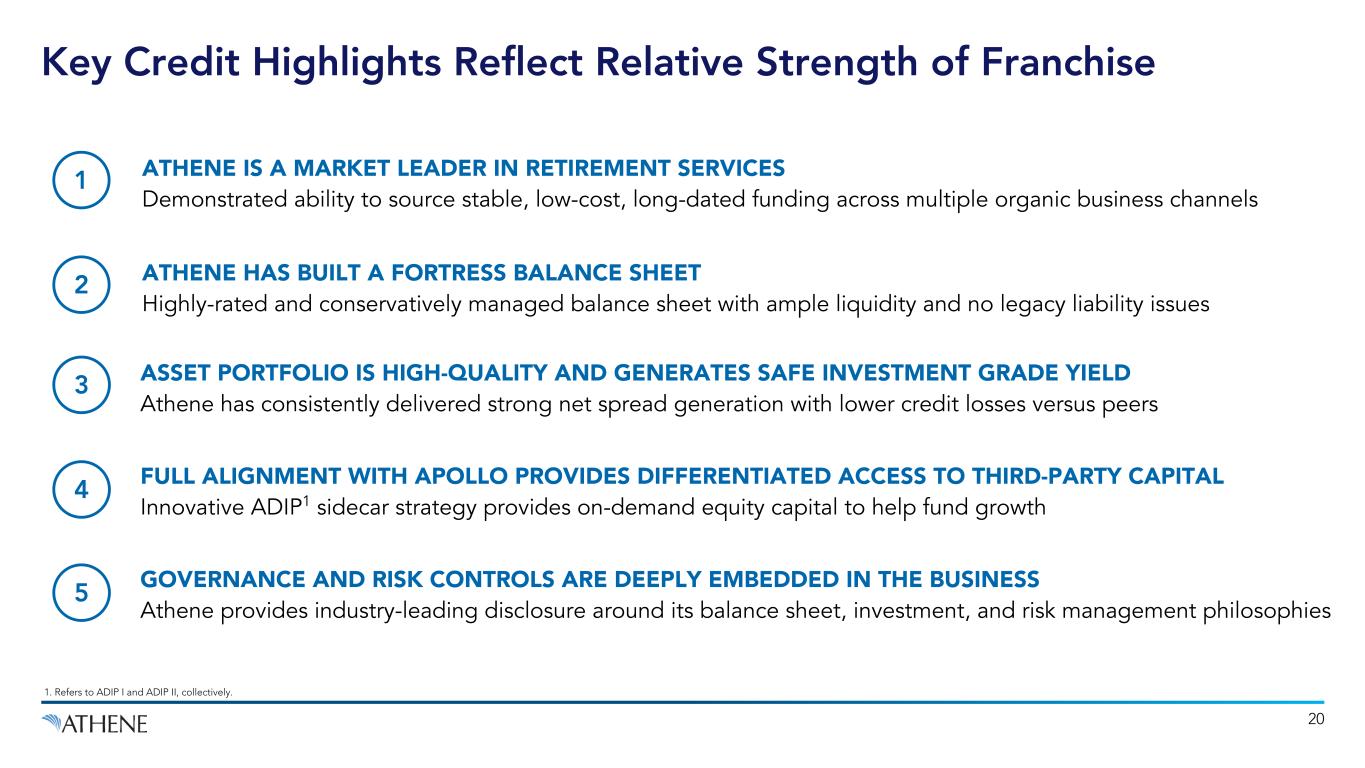
20 Key Credit Highlights Reflect Relative Strength of Franchise ASSET PORTFOLIO IS HIGH-QUALITY AND GENERATES SAFE INVESTMENT GRADE YIELD Athene has consistently delivered strong net spread generation with lower credit losses versus peers 3 ATHENE HAS BUILT A FORTRESS BALANCE SHEET Highly-rated and conservatively managed balance sheet with ample liquidity and no legacy liability issues 2 5 ATHENE IS A MARKET LEADER IN RETIREMENT SERVICES Demonstrated ability to source stable, low-cost, long-dated funding across multiple organic business channels 1 FULL ALIGNMENT WITH APOLLO PROVIDES DIFFERENTIATED ACCESS TO THIRD-PARTY CAPITAL Innovative ADIP1 sidecar strategy provides on-demand equity capital to help fund growth 4 GOVERNANCE AND RISK CONTROLS ARE DEEPLY EMBEDDED IN THE BUSINESS Athene provides industry-leading disclosure around its balance sheet, investment, and risk management philosophies 1. Refers to ADIP I and ADIP II, collectively.
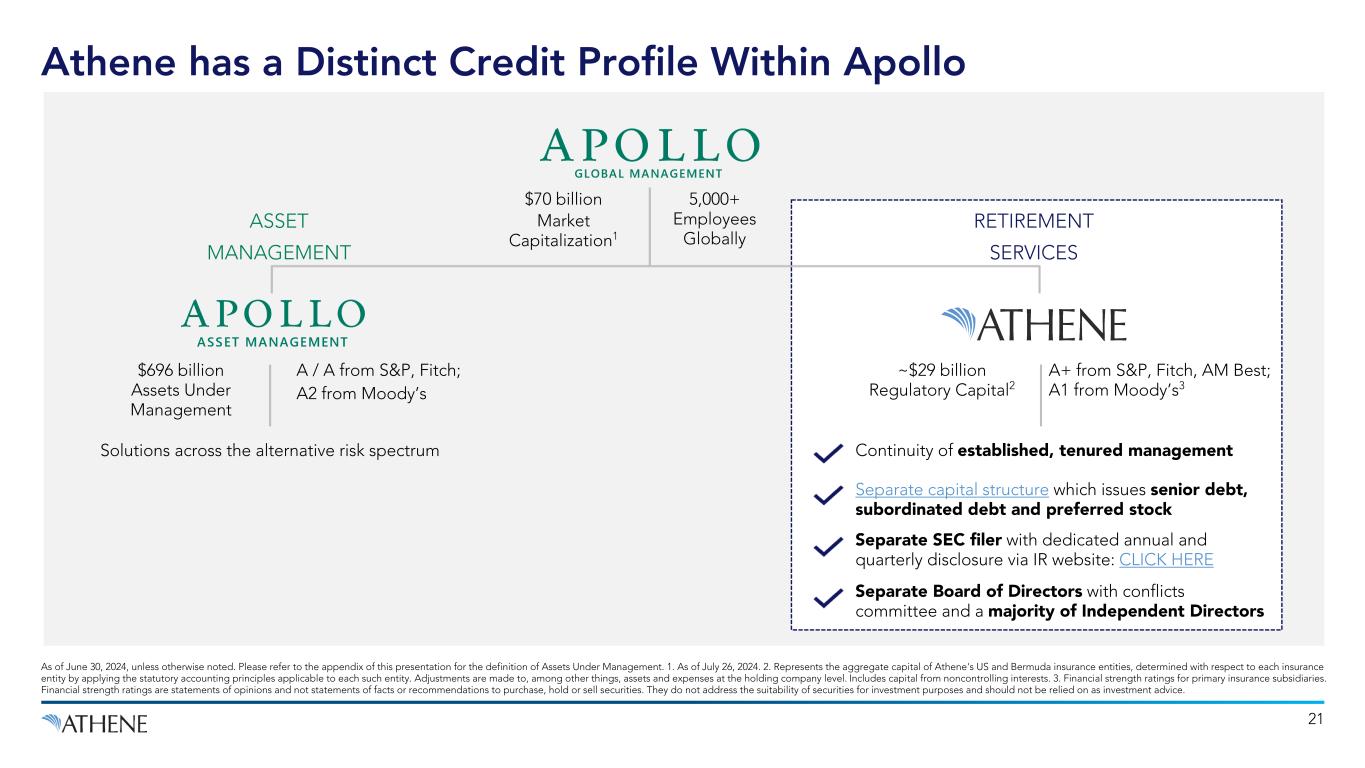
21 Athene has a Distinct Credit Profile Within Apollo $696 billion Assets Under Management ~$29 billion Regulatory Capital2 A+ from S&P, Fitch, AM Best; A1 from Moody’s3 ASSET MANAGEMENT RETIREMENT SERVICES 5,000+ Employees Globally Solutions across the alternative risk spectrum Separate capital structure which issues senior debt, subordinated debt and preferred stock Separate SEC filer with dedicated annual and quarterly disclosure via IR website: CLICK HERE Separate Board of Directors with conflicts committee and a majority of Independent Directors Continuity of established, tenured management A / A from S&P, Fitch; A2 from Moody’s As of June 30, 2024, unless otherwise noted. Please refer to the appendix of this presentation for the definition of Assets Under Management. 1. As of July 26, 2024. 2. Represents the aggregate capital of Athene's US and Bermuda insurance entities, determined with respect to each insurance entity by applying the statutory accounting principles applicable to each such entity. Adjustments are made to, among other things, assets and expenses at the holding company level. Includes capital from noncontrolling interests. 3. Financial strength ratings for primary insurance subsidiaries. Financial strength ratings are statements of opinions and not statements of facts or recommendations to purchase, hold or sell securities. They do not address the suitability of securities for investment purposes and should not be relied on as investment advice. $70 billion Market Capitalization1
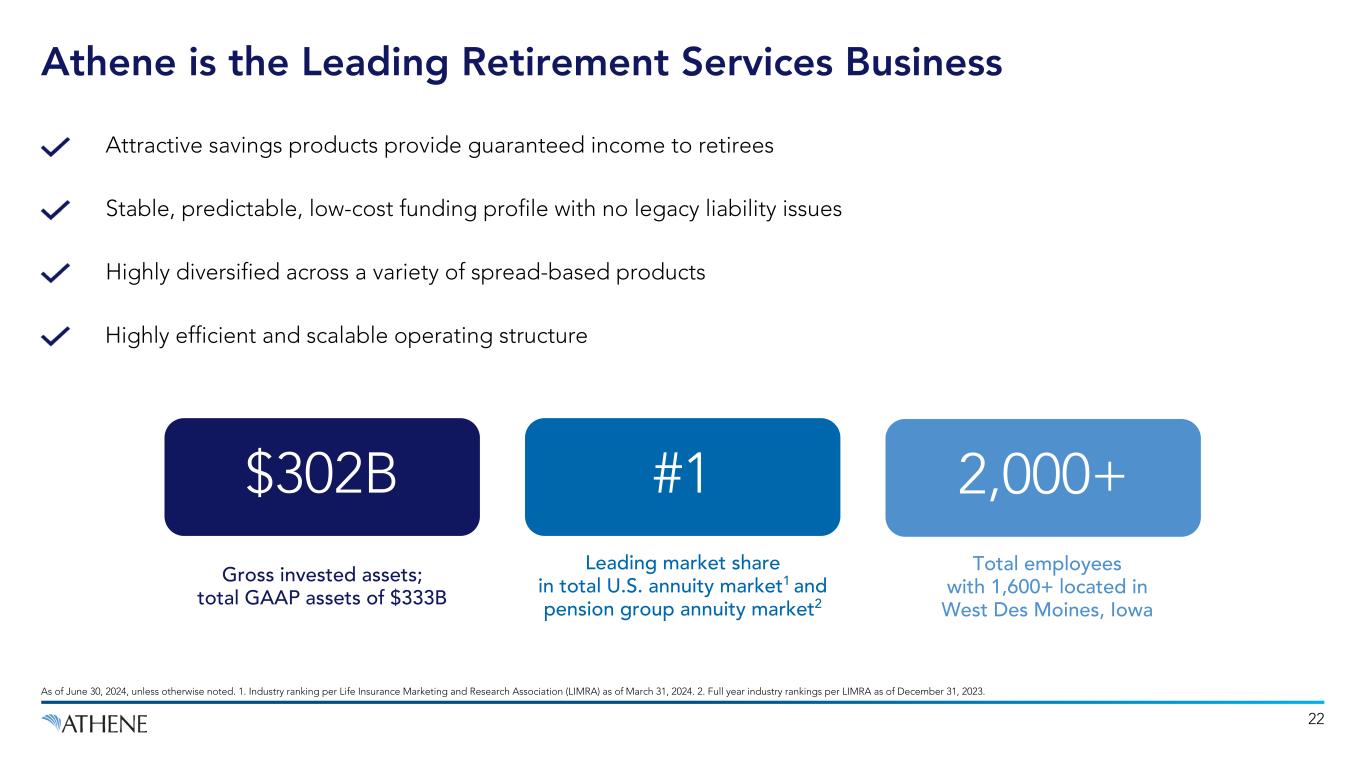
22 Athene is the Leading Retirement Services Business As of June 30, 2024, unless otherwise noted. 1. Industry ranking per Life Insurance Marketing and Research Association (LIMRA) as of March 31, 2024. 2. Full year industry rankings per LIMRA as of December 31, 2023. Attractive savings products provide guaranteed income to retirees Highly diversified across a variety of spread-based products Stable, predictable, low-cost funding profile with no legacy liability issues Highly efficient and scalable operating structure Total employees with 1,600+ located in West Des Moines, Iowa 2,000+ Leading market share in total U.S. annuity market1 and pension group annuity market2 #1 Gross invested assets; total GAAP assets of $333B $302B
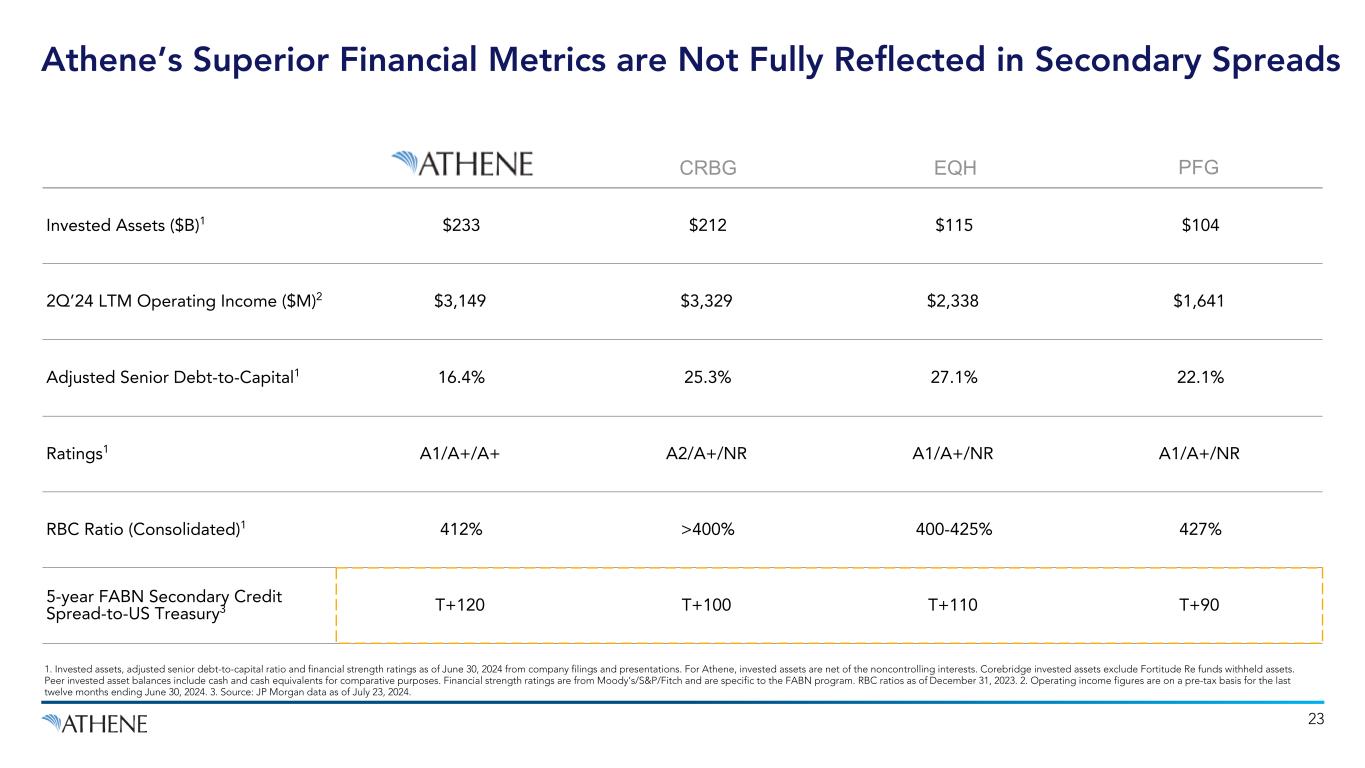
Invested Assets ($B)1 $233 $212 $115 $104 2Q’24 LTM Operating Income ($M)2 $3,149 $3,329 $2,338 $1,641 Adjusted Senior Debt-to-Capital1 16.4% 25.3% 27.1% 22.1% Ratings1 A1/A+/A+ A2/A+/NR A1/A+/NR A1/A+/NR RBC Ratio (Consolidated)1 412% >400% 400-425% 427% 5-year FABN Secondary Credit Spread-to-US Treasury3 T+120 T+100 T+110 T+90 1. Invested assets, adjusted senior debt-to-capital ratio and financial strength ratings as of June 30, 2024 from company filings and presentations. For Athene, invested assets are net of the noncontrolling interests. Corebridge invested assets exclude Fortitude Re funds withheld assets. Peer invested asset balances include cash and cash equivalents for comparative purposes. Financial strength ratings are from Moody’s/S&P/Fitch and are specific to the FABN program. RBC ratios as of December 31, 2023. 2. Operating income figures are on a pre-tax basis for the last twelve months ending June 30, 2024. 3. Source: JP Morgan data as of July 23, 2024. 23 CRBG EQH PFG Athene’s Superior Financial Metrics are Not Fully Reflected in Secondary Spreads
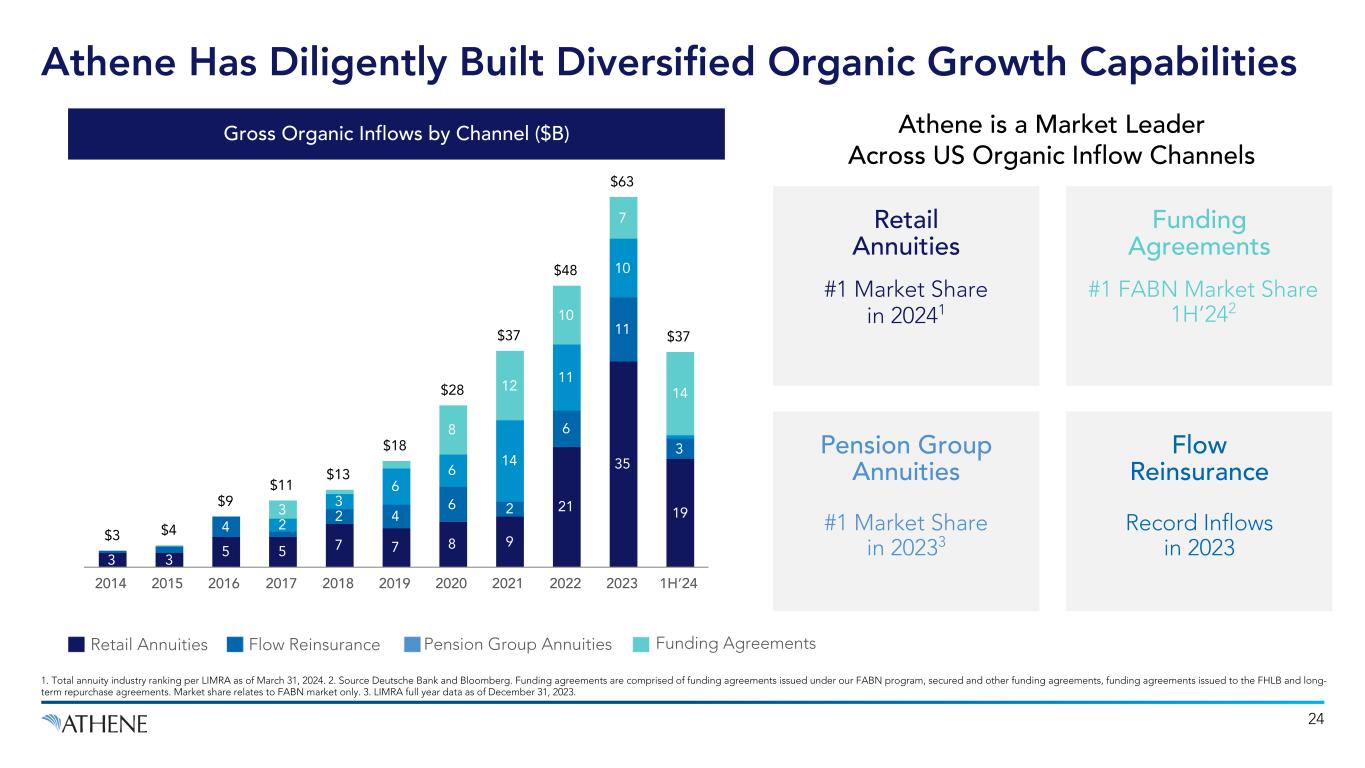
1. Total annuity industry ranking per LIMRA as of March 31, 2024. 2. Source Deutsche Bank and Bloomberg. Funding agreements are comprised of funding agreements issued under our FABN program, secured and other funding agreements, funding agreements issued to the FHLB and long- term repurchase agreements. Market share relates to FABN market only. 3. LIMRA full year data as of December 31, 2023. $3 $4 $9 $11 $13 $18 $28 $37 $48 $63 $37 3 3 5 5 7 7 8 9 21 35 19 4 2 4 6 2 6 11 3 2 3 6 6 14 11 10 3 8 12 10 7 14 2014 2015 2016 2017 2018 2019 2020 2021 2022 2023 1H’24 24 Athene Has Diligently Built Diversified Organic Growth Capabilities Funding AgreementsRetail Annuities Flow Reinsurance Pension Group Annuities Athene is a Market Leader Across US Organic Inflow Channels Pension Group Annuities #1 Market Share in 20233 Funding Agreements #1 FABN Market Share 1H’242 Retail Annuities #1 Market Share in 20241 Flow Reinsurance Record Inflows in 2023 Gross Organic Inflows by Channel ($B)
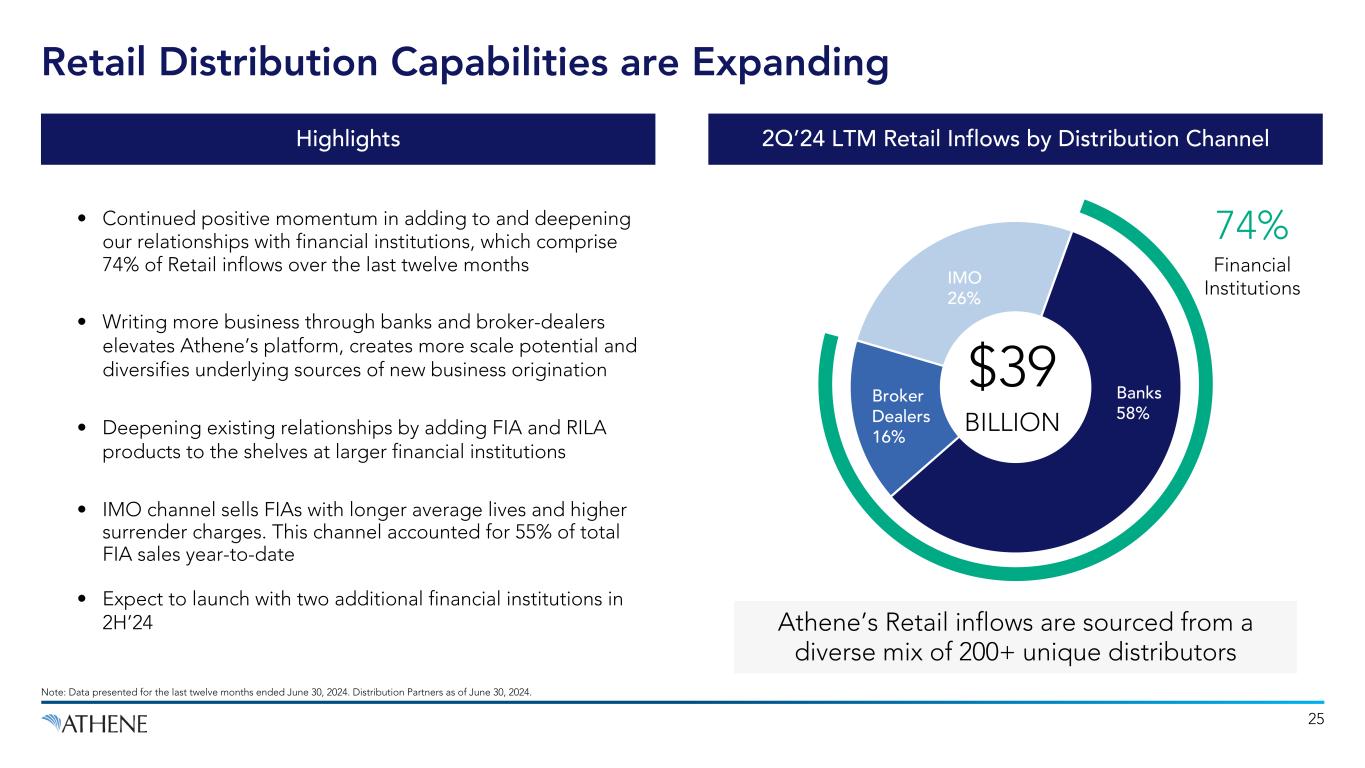
19 Distribution Partners 25 Retail Distribution Capabilities are Expanding Note: Data presented for the last twelve months ended June 30, 2024. Distribution Partners as of June 30, 2024. 2Q’24 LTM Retail Inflows by Distribution Channel Athene’s Retail inflows are sourced from a diverse mix of 200+ unique distributors • Continued positive momentum in adding to and deepening our relationships with financial institutions, which comprise 74% of Retail inflows over the last twelve months • Writing more business through banks and broker-dealers elevates Athene’s platform, creates more scale potential and diversifies underlying sources of new business origination • Deepening existing relationships by adding FIA and RILA products to the shelves at larger financial institutions • IMO channel sells FIAs with longer average lives and higher surrender charges. This channel accounted for 55% of total FIA sales year-to-date • Expect to launch with two additional financial institutions in 2H’24 Financial Institutions 74% Highlights 38 Distribution Partners 148 Distribution Partners $39 BILLION Banks 58% Broker Dealers 16% IMO 26%
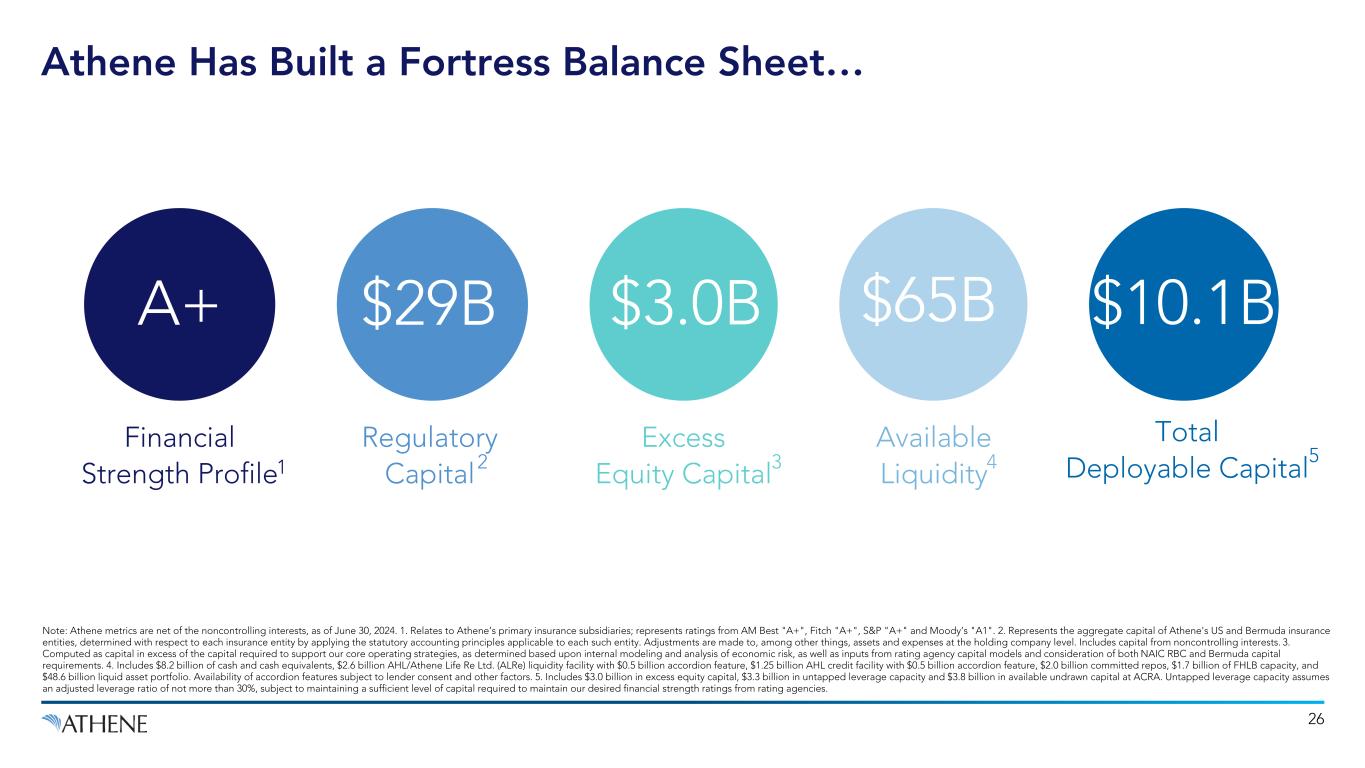
26 Note: Athene metrics are net of the noncontrolling interests, as of June 30, 2024. 1. Relates to Athene’s primary insurance subsidiaries; represents ratings from AM Best "A+", Fitch "A+", S&P "A+" and Moody’s "A1". 2. Represents the aggregate capital of Athene's US and Bermuda insurance entities, determined with respect to each insurance entity by applying the statutory accounting principles applicable to each such entity. Adjustments are made to, among other things, assets and expenses at the holding company level. Includes capital from noncontrolling interests. 3. Computed as capital in excess of the capital required to support our core operating strategies, as determined based upon internal modeling and analysis of economic risk, as well as inputs from rating agency capital models and consideration of both NAIC RBC and Bermuda capital requirements. 4. Includes $8.2 billion of cash and cash equivalents, $2.6 billion AHL/Athene Life Re Ltd. (ALRe) liquidity facility with $0.5 billion accordion feature, $1.25 billion AHL credit facility with $0.5 billion accordion feature, $2.0 billion committed repos, $1.7 billion of FHLB capacity, and $48.6 billion liquid asset portfolio. Availability of accordion features subject to lender consent and other factors. 5. Includes $3.0 billion in excess equity capital, $3.3 billion in untapped leverage capacity and $3.8 billion in available undrawn capital at ACRA. Untapped leverage capacity assumes an adjusted leverage ratio of not more than 30%, subject to maintaining a sufficient level of capital required to maintain our desired financial strength ratings from rating agencies. Athene Has Built a Fortress Balance Sheet… Financial Strength Profile A+ $3.0B Excess Equity Capital3 $29B Regulatory Capital2 $10.1B Total Deployable Capital5 Available Liquidity $65B 41
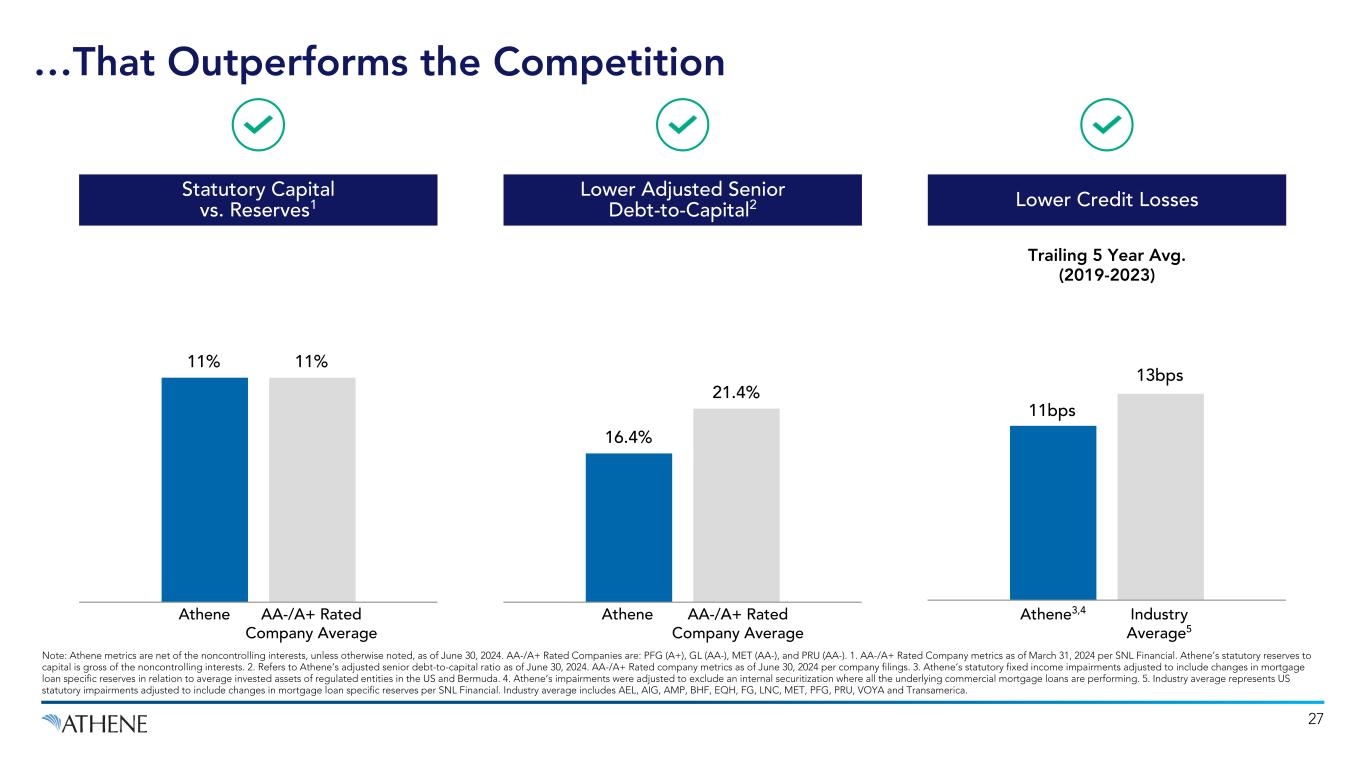
11% 11% 27 Note: Athene metrics are net of the noncontrolling interests, unless otherwise noted, as of June 30, 2024. AA-/A+ Rated Companies are: PFG (A+), GL (AA-), MET (AA-), and PRU (AA-). 1. AA-/A+ Rated Company metrics as of March 31, 2024 per SNL Financial. Athene’s statutory reserves to capital is gross of the noncontrolling interests. 2. Refers to Athene’s adjusted senior debt-to-capital ratio as of June 30, 2024. AA-/A+ Rated company metrics as of June 30, 2024 per company filings. 3. Athene’s statutory fixed income impairments adjusted to include changes in mortgage loan specific reserves in relation to average invested assets of regulated entities in the US and Bermuda. 4. Athene’s impairments were adjusted to exclude an internal securitization where all the underlying commercial mortgage loans are performing. 5. Industry average represents US statutory impairments adjusted to include changes in mortgage loan specific reserves per SNL Financial. Industry average includes AEL, AIG, AMP, BHF, EQH, FG, LNC, MET, PFG, PRU, VOYA and Transamerica. Trailing 5 Year Avg. (2019-2023) Statutory Capital vs. Reserves1 Lower Adjusted Senior Debt-to-Capital2 Lower Credit Losses Athene AA-/A+ Rated Company Average 16.4% 21.4% Athene AA-/A+ Rated Company Average Athene3,4 Industry Average5 11bps 13bps …That Outperforms the Competition
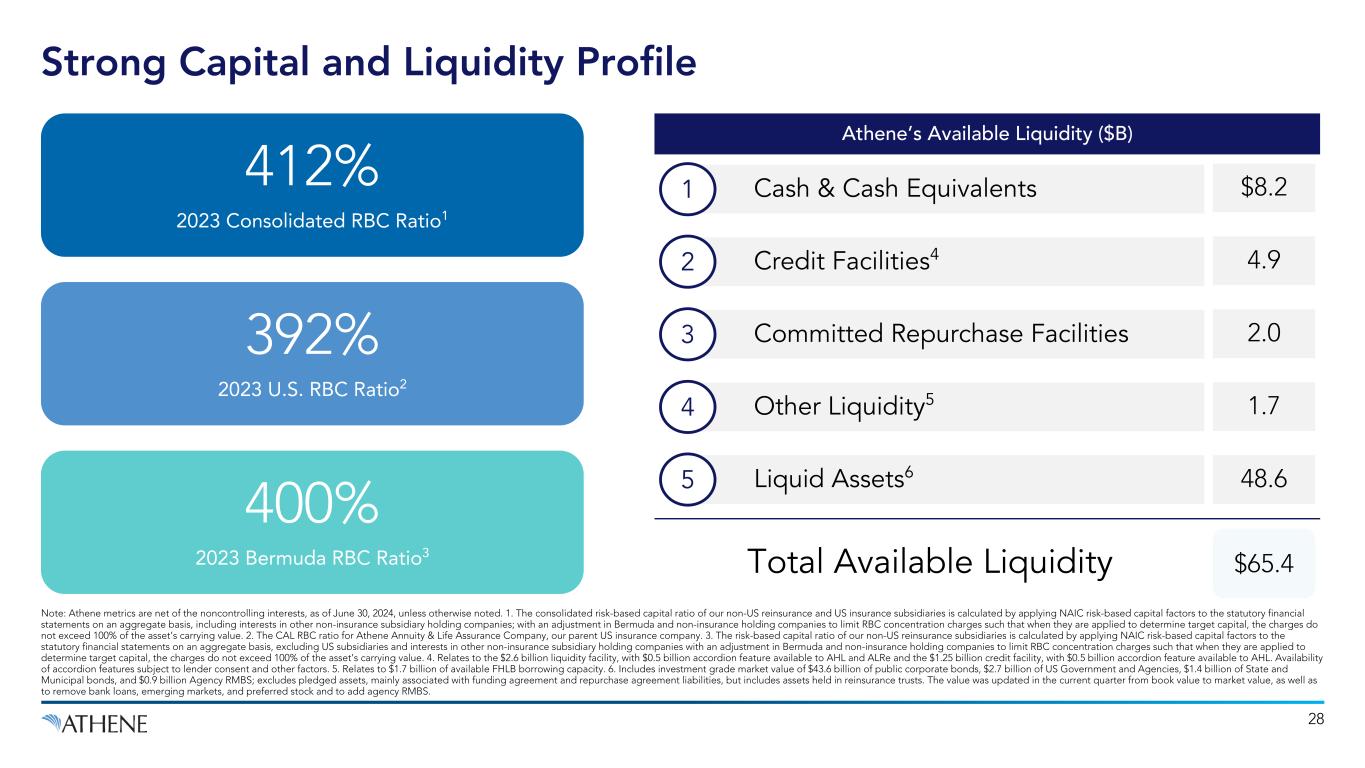
28 Strong Capital and Liquidity Profile Note: Athene metrics are net of the noncontrolling interests, as of June 30, 2024, unless otherwise noted. 1. The consolidated risk-based capital ratio of our non-US reinsurance and US insurance subsidiaries is calculated by applying NAIC risk-based capital factors to the statutory financial statements on an aggregate basis, including interests in other non-insurance subsidiary holding companies; with an adjustment in Bermuda and non-insurance holding companies to limit RBC concentration charges such that when they are applied to determine target capital, the charges do not exceed 100% of the asset’s carrying value. 2. The CAL RBC ratio for Athene Annuity & Life Assurance Company, our parent US insurance company. 3. The risk-based capital ratio of our non-US reinsurance subsidiaries is calculated by applying NAIC risk-based capital factors to the statutory financial statements on an aggregate basis, excluding US subsidiaries and interests in other non-insurance subsidiary holding companies with an adjustment in Bermuda and non-insurance holding companies to limit RBC concentration charges such that when they are applied to determine target capital, the charges do not exceed 100% of the asset’s carrying value. 4. Relates to the $2.6 billion liquidity facility, with $0.5 billion accordion feature available to AHL and ALRe and the $1.25 billion credit facility, with $0.5 billion accordion feature available to AHL. Availability of accordion features subject to lender consent and other factors. 5. Relates to $1.7 billion of available FHLB borrowing capacity. 6. Includes investment grade market value of $43.6 billion of public corporate bonds, $2.7 billion of US Government and Agencies, $1.4 billion of State and Municipal bonds, and $0.9 billion Agency RMBS; excludes pledged assets, mainly associated with funding agreement and repurchase agreement liabilities, but includes assets held in reinsurance trusts. The value was updated in the current quarter from book value to market value, as well as to remove bank loans, emerging markets, and preferred stock and to add agency RMBS. 412% 2023 Consolidated RBC Ratio1 392% 2023 U.S. RBC Ratio2 400% 2023 Bermuda RBC Ratio3 Athene’s Available Liquidity ($B) $65.4 Liquid Assets6 5 48.6 Cash & Cash Equivalents1 $8.2 Committed Repurchase Facilities3 2.0 Credit Facilities42 4.9 Other Liquidity54 1.7 Total Available Liquidity
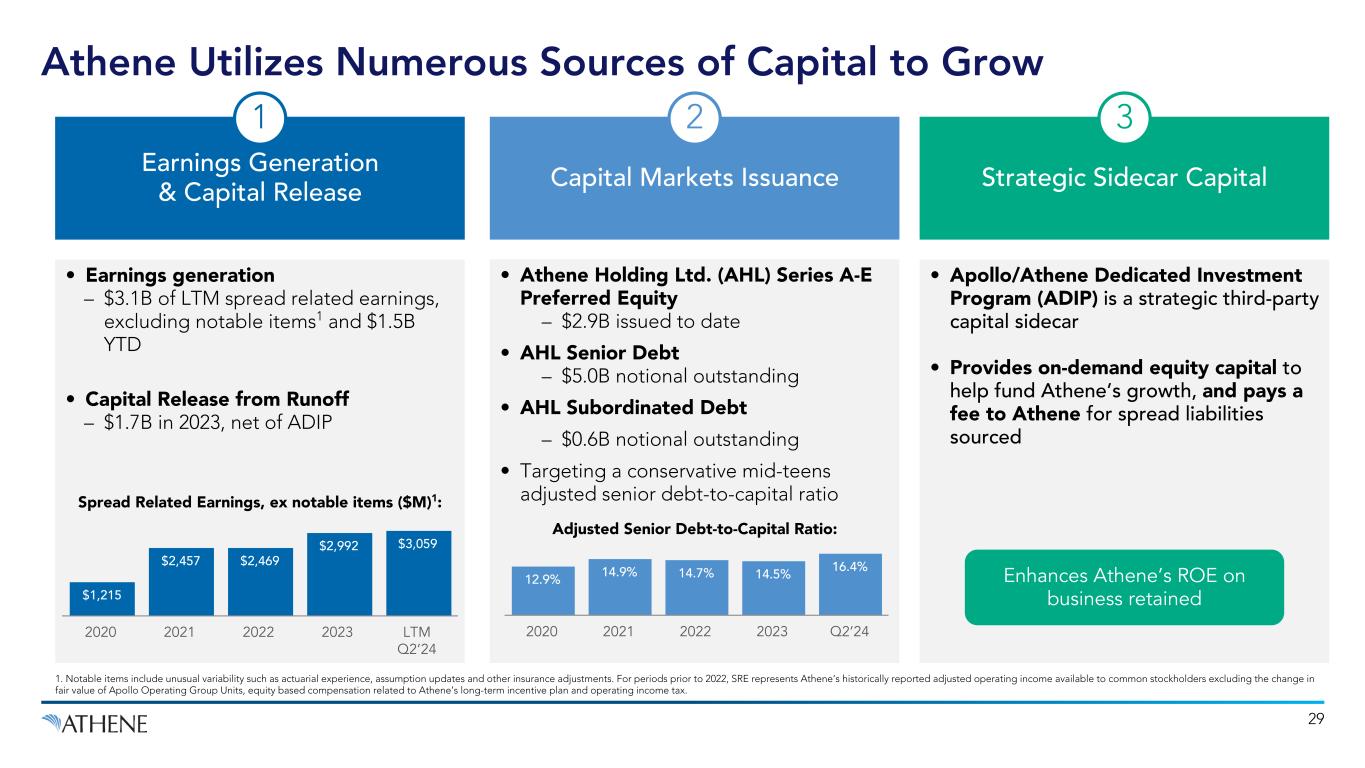
• Athene Holding Ltd. (AHL) Series A-E Preferred Equity – $2.9B issued to date • AHL Senior Debt – $5.0B notional outstanding • AHL Subordinated Debt – $0.6B notional outstanding • Targeting a conservative mid-teens adjusted senior debt-to-capital ratio 12.9% 14.9% 14.7% 14.5% 16.4% 2020 2021 2022 2023 Q2’24 • Earnings generation – $3.1B of LTM spread related earnings, excluding notable items1 and $1.5B YTD • Capital Release from Runoff – $1.7B in 2023, net of ADIP $1,215 $2,457 $2,469 $2,992 $3,059 2020 2021 2022 2023 LTM Q2’24 29 Athene Utilizes Numerous Sources of Capital to Grow Earnings Generation & Capital Release 1 Capital Markets Issuance 2 • Apollo/Athene Dedicated Investment Program (ADIP) is a strategic third-party capital sidecar • Provides on-demand equity capital to help fund Athene’s growth, and pays a fee to Athene for spread liabilities sourced Strategic Sidecar Capital 3 Adjusted Senior Debt-to-Capital Ratio: Spread Related Earnings, ex notable items ($M)1: Enhances Athene’s ROE on business retained 1. Notable items include unusual variability such as actuarial experience, assumption updates and other insurance adjustments. For periods prior to 2022, SRE represents Athene’s historically reported adjusted operating income available to common stockholders excluding the change in fair value of Apollo Operating Group Units, equity based compensation related to Athene’s long-term incentive plan and operating income tax.
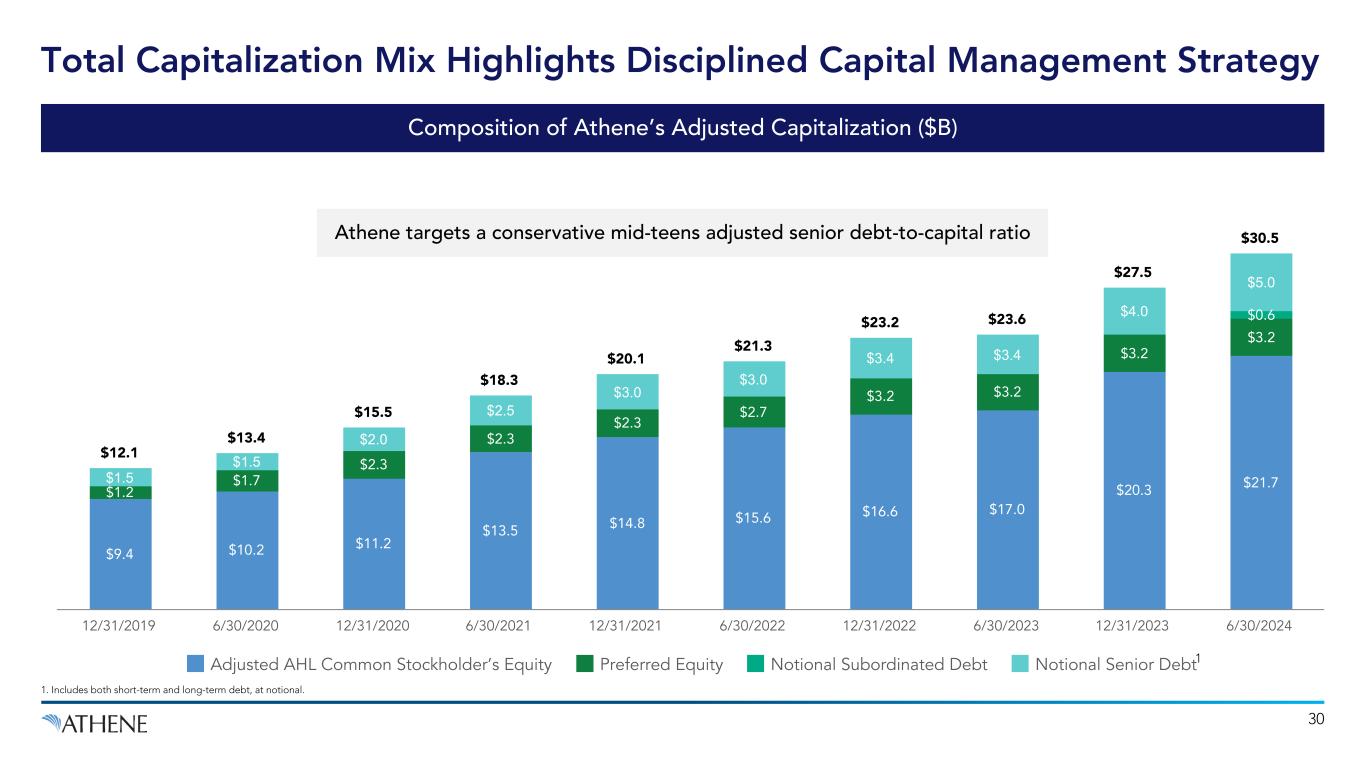
$12.1 $13.4 $15.5 $18.3 $20.1 $21.3 $23.2 $23.6 $27.5 $30.5 $9.4 $10.2 $11.2 $13.5 $14.8 $15.6 $16.6 $17.0 $20.3 $21.7 $1.2 $1.7 $2.3 $2.3 $2.3 $2.7 $3.2 $3.2 $3.2 $3.2 $0.6 $1.5 $1.5 $2.0 $2.5 $3.0 $3.0 $3.4 $3.4 $4.0 $5.0 Adjusted AHL Common Stockholder’s Equity Preferred Equity Notional Subordinated Debt Notional Senior Debt 12/31/2019 6/30/2020 12/31/2020 6/30/2021 12/31/2021 6/30/2022 12/31/2022 6/30/2023 12/31/2023 6/30/2024 30 Total Capitalization Mix Highlights Disciplined Capital Management Strategy 1. Includes both short-term and long-term debt, at notional. Athene targets a conservative mid-teens adjusted senior debt-to-capital ratio 1 Composition of Athene’s Adjusted Capitalization ($B)
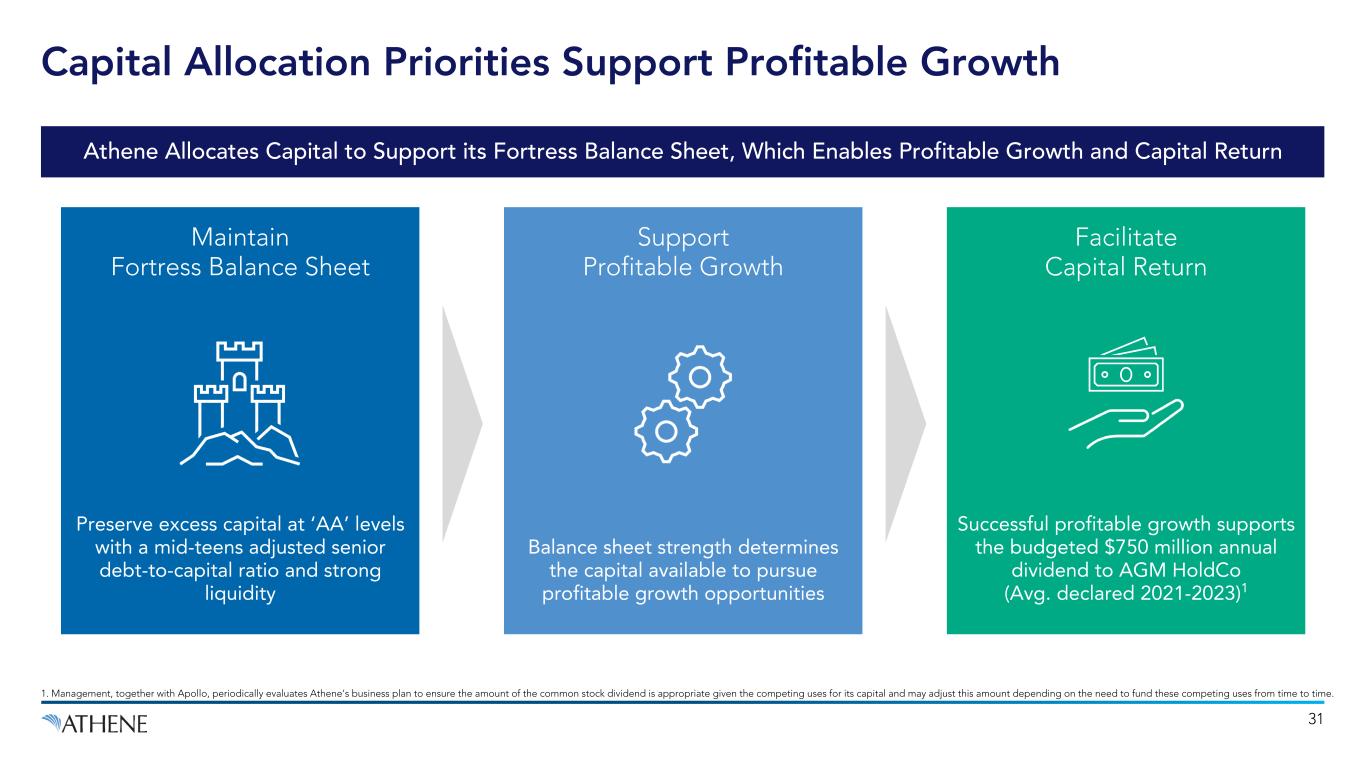
31 Capital Allocation Priorities Support Profitable Growth Balance sheet strength determines the capital available to pursue profitable growth opportunities Support Profitable Growth Preserve excess capital at ‘AA’ levels with a mid-teens adjusted senior debt-to-capital ratio and strong liquidity Maintain Fortress Balance Sheet Athene Allocates Capital to Support its Fortress Balance Sheet, Which Enables Profitable Growth and Capital Return Successful profitable growth supports the budgeted $750 million annual dividend to AGM HoldCo (Avg. declared 2021-2023)1 Facilitate Capital Return 1. Management, together with Apollo, periodically evaluates Athene’s business plan to ensure the amount of the common stock dividend is appropriate given the competing uses for its capital and may adjust this amount depending on the need to fund these competing uses from time to time.
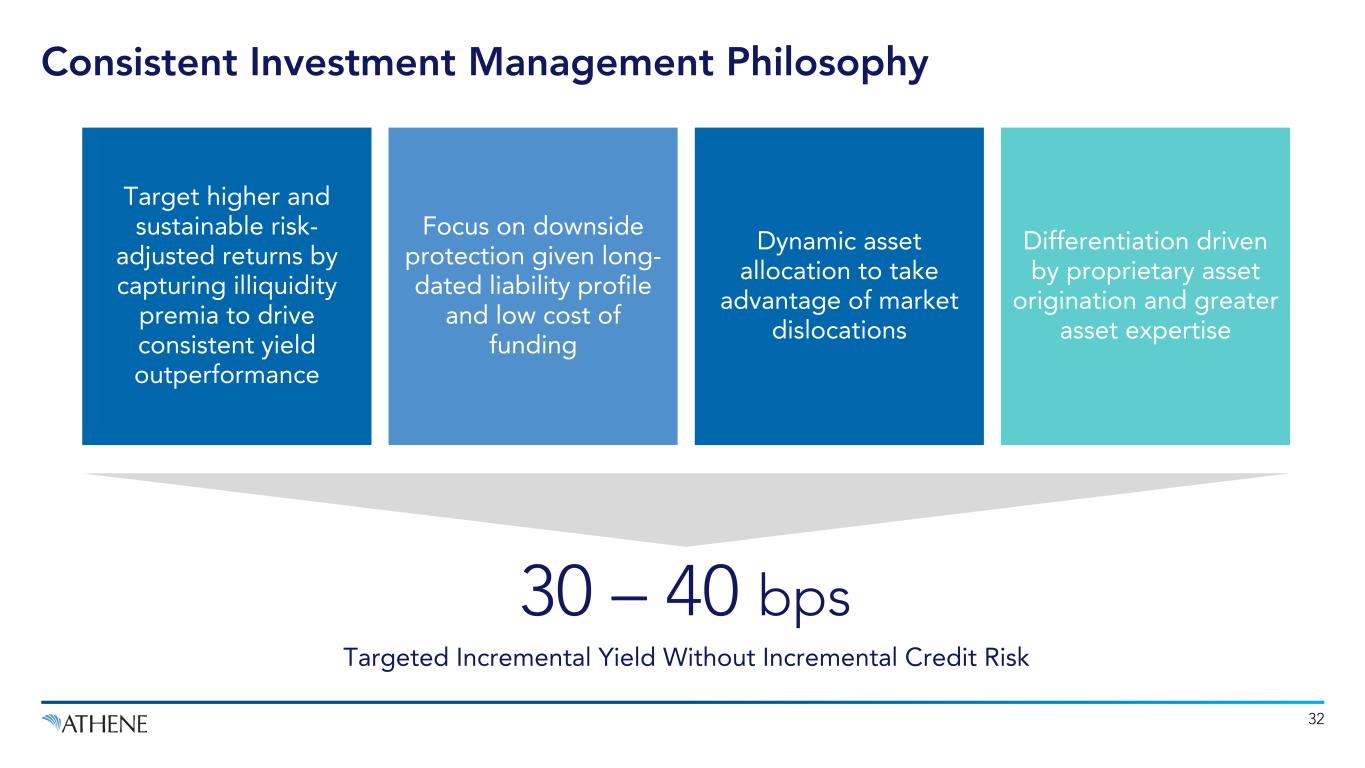
32 Consistent Investment Management Philosophy Target higher and sustainable risk- adjusted returns by capturing illiquidity premia to drive consistent yield outperformance Focus on downside protection given long- dated liability profile and low cost of funding Dynamic asset allocation to take advantage of market dislocations Differentiation driven by proprietary asset origination and greater asset expertise 30 – 40 bps Targeted Incremental Yield Without Incremental Credit Risk
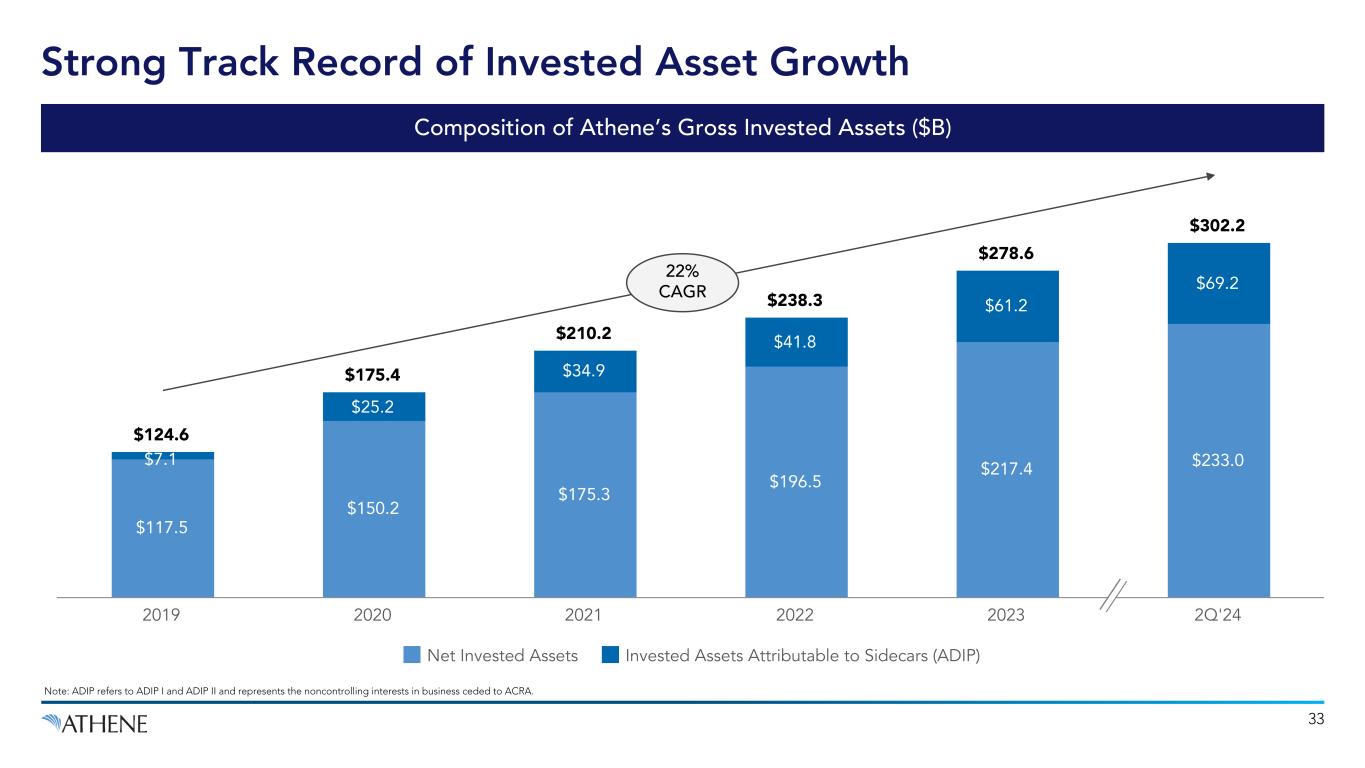
$124.6 $175.4 $210.2 $238.3 $278.6 $302.2 $117.5 $150.2 $175.3 $196.5 $217.4 $233.0 $25.2 $34.9 $41.8 $61.2 $69.2 Net Invested Assets Invested Assets Attributable to Sidecars (ADIP) 2019 2020 2021 2022 2023 2Q'24 33 Strong Track Record of Invested Asset Growth 22% CAGR Composition of Athene’s Gross Invested Assets ($B) Note: ADIP refers to ADIP I and ADIP II and represents the noncontrolling interests in business ceded to ACRA. $7.1
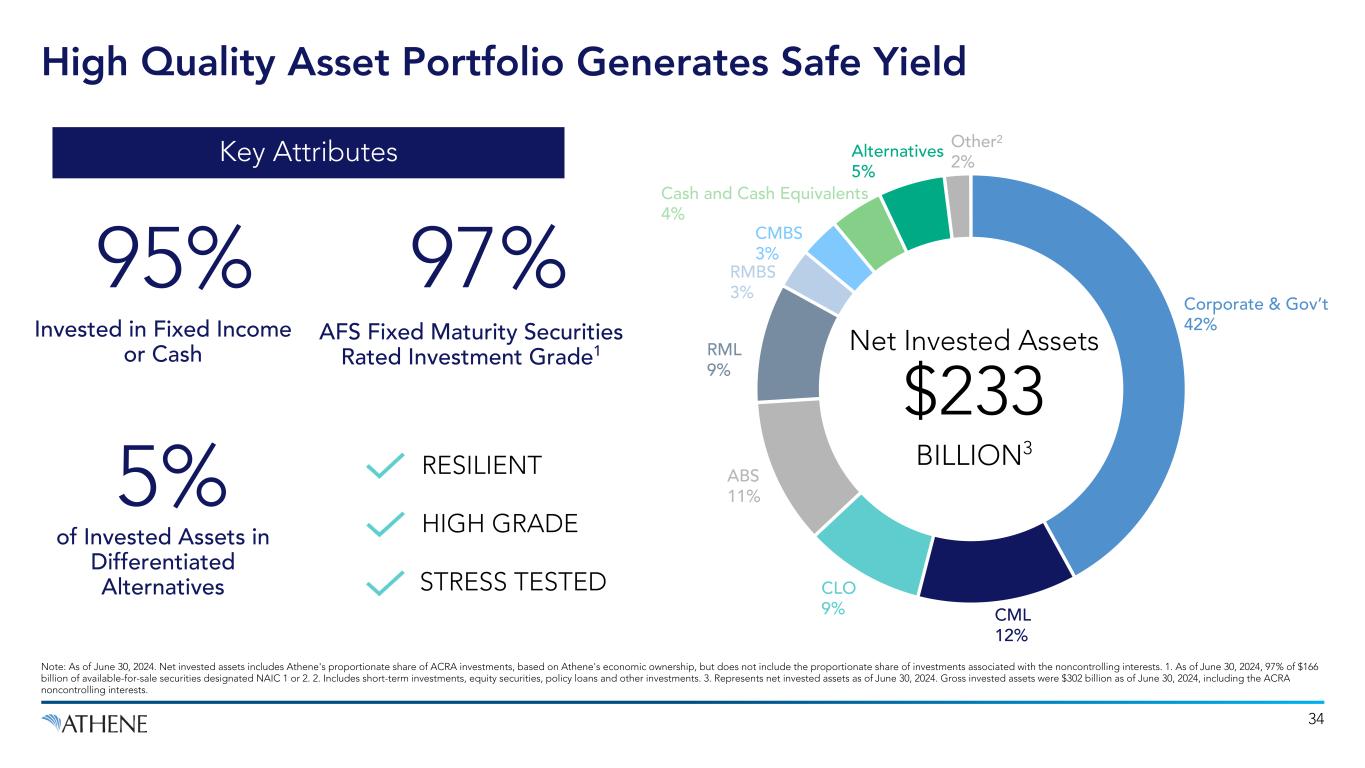
Corporate & Gov’t 42% CML 12% CLO 9% ABS 11% RML 9% RMBS 3% CMBS 3% Cash and Cash Equivalents 4% Alternatives 5% Other 2% Net Invested Assets $233 BILLION3 Note: As of June 30, 2024. Net invested assets includes Athene's proportionate share of ACRA investments, based on Athene's economic ownership, but does not include the proportionate share of investments associated with the noncontrolling interests. 1. As of June 30, 2024, 97% of $166 billion of available-for-sale securities designated NAIC 1 or 2. 2. Includes short-term investments, equity securities, policy loans and other investments. 3. Represents net invested assets as of June 30, 2024. Gross invested assets were $302 billion as of June 30, 2024, including the ACRA noncontrolling interests. High Quality Asset Portfolio Generates Safe Yield AFS Fixed Maturity Securities Rated Investment Grade1 RESILIENT HIGH GRADE STRESS TESTED 97% Invested in Fixed Income or Cash 95% of Invested Assets in Differentiated Alternatives 5% 34 Key Attributes 2
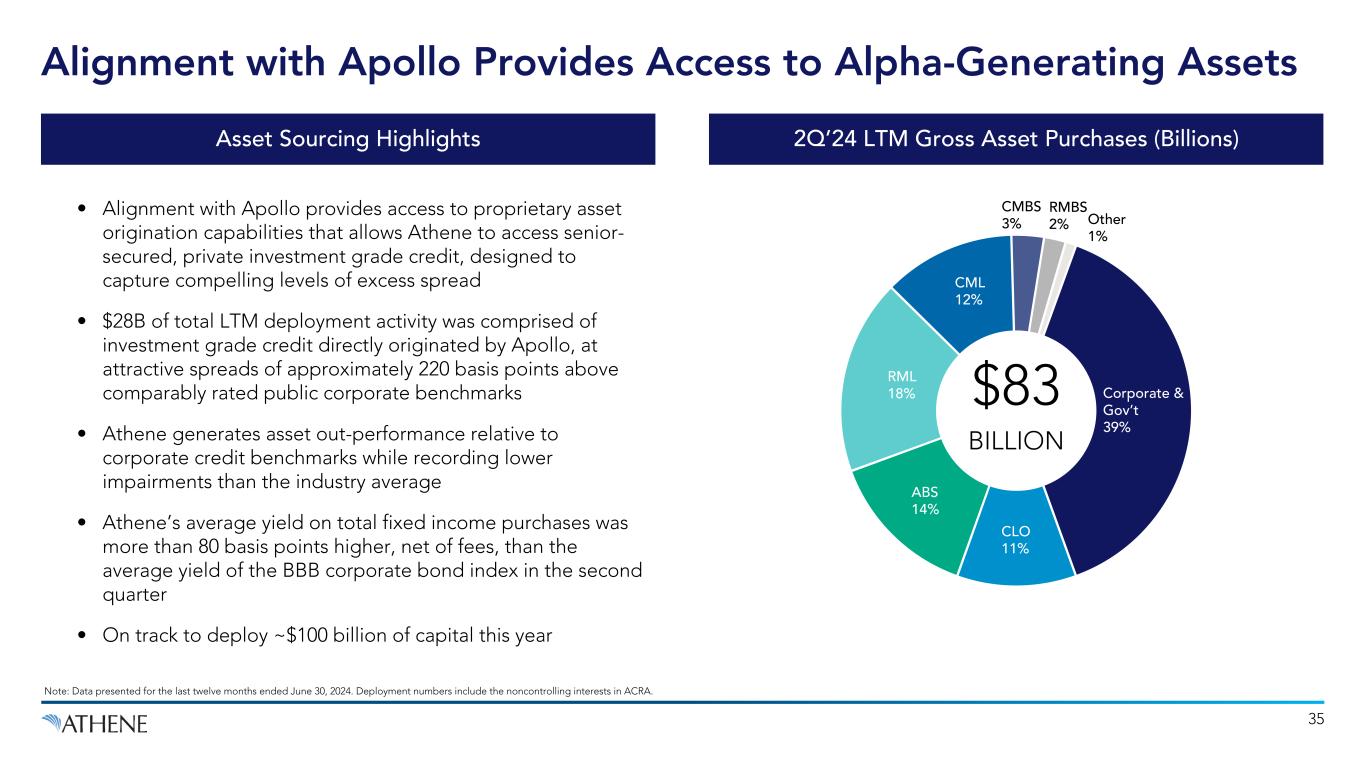
• Alignment with Apollo provides access to proprietary asset origination capabilities that allows Athene to access senior- secured, private investment grade credit, designed to capture compelling levels of excess spread • $28B of total LTM deployment activity was comprised of investment grade credit directly originated by Apollo, at attractive spreads of approximately 220 basis points above comparably rated public corporate benchmarks • Athene generates asset out-performance relative to corporate credit benchmarks while recording lower impairments than the industry average • Athene’s average yield on total fixed income purchases was more than 80 basis points higher, net of fees, than the average yield of the BBB corporate bond index in the second quarter • On track to deploy ~$100 billion of capital this year Corporate & Gov’t 39% CLO 11% ABS 14% RML 18% CML 12% CMBS 3% RMBS 2% Other 1% Alignment with Apollo Provides Access to Alpha-Generating Assets 35 2Q’24 LTM Gross Asset Purchases (Billions)Asset Sourcing Highlights $83 BILLION Note: Data presented for the last twelve months ended June 30, 2024. Deployment numbers include the noncontrolling interests in ACRA.
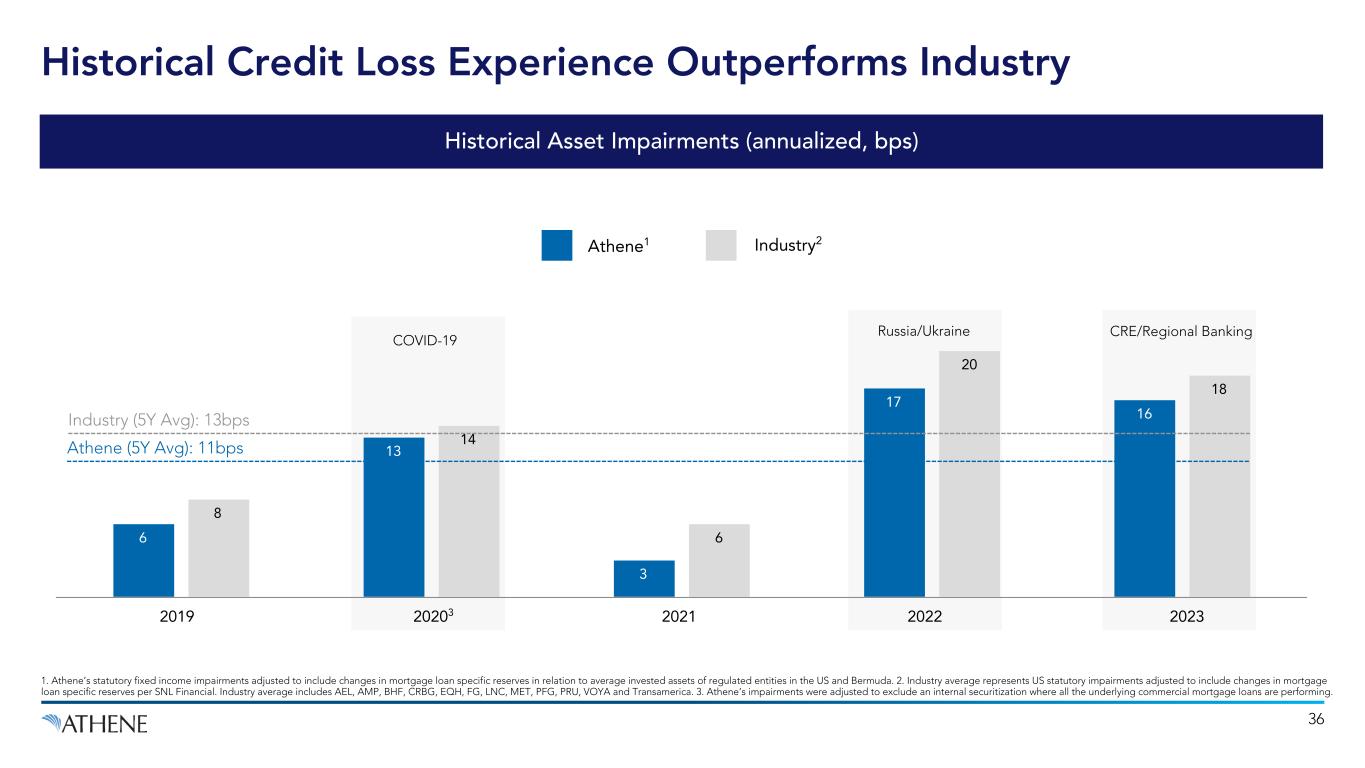
6 13 3 17 16 8 14 6 20 18 COVID-19 Russia/Ukraine CRE/Regional Banking 36 Historical Credit Loss Experience Outperforms Industry Athene1 Industry2 Historical Asset Impairments (annualized, bps) 20203 2021 202320222019 1. Athene’s statutory fixed income impairments adjusted to include changes in mortgage loan specific reserves in relation to average invested assets of regulated entities in the US and Bermuda. 2. Industry average represents US statutory impairments adjusted to include changes in mortgage loan specific reserves per SNL Financial. Industry average includes AEL, AMP, BHF, CRBG, EQH, FG, LNC, MET, PFG, PRU, VOYA and Transamerica. 3. Athene’s impairments were adjusted to exclude an internal securitization where all the underlying commercial mortgage loans are performing. Athene (5Y Avg): 11bps Industry (5Y Avg): 13bps
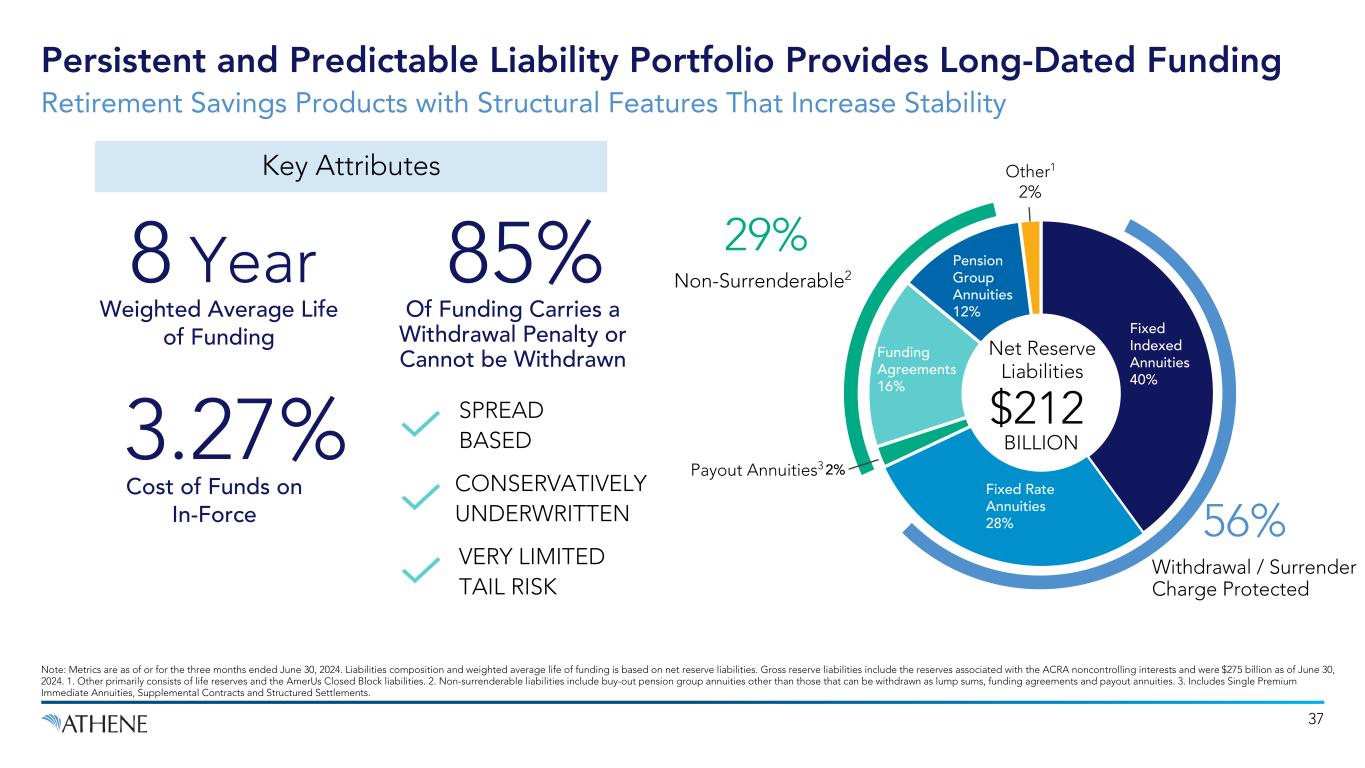
Fixed Indexed Annuities 40% Fixed Rate Annuities 28% 2% Funding Agreements 16% Pension Group Annuities 12% $212 BILLION Persistent and Predictable Liability Portfolio Provides Long-Dated Funding Note: Metrics are as of or for the three months ended June 30, 2024. Liabilities composition and weighted average life of funding is based on net reserve liabilities. Gross reserve liabilities include the reserves associated with the ACRA noncontrolling interests and were $275 billion as of June 30, 2024. 1. Other primarily consists of life reserves and the AmerUs Closed Block liabilities. 2. Non-surrenderable liabilities include buy-out pension group annuities other than those that can be withdrawn as lump sums, funding agreements and payout annuities. 3. Includes Single Premium Immediate Annuities, Supplemental Contracts and Structured Settlements. 29% Non-Surrenderable2 Retirement Savings Products with Structural Features That Increase Stability Of Funding Carries a Withdrawal Penalty or Cannot be Withdrawn 85% SPREAD BASED Weighted Average Life of Funding 8 Year Cost of Funds on In-Force 3.27% VERY LIMITED TAIL RISK 37 56% Withdrawal / Surrender Charge Protected Key Attributes CONSERVATIVELY UNDERWRITTEN Payout Annuities3 Other1 2% Net Reserve Liabilities
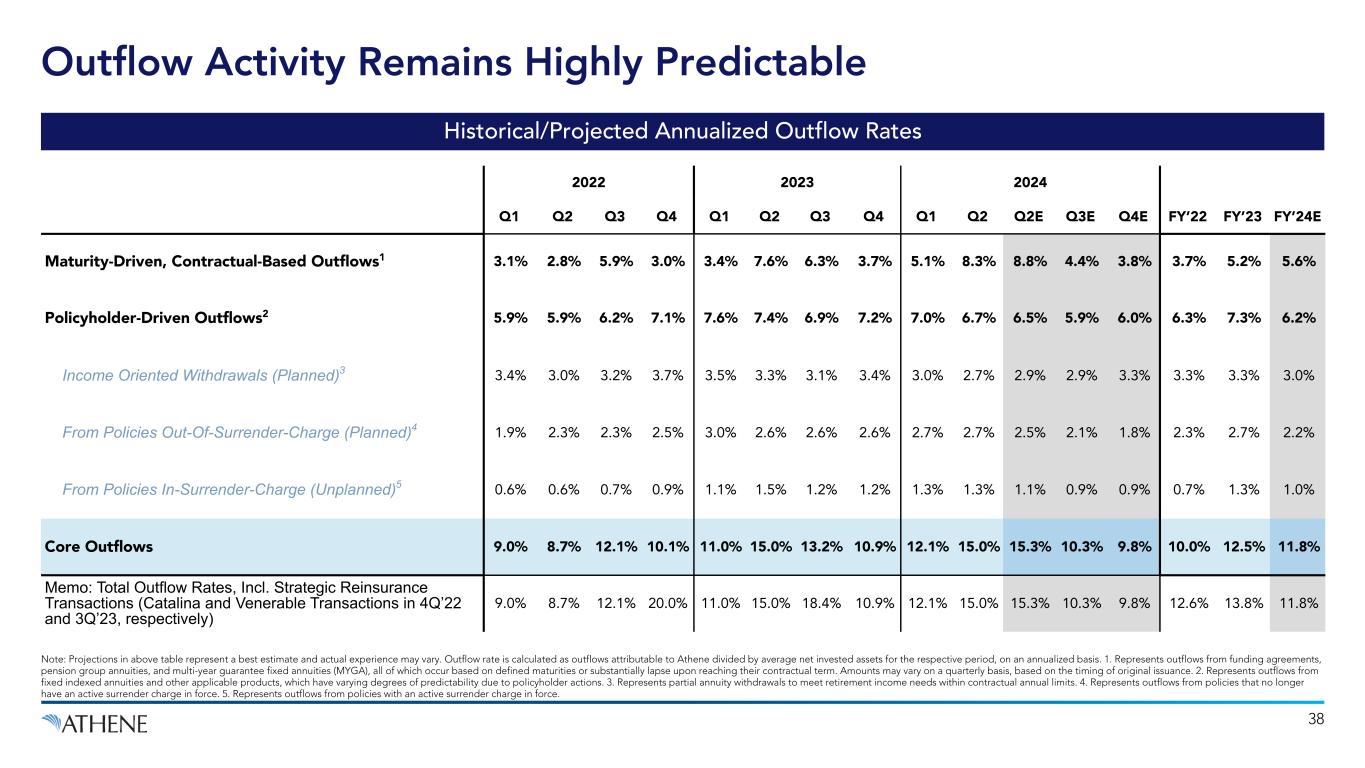
Historical/Projected Annualized Outflow Rates 38 Note: Projections in above table represent a best estimate and actual experience may vary. Outflow rate is calculated as outflows attributable to Athene divided by average net invested assets for the respective period, on an annualized basis. 1. Represents outflows from funding agreements, pension group annuities, and multi-year guarantee fixed annuities (MYGA), all of which occur based on defined maturities or substantially lapse upon reaching their contractual term. Amounts may vary on a quarterly basis, based on the timing of original issuance. 2. Represents outflows from fixed indexed annuities and other applicable products, which have varying degrees of predictability due to policyholder actions. 3. Represents partial annuity withdrawals to meet retirement income needs within contractual annual limits. 4. Represents outflows from policies that no longer have an active surrender charge in force. 5. Represents outflows from policies with an active surrender charge in force. 2022 2023 2024 Q1 Q2 Q3 Q4 Q1 Q2 Q3 Q4 Q1 Q2 Q2E Q3E Q4E FY’22 FY’23 FY’24E Maturity-Driven, Contractual-Based Outflows1 3.1% 2.8% 5.9% 3.0% 3.4% 7.6% 6.3% 3.7% 5.1% 8.3% 8.8% 4.4% 3.8% 3.7% 5.2% 5.6% Policyholder-Driven Outflows2 5.9% 5.9% 6.2% 7.1% 7.6% 7.4% 6.9% 7.2% 7.0% 6.7% 6.5% 5.9% 6.0% 6.3% 7.3% 6.2% Income Oriented Withdrawals (Planned)3 3.4% 3.0% 3.2% 3.7% 3.5% 3.3% 3.1% 3.4% 3.0% 2.7% 2.9% 2.9% 3.3% 3.3% 3.3% 3.0% From Policies Out-Of-Surrender-Charge (Planned)4 1.9% 2.3% 2.3% 2.5% 3.0% 2.6% 2.6% 2.6% 2.7% 2.7% 2.5% 2.1% 1.8% 2.3% 2.7% 2.2% From Policies In-Surrender-Charge (Unplanned)5 0.6% 0.6% 0.7% 0.9% 1.1% 1.5% 1.2% 1.2% 1.3% 1.3% 1.1% 0.9% 0.9% 0.7% 1.3% 1.0% Core Outflows 9.0% 8.7% 12.1% 10.1% 11.0% 15.0% 13.2% 10.9% 12.1% 15.0% 15.3% 10.3% 9.8% 10.0% 12.5% 11.8% Memo: Total Outflow Rates, Incl. Strategic Reinsurance Transactions (Catalina and Venerable Transactions in 4Q’22 and 3Q’23, respectively) 9.0% 8.7% 12.1% 20.0% 11.0% 15.0% 18.4% 10.9% 12.1% 15.0% 15.3% 10.3% 9.8% 12.6% 13.8% 11.8% Outflow Activity Remains Highly Predictable
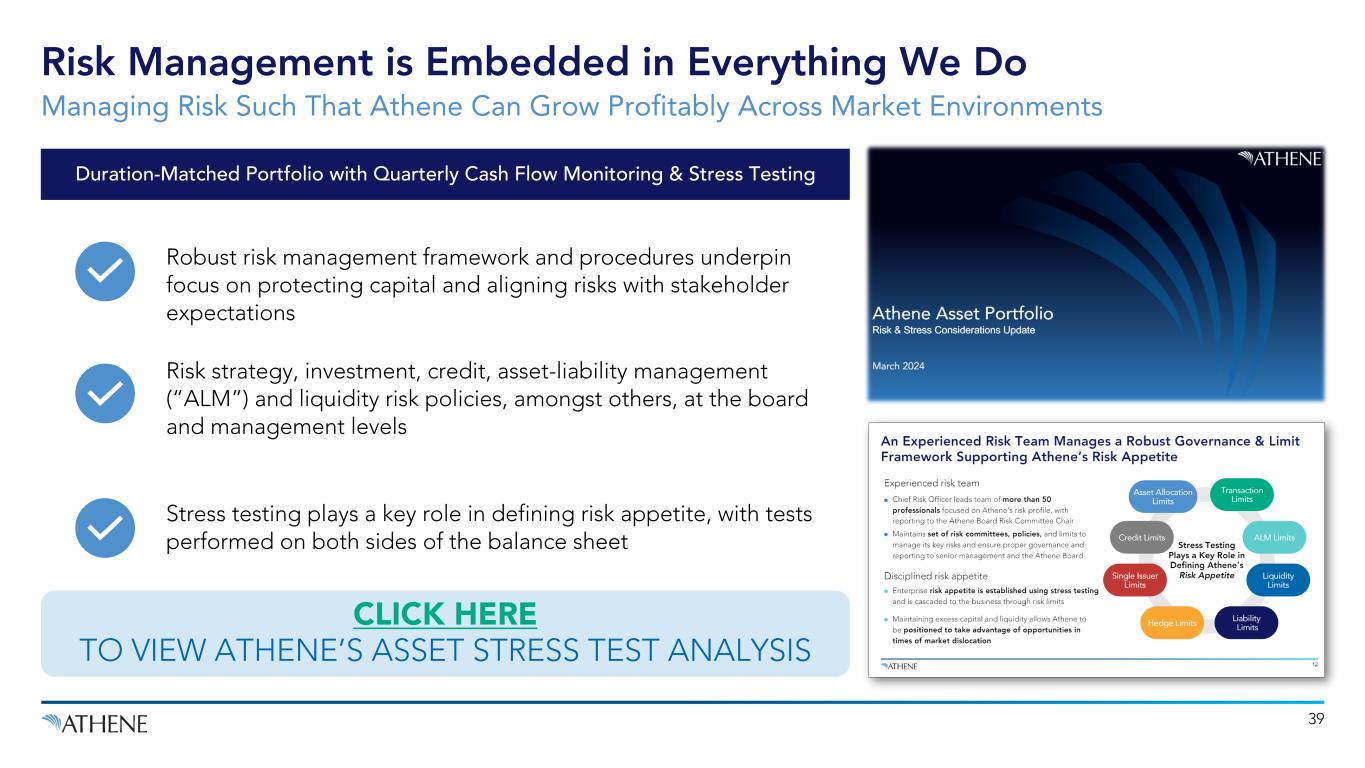
39 Robust risk management framework and procedures underpin focus on protecting capital and aligning risks with stakeholder expectations Risk strategy, investment, credit, asset-liability management (“ALM”) and liquidity risk policies, amongst others, at the board and management levels Stress testing plays a key role in defining risk appetite, with tests performed on both sides of the balance sheet Risk Management is Embedded in Everything We Do Managing Risk Such That Athene Can Grow Profitably Across Market Environments CLICK HERE TO VIEW ATHENE’S ASSET STRESS TEST ANALYSIS Duration-Matched Portfolio with Quarterly Cash Flow Monitoring & Stress Testing
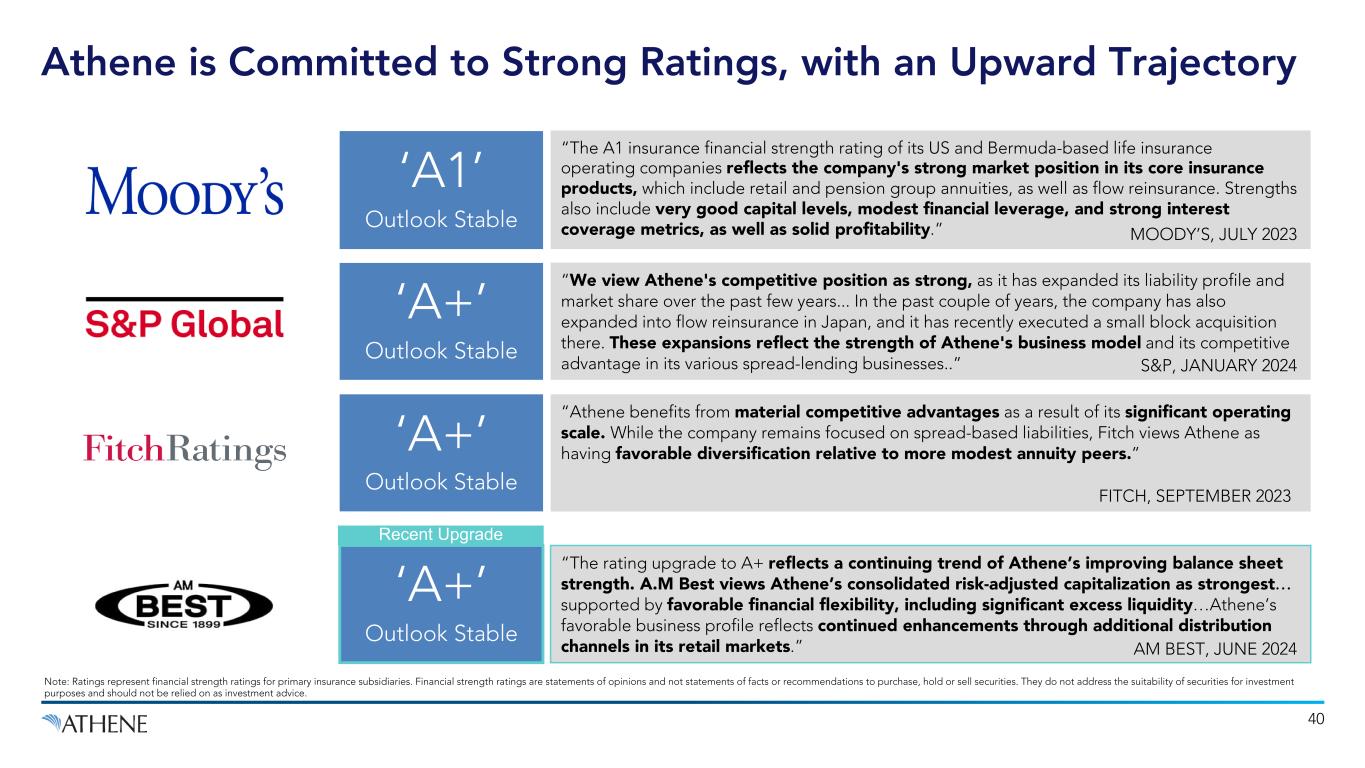
“The rating upgrade to A+ reflects a continuing trend of Athene’s improving balance sheet strength. A.M Best views Athene’s consolidated risk-adjusted capitalization as strongest… supported by favorable financial flexibility, including significant excess liquidity…Athene’s favorable business profile reflects continued enhancements through additional distribution channels in its retail markets.” “The A1 insurance financial strength rating of its US and Bermuda-based life insurance operating companies reflects the company's strong market position in its core insurance products, which include retail and pension group annuities, as well as flow reinsurance. Strengths also include very good capital levels, modest financial leverage, and strong interest coverage metrics, as well as solid profitability.” ‘A1’ Outlook Stable 40 ‘A+’ Outlook Stable “Athene benefits from material competitive advantages as a result of its significant operating scale. While the company remains focused on spread-based liabilities, Fitch views Athene as having favorable diversification relative to more modest annuity peers.” “We view Athene's competitive position as strong, as it has expanded its liability profile and market share over the past few years... In the past couple of years, the company has also expanded into flow reinsurance in Japan, and it has recently executed a small block acquisition there. These expansions reflect the strength of Athene's business model and its competitive advantage in its various spread-lending businesses..” ‘A+’ Outlook Stable ‘A+’ Outlook Stable S&P, JANUARY 2024 FITCH, SEPTEMBER 2023 AM BEST, JUNE 2024 MOODY’S, JULY 2023 Note: Ratings represent financial strength ratings for primary insurance subsidiaries. Financial strength ratings are statements of opinions and not statements of facts or recommendations to purchase, hold or sell securities. They do not address the suitability of securities for investment purposes and should not be relied on as investment advice. Athene is Committed to Strong Ratings, with an Upward Trajectory Recent Upgrade
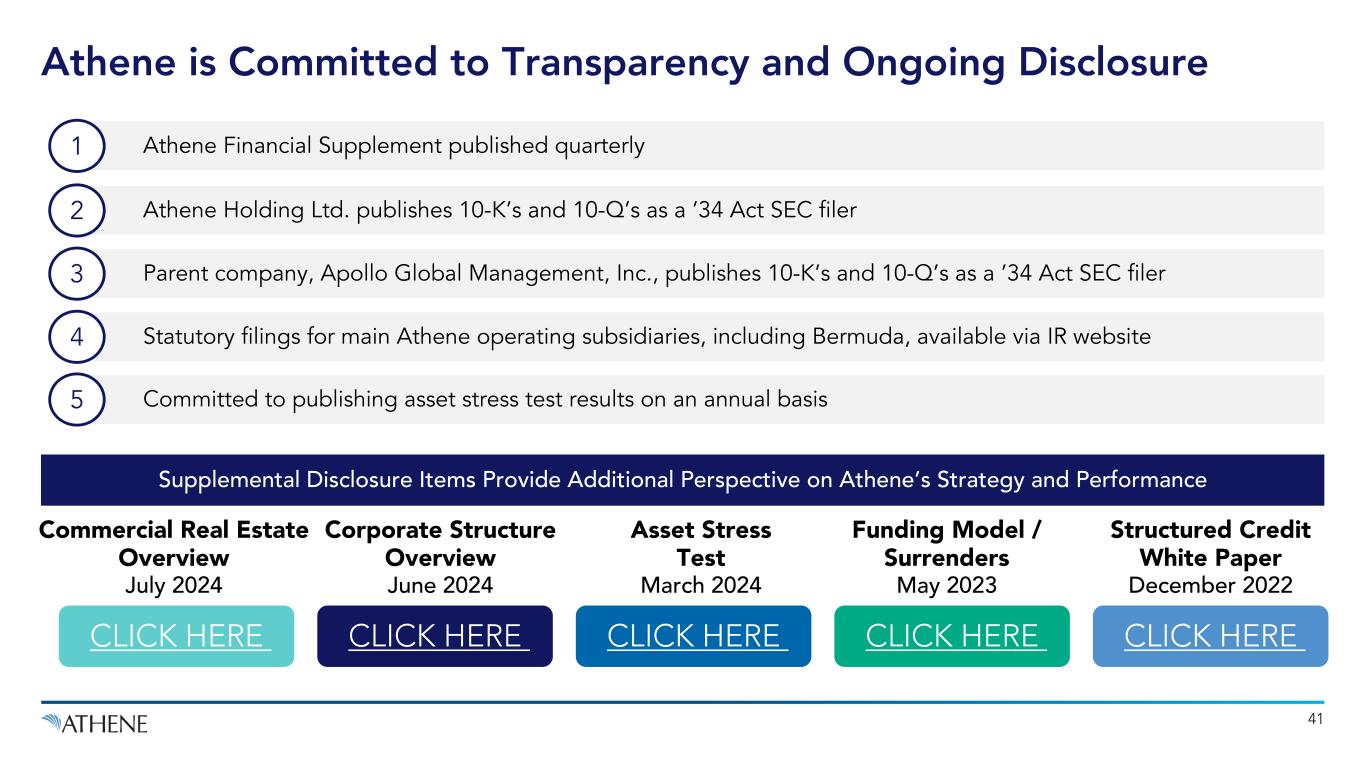
Athene Financial Supplement published quarterly Athene Holding Ltd. publishes 10-K’s and 10-Q’s as a ’34 Act SEC filer Parent company, Apollo Global Management, Inc., publishes 10-K’s and 10-Q’s as a ’34 Act SEC filer Statutory filings for main Athene operating subsidiaries, including Bermuda, available via IR website 41 Athene is Committed to Transparency and Ongoing Disclosure Supplemental Disclosure Items Provide Additional Perspective on Athene’s Strategy and Performance CLICK HERE 1 2 3 4 Asset Stress Test March 2024 Committed to publishing asset stress test results on an annual basis5 CLICK HERE Corporate Structure Overview June 2024 Commercial Real Estate Overview July 2024 CLICK HERE Funding Model / Surrenders May 2023 CLICK HERE CLICK HERE Structured Credit White Paper December 2022

Appendix
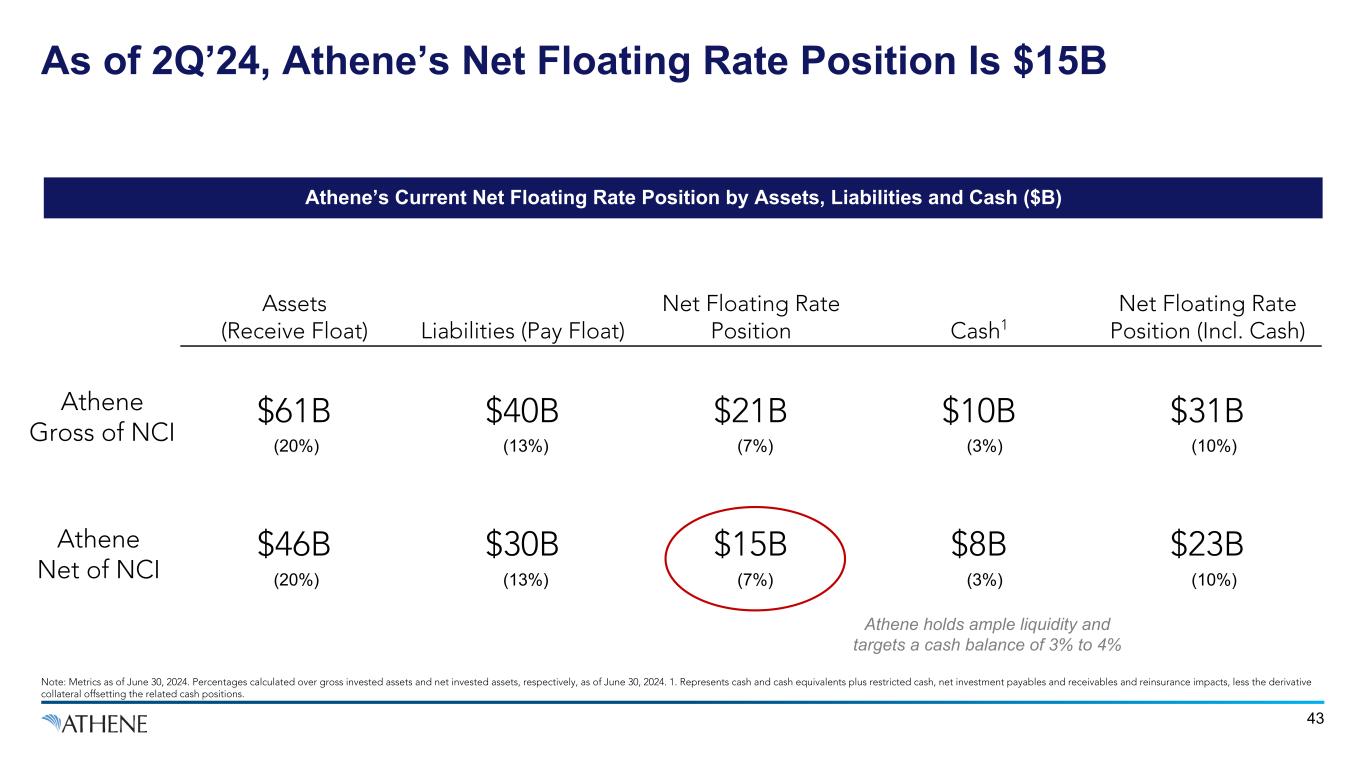
As of 2Q’24, Athene’s Net Floating Rate Position Is $15B 43 Athene’s Current Net Floating Rate Position by Assets, Liabilities and Cash ($B) Note: Metrics as of June 30, 2024. Percentages calculated over gross invested assets and net invested assets, respectively, as of June 30, 2024. 1. Represents cash and cash equivalents plus restricted cash, net investment payables and receivables and reinsurance impacts, less the derivative collateral offsetting the related cash positions. Assets (Receive Float) Liabilities (Pay Float) Net Floating Rate Position Cash1 Net Floating Rate Position (Incl. Cash) $61B $40B $21B $10B $31B $46B $30B $15B $8B $23B (20%) (13%) (7%) (3%) (10%) (20%) (13%) (7%) (3%) (10%) Athene Gross of NCI Athene Net of NCI Athene holds ample liquidity and targets a cash balance of 3% to 4%
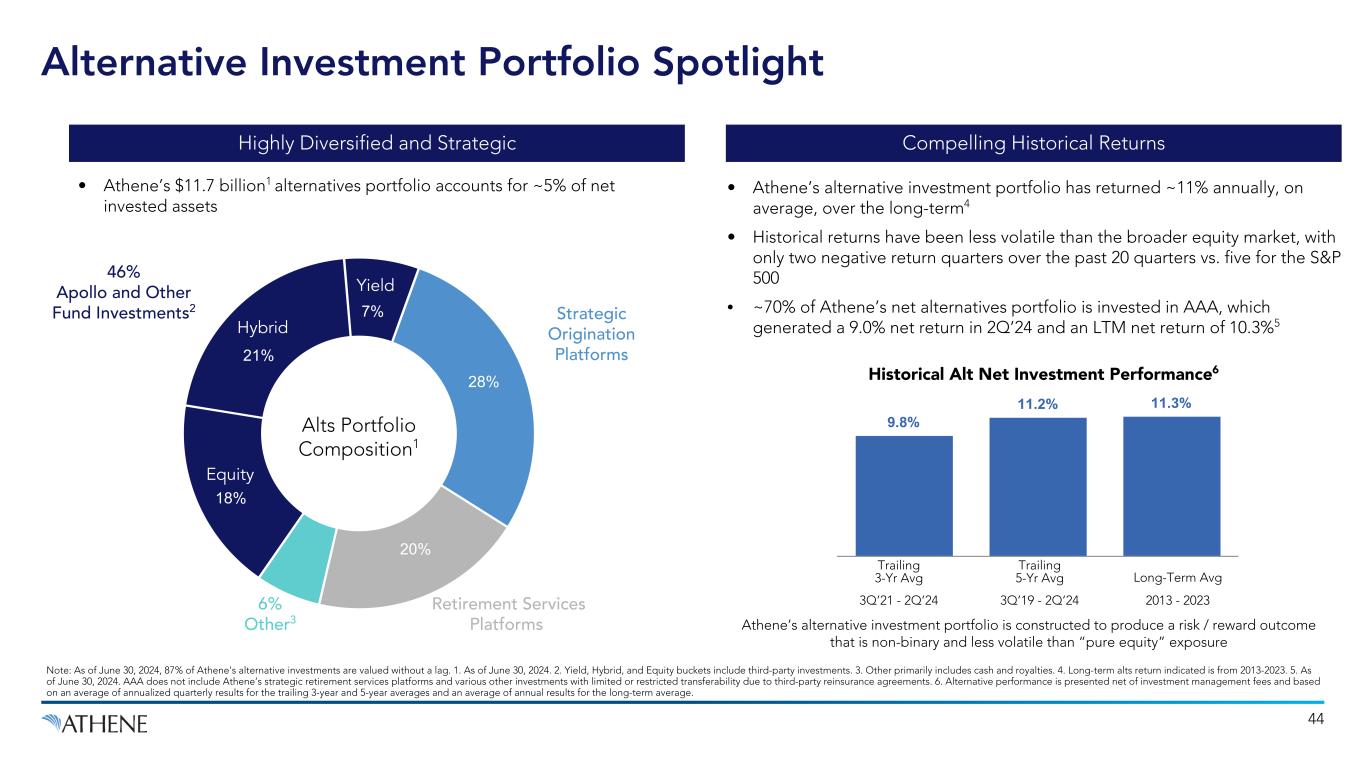
O t h e r Equity Hybrid Yield • Athene’s $11.7 billion1 alternatives portfolio accounts for ~5% of net invested assets 46% Apollo and Other Fund Investments2 Strategic Origination Platforms Retirement Services Platforms Alts Portfolio Composition1 18% 21% 7% Note: As of June 30, 2024, 87% of Athene's alternative investments are valued without a lag. 1. As of June 30, 2024. 2. Yield, Hybrid, and Equity buckets include third-party investments. 3. Other primarily includes cash and royalties. 4. Long-term alts return indicated is from 2013-2023. 5. As of June 30, 2024. AAA does not include Athene’s strategic retirement services platforms and various other investments with limited or restricted transferability due to third-party reinsurance agreements. 6. Alternative performance is presented net of investment management fees and based on an average of annualized quarterly results for the trailing 3-year and 5-year averages and an average of annual results for the long-term average. 28% 20% 6% Other3 • Athene’s alternative investment portfolio has returned ~11% annually, on average, over the long-term4 • Historical returns have been less volatile than the broader equity market, with only two negative return quarters over the past 20 quarters vs. five for the S&P 500 • ~70% of Athene’s net alternatives portfolio is invested in AAA, which generated a 9.0% net return in 2Q’24 and an LTM net return of 10.3%5 9.8% 11.2% 11.3% Historical Alt Net Investment Performance6 Trailing 3-Yr Avg Trailing 5-Yr Avg Long-Term Avg 3Q’21 - 2Q’24 3Q’19 - 2Q’24 2013 - 2023 Athene’s alternative investment portfolio is constructed to produce a risk / reward outcome that is non-binary and less volatile than “pure equity” exposure 44 Alternative Investment Portfolio Spotlight Highly Diversified and Strategic Compelling Historical Returns
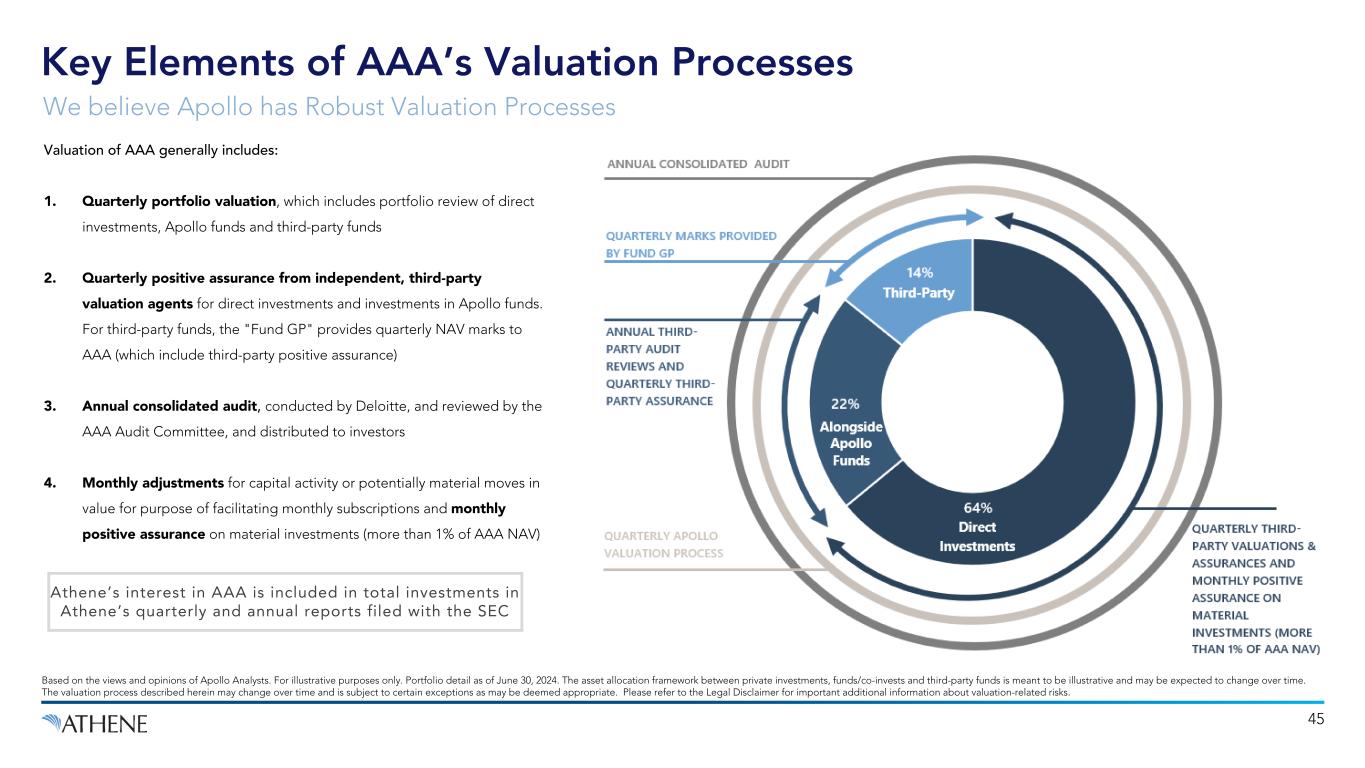
Key Elements of AAA’s Valuation Processes Based on the views and opinions of Apollo Analysts. For illustrative purposes only. Portfolio detail as of June 30, 2024. The asset allocation framework between private investments, funds/co-invests and third-party funds is meant to be illustrative and may be expected to change over time. The valuation process described herein may change over time and is subject to certain exceptions as may be deemed appropriate. Please refer to the Legal Disclaimer for important additional information about valuation-related risks. Valuation of AAA generally includes: 1. Quarterly portfolio valuation, which includes portfolio review of direct investments, Apollo funds and third-party funds 2. Quarterly positive assurance from independent, third-party valuation agents for direct investments and investments in Apollo funds. For third-party funds, the "Fund GP" provides quarterly NAV marks to AAA (which include third-party positive assurance) 3. Annual consolidated audit, conducted by Deloitte, and reviewed by the AAA Audit Committee, and distributed to investors 4. Monthly adjustments for capital activity or potentially material moves in value for purpose of facilitating monthly subscriptions and monthly positive assurance on material investments (more than 1% of AAA NAV) Athene’s interest in AAA is included in total investments in Athene’s quarterly and annual reports filed with the SEC 45 We believe Apollo has Robust Valuation Processes
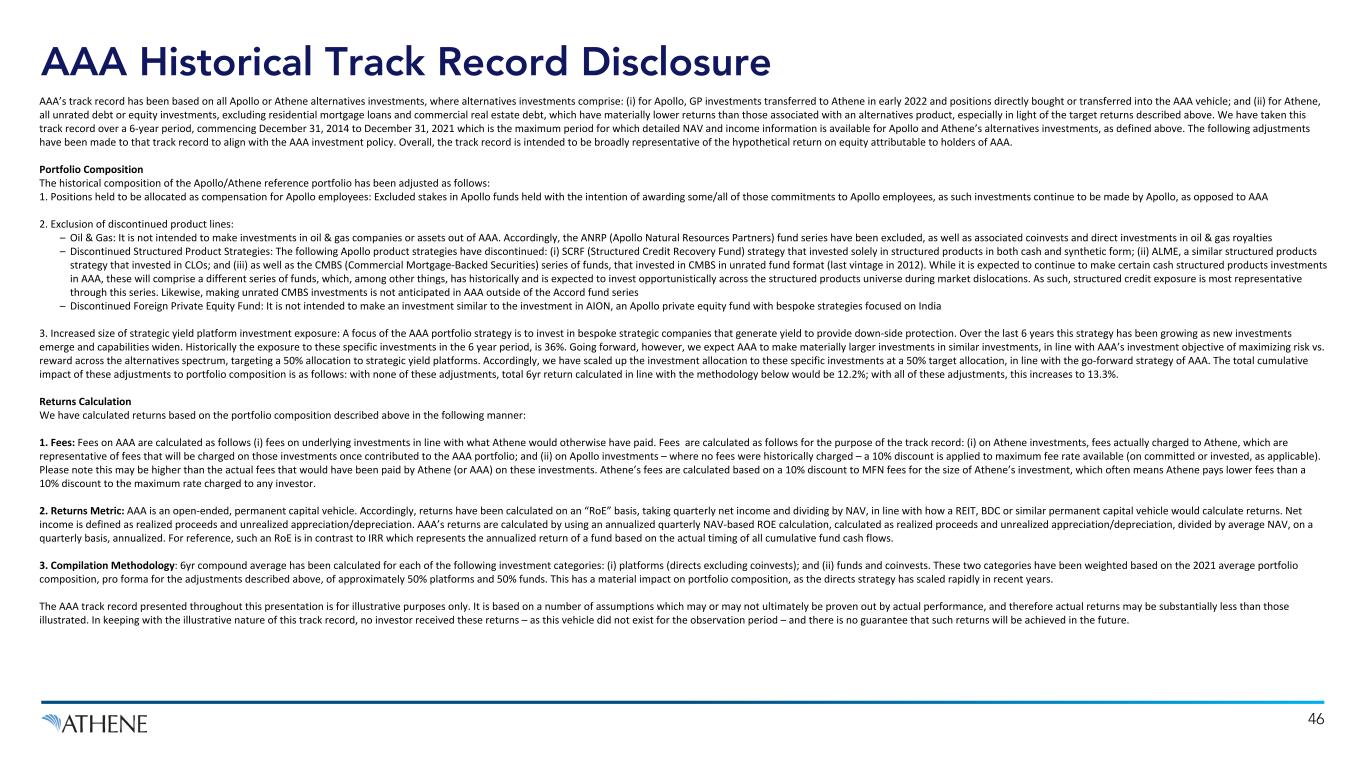
AAA Historical Track Record Disclosure AAA’s track record has been based on all Apollo or Athene alternatives investments, where alternatives investments comprise: (i) for Apollo, GP investments transferred to Athene in early 2022 and positions directly bought or transferred into the AAA vehicle; and (ii) for Athene, all unrated debt or equity investments, excluding residential mortgage loans and commercial real estate debt, which have materially lower returns than those associated with an alternatives product, especially in light of the target returns described above. We have taken this track record over a 6-year period, commencing December 31, 2014 to December 31, 2021 which is the maximum period for which detailed NAV and income information is available for Apollo and Athene’s alternatives investments, as defined above. The following adjustments have been made to that track record to align with the AAA investment policy. Overall, the track record is intended to be broadly representative of the hypothetical return on equity attributable to holders of AAA. Portfolio Composition The historical composition of the Apollo/Athene reference portfolio has been adjusted as follows: 1. Positions held to be allocated as compensation for Apollo employees: Excluded stakes in Apollo funds held with the intention of awarding some/all of those commitments to Apollo employees, as such investments continue to be made by Apollo, as opposed to AAA 2. Exclusion of discontinued product lines: – Oil & Gas: It is not intended to make investments in oil & gas companies or assets out of AAA. Accordingly, the ANRP (Apollo Natural Resources Partners) fund series have been excluded, as well as associated coinvests and direct investments in oil & gas royalties – Discontinued Structured Product Strategies: The following Apollo product strategies have discontinued: (i) SCRF (Structured Credit Recovery Fund) strategy that invested solely in structured products in both cash and synthetic form; (ii) ALME, a similar structured products strategy that invested in CLOs; and (iii) as well as the CMBS (Commercial Mortgage-Backed Securities) series of funds, that invested in CMBS in unrated fund format (last vintage in 2012). While it is expected to continue to make certain cash structured products investments in AAA, these will comprise a different series of funds, which, among other things, has historically and is expected to invest opportunistically across the structured products universe during market dislocations. As such, structured credit exposure is most representative through this series. Likewise, making unrated CMBS investments is not anticipated in AAA outside of the Accord fund series – Discontinued Foreign Private Equity Fund: It is not intended to make an investment similar to the investment in AION, an Apollo private equity fund with bespoke strategies focused on India 3. Increased size of strategic yield platform investment exposure: A focus of the AAA portfolio strategy is to invest in bespoke strategic companies that generate yield to provide down-side protection. Over the last 6 years this strategy has been growing as new investments emerge and capabilities widen. Historically the exposure to these specific investments in the 6 year period, is 36%. Going forward, however, we expect AAA to make materially larger investments in similar investments, in line with AAA’s investment objective of maximizing risk vs. reward across the alternatives spectrum, targeting a 50% allocation to strategic yield platforms. Accordingly, we have scaled up the investment allocation to these specific investments at a 50% target allocation, in line with the go-forward strategy of AAA. The total cumulative impact of these adjustments to portfolio composition is as follows: with none of these adjustments, total 6yr return calculated in line with the methodology below would be 12.2%; with all of these adjustments, this increases to 13.3%. Returns Calculation We have calculated returns based on the portfolio composition described above in the following manner: 1. Fees: Fees on AAA are calculated as follows (i) fees on underlying investments in line with what Athene would otherwise have paid. Fees are calculated as follows for the purpose of the track record: (i) on Athene investments, fees actually charged to Athene, which are representative of fees that will be charged on those investments once contributed to the AAA portfolio; and (ii) on Apollo investments – where no fees were historically charged – a 10% discount is applied to maximum fee rate available (on committed or invested, as applicable). Please note this may be higher than the actual fees that would have been paid by Athene (or AAA) on these investments. Athene’s fees are calculated based on a 10% discount to MFN fees for the size of Athene’s investment, which often means Athene pays lower fees than a 10% discount to the maximum rate charged to any investor. 2. Returns Metric: AAA is an open-ended, permanent capital vehicle. Accordingly, returns have been calculated on an “RoE” basis, taking quarterly net income and dividing by NAV, in line with how a REIT, BDC or similar permanent capital vehicle would calculate returns. Net income is defined as realized proceeds and unrealized appreciation/depreciation. AAA’s returns are calculated by using an annualized quarterly NAV-based ROE calculation, calculated as realized proceeds and unrealized appreciation/depreciation, divided by average NAV, on a quarterly basis, annualized. For reference, such an RoE is in contrast to IRR which represents the annualized return of a fund based on the actual timing of all cumulative fund cash flows. 3. Compilation Methodology: 6yr compound average has been calculated for each of the following investment categories: (i) platforms (directs excluding coinvests); and (ii) funds and coinvests. These two categories have been weighted based on the 2021 average portfolio composition, pro forma for the adjustments described above, of approximately 50% platforms and 50% funds. This has a material impact on portfolio composition, as the directs strategy has scaled rapidly in recent years. The AAA track record presented throughout this presentation is for illustrative purposes only. It is based on a number of assumptions which may or may not ultimately be proven out by actual performance, and therefore actual returns may be substantially less than those illustrated. In keeping with the illustrative nature of this track record, no investor received these returns – as this vehicle did not exist for the observation period – and there is no guarantee that such returns will be achieved in the future. 46
The valuation methodologies employed by Apollo, particularly with regard to securities of private companies and securities that are subject to lock-ups or other limitations on free marketability, vary from security to security and change from time to time, without notice, for a variety of reasons, including the following: (i) valuation rules under generally accepted accounting principles are in constant evolution; (ii) different methodologies may be more appropriate (in Apollo view) at different stages of a particular portfolio company’s lifecycle (depending, for example, upon whether the portfolio company is generating revenue, is generating profit, has become a candidate for acquisition or public offering, or has readily determinable comparables in the marketplace); (iii) preferences or subordinations applicable to particular portfolio securities; (iv) special circumstances affecting a particular portfolio company (such as actual or threatened litigation, loss of key customers, vendors or personnel, or lack of sufficient operating capital); and (v) Apollo’s own judgment regarding macro issues such as developments in markets and technologies and micro issues such as the quality of a particular portfolio company’s management or technology personnel. We make and rely on certain assumptions and estimates regarding many matters related to our businesses, including valuations, interest rates, investment returns, expenses and operating costs, tax assets and liabilities, tax rates, business mix, surrender activity, mortality and contingent liabilities. We also use these assumptions and estimates to make decisions crucial to our business operations. We also use assumptions and estimates to make decisions about pricing, target returns and expense structures for our insurance subsidiaries’ products and pension group annuity transactions; determining the amount of reserves our retirement services business is required to hold for its policy liabilities; determining the price our retirement services business will pay to acquire or reinsure business; determining the hedging strategies we employ to manage risks to our business and operations; and determining the amount of regulatory and rating agency capital that our insurance subsidiaries must hold to support their businesses. Similarly, our management teams make assumptions and estimates in planning and measuring the performance of our asset management business. In addition, certain investments and other assets and liabilities of our asset management business and our retirement services business must be, or at our election are, measured at fair value the determination of which involves the use of various assumptions and estimates and considerable judgment. The factors influencing these various assumptions and estimates cannot be calculated or predicted with certainty, and if our assumptions and estimates differ significantly from actual outcomes and results, our business, financial condition, results of operations, liquidity and cash flows may be materially and adversely affected. Please refer to the Form 10-K filed by Apollo Global Management, Inc. for additional risk factors. ADIP I and ADIP II are currently closed to investors and no longer accepting commitments. Target IRR is presented solely for the purpose of providing insight into the Fund’s investment objectives, detailing the Fund's anticipated risk and reward characteristics in order to facilitate comparisons with other investments and for establishing a benchmark for future evaluation of the Fund's performance. The target IRR presented is not a prediction, projection or guarantee of future performance. The targeted IRR is based upon estimates and assumptions that a potential investment will yield a return equal or greater than the target. There can be no assurance that Apollo's targets will be realized or that Apollo will be successful in finding investment opportunities that meet these anticipated return parameters. Apollo’s target of potential return from a potential investment is not a guarantee as to the quality of the investment or a representation as to the adequacy of Apollo's methodology for estimating returns. Hypothetical or simulated performance results have certain inherent limitations. Unlike an actual performance record, simulated results do not represent actual investment results. Also, since the performance presented does not represent an actual investment portfolio, the results may have under- or over-compensated for the impact, if any, of certain market factors, such as lack of liquidity or market disruptions. Hypothetical or simulated performance results set forth herein are based on a number of assumptions (not all of which are described herein) which may or may not be accurate, and therefore actual returns may be substantially less than those illustrated. No representation is being made by the inclusion of any hypothetical or simulated illustration presented herein that the returns for any Apollo Fund will achieve similar results. Disclaimer 47
Non-GAAP Definitions In addition to our results presented in accordance with accounting principles generally accepted in the United States of America (US GAAP), we present certain financial information that includes non-GAAP measures. Management believes the use of these non-GAAP measures, together with the relevant US GAAP measures, provides information that may enhance an investor’s understanding of our results of operations and the underlying profitability drivers of our business. The majority of these non-GAAP measures are intended to remove from the results of operations the impact of market volatility (other than with respect to alternative investments), which consists of investment gains (losses), net of offsets and non-operating change in insurance liabilities and related derivatives, as well as integration, restructuring, stock compensation and certain other expenses which are not part of our underlying profitability drivers, as such items fluctuate from period to period in a manner inconsistent with these drivers. These measures should be considered supplementary to our results in accordance with US GAAP and should not be viewed as a substitute for the corresponding US GAAP measures. Spread Related Earnings (SRE) Spread related earnings is a pre-tax non-GAAP measure used to evaluate our financial performance including the impact of any reinsurance transactions and excluding market volatility and expenses related to integration, restructuring, stock compensation and other expenses. Our spread related earnings equals net income available to AHL common stockholder adjusted to eliminate the impact of the following: (a) investment gains (losses), net of offsets; (b) non- operating change in insurance liabilities and related derivatives; (c) integration, restructuring, and other non-operating expenses; (d) stock compensation expense; and (e) income tax (expense) benefit. We consider these adjustments to be meaningful adjustments to net income (loss) available to AHL common stockholder. Accordingly, we believe using a measure which excludes the impact of these items is useful in analyzing our business performance and the trends in our results of operations. Together with net income (loss) available to AHL common stockholder, we believe spread related earnings provides a meaningful financial metric that helps investors understand our underlying results and profitability. Spread related earnings should not be used as a substitute for net income (loss) available to AHL common stockholder. SRE, Excluding Notable Items Spread related earnings, excluding notable items represents SRE with an adjustment to exclude notable items. Notable items include unusual variability such as actuarial experience, assumption updates and other insurance adjustments. We use this measure to assess the long-term performance of the business against projected earnings, by excluding items that are expected to be infrequent or not indicative of the ongoing operations of the business. We view this non- GAAP measure as an additional measure that provides insight to management and investors on the historical, period-to-period comparability of our key non-GAAP operating measures. Cost of Funds Cost of funds includes liability costs related to cost of crediting on both deferred annuities and institutional products as well as other liability costs, but does not include the proportionate share of the ACRA cost of funds associated with the noncontrolling interests. Cost of crediting on deferred annuities is the interest credited to the policyholders on our fixed strategies as well as the option costs on the indexed annuity strategies. With respect to FIAs, the cost of providing index credits includes the expenses incurred to fund the annual index credits, and where applicable, minimum guaranteed interest credited. Cost of crediting on institutional products is comprised of (1) pension group annuity costs, including interest credited, benefit payments and other reserve changes, net of premiums received when issued, and (2) funding agreement costs, including the interest payments and other reserve changes. Additionally, cost of crediting includes forward points gains and losses on foreign exchange derivative hedges. Other liability costs include DAC, DSI and VOBA amortization, certain market risk benefit costs, the cost of liabilities on products other than deferred annuities and institutional products, premiums and certain product charges and other revenues. We include the costs related to business added through assumed reinsurance transactions and exclude the costs on business related to ceded reinsurance transactions. Cost of funds is computed as the total liability costs divided by the average net invested assets for the relevant period. To enhance the ability to analyze these measures across periods, interim periods are annualized. We believe a measure like cost of funds is useful in analyzing the trends of our core business operations, profitability and pricing discipline. While we believe cost of funds is a meaningful financial metric and enhances our understanding of the underlying profitability drivers of our business, it should not be used as a substitute for total benefits and expenses presented under US GAAP. Non-GAAP Measures & Definitions 48
Non-GAAP Measures & Definitions 49 Other Operating Expenses Other operating expenses excludes integration, restructuring and other non-operating expenses, stock compensation and long-term incentive plan expenses, interest expense, policy acquisition expenses, net of deferrals, and the proportionate share of the ACRA operating expenses associated with the noncontrolling interests. We believe a measure like other operating expenses is useful in analyzing the trends of our core business operations and profitability. While we believe other operating expenses is a meaningful financial metric and enhances our understanding of the underlying profitability drivers of our business, it should not be used as a substitute for policy and other operating expenses presented under US GAAP. Adjusted Senior Debt-to-Capital Ratio Adjusted senior debt-to-capital ratio is a non-GAAP measure used to evaluate our capital structure excluding the impacts of AOCI and the cumulative changes in fair value of funds withheld and modco reinsurance assets as well as mortgage loan assets, net of tax. Adjusted senior debt-to-capital ratio is calculated as senior debt at notional value divided by adjusted capitalization. Adjusted capitalization includes our adjusted AHL common stockholder’s equity, preferred stock and the notional value of our total debt. Adjusted AHL common stockholder’s equity is calculated as the ending AHL stockholders’ equity excluding AOCI, the cumulative changes in fair value of funds withheld and modco reinsurance assets and mortgage loan assets as well as preferred stock. These adjustments fluctuate period to period in a manner inconsistent with our underlying profitability drivers as the majority of such fluctuation is related to the market volatility of the unrealized gains and losses associated with our AFS securities, reinsurance assets and mortgage loans. Except with respect to reinvestment activity relating to acquired blocks of businesses, we typically buy and hold investments to maturity throughout the duration of market fluctuations, therefore, the period-over-period impacts in unrealized gains and losses are not necessarily indicative of current operating fundamentals or future performance. Adjusted senior debt-to-capital ratio should not be used as a substitute for the debt-to-capital ratio. However, we believe the adjustments to stockholders’ equity and debt are significant to gaining an understanding of our capitalization, debt utilization and debt capacity. Net Invested Assets In managing our business, we analyze net invested assets, which does not correspond to total investments, including investments in related parties, as disclosed in our condensed consolidated financial statements and notes thereto. Net invested assets represent the investments that directly back our net reserve liabilities as well as surplus assets. Net invested assets is used in the computation of net investment earned rate, which allows us to analyze the profitability of our investment portfolio. Net invested assets include (a) total investments on the condensed consolidated balance sheets, with AFS securities, trading securities and mortgage loans at cost or amortized cost, excluding derivatives, (b) cash and cash equivalents and restricted cash, (c) investments in related parties, (d) accrued investment income, (e) VIE assets, liabilities and noncontrolling interest adjustments, (f) net investment payables and receivables, (g) policy loans ceded (which offset the direct policy loans in total investments) and (h) an adjustment for the allowance for credit losses. Net invested assets exclude the derivative collateral offsetting the related cash positions. We include the underlying investments supporting our assumed funds withheld and modco agreements and exclude the underlying investments related to ceded reinsurance transactions in our net invested assets calculation in order to match the assets with the income received. We believe the adjustments for reinsurance provide a view of the assets for which we have economic exposure. Net invested assets include our proportionate share of ACRA investments, based on our economic ownership, but do not include the proportionate share of investments associated with the noncontrolling interests. Our net invested assets are averaged over the number of quarters in the relevant period to compute our net investment earned rate for such period. While we believe net invested assets is a meaningful financial metric and enhances our understanding of the underlying drivers of our investment portfolio, it should not be used as a substitute for total investments, including related parties, presented under US GAAP. Net Reserve Liabilities In managing our business, we also analyze net reserve liabilities, which does not correspond to total liabilities as disclosed in our condensed consolidated financial statements and notes thereto. Net reserve liabilities represent our policyholder liability obligations net of reinsurance and are used to analyze the costs of our liabilities. Net reserve liabilities include (a) interest sensitive contract liabilities, (b) future policy benefits, (c) net market risk benefits, (d) long- term repurchase obligations, (e) dividends payable to policyholders and (f) other policy claims and benefits, offset by reinsurance recoverable, excluding policy loans ceded. Net reserve liabilities include our proportionate share of ACRA reserve liabilities, based on our economic ownership, but do not include the proportionate share of reserve liabilities associated with the noncontrolling interests. Net reserve liabilities are net of the ceded liabilities to third-party reinsurers as the costs of the liabilities are passed to such reinsurers and, therefore, we have no net economic exposure to such liabilities, assuming our reinsurance counterparties perform under our agreements. For such transactions, US GAAP requires the ceded liabilities and related reinsurance recoverables to continue to be recorded in our consolidated financial statements despite the transfer of economic risk to the counterparty in connection with the reinsurance transaction. We include the underlying liabilities assumed through modco reinsurance agreements in our net reserve liabilities calculation in order to match the liabilities with the expenses incurred. While we believe net reserve liabilities is a meaningful financial metric and enhances our understanding of the underlying profitability drivers of our business, it should not be used as a substitute for total liabilities presented under US GAAP.
Non-GAAP Measures & Definitions 50 Sales Sales statistics do not correspond to revenues under US GAAP but are used as relevant measures to understand our business performance as it relates to inflows generated during a specific period of time. Our sales statistics include inflows for fixed rate annuities and FIAs and align with the LIMRA definition of all money paid into an individual annuity, including money paid into new contracts with initial purchase occurring in the specified period and existing contracts with initial purchase occurring prior to the specified period (excluding internal transfers). We believe sales is a meaningful metric that enhances our understanding of our business performance and is not the same as premiums presented in our condensed consolidated statements of income. Assets Under Management Assets Under Management, or AUM, refers to the assets of the funds, partnerships and accounts to which Apollo provides investment management, advisory, or certain other investment-related services, including, without limitation, capital that such funds, partnerships and accounts have the right to call from investors pursuant to capital commitments. AUM equals the sum of: 1. the net asset value, plus used or available leverage and/or capital commitments, or gross assets plus capital commitments, of the yield and certain hybrid funds, partnerships and accounts for which Apollo provides investment management or advisory services, other than certain collateralized loan obligations, collateralized debt obligations, and certain perpetual capital vehicles, which have a fee-generating basis other than the mark-to-market value of the underlying assets; for certain perpetual capital vehicles in yield, gross asset value plus available financing capacity; 2. the fair value of the investments of equity and certain hybrid funds, partnerships and accounts Apollo manages or advises, plus the capital that such funds, partnerships and accounts are entitled to call from investors pursuant to capital commitments, plus portfolio level financings; 3. the gross asset value associated with the reinsurance investments of the portfolio company assets Apollo manages or advises; and 4. the fair value of any other assets that Apollo manages or advises for the funds, partnerships and accounts to which Apollo provides investment management, advisory, or certain other investment-related services, plus unused credit facilities, including capital commitments to such funds, partnerships and accounts for investments that may require pre-qualification or other conditions before investment plus any other capital commitments to such funds, partnerships and accounts available for investment that are not otherwise included in the clauses above. Apollo’s AUM measure includes Assets Under Management for which Apollo charges either nominal or zero fees. Apollo’s AUM measure also includes assets for which Apollo does not have investment discretion, including certain assets for which Apollo earns only investment-related service fees, rather than management or advisory fees. Apollo’s definition of AUM is not based on any definition of Assets Under Management contained in its governing documents or in any Apollo Fund management agreements. Apollo considers multiple factors for determining what should be included in its definition of AUM. Such factors include but are not limited to (1) Apollo’s ability to influence the investment decisions for existing and available assets; (2) Apollo’s ability to generate income from the underlying assets in its funds; and (3) the AUM measures that Apollo uses internally or believes are used by other investment managers. Given the differences in the investment strategies and structures among other alternative investment managers, Apollo’s calculation of AUM may differ from the calculations employed by other investment managers and, as a result, this measure may not be directly comparable to similar measures presented by other investment managers. Apollo’s calculation also differs from the manner in which its affiliates registered with the SEC report “Regulatory Assets Under Management” on Form ADV and Form PF in various ways. Apollo uses AUM, Gross capital deployed and Dry powder as performance measurements of its investment activities, as well as to monitor fund size in relation to professional resource and infrastructure needs.
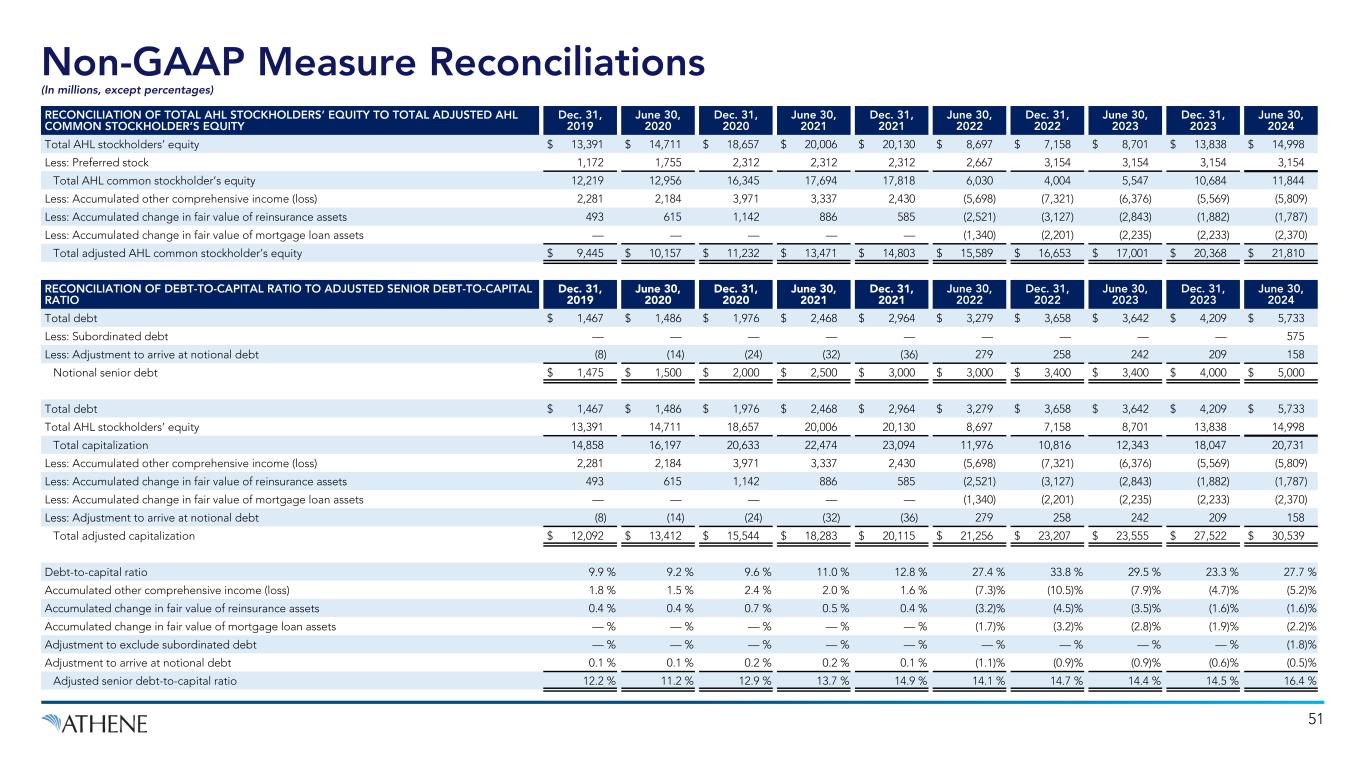
Non-GAAP Measure Reconciliations (In millions, except percentages) 51 RECONCILIATION OF TOTAL AHL STOCKHOLDERS’ EQUITY TO TOTAL ADJUSTED AHL COMMON STOCKHOLDER’S EQUITY Dec. 31, 2019 June 30, 2020 Dec. 31, 2020 June 30, 2021 Dec. 31, 2021 June 30, 2022 Dec. 31, 2022 June 30, 2023 Dec. 31, 2023 June 30, 2024 Total AHL stockholders’ equity $ 13,391 $ 14,711 $ 18,657 $ 20,006 $ 20,130 $ 8,697 $ 7,158 $ 8,701 $ 13,838 $ 14,998 Less: Preferred stock 1,172 1,755 2,312 2,312 2,312 2,667 3,154 3,154 3,154 3,154 Total AHL common stockholder’s equity 12,219 12,956 16,345 17,694 17,818 6,030 4,004 5,547 10,684 11,844 Less: Accumulated other comprehensive income (loss) 2,281 2,184 3,971 3,337 2,430 (5,698) (7,321) (6,376) (5,569) (5,809) Less: Accumulated change in fair value of reinsurance assets 493 615 1,142 886 585 (2,521) (3,127) (2,843) (1,882) (1,787) Less: Accumulated change in fair value of mortgage loan assets — — — — — (1,340) (2,201) (2,235) (2,233) (2,370) Total adjusted AHL common stockholder’s equity $ 9,445 $ 10,157 $ 11,232 $ 13,471 $ 14,803 $ 15,589 $ 16,653 $ 17,001 $ 20,368 $ 21,810 RECONCILIATION OF DEBT-TO-CAPITAL RATIO TO ADJUSTED SENIOR DEBT-TO-CAPITAL RATIO Dec. 31, 2019 June 30, 2020 Dec. 31, 2020 June 30, 2021 Dec. 31, 2021 June 30, 2022 Dec. 31, 2022 June 30, 2023 Dec. 31, 2023 June 30, 2024 Total debt $ 1,467 $ 1,486 $ 1,976 $ 2,468 $ 2,964 $ 3,279 $ 3,658 $ 3,642 $ 4,209 $ 5,733 Less: Subordinated debt — — — — — — — — — 575 Less: Adjustment to arrive at notional debt (8) (14) (24) (32) (36) 279 258 242 209 158 Notional senior debt $ 1,475 $ 1,500 $ 2,000 $ 2,500 $ 3,000 $ 3,000 $ 3,400 $ 3,400 $ 4,000 $ 5,000 Total debt $ 1,467 $ 1,486 $ 1,976 $ 2,468 $ 2,964 $ 3,279 $ 3,658 $ 3,642 $ 4,209 $ 5,733 Total AHL stockholders’ equity 13,391 14,711 18,657 20,006 20,130 8,697 7,158 8,701 13,838 14,998 Total capitalization 14,858 16,197 20,633 22,474 23,094 11,976 10,816 12,343 18,047 20,731 Less: Accumulated other comprehensive income (loss) 2,281 2,184 3,971 3,337 2,430 (5,698) (7,321) (6,376) (5,569) (5,809) Less: Accumulated change in fair value of reinsurance assets 493 615 1,142 886 585 (2,521) (3,127) (2,843) (1,882) (1,787) Less: Accumulated change in fair value of mortgage loan assets — — — — — (1,340) (2,201) (2,235) (2,233) (2,370) Less: Adjustment to arrive at notional debt (8) (14) (24) (32) (36) 279 258 242 209 158 Total adjusted capitalization $ 12,092 $ 13,412 $ 15,544 $ 18,283 $ 20,115 $ 21,256 $ 23,207 $ 23,555 $ 27,522 $ 30,539 Debt-to-capital ratio 9.9 % 9.2 % 9.6 % 11.0 % 12.8 % 27.4 % 33.8 % 29.5 % 23.3 % 27.7 % Accumulated other comprehensive income (loss) 1.8 % 1.5 % 2.4 % 2.0 % 1.6 % (7.3) % (10.5) % (7.9) % (4.7) % (5.2) % Accumulated change in fair value of reinsurance assets 0.4 % 0.4 % 0.7 % 0.5 % 0.4 % (3.2) % (4.5) % (3.5) % (1.6) % (1.6) % Accumulated change in fair value of mortgage loan assets — % — % — % — % — % (1.7) % (3.2) % (2.8) % (1.9) % (2.2) % Adjustment to exclude subordinated debt — % — % — % — % — % — % — % — % — % (1.8) % Adjustment to arrive at notional debt 0.1 % 0.1 % 0.2 % 0.2 % 0.1 % (1.1) % (0.9) % (0.9) % (0.6) % (0.5) % Adjusted senior debt-to-capital ratio 12.2 % 11.2 % 12.9 % 13.7 % 14.9 % 14.1 % 14.7 % 14.4 % 14.5 % 16.4 %
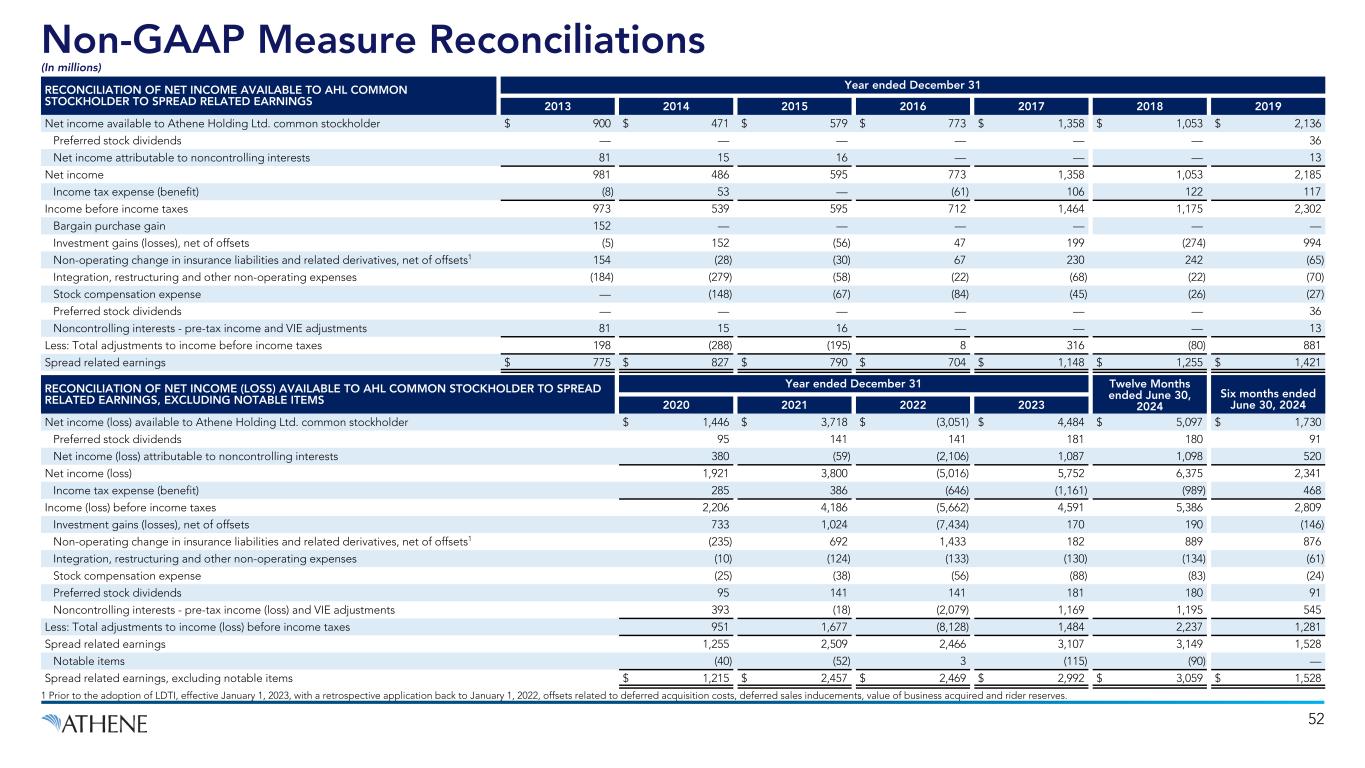
Non-GAAP Measure Reconciliations (In millions) 52 RECONCILIATION OF NET INCOME AVAILABLE TO AHL COMMON STOCKHOLDER TO SPREAD RELATED EARNINGS Year ended December 31 2013 2014 2015 2016 2017 2018 2019 Net income available to Athene Holding Ltd. common stockholder $ 900 $ 471 $ 579 $ 773 $ 1,358 $ 1,053 $ 2,136 Preferred stock dividends — — — — — — 36 Net income attributable to noncontrolling interests 81 15 16 — — — 13 Net income 981 486 595 773 1,358 1,053 2,185 Income tax expense (benefit) (8) 53 — (61) 106 122 117 Income before income taxes 973 539 595 712 1,464 1,175 2,302 Bargain purchase gain 152 — — — — — — Investment gains (losses), net of offsets (5) 152 (56) 47 199 (274) 994 Non-operating change in insurance liabilities and related derivatives, net of offsets1 154 (28) (30) 67 230 242 (65) Integration, restructuring and other non-operating expenses (184) (279) (58) (22) (68) (22) (70) Stock compensation expense — (148) (67) (84) (45) (26) (27) Preferred stock dividends — — — — — — 36 Noncontrolling interests - pre-tax income and VIE adjustments 81 15 16 — — — 13 Less: Total adjustments to income before income taxes 198 (288) (195) 8 316 (80) 881 Spread related earnings $ 775 $ 827 $ 790 $ 704 $ 1,148 $ 1,255 $ 1,421 RECONCILIATION OF NET INCOME (LOSS) AVAILABLE TO AHL COMMON STOCKHOLDER TO SPREAD RELATED EARNINGS, EXCLUDING NOTABLE ITEMS Year ended December 31 Twelve Months ended June 30, 2024 Six months ended June 30, 20242020 2021 2022 2023 Net income (loss) available to Athene Holding Ltd. common stockholder $ 1,446 $ 3,718 $ (3,051) $ 4,484 $ 5,097 $ 1,730 Preferred stock dividends 95 141 141 181 180 91 Net income (loss) attributable to noncontrolling interests 380 (59) (2,106) 1,087 1,098 520 Net income (loss) 1,921 3,800 (5,016) 5,752 6,375 2,341 Income tax expense (benefit) 285 386 (646) (1,161) (989) 468 Income (loss) before income taxes 2,206 4,186 (5,662) 4,591 5,386 2,809 Investment gains (losses), net of offsets 733 1,024 (7,434) 170 190 (146) Non-operating change in insurance liabilities and related derivatives, net of offsets1 (235) 692 1,433 182 889 876 Integration, restructuring and other non-operating expenses (10) (124) (133) (130) (134) (61) Stock compensation expense (25) (38) (56) (88) (83) (24) Preferred stock dividends 95 141 141 181 180 91 Noncontrolling interests - pre-tax income (loss) and VIE adjustments 393 (18) (2,079) 1,169 1,195 545 Less: Total adjustments to income (loss) before income taxes 951 1,677 (8,128) 1,484 2,237 1,281 Spread related earnings 1,255 2,509 2,466 3,107 3,149 1,528 Notable items (40) (52) 3 (115) (90) — Spread related earnings, excluding notable items $ 1,215 $ 2,457 $ 2,469 $ 2,992 $ 3,059 $ 1,528 1 Prior to the adoption of LDTI, effective January 1, 2023, with a retrospective application back to January 1, 2022, offsets related to deferred acquisition costs, deferred sales inducements, value of business acquired and rider reserves.
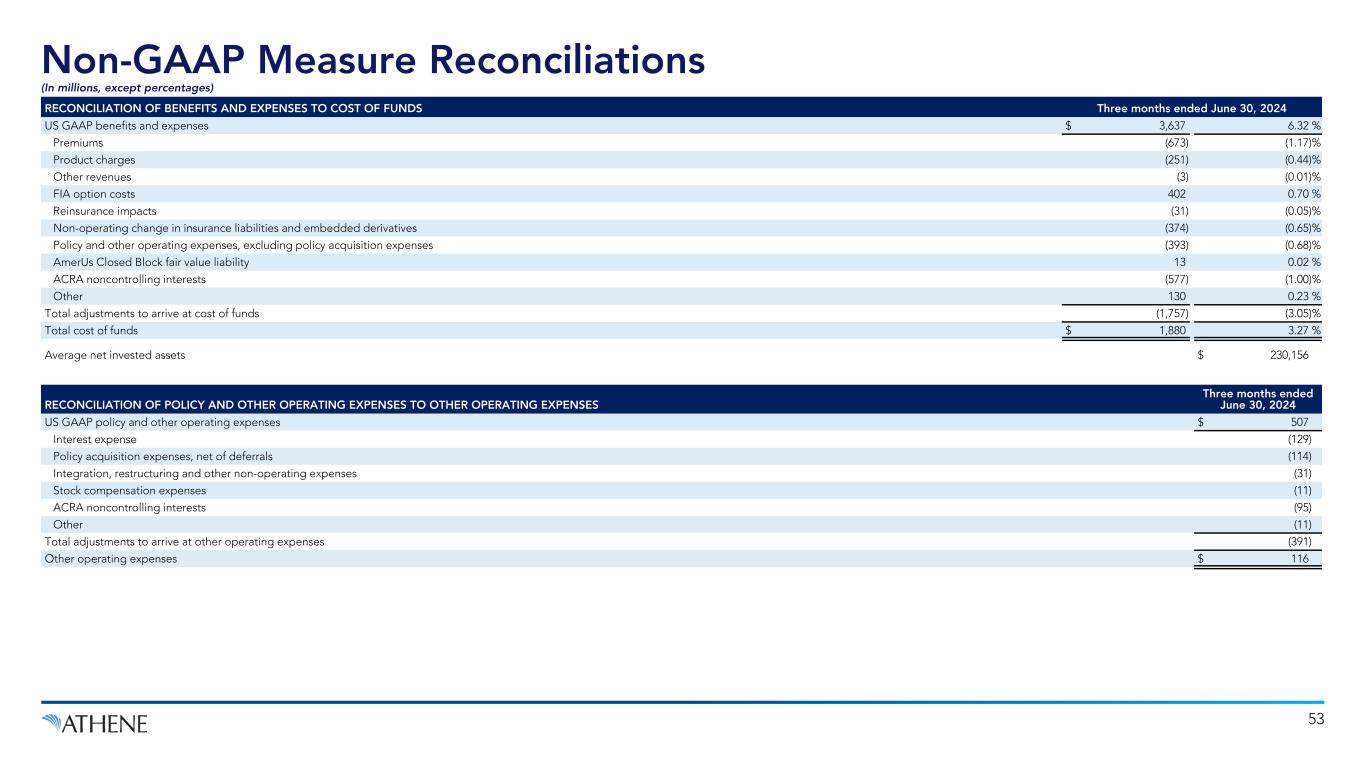
Non-GAAP Measure Reconciliations (In millions, except percentages) 53 RECONCILIATION OF BENEFITS AND EXPENSES TO COST OF FUNDS Three months ended June 30, 2024 US GAAP benefits and expenses $ 3,637 6.32 % Premiums (673) (1.17) % Product charges (251) (0.44) % Other revenues (3) (0.01) % FIA option costs 402 0.70 % Reinsurance impacts (31) (0.05) % Non-operating change in insurance liabilities and embedded derivatives (374) (0.65) % Policy and other operating expenses, excluding policy acquisition expenses (393) (0.68) % AmerUs Closed Block fair value liability 13 0.02 % ACRA noncontrolling interests (577) (1.00) % Other 130 0.23 % Total adjustments to arrive at cost of funds (1,757) (3.05) % Total cost of funds $ 1,880 3.27 % Average net invested assets $ 230,156 RECONCILIATION OF POLICY AND OTHER OPERATING EXPENSES TO OTHER OPERATING EXPENSES Three months ended June 30, 2024 US GAAP policy and other operating expenses $ 507 Interest expense (129) Policy acquisition expenses, net of deferrals (114) Integration, restructuring and other non-operating expenses (31) Stock compensation expenses (11) ACRA noncontrolling interests (95) Other (11) Total adjustments to arrive at other operating expenses (391) Other operating expenses $ 116
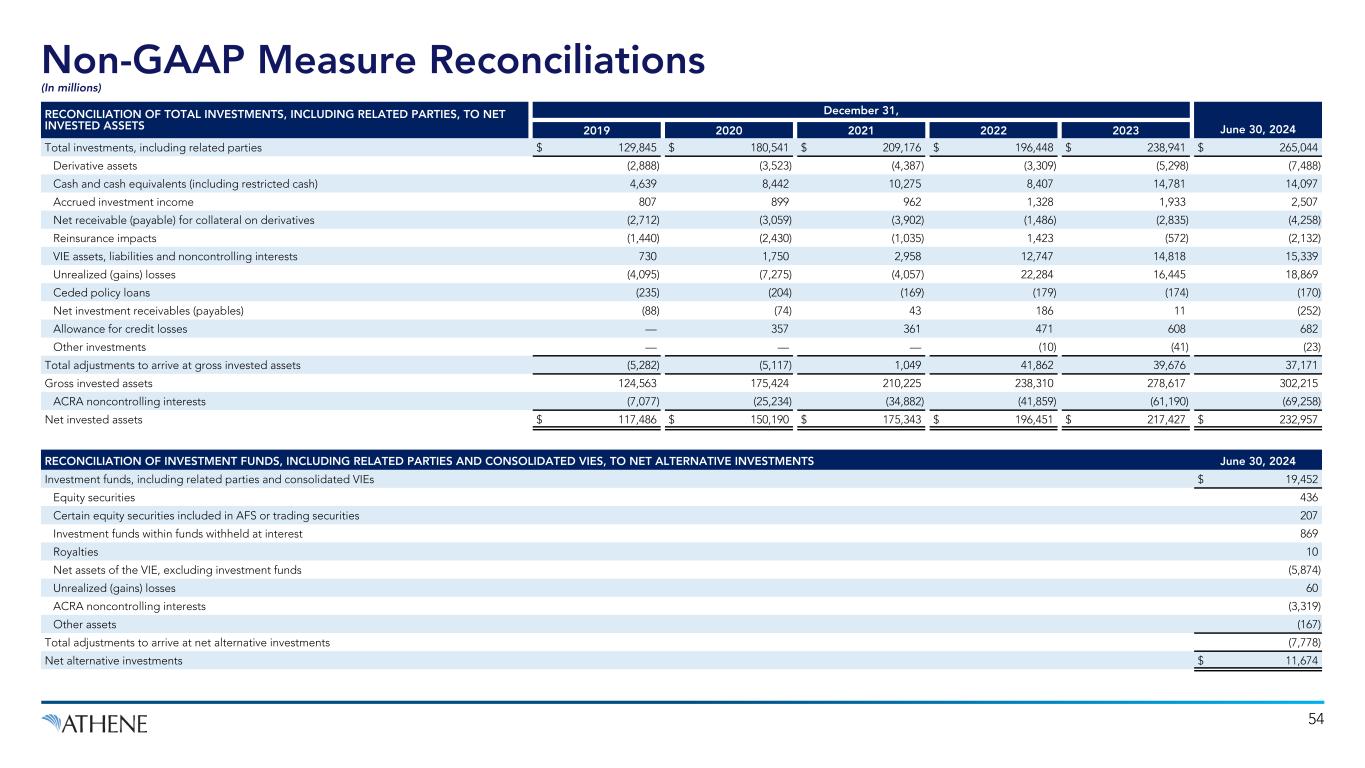
Non-GAAP Measure Reconciliations (In millions) 54 RECONCILIATION OF TOTAL INVESTMENTS, INCLUDING RELATED PARTIES, TO NET INVESTED ASSETS December 31, June 30, 20242019 2020 2021 2022 2023 Total investments, including related parties $ 129,845 $ 180,541 $ 209,176 $ 196,448 $ 238,941 $ 265,044 Derivative assets (2,888) (3,523) (4,387) (3,309) (5,298) (7,488) Cash and cash equivalents (including restricted cash) 4,639 8,442 10,275 8,407 14,781 14,097 Accrued investment income 807 899 962 1,328 1,933 2,507 Net receivable (payable) for collateral on derivatives (2,712) (3,059) (3,902) (1,486) (2,835) (4,258) Reinsurance impacts (1,440) (2,430) (1,035) 1,423 (572) (2,132) VIE assets, liabilities and noncontrolling interests 730 1,750 2,958 12,747 14,818 15,339 Unrealized (gains) losses (4,095) (7,275) (4,057) 22,284 16,445 18,869 Ceded policy loans (235) (204) (169) (179) (174) (170) Net investment receivables (payables) (88) (74) 43 186 11 (252) Allowance for credit losses — 357 361 471 608 682 Other investments — — — (10) (41) (23) Total adjustments to arrive at gross invested assets (5,282) (5,117) 1,049 41,862 39,676 37,171 Gross invested assets 124,563 175,424 210,225 238,310 278,617 302,215 ACRA noncontrolling interests (7,077) (25,234) (34,882) (41,859) (61,190) (69,258) Net invested assets $ 117,486 $ 150,190 $ 175,343 $ 196,451 $ 217,427 $ 232,957 RECONCILIATION OF INVESTMENT FUNDS, INCLUDING RELATED PARTIES AND CONSOLIDATED VIES, TO NET ALTERNATIVE INVESTMENTS June 30, 2024 Investment funds, including related parties and consolidated VIEs $ 19,452 Equity securities 436 Certain equity securities included in AFS or trading securities 207 Investment funds within funds withheld at interest 869 Royalties 10 Net assets of the VIE, excluding investment funds (5,874) Unrealized (gains) losses 60 ACRA noncontrolling interests (3,319) Other assets (167) Total adjustments to arrive at net alternative investments (7,778) Net alternative investments $ 11,674
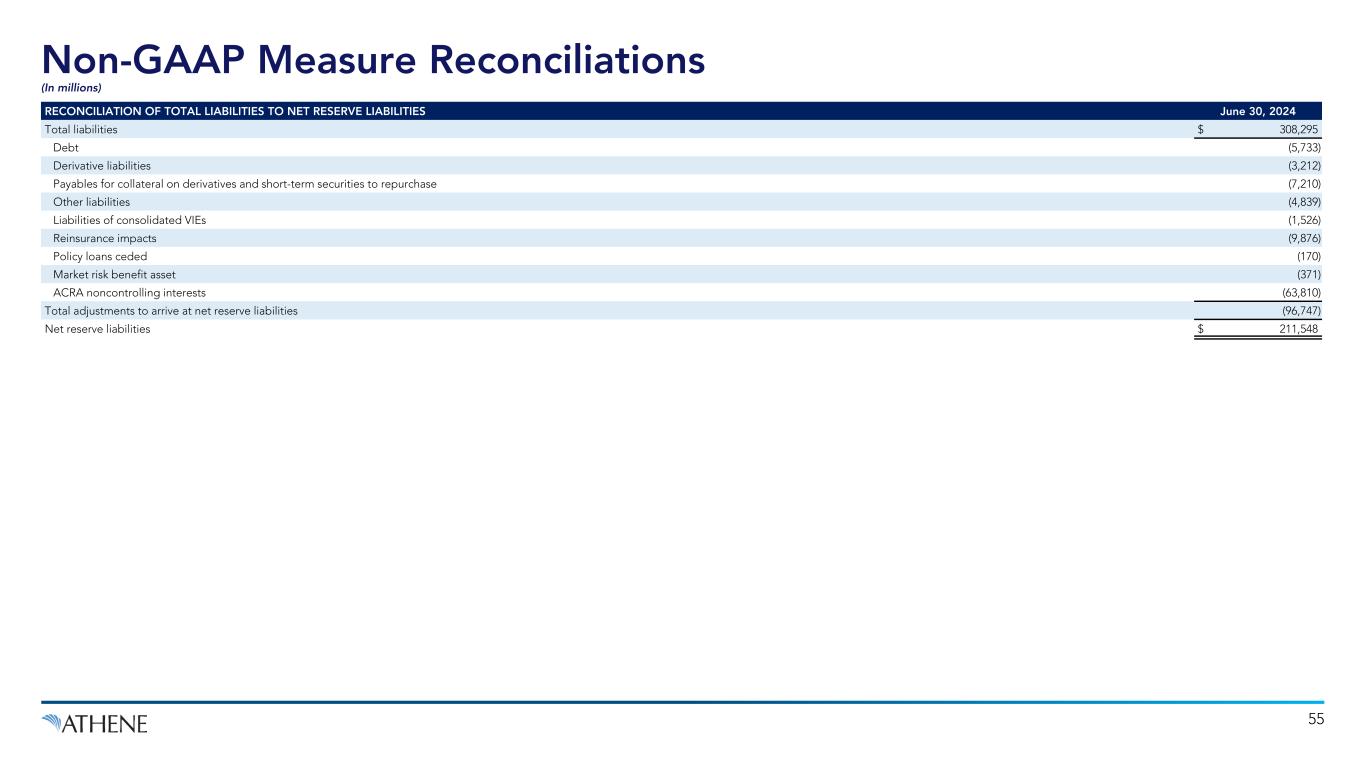
Non-GAAP Measure Reconciliations (In millions) 55 RECONCILIATION OF TOTAL LIABILITIES TO NET RESERVE LIABILITIES June 30, 2024 Total liabilities $ 308,295 Debt (5,733) Derivative liabilities (3,212) Payables for collateral on derivatives and short-term securities to repurchase (7,210) Other liabilities (4,839) Liabilities of consolidated VIEs (1,526) Reinsurance impacts (9,876) Policy loans ceded (170) Market risk benefit asset (371) ACRA noncontrolling interests (63,810) Total adjustments to arrive at net reserve liabilities (96,747) Net reserve liabilities $ 211,548