© Atkore Fourth Quarter and Full Year 2022 Earnings Presentation and Business Update November 18, 2022
2© Atkore This presentation is provided for general informational purposes only and it does not include every item which may be of interest, nor does it purport to present full and fair disclosure with respect to Atkore Inc. (the “Company” or “Atkore”) or its operational and financial information. Atkore expressly disclaims any current intention to update any forward-looking statements contained in this presentation as a result of new information or future events or developments or otherwise, except as required by federal securities laws. This presentation is not a prospectus and is not an offer to sell securities. This presentation contains forward-looking statements that are subject to known and unknown risks and uncertainties, many of which are beyond our control. All statements other than statements of historical fact included in this presentation are forward-looking statements. Forward-looking statements appearing throughout this presentation include, without limitation, statements regarding our intentions, beliefs, assumptions or current expectations concerning, among other things, financial position; results of operations; cash flows; prospects; growth strategies or expectations; customer retention; the outcome (by judgment or settlement) and costs of legal, administrative or regulatory proceedings, investigations or inspections, including, without limitation, collective, representative or any other litigation; and the impact of prevailing economic conditions. You can identify forward-looking statements by the fact that they do not relate strictly to historical or current facts. These statements may include words such as “believes,” “expects,” “may,” “will,” “shall,” “should,” “would,” “could,” “seeks,” “aims,” “projects,” “is optimistic,” “intends,” “plans,” “estimates,” “anticipates” and other comparable terms. We caution you that forward-looking statements are not guarantees of future performance or outcomes and that actual performance and outcomes, including, without limitation, our actual results of operations, financial condition and liquidity, and the development of the market in which we operate, may differ materially from those made in or suggested by the forward-looking statements contained in this presentation. In addition, even if our results of operations, financial condition and cash flows, and the development of the market in which we operate, are consistent with the forward-looking statements contained in this presentation, those results or developments may not be indicative of results or developments in subsequent periods. A number of important factors, including, without limitation, the risks and uncertainties discussed under the captions “Risk Factors” and “Management’s Discussion and Analysis of Financial Condition and Results of Operations” in our Annual Report on Form 10-K and the Quarterly Report on Form 10-Q filed with the U.S. Securities and Exchange Commission, could cause actual results and outcomes to differ materially from those reflected in the forward-looking statements. Because of these risks, we caution that you should not place undue reliance on any of our forward-looking statements. New risks and uncertainties arise from time to time, and it is impossible for us to predict those events or how they may affect us. Further, any forward-looking statement speaks only as of the date on which it is made. We undertake no obligation to revise the forward-looking statements in this presentation after the date of this presentation. Market data and industry information used throughout this presentation are based on management’s knowledge of the industry and the good faith estimates of management. We also relied, to the extent available, upon management’s review of independent industry surveys, forecasts and publications and other publicly available information prepared by a number of third-party sources. All of the market data and industry information used in this presentation involves a number of assumptions and limitations which we believe to be reasonable, but you are cautioned not to give undue weight to such estimates. Although we believe that these sources are reliable, we cannot guarantee the accuracy or completeness of this information, and we have not independently verified this information. While we believe the estimated market position, market opportunity and market size information included in this presentation are generally reliable, such information, which is derived in part from management’s estimates and beliefs, is inherently uncertain and imprecise. Projections, assumptions and estimates of our future performance and the future performance of the industry in which we operate are subject to a high degree of uncertainty and risk due to a variety of factors, including those described above. These and other factors could cause results to differ materially from those expressed in our estimates and beliefs and in the estimates prepared by independent parties. This presentation should be read along with the historical financial statements of Atkore, including the most recent audited financial statements. Historical results may not be indicative of future results. We use non-GAAP financial measures to help us describe our operating and financial performance. These measures may include Adjusted EBITDA, Adjusted EBITDA margin (Adjusted EBITDA over Net sales), Net debt (total debt less cash and cash equivalents), Adjusted Net Income Per Share (also referred to as “Adjusted EPS”), Leverage ratio (net debt or total debt less cash and cash equivalents, over Adjusted EBITDA on trailing twelve month (“TTM”) basis), Free Cash Flow (net cash provided by operating activities less capital expenditures) and Return on Capital to help us describe our operating and financial performance. These non-GAAP financial measures are commonly used in our industry and have certain limitations and should not be construed as alternatives to net income, total debt, net cash provided by operating activities, return on assets, and other income data measures as determined in accordance with generally accepted accounting principles in the United States, or GAAP, or as better indicators of operating performance. These non-GAAP financial measures as defined by us may not be comparable to similarly-titled non-GAAP measures presented by other companies. Our presentation of such non- GAAP financial measures should not be construed as an inference that our future results will be unaffected by unusual or non-recurring items. See the appendix to this presentation for a reconciliation of the non-GAAP financial measures presented herein to the most comparable financial measures as determined in accordance with GAAP. Fiscal Periods - The Company has a fiscal year that ends on September 30th. It is the Company's practice to establish quarterly closings using a 4-5-4 calendar. The Company's fiscal quarters typically end on the last Friday in December, March and June. Cautionary Statements
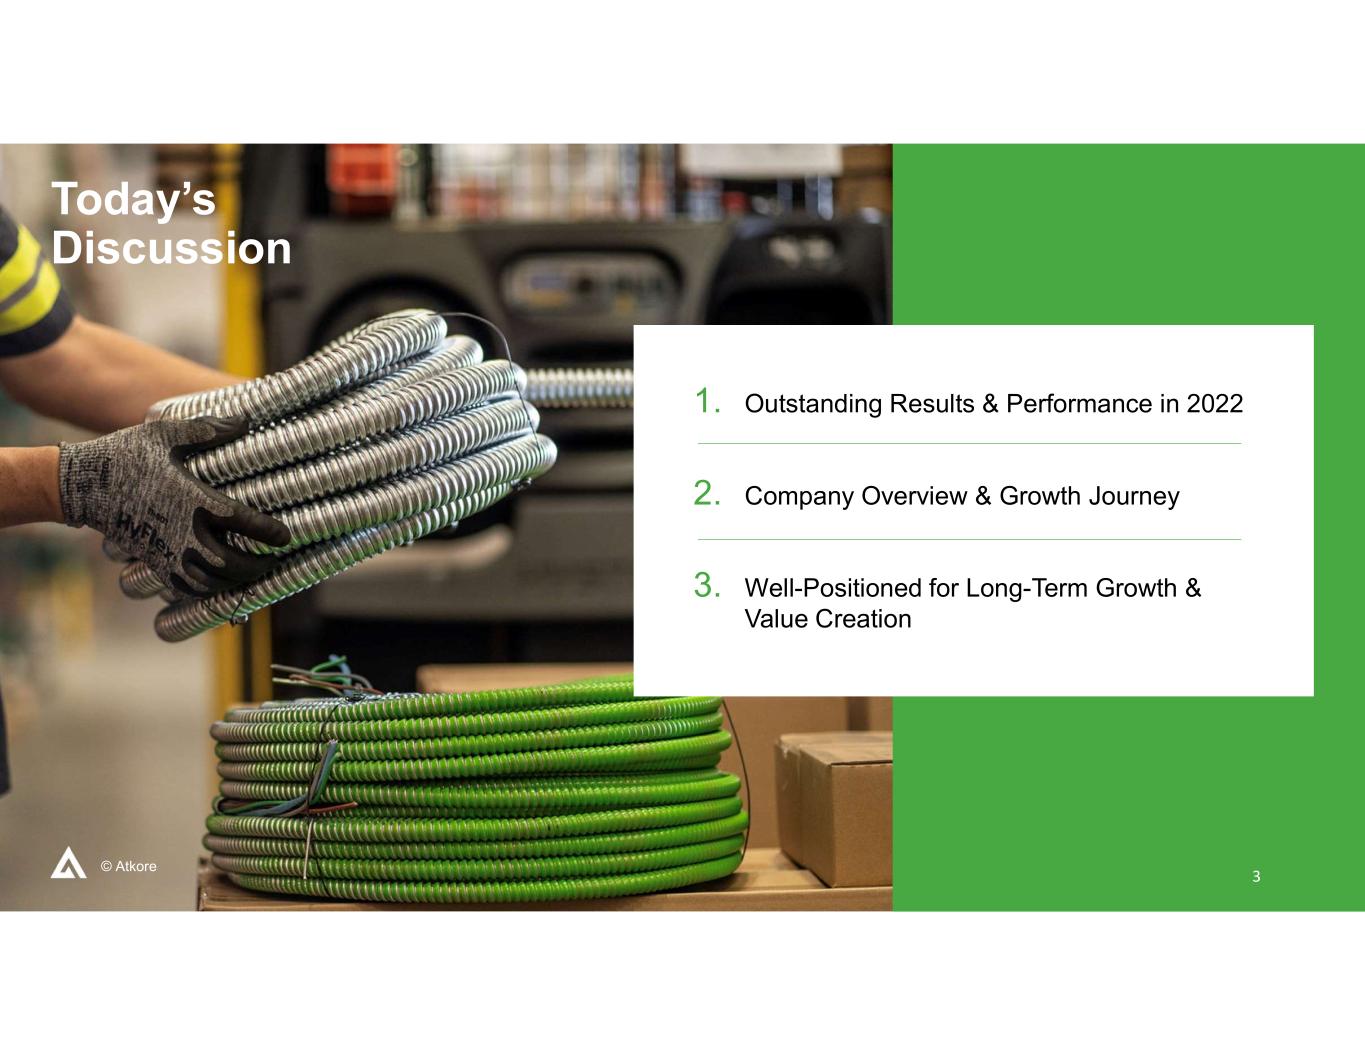
3© Atkore Today’s Discussion 1. Outstanding Results & Performance in 2022 2. Company Overview & Growth Journey 3. Well-Positioned for Long-Term Growth & Value Creation 3
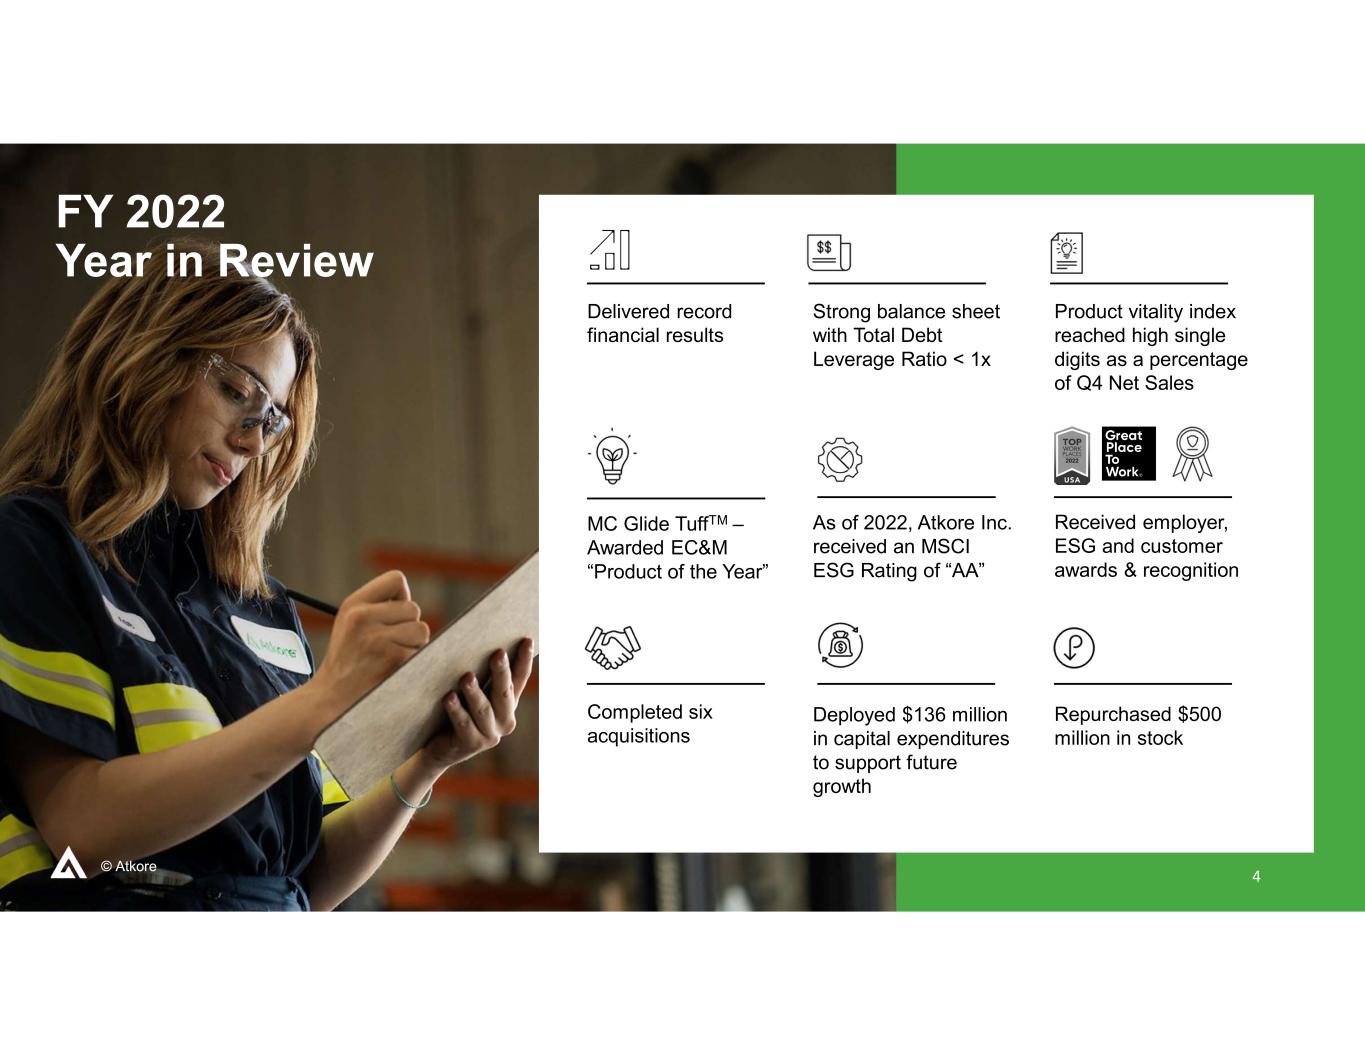
4© Atkore FY 2022 Year in Review 4 Delivered record financial results Completed six acquisitions As of 2022, Atkore Inc. received an MSCI ESG Rating of “AA” Received employer, ESG and customer awards & recognition MC Glide TuffTM – Awarded EC&M “Product of the Year” Strong balance sheet with Total Debt Leverage Ratio < 1x Product vitality index reached high single digits as a percentage of Q4 Net Sales Deployed $136 million in capital expenditures to support future growth Repurchased $500 million in stock
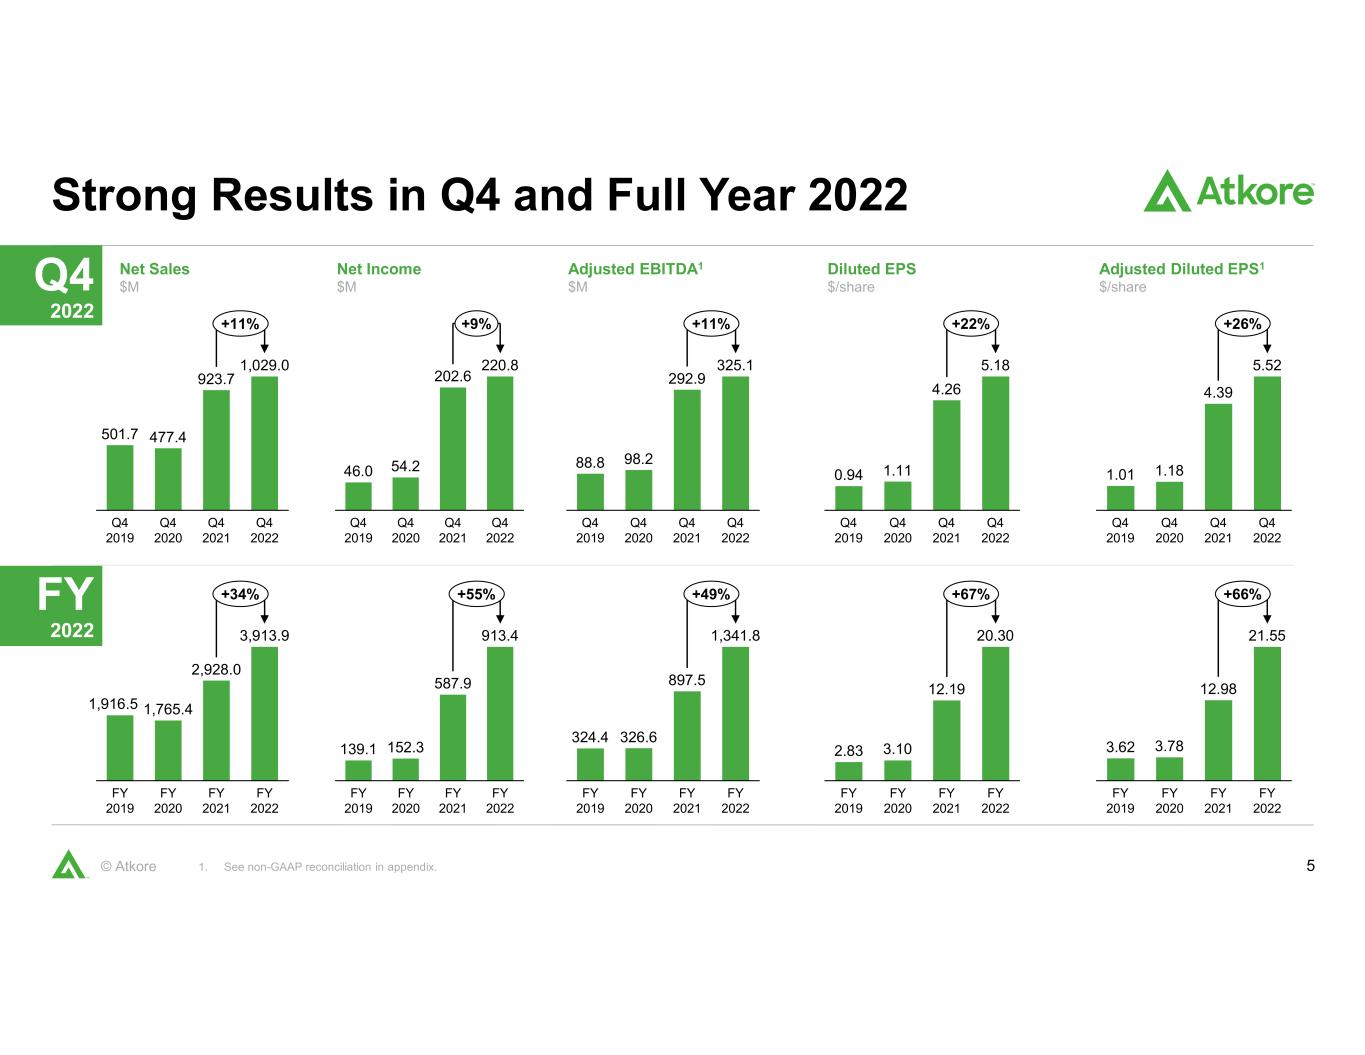
5© Atkore Strong Results in Q4 and Full Year 2022 1. See non-GAAP reconciliation in appendix. 501.7 477.4 923.7 1,029.0 Q4 2019 Q4 2022 Q4 2020 Q4 2021 +11% 46.0 54.2 202.6 220.8 Q4 2019 Q4 2020 Q4 2021 Q4 2022 +9% 88.8 98.2 292.9 325.1 Q4 2019 Q4 2020 Q4 2021 Q4 2022 +11% 1.01 1.18 4.39 5.52 Q4 2021 Q4 2019 Q4 2020 Q4 2022 +26% Net Sales $M Net Income $M Adjusted EBITDA1 $M Adjusted Diluted EPS1 $/share 1,916.5 1,765.4 2,928.0 3,913.9 FY 2019 FY 2020 FY 2021 FY 2022 +34% 139.1 152.3 587.9 913.4 FY 2022 FY 2021 FY 2019 FY 2020 +55% 324.4 326.6 897.5 1,341.8 FY 2019 FY 2020 FY 2021 FY 2022 +49% 3.62 3.78 12.98 21.55 FY 2019 FY 2020 FY 2021 FY 2022 +66% 0.94 1.11 4.26 5.18 Q4 2019 Q4 2020 Q4 2021 Q4 2022 +22% Diluted EPS $/share 2.83 3.10 12.19 20.30 FY 2022 FY 2019 FY 2020 FY 2021 +67% Q4 2022 FY 2022
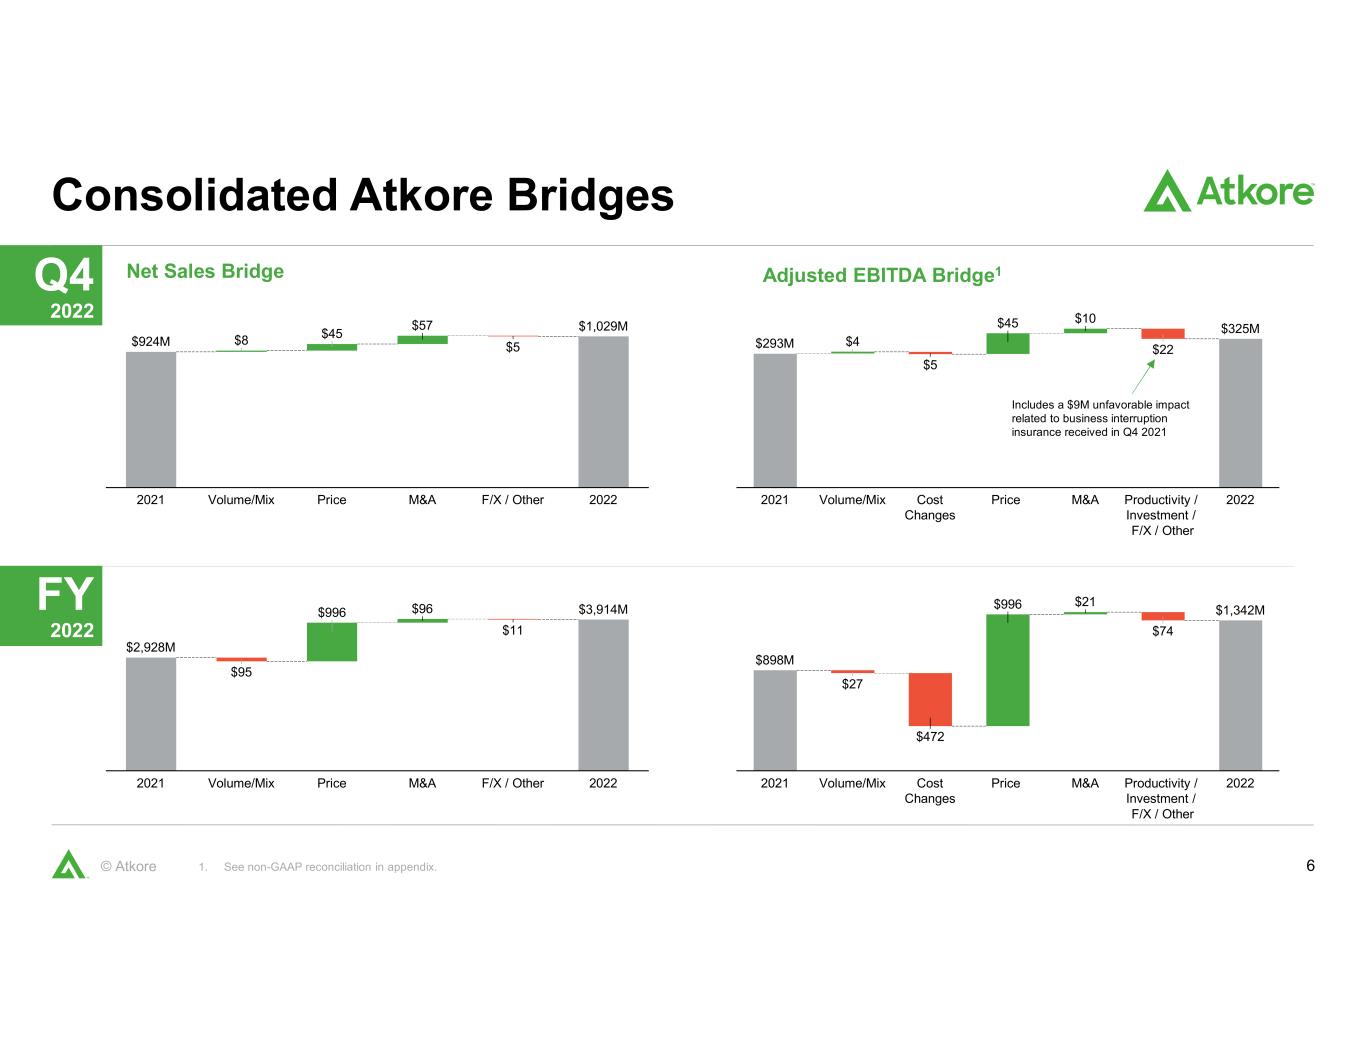
6© Atkore Consolidated Atkore Bridges 1. See non-GAAP reconciliation in appendix. Adjusted EBITDA Bridge1Net Sales BridgeQ4 2022 FY 2022 $8 $45 $57 $5 Volume/Mix2021 M&APrice F/X / Other 2022 $924M $1,029M $4 $5 $45 $10 $22 2022Cost Changes 2021 Volume/Mix Price M&A Productivity / Investment / F/X / Other $293M $325M $95 $996 $96 $11 2021 M&APriceVolume/Mix F/X / Other 2022 $3,914M $2,928M $27 $472 $996 $21 $74 2021 Price 2022Volume/Mix Cost Changes M&A Productivity / Investment / F/X / Other $898M $1,342M Includes a $9M unfavorable impact related to business interruption insurance received in Q4 2021
7© Atkore Company Overview
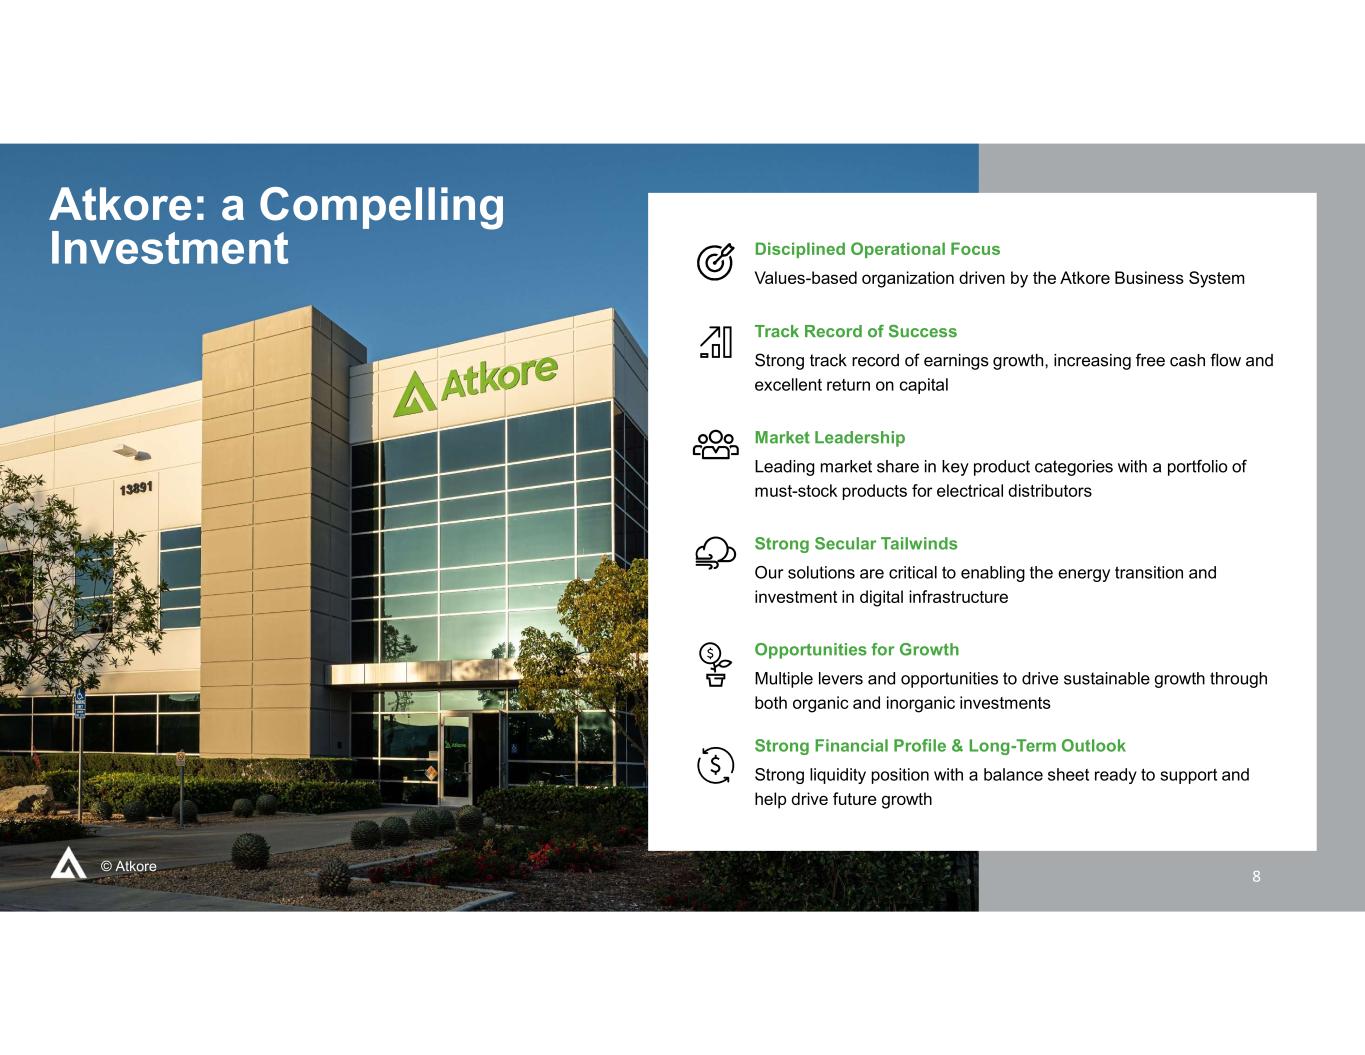
8© Atkore Atkore: a Compelling Investment Disciplined Operational Focus Values-based organization driven by the Atkore Business System Track Record of Success Strong track record of earnings growth, increasing free cash flow and excellent return on capital Market Leadership Leading market share in key product categories with a portfolio of must-stock products for electrical distributors Strong Secular Tailwinds Our solutions are critical to enabling the energy transition and investment in digital infrastructure Opportunities for Growth Multiple levers and opportunities to drive sustainable growth through both organic and inorganic investments Strong Financial Profile & Long-Term Outlook Strong liquidity position with a balance sheet ready to support and help drive future growth 8
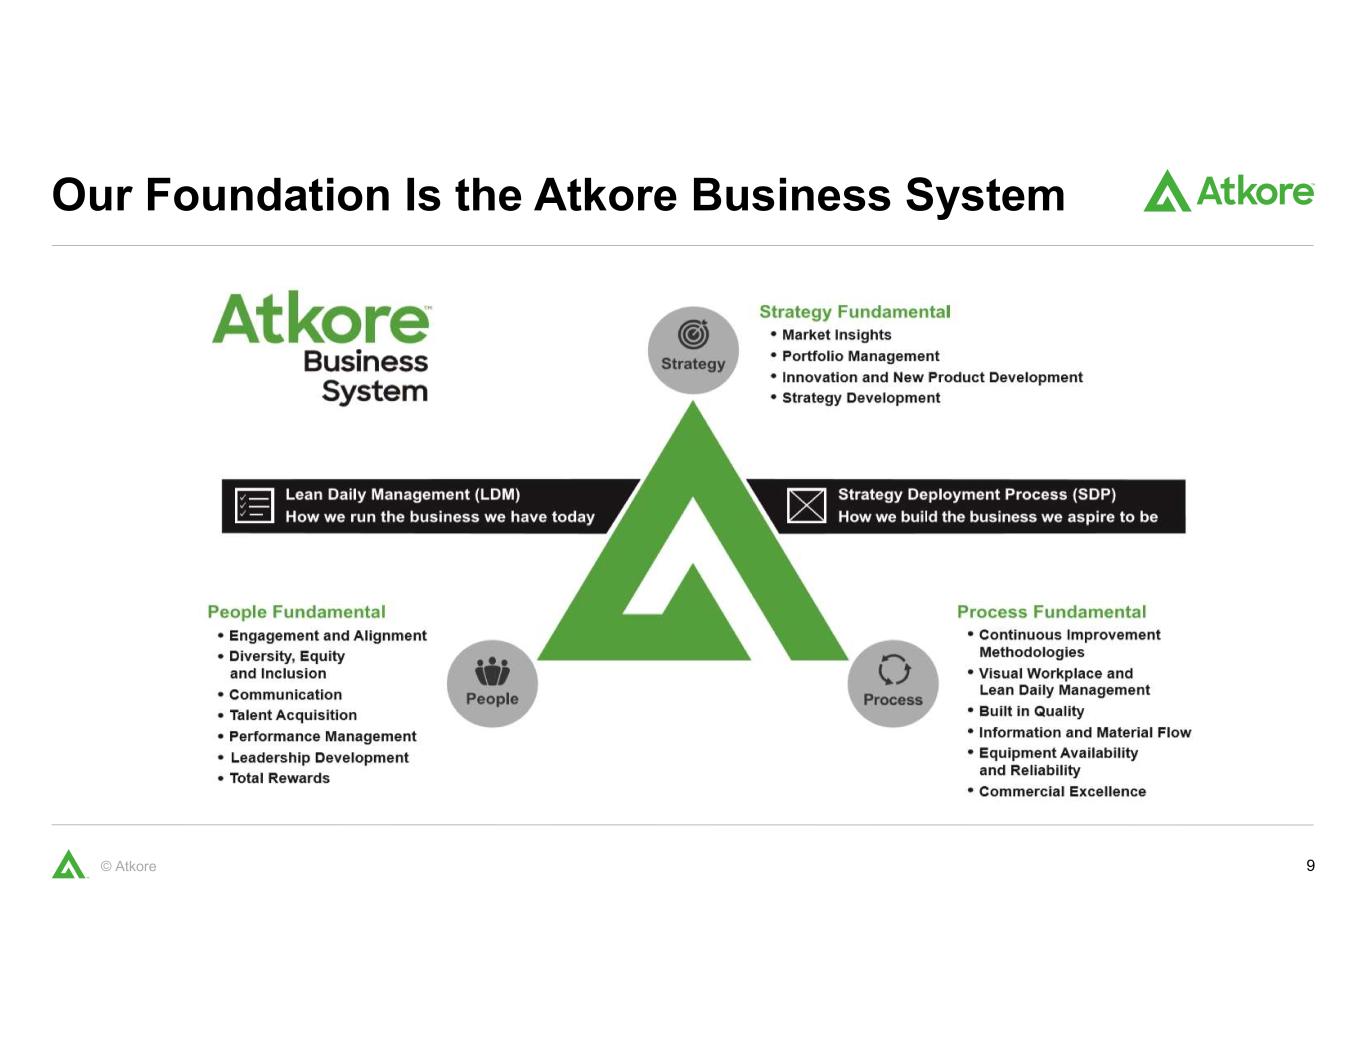
9© Atkore Our Foundation Is the Atkore Business System
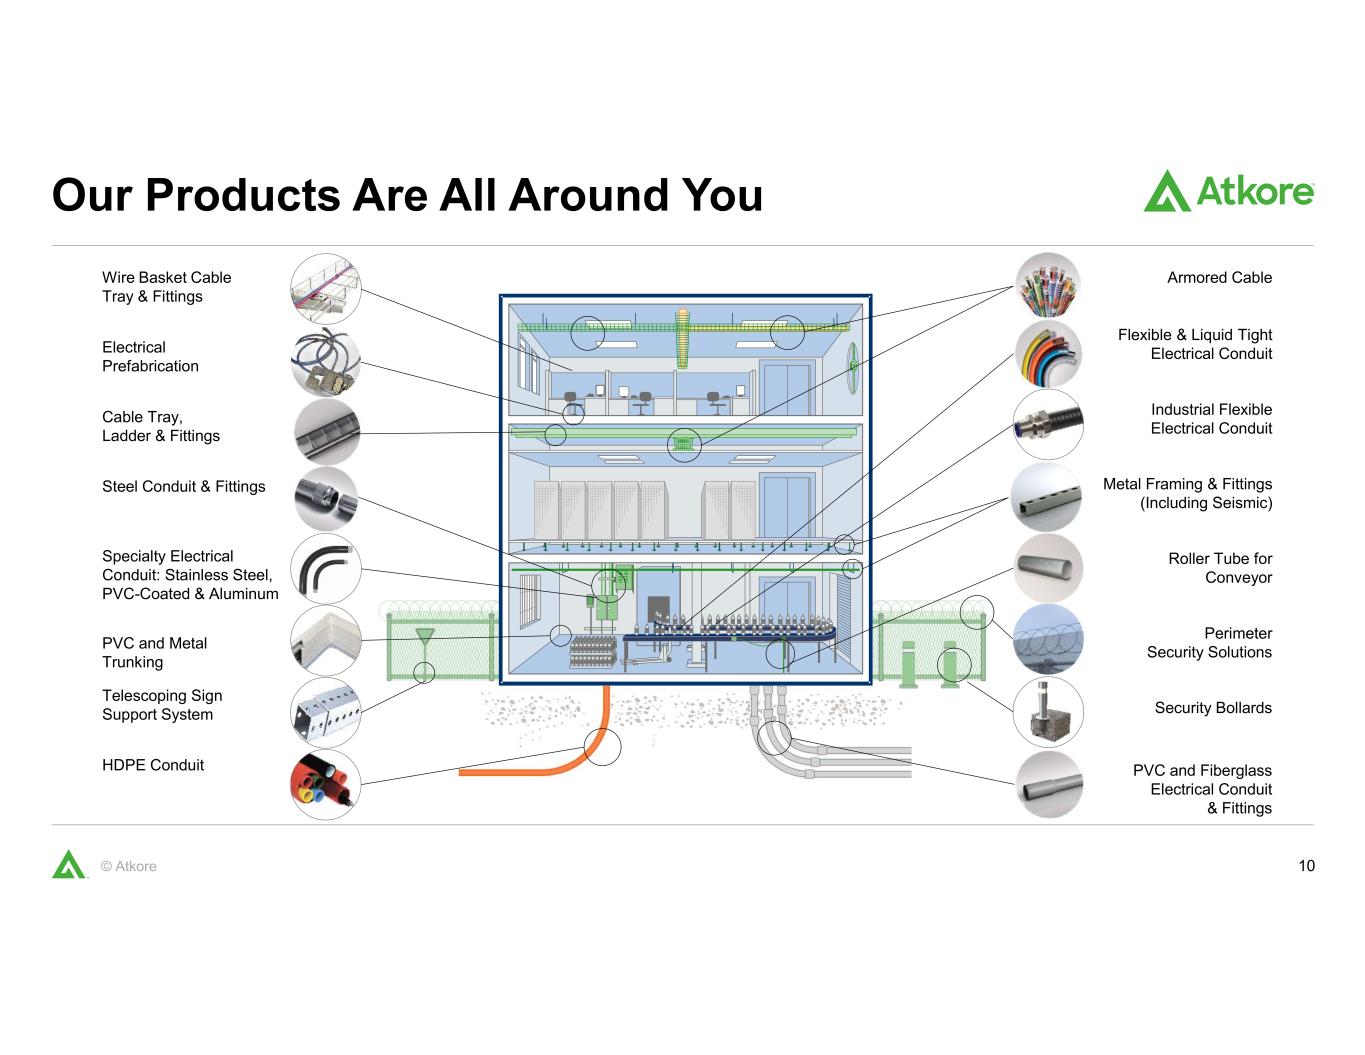
10© Atkore Our Products Are All Around You HDPE Conduit Wire Basket Cable Tray & Fittings Telescoping Sign Support System Cable Tray, Ladder & Fittings Steel Conduit & Fittings PVC and Metal Trunking Electrical Prefabrication Flexible & Liquid Tight Electrical Conduit Industrial Flexible Electrical Conduit Roller Tube for Conveyor PVC and Fiberglass Electrical Conduit & Fittings Metal Framing & Fittings (Including Seismic) Perimeter Security Solutions Security Bollards Armored Cable Specialty Electrical Conduit: Stainless Steel, PVC-Coated & Aluminum
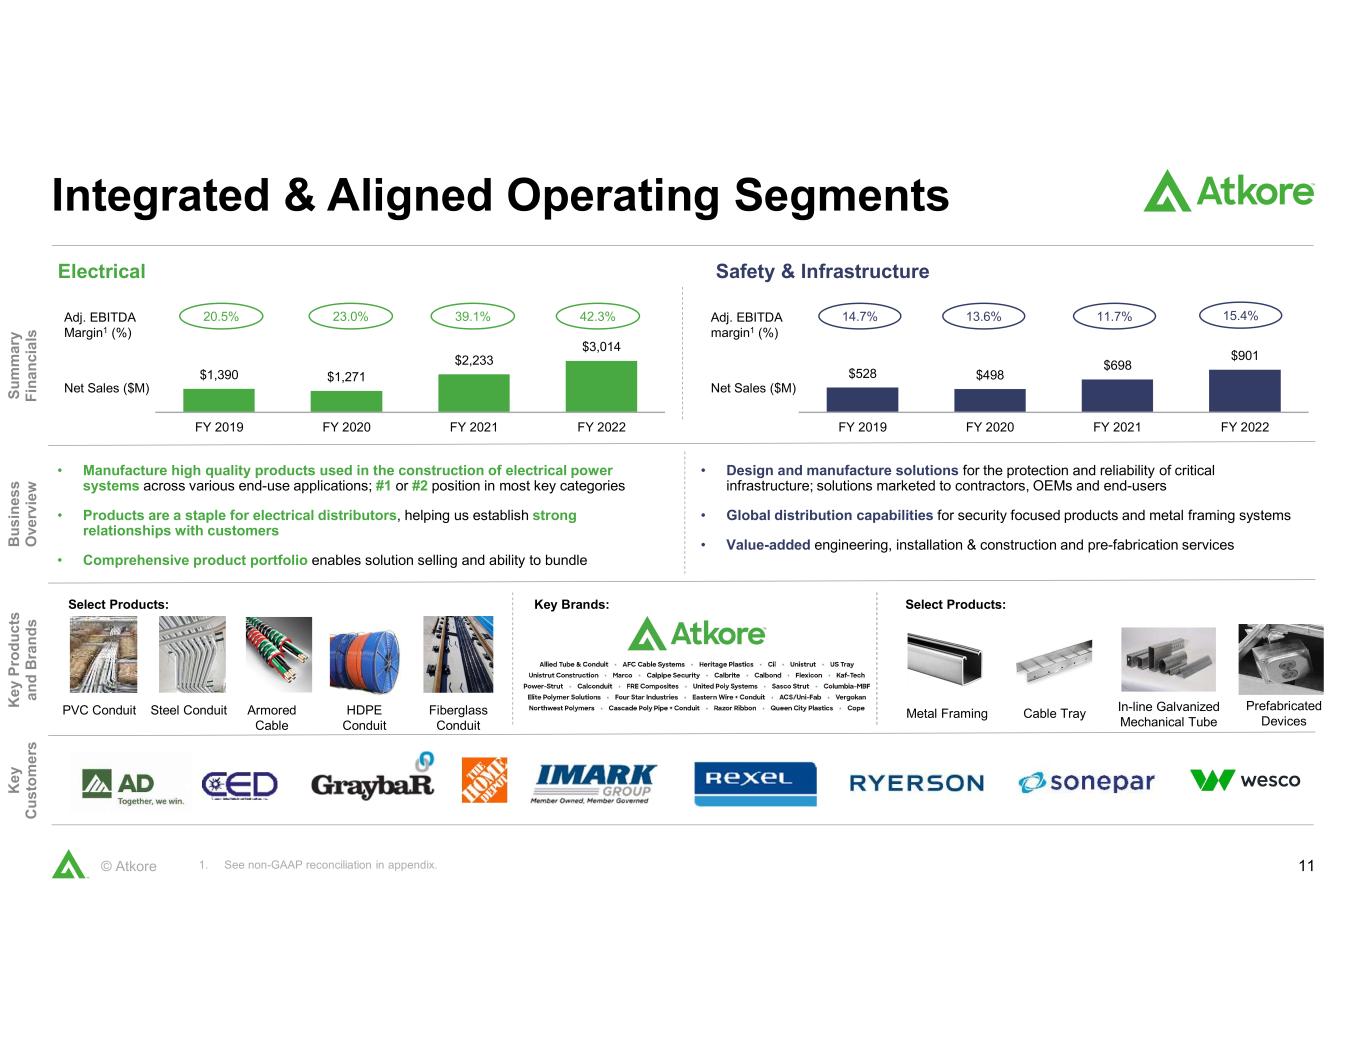
11© Atkore Integrated & Aligned Operating Segments • Manufacture high quality products used in the construction of electrical power systems across various end-use applications; #1 or #2 position in most key categories • Products are a staple for electrical distributors, helping us establish strong relationships with customers • Comprehensive product portfolio enables solution selling and ability to bundle • Design and manufacture solutions for the protection and reliability of critical infrastructure; solutions marketed to contractors, OEMs and end-users • Global distribution capabilities for security focused products and metal framing systems • Value-added engineering, installation & construction and pre-fabrication services S u m m ar y F in a n ci a ls S u m m ar y F in a n ci a ls B u s in es s O ve rv ie w B u s in es s O ve rv ie w Select Products: Select Products: PVC Conduit Steel Conduit Armored Cable K e y P ro d u c ts a n d B ra n d s K e y P ro d u c ts a n d B ra n d s K e y C u s to m e rs K e y C u s to m e rs $1,390 $1,271 $2,233 $3,014 FY 2019 FY 2020 FY 2021 FY 2022 $528 $498 $698 $901 FY 2019 FY 2020 FY 2021 FY 2022 14.7% 13.6% 11.7%20.5% 23.0% 39.1% Net Sales ($M) Adj. EBITDA Margin1 (%) Net Sales ($M) Adj. EBITDA margin1 (%) Electrical Safety & Infrastructure Fiberglass Conduit Metal Framing Cable Tray Prefabricated Devices 42.3% 15.4% HDPE Conduit In-line Galvanized Mechanical Tube 1. See non-GAAP reconciliation in appendix. Key Brands:
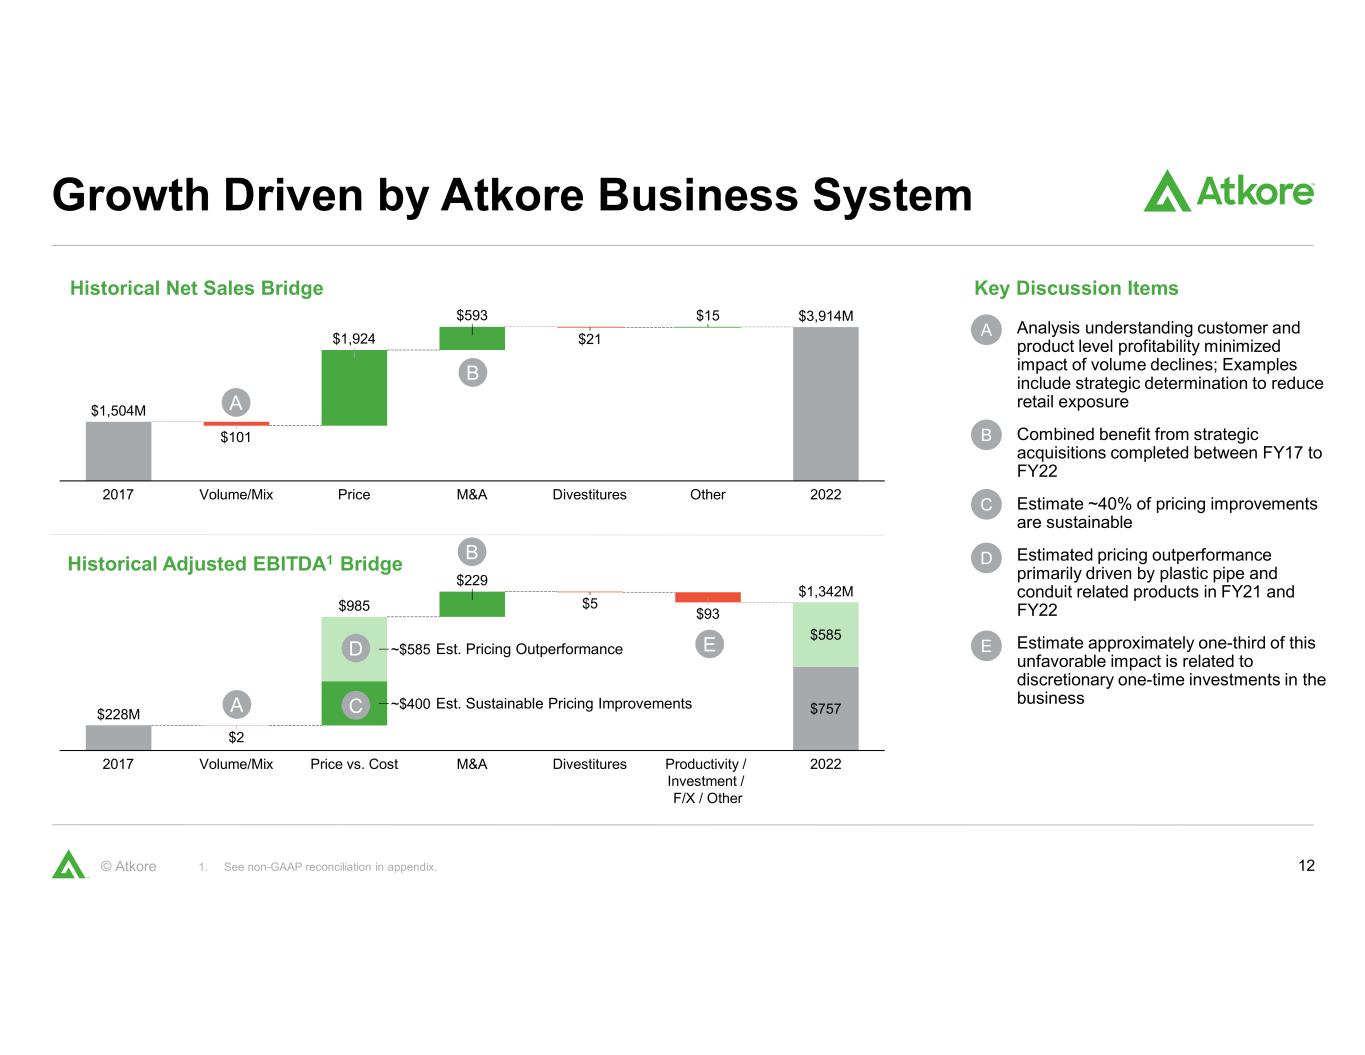
12© Atkore Growth Driven by Atkore Business System 1. See non-GAAP reconciliation in appendix. Historical Adjusted EBITDA1 Bridge Historical Net Sales Bridge $101 $1,924 $593 $21 $15 2017 PriceVolume/Mix $1,504M M&A Divestitures Other 2022 $3,914M $757 $229 $5 $93 $585 2017 Volume/Mix DivestituresPrice vs. Cost $2 M&A Productivity / Investment / F/X / Other 2022 $228M $985 $1,342M ~$400 ~$585 Est. Pricing Outperformance Est. Sustainable Pricing Improvements A B A C E • Analysis understanding customer and product level profitability minimized impact of volume declines; Examples include strategic determination to reduce retail exposure • Combined benefit from strategic acquisitions completed between FY17 to FY22 • Estimate ~40% of pricing improvements are sustainable • Estimated pricing outperformance primarily driven by plastic pipe and conduit related products in FY21 and FY22 • Estimate approximately one-third of this unfavorable impact is related to discretionary one-time investments in the business Key Discussion Items A B C D D E B
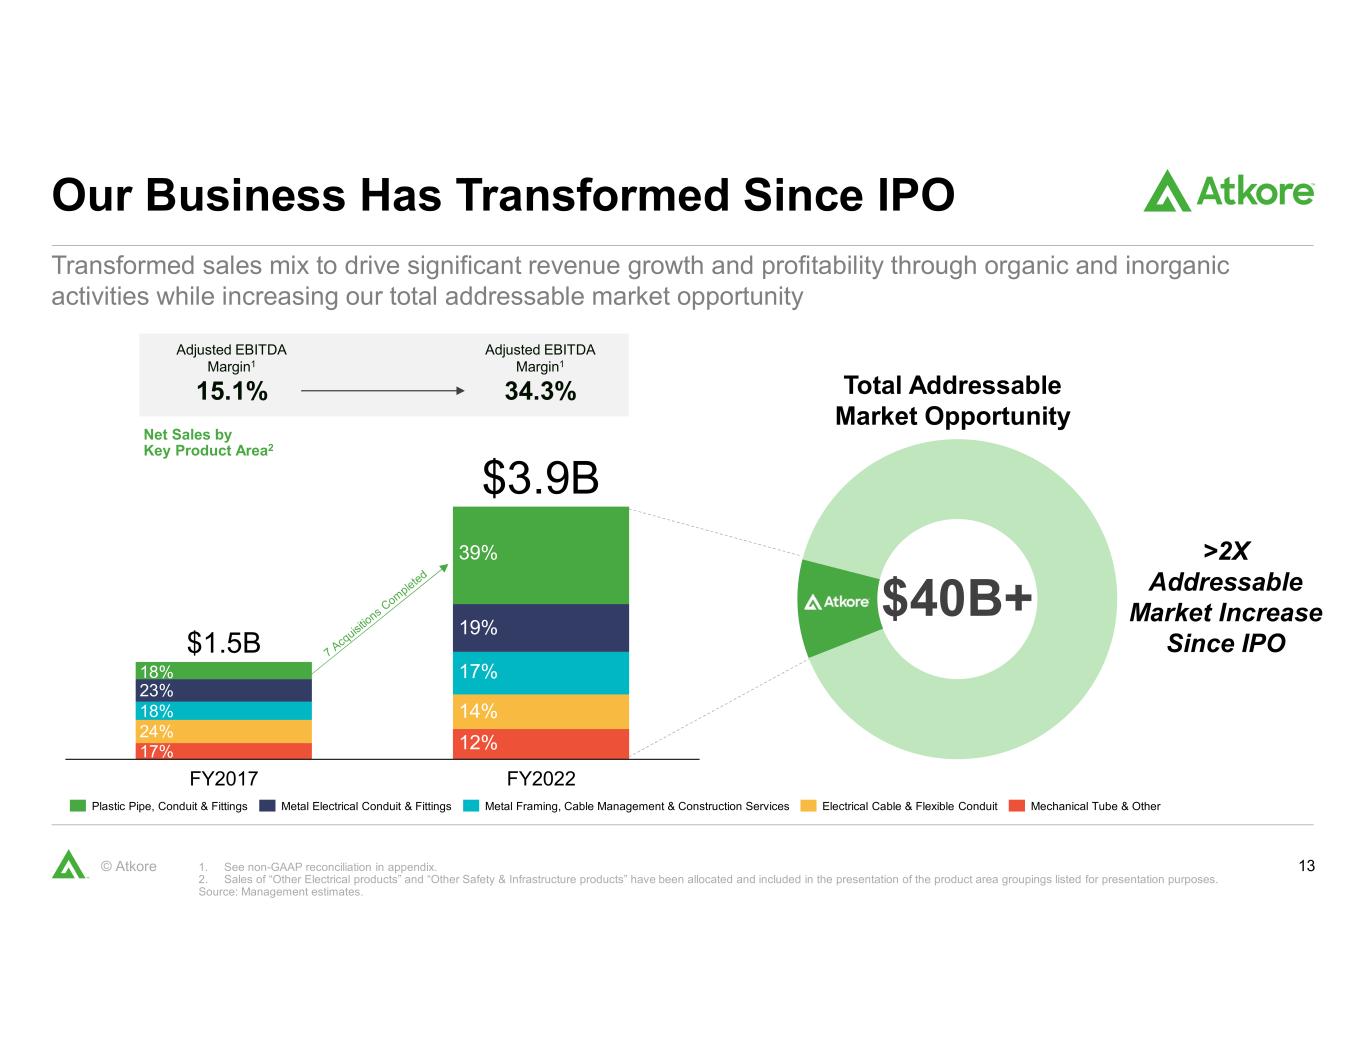
13© Atkore Transformed sales mix to drive significant revenue growth and profitability through organic and inorganic activities while increasing our total addressable market opportunity Our Business Has Transformed Since IPO 1. See non-GAAP reconciliation in appendix. 2. Sales of “Other Electrical products” and “Other Safety & Infrastructure products” have been allocated and included in the presentation of the product area groupings listed for presentation purposes. Source: Management estimates. FY2017 FY2022 $1.5B $3.9B Electrical Cable & Flexible ConduitPlastic Pipe, Conduit & Fittings Mechanical Tube & OtherMetal Electrical Conduit & Fittings Metal Framing, Cable Management & Construction Services Adjusted EBITDA Margin1 34.3% Adjusted EBITDA Margin1 15.1% Net Sales by Key Product Area2 39% 19% 17% 14% 12% 18% 23% 18% 24% 17% $40B+ Total Addressable Market Opportunity >2X Addressable Market Increase Since IPO
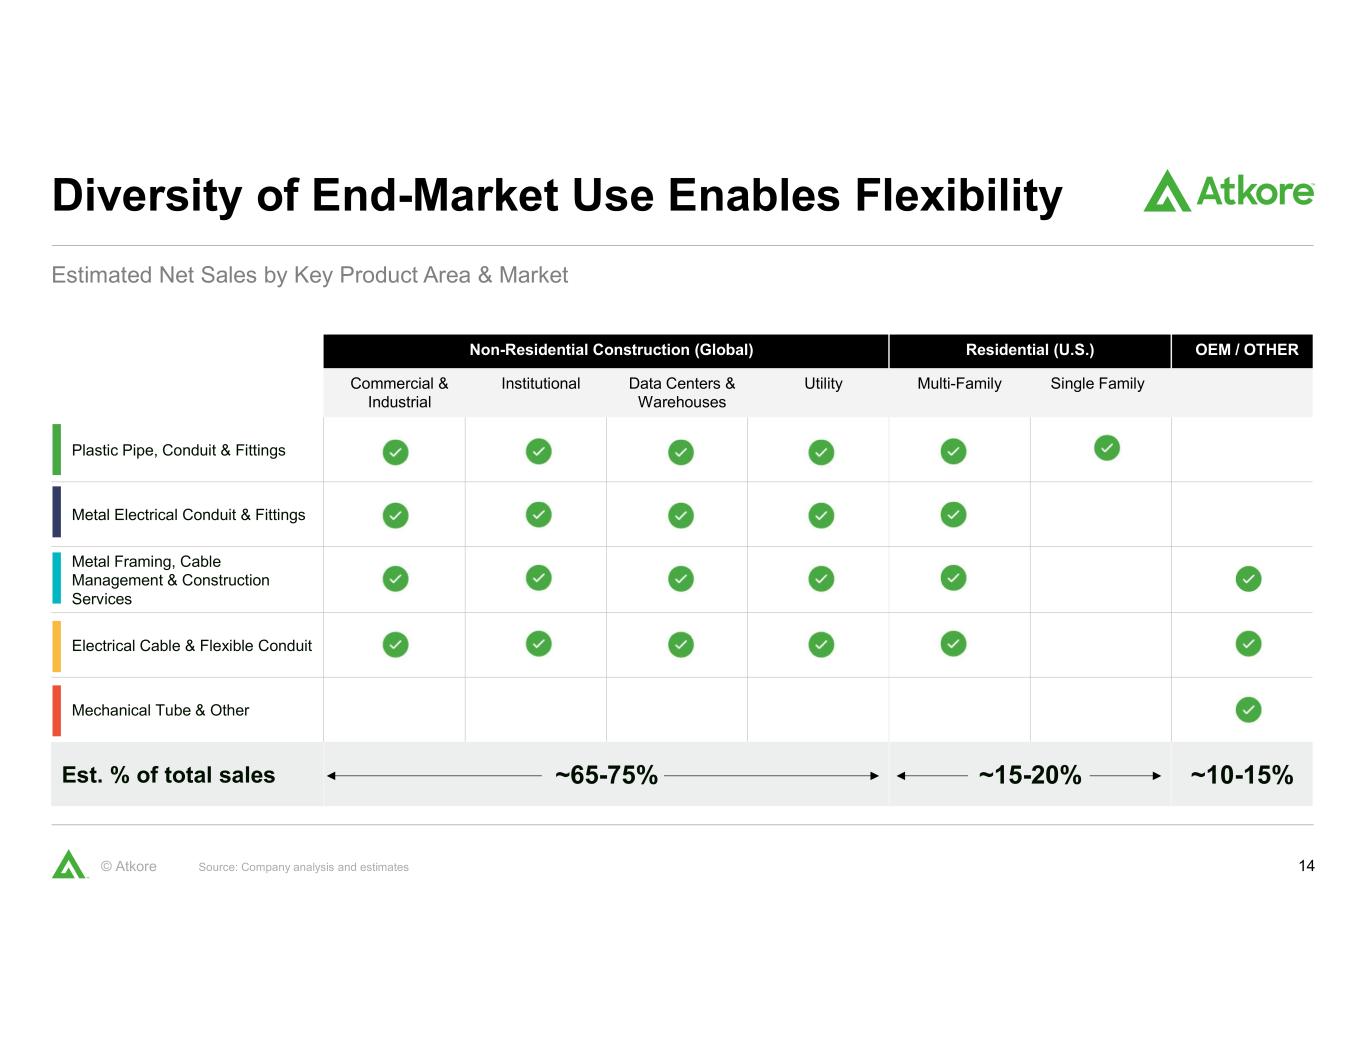
14© Atkore Diversity of End-Market Use Enables Flexibility Non-Residential Construction (Global) Residential (U.S.) OEM / OTHER Commercial & Industrial Institutional Data Centers & Warehouses Utility Multi-Family Single Family Plastic Pipe, Conduit & Fittings Metal Electrical Conduit & Fittings Metal Framing, Cable Management & Construction Services Electrical Cable & Flexible Conduit Mechanical Tube & Other Est. % of total sales ~65-75% ~15-20% ~10-15% Estimated Net Sales by Key Product Area & Market Source: Company analysis and estimates
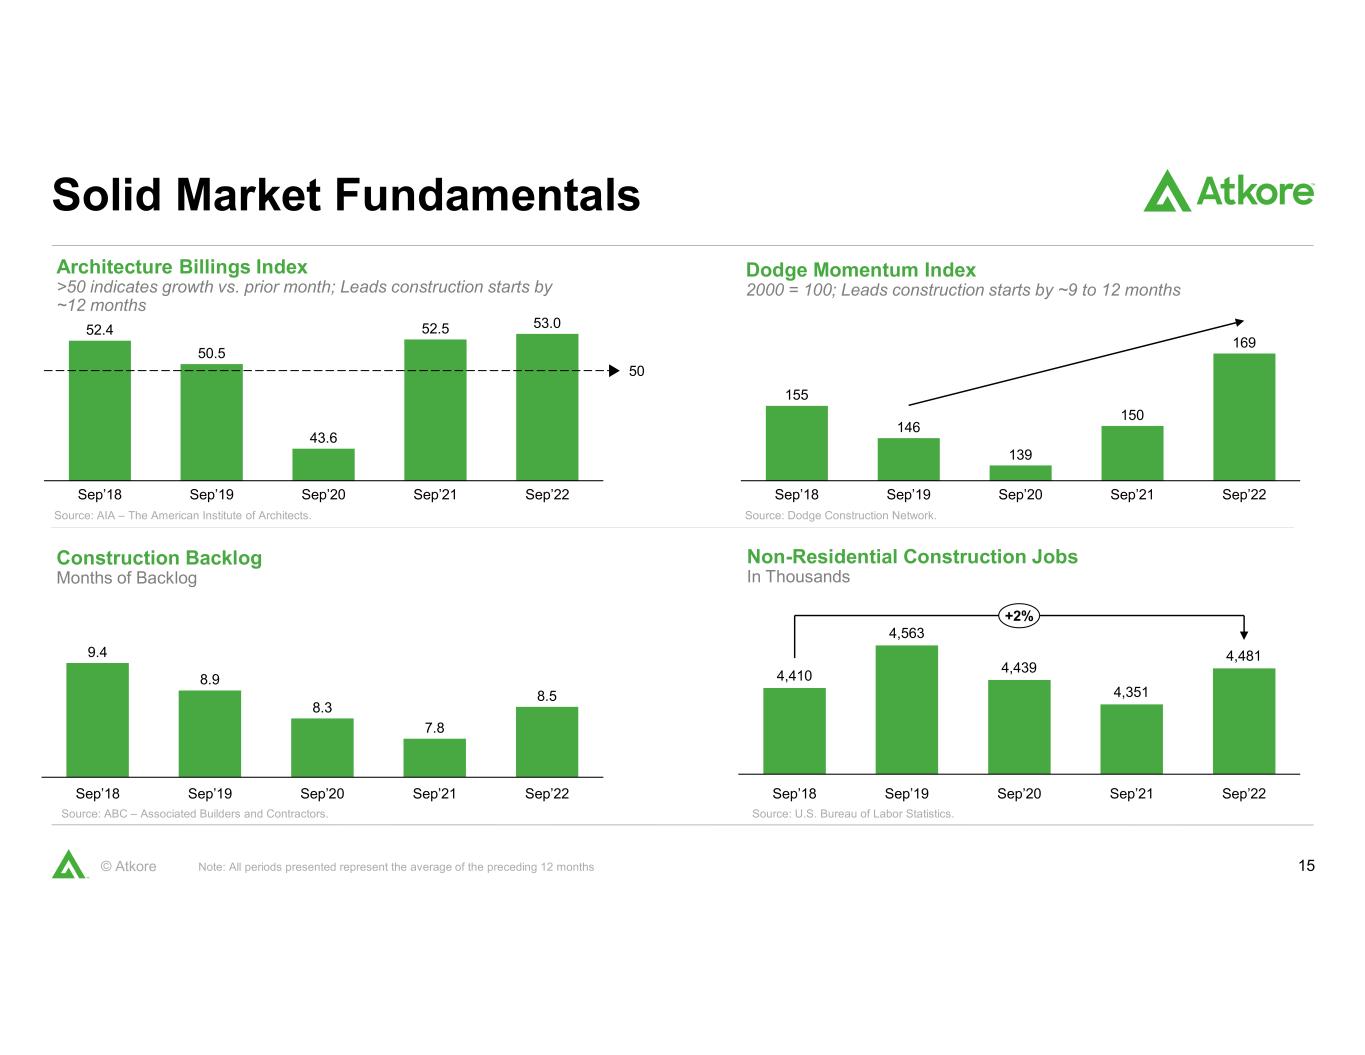
15© Atkore Architecture Billings Index >50 indicates growth vs. prior month; Leads construction starts by ~12 months Dodge Momentum Index 2000 = 100; Leads construction starts by ~9 to 12 months Solid Market Fundamentals Note: All periods presented represent the average of the preceding 12 months Construction Backlog Months of Backlog Non-Residential Construction Jobs In Thousands 52.4 50.5 43.6 52.5 53.0 Sep’22Sep’18 Sep’19 Sep’20 Sep’21 50 9.4 8.9 8.3 7.8 8.5 Sep’18 Sep’19 Sep’20 Sep’21 Sep’22 155 146 139 150 169 Sep’18 Sep’19 Sep’20 Sep’22Sep’21 4,410 4,563 4,439 4,351 4,481 Sep’21Sep’20Sep’18 Sep’19 Sep’22 +2% Source: AIA – The American Institute of Architects. Source: Dodge Construction Network. Source: ABC – Associated Builders and Contractors. Source: U.S. Bureau of Labor Statistics.
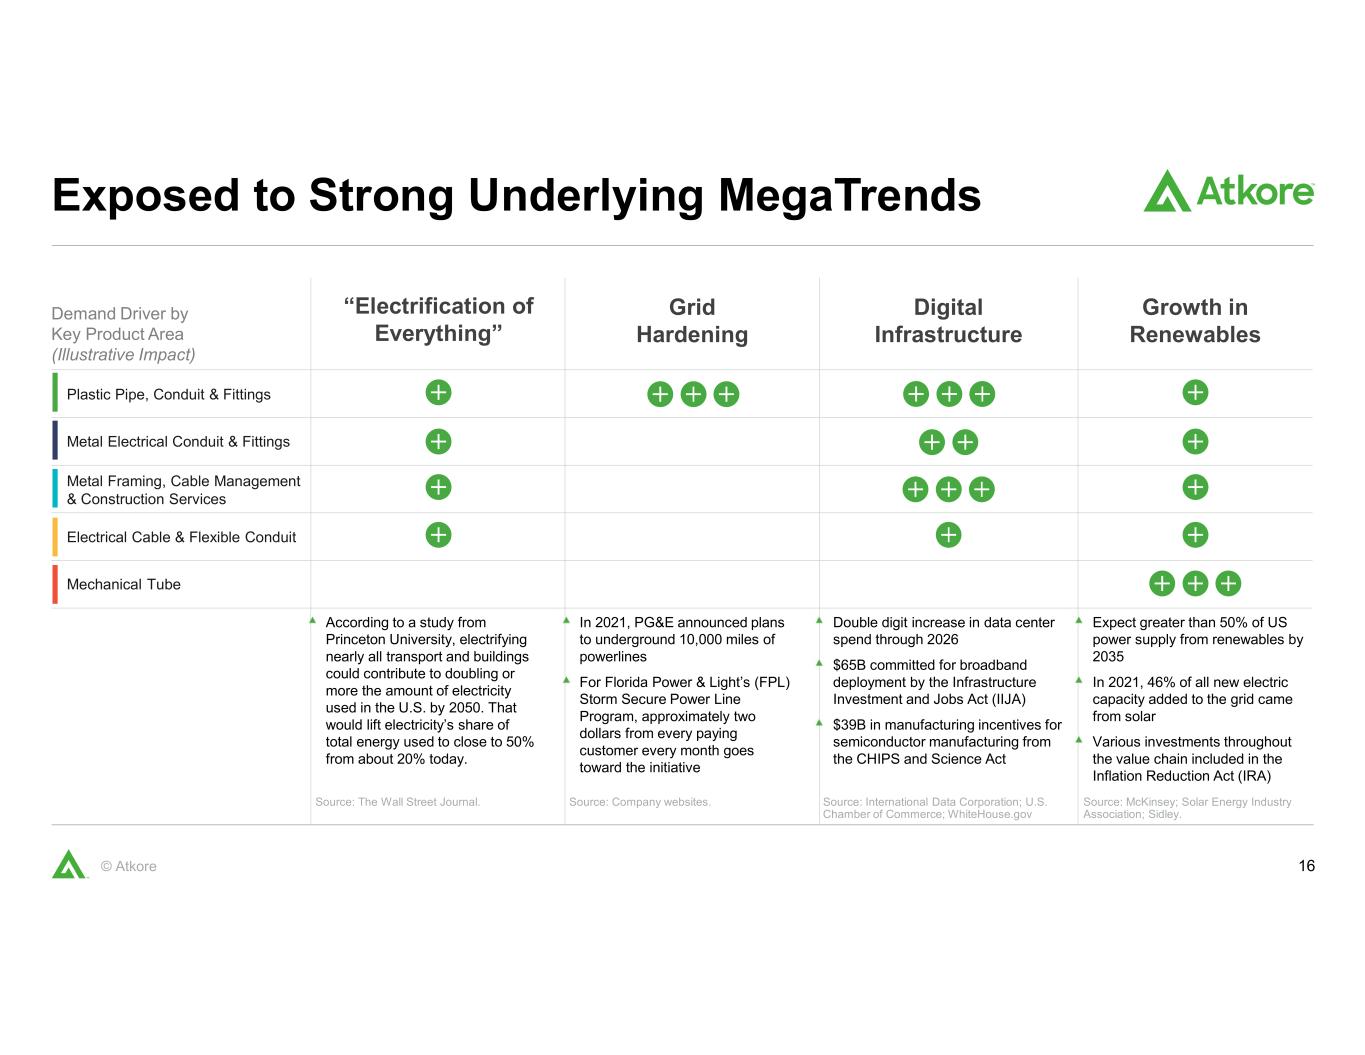
16© Atkore “Electrification of Everything” Growth in Renewables Exposed to Strong Underlying MegaTrends Grid Hardening Digital Infrastructure Plastic Pipe, Conduit & Fittings Demand Driver by Key Product Area (Illustrative Impact) According to a study from Princeton University, electrifying nearly all transport and buildings could contribute to doubling or more the amount of electricity used in the U.S. by 2050. That would lift electricity’s share of total energy used to close to 50% from about 20% today. Expect greater than 50% of US power supply from renewables by 2035 In 2021, 46% of all new electric capacity added to the grid came from solar Various investments throughout the value chain included in the Inflation Reduction Act (IRA) In 2021, PG&E announced plans to underground 10,000 miles of powerlines For Florida Power & Light’s (FPL) Storm Secure Power Line Program, approximately two dollars from every paying customer every month goes toward the initiative Double digit increase in data center spend through 2026 $65B committed for broadband deployment by the Infrastructure Investment and Jobs Act (IIJA) $39B in manufacturing incentives for semiconductor manufacturing from the CHIPS and Science Act Metal Electrical Conduit & Fittings Metal Framing, Cable Management & Construction Services Electrical Cable & Flexible Conduit Mechanical Tube Source: Company websites. Source: The Wall Street Journal. Source: International Data Corporation; U.S. Chamber of Commerce; WhiteHouse.gov Source: McKinsey; Solar Energy Industry Association; Sidley.
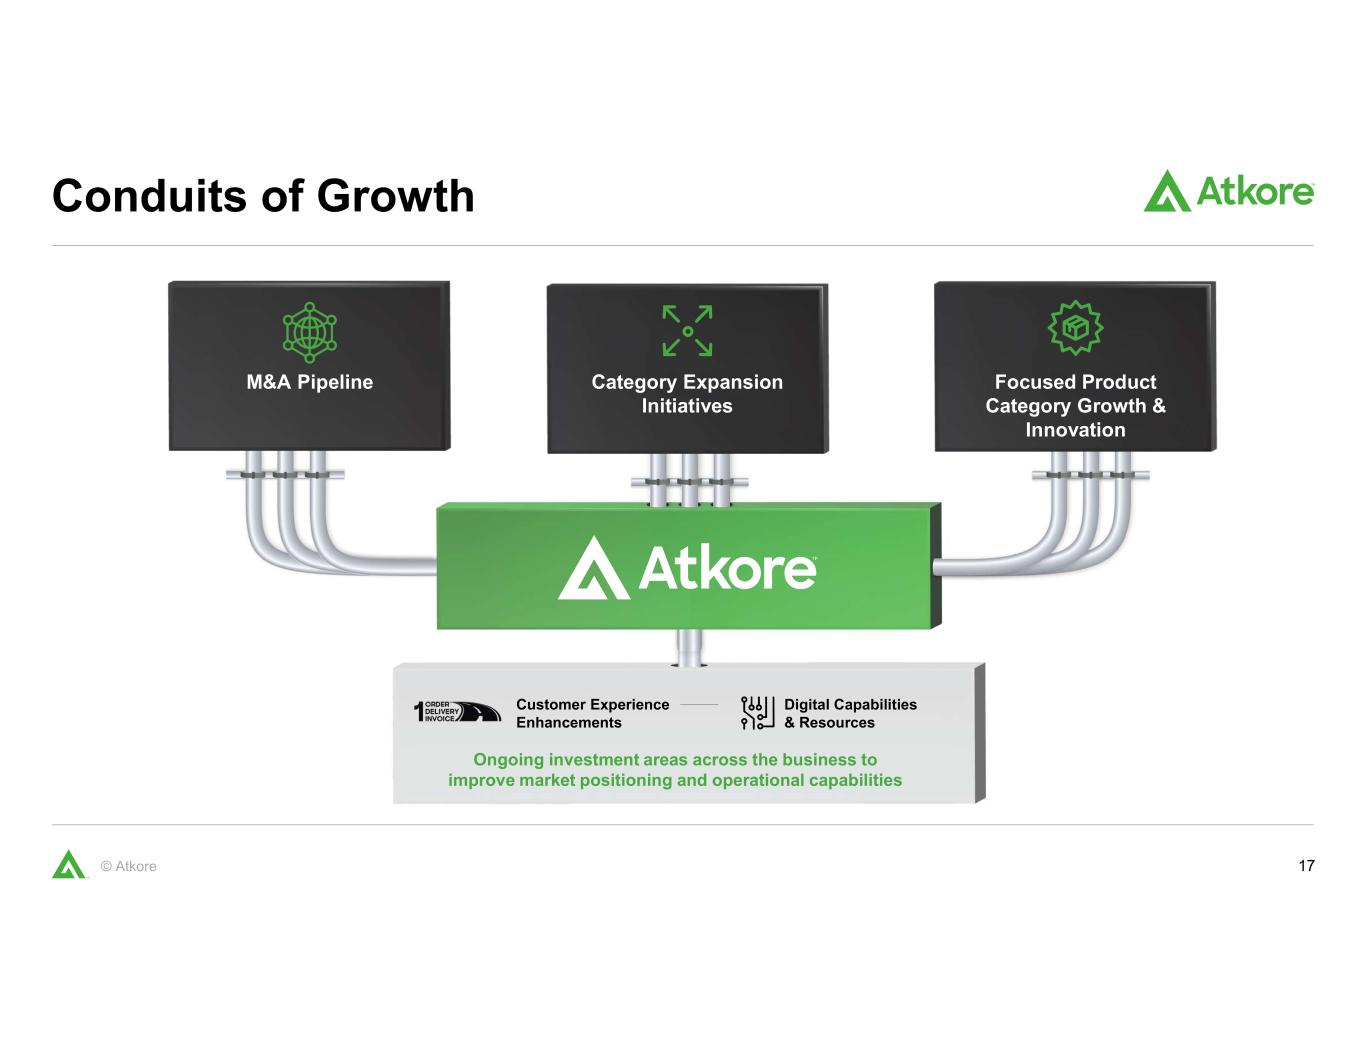
17© Atkore Conduits of Growth Customer Experience Enhancements Digital Capabilities & Resources Ongoing investment areas across the business to improve market positioning and operational capabilities Focused Product Category Growth & Innovation M&A Pipeline Category Expansion Initiatives
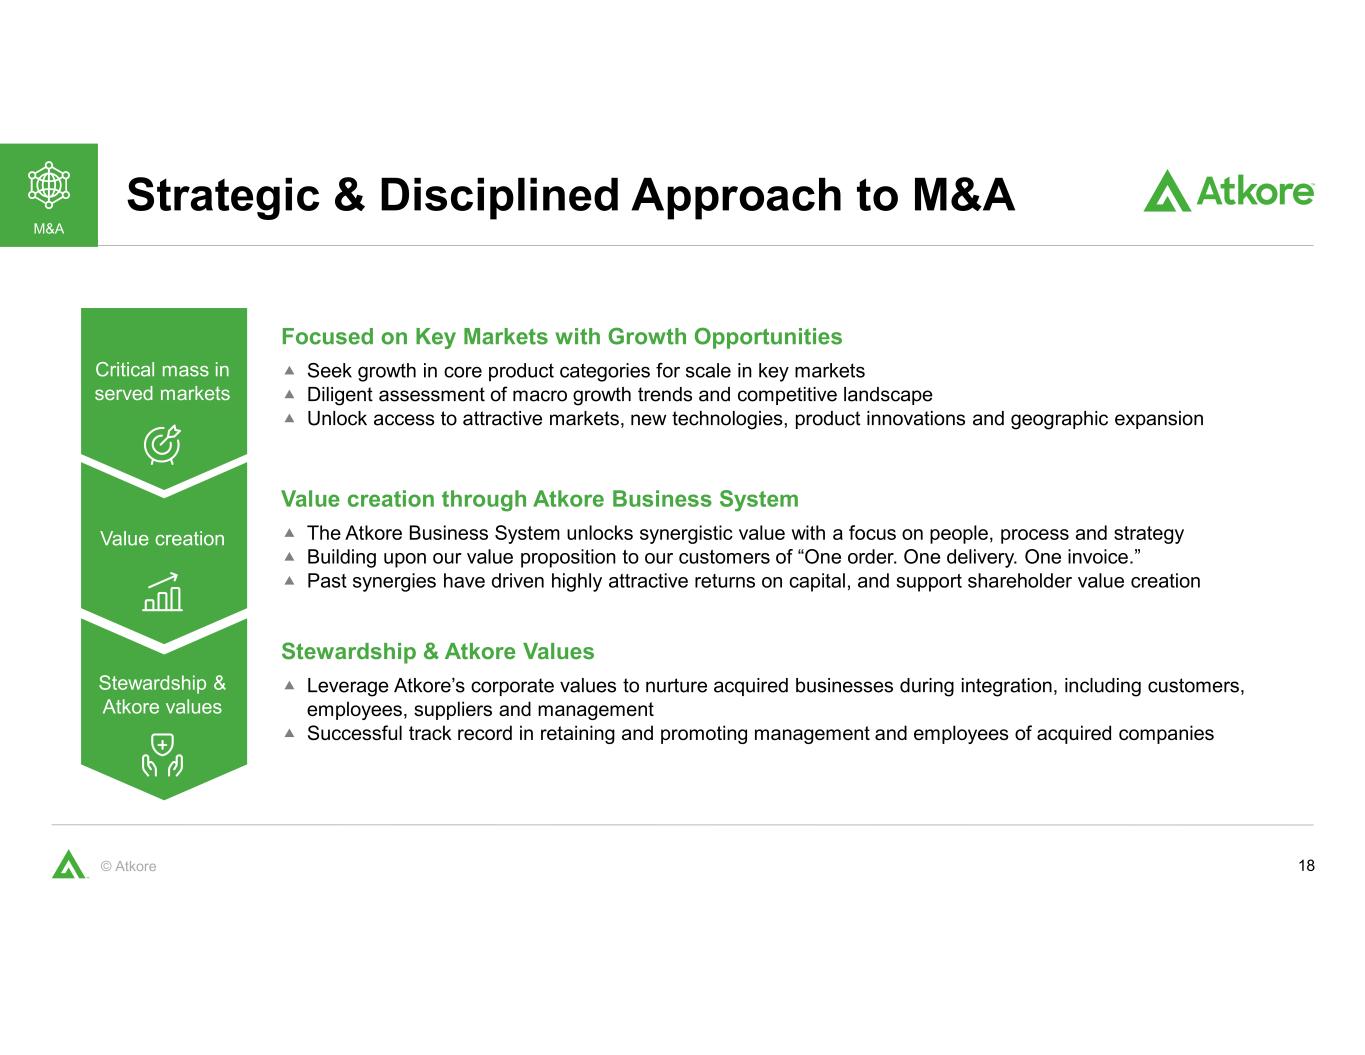
18© Atkore Strategic & Disciplined Approach to M&A Critical mass in served markets Value creation Stewardship & Atkore values Focused on Key Markets with Growth Opportunities Seek growth in core product categories for scale in key markets Diligent assessment of macro growth trends and competitive landscape Unlock access to attractive markets, new technologies, product innovations and geographic expansion Value creation through Atkore Business System The Atkore Business System unlocks synergistic value with a focus on people, process and strategy Building upon our value proposition to our customers of “One order. One delivery. One invoice.” Past synergies have driven highly attractive returns on capital, and support shareholder value creation Stewardship & Atkore Values Leverage Atkore’s corporate values to nurture acquired businesses during integration, including customers, employees, suppliers and management Successful track record in retaining and promoting management and employees of acquired companies M&A
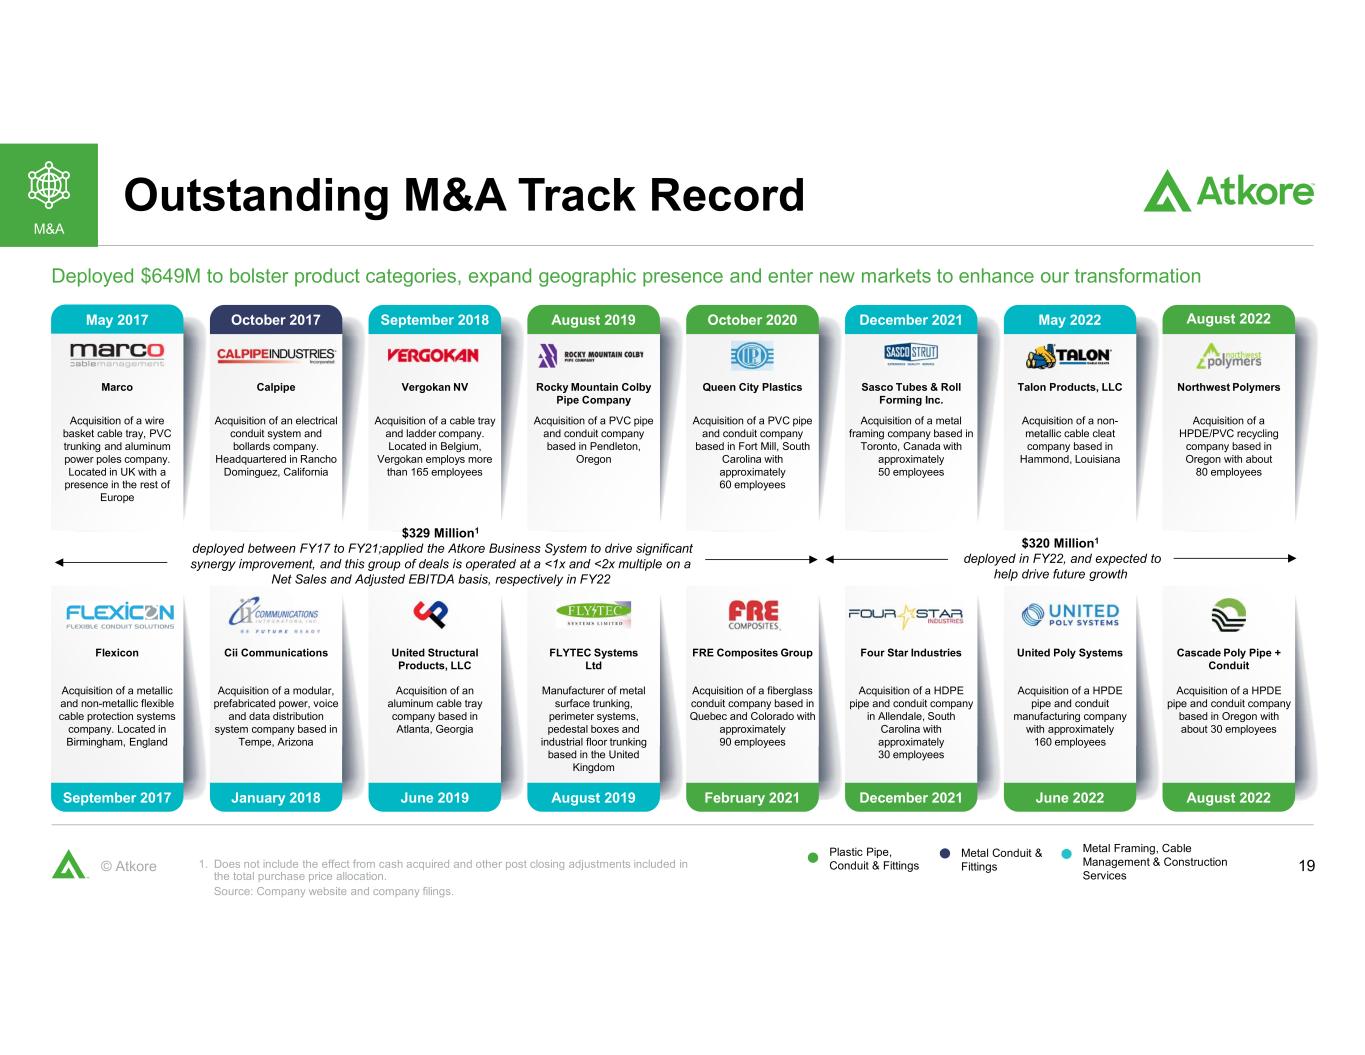
19© Atkore Deployed $649M to bolster product categories, expand geographic presence and enter new markets to enhance our transformation May 2017 August 2022May 2022December 2021October 2020August 2019September 2018 Acquisition of a wire basket cable tray, PVC trunking and aluminum power poles company. Located in UK with a presence in the rest of Europe Marco Acquisition of a HPDE/PVC recycling company based in Oregon with about 80 employees Northwest Polymers Acquisition of a non- metallic cable cleat company based in Hammond, Louisiana Talon Products, LLC Acquisition of a metal framing company based in Toronto, Canada with approximately 50 employees Sasco Tubes & Roll Forming Inc. Acquisition of a PVC pipe and conduit company based in Fort Mill, South Carolina with approximately 60 employees Queen City Plastics Acquisition of a PVC pipe and conduit company based in Pendleton, Oregon Rocky Mountain Colby Pipe Company Acquisition of a cable tray and ladder company. Located in Belgium, Vergokan employs more than 165 employees Vergokan NV Acquisition of an electrical conduit system and bollards company. Headquartered in Rancho Dominguez, California Calpipe September 2017 August 2022June 2022December 2021February 2021August 2019June 2019January 2018 October 2017 Acquisition of a metallic and non-metallic flexible cable protection systems company. Located in Birmingham, England Flexicon Acquisition of a HPDE pipe and conduit company based in Oregon with about 30 employees Cascade Poly Pipe + Conduit Acquisition of a HPDE pipe and conduit manufacturing company with approximately 160 employees United Poly Systems Acquisition of a HDPE pipe and conduit company in Allendale, South Carolina with approximately 30 employees Four Star Industries Acquisition of a fiberglass conduit company based in Quebec and Colorado with approximately 90 employees FRE Composites Group Manufacturer of metal surface trunking, perimeter systems, pedestal boxes and industrial floor trunking based in the United Kingdom FLYTEC Systems Ltd Acquisition of an aluminum cable tray company based in Atlanta, Georgia United Structural Products, LLC Acquisition of a modular, prefabricated power, voice and data distribution system company based in Tempe, Arizona Cii Communications Outstanding M&A Track Record $320 Million1 deployed in FY22, and expected to help drive future growth Plastic Pipe, Conduit & Fittings Metal Conduit & Fittings Metal Framing, Cable Management & Construction Services 1. Does not include the effect from cash acquired and other post closing adjustments included in the total purchase price allocation. Source: Company website and company filings. M&A $329 Million1 deployed between FY17 to FY21;applied the Atkore Business System to drive significant synergy improvement, and this group of deals is operated at a <1x and <2x multiple on a Net Sales and Adjusted EBITDA basis, respectively in FY22
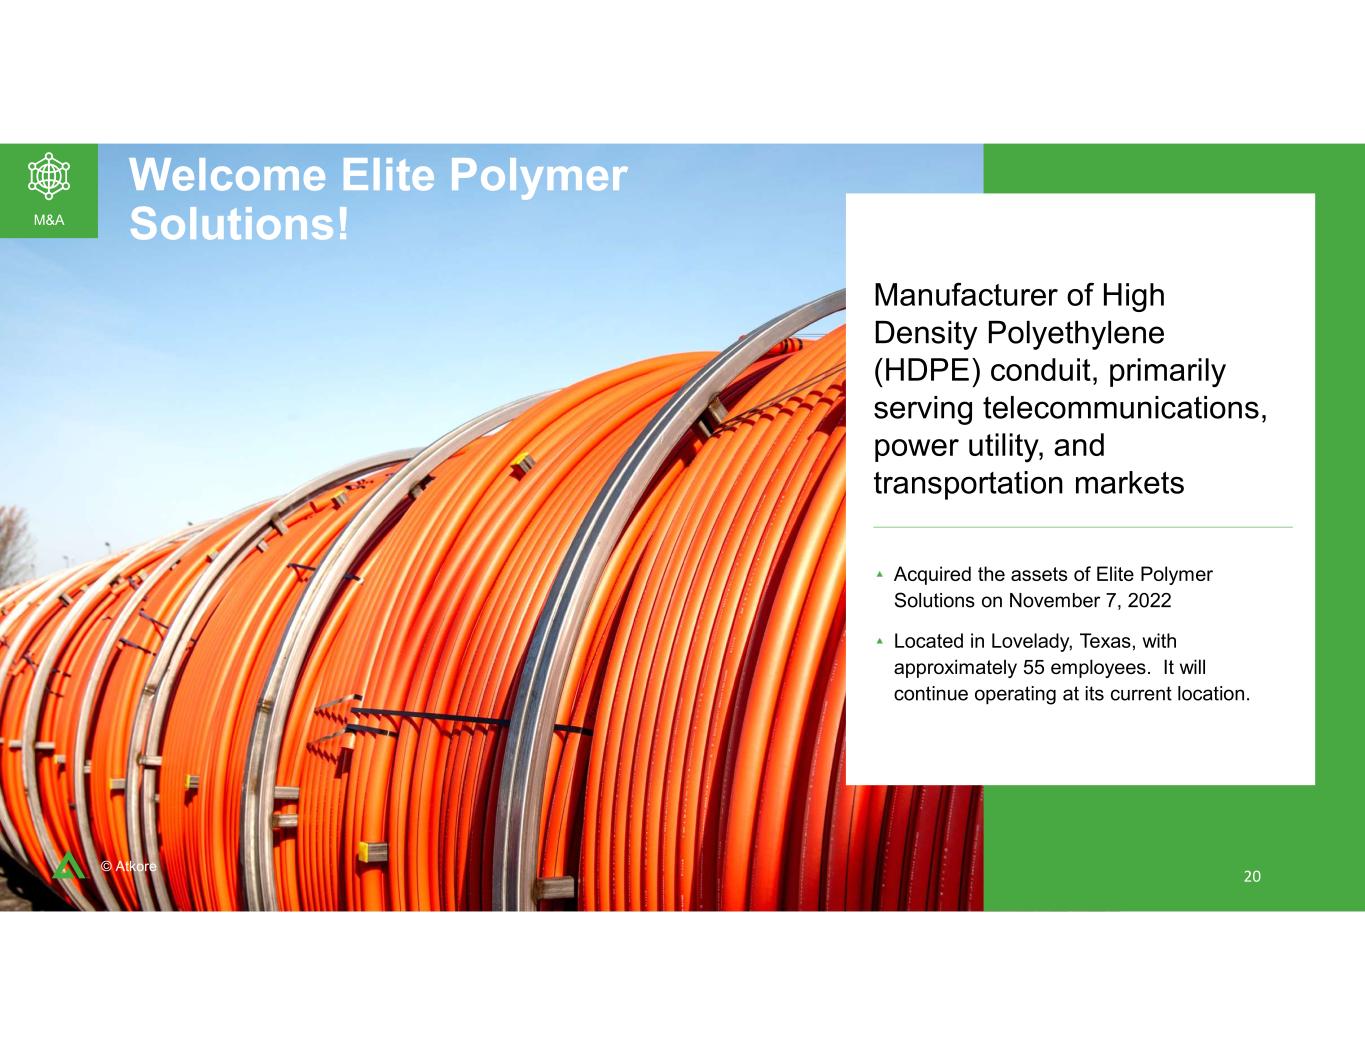
20© Atkore Welcome Elite Polymer Solutions! Manufacturer of High Density Polyethylene (HDPE) conduit, primarily serving telecommunications, power utility, and transportation markets 20 M&A Acquired the assets of Elite Polymer Solutions on November 7, 2022 Located in Lovelady, Texas, with approximately 55 employees. It will continue operating at its current location.
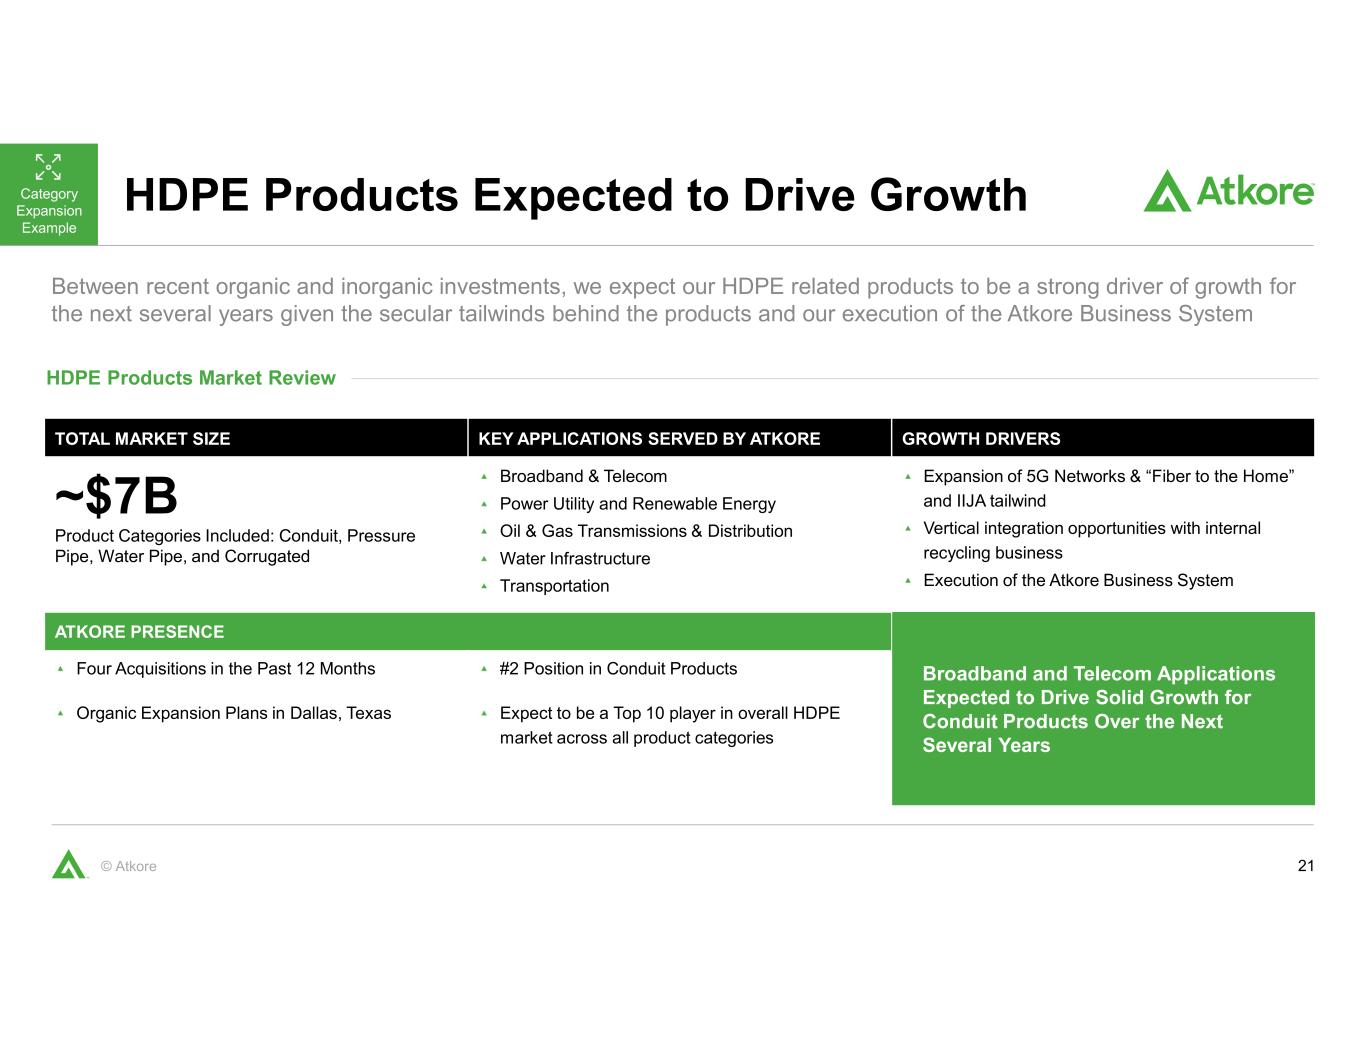
21© Atkore Between recent organic and inorganic investments, we expect our HDPE related products to be a strong driver of growth for the next several years given the secular tailwinds behind the products and our execution of the Atkore Business System HDPE Products Expected to Drive Growth HDPE Products Market Review Category Expansion Example TOTAL MARKET SIZE KEY APPLICATIONS SERVED BY ATKORE GROWTH DRIVERS ~$7B Product Categories Included: Conduit, Pressure Pipe, Water Pipe, and Corrugated Broadband & Telecom Power Utility and Renewable Energy Oil & Gas Transmissions & Distribution Water Infrastructure Transportation Expansion of 5G Networks & “Fiber to the Home” and IIJA tailwind Vertical integration opportunities with internal recycling business Execution of the Atkore Business System ATKORE PRESENCE Broadband and Telecom Applications Expected to Drive Solid Growth for Conduit Products Over the Next Several Years Four Acquisitions in the Past 12 Months Organic Expansion Plans in Dallas, Texas #2 Position in Conduit Products Expect to be a Top 10 player in overall HDPE market across all product categories
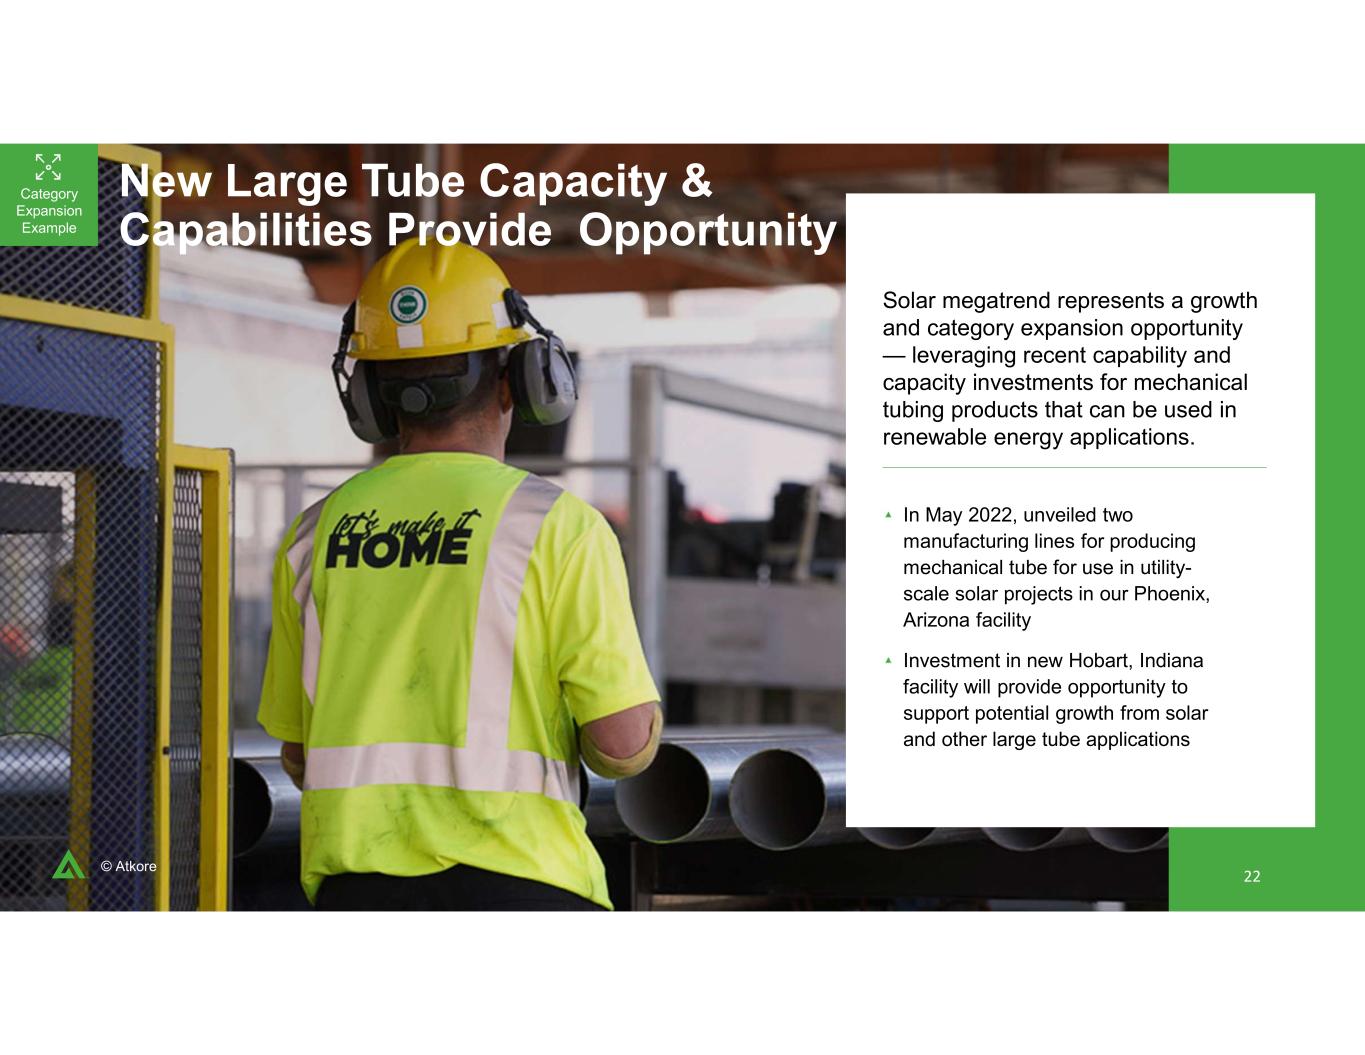
22© Atkore New Large Tube Capacity & Capabilities Provide Opportunity Solar megatrend represents a growth and category expansion opportunity — leveraging recent capability and capacity investments for mechanical tubing products that can be used in renewable energy applications. In May 2022, unveiled two manufacturing lines for producing mechanical tube for use in utility- scale solar projects in our Phoenix, Arizona facility Investment in new Hobart, Indiana facility will provide opportunity to support potential growth from solar and other large tube applications Category Expansion Example 22
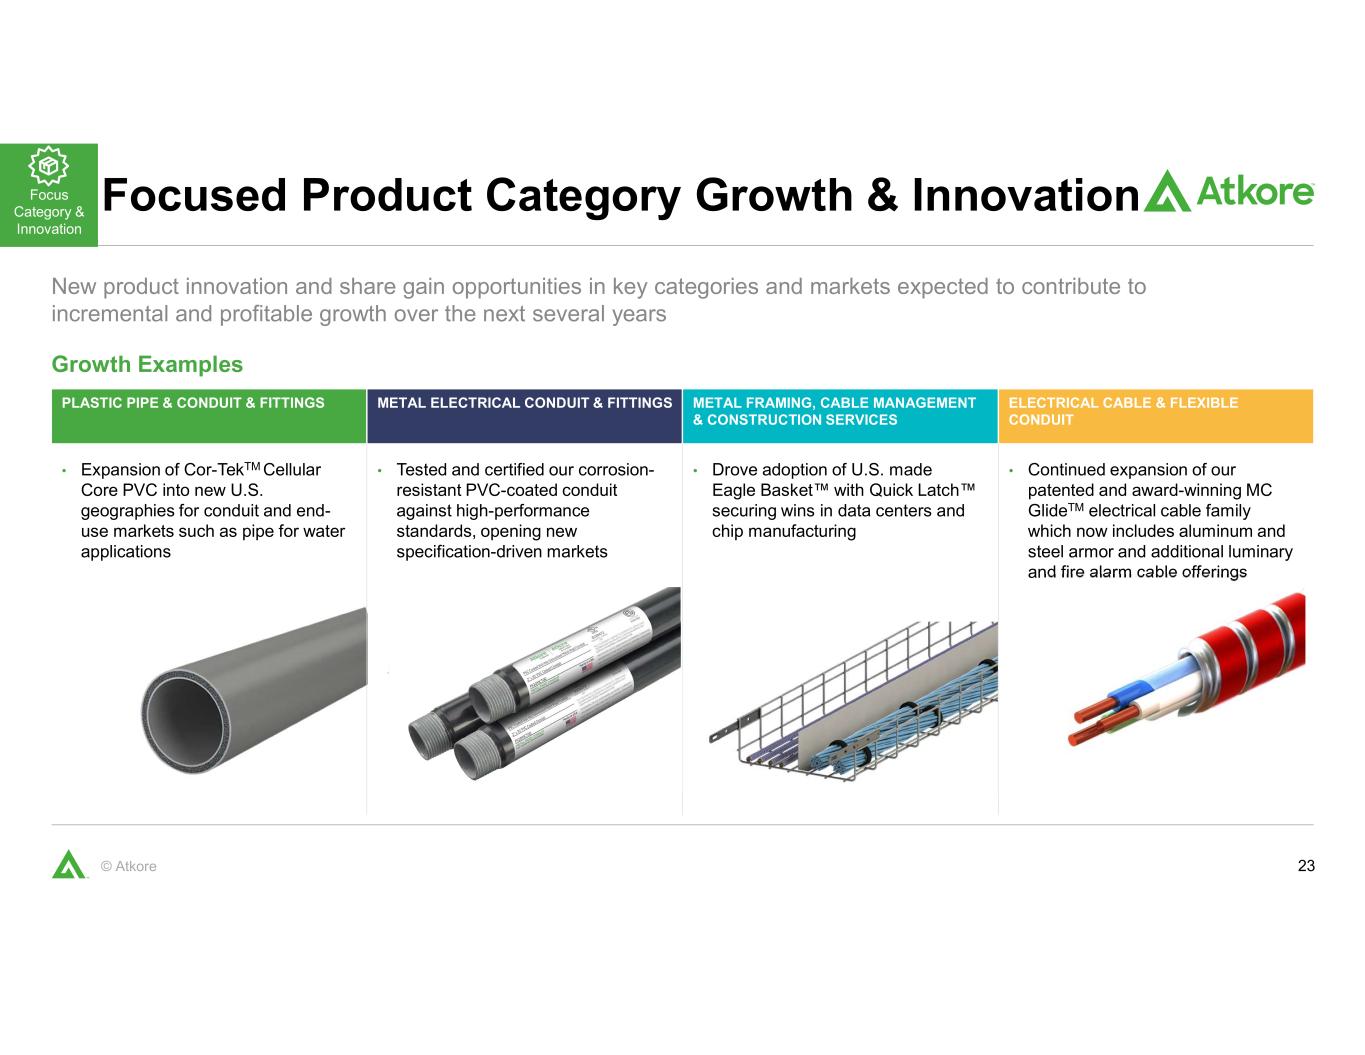
23© Atkore New product innovation and share gain opportunities in key categories and markets expected to contribute to incremental and profitable growth over the next several years Focused Product Category Growth & Innovation Growth Examples PLASTIC PIPE & CONDUIT & FITTINGS METAL ELECTRICAL CONDUIT & FITTINGS METAL FRAMING, CABLE MANAGEMENT & CONSTRUCTION SERVICES ELECTRICAL CABLE & FLEXIBLE CONDUIT • Expansion of Cor-TekTM Cellular Core PVC into new U.S. geographies for conduit and end- use markets such as pipe for water applications • Tested and certified our corrosion- resistant PVC-coated conduit against high-performance standards, opening new specification-driven markets • Drove adoption of U.S. made Eagle Basket™ with Quick Latch™ securing wins in data centers and chip manufacturing • Continued expansion of our patented and award-winning MC GlideTM electrical cable family which now includes aluminum and steel armor and additional luminary and fire alarm cable offerings Focus Category & Innovation
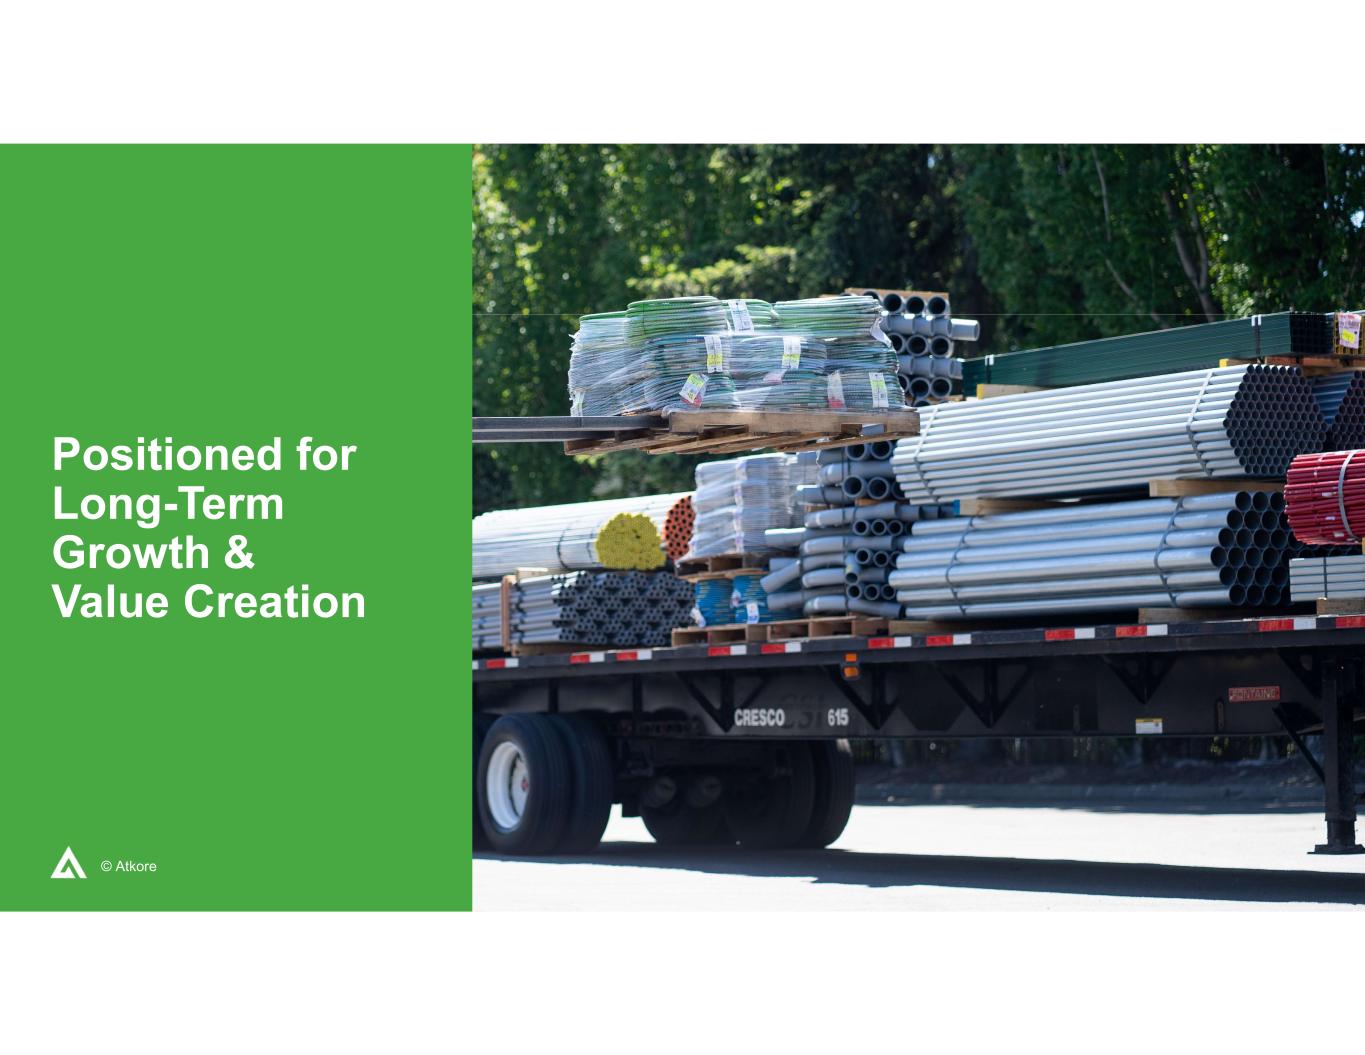
24© Atkore Positioned for Long-Term Growth & Value Creation
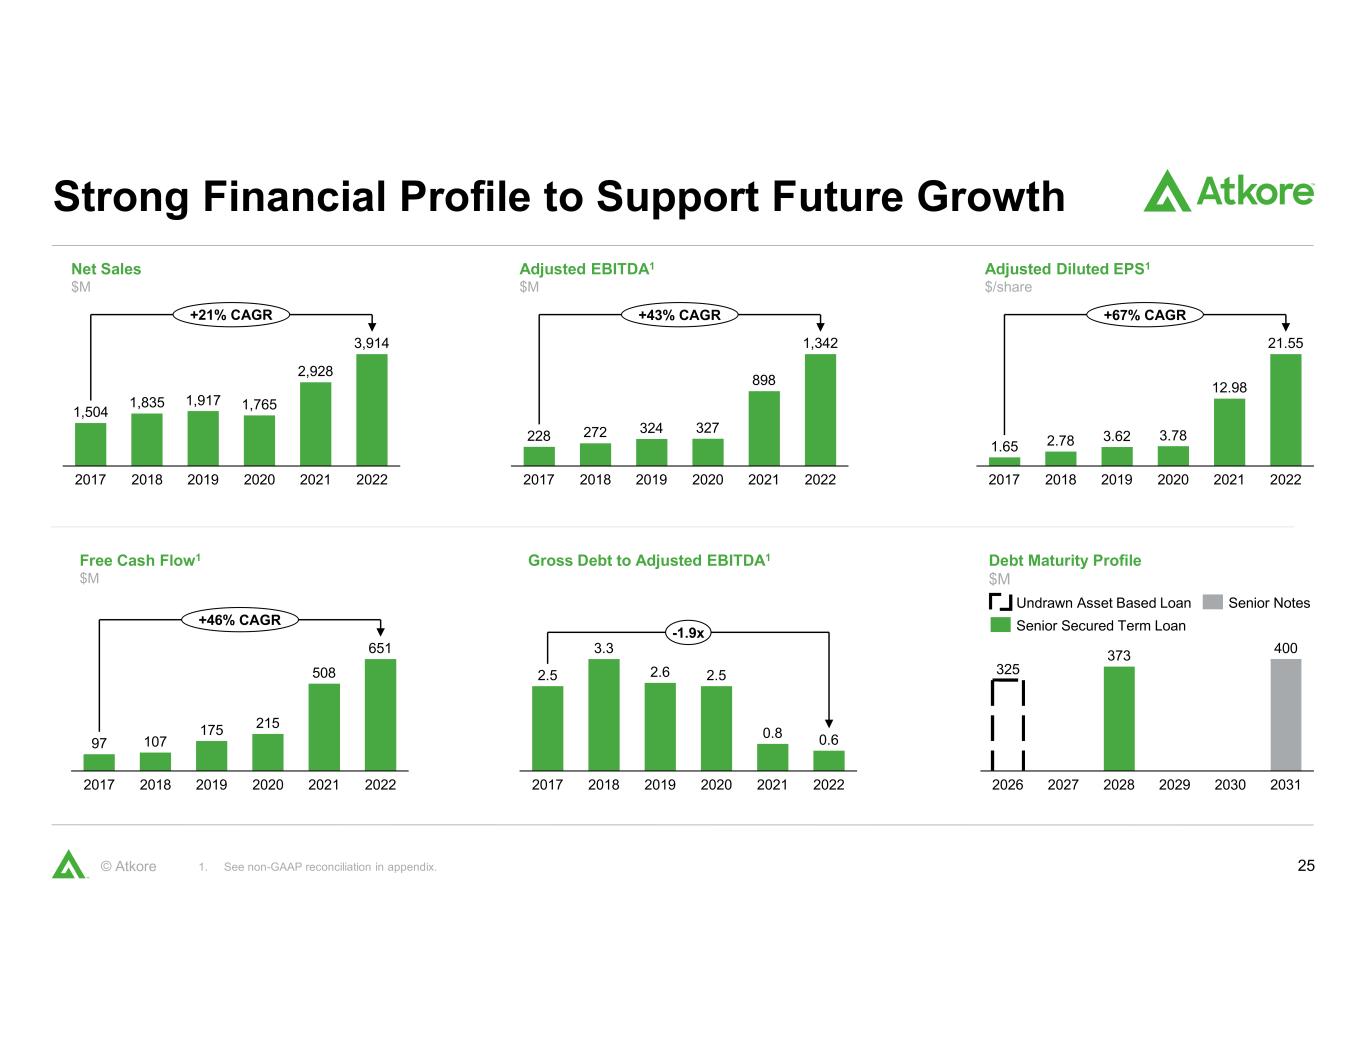
25© Atkore Strong Financial Profile to Support Future Growth 1. See non-GAAP reconciliation in appendix. 1,504 1,835 1,917 1,765 2,928 3,914 20192017 2018 20212020 2022 +21% CAGR Net Sales $M 228 272 324 327 898 1,342 2017 2018 20202019 2021 2022 +43% CAGR Adjusted EBITDA1 $M 1.65 2.78 3.62 3.78 12.98 21.55 202120202017 2018 20222019 +67% CAGR Adjusted Diluted EPS1 $/share 97 107 175 215 508 651 20202017 20212018 20222019 +46% CAGR Free Cash Flow1 $M 2.5 3.3 2.6 2.5 0.8 0.6 201920182017 2020 20222021 -1.9x Gross Debt to Adjusted EBITDA1 325 373 400 2029 20302027 20282026 2031 Debt Maturity Profile $M Senior NotesUndrawn Asset Based Loan Senior Secured Term Loan
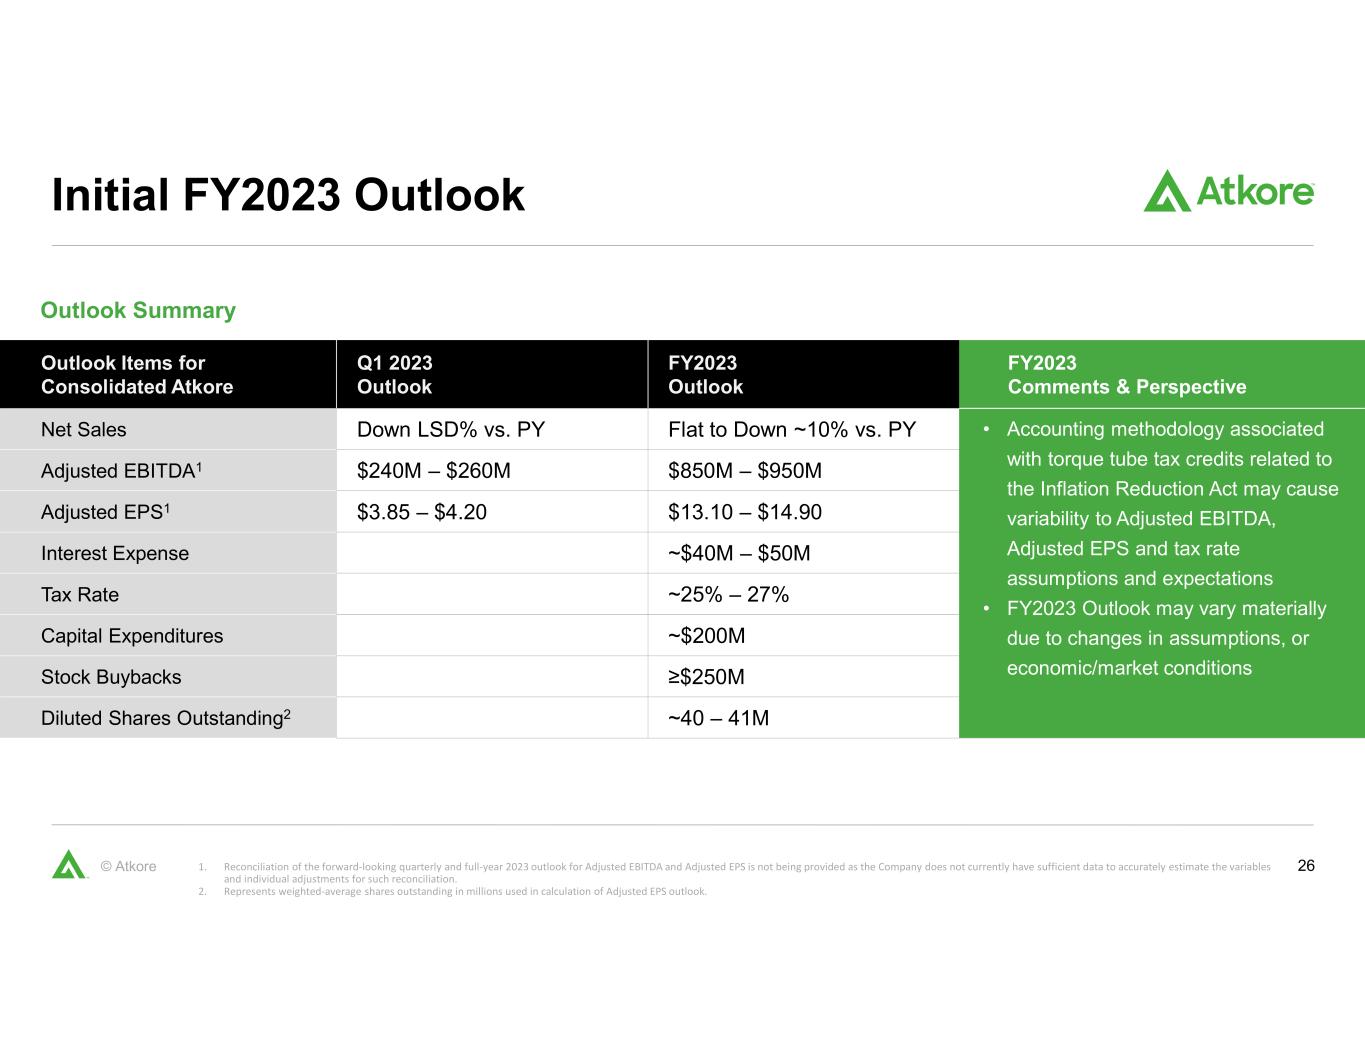
26© Atkore Initial FY2023 Outlook Outlook Summary 1. Reconciliation of the forward-looking quarterly and full-year 2023 outlook for Adjusted EBITDA and Adjusted EPS is not being provided as the Company does not currently have sufficient data to accurately estimate the variables and individual adjustments for such reconciliation. 2. Represents weighted-average shares outstanding in millions used in calculation of Adjusted EPS outlook. Outlook Items for Consolidated Atkore Q1 2023 Outlook FY2023 Outlook FY2023 Comments & Perspective Net Sales Down LSD% vs. PY Flat to Down ~10% vs. PY • Accounting methodology associated with torque tube tax credits related to the Inflation Reduction Act may cause variability to Adjusted EBITDA, Adjusted EPS and tax rate assumptions and expectations • FY2023 Outlook may vary materially due to changes in assumptions, or economic/market conditions Adjusted EBITDA1 $240M – $260M $850M – $950M Adjusted EPS1 $3.85 – $4.20 $13.10 – $14.90 Interest Expense ~$40M – $50M Tax Rate ~25% – 27% Capital Expenditures ~$200M Stock Buybacks ≥$250M Diluted Shares Outstanding2 ~40 – 41M
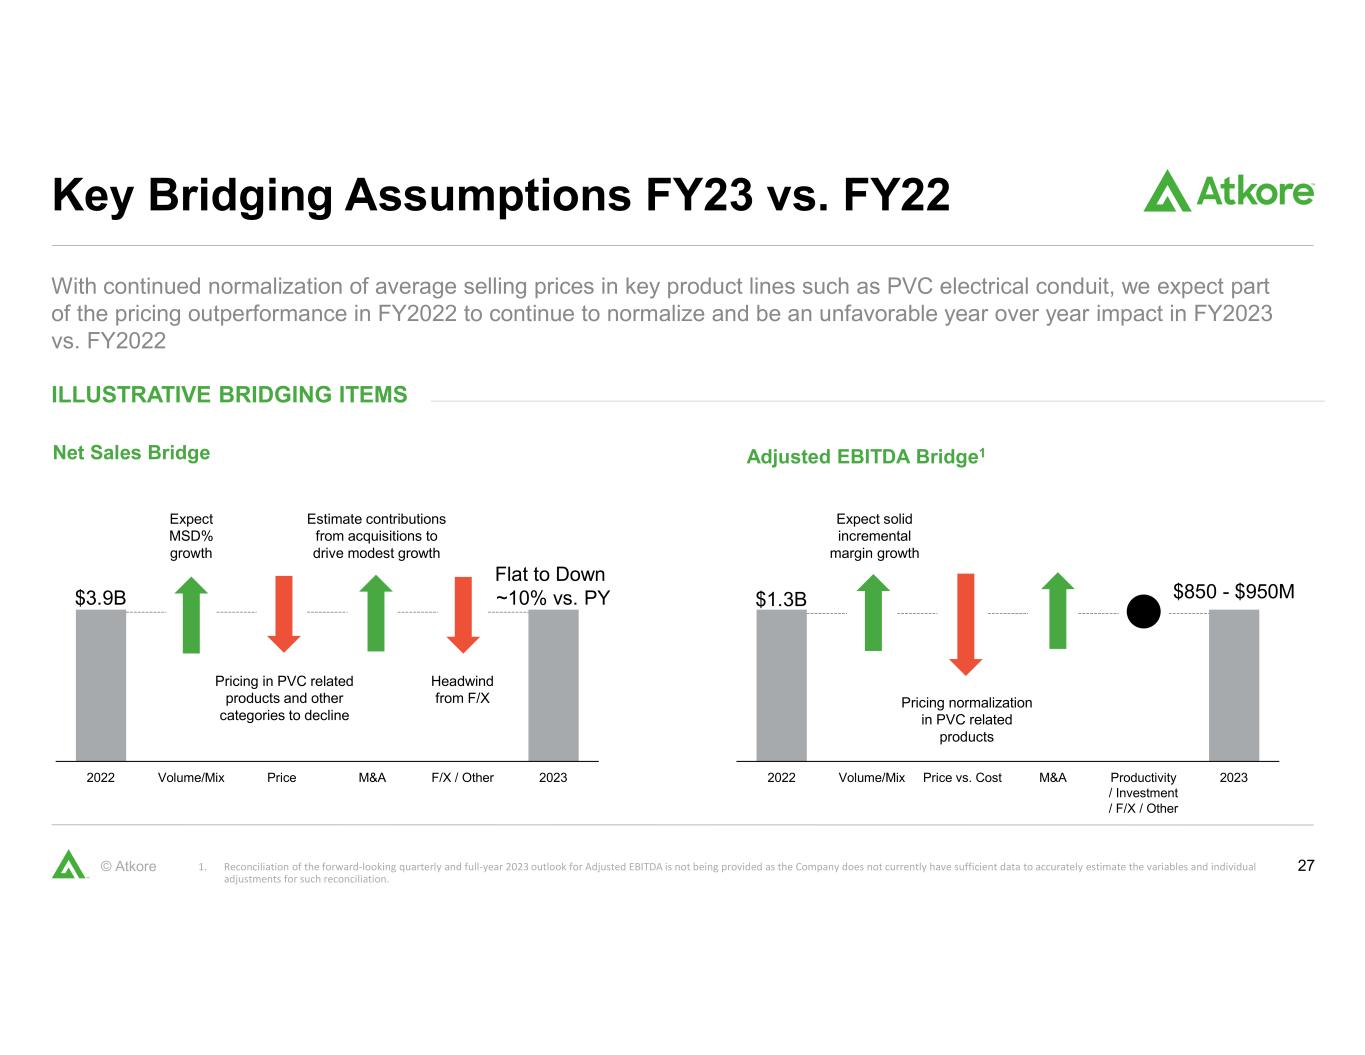
27© Atkore With continued normalization of average selling prices in key product lines such as PVC electrical conduit, we expect part of the pricing outperformance in FY2022 to continue to normalize and be an unfavorable year over year impact in FY2023 vs. FY2022 Key Bridging Assumptions FY23 vs. FY22 ILLUSTRATIVE BRIDGING ITEMS 1. Reconciliation of the forward-looking quarterly and full-year 2023 outlook for Adjusted EBITDA is not being provided as the Company does not currently have sufficient data to accurately estimate the variables and individual adjustments for such reconciliation. 2022 Volume/Mix Price M&A F/X / Other 2023 $3.9B Flat to Down ~10% vs. PY Adjusted EBITDA Bridge1Net Sales Bridge Expect MSD% growth Pricing in PVC related products and other categories to decline Estimate contributions from acquisitions to drive modest growth 2022 $850 - $950M Price vs. CostVolume/Mix 2023M&A Productivity / Investment / F/X / Other $1.3B Headwind from F/X Expect solid incremental margin growth Pricing normalization in PVC related products
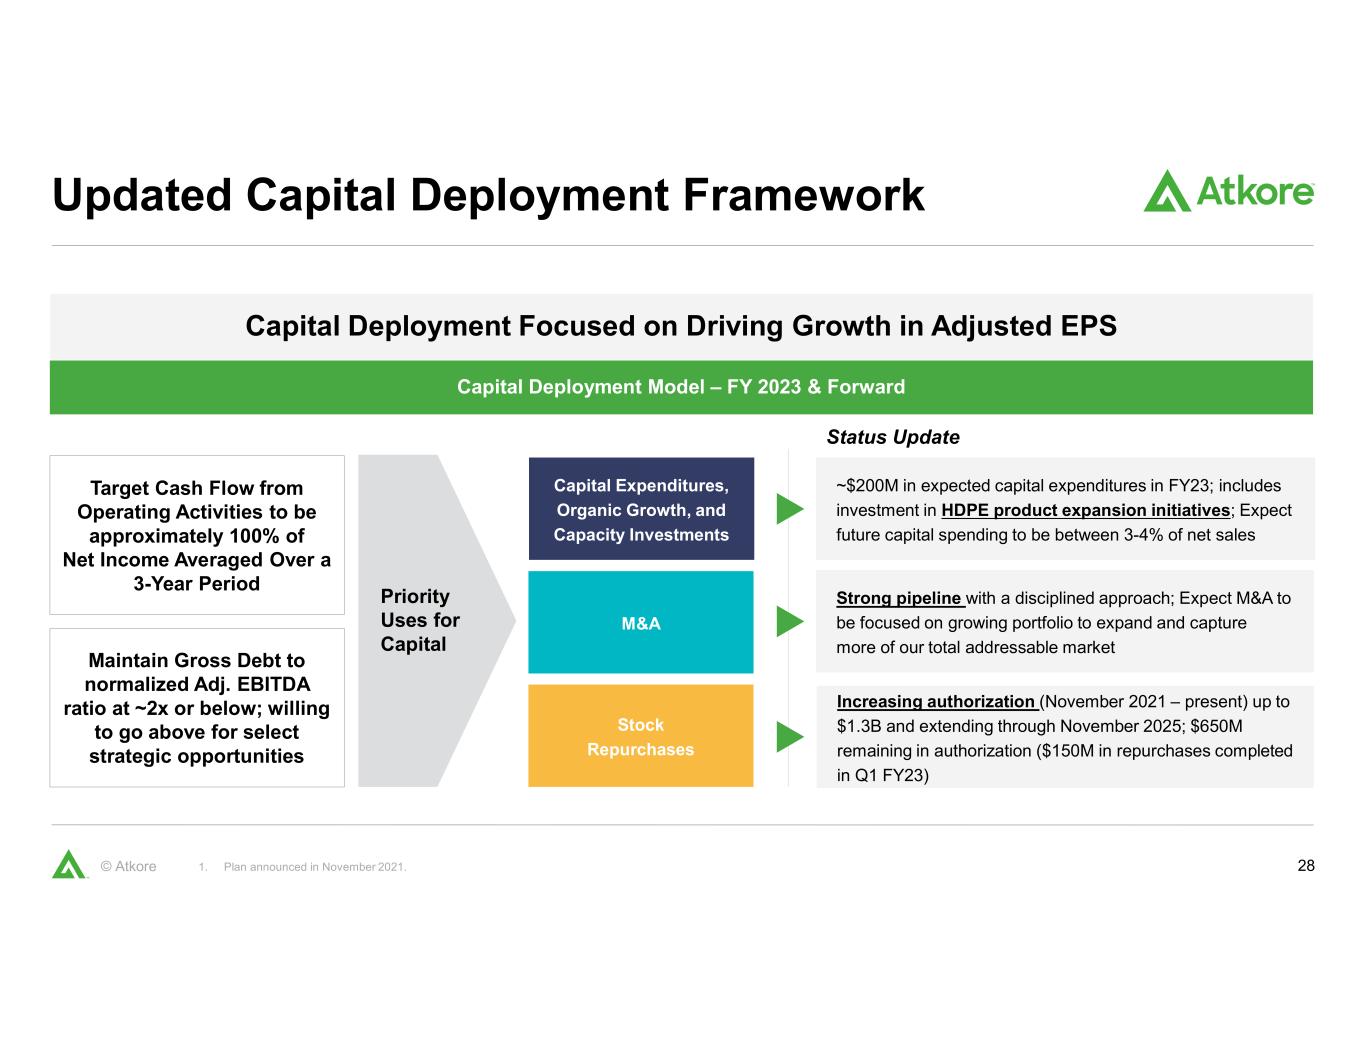
28© Atkore Updated Capital Deployment Framework 1. Plan announced in November 2021. Capital Deployment Focused on Driving Growth in Adjusted EPS Capital Deployment Model – FY 2023 & Forward Capital Expenditures, Organic Growth, and Capacity Investments M&A Stock Repurchases Priority Uses for Capital Maintain Gross Debt to normalized Adj. EBITDA ratio at ~2x or below; willing to go above for select strategic opportunities ~$200M in expected capital expenditures in FY23; includes investment in HDPE product expansion initiatives; Expect future capital spending to be between 3-4% of net sales Strong pipeline with a disciplined approach; Expect M&A to be focused on growing portfolio to expand and capture more of our total addressable market Increasing authorization (November 2021 – present) up to $1.3B and extending through November 2025; $650M remaining in authorization ($150M in repurchases completed in Q1 FY23) Target Cash Flow from Operating Activities to be approximately 100% of Net Income Averaged Over a 3-Year Period Status Update
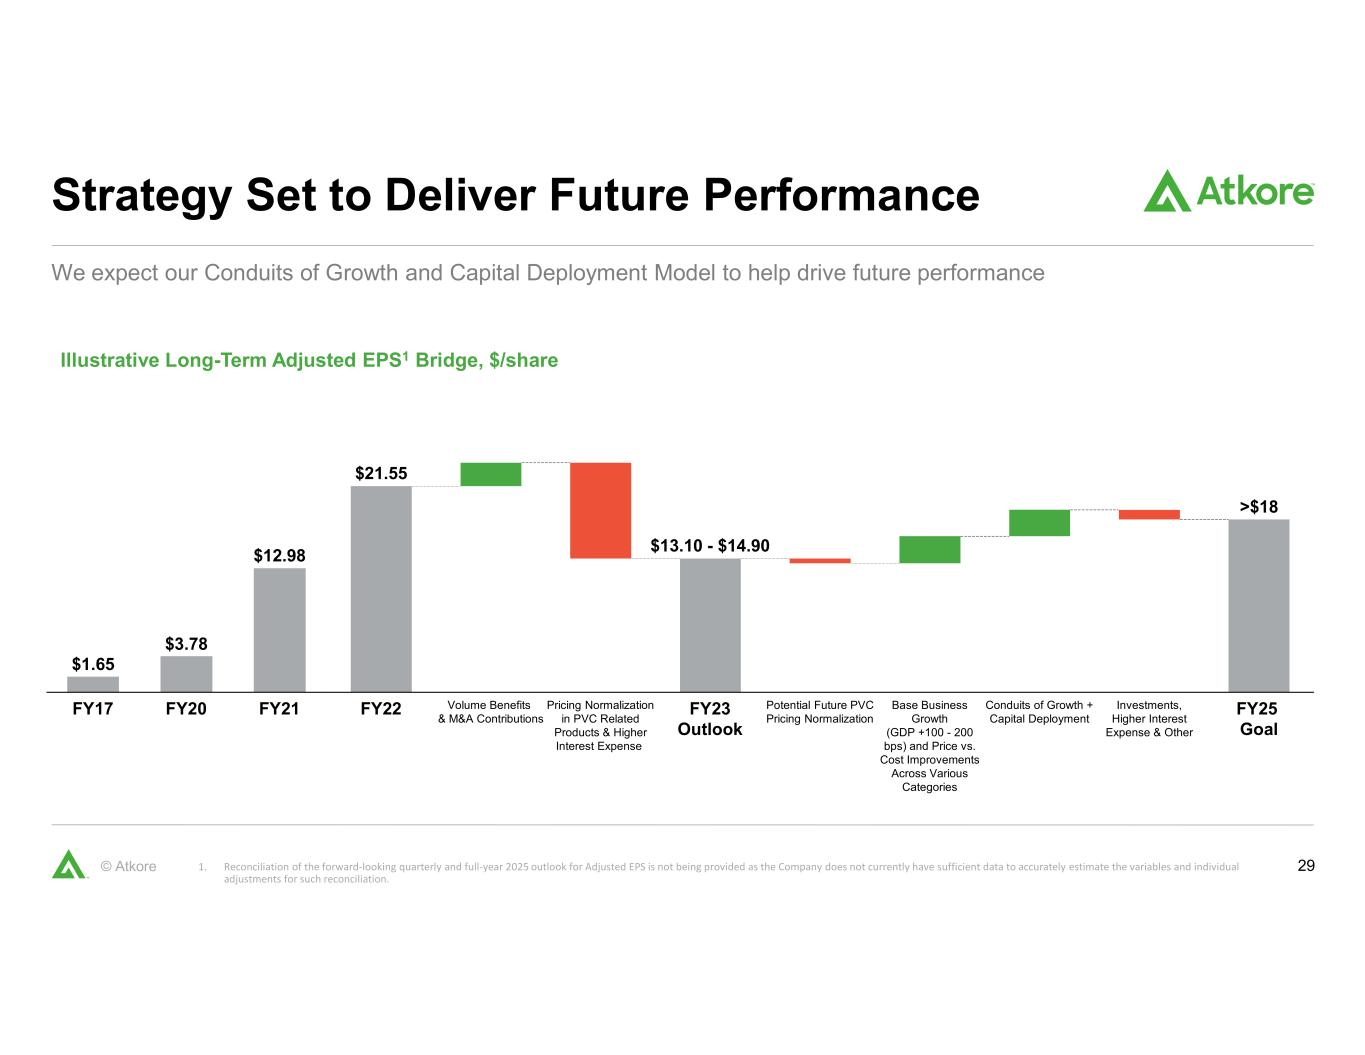
29© Atkore We expect our Conduits of Growth and Capital Deployment Model to help drive future performance Strategy Set to Deliver Future Performance Illustrative Long-Term Adjusted EPS1 Bridge, $/share 1. Reconciliation of the forward-looking quarterly and full-year 2025 outlook for Adjusted EPS is not being provided as the Company does not currently have sufficient data to accurately estimate the variables and individual adjustments for such reconciliation. $21.55 Base Business Growth (GDP +100 - 200 bps) and Price vs. Cost Improvements Across Various Categories Potential Future PVC Pricing Normalization FY22 Volume Benefits & M&A Contributions Conduits of Growth + Capital Deployment Pricing Normalization in PVC Related Products & Higher Interest Expense FY23 Outlook Investments, Higher Interest Expense & Other FY25 Goal $13.10 - $14.90 >$18 $1.65 $3.78 $12.98 FY17 FY20 FY21
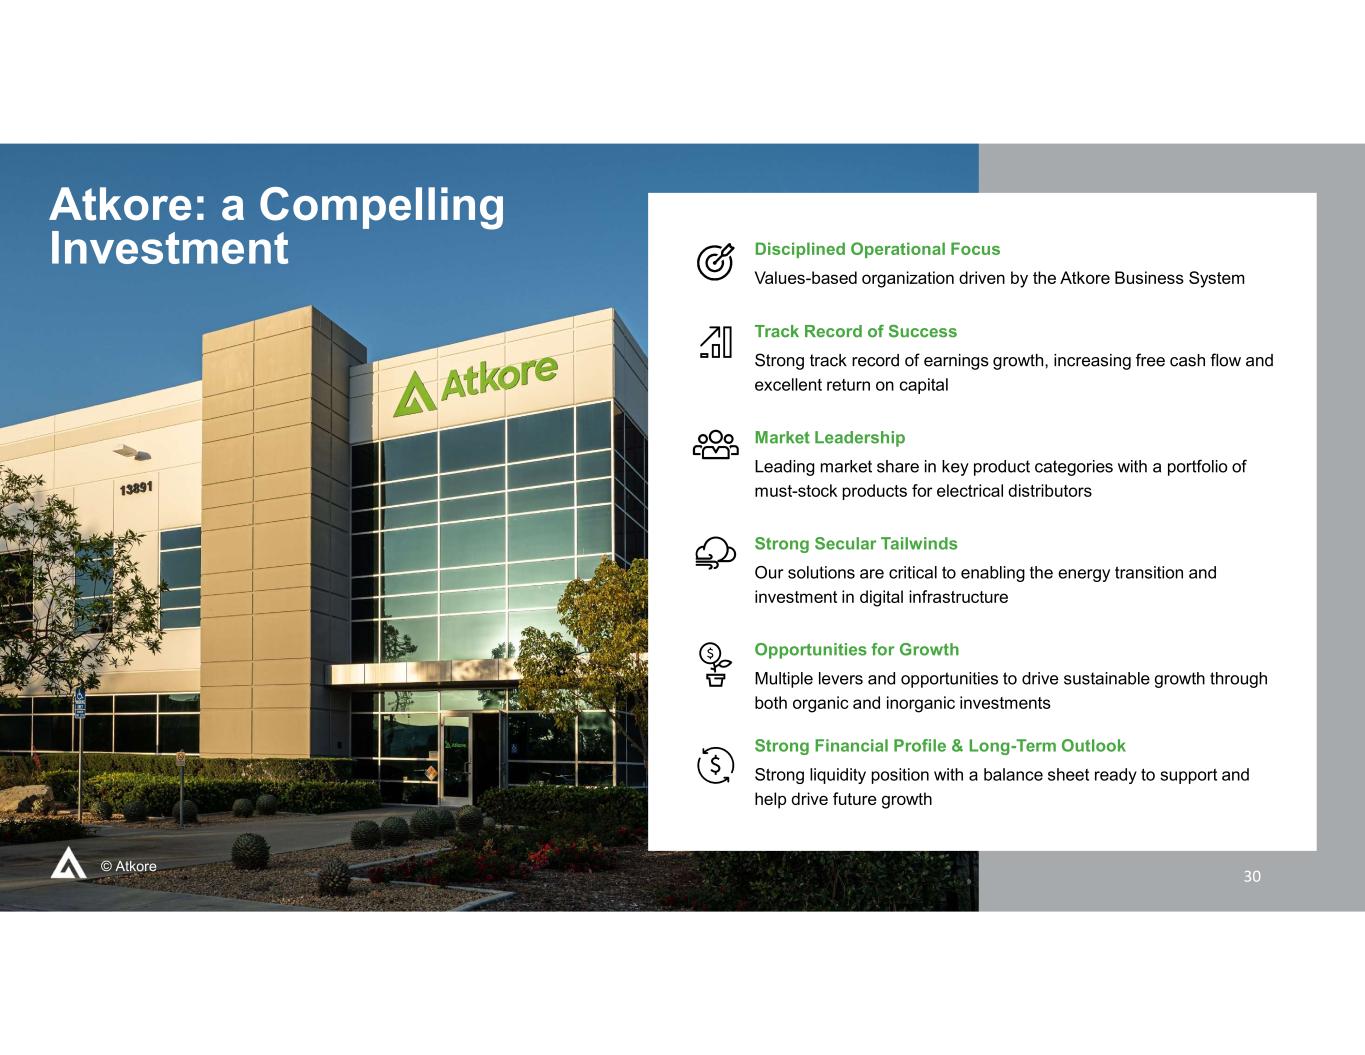
30© Atkore Atkore: a Compelling Investment Disciplined Operational Focus Values-based organization driven by the Atkore Business System Track Record of Success Strong track record of earnings growth, increasing free cash flow and excellent return on capital Market Leadership Leading market share in key product categories with a portfolio of must-stock products for electrical distributors Strong Secular Tailwinds Our solutions are critical to enabling the energy transition and investment in digital infrastructure Opportunities for Growth Multiple levers and opportunities to drive sustainable growth through both organic and inorganic investments Strong Financial Profile & Long-Term Outlook Strong liquidity position with a balance sheet ready to support and help drive future growth 30
31© Atkore Appendix
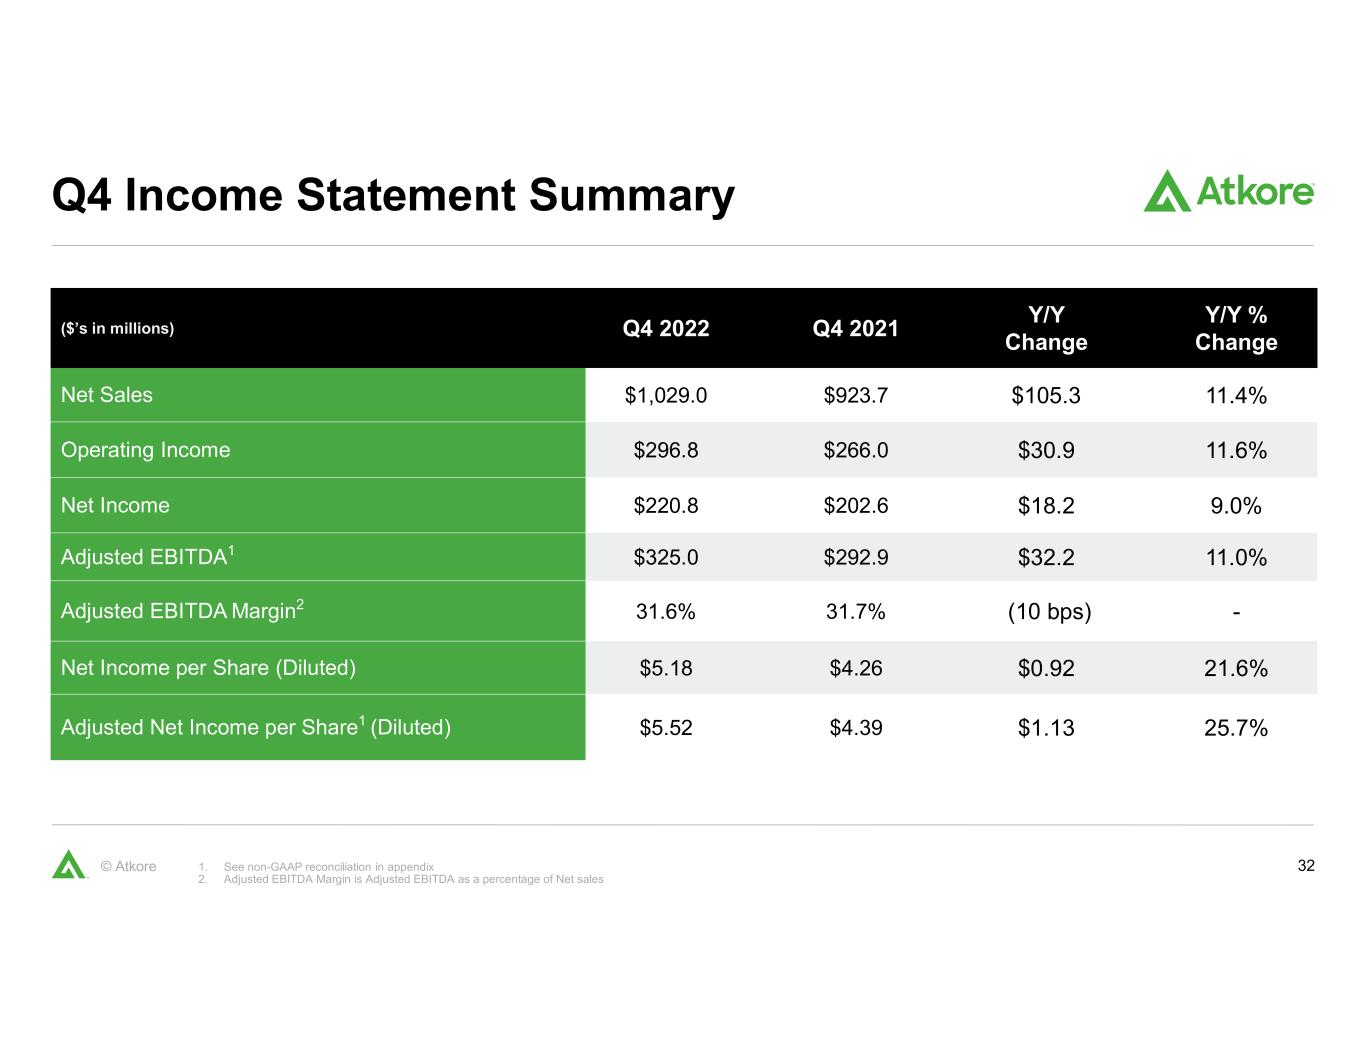
32© Atkore Q4 Income Statement Summary 1. See non-GAAP reconciliation in appendix 2. Adjusted EBITDA Margin is Adjusted EBITDA as a percentage of Net sales ($’s in millions) Q4 2022 Q4 2021 Y/Y Change Y/Y % Change Net Sales $1,029.0 $923.7 $105.3 11.4% Operating Income $296.8 $266.0 $30.9 11.6% Net Income $220.8 $202.6 $18.2 9.0% Adjusted EBITDA1 $325.0 $292.9 $32.2 11.0% Adjusted EBITDA Margin2 31.6% 31.7% (10 bps) - Net Income per Share (Diluted) $5.18 $4.26 $0.92 21.6% Adjusted Net Income per Share1 (Diluted) $5.52 $4.39 $1.13 25.7%
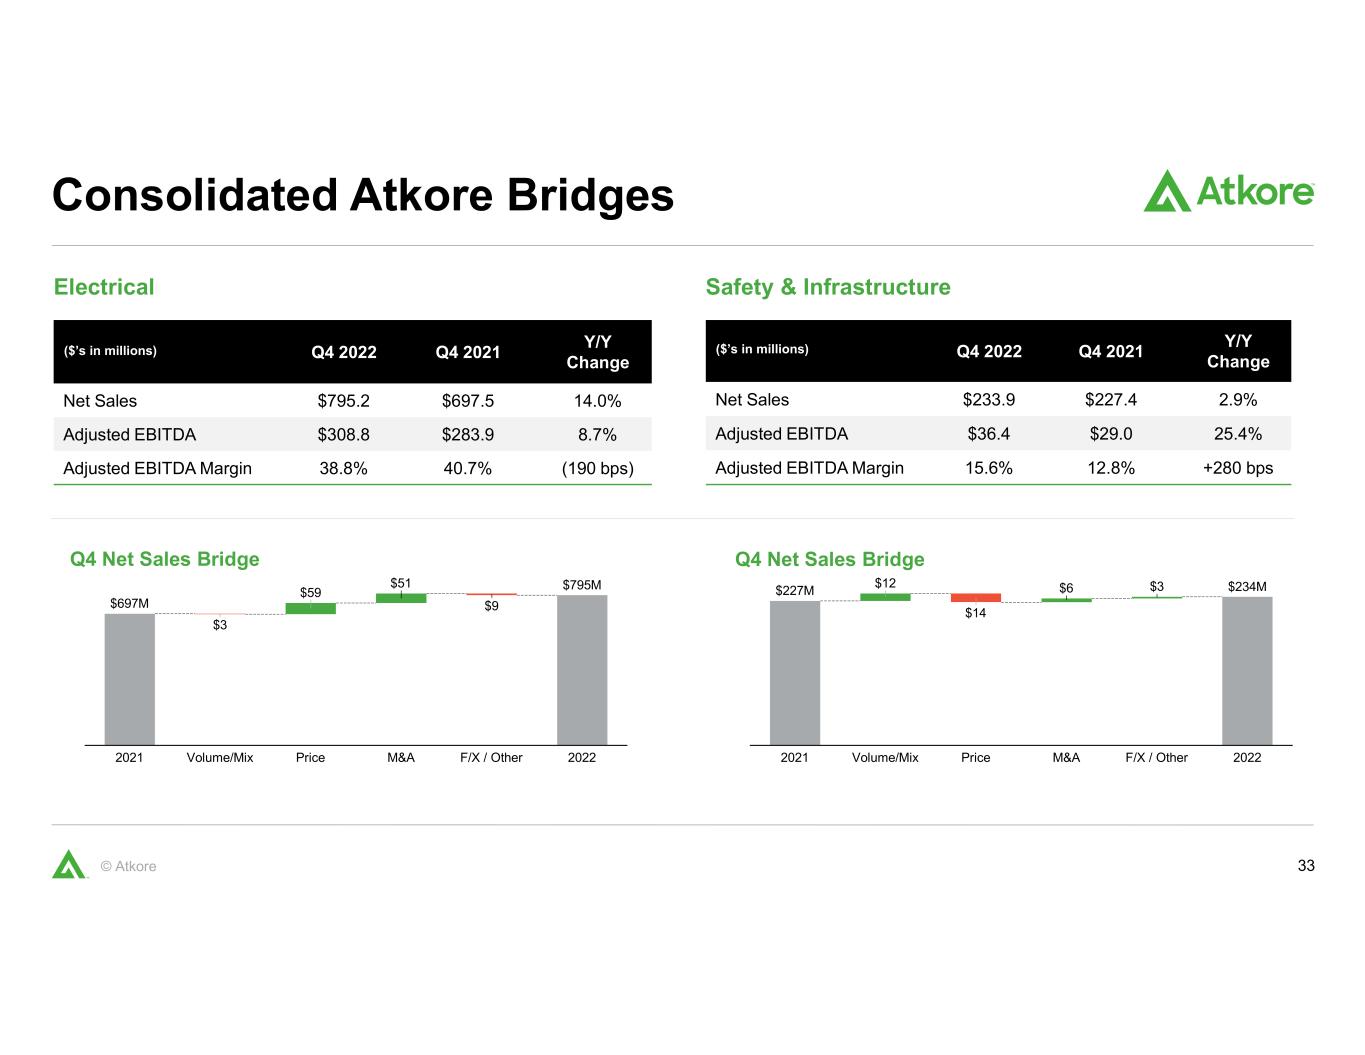
33© Atkore Consolidated Atkore Bridges $3 $59 $51 $9 2021 Volume/Mix Price M&A F/X / Other 2022 $697M $795M Q4 Net Sales Bridge $12 $14 $6 $3 20222021 Volume/Mix Price $234M M&A F/X / Other $227M Q4 Net Sales Bridge Electrical Safety & Infrastructure ($’s in millions) Q4 2022 Q4 2021 Y/Y Change Net Sales $795.2 $697.5 14.0% Adjusted EBITDA $308.8 $283.9 8.7% Adjusted EBITDA Margin 38.8% 40.7% (190 bps) ($’s in millions) Q4 2022 Q4 2021 Y/Y Change Net Sales $233.9 $227.4 2.9% Adjusted EBITDA $36.4 $29.0 25.4% Adjusted EBITDA Margin 15.6% 12.8% +280 bps
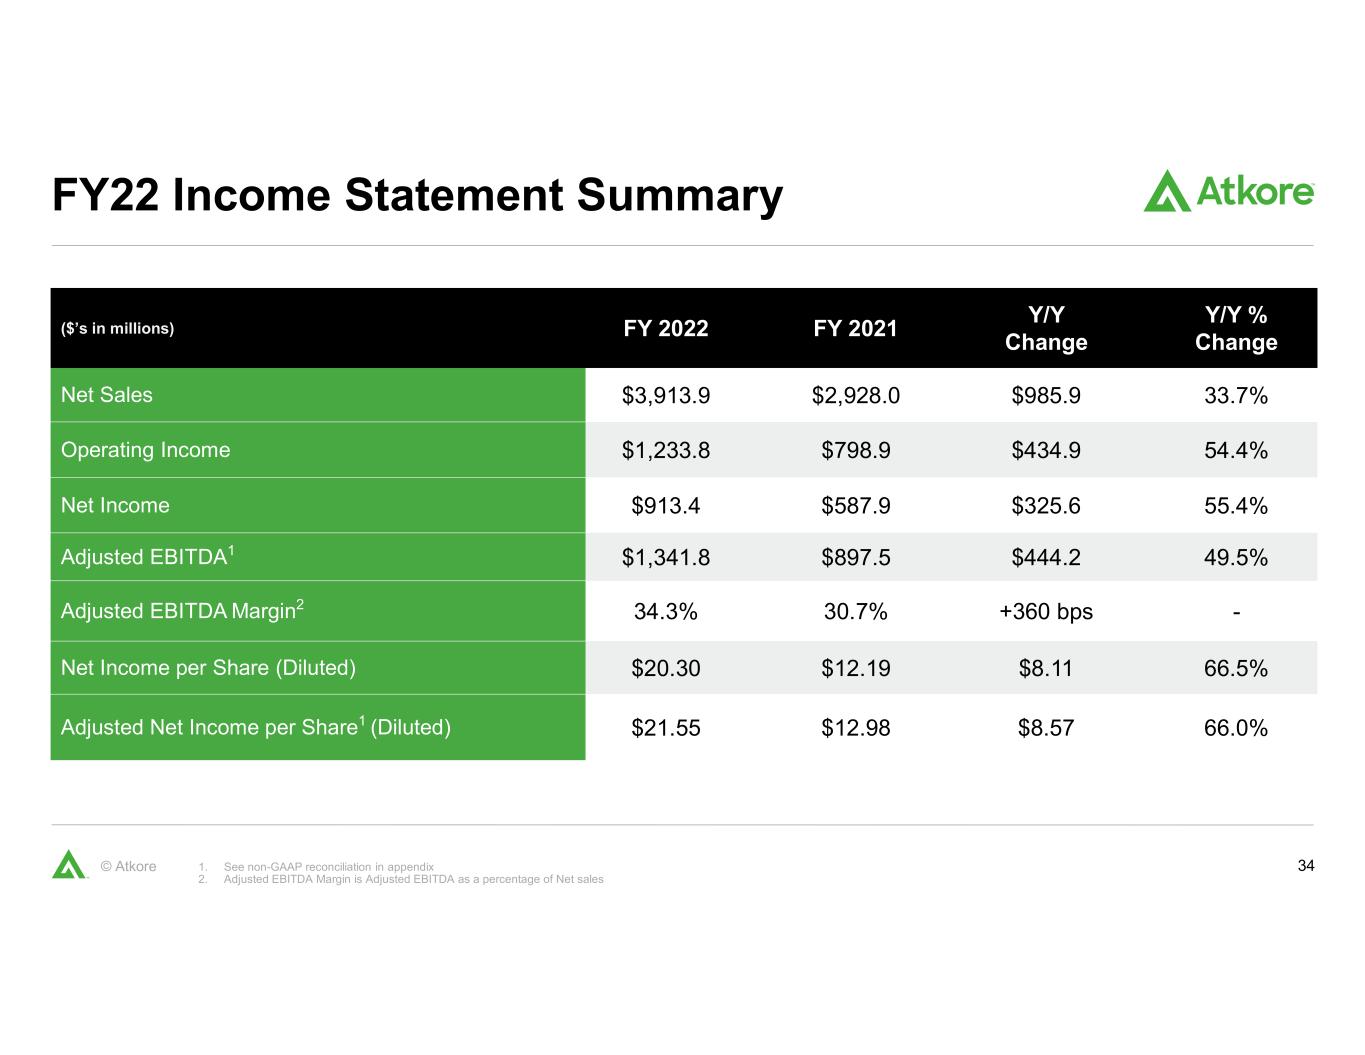
34© Atkore FY22 Income Statement Summary 1. See non-GAAP reconciliation in appendix 2. Adjusted EBITDA Margin is Adjusted EBITDA as a percentage of Net sales ($’s in millions) FY 2022 FY 2021 Y/Y Change Y/Y % Change Net Sales $3,913.9 $2,928.0 $985.9 33.7% Operating Income $1,233.8 $798.9 $434.9 54.4% Net Income $913.4 $587.9 $325.6 55.4% Adjusted EBITDA1 $1,341.8 $897.5 $444.2 49.5% Adjusted EBITDA Margin2 34.3% 30.7% +360 bps - Net Income per Share (Diluted) $20.30 $12.19 $8.11 66.5% Adjusted Net Income per Share1 (Diluted) $21.55 $12.98 $8.57 66.0%
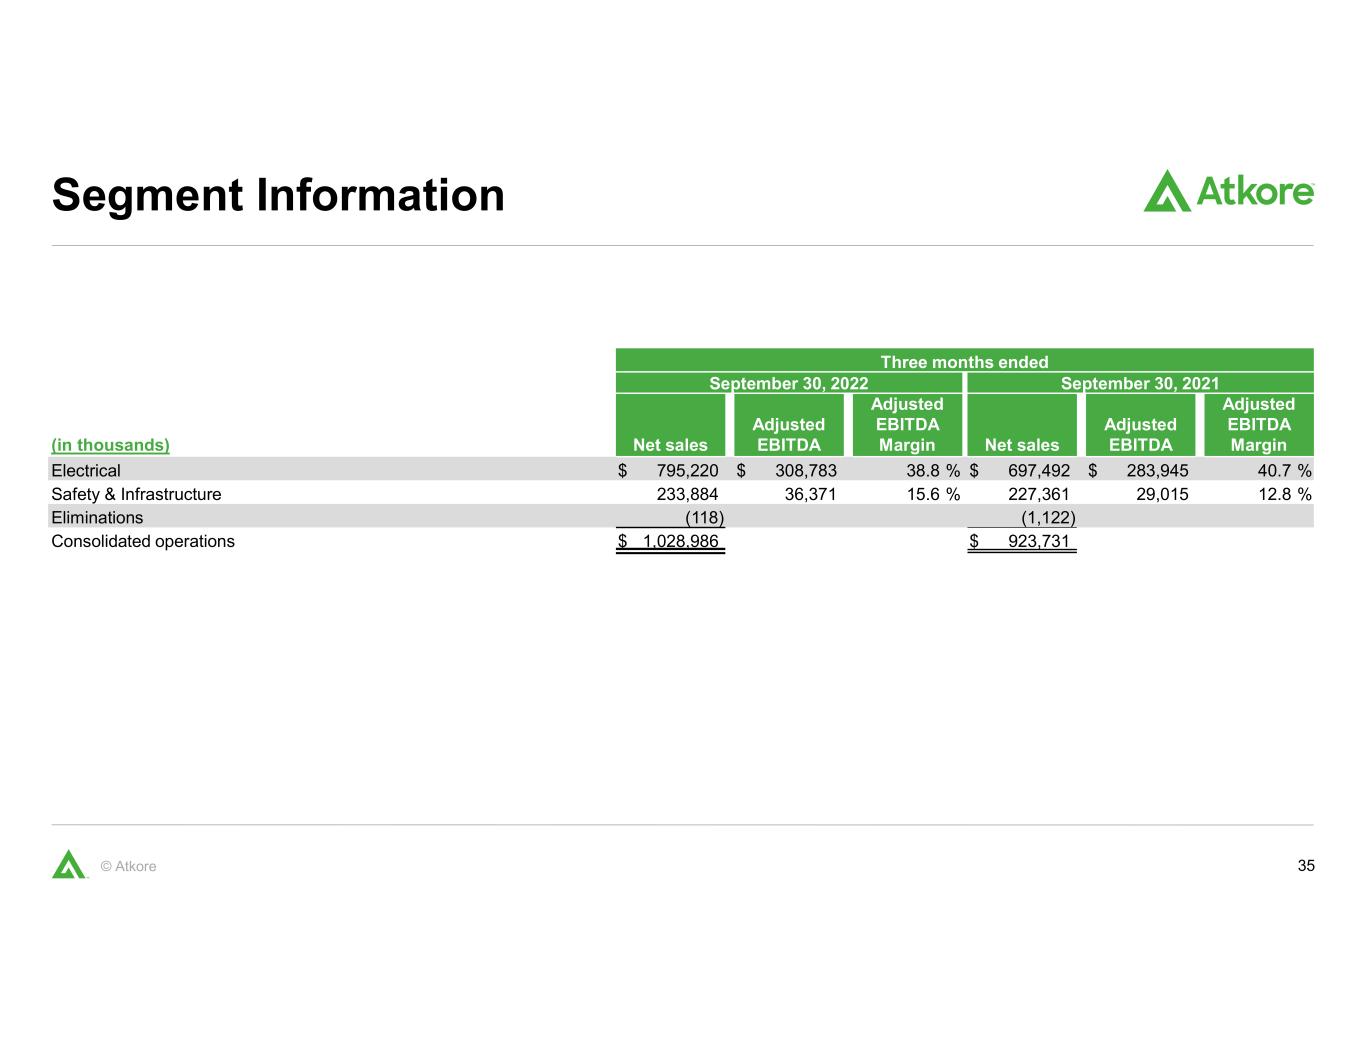
35© Atkore Segment Information Three months ended September 30, 2022 September 30, 2021 (in thousands) Net sales Adjusted EBITDA Adjusted EBITDA Margin Net sales Adjusted EBITDA Adjusted EBITDA Margin Electrical $ 795,220 $ 308,783 38.8 % $ 697,492 $ 283,945 40.7 % Safety & Infrastructure 233,884 36,371 15.6 % 227,361 29,015 12.8 % Eliminations (118) (1,122) Consolidated operations $ 1,028,986 $ 923,731
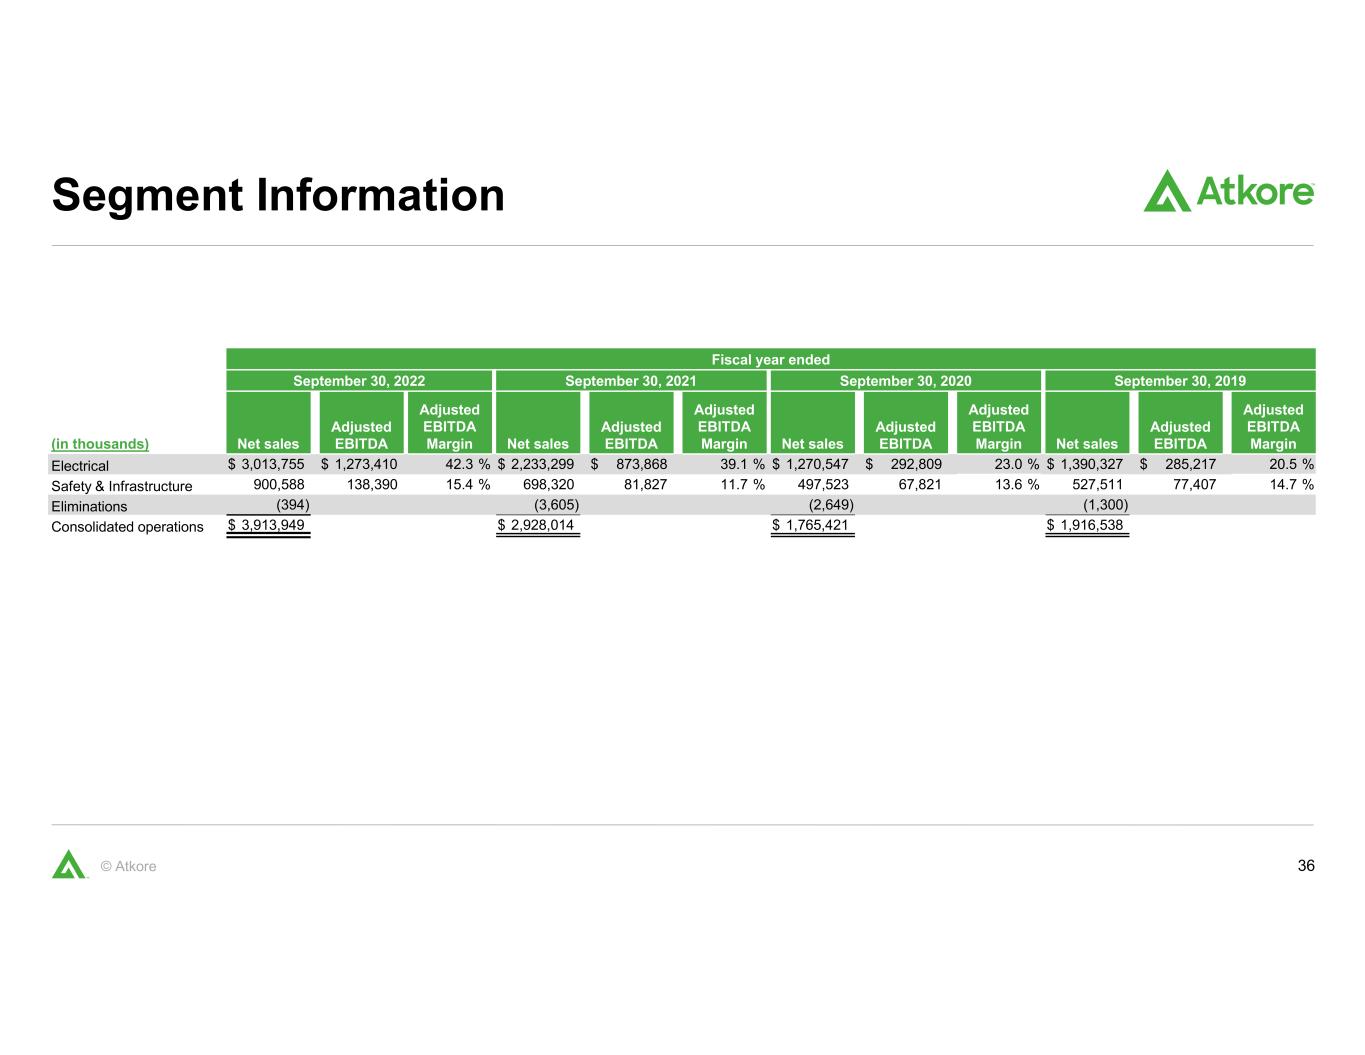
36© Atkore Segment Information Fiscal year ended September 30, 2022 September 30, 2021 September 30, 2020 September 30, 2019 (in thousands) Net sales Adjusted EBITDA Adjusted EBITDA Margin Net sales Adjusted EBITDA Adjusted EBITDA Margin Net sales Adjusted EBITDA Adjusted EBITDA Margin Net sales Adjusted EBITDA Adjusted EBITDA Margin Electrical $ 3,013,755 $ 1,273,410 42.3 % $ 2,233,299 $ 873,868 39.1 % $ 1,270,547 $ 292,809 23.0 % $ 1,390,327 $ 285,217 20.5 % Safety & Infrastructure 900,588 138,390 15.4 % 698,320 81,827 11.7 % 497,523 67,821 13.6 % 527,511 77,407 14.7 % Eliminations (394) (3,605) (2,649) (1,300) Consolidated operations $ 3,913,949 $ 2,928,014 $ 1,765,421 $ 1,916,538
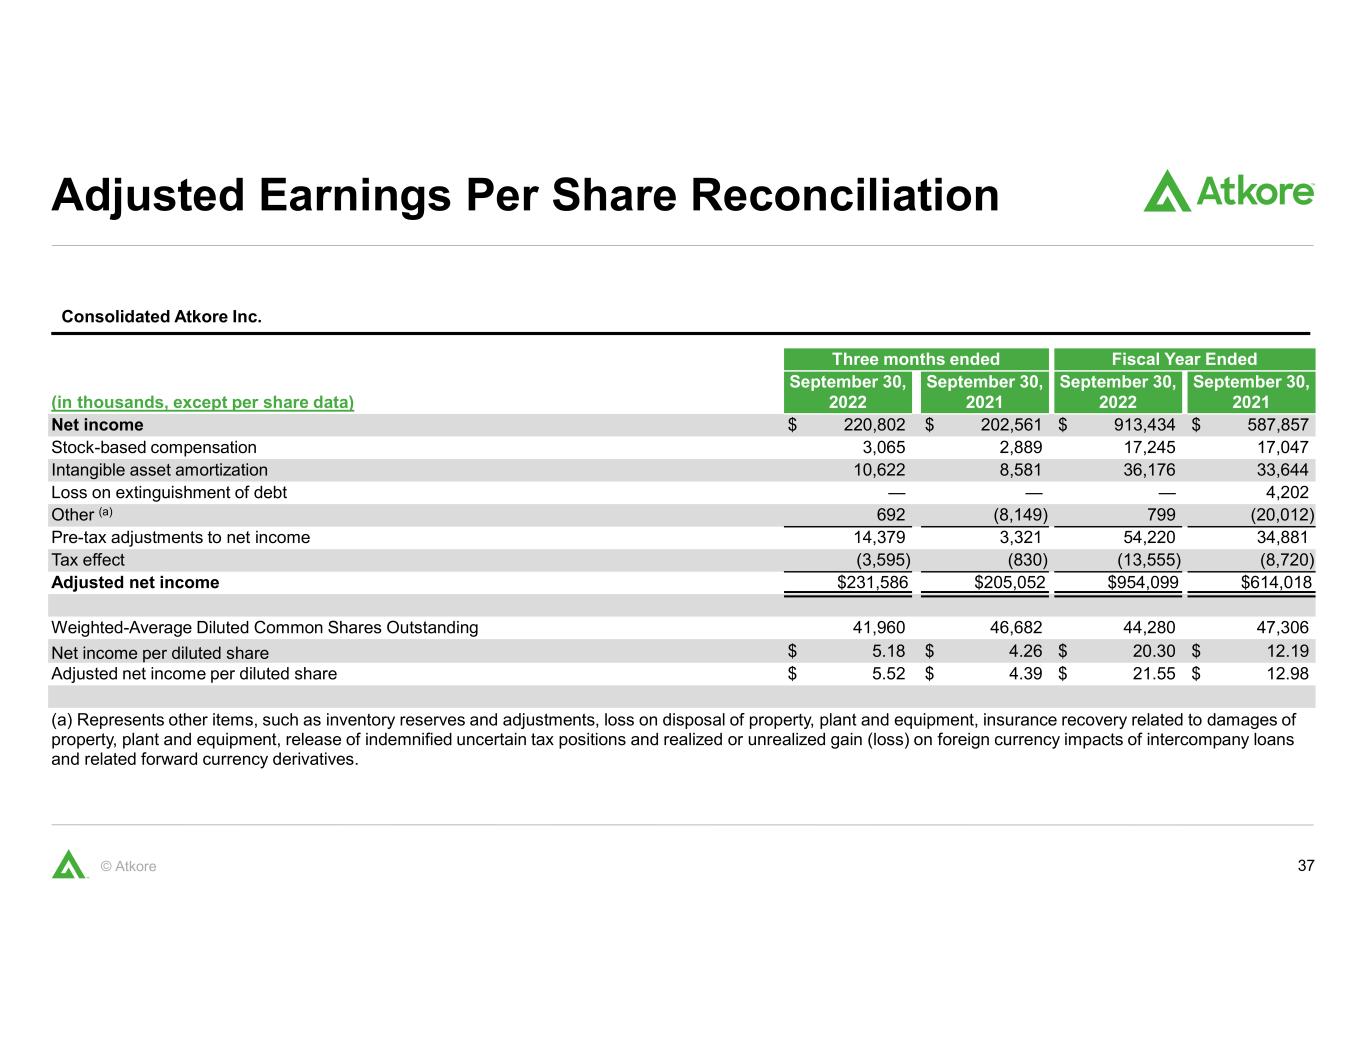
37© Atkore Adjusted Earnings Per Share Reconciliation Consolidated Atkore Inc. Three months ended Fiscal Year Ended (in thousands, except per share data) September 30, 2022 September 30, 2021 September 30, 2022 September 30, 2021 Net income $ 220,802 $ 202,561 $ 913,434 $ 587,857 Stock-based compensation 3,065 2,889 17,245 17,047 Intangible asset amortization 10,622 8,581 36,176 33,644 Loss on extinguishment of debt — — — 4,202 Other (a) 692 (8,149) 799 (20,012) Pre-tax adjustments to net income 14,379 3,321 54,220 34,881 Tax effect (3,595) (830) (13,555) (8,720) Adjusted net income $231,586 $205,052 $954,099 $614,018 Weighted-Average Diluted Common Shares Outstanding 41,960 46,682 44,280 47,306 Net income per diluted share $ 5.18 $ 4.26 $ 20.30 $ 12.19 Adjusted net income per diluted share $ 5.52 $ 4.39 $ 21.55 $ 12.98 (a) Represents other items, such as inventory reserves and adjustments, loss on disposal of property, plant and equipment, insurance recovery related to damages of property, plant and equipment, release of indemnified uncertain tax positions and realized or unrealized gain (loss) on foreign currency impacts of intercompany loans and related forward currency derivatives.
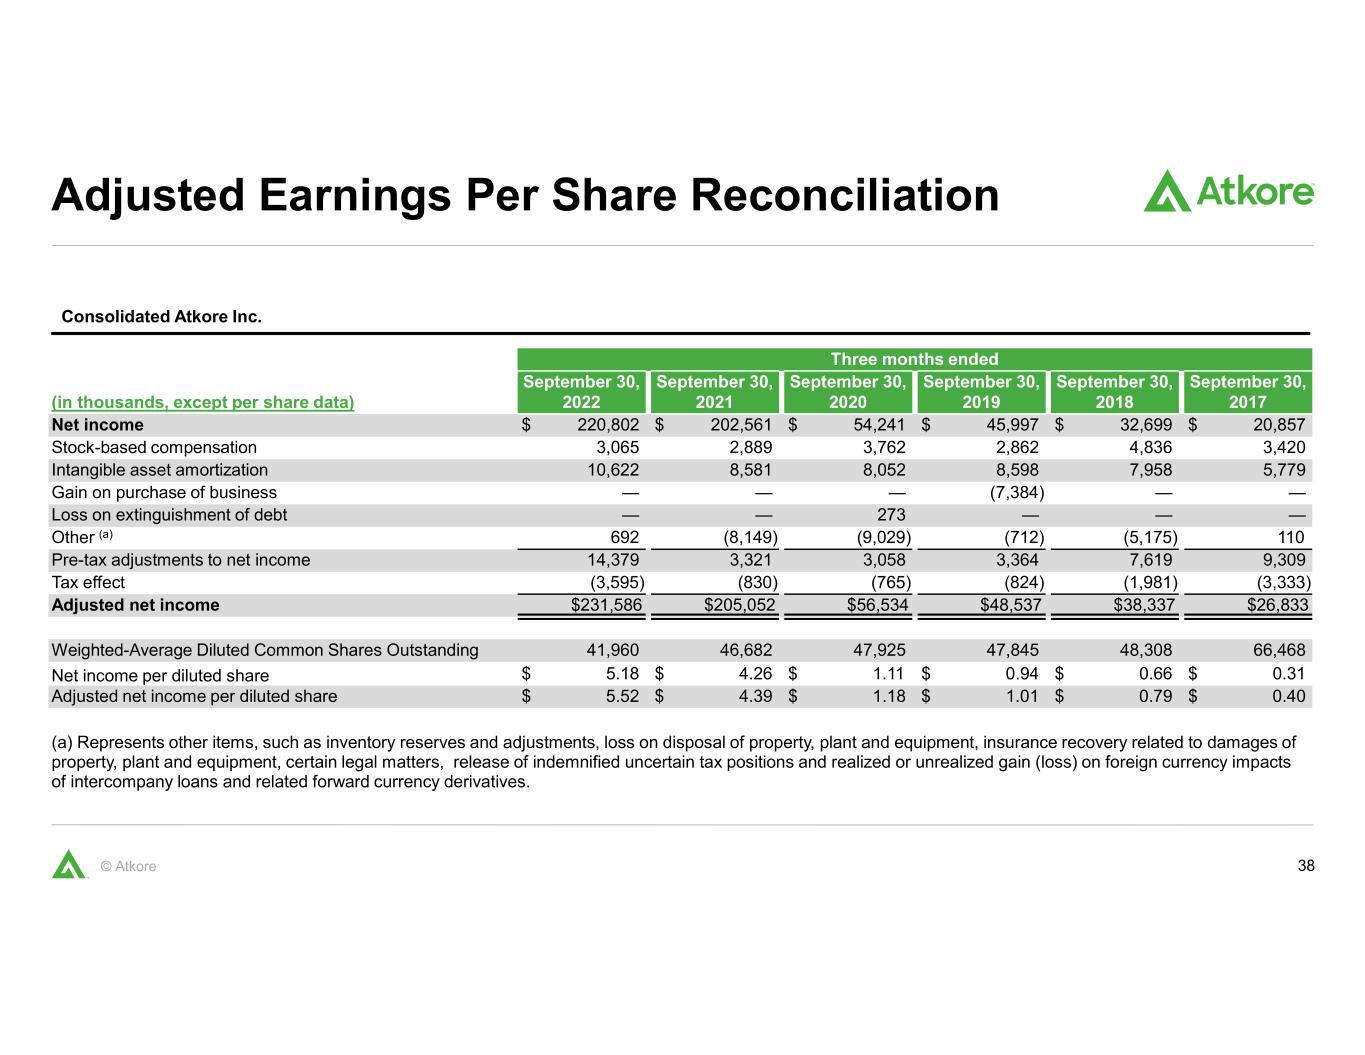
38© Atkore Adjusted Earnings Per Share Reconciliation Consolidated Atkore Inc. (in thousands, except per share data) Three months ended September 30, 2022 September 30, 2021 September 30, 2020 September 30, 2019 September 30, 2018 September 30, 2017 Net income $ 220,802 $ 202,561 $ 54,241 $ 45,997 $ 32,699 $ 20,857 Stock-based compensation 3,065 2,889 3,762 2,862 4,836 3,420 Intangible asset amortization 10,622 8,581 8,052 8,598 7,958 5,779 Gain on purchase of business — — — (7,384) — — Loss on extinguishment of debt — — 273 — — — Other (a) 692 (8,149) (9,029) (712) (5,175) 110 Pre-tax adjustments to net income 14,379 3,321 3,058 3,364 7,619 9,309 Tax effect (3,595) (830) (765) (824) (1,981) (3,333) Adjusted net income $231,586 $205,052 $56,534 $48,537 $38,337 $26,833 Weighted-Average Diluted Common Shares Outstanding 41,960 46,682 47,925 47,845 48,308 66,468 Net income per diluted share $ 5.18 $ 4.26 $ 1.11 $ 0.94 $ 0.66 $ 0.31 Adjusted net income per diluted share $ 5.52 $ 4.39 $ 1.18 $ 1.01 $ 0.79 $ 0.40 (a) Represents other items, such as inventory reserves and adjustments, loss on disposal of property, plant and equipment, insurance recovery related to damages of property, plant and equipment, certain legal matters, release of indemnified uncertain tax positions and realized or unrealized gain (loss) on foreign currency impacts of intercompany loans and related forward currency derivatives.
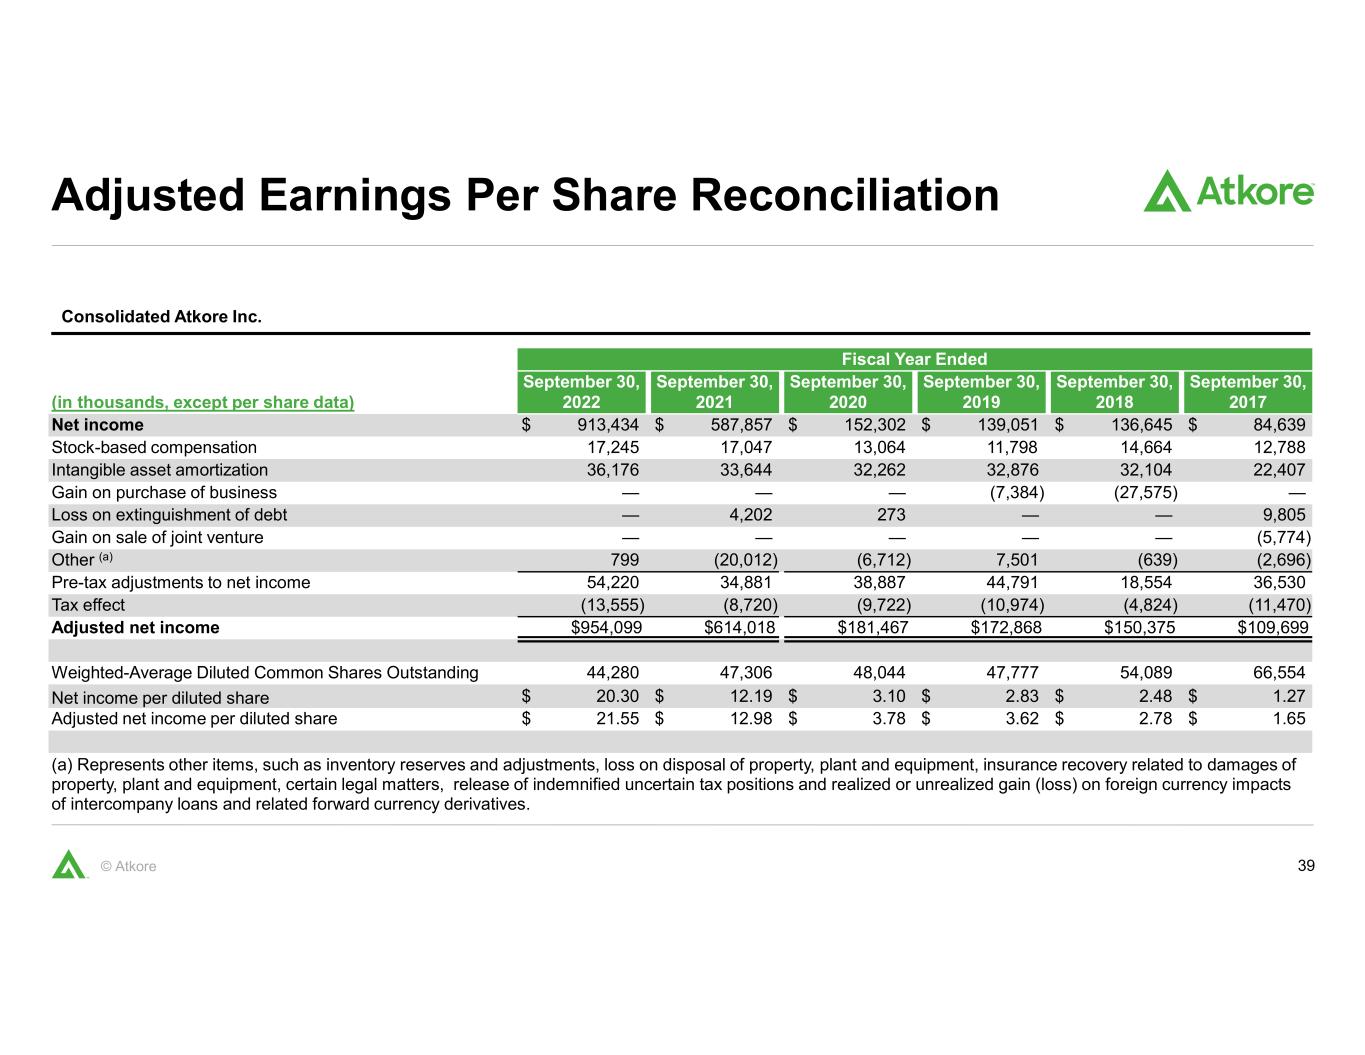
39© Atkore Adjusted Earnings Per Share Reconciliation Consolidated Atkore Inc. (in thousands, except per share data) Fiscal Year Ended September 30, 2022 September 30, 2021 September 30, 2020 September 30, 2019 September 30, 2018 September 30, 2017 Net income $ 913,434 $ 587,857 $ 152,302 $ 139,051 $ 136,645 $ 84,639 Stock-based compensation 17,245 17,047 13,064 11,798 14,664 12,788 Intangible asset amortization 36,176 33,644 32,262 32,876 32,104 22,407 Gain on purchase of business — — — (7,384) (27,575) — Loss on extinguishment of debt — 4,202 273 — — 9,805 Gain on sale of joint venture — — — — — (5,774) Other (a) 799 (20,012) (6,712) 7,501 (639) (2,696) Pre-tax adjustments to net income 54,220 34,881 38,887 44,791 18,554 36,530 Tax effect (13,555) (8,720) (9,722) (10,974) (4,824) (11,470) Adjusted net income $954,099 $614,018 $181,467 $172,868 $150,375 $109,699 Weighted-Average Diluted Common Shares Outstanding 44,280 47,306 48,044 47,777 54,089 66,554 Net income per diluted share $ 20.30 $ 12.19 $ 3.10 $ 2.83 $ 2.48 $ 1.27 Adjusted net income per diluted share $ 21.55 $ 12.98 $ 3.78 $ 3.62 $ 2.78 $ 1.65 (a) Represents other items, such as inventory reserves and adjustments, loss on disposal of property, plant and equipment, insurance recovery related to damages of property, plant and equipment, certain legal matters, release of indemnified uncertain tax positions and realized or unrealized gain (loss) on foreign currency impacts of intercompany loans and related forward currency derivatives.
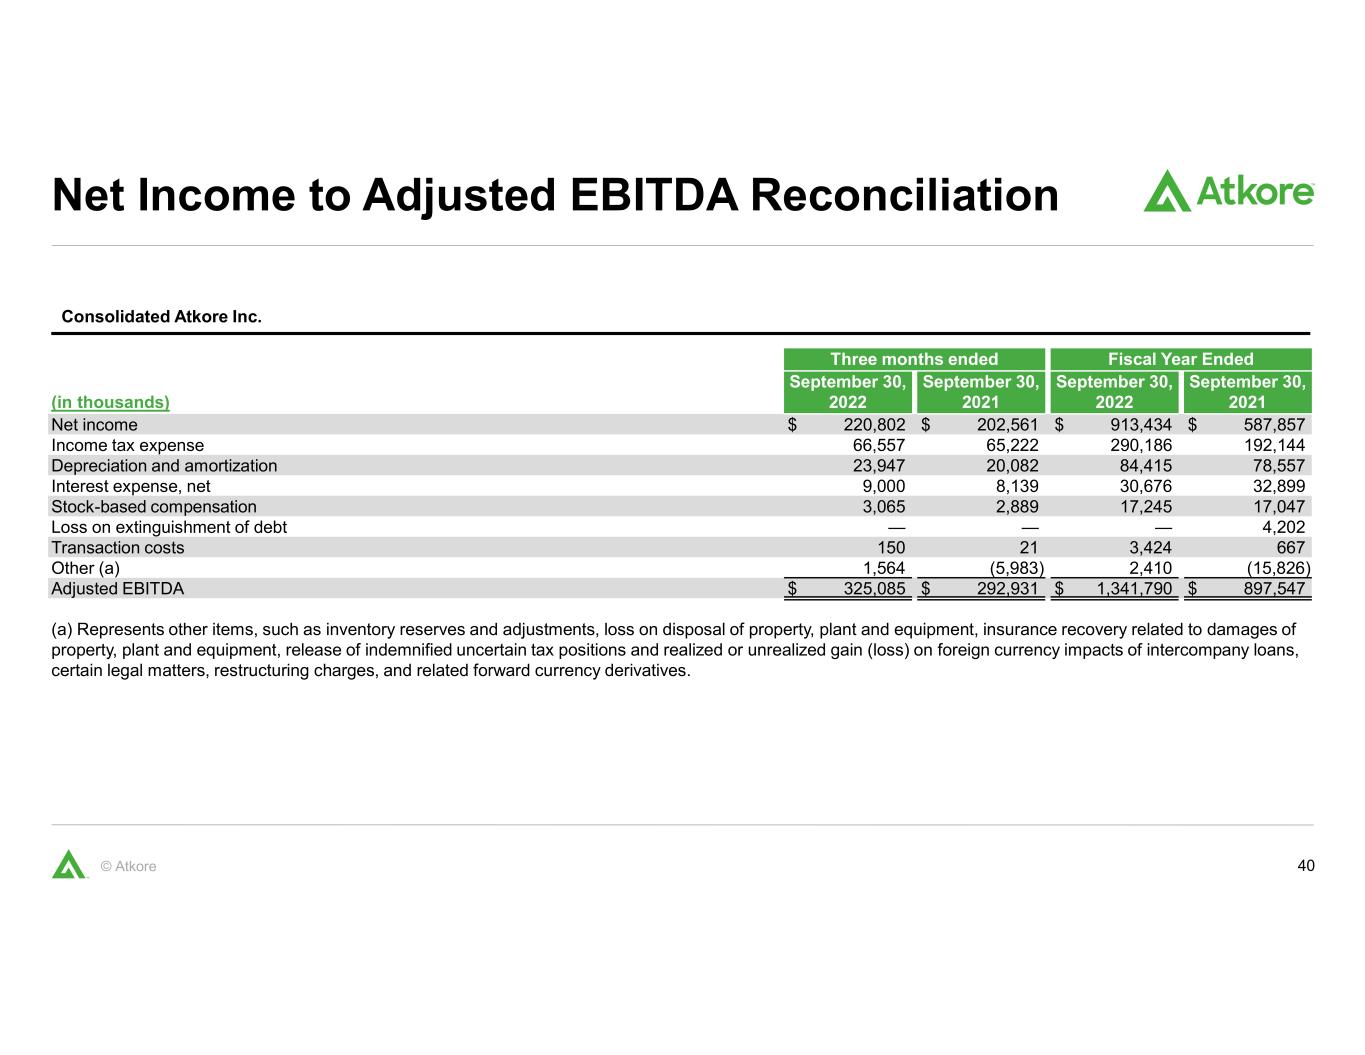
40© Atkore Net Income to Adjusted EBITDA Reconciliation Consolidated Atkore Inc. Three months ended Fiscal Year Ended (in thousands) September 30, 2022 September 30, 2021 September 30, 2022 September 30, 2021 Net income $ 220,802 $ 202,561 $ 913,434 $ 587,857 Income tax expense 66,557 65,222 290,186 192,144 Depreciation and amortization 23,947 20,082 84,415 78,557 Interest expense, net 9,000 8,139 30,676 32,899 Stock-based compensation 3,065 2,889 17,245 17,047 Loss on extinguishment of debt — — — 4,202 Transaction costs 150 21 3,424 667 Other (a) 1,564 (5,983) 2,410 (15,826) Adjusted EBITDA $ 325,085 $ 292,931 $ 1,341,790 $ 897,547 (a) Represents other items, such as inventory reserves and adjustments, loss on disposal of property, plant and equipment, insurance recovery related to damages of property, plant and equipment, release of indemnified uncertain tax positions and realized or unrealized gain (loss) on foreign currency impacts of intercompany loans, certain legal matters, restructuring charges, and related forward currency derivatives.
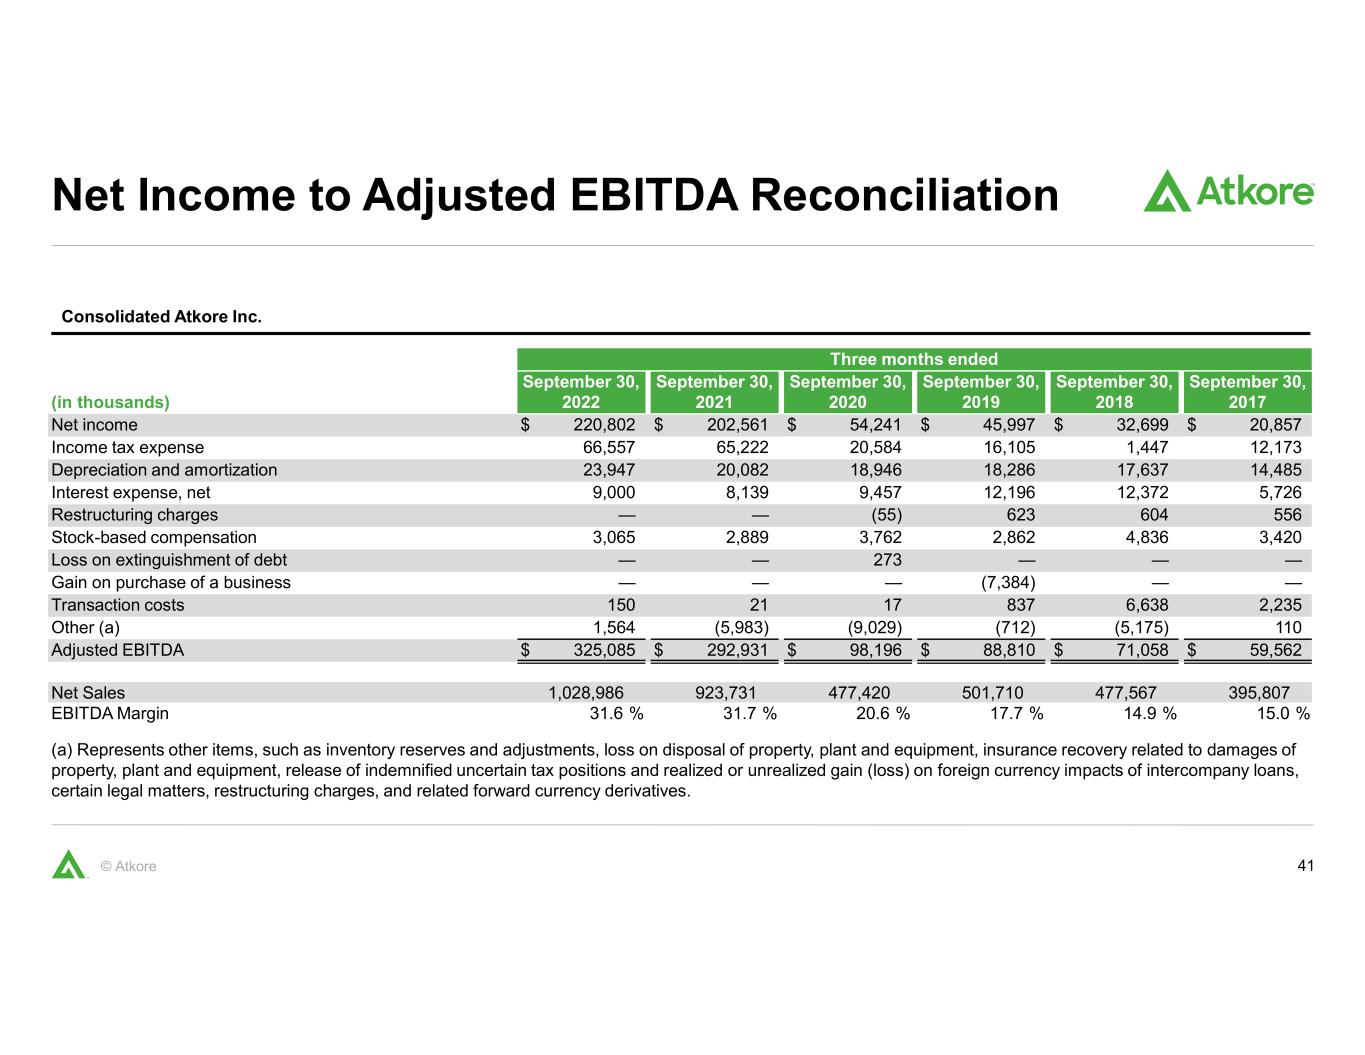
41© Atkore Net Income to Adjusted EBITDA Reconciliation Consolidated Atkore Inc. Three months ended (in thousands) September 30, 2022 September 30, 2021 September 30, 2020 September 30, 2019 September 30, 2018 September 30, 2017 Net income $ 220,802 $ 202,561 $ 54,241 $ 45,997 $ 32,699 $ 20,857 Income tax expense 66,557 65,222 20,584 16,105 1,447 12,173 Depreciation and amortization 23,947 20,082 18,946 18,286 17,637 14,485 Interest expense, net 9,000 8,139 9,457 12,196 12,372 5,726 Restructuring charges — — (55) 623 604 556 Stock-based compensation 3,065 2,889 3,762 2,862 4,836 3,420 Loss on extinguishment of debt — — 273 — — — Gain on purchase of a business — — — (7,384) — — Transaction costs 150 21 17 837 6,638 2,235 Other (a) 1,564 (5,983) (9,029) (712) (5,175) 110 Adjusted EBITDA $ 325,085 $ 292,931 $ 98,196 $ 88,810 $ 71,058 $ 59,562 Net Sales 1,028,986 923,731 477,420 501,710 477,567 395,807 EBITDA Margin 31.6 % 31.7 % 20.6 % 17.7 % 14.9 % 15.0 % (a) Represents other items, such as inventory reserves and adjustments, loss on disposal of property, plant and equipment, insurance recovery related to damages of property, plant and equipment, release of indemnified uncertain tax positions and realized or unrealized gain (loss) on foreign currency impacts of intercompany loans, certain legal matters, restructuring charges, and related forward currency derivatives.
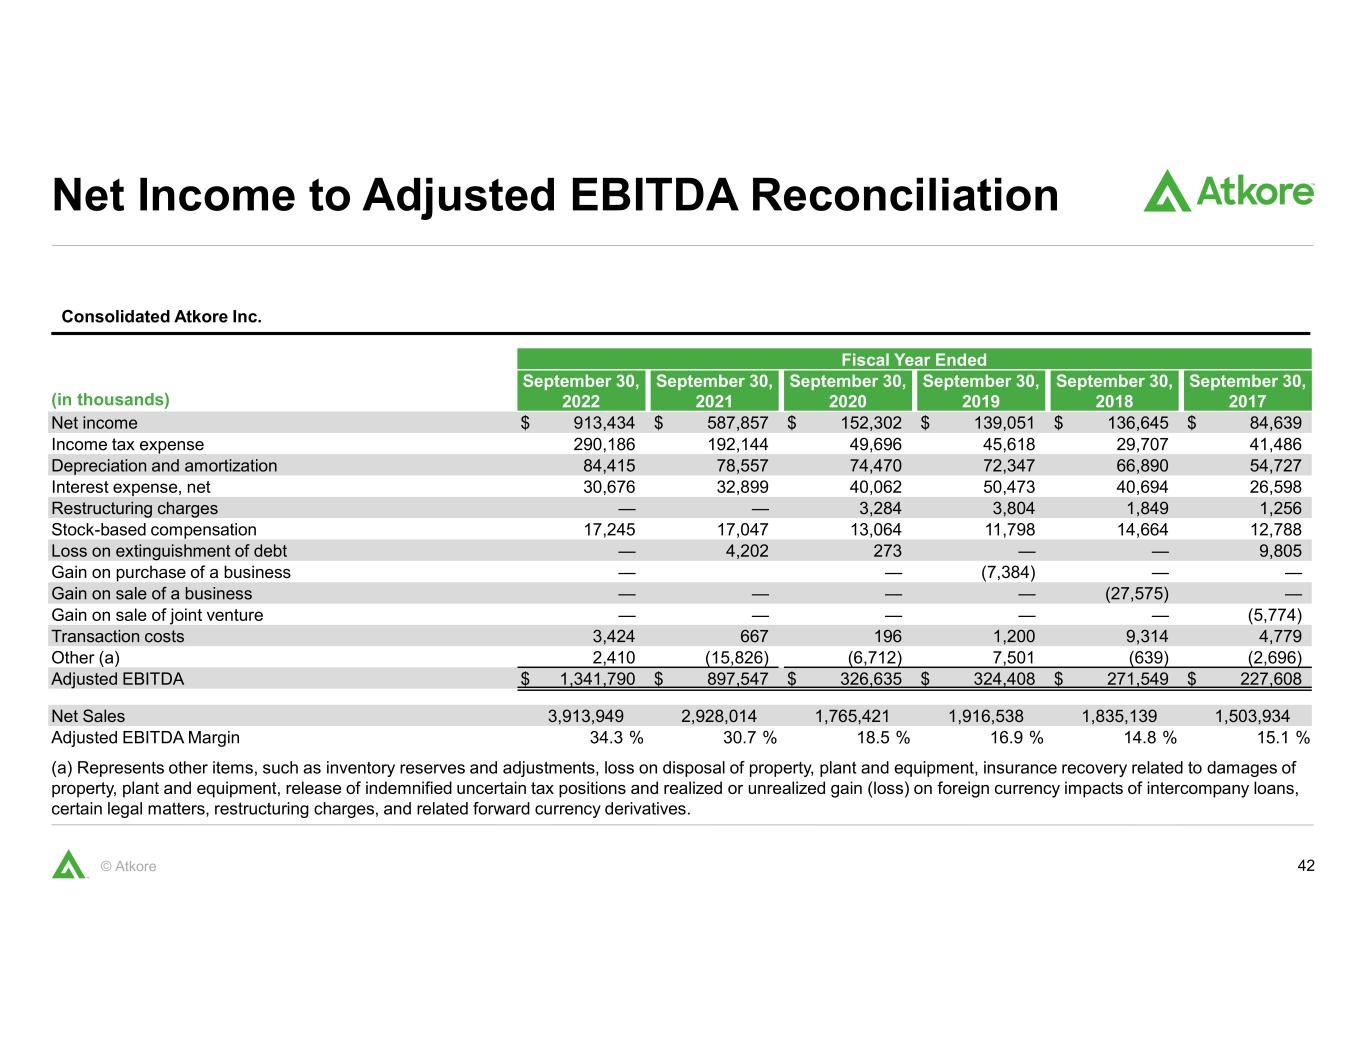
42© Atkore Net Income to Adjusted EBITDA Reconciliation Consolidated Atkore Inc. Fiscal Year Ended (in thousands) September 30, 2022 September 30, 2021 September 30, 2020 September 30, 2019 September 30, 2018 September 30, 2017 Net income $ 913,434 $ 587,857 $ 152,302 $ 139,051 $ 136,645 $ 84,639 Income tax expense 290,186 192,144 49,696 45,618 29,707 41,486 Depreciation and amortization 84,415 78,557 74,470 72,347 66,890 54,727 Interest expense, net 30,676 32,899 40,062 50,473 40,694 26,598 Restructuring charges — — 3,284 3,804 1,849 1,256 Stock-based compensation 17,245 17,047 13,064 11,798 14,664 12,788 Loss on extinguishment of debt — 4,202 273 — — 9,805 Gain on purchase of a business — — (7,384) — — Gain on sale of a business — — — — (27,575) — Gain on sale of joint venture — — — — — (5,774) Transaction costs 3,424 667 196 1,200 9,314 4,779 Other (a) 2,410 (15,826) (6,712) 7,501 (639) (2,696) Adjusted EBITDA $ 1,341,790 $ 897,547 $ 326,635 $ 324,408 $ 271,549 $ 227,608 Net Sales 3,913,949 2,928,014 1,765,421 1,916,538 1,835,139 1,503,934 Adjusted EBITDA Margin 34.3 % 30.7 % 18.5 % 16.9 % 14.8 % 15.1 % (a) Represents other items, such as inventory reserves and adjustments, loss on disposal of property, plant and equipment, insurance recovery related to damages of property, plant and equipment, release of indemnified uncertain tax positions and realized or unrealized gain (loss) on foreign currency impacts of intercompany loans, certain legal matters, restructuring charges, and related forward currency derivatives.
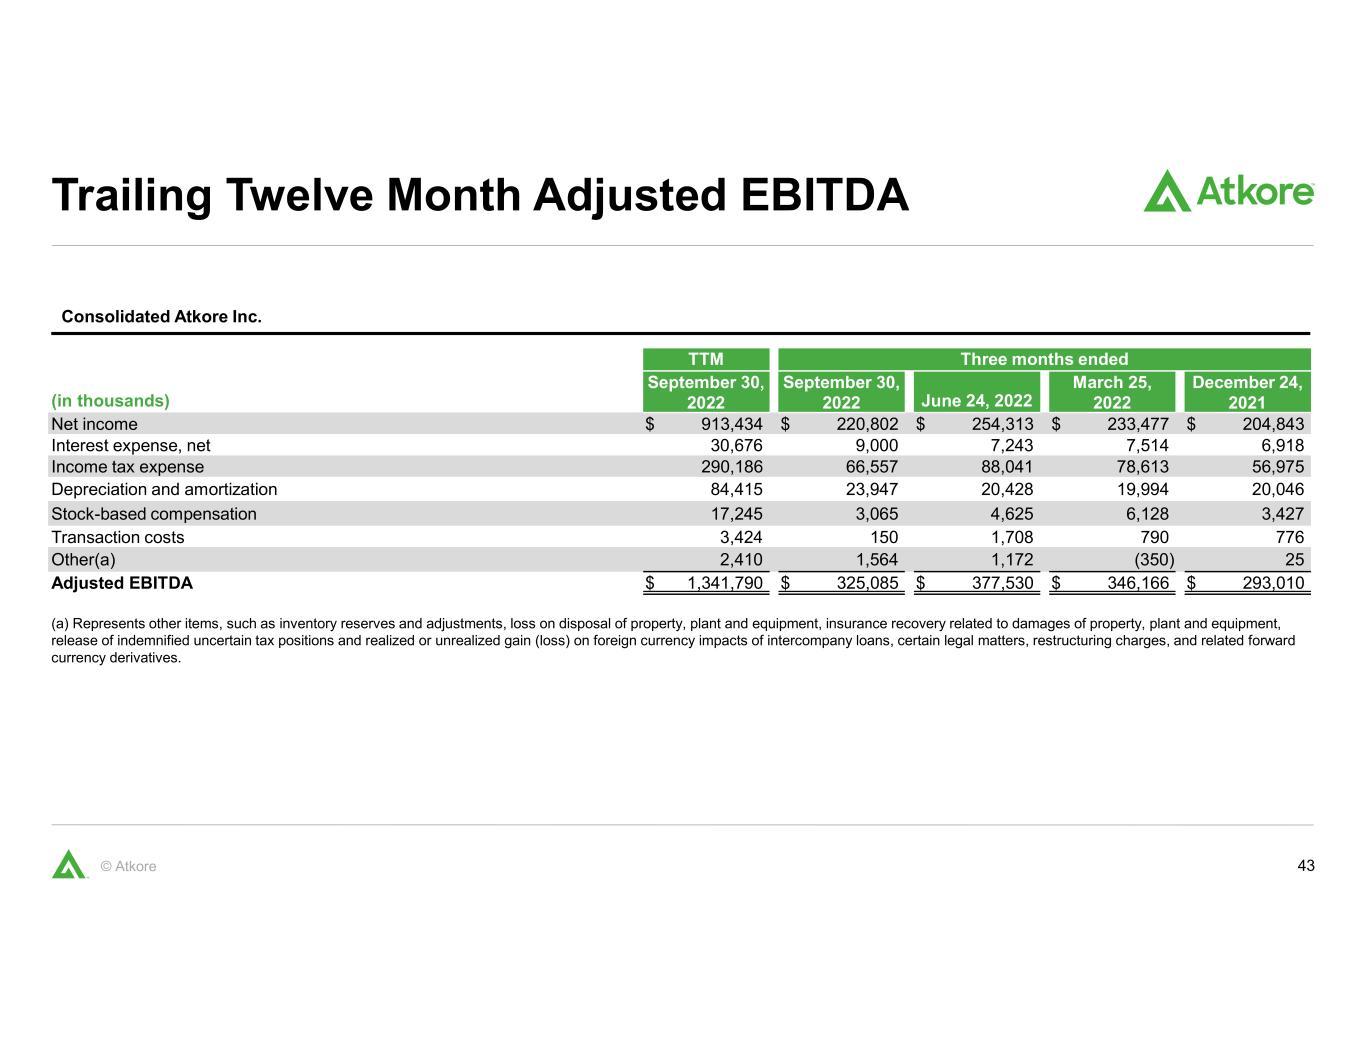
43© Atkore Trailing Twelve Month Adjusted EBITDA Consolidated Atkore Inc. TTM Three months ended (in thousands) September 30, 2022 September 30, 2022 June 24, 2022 March 25, 2022 December 24, 2021 Net income $ 913,434 $ 220,802 $ 254,313 $ 233,477 $ 204,843 Interest expense, net 30,676 9,000 7,243 7,514 6,918 Income tax expense 290,186 66,557 88,041 78,613 56,975 Depreciation and amortization 84,415 23,947 20,428 19,994 20,046 Stock-based compensation 17,245 3,065 4,625 6,128 3,427 Transaction costs 3,424 150 1,708 790 776 Other(a) 2,410 1,564 1,172 (350) 25 Adjusted EBITDA $ 1,341,790 $ 325,085 $ 377,530 $ 346,166 $ 293,010 (a) Represents other items, such as inventory reserves and adjustments, loss on disposal of property, plant and equipment, insurance recovery related to damages of property, plant and equipment, release of indemnified uncertain tax positions and realized or unrealized gain (loss) on foreign currency impacts of intercompany loans, certain legal matters, restructuring charges, and related forward currency derivatives.
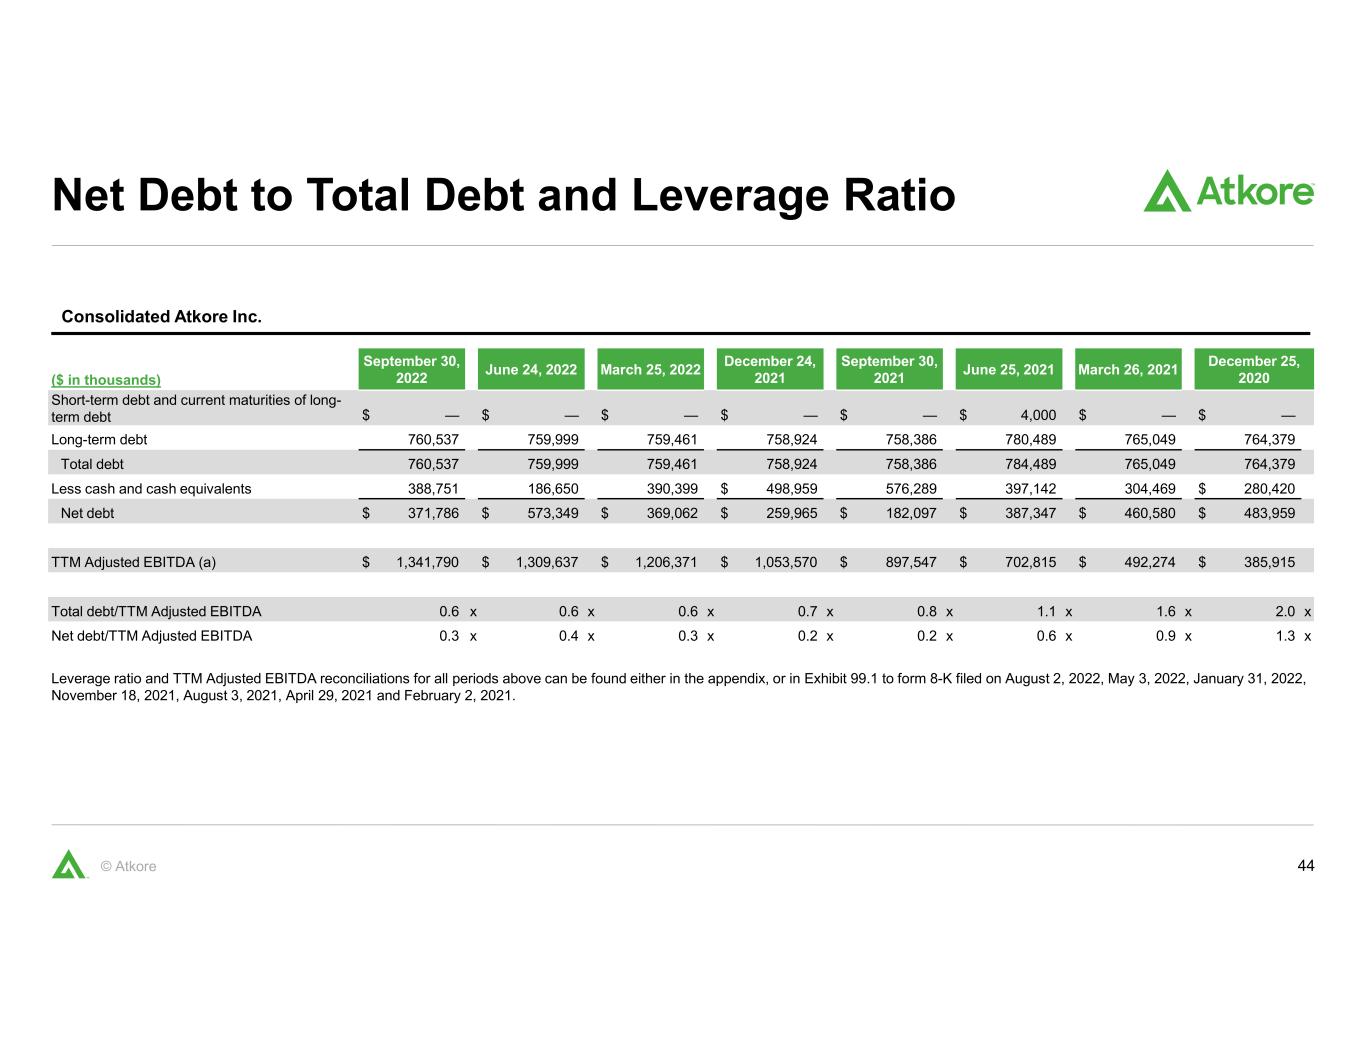
44© Atkore Net Debt to Total Debt and Leverage Ratio Consolidated Atkore Inc. ($ in thousands) September 30, 2022 June 24, 2022 March 25, 2022 December 24, 2021 September 30, 2021 June 25, 2021 March 26, 2021 December 25, 2020 Short-term debt and current maturities of long- term debt $ — $ — $ — $ — $ — $ 4,000 $ — $ — Long-term debt 760,537 759,999 759,461 758,924 758,386 780,489 765,049 764,379 Total debt 760,537 759,999 759,461 758,924 758,386 784,489 765,049 764,379 Less cash and cash equivalents 388,751 186,650 390,399 $ 498,959 576,289 397,142 304,469 $ 280,420 Net debt $ 371,786 $ 573,349 $ 369,062 $ 259,965 $ 182,097 $ 387,347 $ 460,580 $ 483,959 TTM Adjusted EBITDA (a) $ 1,341,790 $ 1,309,637 $ 1,206,371 $ 1,053,570 $ 897,547 $ 702,815 $ 492,274 $ 385,915 Total debt/TTM Adjusted EBITDA 0.6 x 0.6 x 0.6 x 0.7 x 0.8 x 1.1 x 1.6 x 2.0 x Net debt/TTM Adjusted EBITDA 0.3 x 0.4 x 0.3 x 0.2 x 0.2 x 0.6 x 0.9 x 1.3 x Leverage ratio and TTM Adjusted EBITDA reconciliations for all periods above can be found either in the appendix, or in Exhibit 99.1 to form 8-K filed on August 2, 2022, May 3, 2022, January 31, 2022, November 18, 2021, August 3, 2021, April 29, 2021 and February 2, 2021.
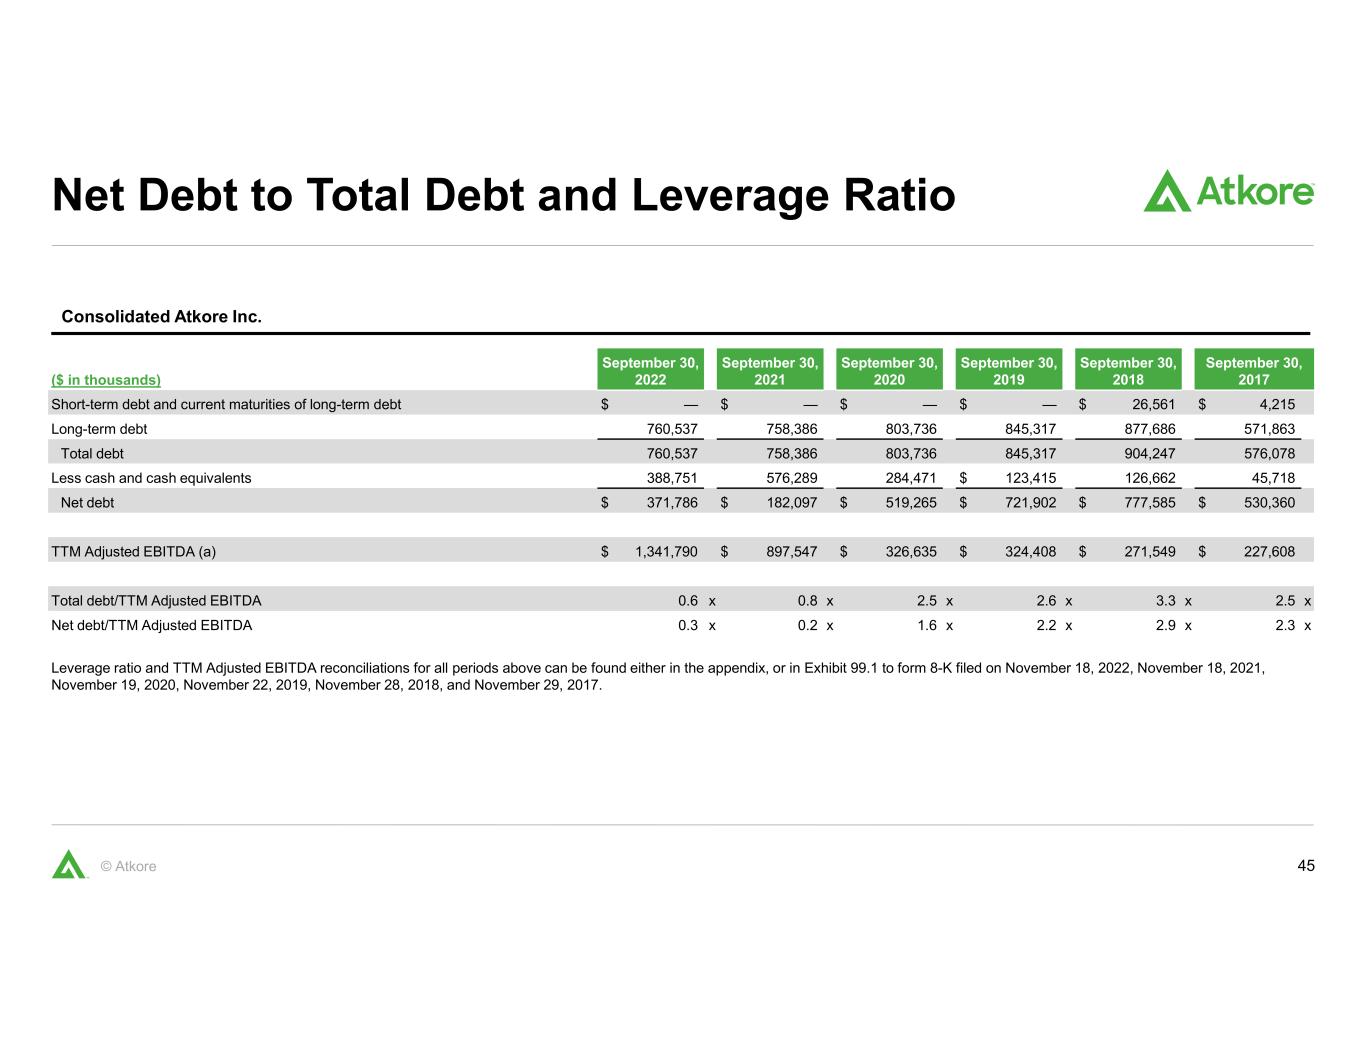
45© Atkore Net Debt to Total Debt and Leverage Ratio Consolidated Atkore Inc. ($ in thousands) September 30, 2022 September 30, 2021 September 30, 2020 September 30, 2019 September 30, 2018 September 30, 2017 Short-term debt and current maturities of long-term debt $ — $ — $ — $ — $ 26,561 $ 4,215 Long-term debt 760,537 758,386 803,736 845,317 877,686 571,863 Total debt 760,537 758,386 803,736 845,317 904,247 576,078 Less cash and cash equivalents 388,751 576,289 284,471 $ 123,415 126,662 45,718 Net debt $ 371,786 $ 182,097 $ 519,265 $ 721,902 $ 777,585 $ 530,360 TTM Adjusted EBITDA (a) $ 1,341,790 $ 897,547 $ 326,635 $ 324,408 $ 271,549 $ 227,608 Total debt/TTM Adjusted EBITDA 0.6 x 0.8 x 2.5 x 2.6 x 3.3 x 2.5 x Net debt/TTM Adjusted EBITDA 0.3 x 0.2 x 1.6 x 2.2 x 2.9 x 2.3 x Leverage ratio and TTM Adjusted EBITDA reconciliations for all periods above can be found either in the appendix, or in Exhibit 99.1 to form 8-K filed on November 18, 2022, November 18, 2021, November 19, 2020, November 22, 2019, November 28, 2018, and November 29, 2017.
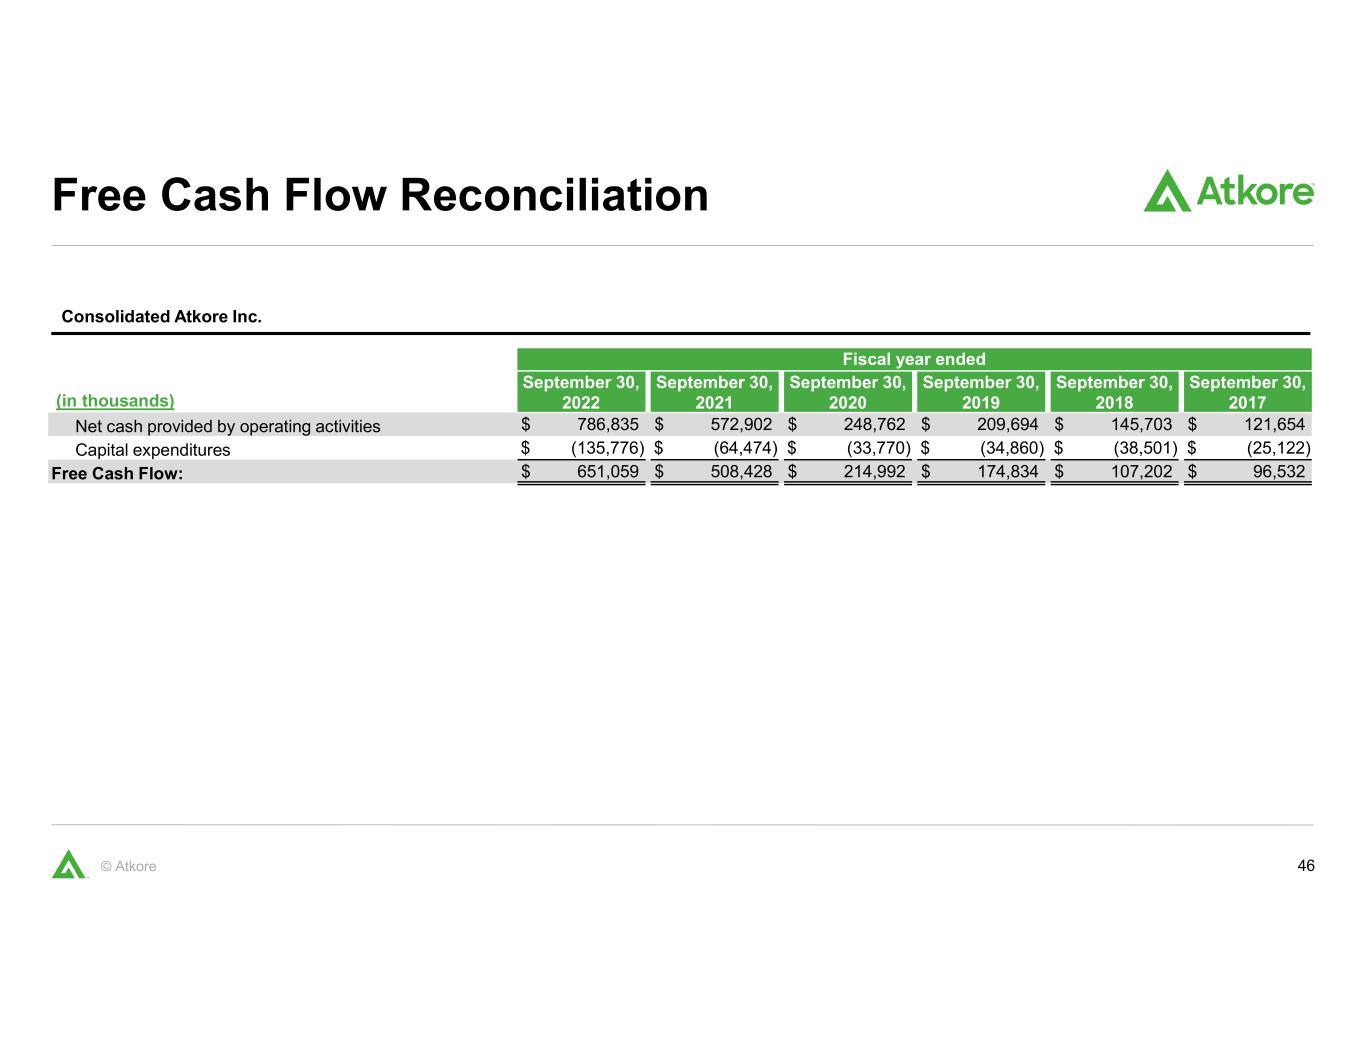
46© Atkore Free Cash Flow Reconciliation Consolidated Atkore Inc. Fiscal year ended (in thousands) September 30, 2022 September 30, 2021 September 30, 2020 September 30, 2019 September 30, 2018 September 30, 2017 Net cash provided by operating activities $ 786,835 $ 572,902 $ 248,762 $ 209,694 $ 145,703 $ 121,654 Capital expenditures $ (135,776) $ (64,474) $ (33,770) $ (34,860) $ (38,501) $ (25,122) Free Cash Flow: $ 651,059 $ 508,428 $ 214,992 $ 174,834 $ 107,202 $ 96,532
47© Atkore atkore.com © Atkore