Exhibit 99.1

Contact: Robert M. Gorman - (804) 523-7828
Executive Vice President / Chief Financial Officer
ATLANTIC UNION BANKSHARES REPORTS SECOND QUARTER FINANCIAL RESULTS
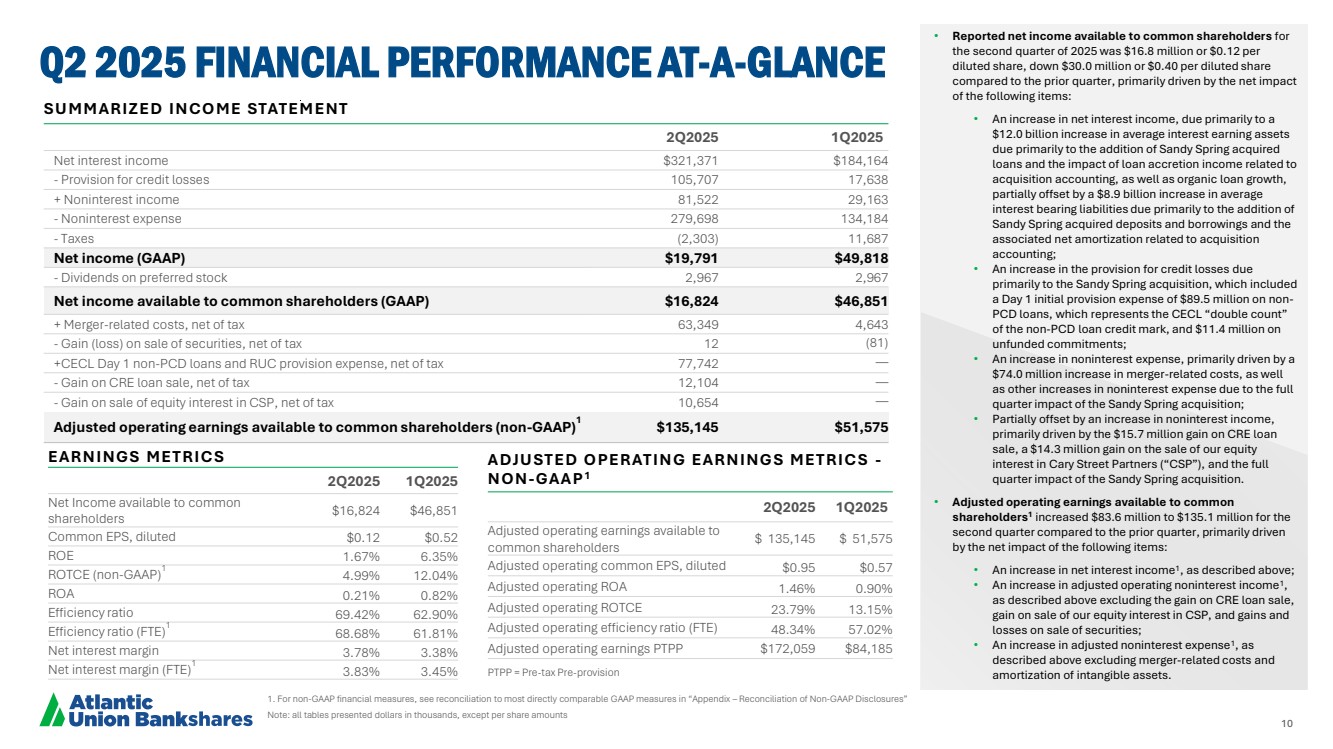
Richmond, Va., July 24, 2025 – Atlantic Union Bankshares Corporation (the “Company” or “Atlantic Union”) (NYSE: AUB) reported net income available to common shareholders of $16.8 million and both basic and diluted earnings per common share of $0.12, for the second quarter of 2025 and adjusted operating earnings available to common shareholders(1) of $135.1 million and adjusted diluted operating earnings per common share(1) of $0.95 for the second quarter of 2025.
In the second quarter of 2025, the Company’s adjusted operating earnings(1) included the following main pre-tax adjustments:
| ● | $78.9 million in merger-related costs associated with the Sandy Spring Bancorp, Inc. (“Sandy Spring”) acquisition |
| ● | $100.9 million in current expected credit losses (“CECL”) Day 1 initial provision expense related to the Sandy Spring acquisition, comprised of the initial provision expense on purchased non-credit deteriorated (“non-PCD”) loans, which represents the CECL “double count” of the non-PCD loan credit mark, and the additional provision for unfunded commitments |
| ● | $15.7 million gain on sale of $2.0 billion of commercial real estate (“CRE”) loans acquired in the Sandy Spring acquisition, which were previously identified, marked to fair value, and classified as held for sale as of the April 1, 2025 acquisition date |
| ● | $14.3 million gain on sale of our equity interest in Cary Street Partners LLC (“CSP”) |
Merger with Sandy Spring and Full Physical Settlement of the Forward Sale Agreements
On April 1, 2025, the Company completed its acquisition of Sandy Spring and its results of operations are included in the Company’s consolidated results since the date of acquisition. Therefore, the Company’s second quarter and first half of 2025 results reflect increased levels of average balances, net interest income, and expense compared to its prior quarter and first half of 2024 results. After purchase accounting fair value adjustments, the acquisition added $13.0 billion of total assets, including $8.6 billion of loans held for investment (“LHFI”), $1.9 billion of loans held for sale, primarily consisting of the CRE loans sold during the quarter subsequent to the acquisition discussed below, as well as $12.2 billion of total liabilities, primarily consisting of $11.2 billion in deposits. The Company recorded preliminary goodwill of $496.9 million and core deposit intangibles and other intangibles of $290.7 million related to the acquisition.
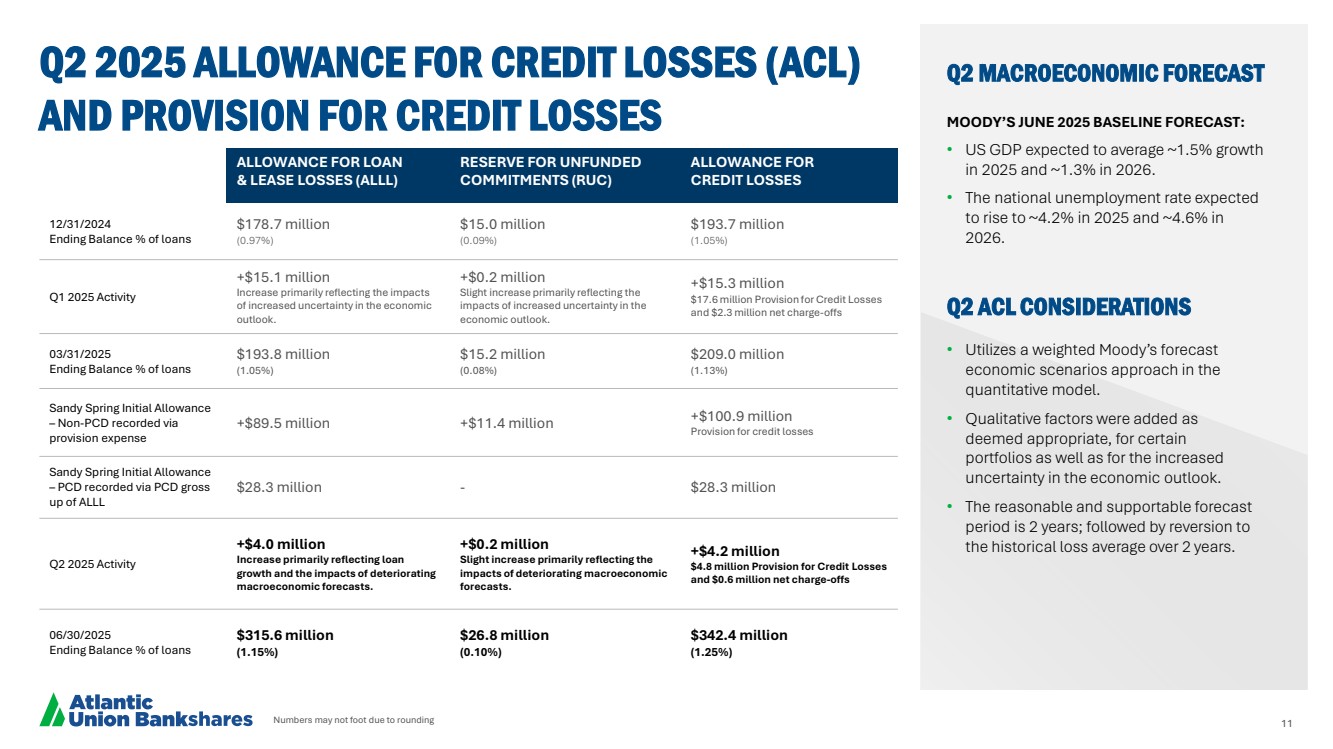
In connection with the acquisition, the Company recorded an initial allowance for credit losses (“ACL”) of $129.2 million that consisted of an allowance for loan and lease losses (“ALLL”) of $117.8 million, which included a $28.3 million reserve on acquired loans that experienced a more-than insignificant amount of credit deterioration since origination (“PCD” loans), and a reserve for unfunded commitments (“RUC”) discussed below. The Company also recorded a $89.5 million reserve on non-PCD loans established through provision expense, which represents the CECL “double count” of the non-PCD credit mark, and a $11.4 million RUC through the provision for credit losses.
Also on April 1, 2025, the Company physically settled in full the previously disclosed forward sale agreements between the Company and Morgan Stanley & Co. LLC, as forward purchaser, by delivering 11,338,028 shares of the Company’s common stock to the forward purchaser. The Company received net proceeds from such sale of shares of the Company’s common stock and full physical settlement of the forward sale agreements, before expenses, of approximately $385.0 million.
CRE Loan Sale
On June 26, 2025, the Company completed the sale of approximately $2.0 billion of performing CRE loans acquired in the Sandy Spring acquisition, which the Company marked to fair value at $1.8 billion and classified as held for sale as of the April 1, 2025 acquisition date. The CRE loan sale transaction generated a $15.7 million pre-tax gain during the second quarter of 2025. Under the terms of the loan purchase agreement, the Company sold the loans without recourse and retained customer-facing servicing responsibilities.
“With the closing of the Sandy Spring acquisition on April 1, 2025, our second quarter results provide an initial view into the operating earnings power of our combined franchise,” said John C. Asbury, president and chief executive officer of Atlantic Union. “While merger-related costs created a noisy quarter, our operating results demonstrate that we are off to a great start with the acquisition.
It was also a productive quarter as we physically settled in full the previously announced forward sale of common equity and received net proceeds, before expenses, of $385.0 million, closed on the planned sale of approximately $2.0 billion of CRE loans acquired from Sandy Spring, and sold our equity interest in Cary Street Partners resulting in a pre-tax gain of $14.3 million. The CRE loan sale was an important step in executing on our strategy related to the Sandy Spring acquisition and our team achieved better-than-expected pricing on the sale, which resulted in a pre-tax gain on sale of $15.7 million.
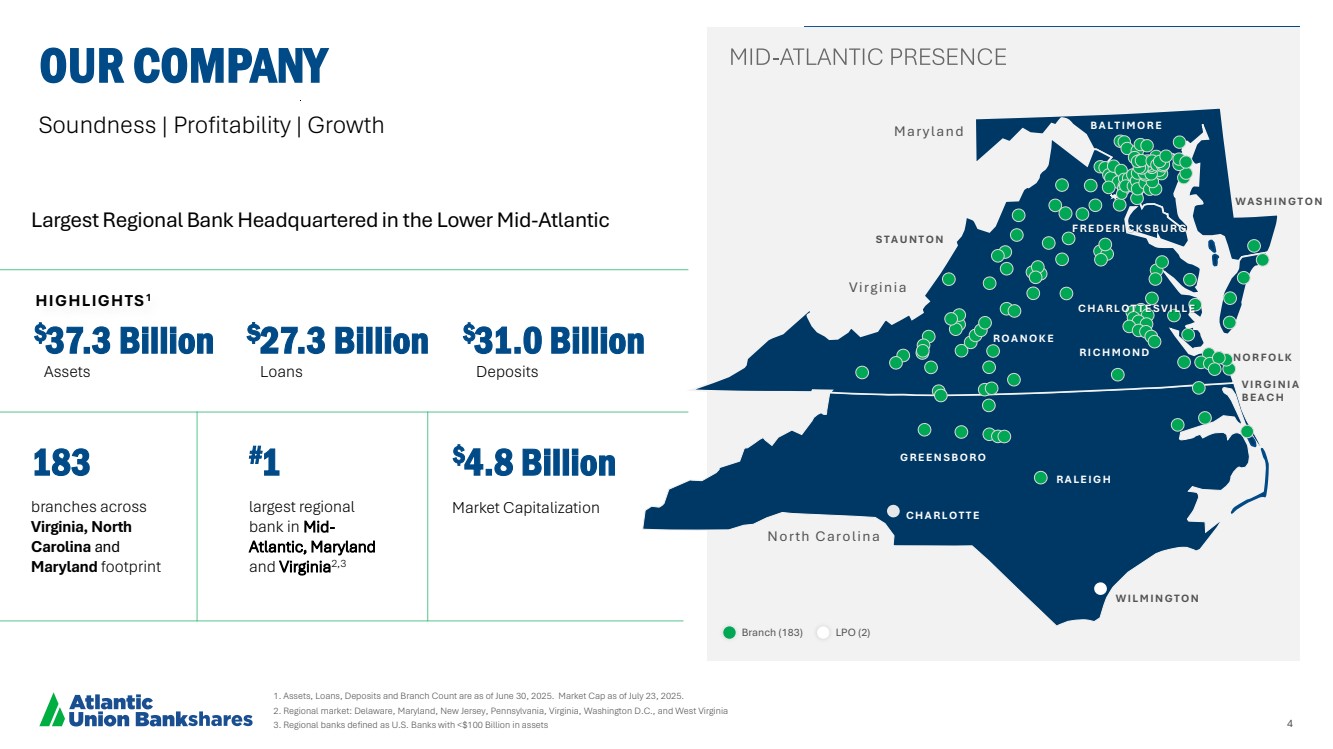
Atlantic Union is a story of transformation from a Virginia community bank to the largest regional bank headquartered in the lower Mid-Atlantic, with operations throughout Virginia, Maryland, and a growing presence in North Carolina. Operating under the mantra of soundness, profitability, and growth – in that order of priority – Atlantic Union remains committed to generating sustainable, profitable growth and building long-term value for our shareholders.”
NET INTEREST INCOME
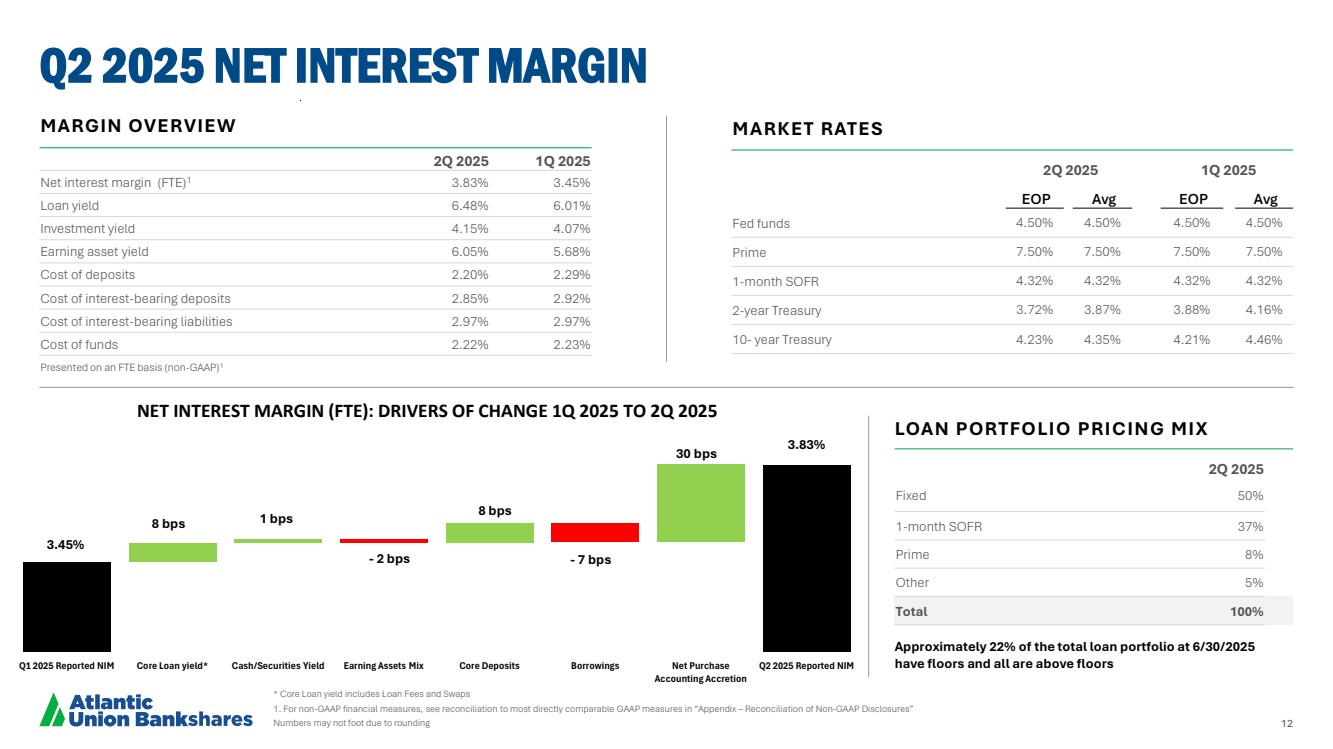
For the second quarter of 2025, net interest income was $321.4 million, an increase of $137.2 million from $184.2 million in the first quarter of 2025. Net interest income - fully taxable equivalent (“FTE”)(1) was $325.7 million in the second quarter of 2025, an increase of $137.8 million from $187.9 million in the first quarter of 2025. The increases from the prior quarter in both net interest income and net interest income (FTE)(1) are due primarily to a $12.0 billion increase in average interest earning assets due primarily to the addition of Sandy Spring acquired loans and the impact of loan accretion income related to acquisition accounting, as well as organic loan growth, partially offset by a $8.9 billion increase in average interest bearing liabilities due primarily to the addition of Sandy Spring acquired deposits and borrowings and the associated net amortization related to acquisition accounting.
For the second quarter of 2025, the Company’s net interest margin increased 40 basis points to 3.78% and the net interest margin (FTE)(1) increased 38 basis points to 3.83%, compared to the first quarter of 2025, primarily driven by the net accretion of purchase accounting adjustments on loans, deposits, and long-term borrowings related to the Sandy Spring acquisition. Earning asset yields for the second quarter of 2025 increased 37 basis points to 6.05%, compared to the first quarter of 2025, due to higher yields on loans, primarily as a result of higher accretion income due to the Sandy Spring acquisition. Cost of funds decreased by 1 basis point to 2.22% for the second quarter of 2025, compared to the first quarter of 2025, primarily due to a lower cost of deposits, which includes the acquisition related accretion, partially offset by higher borrowing costs, primarily due to increased long-term subordinated debt as a result of the Sandy Spring acquisition.
The Company’s net interest margin (FTE)(1) includes the impact of acquisition accounting fair value adjustments. Net accretion income related to acquisition accounting was $45.4 million for the quarter ended June 30, 2025 compared to $12.6 million for the quarter ended March 31, 2025, with the increase due to the Sandy Spring acquisition. The impact of accretion and amortization for the periods presented are reflected in the following table (dollars in thousands):
| | | | | | | | | | | | |
| | | | Deposit | | | | | | | ||
| | Loan | | Accretion | | Borrowings | | | | |||
|
| Accretion |
| (Amortization) |
| Amortization |
| Total | ||||
For the quarter ended March 31, 2025 | | $ | 13,286 | | $ | (415) | | $ | (287) | | $ | 12,584 |
For the quarter ended June 30, 2025 | | | 45,744 | | | 1,884 | | | (2,256) | | | 45,372 |
ASSET QUALITY
Overview
At June 30, 2025, nonperforming assets (“NPAs”) as a percentage of total LHFI was 0.60%, an increase of 22 basis points from the prior quarter and included nonaccrual loans of $162.6 million. The increase in NPAs as a percentage of LHFI was primarily due to PCD loans acquired from Sandy Spring, primarily in the construction and land development, commercial real estate non-owner occupied, residential 1-4 family consumer and revolving, and commercial real estate owner occupied portfolios, which were nonperforming at the time of acquisition and were recorded at their amortized cost basis, which reflects their acquisition date fair value plus the initial allowance for expected credit losses recognized at acquisition, in accordance with ASC 326, Financial Instruments – Credit Losses. Accruing past due loans as a percentage of total LHFI totaled 28 basis points at June 30, 2025, an increase of 1 basis point from March 31, 2025, and an increase of 6 basis points from June 30, 2024. Net charge-offs were 0.01% of total average LHFI (annualized) for the second quarter of 2025, a decrease of 4 basis points compared to March 31, 2025, and a decrease of 3 basis points compared to June 30, 2024. The ACL totaled $342.4 million at June 30, 2025, a $133.3 million increase from the prior quarter, primarily reflecting the impacts of the Sandy Spring acquisition.
At June 30, 2025, NPAs totaled $163.4 million, compared to $69.4 million as of March 31, 2025. The increase in NPAs was primarily due to PCD loans acquired in the Sandy Spring acquisition, which included $49.4 million of acquired construction and land development loans, $27.1 million of acquired commercial real estate non-owner occupied loans, $10.3 million of acquired residential 1-4 family consumer and revolving loans, $3.1 million of acquired commercial real estate owner occupied loans, and the remainder due to other acquired Sandy Spring loans. The following table shows a summary of NPA balances at the quarters ended (dollars in thousands):
|
| June 30, |
| March 31, |
| December 31, |
| September 30, |
| June 30, | |||||
| | 2025 | | 2025 | | 2024 | | 2024 | | 2024 | |||||
Nonaccrual loans | | $ | 162,615 | | $ | 69,015 | | $ | 57,969 | | $ | 36,847 | | $ | 35,913 |
Foreclosed properties | |
| 774 | |
| 404 | |
| 404 | |
| 404 | |
| 230 |
Total nonperforming assets | | $ | 163,389 | | $ | 69,419 | | $ | 58,373 | | $ | 37,251 | | $ | 36,143 |
The following table shows the activity in nonaccrual loans for the quarters ended (dollars in thousands):
|
| June 30, |
| March 31, |
| December 31, |
| September 30, |
| June 30, | |||||
| | 2025 | | 2025 | | 2024 | | 2024 | | 2024 | |||||
Beginning Balance | | $ | 69,015 | | $ | 57,969 | | $ | 36,847 | | $ | 35,913 | | $ | 36,389 |
Net customer payments | |
| (4,595) | |
| (898) | |
| (11,491) | |
| (2,219) | |
| (6,293) |
Additions | |
| 98,975 | |
| 13,197 | |
| 34,446 | |
| 5,347 | |
| 6,831 |
Charge-offs | |
| (780) | |
| (1,253) | |
| (1,231) | |
| (542) | |
| (759) |
Loans returning to accruing status | |
| — | |
| — | |
| (602) | |
| (1,478) | |
| (54) |
Transfers to foreclosed property | |
| — | |
| — | |
| — | |
| (174) | |
| (201) |
Ending Balance | | $ | 162,615 | | $ | 69,015 | | $ | 57,969 | | $ | 36,847 | | $ | 35,913 |
Past Due Loans
At June 30, 2025, past due loans still accruing interest totaled $77.7 million or 0.28% of total LHFI, compared to $50.0 million or 0.27% of total LHFI at March 31, 2025, and $40.2 million or 0.22% of total LHFI at June 30, 2024. The increase in past due loan levels at June 30, 2025 from March 31, 2025 was primarily within the construction and land development, commercial and industrial, commercial real estate owner occupied, and residential 1-4 family – commercial portfolios. Of the total past due loans still accruing interest, $39.8 million or 0.15% of total LHFI were past due 90 days or more at June 30, 2025, compared to $6.8 million or 0.04% of total LHFI at March 31, 2025, and $15.6 million or 0.09% of total LHFI at June 30, 2024.
At June 30, 2025, the ACL was $342.4 million, an increase of $133.3 million from the prior quarter, and included an ALLL of $315.6 million and an RUC of $26.8 million. At April 1, 2025, the initial ACL related to the Sandy Spring acquisition was $129.2 million, consisting of an ALLL of $117.8 million and RUC of $11.4 million. The ALLL included
an $89.5 million reserve on acquired non-PCD loans established through provision expense, which represents the CECL “double count” of the non-PCD credit mark, and a $28.3 million reserve on PCD loans. Outside of the initial ACL related to the Sandy Spring acquisition, the ACL at June 30, 2025 increased $4.1 million from March 31, 2025, primarily reflecting the impacts of loan growth and deteriorating macroeconomic forecasts.
The ACL as a percentage of total LHFI was 1.25% at June 30, 2025, compared to 1.13% at March 31, 2025. The ALLL as a percentage of total LHFI was 1.15% at June 30, 2025, compared to 1.05% at March 31, 2025.
Net Charge-offs
Net charge-offs were $666,000 or 0.01% of total average LHFI on an annualized basis for the second quarter of 2025, compared to $2.3 million or 0.05% (annualized) for the first quarter of 2025, and $1.7 million or 0.04% (annualized) for the second quarter of 2024.
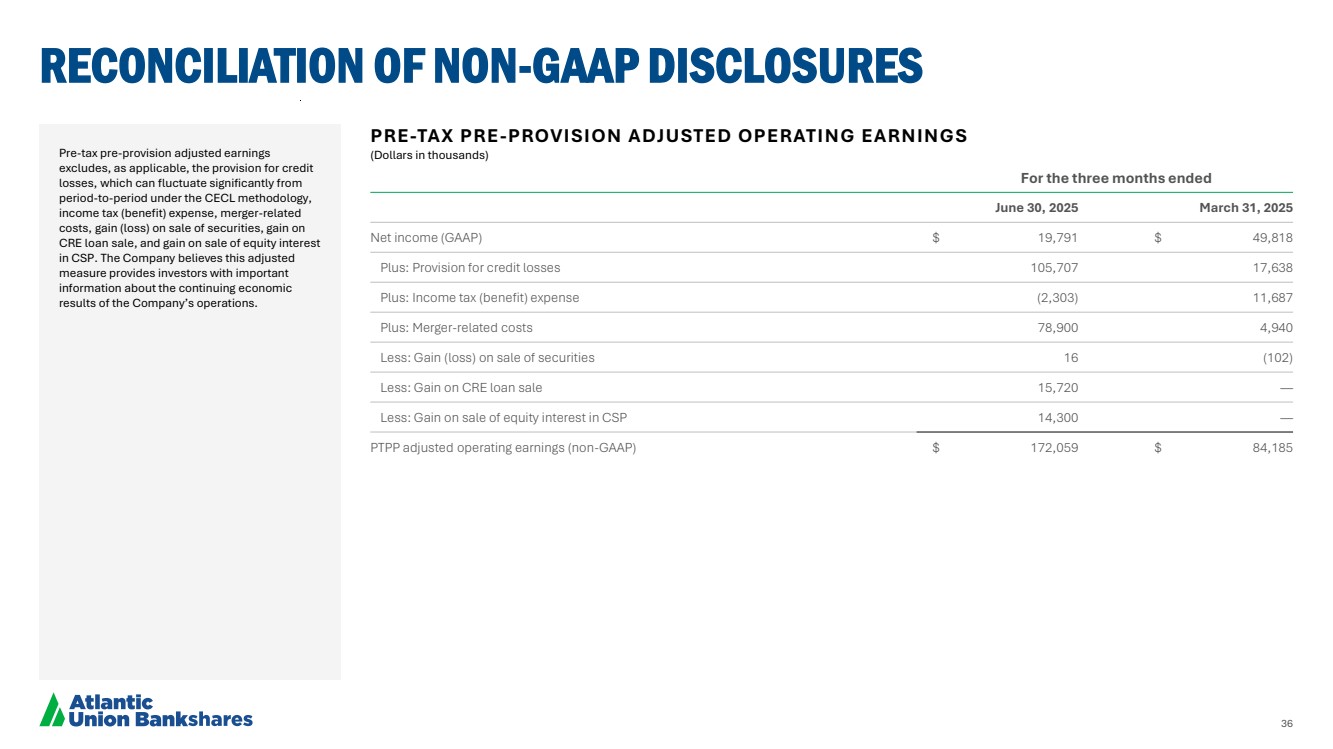
Provision for Credit Losses
For the second quarter of 2025, the Company recorded a provision for credit losses of $105.7 million, compared to $17.6 million in the prior quarter, and $21.8 million in the second quarter of 2024. Included in the provision for credit losses for the second quarter of 2025 was $89.5 million of Day 1 initial provision expense on non-PCD loans and $11.4 million on unfunded commitments, each acquired from Sandy Spring. Included in the provision for credit losses for the second quarter of 2024 was $13.2 million of Day 1 initial provision expense on non-PCD loans and $1.4 million on unfunded commitments, each acquired from American National. Outside of the Day 1 initial provision expense recorded on non-PCD loans and unfunded commitments acquired from Sandy Spring and American National, the provision for credit losses decreased compared to the prior quarter and the prior year, primarily reflecting the impact of the overall build in the allowance for loan losses due to the uncertainty in the economic outlook in the prior quarter and prior year, as well as lower net charge-offs in the second quarter of 2025.
NONINTEREST INCOME
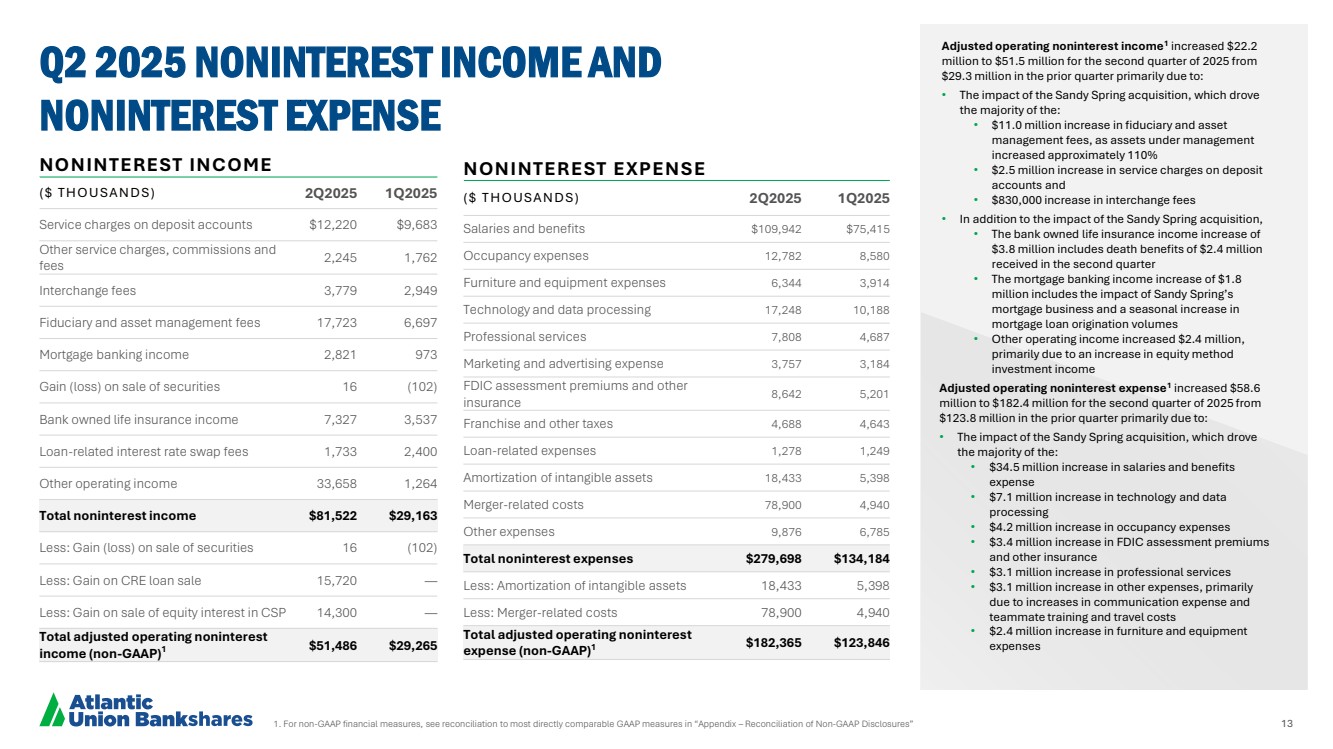
Noninterest income increased $52.3 million to $81.5 million for the second quarter of 2025 from $29.2 million in the prior quarter, primarily driven by the $15.7 million gain on the CRE loan sale, a $14.3 million gain on the sale of our equity interest in CSP, and the full quarter impact of the Sandy Spring acquisition that closed on April 1, 2025.
Adjusted operating noninterest income(1) which excludes the gain on CRE loan sale ($15.7 million in the second quarter), gain on sale of our equity interest in CSP ($14.3 million in the second quarter), and gains and losses on sale of securities (gains of $16,000 in the second quarter and losses of $102,000 in the first quarter), increased $22.2 million to $51.5 million, compared to $29.3 million in the prior quarter. This increase was primarily due to the impact of the Sandy Spring acquisition, which drove the majority of the $11.0 million increase in fiduciary and asset management fees, due to assets under management increasing approximately 110% from the prior quarter, the $2.5 million increase in service charges on deposit accounts, and the $830,000 increase in interchange fees. In addition to the impact of the Sandy Spring acquisition, the bank owned life insurance income increase of $3.8 million includes death benefits of $2.4 million received in the second quarter and the mortgage banking income increase of $1.8 million includes the impact of the Sandy Spring’s mortgage business, as well as a seasonal increase in mortgage loan origination volumes. Other operating income increased $2.4 million, primarily due to an increase in equity method investment income.
NONINTEREST EXPENSE
Noninterest expense increased $145.5 million to $279.7 million for the second quarter of 2025 from $134.2 million in the prior quarter, primarily driven by a $74.0 million increase in merger-related costs, as well as other increases in noninterest expense due to the full quarter impact of the Sandy Spring acquisition.
Adjusted operating noninterest expense(1) which excludes merger-related costs ($78.9 million in the second quarter and $4.9 million in the first quarter) and amortization of intangible assets ($18.4 million in the second quarter and $5.4 million in the first quarter) increased $58.6 million to $182.4 million, compared to $123.8 million in the prior quarter. This increase was primarily due to the impact of the Sandy Spring acquisition, which drove the majority of the $34.5 million increase in salaries and benefits, the $7.1 million increase in technology and data processing, the $4.2 million increase in occupancy expenses, the $3.4 million increase in FDIC assessment premiums and other insurance, the $3.1 million increase in professional services, the $3.1 million increase in other expenses, primarily due to increases in communication expense and teammate training and travel costs, and the $2.4 million increase in furniture and equipment expenses.
INCOME TAXES
During the second quarter of 2025, the Company’s estimated annual effective tax rate (“AETR”) increased to 21.7% from approximately 19.0% in the first quarter of 2025, reflecting the impact of the Sandy Spring acquisition as Sandy Spring operated in a higher state tax jurisdiction, which now impacts a larger proportion of the Company’s consolidated pre-tax income. The updated AETR was applied to the year-to-date pre-tax income calculation during the second quarter of 2025, impacting the Company’s income tax expense for the quarter ended June 30, 2025.
The Company’s effective tax rate for the three months ended June 30, 2025 and March 31, 2025 was (13.2%) and 19.0%, respectively. The negative effective tax rate for the quarter ended June 30, 2025 reflects the impact of a $8.0 million income tax benefit recorded this quarter related to the Company re-evaluating its state deferred tax asset, as a result of the Sandy Spring acquisition.
BALANCE SHEET
At June 30, 2025, the Company’s consolidated balance sheet includes the impact of the Sandy Spring acquisition, which closed April 1, 2025, as discussed above. ASC 805, Business Combinations, allows for a measurement period of twelve months beyond the acquisition date to finalize the fair value measurements of an acquired company’s net assets as additional information existing as of the acquisition date becomes available. If applicable, any future measurement period adjustments will be recorded through goodwill upon identification. Below is a summary of the related impact of the Sandy Spring acquisition as of the acquisition date:
| ● | The fair value of assets acquired totaled $13.0 billion and included LHFI of $8.6 billion with an initial loan discount of $789.7 million, loans held for sale of $1.9 billion, and total investments of $1.3 billion. |
| ● | The fair value of the liabilities assumed totaled $12.2 billion and included total deposits of $11.2 billion with an initial deposit mark related to time deposits of $243.4 million and total borrowings of $833.0 million. |
| ● | Core deposit intangibles and other intangibles recorded totaled $290.7 million. |
| ● | Preliminary goodwill recorded totaled $496.9 million. |
On June 26, 2025, the Company completed the sale of approximately $2.0 billion of performing CRE loans acquired in the Sandy Spring acquisition, which the Company marked to fair value at $1.84 billion and classified as held for sale as of the April 1, 2025 acquisition date. The Company received net proceeds from the sale of the CRE loans, before expenses, of approximately $1.87 billion, which increased the Company’s cash balance at June 30, 2025, and a portion of such proceeds were used to repay the Company’s short-term Federal Home Loan Bank advances and brokered CDs that matured during the second quarter of 2025.
At June 30, 2025, total assets were $37.3 billion, an increase of $12.7 billion from March 31, 2025, and $12.5 billion or approximately 50.6% from June 30, 2024. The increases in total assets from the prior quarter and prior year were primarily driven by growth in LHFI and the available for sale (“AFS”) securities portfolio, primarily due to the Sandy Spring acquisition. At June 30, 2025, cash and cash equivalents were $1.6 billion, an increase of $1.2 billion from March 31, 2025, and $1.1 billion from June 30, 2024, primarily reflecting the impact from the CRE loan sale proceeds.
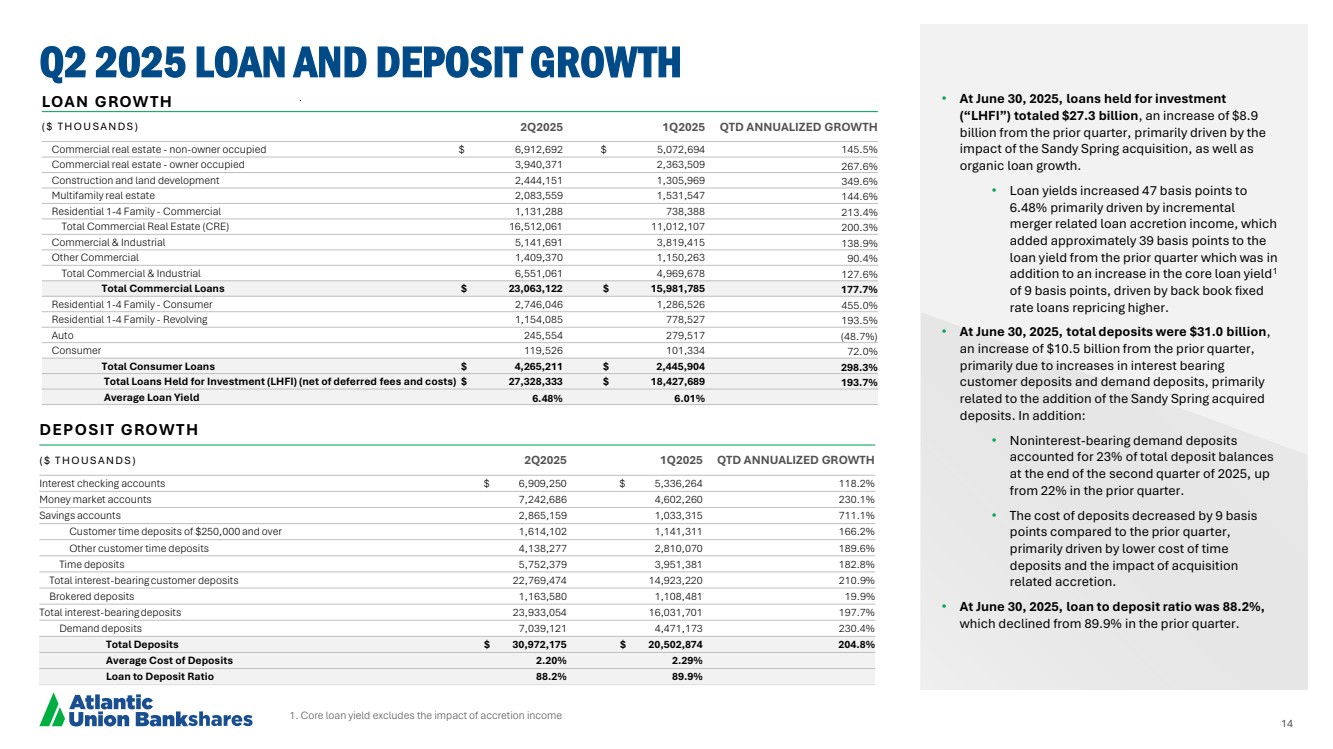
At June 30, 2025, LHFI totaled $27.3 billion, an increase of $8.9 billion from March 31, 2025, and an increase of $9.0 billion or 49.0% from June 30, 2024. LHFI increased from the prior quarter and prior year primarily due to the Sandy Spring acquisition, as well as organic loan growth.
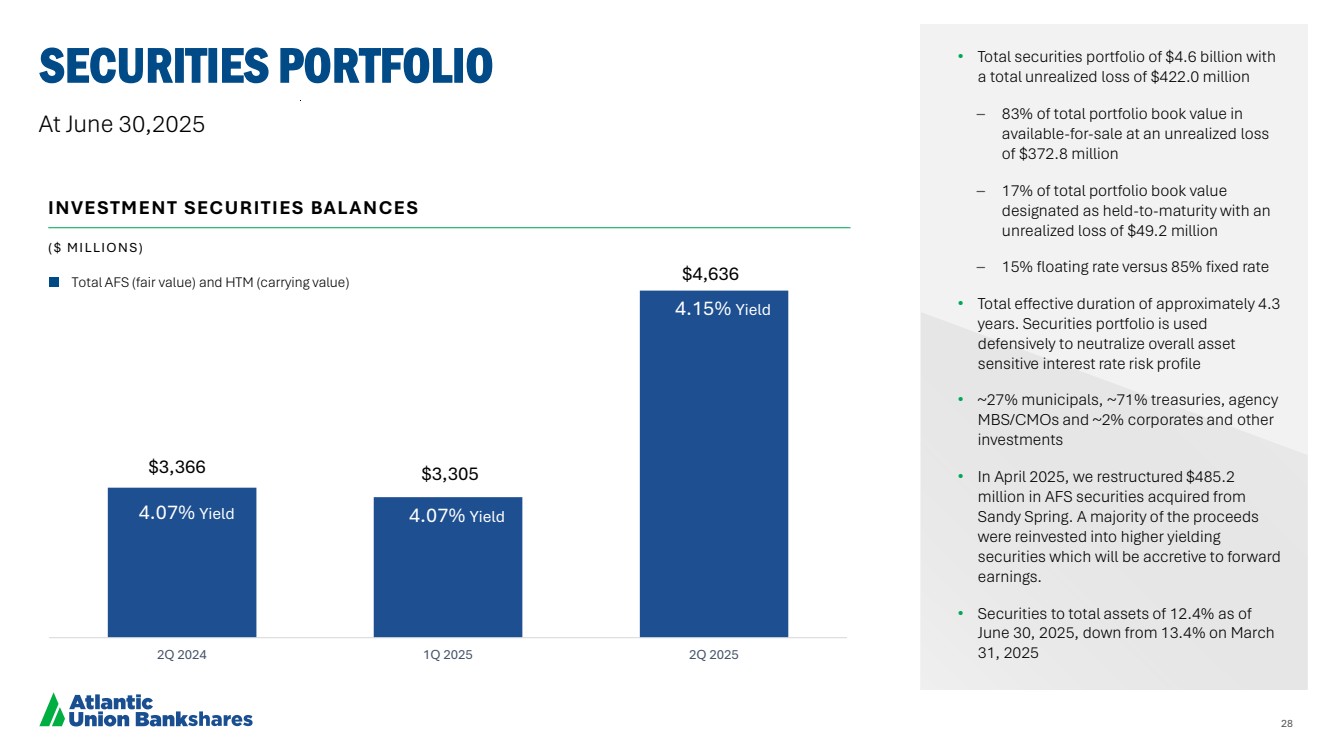
At June 30, 2025, total investments were $4.8 billion, an increase of $1.4 billion from March 31, 2025, and an increase of $1.3 billion or 36.8% from June 30, 2024. The increases compared to the prior quarter and prior year were primarily due to the Sandy Spring acquisition. AFS securities totaled $3.8 billion at June 30, 2025, $2.5 billion at March 31, 2025, and $2.6 billion at June 30, 2024. As part of the Sandy Spring acquisition, the Company restructured $485.2 million of securities acquired from Sandy Spring and reinvested the proceeds into higher yielding securities. Total net unrealized losses on the AFS securities portfolio were $372.8 million at June 30, 2025, compared to $382.0 million at March 31, 2025, and $420.7 million at June 30, 2024. Held to maturity securities are carried at cost and totaled $827.1 million at
June 30, 2025, $821.1 million at March 31, 2025, and $810.5 million at June 30, 2024 and had net unrealized losses of $49.2 million at June 30, 2025, $48.6 million at March 31, 2025, and $44.0 million at June 30, 2024.
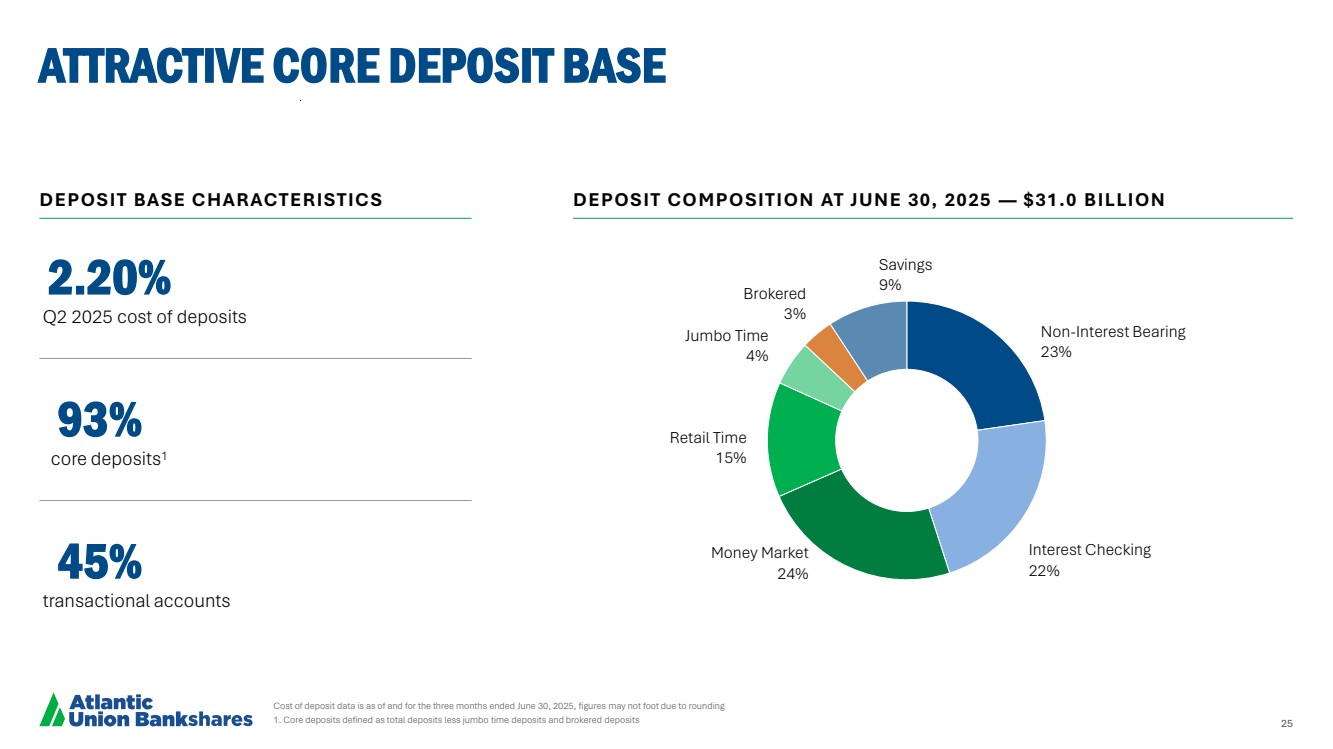
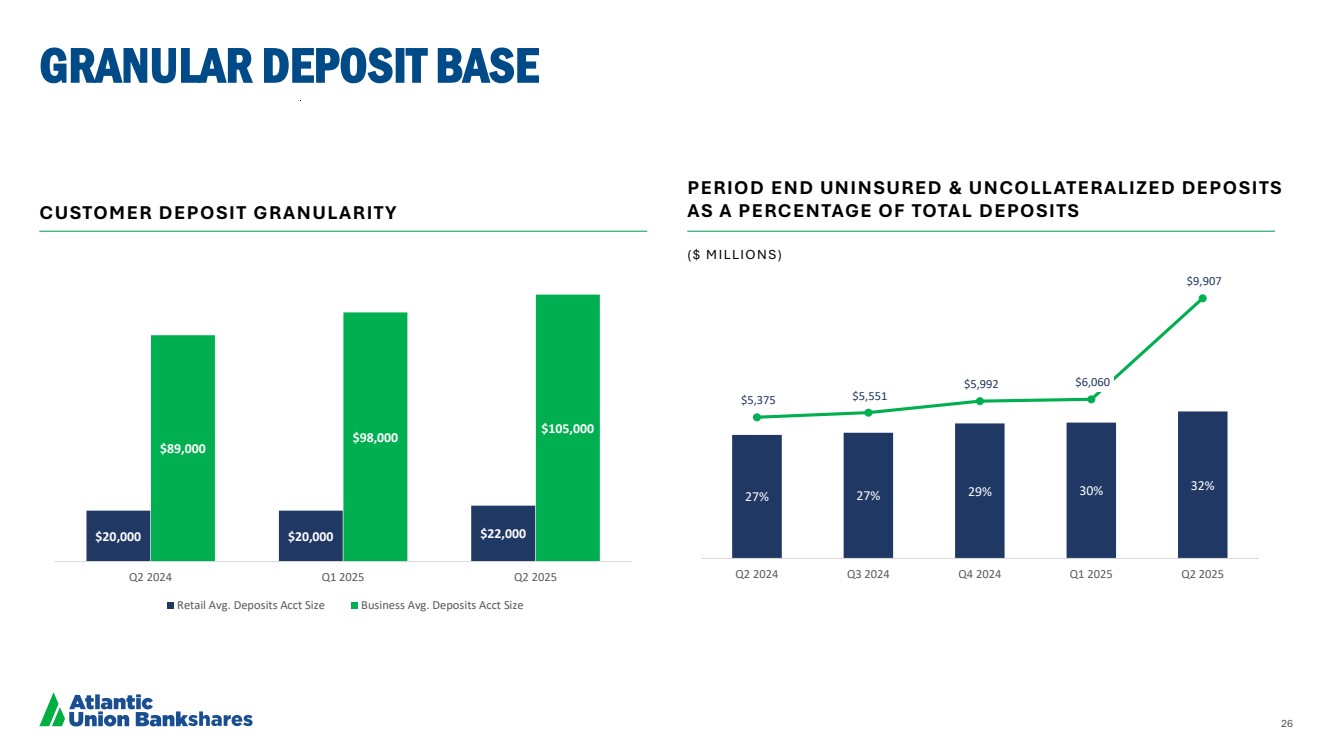
At June 30, 2025, total deposits were $31.0 billion, an increase of $10.5 billion from the prior quarter, and an increase of $11.0 billion or 54.9% from June 30, 2024. The increases in total deposits from the prior quarter and prior year were primarily due to increases in interest-bearing customer deposits and demand deposits, primarily related to the addition of the Sandy Spring acquired deposits.
At June 30, 2025, total borrowings were $892.8 million, an increase of $417.1 million from March 31, 2025 primarily driven by the acquisition of long-term subordinated debt issued by Sandy Spring, and a decrease of $314.0 million or 26.0% from June 30, 2024. The increase in borrowings from the prior quarter was primarily due to the Sandy Spring acquisition, while the decrease from the same period in the prior year was primarily due to repayment of short-term Federal Home Loan Bank advances.
The following table shows the Company’s capital ratios at the quarters ended:
|
| June 30, |
| March 31, |
| June 30, |
|
| | 2025 | | 2025 | | 2024 |
|
Common equity Tier 1 capital ratio (2) |
| 9.77 | % | 10.07 | % | 9.47 | % |
Tier 1 capital ratio (2) |
| 10.32 | % | 10.87 | % | 10.26 | % |
Total capital ratio (2) |
| 13.73 | % | 13.88 | % | 12.99 | % |
Leverage ratio (Tier 1 capital to average assets) (2) |
| 8.65 | % | 9.45 | % | 9.05 | % |
Common equity to total assets |
| 12.51 | % | 12.26 | % | 11.62 | % |
Tangible common equity to tangible assets (1) |
| 7.39 | % | 7.39 | % | 6.71 | % |
(1) These are financial measures not calculated in accordance with generally accepted accounting principles (“GAAP”). For a reconciliation of these non-GAAP financial measures, see the “Alternative Performance Measures (non-GAAP)” section of the Key Financial Results.
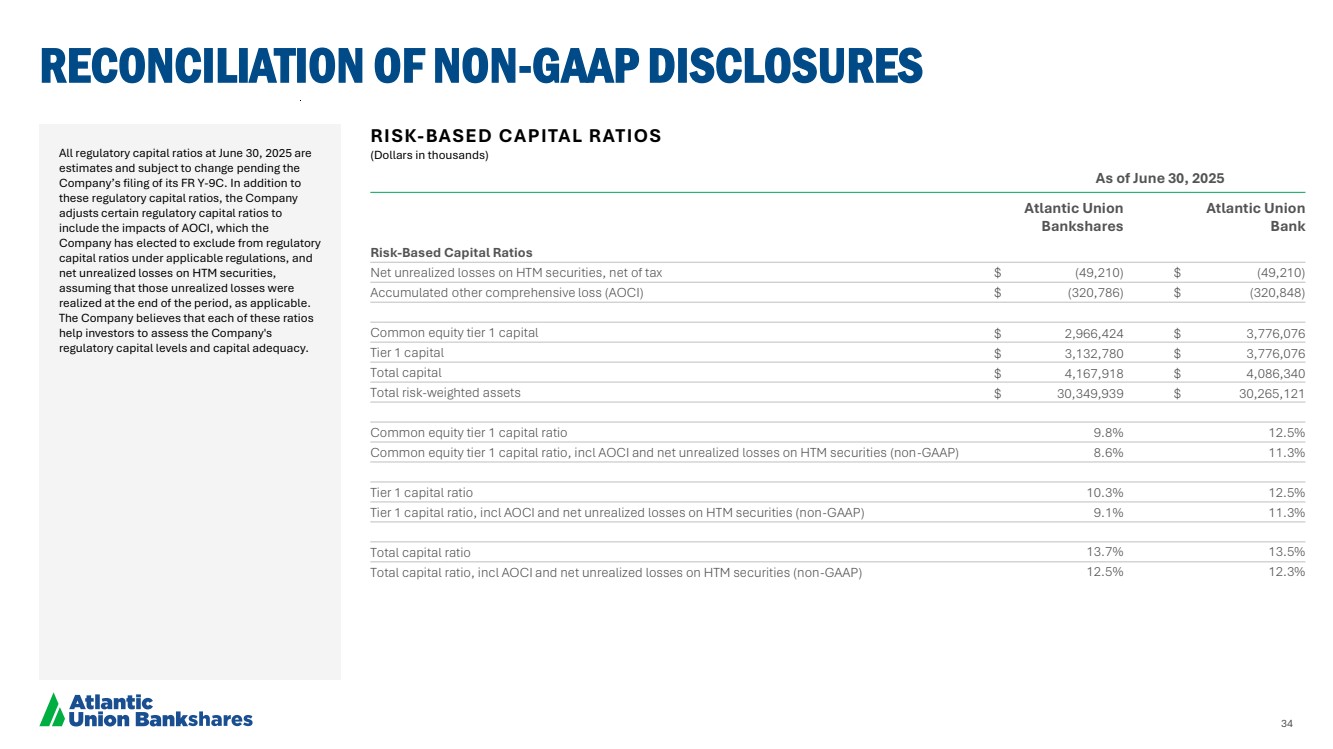
(2) All ratios at June 30, 2025 are estimates and subject to change pending the Company’s filing of its FR Y9-C. All other periods are presented as filed.
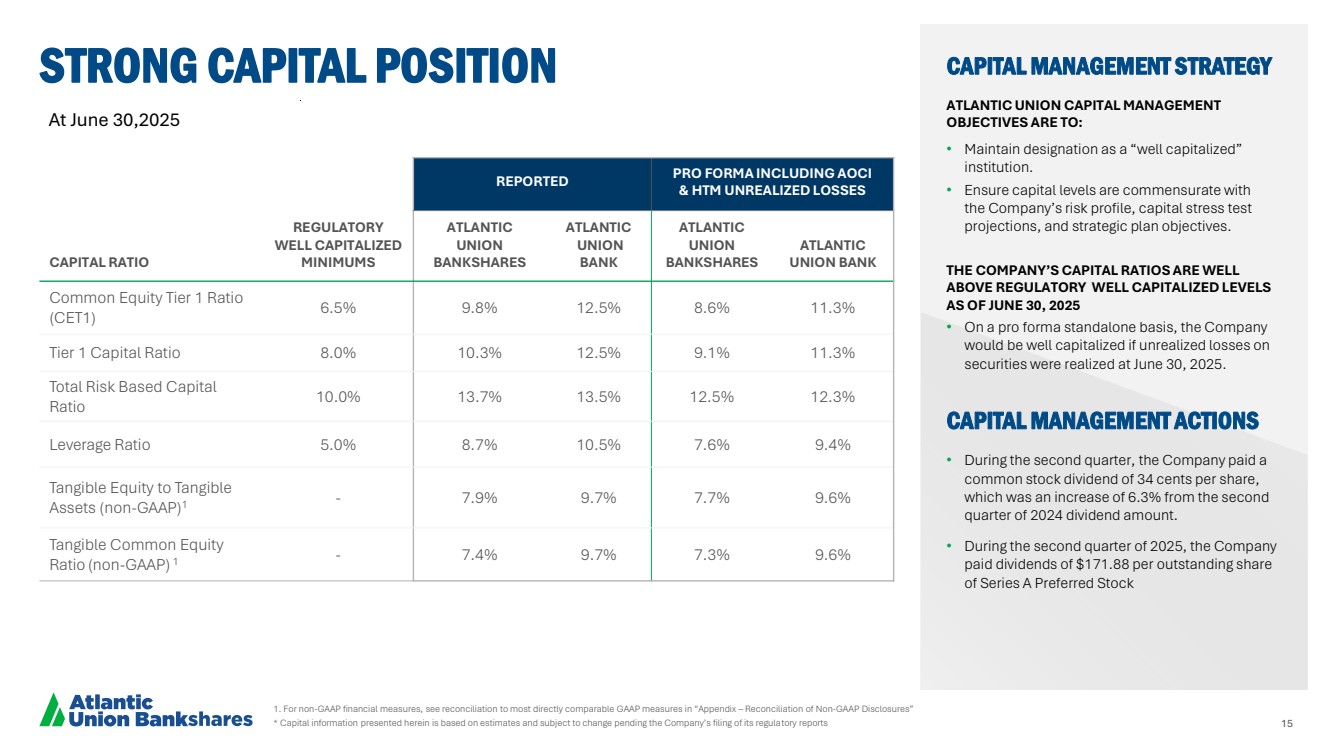
During the second quarter of 2025, the Company declared and paid a quarterly dividend on the outstanding shares of Series A Preferred Stock of $171.88 per share (equivalent to $0.43 per outstanding depositary share), consistent with the first quarter of 2025 and the second quarter of 2024. During the second quarter of 2025, the Company also declared and paid cash dividends of $0.34 per common share, consistent with the first quarter of 2025 and a $0.02 increase or approximately 6.3% from the second quarter of 2024.
On April 1, 2025, the Company physically settled in full the previously disclosed forward sale agreements between the Company and Morgan Stanley & Co. LLC, as forward purchaser, by delivering 11,338,028 shares of the Company’s common stock to the forward purchaser. The Company received net proceeds from such sale of shares of the Company’s common stock and full physical settlement of the forward sale agreements, before expenses, of approximately $385.0 million.
ABOUT ATLANTIC UNION BANKSHARES CORPORATION
Headquartered in Richmond, Virginia, Atlantic Union Bankshares Corporation (NYSE: AUB) is the holding company for Atlantic Union Bank. Atlantic Union Bank has branches and ATMs located in Virginia, Maryland and North Carolina. Certain non-bank financial services affiliates of Atlantic Union Bank include: Atlantic Union Equipment Finance, Inc., which provides equipment financing; Atlantic Union Financial Consultants, LLC, which provides brokerage services; and Union Insurance Group, LLC, which offers various lines of insurance products.
SECOND QUARTER 2025 EARNINGS RELEASE CONFERENCE CALL
The Company will hold a conference call and webcast for investors at 9:00 a.m. Eastern Time on Thursday, July 24, 2025, during which management will review our financial results for the second quarter 2025 and provide an update on our recent activities.
The listen-only webcast and the accompanying slides can be accessed at:
https://edge.media-server.com/mmc/p/qhq3zxe7.
For analysts who wish to participate in the conference call, please register at the following URL:
https://register-conf.media-server.com/register/BI5ce9a0a26dc048d7a667f6dd94226844. To participate in the conference call, you must use the link to receive an audio dial-in number and an Access PIN.
A replay of the webcast, and the accompanying slides, will be available on the Company’s website for 90 days at: https://investors.atlanticunionbank.com/.
NON-GAAP FINANCIAL MEASURES
In reporting the results as of and for the period ended June 30, 2025, we have provided supplemental performance measures determined by methods other than in accordance with GAAP. These non-GAAP financial measures are a supplement to GAAP, which we use to prepare our financial statements, and should not be considered in isolation or as a substitute for comparable measures calculated in accordance with GAAP. In addition, our non-GAAP financial measures may not be comparable to non-GAAP financial measures of other companies. We use the non-GAAP financial measures discussed herein in our analysis of our performance. Management believes that these non-GAAP financial measures provide additional understanding of ongoing operations, enhance the comparability of our results of operations with prior periods and show the effects of significant gains and charges in the periods presented without the impact of items or events that may obscure trends in our underlying performance. For a reconciliation of these measures to their most directly comparable GAAP measures and additional information about these non-GAAP financial measures, see “Alternative Performance Measures (non-GAAP)” in the tables within the section “Key Financial Results.”
FORWARD-LOOKING STATEMENTS
This press release and statements by our management may constitute “forward-looking statements” within the meaning of the Private Securities Litigation Reform Act of 1995. Forward-looking statements are statements that include, without limitation, statements made in Mr. Asbury’s quotations, statements regarding the recently completed acquisition of Sandy Spring, including expectations with regard to the benefits of the Sandy Spring acquisition; statements regarding our business, financial and operating results, including our deposit base and funding; the impact of changes in economic conditions, anticipated changes in the interest rate environment and the related impacts on our net interest margin, changes in economic, fiscal or trade policy and the potential impacts on our business, loan demand and economic conditions; in our markets and nationally; management’s beliefs regarding our liquidity, capital resources, asset quality, CRE loan portfolio and our customer relationships; and statements that include other projections, predictions, expectations, or beliefs about future events or results or otherwise are not statements of historical fact. Such forward-looking statements are based on certain assumptions as of the time they are made, and are inherently subject to known and unknown risks, uncertainties, and other factors, some of which cannot be predicted or quantified, that may cause actual results, performance, or achievements to be materially different from those expressed or implied by such forward-looking statements. Forward-looking statements are often characterized by the use of qualified words (and their derivatives) such as “expect,” “believe,” “estimate,” “plan,” “project,” “anticipate,” “intend,” “will,” “may,” “view,” “opportunity,” “seek to,” “potential,” “continue,” “confidence,” or words of similar meaning or other statements concerning opinions or judgment of the Company and our management about future events. Although we believe that our expectations with respect to forward-looking statements are based upon reasonable assumptions within the bounds of our existing knowledge of our business and operations, there can be no assurance that actual future results, performance, or achievements of, or trends affecting, us will not differ materially from any projected future results, performance, achievements or trends expressed or implied by such forward-looking statements. Actual future results, performance, achievements or trends may differ materially from historical results or those anticipated depending on a variety of factors, including, but not limited to, the effects of or changes in:
| ● | market interest rates and their related impacts on macroeconomic conditions, customer and client behavior, our funding costs and our loan and securities portfolios; |
| ● | economic conditions, including inflation and recessionary conditions and their related impacts on economic growth and customer and client behavior; |
| ● | U.S. and global trade policies and tensions, including change in, or the imposition of, tariffs and/or trade barriers and the economic impacts, volatility and uncertainty resulting therefrom, and geopolitical instability; |
| ● | volatility in the financial services sector, including failures or rumors of failures of other depository institutions, along with actions taken by governmental agencies to address such turmoil, and the effects on the ability of depository institutions, including us, to attract and retain depositors and to borrow or raise capital; |
| ● | legislative or regulatory changes and requirements, including as part of the regulatory reform agenda of the Trump administration, including changes in federal, state or local tax laws and changes impacting the rulemaking, supervision, examination and enforcement priorities of the federal banking agencies; |
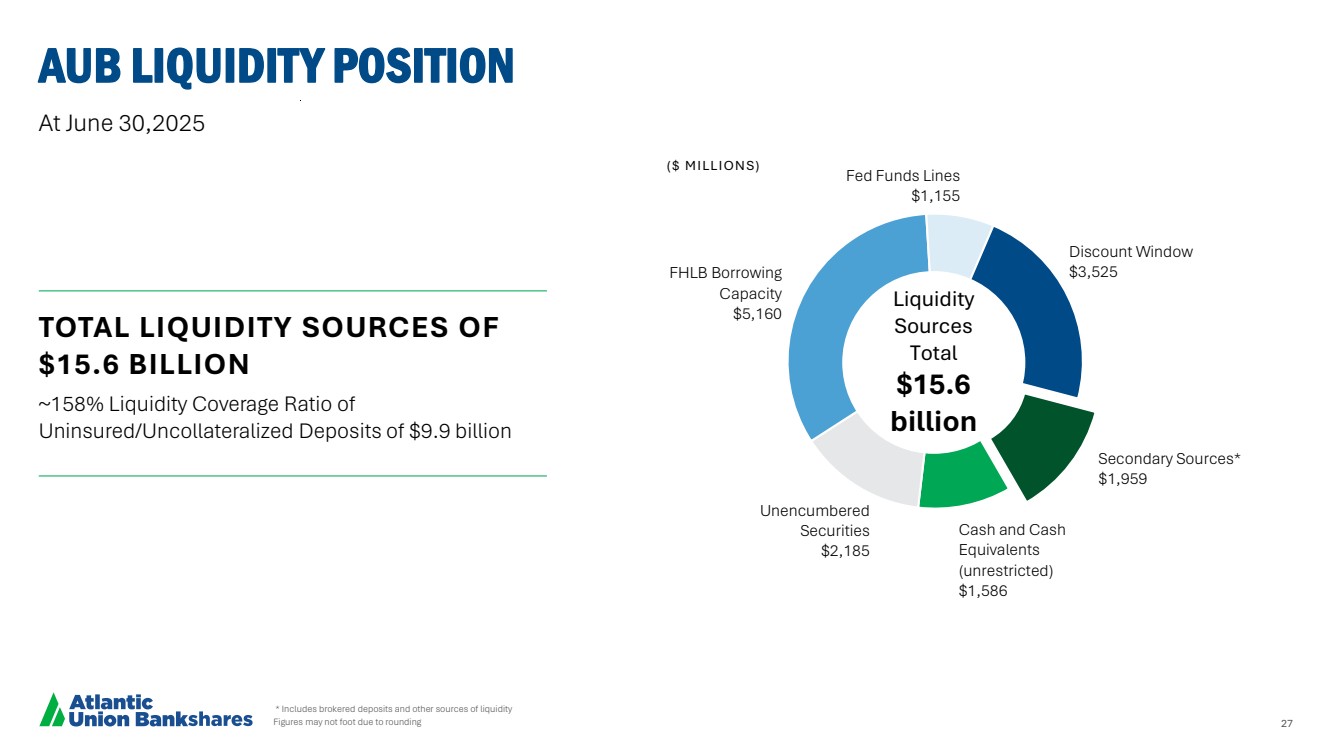
| ● | the sufficiency of liquidity and changes in our capital position; |
| ● | general economic and financial market conditions, in the United States generally and particularly in the markets in which we operate and which our loans are concentrated, including the effects of declines in real estate values, an increase in unemployment levels, U.S. fiscal debt, budget, and tax matters, and slowdowns in economic growth; |
| ● | the diversion of management’s attention from ongoing business operations and opportunities due to our recent acquisition of Sandy Spring; |
| ● | the impact of purchase accounting with respect to the Sandy Spring acquisition, or any change in the assumptions used regarding the assets acquired and liabilities assumed to determine the fair value and credit marks; |
| ● | the possibility that the anticipated benefits of our acquisition activity, including our acquisitions of Sandy Spring and American National, including anticipated cost savings and strategic gains, are not realized when expected or at all, including as a result of the strength of the economy, competitive factors in the areas where we do business, or as a result of other unexpected factors or events, or with respect to our acquisition of Sandy Spring, as a result of the impact of, or problems arising from, the integration of the two companies; |
| ● | the integration of the business and operations of Sandy Spring may take longer or be more costly than anticipated; |
| ● | potential adverse reactions or changes to business or employee relationships, including those resulting from our acquisitions of Sandy Spring and American National; |
| ● | our ability to identify, recruit and retain key employees; |
| ● | monetary, fiscal and regulatory policies of the U.S. government, including policies of the U.S. Department of the Treasury and the Federal Reserve; |
| ● | the quality or composition of our loan or investment portfolios and changes in these portfolios; |
| ● | demand for loan products and financial services in our market areas; |
| ● | our ability to manage our growth or implement our growth strategy; |
| ● | the effectiveness of expense reduction plans; |
| ● | the introduction of new lines of business or new products and services; |
| ● | real estate values in our lending area; |
| ● | changes in accounting principles, standards, rules, and interpretations, and the related impact on our financial statements; |
| ● | an insufficient ACL or volatility in the ACL resulting from the CECL methodology, either alone or as that may be affected by changing economic conditions, credit concentrations, inflation, changing interest rates, or other factors; |
| ● | concentrations of loans secured by real estate, particularly CRE; |
| ● | the effectiveness of our credit processes and management of our credit risk; |
| ● | our ability to compete in the market for financial services and increased competition from fintech companies; |
| ● | technological risks and developments, and cyber threats, attacks, or events; |
| ● | operational, technological, cultural, regulatory, legal, credit, and other risks associated with the exploration, consummation and integration of potential future acquisitions, whether involving stock or cash consideration; |
| ● | the potential adverse effects of unusual and infrequently occurring events, such as weather-related disasters, terrorist acts, geopolitical conflicts or public health events (such as pandemics), and of governmental and societal responses thereto; these potential adverse effects may include, without limitation, adverse effects on the ability of our borrowers to satisfy their obligations to us, on the value of collateral securing loans, on the demand for our loans or our other products and services, on supply chains and methods used to distribute products and services, on incidents of cyberattack and fraud, on our liquidity or capital positions, on risks posed by reliance on third-party service providers, on other aspects of our business operations and on financial markets and economic growth; |
| ● | performance by our counterparties or vendors; |
| ● | deposit flows; |
| ● | the availability of financing and the terms thereof; |
| ● | the level of prepayments on loans and mortgage-backed securities; |
| ● | actual or potential claims, damages, and fines related to litigation or government actions, which may result in, among other things, additional costs, fines, penalties, restrictions on our business activities, reputational harm, or other adverse consequences; |
| ● | any event or development that would cause us to conclude that there was an impairment of any asset, including intangible assets, such as goodwill; and |
| ● | other factors, many of which are beyond our control. |
Please also refer to such other factors as discussed throughout Part I, Item 1A. “Risk Factors” and Part II, Item 7. “Management’s Discussion and Analysis of Financial Condition and Results of Operations” of our Annual Report on Form 10-K for the year ended December 31, 2024, and related disclosures in other filings, which have been filed with the U.S. Securities and Exchange Commission (“SEC”) and are available on the SEC’s website at www.sec.gov. All risk factors and uncertainties described herein and therein should be considered in evaluating forward-looking statements, and all the forward-looking statements are expressly qualified by the cautionary statements contained or referred to herein and therein. The actual results or developments anticipated may not be realized or, even if substantially realized, they may not have the expected consequences to or effects on the Company or our businesses or operations. Readers are cautioned not to rely too heavily on forward-looking statements. Forward-looking statements speak only as of the date they are made. We do not intend or assume any obligation to update, revise or clarify any forward-looking statements that may be made from time to time by or on behalf of the Company, whether as a result of new information, future events or otherwise, except as required by law.
ATLANTIC UNION BANKSHARES CORPORATION AND SUBSIDIARIES
KEY FINANCIAL RESULTS (UNAUDITED)
(Dollars in thousands, except share data)
| As of & For Three Months Ended |
| As of & For Six Months Ended | | |||||||||||
| 6/30/25 |
| 3/31/25 |
| 6/30/24 |
| 6/30/25 | | 6/30/24 | | |||||
Results of Operations | | | | | | | | |
| | | | | | |
Interest and dividend income | $ | 510,372 | | $ | 305,836 | | $ | 320,888 | | $ | 816,208 | | $ | 583,802 | |
Interest expense |
| 189,001 | |
| 121,672 | |
| 136,354 | |
| 310,672 | |
| 251,444 | |
Net interest income |
| 321,371 | |
| 184,164 | |
| 184,534 | |
| 505,536 | |
| 332,358 | |
Provision for credit losses |
| 105,707 | |
| 17,638 | |
| 21,751 | |
| 123,345 | |
| 29,989 | |
Net interest income after provision for credit losses |
| 215,664 | |
| 166,526 | |
| 162,783 | |
| 382,191 | |
| 302,369 | |
Noninterest income |
| 81,522 | |
| 29,163 | |
| 23,812 | |
| 110,685 | |
| 49,365 | |
Noninterest expenses |
| 279,698 | |
| 134,184 | |
| 150,005 | |
| 413,882 | |
| 255,279 | |
Income before income taxes |
| 17,488 | |
| 61,505 | |
| 36,590 | |
| 78,994 | |
| 96,455 | |
Income tax (benefit) expense |
| (2,303) | |
| 11,687 | |
| 11,429 | |
| 9,384 | |
| 21,525 | |
Net income |
| 19,791 | |
| 49,818 | |
| 25,161 | |
| 69,610 | |
| 74,930 | |
Dividends on preferred stock | | 2,967 | | | 2,967 | | | 2,967 | | | 5,934 | | | 5,934 | |
Net income available to common shareholders | $ | 16,824 | | $ | 46,851 | | $ | 22,194 | | $ | 63,676 | | $ | 68,996 | |
| | | | | | | | | | | | | | | |
Interest earned on earning assets (FTE) (1) | $ | 514,734 | | $ | 309,593 | | $ | 324,702 | | $ | 824,328 | | $ | 591,339 | |
Net interest income (FTE) (1) |
| 325,733 | |
| 187,921 | |
| 188,348 | |
| 513,656 | |
| 339,895 | |
Total revenue (FTE) (1) | | 407,255 | | | 217,084 | | | 212,160 | | | 624,341 | | | 389,260 | |
Pre-tax pre-provision adjusted operating earnings (7) | | 172,059 | | | 84,185 | | | 94,635 | | | 256,246 | | | 165,449 | |
| | | | | | | | | | | | | | | |
Key Ratios | | | | | | | | | | | | | | | |
Earnings per common share, diluted | $ | 0.12 | | $ | 0.52 | | $ | 0.25 | | $ | 0.55 | | $ | 0.84 | |
Return on average assets (ROA) |
| 0.21 | % |
| 0.82 | % |
| 0.41 | % |
| 0.45 | % |
| 0.66 | % |
Return on average equity (ROE) |
| 1.67 | % |
| 6.35 | % |
| 3.35 | % |
| 3.53 | % |
| 5.39 | % |
Return on average tangible common equity (ROTCE) (2) (3) |
| 4.99 | % |
| 12.04 | % |
| 6.99 | % |
| 7.83 | % |
| 10.06 | % |
Efficiency ratio |
| 69.42 | % |
| 62.90 | % |
| 72.00 | % |
| 67.16 | % |
| 66.88 | % |
Efficiency ratio (FTE) (1) | | 68.68 | % |
| 61.81 | % |
| 70.70 | % |
| 66.29 | % |
| 65.58 | % |
Net interest margin |
| 3.78 | % |
| 3.38 | % |
| 3.39 | % |
| 3.62 | % |
| 3.26 | % |
Net interest margin (FTE) (1) |
| 3.83 | % |
| 3.45 | % |
| 3.46 | % |
| 3.68 | % |
| 3.33 | % |
Yields on earning assets (FTE) (1) |
| 6.05 | % |
| 5.68 | % |
| 5.96 | % |
| 5.91 | % |
| 5.80 | % |
Cost of interest-bearing liabilities |
| 2.97 | % |
| 2.97 | % |
| 3.33 | % |
| 2.97 | % |
| 3.28 | % |
Cost of deposits |
| 2.20 | % |
| 2.29 | % |
| 2.46 | % |
| 2.24 | % |
| 2.43 | % |
Cost of funds |
| 2.22 | % |
| 2.23 | % |
| 2.50 | % |
| 2.23 | % |
| 2.47 | % |
| | | | | | | | | | | | | | | |
Operating Measures (4) | | | | | | | | | | | | | | | |
Adjusted operating earnings | $ | 138,112 | | $ | 54,542 | | $ | 70,839 | | $ | 192,653 | | $ | 122,832 | |
Adjusted operating earnings available to common shareholders | | 135,145 | | | 51,575 | | | 67,872 | | | 186,719 | | | 116,898 | |
Adjusted operating earnings per common share, diluted | $ | 0.95 | | $ | 0.57 | | $ | 0.76 | | $ | 1.61 | | $ | 1.42 | |
Adjusted operating ROA | | 1.46 | % |
| 0.90 | % |
| 1.16 | % |
| 1.24 | % |
| 1.08 | % |
Adjusted operating ROE |
| 11.63 | % |
| 6.95 | % |
| 9.43 | % | | 9.77 | % |
| 8.84 | % |
Adjusted operating ROTCE (2) (3) |
| 23.79 | % |
| 13.15 | % |
| 18.84 | % |
| 19.50 | % |
| 16.46 | % |
Adjusted operating efficiency ratio (FTE) (1)(6) |
| 48.34 | % |
| 57.02 | % |
| 52.24 | % |
| 51.52 | % |
| 54.30 | % |
| | | | | | | | | | | | | | | |
Per Share Data | | | | | | | | | | | | | | | |
Earnings per common share, basic | $ | 0.12 | | $ | 0.53 | | $ | 0.25 | | $ | 0.55 | | $ | 0.84 | |
Earnings per common share, diluted |
| 0.12 | |
| 0.52 | |
| 0.25 | |
| 0.55 | |
| 0.84 | |
Cash dividends paid per common share |
| 0.34 | |
| 0.34 | |
| 0.32 | |
| 0.68 | |
| 0.64 | |
Market value per share |
| 31.28 | |
| 31.14 | |
| 32.85 | |
| 31.28 | |
| 32.85 | |
Book value per common share(8) |
| 32.93 | |
| 33.79 | |
| 32.30 | |
| 32.93 | |
| 32.30 | |
Tangible book value per common share (2)(8) |
| 18.38 | |
| 19.32 | |
| 17.67 | |
| 18.38 | |
| 17.67 | |
Price to earnings ratio, diluted |
| 65.70 | |
| 14.76 | |
| 33.04 | |
| 28.27 | |
| 19.53 | |
Price to book value per common share ratio (8) |
| 0.95 | |
| 0.92 | |
| 1.02 | |
| 0.95 | |
| 1.02 | |
Price to tangible book value per common share ratio (2)(8) |
| 1.70 | |
| 1.61 | |
| 1.86 | |
| 1.70 | |
| 1.86 | |
Unvested shares of restricted stock awards(8) | | 916,294 | | | 806,420 | | | 691,111 | | | 916,294 | | | 691,111 | |
Weighted average common shares outstanding, basic |
| 141,680,472 | |
| 89,222,296 | |
| 89,768,466 | |
| 115,596,296 | |
| 82,482,790 | |
Weighted average common shares outstanding, diluted |
| 141,738,325 | |
| 90,072,795 | |
| 89,768,466 | |
| 116,056,670 | |
| 82,482,921 | |
Common shares outstanding at end of period |
| 141,694,720 | |
| 89,340,541 | |
| 89,769,734 | |
| 141,694,720 | |
| 89,769,734 | |
ATLANTIC UNION BANKSHARES CORPORATION AND SUBSIDIARIES
KEY FINANCIAL RESULTS (UNAUDITED)
(Dollars in thousands, except share data)
| As of & For Three Months Ended |
| As of & For Six Months Ended | | |||||||||||
| 6/30/25 |
| 3/31/25 |
| 6/30/24 |
| 6/30/25 | | 6/30/24 | | |||||
Capital Ratios | | | | | | | | |
| | | | | | |
Common equity Tier 1 capital ratio (5) |
| 9.77 | % | | 10.07 | % |
| 9.47 | % |
| 9.77 | % |
| 9.47 | % |
Tier 1 capital ratio (5) |
| 10.32 | % | | 10.87 | % |
| 10.26 | % |
| 10.32 | % |
| 10.26 | % |
Total capital ratio (5) |
| 13.73 | % | | 13.88 | % |
| 12.99 | % |
| 13.73 | % |
| 12.99 | % |
Leverage ratio (Tier 1 capital to average assets) (5) |
| 8.65 | % | | 9.45 | % |
| 9.05 | % |
| 8.65 | % |
| 9.05 | % |
Common equity to total assets |
| 12.51 | % | | 12.26 | % |
| 11.62 | % |
| 12.51 | % |
| 11.62 | % |
Tangible common equity to tangible assets (2) |
| 7.39 | % | | 7.39 | % |
| 6.71 | % |
| 7.39 | % |
| 6.71 | % |
|
|
|
|
|
|
|
|
|
|
|
|
|
|
|
|
Financial Condition |
|
|
|
|
|
|
|
|
|
|
|
|
|
|
|
Assets | $ | 37,289,371 | | $ | 24,632,611 |
| $ | 24,761,413 |
| $ | 37,289,371 |
| $ | 24,761,413 | |
LHFI (net of deferred fees and costs) |
| 27,328,333 | | | 18,427,689 |
|
| 18,347,190 |
|
| 27,328,333 |
|
| 18,347,190 | |
Securities |
| 4,777,022 | | | 3,405,206 |
|
| 3,491,481 |
|
| 4,777,022 |
|
| 3,491,481 | |
Earning Assets |
| 33,392,111 | | | 22,085,559 |
|
| 22,067,549 |
|
| 33,392,111 |
|
| 22,067,549 | |
Goodwill |
| 1,710,912 | | | 1,214,053 |
|
| 1,207,484 |
|
| 1,710,912 |
|
| 1,207,484 | |
Amortizable intangibles, net |
| 351,381 | | | 79,165 |
|
| 95,980 |
|
| 351,381 |
|
| 95,980 | |
Deposits |
| 30,972,175 | | | 20,502,874 |
|
| 20,000,877 |
|
| 30,972,175 |
|
| 20,000,877 | |
Borrowings |
| 892,767 | | | 475,685 |
|
| 1,206,734 |
|
| 892,767 |
|
| 1,206,734 | |
Stockholders' equity |
| 4,832,639 | | | 3,185,216 |
|
| 3,043,686 |
|
| 4,832,639 |
|
| 3,043,686 | |
Tangible common equity (2) |
| 2,603,989 | | | 1,725,641 |
|
| 1,573,865 |
|
| 2,603,989 |
|
| 1,573,865 | |
| | | | | | | | | | | | | | | |
Loans held for investment, net of deferred fees and costs | | | | | | | | | | | | | | | |
Construction and land development | $ | 2,444,151 | | $ | 1,305,969 | | $ | 1,454,545 | | $ | 2,444,151 | | $ | 1,454,545 | |
Commercial real estate - owner occupied | | 3,940,371 | | | 2,363,509 | | | 2,397,700 | | | 3,940,371 | | | 2,397,700 | |
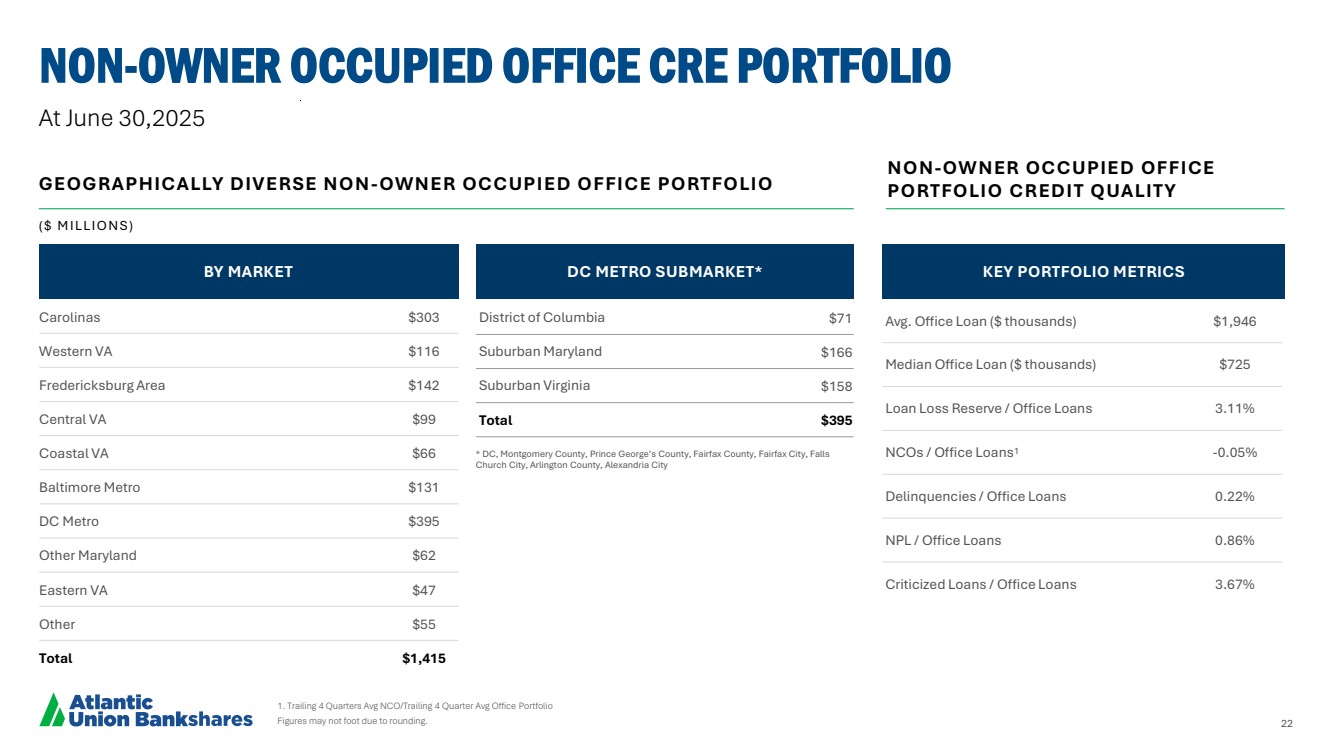
Commercial real estate - non-owner occupied | | 6,912,692 | | | 5,072,694 | | | 4,906,285 | | | 6,912,692 | | | 4,906,285 | |
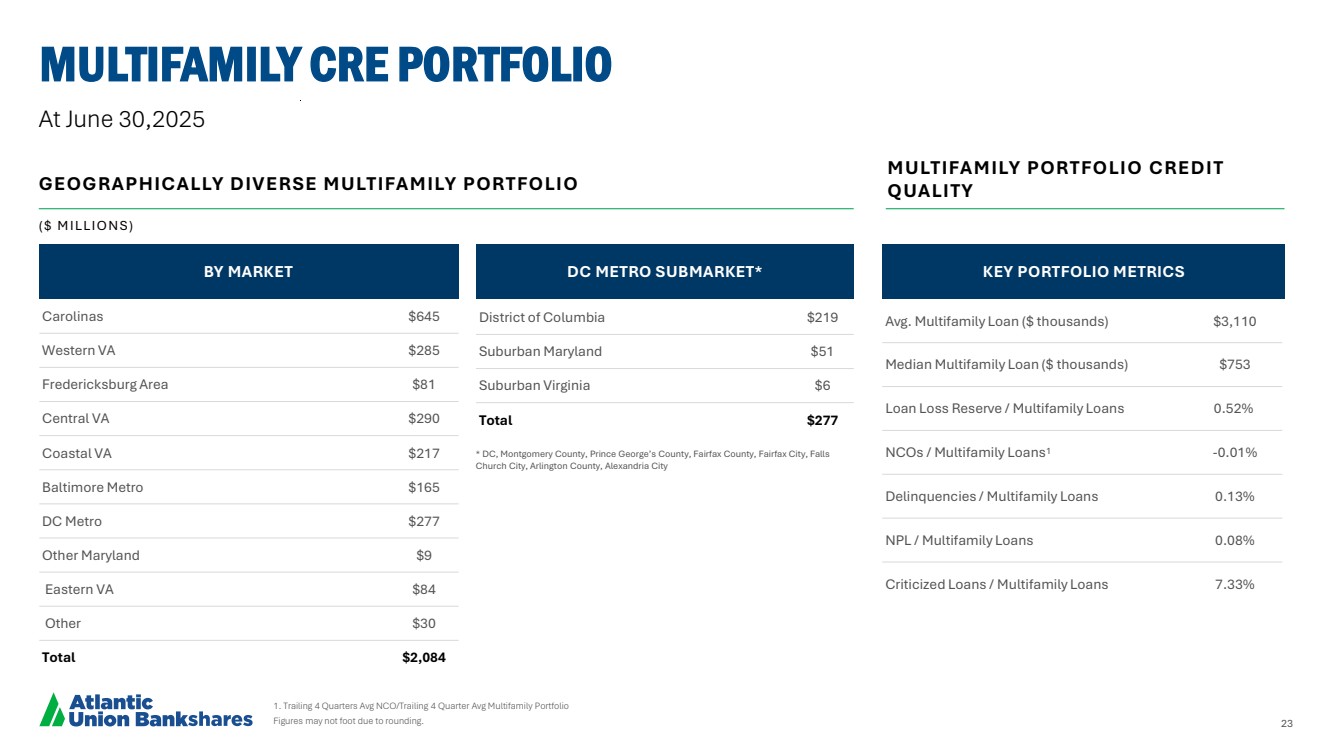
Multifamily real estate | | 2,083,559 | | | 1,531,547 | | | 1,353,024 | | | 2,083,559 | | | 1,353,024 | |
Commercial & Industrial |
| 5,141,691 | |
| 3,819,415 | | | 3,944,723 | | | 5,141,691 | | | 3,944,723 | |
Residential 1-4 Family - Commercial |
| 1,131,288 | |
| 738,388 | | | 737,687 | | | 1,131,288 | | | 737,687 | |
Residential 1-4 Family - Consumer |
| 2,746,046 | |
| 1,286,526 | | | 1,251,033 | | | 2,746,046 | | | 1,251,033 | |
Residential 1-4 Family - Revolving |
| 1,154,085 | |
| 778,527 | | | 718,491 | | | 1,154,085 | | | 718,491 | |
Auto | | 245,554 | |
| 279,517 | | | 396,776 | | | 245,554 | | | 396,776 | |
Consumer |
| 119,526 | |
| 101,334 | | | 115,541 | | | 119,526 | | | 115,541 | |
Other Commercial |
| 1,409,370 | |
| 1,150,263 | | | 1,071,385 | | | 1,409,370 | | | 1,071,385 | |
Total LHFI | $ | 27,328,333 | | $ | 18,427,689 | | $ | 18,347,190 | | $ | 27,328,333 | | $ | 18,347,190 | |
|
| | | | | | | | | | | | | | |
Deposits |
| | | | | | | | | | | | | | |
Interest checking accounts | $ | 6,909,250 | | $ | 5,336,264 | | $ | 5,044,503 | | $ | 6,909,250 | | $ | 5,044,503 | |
Money market accounts | | 7,242,686 | | | 4,602,260 | | | 4,330,928 | | | 7,242,686 | | | 4,330,928 | |
Savings accounts | | 2,865,159 | | | 1,033,315 | | | 1,056,474 | | | 2,865,159 | | | 1,056,474 | |
Customer time deposits of $250,000 and over | | 1,614,102 | | | 1,141,311 | | | 1,015,032 | | | 1,614,102 | | | 1,015,032 | |
Other customer time deposits | | 4,138,277 | | | 2,810,070 | | | 2,691,600 | | | 4,138,277 | | | 2,691,600 | |
Time deposits | | 5,752,379 | | | 3,951,381 | | | 3,706,632 | | | 5,752,379 | | | 3,706,632 | |
Total interest-bearing customer deposits | | 22,769,474 | | | 14,923,220 | | | 14,138,537 | | | 22,769,474 | | | 14,138,537 | |
Brokered deposits | | 1,163,580 | | | 1,108,481 | | | 1,335,092 | | | 1,163,580 | | | 1,335,092 | |
Total interest-bearing deposits | $ | 23,933,054 | | $ | 16,031,701 | | $ | 15,473,629 | | $ | 23,933,054 | | $ | 15,473,629 | |
Demand deposits |
| 7,039,121 | |
| 4,471,173 | |
| 4,527,248 | |
| 7,039,121 | |
| 4,527,248 | |
Total deposits | $ | 30,972,175 | | $ | 20,502,874 | | $ | 20,000,877 | | $ | 30,972,175 | | $ | 20,000,877 | |
| | | | | | | | | | | | | | | |
Averages | | | | | | | | | | | | | | | |
Assets | $ | 37,939,232 | | $ | 24,678,974 | | $ | 24,620,198 | | $ | 31,345,735 | | $ | 22,921,478 | |
LHFI (net of deferred fees and costs) | | 27,094,551 | | | 18,428,710 | | | 18,154,673 | | | 22,785,570 | | | 16,943,636 | |
Loans held for sale |
| 1,777,882 | |
| 8,172 | |
| 12,392 | |
| 897,916 | |
| 10,767 | |
Securities |
| 4,721,736 | |
| 3,387,627 | |
| 3,476,890 | |
| 4,058,367 | |
| 3,315,223 | |
Earning assets |
| 34,121,715 | |
| 22,108,618 | |
| 21,925,128 | |
| 28,148,353 | |
| 20,507,261 | |
Deposits |
| 31,243,383 | |
| 20,466,081 | |
| 20,033,678 | |
| 25,884,505 | |
| 18,590,430 | |
Time deposits |
| 6,553,018 | |
| 4,715,648 | |
| 4,243,344 | |
| 5,639,409 | |
| 3,851,241 | |
Interest-bearing deposits |
| 24,150,220 | |
| 16,062,478 | |
| 15,437,549 | |
| 20,128,691 | |
| 14,374,693 | |
Borrowings |
| 1,331,793 | |
| 525,889 | |
| 1,043,297 | |
| 931,066 | |
| 1,028,047 | |
Interest-bearing liabilities |
| 25,482,013 | |
| 16,588,367 | |
| 16,480,846 | |
| 21,059,757 | |
| 15,402,740 | |
Stockholders' equity |
| 4,761,630 | |
| 3,183,846 | |
| 3,021,929 | |
| 3,977,098 | |
| 2,795,086 | |
Tangible common equity (2) |
| 2,524,128 | |
| 1,721,647 | |
| 1,549,876 | |
| 2,125,105 | |
| 1,504,178 | |
ATLANTIC UNION BANKSHARES CORPORATION AND SUBSIDIARIES
KEY FINANCIAL RESULTS (UNAUDITED)
(Dollars in thousands, except share data)
| As of & For Three Months Ended |
| As of & For Six Months Ended | | |||||||||||
| 6/30/25 |
| 3/31/25 |
| 6/30/24 |
| 6/30/25 | | 6/30/24 | | |||||
Asset Quality | | | | | | | | |
| | | | | | |
Allowance for Credit Losses (ACL) |
|
|
|
|
|
|
|
|
|
|
|
|
|
|
|
Beginning balance, Allowance for loan and lease losses (ALLL) | $ | 193,796 |
| $ | 178,644 |
| $ | 136,190 |
| $ | 178,644 |
| $ | 132,182 |
|
Add: Recoveries |
| 1,913 |
| | 607 |
|
| 1,348 |
|
| 2,520 |
|
| 2,325 |
|
Less: Charge-offs |
| 2,579 |
| | 2,885 |
|
| 3,088 |
|
| 5,464 |
|
| 8,982 |
|
Add: Initial Allowance - Purchased Credit Deteriorated (PCD) loans | | 28,265 | | | — | | | 3,896 | | | 28,265 | | | 3,896 | |
Add: Initial Provision - Non-PCD loans | | 89,538 | | | — | | | 13,229 | | | 89,538 | | | 13,229 | |
Add: Provision for loan losses |
| 4,641 |
| | 17,430 |
|
| 6,556 |
|
| 22,071 |
|
| 15,481 |
|
Ending balance, ALLL | $ | 315,574 |
| $ | 193,796 |
| $ | 158,131 |
| $ | 315,574 |
| $ | 158,131 |
|
| | | | | | | | | | | | | | | |
Beginning balance, Reserve for unfunded commitment (RUC) | $ | 15,249 | | $ | 15,041 |
| $ | 15,582 |
| $ | 15,041 |
| $ | 16,269 | |
Add: Initial Provision - RUC acquired loans | | 11,425 | | | — | | | 1,353 | | | 11,425 | | | 1,353 | |
Add: Provision for unfunded commitments | | 104 |
| | 208 |
|
| 622 |
|
| 312 |
|
| (65) | |
Ending balance, RUC | $ | 26,778 | | $ | 15,249 |
| $ | 17,557 |
| $ | 26,778 |
| $ | 17,557 | |
Total ACL | $ | 342,352 | | $ | 209,045 |
| $ | 175,688 |
| $ | 342,352 |
| $ | 175,688 | |
| | | | | | | | | | | | | | | |
ACL / total LHFI | | 1.25 | % | | 1.13 | % |
| 0.96 | % |
| 1.25 | % |
| 0.96 | % |
ALLL / total LHFI |
| 1.15 | % | | 1.05 | % | | 0.86 | % | | 1.15 | % | | 0.86 | % |
Net charge-offs / total average LHFI (annualized) |
| 0.01 | % | | 0.05 | % | | 0.04 | % | | 0.03 | % | | 0.08 | % |
Provision for loan losses/ total average LHFI (annualized) |
| 1.39 | % | | 0.38 | % | | 0.44 | % | | 0.99 | % | | 0.34 | % |
| | | | | | | | | | | | | | | |
Nonperforming Assets |
|
|
|
|
|
|
|
|
|
|
|
|
|
| |
Construction and land development | $ | 50,904 | | $ | 2,794 | | $ | 1,144 | | $ | 50,904 | | $ | 1,144 | |
Commercial real estate - owner occupied |
| 6,116 | |
| 2,932 | | | 4,651 | | | 6,116 | | | 4,651 | |
Commercial real estate - non-owner occupied |
| 28,413 | |
| 1,159 | | | 10,741 | | | 28,413 | | | 10,741 | |
Multifamily real estate | | 1,589 | | | 124 | | | 1 | | | 1,589 | | | 1 | |
Commercial & Industrial |
| 44,897 | | | 43,106 | | | 3,408 | | | 44,897 | | | 3,408 | |
Residential 1-4 Family - Commercial |
| 2,700 | | | 1,610 | | | 1,783 | | | 2,700 | | | 1,783 | |
Residential 1-4 Family - Consumer |
| 20,689 | | | 12,942 | | | 10,799 | | | 20,689 | | | 10,799 | |
Residential 1-4 Family - Revolving |
| 5,346 | | | 3,593 | | | 3,028 | | | 5,346 | | | 3,028 | |
Auto |
| 526 | | | 641 | | | 354 | | | 526 | | | 354 | |
Consumer | | 20 | | | 16 | | | 4 | | | 20 | | | 4 | |
Other Commercial | | 1,415 | | | 98 | | | — | | | 1,415 | | | — | |
Nonaccrual loans | $ | 162,615 | | $ | 69,015 | | $ | 35,913 | | $ | 162,615 | | $ | 35,913 | |
Foreclosed property |
| 774 | |
| 404 | |
| 230 | |
| 774 | |
| 230 | |
Total nonperforming assets (NPAs) | $ | 163,389 | | $ | 69,419 | | $ | 36,143 | | $ | 163,389 | | $ | 36,143 | |
Construction and land development | $ | 22,807 | | $ | — | | $ | 764 | | $ | 22,807 | | $ | 764 | |
Commercial real estate - owner occupied |
| 1,817 | | | 714 | | | 1,047 | | | 1,817 | | | 1,047 | |
Commercial real estate - non-owner occupied | | 2,764 | | | — | | | 1,309 | | | 2,764 | | | 1,309 | |
Multifamily real estate | | — | | | — | | | 141 | | | — | | | 141 | |
Commercial & Industrial |
| 2,657 | |
| 1,075 | |
| 684 | |
| 2,657 | |
| 684 | |
Residential 1-4 Family - Commercial |
| 5,561 | |
| 1,091 | |
| 678 | |
| 5,561 | |
| 678 | |
Residential 1-4 Family - Consumer |
| 1,487 | |
| 1,193 | |
| 1,645 | |
| 1,487 | |
| 1,645 | |
Residential 1-4 Family - Revolving |
| 2,460 | |
| 2,397 | |
| 1,449 | |
| 2,460 | |
| 1,449 | |
Auto |
| 150 | |
| 196 | |
| 263 | |
| 150 | |
| 263 | |
Consumer |
| 79 | |
| 94 | |
| 176 | |
| 79 | |
| 176 | |
Other Commercial | | 30 | |
| 22 | |
| 7,464 | |
| 30 | |
| 7,464 | |
LHFI ≥ 90 days and still accruing | $ | 39,812 | | $ | 6,782 | | $ | 15,620 | | $ | 39,812 | | $ | 15,620 | |
Total NPAs and LHFI ≥ 90 days | $ | 203,201 | | $ | 76,201 | | $ | 51,763 | | $ | 203,201 | | $ | 51,763 | |
NPAs / total LHFI | | 0.60 | % |
| 0.38 | % |
| 0.20 | % |
| 0.60 | % |
| 0.20 | % |
NPAs / total assets |
| 0.44 | % | | 0.28 | % | | 0.15 | % | | 0.44 | % | | 0.15 | % |
ALLL / nonaccrual loans |
| 194.06 | % | | 280.80 | % | | 440.32 | % | | 194.06 | % | | 440.32 | % |
ALLL/ nonperforming assets |
| 193.14 | % | | 279.17 | % | | 437.51 | % | | 193.14 | % | | 437.51 | % |
ATLANTIC UNION BANKSHARES CORPORATION AND SUBSIDIARIES
KEY FINANCIAL RESULTS (UNAUDITED)
(Dollars in thousands, except share data)
| As of & For Three Months Ended |
| As of & For Six Months Ended | | |||||||||||
| 6/30/25 |
| 3/31/25 |
| 6/30/24 |
| 6/30/25 | | 6/30/24 | | |||||
Past Due Detail | | | | | | | | |
| | | | | | |
Construction and land development | $ | 447 | | $ | 458 | | $ | 1,689 | | $ | 447 | | $ | 1,689 | |
Commercial real estate - owner occupied |
| 3,933 | |
| 1,455 | |
| 3,450 | |
| 3,933 | |
| 3,450 | |
Commercial real estate - non-owner occupied |
| 1,295 | |
| 3,760 | |
| 1,316 | |
| 1,295 | |
| 1,316 | |
Multifamily real estate |
| 410 | |
| 1,353 | |
| 1,694 | |
| 410 | |
| 1,694 | |
Commercial & Industrial |
| 4,606 | |
| 4,192 | |
| 2,154 | |
| 4,606 | |
| 2,154 | |
Residential 1-4 Family - Commercial |
| 3,186 | |
| 1,029 | |
| 873 | |
| 3,186 | |
| 873 | |
Residential 1-4 Family - Consumer |
| 2,125 | |
| 11,005 | |
| 1,331 | |
| 2,125 | |
| 1,331 | |
Residential 1-4 Family - Revolving |
| 4,270 | |
| 2,533 | |
| 2,518 | |
| 4,270 | |
| 2,518 | |
Auto |
| 3,735 | |
| 3,662 | |
| 3,463 | |
| 3,735 | |
| 3,463 | |
Consumer | | 274 | | | 479 | | | 385 | | | 274 | | | 385 | |
Other Commercial | | 19 | | | 6,875 | | | 289 | | | 19 | | | 289 | |
LHFI 30-59 days past due | $ | 24,300 | | $ | 36,801 | | $ | 19,162 | | $ | 24,300 | | $ | 19,162 | |
Construction and land development | $ | 189 | | $ | 35 | | $ | 155 | | | 189 | | | 155 | |
Commercial real estate - owner occupied |
| 537 | |
| 971 | |
| 72 | |
| 537 | |
| 72 | |
Commercial real estate - non-owner occupied |
| 147 | |
| — | |
| — | |
| 147 | |
| — | |
Multifamily real estate | | 727 | | | 981 | | | 632 | | | 727 | | | 632 | |
Commercial & Industrial |
| 2,278 | |
| 838 | |
| 192 | |
| 2,278 | |
| 192 | |
Residential 1-4 Family - Commercial |
| 552 | |
| 19 | |
| 689 | |
| 552 | |
| 689 | |
Residential 1-4 Family - Consumer |
| 4,559 | |
| 348 | |
| 1,960 | |
| 4,559 | |
| 1,960 | |
Residential 1-4 Family - Revolving |
| 2,094 | |
| 1,137 | |
| 795 | |
| 2,094 | |
| 795 | |
Auto |
| 718 | |
| 539 | |
| 565 | |
| 718 | |
| 565 | |
Consumer | | 387 | | | 384 | | | 309 | | | 387 | | | 309 | |
Other Commercial | | 1,440 | | | 1,123 | | | — | | | 1,440 | |
| — | |
LHFI 60-89 days past due | $ | 13,628 | | $ | 6,375 | | $ | 5,369 | | $ | 13,628 | | $ | 5,369 | |
| | | | | | | | | | | | | | | |
Past Due and still accruing | $ | 77,740 | | $ | 49,958 | | $ | 40,151 | | $ | 77,740 | | $ | 40,151 | |
Past Due and still accruing / total LHFI | | 0.28 | % | | 0.27 | % | | 0.22 | % | | 0.28 | % | | 0.22 | % |
| |
| | |
| | |
| | |
| | |
| |
Alternative Performance Measures (non-GAAP) |
| | | | | | | | | | | | | | |
Net interest income (FTE) (1) |
| | | | | | | | | | | | | | |
Net interest income (GAAP) | $ | 321,371 | | $ | 184,164 | | $ | 184,534 | | $ | 505,536 | | $ | 332,358 | |
FTE adjustment |
| 4,362 | |
| 3,757 | |
| 3,814 | |
| 8,120 | |
| 7,537 | |
Net interest income (FTE) (non-GAAP) | $ | 325,733 | | $ | 187,921 | | $ | 188,348 | | $ | 513,656 | | $ | 339,895 | |
Noninterest income (GAAP) | | 81,522 | | | 29,163 | | | 23,812 | | | 110,685 | | | 49,365 | |
Total revenue (FTE) (non-GAAP) | $ | 407,255 | | $ | 217,084 | | $ | 212,160 | | $ | 624,341 | | $ | 389,260 | |
| | | | | | | | | | | | | | | |
Average earning assets | $ | 34,121,715 | | $ | 22,108,618 | | $ | 21,925,128 | | $ | 28,148,353 | | $ | 20,507,261 | |
Net interest margin |
| 3.78 | % |
| 3.38 | % |
| 3.39 | % |
| 3.62 | % |
| 3.26 | % |
Net interest margin (FTE) |
| 3.83 | % |
| 3.45 | % |
| 3.46 | % |
| 3.68 | % |
| 3.33 | % |
| | | | | | | | | | | | | | | |
Tangible Assets (2) |
| | | | | | | | | | | | | | |
Ending assets (GAAP) | $ | 37,289,371 | | $ | 24,632,611 | | $ | 24,761,413 | | $ | 37,289,371 | | $ | 24,761,413 | |
Less: Ending goodwill |
| 1,710,912 | |
| 1,214,053 | |
| 1,207,484 | |
| 1,710,912 | |
| 1,207,484 | |
Less: Ending amortizable intangibles |
| 351,381 | |
| 79,165 | |
| 95,980 | |
| 351,381 | |
| 95,980 | |
Ending tangible assets (non-GAAP) | $ | 35,227,078 | | $ | 23,339,393 | | $ | 23,457,949 | | $ | 35,227,078 | | $ | 23,457,949 | |
| | | | | | | | | | | | | | | |
Tangible Common Equity (2) |
| | | | | | | | | | | | | | |
Ending equity (GAAP) | $ | 4,832,639 | | $ | 3,185,216 | | $ | 3,043,686 | | $ | 4,832,639 | | $ | 3,043,686 | |
Less: Ending goodwill |
| 1,710,912 | |
| 1,214,053 | |
| 1,207,484 | |
| 1,710,912 | |
| 1,207,484 | |
Less: Ending amortizable intangibles |
| 351,381 | |
| 79,165 | |
| 95,980 | |
| 351,381 | |
| 95,980 | |
Less: Perpetual preferred stock | | 166,357 | | | 166,357 | | | 166,357 | | | 166,357 | | | 166,357 | |
Ending tangible common equity (non-GAAP) | $ | 2,603,989 | | $ | 1,725,641 | | $ | 1,573,865 | | $ | 2,603,989 | | $ | 1,573,865 | |
| | | | | | | | | | | | | | | |
Average equity (GAAP) | $ | 4,761,630 | | $ | 3,183,846 | | $ | 3,021,929 | | $ | 3,977,098 | | $ | 2,795,086 | |
Less: Average goodwill |
| 1,710,557 | |
| 1,214,053 | |
| 1,208,588 | |
| 1,463,677 | |
| 1,066,899 | |
Less: Average amortizable intangibles |
| 360,589 | |
| 81,790 | |
| 97,109 | |
| 221,960 | |
| 57,653 | |
Less: Average perpetual preferred stock | | 166,356 | | | 166,356 | | | 166,356 | | | 166,356 | | | 166,356 | |
Average tangible common equity (non-GAAP) | $ | 2,524,128 | | $ | 1,721,647 | | $ | 1,549,876 | | $ | 2,125,105 | | $ | 1,504,178 | |
| | | | | | | | | | | | | | | |
ROTCE (2)(3) | | | | | | | | | | | | | | | |
Net income available to common shareholders (GAAP) | $ | 16,824 | | $ | 46,851 | | $ | 22,194 | | $ | 63,676 | | $ | 68,996 | |
Plus: Amortization of intangibles, tax effected | | 14,562 | | | 4,264 | | | 4,736 | | | 18,827 | | | 6,232 | |
Net income available to common shareholders before amortization of intangibles (non-GAAP) | $ | 31,386 | | $ | 51,115 | | $ | 26,930 | | $ | 82,503 | | $ | 75,228 | |
| | | | | | | | | | | | | | | |
Return on average tangible common equity (ROTCE) | | 4.99 | % | | 12.04 | % | | 6.99 | % | | 7.83 | % | | 10.06 | % |
ATLANTIC UNION BANKSHARES CORPORATION AND SUBSIDIARIES
KEY FINANCIAL RESULTS (UNAUDITED)
(Dollars in thousands, except share data)
| As of & For Three Months Ended |
| As of & For Six Months Ended | | |||||||||||
| 6/30/25 |
| 3/31/25 |
| 6/30/24 |
| 6/30/25 | | 6/30/24 | | |||||
Operating Measures (4) | | | | | | | | | | | | | | | |
Net income (GAAP) | $ | 19,791 | | $ | 49,818 | | $ | 25,161 | | $ | 69,610 | | $ | 74,930 | |
Plus: Merger-related costs, net of tax | | 63,349 | | | 4,643 | | | 24,236 | | | 67,992 | | | 25,799 | |
Plus: FDIC special assessment, net of tax | | — | | | — | | | — | | | — | | | 664 | |
Plus: Deferred tax asset write-down | | — | | | — | | | 4,774 | | | — | | | 4,774 | |
Plus: CECL Day 1 non-PCD loans and RUC provision expense, net of tax | | 77,742 | | | — | | | 11,520 | | | 77,742 | | | 11,520 | |
Less: Gain (loss) on sale of securities, net of tax |
| 12 | |
| (81) | |
| (5,148) | |
| (67) | |
| (5,145) | |
Less: Gain on CRE loan sale, net of tax | | 12,104 | |
| — | |
| — | | | 12,104 | | | — | |
Less: Gain on sale of equity interest in CSP, net of tax |
| 10,654 | |
| — | |
| — | |
| 10,654 | |
| — | |
Adjusted operating earnings (non-GAAP) |
| 138,112 | |
| 54,542 | |
| 70,839 | |
| 192,653 | |
| 122,832 | |
Less: Dividends on preferred stock | | 2,967 | | | 2,967 | | | 2,967 | | | 5,934 | | | 5,934 | |
Adjusted operating earnings available to common shareholders (non-GAAP) | $ | 135,145 | | $ | 51,575 | | $ | 67,872 | | $ | 186,719 | | $ | 116,898 | |
| | | | | | | | | | | | | | | |
Operating Efficiency Ratio (1)(6) | | | | | | | | | | | | | | | |
Noninterest expense (GAAP) | $ | 279,698 | | $ | 134,184 | | $ | 150,005 | | $ | 413,882 | | $ | 255,279 | |
Less: Amortization of intangible assets | | 18,433 | | | 5,398 | | | 5,995 | | | 23,832 | | | 7,889 | |
Less: Merger-related costs |
| 78,900 | |
| 4,940 | |
| 29,778 | |
| 83,840 | |
| 31,652 | |
Less: FDIC special assessment | | — | | | — | | | — | | | — | | | 840 | |
Adjusted operating noninterest expense (non-GAAP) | $ | 182,365 | | $ | 123,846 | | $ | 114,232 | | $ | 306,210 | | $ | 214,898 | |
| | | | | | | | | | | | | | | |
Noninterest income (GAAP) | $ | 81,522 | | $ | 29,163 | | $ | 23,812 | | $ | 110,685 | | $ | 49,365 | |
Less: Gain (loss) on sale of securities | | 16 | | | (102) | | | (6,516) | | | (87) | | | (6,513) | |
Less: Gain on CRE loan sale | | 15,720 | | | — | | | — | | | 15,720 | | | — | |
Less: Gain on sale of equity interest in CSP | | 14,300 | | | — | | | — | | | 14,300 | | | — | |
Adjusted operating noninterest income (non-GAAP) | $ | 51,486 | | $ | 29,265 | | $ | 30,328 | | $ | 80,752 | | $ | 55,878 | |
| | | | | | | | | | | | | | | |
Net interest income (FTE) (non-GAAP) (1) | $ | 325,733 | | $ | 187,921 | | $ | 188,348 | | $ | 513,656 | | $ | 339,895 | |
Adjusted operating noninterest income (non-GAAP) |
| 51,486 | |
| 29,265 | |
| 30,328 | |
| 80,752 | |
| 55,878 | |
Total adjusted revenue (FTE) (non-GAAP) (1) | $ | 377,219 | | $ | 217,186 | | $ | 218,676 | | $ | 594,408 | | $ | 395,773 | |
| | | | | | | | | | | | | | | |
Efficiency ratio |
| 69.42 | % |
| 62.90 | % |
| 72.00 | % |
| 67.16 | % |
| 66.88 | % |
Efficiency ratio (FTE) (1) |
| 68.68 | % |
| 61.81 | % |
| 70.70 | % |
| 66.29 | % |
| 65.58 | % |
Adjusted operating efficiency ratio (FTE) (1)(6) | | 48.34 | % | | 57.02 | % | | 52.24 | % | | 51.52 | % | | 54.30 | % |
|
|
|
|
|
|
|
|
|
|
|
|
|
|
| |
Operating ROA & ROE (4) | | | | | | | | | | | | | | | |
Adjusted operating earnings (non-GAAP) | $ | 138,112 | | $ | 54,542 | | $ | 70,839 | | $ | 192,653 | | $ | 122,832 | |
| | | | | | | | | | | | | | | |
Average assets (GAAP) | $ | 37,939,232 | | $ | 24,678,974 | | $ | 24,620,198 | | $ | 31,345,735 | | $ | 22,921,478 | |
Return on average assets (ROA) (GAAP) | | 0.21 | % | | 0.82 | % | | 0.41 | % | | 0.45 | % | | 0.66 | % |
Adjusted operating return on average assets (ROA) (non-GAAP) |
| 1.46 | % |
| 0.90 | % |
| 1.16 | % |
| 1.24 | % |
| 1.08 | % |
|
| | |
| | |
| | |
| | |
| | |
Average equity (GAAP) | $ | 4,761,630 | | $ | 3,183,846 | | $ | 3,021,929 | | $ | 3,977,098 | | $ | 2,795,086 | |
Return on average equity (ROE) (GAAP) |
| 1.67 | % |
| 6.35 | % |
| 3.35 | % |
| 3.53 | % |
| 5.39 | % |
Adjusted operating return on average equity (ROE) (non-GAAP) | | 11.63 | % | | 6.95 | % | | 9.43 | % | | 9.77 | % | | 8.84 | % |
|
|
|
|
|
|
|
|
|
|
|
|
|
|
| |
Operating ROTCE (2)(3)(4) |
|
|
|
|
|
|
|
|
|
|
|
|
|
| |
Adjusted operating earnings available to common shareholders (non-GAAP) | $ | 135,145 | | $ | 51,575 | | $ | 67,872 | | $ | 186,719 | | $ | 116,898 | |
Plus: Amortization of intangibles, tax effected | | 14,562 | | | 4,264 | | | 4,736 | | | 18,827 | | | 6,232 | |
Adjusted operating earnings available to common shareholders before amortization of intangibles (non-GAAP) | $ | 149,707 | | $ | 55,839 | | $ | 72,608 | | $ | 205,546 | | $ | 123,130 | |
| | | | | | | | | | | | | | | |
Average tangible common equity (non-GAAP) | $ | 2,524,128 | | $ | 1,721,647 | | $ | 1,549,876 | | $ | 2,125,105 | | $ | 1,504,178 | |
Adjusted operating return on average tangible common equity (non-GAAP) |
| 23.79 | % |
| 13.15 | % |
| 18.84 | % |
| 19.50 | % |
| 16.46 | % |
| | | | | | | | | | | | | | | |
Pre-tax pre-provision adjusted operating earnings (7) | | | | | | | | | | | | | | | |
Net income (GAAP) | $ | 19,791 | | $ | 49,818 | | $ | 25,161 | | $ | 69,610 | | $ | 74,930 | |
Plus: Provision for credit losses | | 105,707 | | | 17,638 | | | 21,751 | | | 123,345 | | | 29,989 | |
Plus: Income tax (benefit) expense |
| (2,303) | |
| 11,687 | |
| 11,429 | |
| 9,384 | |
| 21,525 | |
Plus: Merger-related costs | | 78,900 | | | 4,940 | | | 29,778 | | | 83,840 | | | 31,652 | |
Plus: FDIC special assessment | | — | | | — | | | — | | | — | | | 840 | |
Less: Gain (loss) on sale of securities | | 16 | | | (102) | | | (6,516) | | | (87) | | | (6,513) | |
Less: Gain on CRE loan sale | | 15,720 | | | — | | | — | | | 15,720 | | | — | |
Less: Gain on sale of equity interest in CSP | | 14,300 | | | — | | | — | | | 14,300 | | | — | |
Pre-tax pre-provision adjusted operating earnings (non-GAAP) | $ | 172,059 | | $ | 84,185 | | $ | 94,635 | | $ | 256,246 | | $ | 165,449 | |
Less: Dividends on preferred stock | | 2,967 | | | 2,967 | | | 2,967 | | | 5,934 | | | 5,934 | |
Pre-tax pre-provision adjusted operating earnings available to common shareholders (non-GAAP) | $ | 169,092 | | $ | 81,218 | | $ | 91,668 | | $ | 250,312 | | $ | 159,515 | |
| | | | | | | | | | | | | | | |
Weighted average common shares outstanding, diluted | | 141,738,325 | | | 90,072,795 | | | 89,768,466 | | | 116,056,670 | | | 82,482,921 | |
Pre-tax pre-provision earnings per common share, diluted | $ | 1.19 | | $ | 0.90 | | $ | 1.02 | | $ | 2.16 | | $ | 1.93 | |
ATLANTIC UNION BANKSHARES CORPORATION AND SUBSIDIARIES
KEY FINANCIAL RESULTS (UNAUDITED)
(Dollars in thousands, except share data)
| As of & For Three Months Ended |
| As of & For Six Months Ended | | |||||||||||
| 6/30/25 |
| 3/31/25 |
| 6/30/24 |
| 6/30/25 | | 6/30/24 | | |||||
Mortgage Origination Held for Sale Volume | | | | | | | | | | | | | | | |
Refinance Volume | $ | 15,126 | | $ | 10,035 | | $ | 4,234 | | $ | 25,161 | | $ | 9,872 | |
Purchase Volume |
| 131,192 | |
| 33,733 | |
| 48,487 | |
| 164,925 | |
| 80,255 | |
Total Mortgage loan originations held for sale | $ | 146,318 | | $ | 43,768 | | $ | 52,721 | | $ | 190,086 | | $ | 90,127 | |
% of originations held for sale that are refinances |
| 10.3 | % |
| 22.9 | % |
| 8.0 | % |
| 13.2 | % |
| 11.0 | % |
|
| |
|
|
|
|
|
|
|
|
|
|
|
| |
Wealth |
|
| |
| | |
| | |
| | |
| | |
Assets under management | $ | 14,270,205 | | $ | 6,785,740 | | $ | 6,487,087 | | $ | 14,270,205 | | $ | 6,487,087 | |
|
| | |
| | |
| | |
| | |
| | |
Other Data | |
| | | | | | | | | | | | | |
End of period full-time equivalent employees | | 3,160 | | | 2,128 | | | 2,083 | | | 3,160 | |
| 2,083 | |
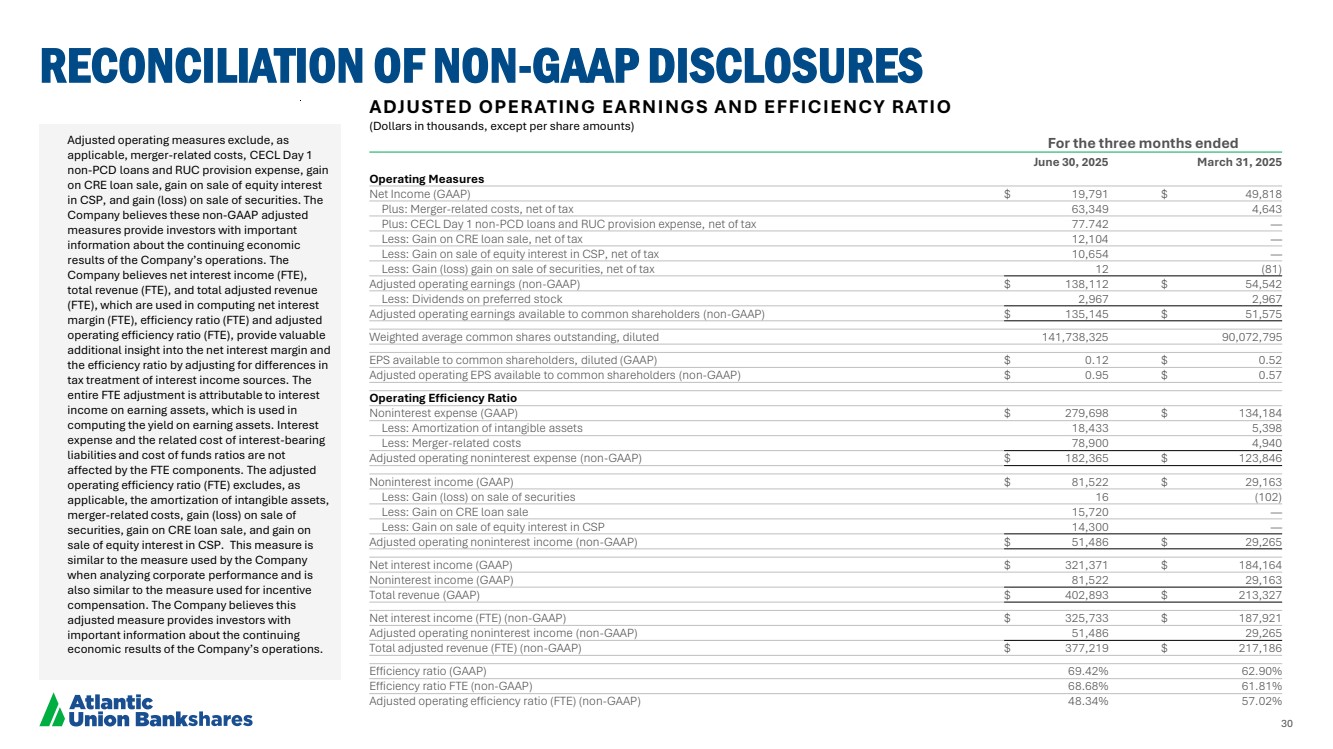
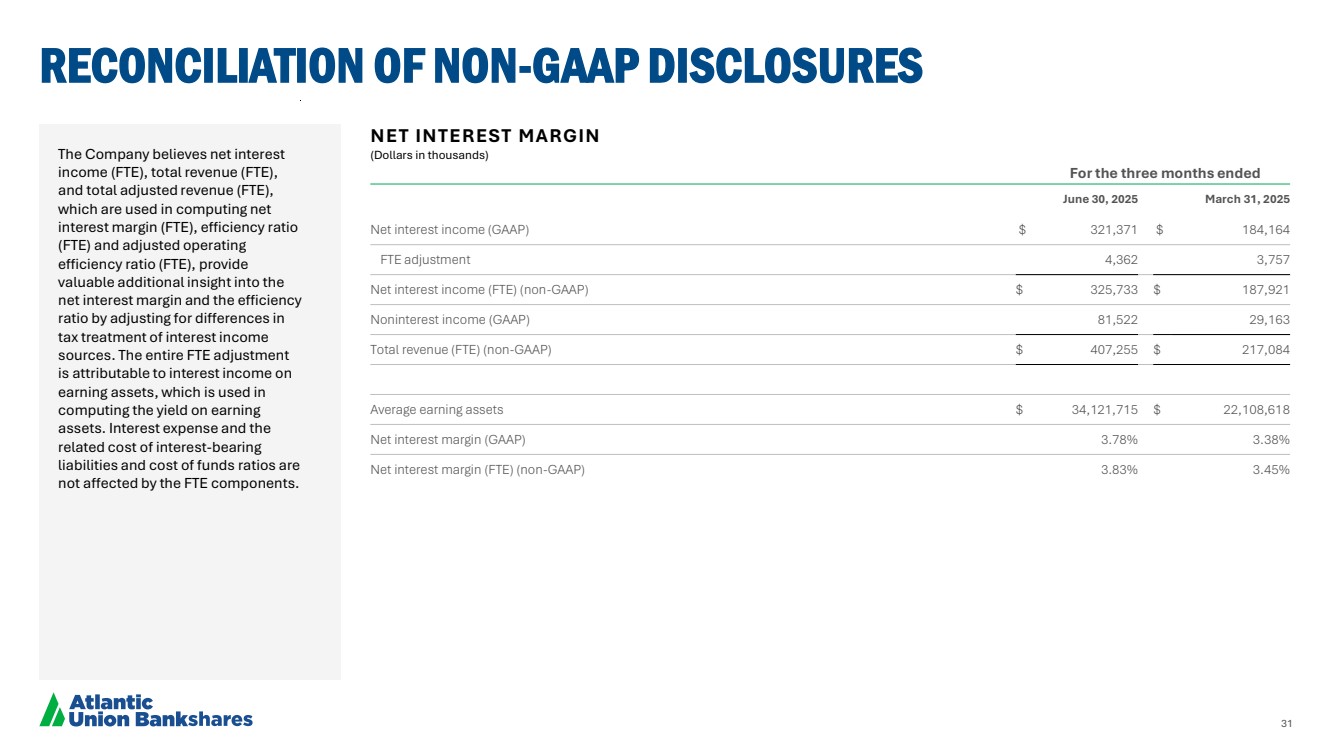
| (1) | These are non-GAAP financial measures. The Company believes net interest income (FTE), total revenue (FTE), and total adjusted revenue (FTE), which are used in computing net interest margin (FTE), efficiency ratio (FTE) and adjusted operating efficiency ratio (FTE), provide valuable additional insight into the net interest margin and the efficiency ratio by adjusting for differences in tax treatment of interest income sources. The entire FTE adjustment is attributable to interest income on earning assets, which is used in computing the yield on earning assets. Interest expense and the related cost of interest-bearing liabilities and cost of funds ratios are not affected by the FTE components. |
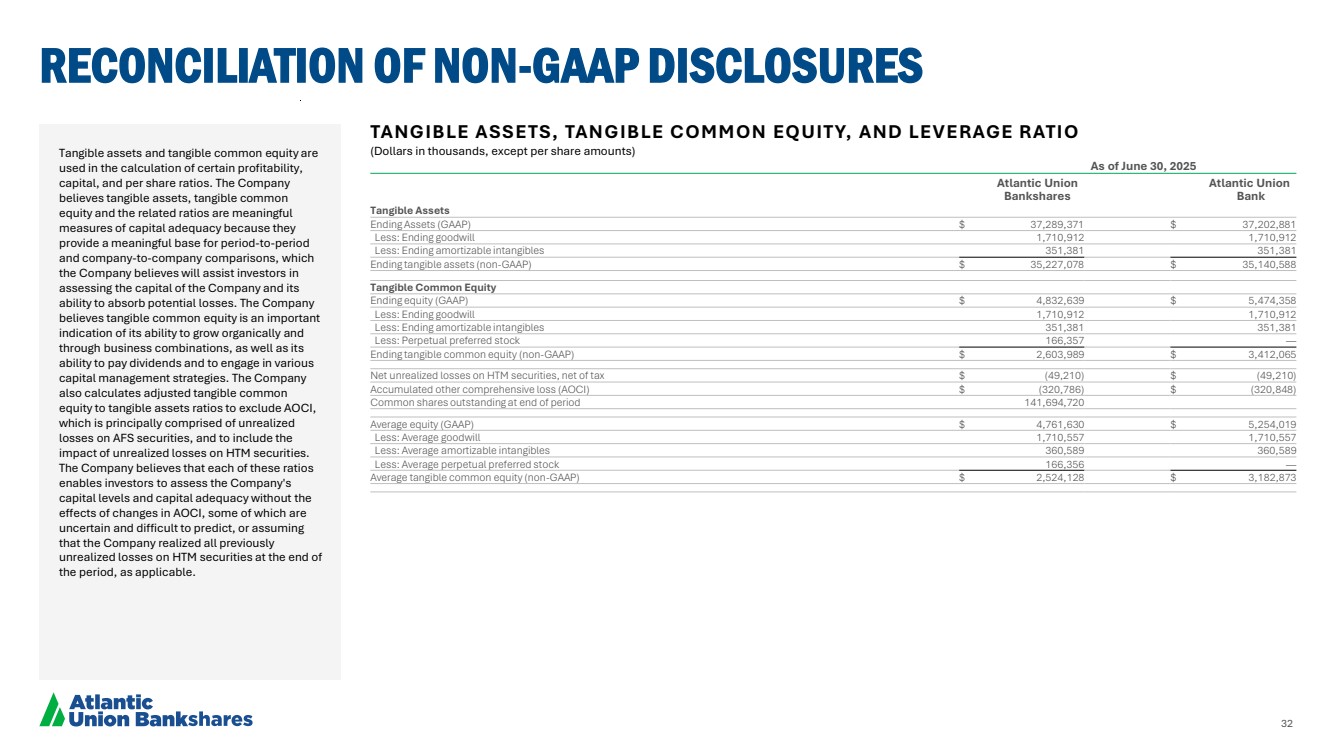
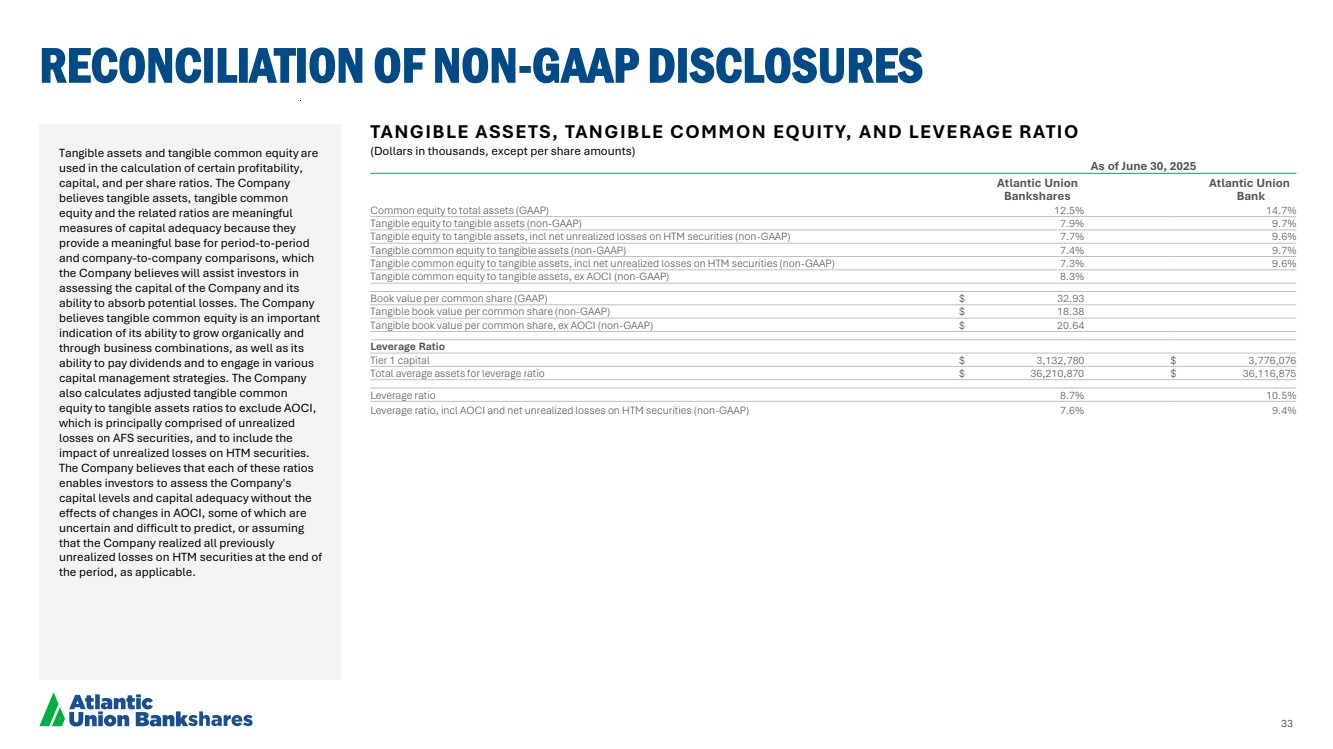
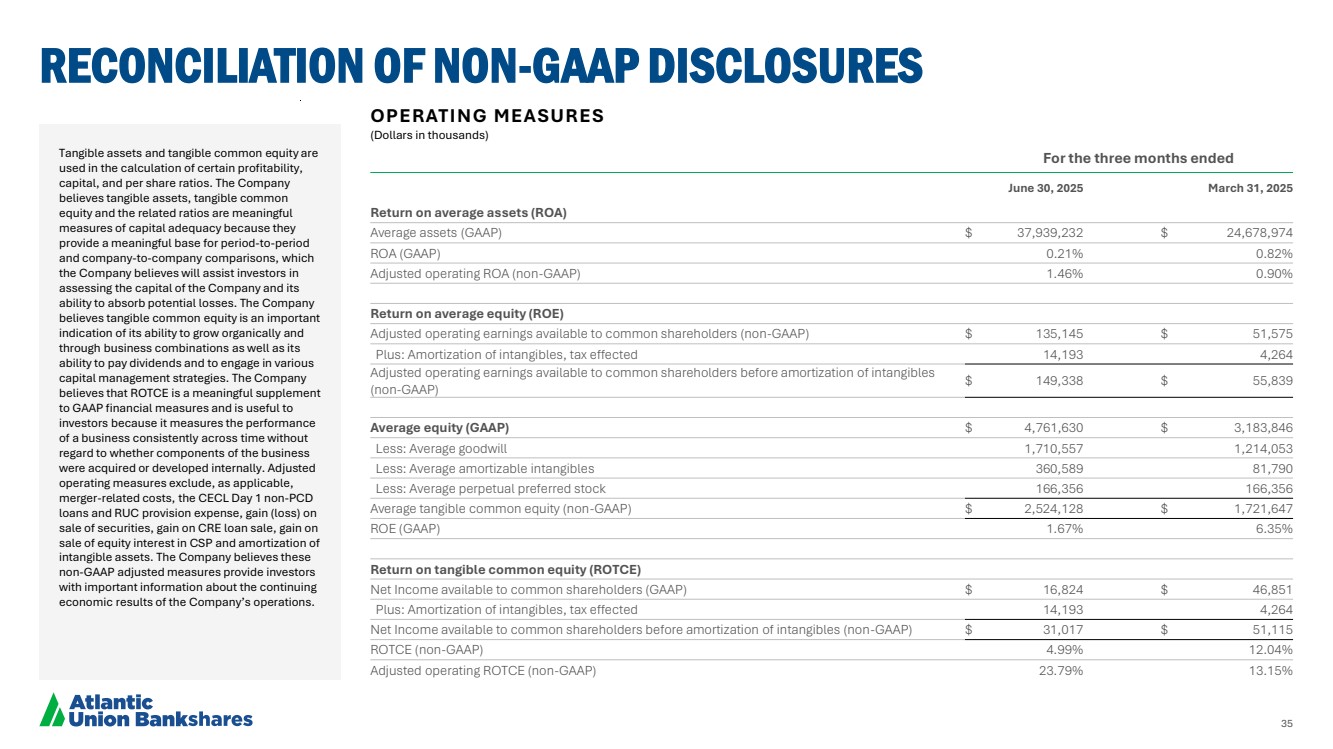
| (2) | These are non-GAAP financial measures. Tangible assets and tangible common equity are used in the calculation of certain profitability, capital, and per share ratios. The Company believes tangible assets, tangible common equity and the related ratios are meaningful measures of capital adequacy because they provide a meaningful base for period-to-period and company-to-company comparisons, which the Company believes will assist investors in assessing the capital of the Company and its ability to absorb potential losses. The Company believes tangible common equity is an important indication of its ability to grow organically and through business combinations as well as its ability to pay dividends and to engage in various capital management strategies. |
| (3) | These are non-GAAP financial measures. The Company believes that ROTCE is a meaningful supplement to GAAP financial measures and is useful to investors because it measures the performance of a business consistently across time without regard to whether components of the business were acquired or developed internally. |
| (4) | These are non-GAAP financial measures. Adjusted operating measures exclude, as applicable, merger-related costs, FDIC special assessments, deferred tax asset write-down, the CECL Day 1 non-PCD loans and RUC provision expense, gain (loss) on sale of securities, gain on CRE loan sale, and gain on sale of equity interest in CSP. The Company believes these non-GAAP adjusted measures provide investors with important information about the continuing economic results of the Company’s operations. Due to the impact of completing the Sandy Spring acquisition in the second quarter of 2025 and the acquisition of American National Bankshares in the second quarter of 2024, we updated our non-GAAP operating measures beginning in the second quarter of 2025 to exclude the CECL Day 1 non-PCD loans and RUC provision expense. The CECL Day 1 non-PCD loans and RUC provision expense is comprised of the initial provision expense on non-PCD loans, which represents the CECL “double count” of the non-PCD credit mark, and the additional provision for unfunded commitments. The Company does not view the CECL Day 1 non-PCD loans and RUC provision expense as organic costs to run the Company’s business and believes this updated presentation will provide investors with additional information to assist in period-to-period and company-to-company comparisons of operating performance, which will aid investors in analyzing the Company’s performance. Prior period non-GAAP operating measures presented in this release have been recast to conform to this updated presentation. |
| (5) | All ratios at June 30, 2025 are estimates and subject to change pending the Company’s filing of its FR Y9-C. All other periods are presented as filed. |
| (6) | The adjusted operating efficiency ratio (FTE) excludes, as applicable, the amortization of intangible assets, merger-related costs, FDIC special assessments, gain (loss) on sale of securities, gain on CRE loan sale, and gain on sale of equity interest in CSP. This measure is similar to the measure used by the Company when analyzing corporate performance and is also similar to the measure used for incentive compensation. The Company believes this adjusted measure provides investors with important information about the continuing economic results of the Company’s operations. |
| (7) | These are non-GAAP financial measures. Pre-tax pre-provision adjusted earnings excludes, as applicable, the provision for credit losses, which can fluctuate significantly from period-to-period under the CECL methodology, income tax (benefit) expense, merger-related costs, FDIC special assessments, gain (loss) on sale of securities, gain on CRE loan sale, and gain on sale of equity interest in CSP. The Company believes this adjusted measure provides investors with important information about the continuing economic results of the Company’s operations. |
| (8) | The calculations for the periods prior to March 31, 2025 exclude the impact of unvested restricted stock awards outstanding as of each period end; however, unvested shares are reflected in March 31, 2025 and subsequent period ratios. |
ATLANTIC UNION BANKSHARES CORPORATION AND SUBSIDIARIES
CONSOLIDATED BALANCE SHEETS
(Dollars in thousands, except share data)
| June 30, | | December 31, | | June 30, | |||
| 2025 |
| 2024 |
| 2024 | |||
ASSETS | | (unaudited) | | | (audited) | | | (unaudited) |
Cash and cash equivalents: | | | | | | | | |
Cash and due from banks | $ | 337,974 | | $ | 196,435 | | $ | 233,065 |
Interest-bearing deposits in other banks | | 1,246,294 | | | 153,695 | | | 207,129 |
Federal funds sold | | 4,380 | | | 3,944 | | | 5,820 |
Total cash and cash equivalents | | 1,588,648 | | | 354,074 | | | 446,014 |
Securities available for sale, at fair value | | 3,809,281 | | | 2,442,166 | | | 2,555,723 |
Securities held to maturity, at carrying value | | 827,135 | | | 803,851 | | | 810,450 |
Restricted stock, at cost | | 140,606 | | | 102,954 | | | 125,308 |
Loans held for sale | | 32,987 | | | 9,420 | | | 12,906 |
Loans held for investment, net of deferred fees and costs | | 27,328,333 | | | 18,470,621 | | | 18,347,190 |
Less: allowance for loan and lease losses | | 315,574 | | | 178,644 | | | 158,131 |
Total loans held for investment, net | | 27,012,759 | | | 18,291,977 | | | 18,189,059 |
Premises and equipment, net | | 164,828 | | | 112,704 | | | 114,987 |
Goodwill | | 1,710,912 | | | 1,214,053 | | | 1,207,484 |
Amortizable intangibles, net | | 351,381 | | | 84,563 | | | 95,980 |
Bank owned life insurance | | 665,477 | | | 493,396 | | | 489,550 |
Other assets | | 985,357 | | | 676,165 | | | 713,952 |
Total assets | $ | 37,289,371 | | $ | 24,585,323 | | $ | 24,761,413 |
LIABILITIES | | | | | | | | |
Noninterest-bearing demand deposits | $ | 7,039,121 | | $ | 4,277,048 | | $ | 4,527,248 |
Interest-bearing deposits | | 23,933,054 | | | 16,120,571 | | | 15,473,629 |
Total deposits | | 30,972,175 | | | 20,397,619 | | | 20,000,877 |
Securities sold under agreements to repurchase | | 127,351 | | | 56,275 | | | 64,585 |
Other short-term borrowings | | — | | | 60,000 | | | 725,500 |
Long-term borrowings | | 765,416 | | | 418,303 | | | 416,649 |
Other liabilities | | 591,790 | | | 510,247 | | | 510,116 |
Total liabilities | | 32,456,732 | | | 21,442,444 | | | 21,717,727 |
Commitments and contingencies | | | | | | | | |
STOCKHOLDERS' EQUITY | | | | | | | | |
Preferred stock, $10.00 par value | | 173 | | | 173 | | | 173 |
Common stock, $1.33 par value | | 188,454 | | | 118,519 | | | 118,475 |
Additional paid-in capital | | 3,876,831 | | | 2,280,547 | | | 2,273,312 |
Retained earnings | | 1,087,967 | | | 1,103,326 | | | 1,034,313 |
Accumulated other comprehensive loss | | (320,786) | | | (359,686) | | | (382,587) |
Total stockholders' equity | | 4,832,639 | | | 3,142,879 | | | 3,043,686 |
Total liabilities and stockholders' equity | $ | 37,289,371 | | $ | 24,585,323 | | $ | 24,761,413 |
| | | | | | | | |
Common shares outstanding | | 141,694,720 | | | 89,770,231 | | | 89,769,734 |
Common shares authorized | | 200,000,000 | | | 200,000,000 | | | 200,000,000 |
Preferred shares outstanding | | 17,250 | | | 17,250 | | | 17,250 |
Preferred shares authorized | | 500,000 | | | 500,000 | | | 500,000 |
ATLANTIC UNION BANKSHARES CORPORATION AND SUBSIDIARIES
CONSOLIDATED STATEMENTS OF INCOME (UNAUDITED)
(Dollars in thousands, except share data)
| Three Months Ended | | Six Months Ended | |||||||||||
| June 30, | | March 31, | | June 30, | | June 30, | | June 30, | |||||
| 2025 | | 2025 |
| 2024 |
| 2025 | | 2024 | |||||
Interest and dividend income: | | | | | | | | | | | | | | |
Interest and fees on loans | $ | 458,766 | | $ | 271,515 | | $ | 285,198 | | $ | 730,281 | | $ | 519,796 |
Interest on deposits in other banks | | 4,991 | | | 2,513 | | | 2,637 | | | 7,504 | | | 3,918 |
Interest and dividends on securities: | | | | | | | | | | | | | | |
Taxable | | 38,260 | | | 23,648 | | | 24,886 | | | 61,908 | | | 43,765 |
Nontaxable | | 8,355 | | | 8,160 | | | 8,167 | | | 16,515 | | | 16,323 |
Total interest and dividend income | | 510,372 | | | 305,836 | | | 320,888 | | | 816,208 | | | 583,802 |
Interest expense: | | | | | | | | | | | | | | |
Interest on deposits | | 171,343 | | | 115,587 | | | 122,504 | | | 286,929 | | | 224,368 |
Interest on short-term borrowings | | 4,147 | | | 909 | | | 8,190 | | | 5,056 | | | 16,351 |
Interest on long-term borrowings | | 13,511 | | | 5,176 | | | 5,660 | | | 18,687 | | | 10,725 |
Total interest expense | | 189,001 | | | 121,672 | | | 136,354 | | | 310,672 | | | 251,444 |
Net interest income | | 321,371 | | | 184,164 | | | 184,534 | | | 505,536 | | | 332,358 |
Provision for credit losses | | 105,707 | | | 17,638 | | | 21,751 | | | 123,345 | | | 29,989 |
Net interest income after provision for credit losses | | 215,664 | | | 166,526 | | | 162,783 | | | 382,191 | | | 302,369 |
Noninterest income: | | | | | | | | | | | | | | |
Service charges on deposit accounts | | 12,220 | | | 9,683 | | | 9,086 | | | 21,905 | | | 17,655 |
Other service charges, commissions and fees | | 2,245 | | | 1,762 | | | 1,967 | | | 4,007 | | | 3,698 |
Interchange fees | | 3,779 | | | 2,949 | | | 3,126 | | | 6,727 | | | 5,420 |
Fiduciary and asset management fees | | 17,723 | | | 6,697 | | | 6,907 | | | 24,420 | | | 11,745 |
Mortgage banking income | | 2,821 | | | 973 | | | 1,193 | | | 3,794 | | | 2,060 |
Gain (loss) on sale of securities | | 16 | | | (102) | | | (6,516) | | | (87) | | | (6,513) |
Bank owned life insurance income | | 7,327 | | | 3,537 | | | 3,791 | | | 10,864 | | | 7,037 |
Loan-related interest rate swap fees | | 1,733 | | | 2,400 | | | 1,634 | | | 4,133 | | | 2,850 |
Other operating income | | 33,658 | | | 1,264 | | | 2,624 | | | 34,922 | | | 5,413 |
Total noninterest income | | 81,522 | | | 29,163 | | | 23,812 | | | 110,685 | | | 49,365 |
Noninterest expenses: | | | | | | | | | | | | | | |
Salaries and benefits | | 109,942 | | | 75,415 | | | 68,531 | | | 185,357 | | | 130,413 |
Occupancy expenses | | 12,782 | | | 8,580 | | | 7,836 | | | 21,362 | | | 14,462 |
Furniture and equipment expenses | | 6,344 | | | 3,914 | | | 3,805 | | | 10,258 | | | 7,114 |
Technology and data processing | | 17,248 | | | 10,188 | | | 10,274 | | | 27,435 | | | 18,401 |
Professional services | | 7,808 | | | 4,687 | | | 4,377 | | | 12,494 | | | 7,458 |
Marketing and advertising expense | | 3,757 | | | 3,184 | | | 2,983 | | | 6,941 | | | 5,301 |
FDIC assessment premiums and other insurance | | 8,642 | | | 5,201 | | | 4,675 | | | 13,844 | | | 9,818 |
Franchise and other taxes | | 4,688 | | | 4,643 | | | 5,013 | | | 9,331 | | | 9,514 |
Loan-related expenses | | 1,278 | | | 1,249 | | | 1,275 | | | 2,527 | | | 2,598 |
Amortization of intangible assets | | 18,433 | | | 5,398 | | | 5,995 | | | 23,832 | | | 7,889 |
Merger-related costs | | 78,900 | | | 4,940 | | | 29,778 | | | 83,840 | | | 31,652 |
Other expenses | | 9,876 | | | 6,785 | | | 5,463 | | | 16,661 | | | 10,659 |
Total noninterest expenses | | 279,698 | | | 134,184 | | | 150,005 | | | 413,882 | | | 255,279 |
Income before income taxes | | 17,488 | | | 61,505 | | | 36,590 | | | 78,994 | | | 96,455 |
Income tax (benefit) expense | | (2,303) | | | 11,687 | | | 11,429 | | | 9,384 | | | 21,525 |
Net Income | $ | 19,791 | | $ | 49,818 | | $ | 25,161 | | $ | 69,610 | | $ | 74,930 |
Dividends on preferred stock | | 2,967 | | | 2,967 | | | 2,967 | | | 5,934 | | | 5,934 |
Net income available to common shareholders | $ | 16,824 | | $ | 46,851 | | $ | 22,194 | | $ | 63,676 | | $ | 68,996 |
| | | | | | | | | | | | | | |
Basic earnings per common share | $ | 0.12 | | $ | 0.53 | | $ | 0.25 | | $ | 0.55 | | $ | 0.84 |
Diluted earnings per common share | $ | 0.12 | | $ | 0.52 | | $ | 0.25 | | $ | 0.55 | | $ | 0.84 |
ATLANTIC UNION BANKSHARES CORPORATION AND SUBSIDIARIES
AVERAGE BALANCES, INCOME AND EXPENSES, YIELDS AND RATES (TAXABLE EQUIVALENT BASIS) (UNAUDITED)
(Dollars in thousands)
| For the Quarter Ended | ||||||||||||||
| June 30, 2025 | | March 31, 2025 | ||||||||||||
| Average |
| Interest |
| Yield / |
| Average |
| Interest |
| Yield / | ||||
Assets: |
| | | | | | | | | | | | |
| |
Securities: |
| | | | | | | | | | | | |
| |
Taxable | $ | 3,441,963 | | $ | 38,260 | | 4.46% | | $ | 2,131,859 | | $ | 23,648 | | 4.50% |
Tax-exempt | | 1,279,773 | | | 10,576 | | 3.31% | | | 1,255,768 | | | 10,329 | | 3.34% |
Total securities | | 4,721,736 | | | 48,836 | | 4.15% | | | 3,387,627 | | | 33,977 | | 4.07% |
LHFI, net of deferred fees and costs (3)(4) | | 27,094,551 | | | 437,819 | | 6.48% | | | 18,428,710 | | | 272,904 | | 6.01% |
Other earning assets | | 2,305,428 | | | 28,079 | | 4.89% | | | 292,281 | | | 2,712 | | 3.76% |
Total earning assets | | 34,121,715 | | $ | 514,734 | | 6.05% | | | 22,108,618 | | $ | 309,593 | | 5.68% |
Allowance for loan and lease losses | | (349,131) | | | | | | | | (179,601) | | | | | |
Total non-earning assets | | 4,166,648 | | | | | | | | 2,749,957 | | | | | |
Total assets | $ | 37,939,232 | | | | | | | $ | 24,678,974 | | | | | |
| | | | | | | | | | | | | | | |
Liabilities and Stockholders' Equity: | | | | | | | | | | | | | | | |
Interest-bearing deposits: | | | | | | | | | | | | | | | |
Transaction and money market accounts | $ | 14,748,786 | | $ | 95,719 | | 2.60% | | $ | 10,316,955 | | $ | 66,688 | | 2.62% |
Regular savings | | 2,848,416 | | | 13,818 | | 1.95% | | | 1,029,875 | | | 501 | | 0.20% |
Time deposits (5) | | 6,553,018 | | | 61,806 | | 3.78% | | | 4,715,648 | | | 48,398 | | 4.16% |
Total interest-bearing deposits | | 24,150,220 | | | 171,343 | | 2.85% | | | 16,062,478 | | | 115,587 | | 2.92% |
Other borrowings (6) | | 1,331,793 | | | 17,658 | | 5.32% | | | 525,889 | | | 6,085 | | 4.69% |
Total interest-bearing liabilities | $ | 25,482,013 | | $ | 189,001 | | 2.97% | | $ | 16,588,367 | | $ | 121,672 | | 2.97% |
| | | | | | | | | | | | | | | |
Noninterest-bearing liabilities: | | | | | | | | | | | | | | | |
Demand deposits | | 7,093,163 | | | | | | | | 4,403,603 | | | | | |
Other liabilities | | 602,426 | | | | | | | | 503,158 | | | | | |
Total liabilities | | 33,177,602 | | | | | | | | 21,495,128 | | | | | |
Stockholders' equity | | 4,761,630 | | | | | | | | 3,183,846 | | | | | |
Total liabilities and stockholders' equity | $ | 37,939,232 | | | | | | | $ | 24,678,974 | | | | | |
| | | | | | | | | | | | | | | |
Net interest income (FTE) | | | | $ | 325,733 | | | | | | | $ | 187,921 | | |
| | | | | | | | | | | | | | | |
Interest rate spread | | | | | | | 3.08% | | | | | | | | 2.71% |
Cost of funds | | | | | | | 2.22% | | | | | | | | 2.23% |
Net interest margin (FTE) | | | | | | | 3.83% | | | | | | | | 3.45% |
| (1) | Income and yields are reported on a taxable equivalent basis using the statutory federal corporate tax rate of 21%. |
| (2) | Rates and yields are annualized and calculated from rounded amounts in thousands, which appear above. |
| (3) | Nonaccrual loans are included in average loans outstanding. |
| (4) | Interest income on loans includes $45.7 million and $13.3 million for the three months ended June 30, 2025 and March 31, 2025, respectively, in accretion of the fair market value adjustments related to acquisitions. |
| (5) | Interest expense on time deposits includes $1.9 million in accretion and $415,000 in amortization for the three months ended June 30, 2025 and March 31, 2025, respectively, of the fair market value adjustments related to acquisitions. |
| (6) | Interest expense on borrowings includes $2.3 million and $287,000 for the three months ended June 30, 2025 and March 31, 2025, respectively, in amortization of the fair market value adjustments related to acquisitions. |