Exhibit 99.1

Contact: Robert M. Gorman - (804) 523-7828
Executive Vice President / Chief Financial Officer
ATLANTIC UNION BANKSHARES REPORTS FIRST QUARTER RESULTS
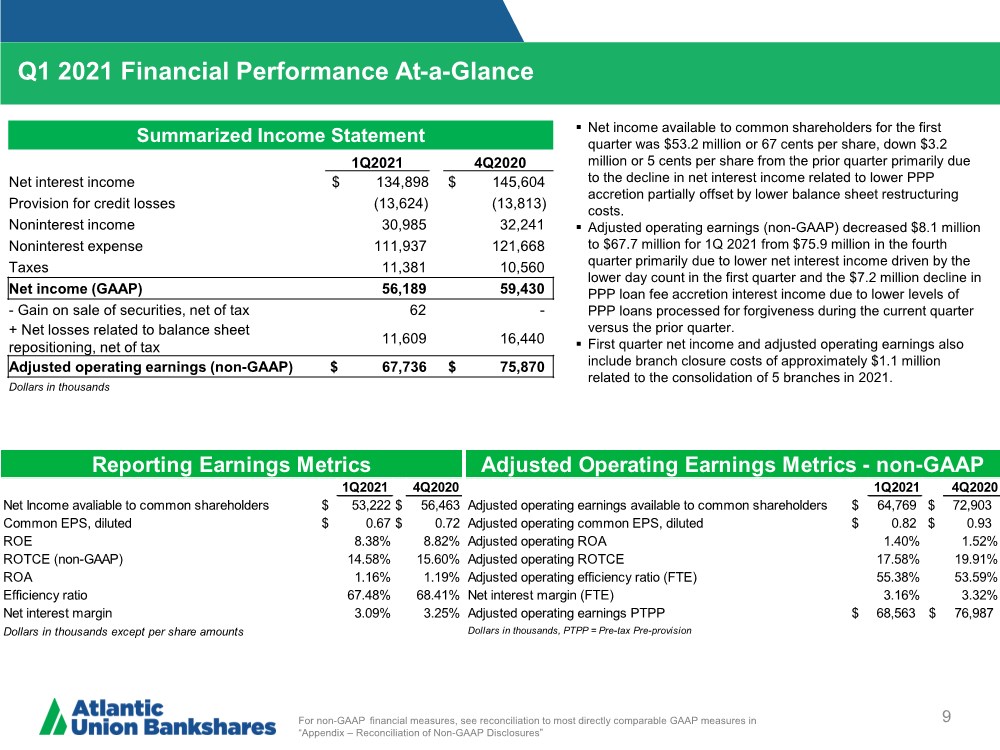
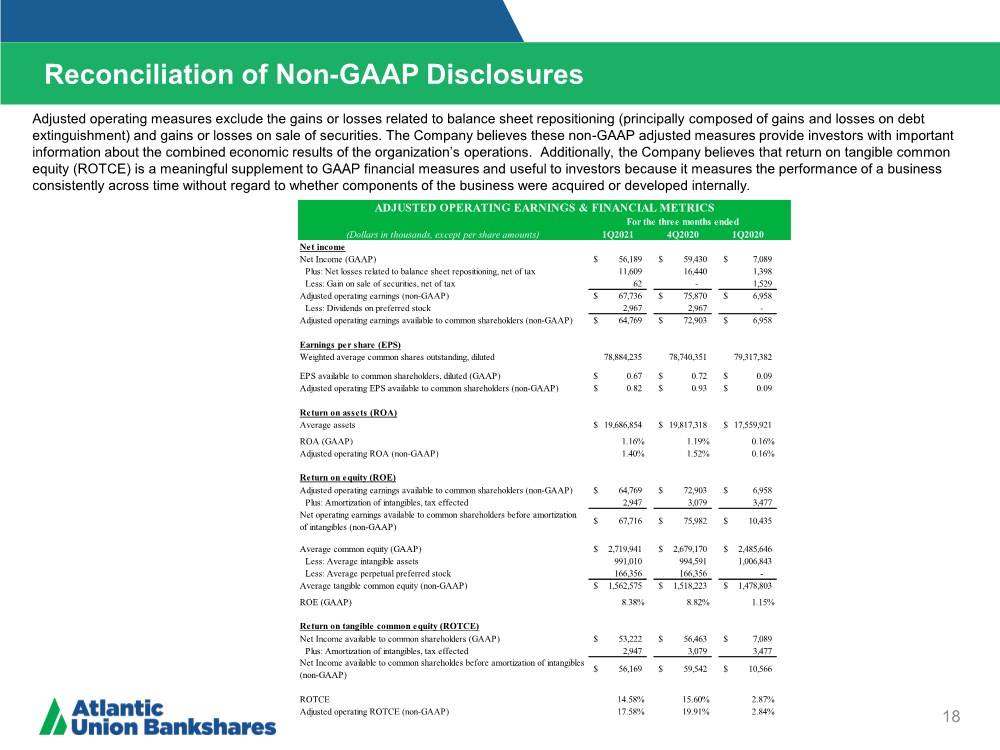
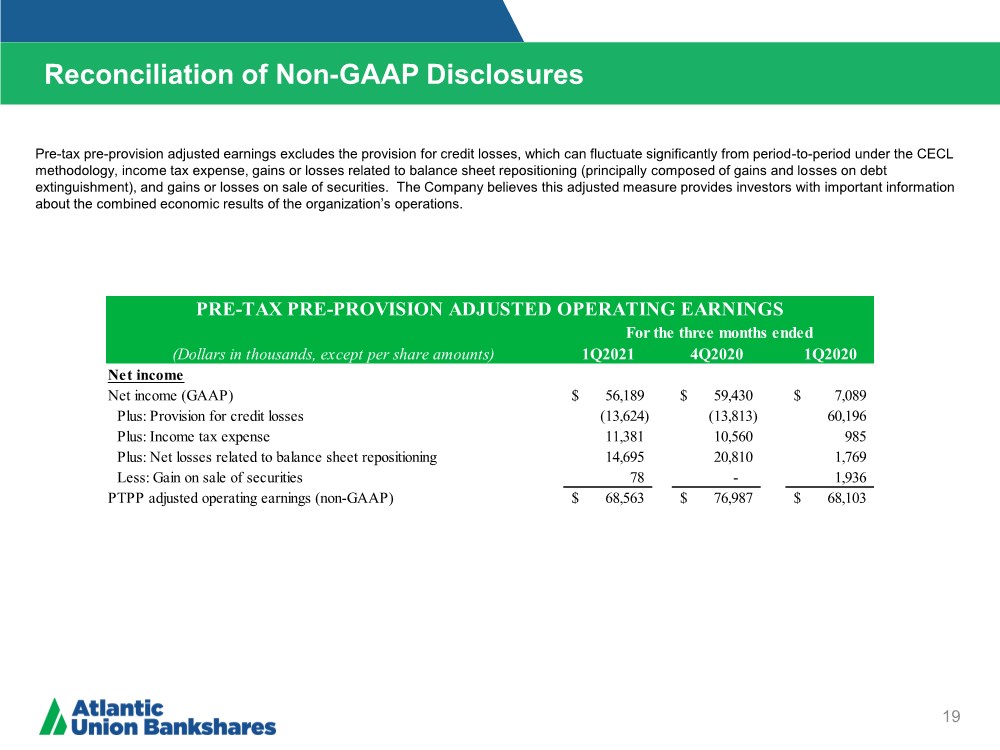
Richmond, Va., April 22, 2021 – Atlantic Union Bankshares Corporation (the “Company” or “Atlantic Union”) (Nasdaq: AUB) today reported net income available to common shareholders of $53.2 million and basic and diluted earnings per common share of $0.67 for the first quarter ended March 31, 2021. Adjusted operating earnings available to common shareholders(1) were $64.8 million, diluted operating earnings per common share(1) were $0.82, and pre-tax pre-provision adjusted operating earnings(1) were $68.6 million for the first quarter ended March 31, 2021.
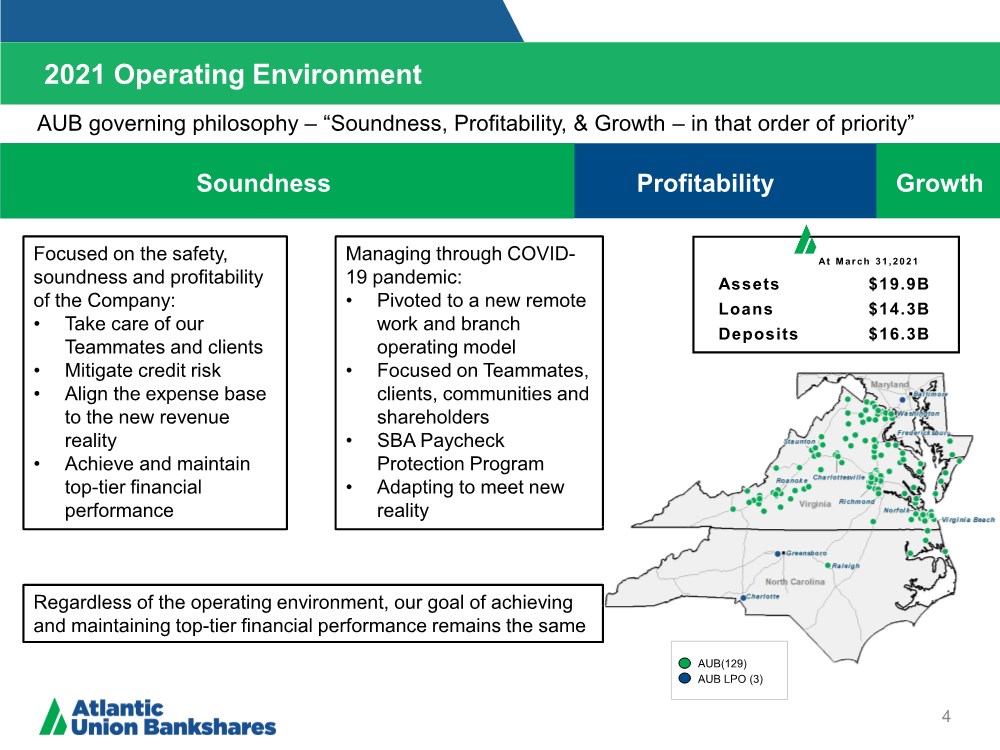
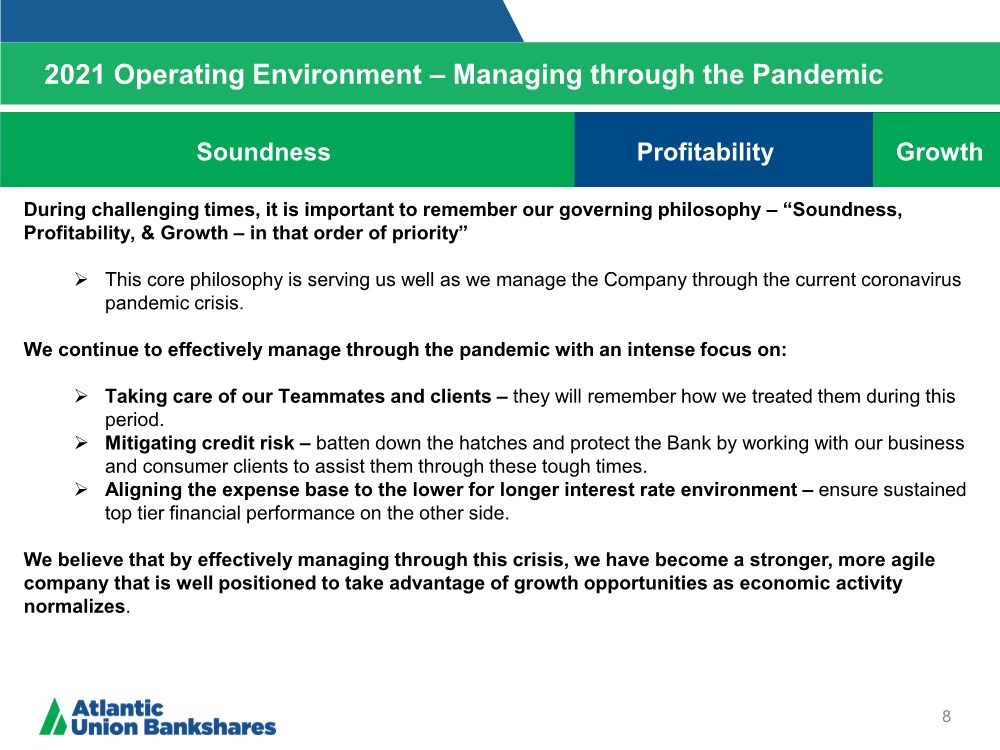
“Despite near term economic headwinds from COVID-19, Atlantic Union delivered solid financial results in the first quarter while positioning the company for success over the long term,” said John C. Asbury, president and chief executive officer of Atlantic Union. “Operating under the mantra of soundness, profitability and growth – in that order of priority - Atlantic Union remains in a strong financial position with ample liquidity and a well-fortified capital base.”
“Our conservative credit culture continues to serve us well as we help our clients manage through the pandemic. With credit quality metrics remaining benign and a more optimistic economic recovery outlook due to the roll-out of COVID-19 vaccines and additional government stimulus inclusive of more PPP funding, we believe that credit losses will not be as severe as initially projected and that loan growth will improve as economic activity accelerates over the next few quarters.”
“Looking forward, we remain optimistic that the challenges of COVID-19 will ease as the year progresses and that Atlantic Union will emerge as a stronger company that is well positioned to generate sustainable, profitable growth and build long term value for our shareholders.”
Small Business Administration (“SBA”) Paycheck Protection Program (“PPP”)
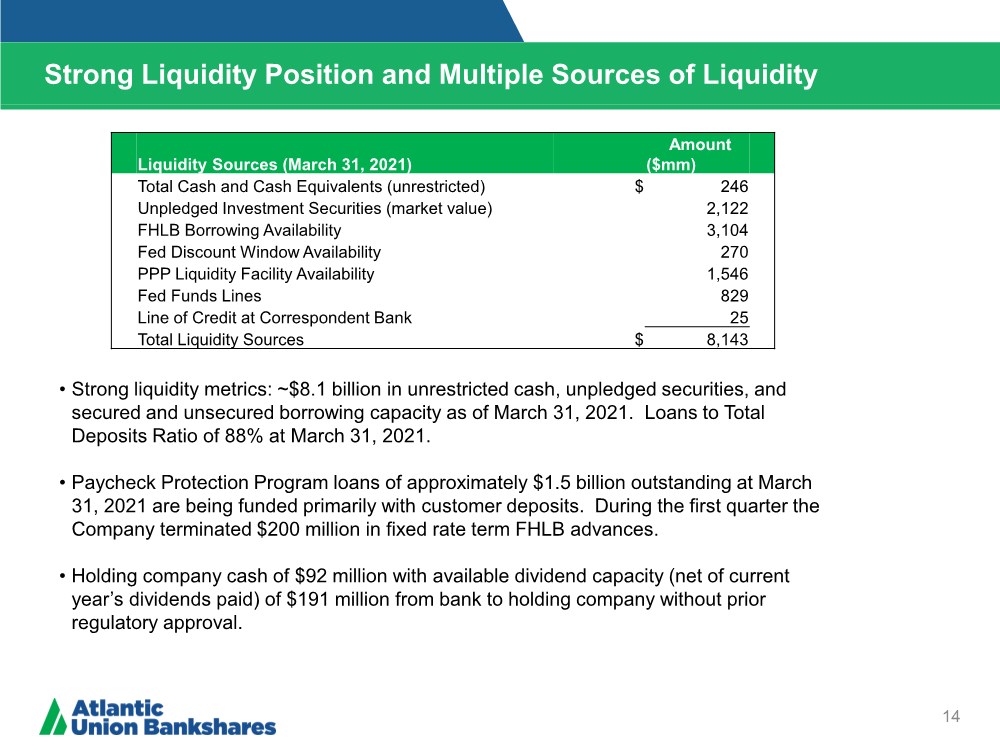
The Company has participated in the SBA PPP under the Coronavirus Aid, Relief, and Economic Security (“CARES”) Act (“PPP Round One”), which was intended to provide economic relief to small businesses that have been adversely impacted by the COVID-19 global pandemic (“COVID-19”). The Company processed over 11,000 PPP loans totaling $1.7 billion in 2020 pursuant to the CARES Act. The loans carry a 1% interest rate. As of March 31, 2021, PPP Round One loans have a recorded investment of $1.03 billion and unamortized deferred fees of $10.7 million. In addition to an insignificant amount of PPP loan pay offs, the Company has processed approximately $600 million of loan forgiveness on approximately 5,600 PPP loans, of which approximately 2,500 PPP loans totaling approximately $165.0 million were processed for forgiveness in the first quarter of 2021.
Certain provisions of the CARES Act, including additional PPP funding, were extended as a result of the Consolidated Appropriations Act 2021 (the “CAA”) (“PPP Round Two”), which was signed into law on December 27, 2020 and is currently set to expire on May 31, 2021. The Company has processed approximately 4,800 loans pursuant to PPP Round Two, with a recorded investment of $511.7 million and unamortized deferred fees of $22.4 million as of March 31, 2021. The loans carry a 1% interest rate.
| (1) | These are financial measures not calculated in accordance with generally accepted accounting principles (“GAAP”). For a reconciliation of these non-GAAP financial measures, see Alternative Performance Measures (non-GAAP) section of the Key Financial Results |
First Quarter 2021 Branch Consolidations and FHLB Advance Prepayments
The Company completed the consolidation of five branches in February 2021 and incurred branch closure costs of approximately $1.1 million in the first quarter of 2021 primarily related to lease termination costs, severance costs, and real estate write-downs.
Additionally, during the first quarter of 2021 and in response to the current rate environment, the Company prepaid a $200 million, 1.78% fixed rate long-term Federal Home Loan Bank (“FHLB”) advance with a remaining maturity of approximately 7.5 years, which resulted in a $14.7 million and $11.6 million pre-tax and after tax, respectively, prepayment penalty in the first quarter of 2021.
NET INTEREST INCOME
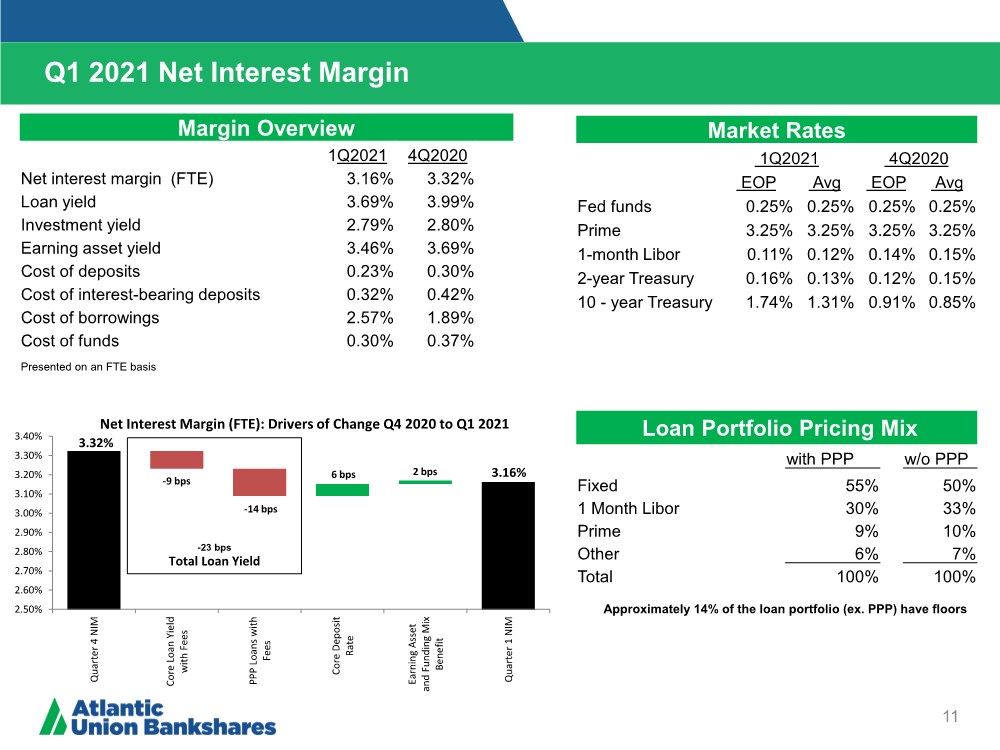
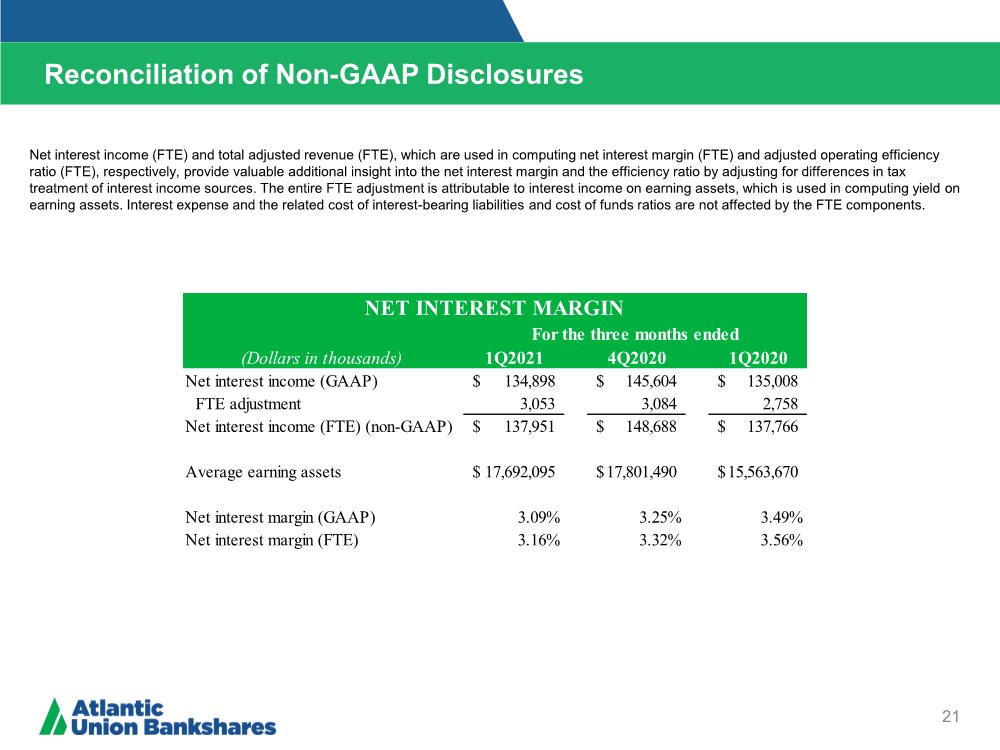
For the first quarter of 2021, net interest income was $134.9 million, a decrease from $145.6 million reported in the fourth quarter of 2020. Net interest income (FTE)(1) was $138.0 million in the first quarter of 2021, a decrease of $10.7 million from the fourth quarter of 2020. The declines in the net interest income and net interest income (FTE) were primarily driven by the lower day count in the first quarter and the decrease in PPP loan accretion included in interest income to $7.8 million in the first quarter of 2021 from $15.0 million in the fourth quarter of 2020. The decline in PPP loan accretion income was driven by fewer PPP loan forgiveness approvals during the first quarter due to the Company’s PPP forgiveness borrower portal being closed for approximately two months as a result of revised guidance issued by the SBA. The first quarter net interest margin decreased 16 basis points to 3.09% from 3.25% in the previous quarter, while the net interest margin (FTE)(1) decreased 16 basis points to 3.16% from 3.32% during the same period primarily due to lower PPP loan accretion income in the first quarter.
The Company’s net interest margin (FTE) (1) includes the impact of acquisition accounting fair value adjustments. Net accretion related to acquisition accounting decreased $266,000 from the prior quarter to $4.1 million for the quarter ended March 31, 2021. The fourth quarter of 2020 and first quarter of 2021 and the remaining estimated net accretion impact are reflected in the following table (dollars in thousands):
| | | | | Deposit | | | | | | | |
| | Loan | | Accretion | | Borrowings | | | | |||
|
| Accretion |
| (Amortization) |
| Amortization |
| Total | ||||
For the quarter ended December 31, 2020 | | $ | 4,541 | | | 22 | | | (188) | | $ | 4,375 |
For the quarter ended March 31, 2021 | | | 4,287 | | | 20 | | | (198) | | | 4,109 |
For the remaining nine months of 2021 (estimated) | |
| 5,974 | | | (5) | | | (608) | |
| 5,361 |
For the years ending (estimated): | |
|
| |
|
| |
|
| |
|
|
2022 | |
| 6,660 | |
| (43) | |
| (829) | |
| 5,788 |
2023 | |
| 4,903 | |
| (32) | |
| (852) | |
| 4,019 |
2024 | |
| 3,943 | |
| (4) | |
| (877) | |
| 3,062 |
2025 | |
| 2,993 | |
| (1) | |
| (900) | |
| 2,092 |
2026 | |
| 2,376 | |
| — | |
| (926) | |
| 1,450 |
Thereafter | |
| 10,955 | |
| — | |
| (8,946) | |
| 2,009 |
Total remaining acquisition accounting fair value adjustments at March 31, 2021 | | $ | 37,804 | | | (85) | | | (13,938) | | $ | 23,781 |
ASSET QUALITY
Overview
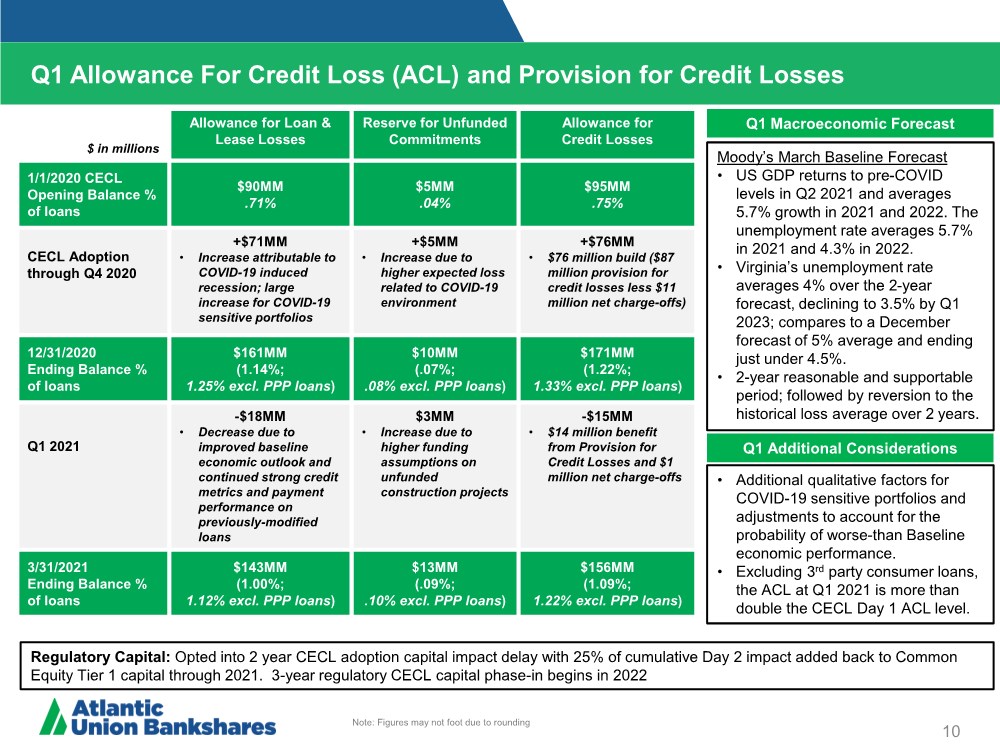
During the first quarter of 2021, nonperforming assets (“NPAs”) as a percentage of loans decreased slightly and remained low at 0.31% at March 31, 2021. Accruing past due loan levels as a percentage of total loans held for investment at March 31, 2021 decreased 11 basis points as compared to December 31, 2020 and were 34 basis points lower than accruing past due loan levels at March 31, 2020. Net charge-off levels remained low at 0.03% of average loans for the first quarter 2021, which is a 2 basis point decrease from the fourth quarter of 2020, and a 13 basis point decrease from the first quarter of 2020. The allowance for credit losses (“ACL”) decreased $14.8 million from December 31, 2020 due primarily to improvements in the macroeconomic outlook.
(1) These are financial measures not calculated in accordance with GAAP. For a reconciliation of these non-GAAP financial measures, see Alternative Performance Measures (non-GAAP) section of the Key Financial Results
Loan Modifications for Borrowers Affected by COVID-19
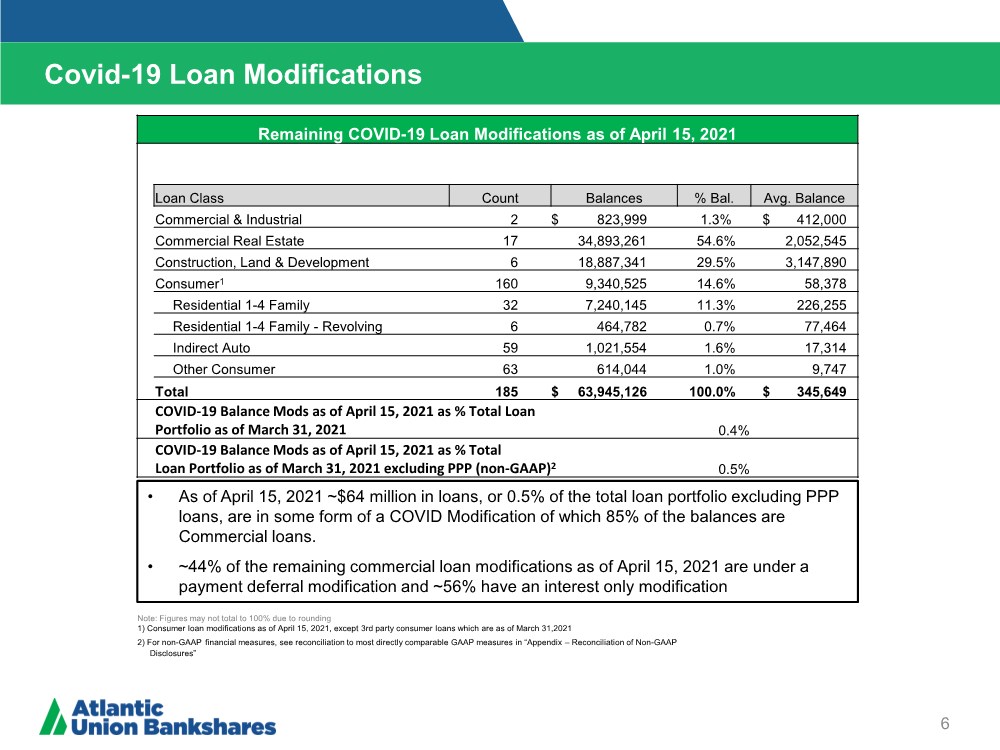
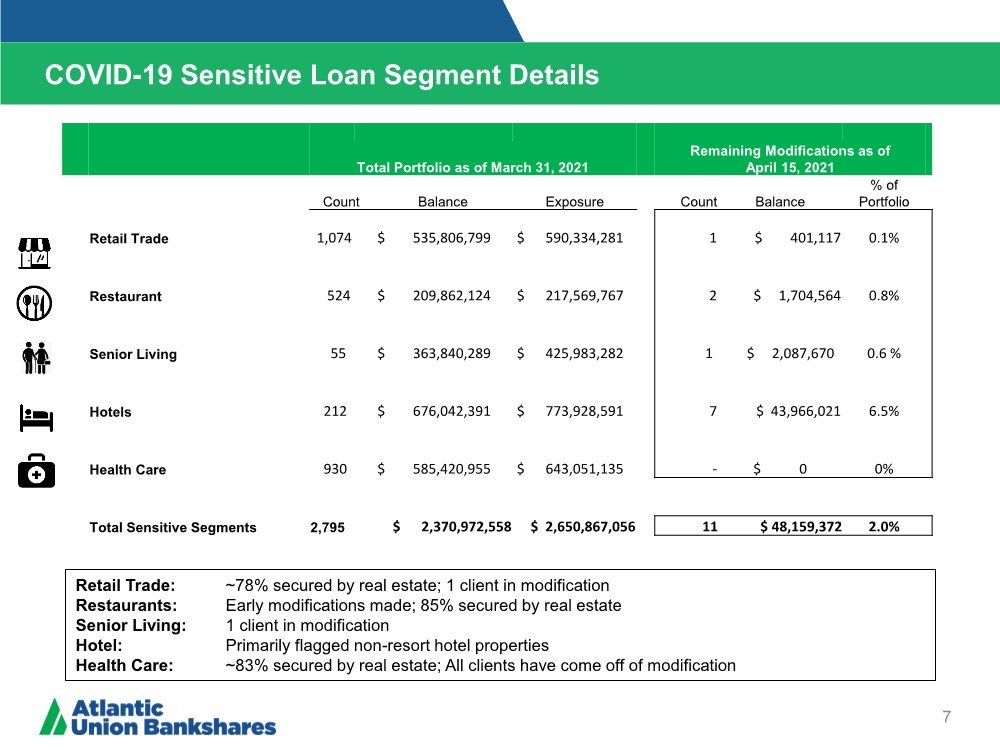
The Company has made certain loan modifications pursuant to joint guidance issued and subsequently updated by the five federal bank regulatory agencies and the Conference of State Bank Supervisors regarding loan modifications for borrowers affected by COVID-19 (the “Joint Guidance “) and Section 4013 of the CARES Act (as amended by the CAA). At March 31, 2021, total loans that remain under their modified terms was approximately $68.1 million or less than 1% of total loans, compared to $146.1 million at December 31, 2020. The majority of the Company’s modifications as of March 31, 2021 were in the construction and land development, commercial real estate, and commercial portfolios.
Nonperforming Assets
At March 31, 2021, NPAs totaled $44.2 million, a decrease of $1.0 million from December 31, 2020. NPAs as a percentage of total outstanding loans at March 31, 2021 were 0.31%, a decrease of 1 basis points from 0.32% at December 31, 2020. Excluding the impact of the PPP loans(1), NPAs as a percentage of total adjusted loans held for investment were 0.35% at March 31, 2021, consistent with December 31, 2020.
The following table shows a summary of nonperforming asset balances at the quarter ended (dollars in thousands):
|
| March 31, |
| December 31, |
| September 30, |
| June 30, |
| March 31, | |||||
| | 2021 | | 2020 | | 2020 | | 2020 | | 2020 | |||||
Nonaccrual loans | | $ | 41,866 | | $ | 42,448 | | $ | 39,023 | | $ | 39,624 | | $ | 44,022 |
Foreclosed properties | |
| 2,344 | |
| 2,773 | |
| 4,159 | |
| 4,397 | |
| 4,444 |
Total nonperforming assets | | $ | 44,210 | | $ | 45,221 | | $ | 43,182 | | $ | 44,021 | | $ | 48,466 |
The following table shows the activity in nonaccrual loans for the quarter ended (dollars in thousands):
|
| March 31, |
| December 31, |
| September 30, |
| June 30, |
| March 31, | |||||
| | 2021 | | 2020 | | 2020 | | 2020 | | 2020 | |||||
Beginning Balance | | $ | 42,448 | | $ | 39,023 | | $ | 39,624 | | $ | 44,022 | | $ | 28,232 |
Net customer payments | |
| (4,133) | |
| (4,640) | |
| (2,803) | |
| (6,524) | |
| (3,451) |
Additions | |
| 3,821 | |
| 8,211 | |
| 2,790 | |
| 3,206 | |
| 6,059 |
Impact of CECL adoption | | | — | | | — | | | — | | | — | | | 14,381 |
Charge-offs | |
| (270) | |
| (146) | |
| (588) | |
| (1,088) | |
| (1,199) |
Loans returning to accruing status | |
| — | |
| — | |
| — | |
| 8 | |
| — |
Ending Balance | | $ | 41,866 | | $ | 42,448 | | $ | 39,023 | | $ | 39,624 | | $ | 44,022 |
The following table shows the activity in foreclosed properties for the quarter ended (dollars in thousands):
|
| March 31, |
| December 31, |
| September 30, |
| June 30, |
| March 31, | |||||
| | 2021 | | 2020 | | 2020 | | 2020 | | 2020 | |||||
Beginning Balance | | $ | 2,773 | | $ | 4,159 | | $ | 4,397 | | $ | 4,444 | | $ | 4,708 |
Additions of foreclosed property | |
| — | |
| — | |
| — | |
| — | |
| 615 |
Valuation adjustments | |
| — | |
| (35) | |
| — | |
| — | |
| (44) |
Proceeds from sales | |
| (419) | |
| (1,357) | |
| (254) | |
| (55) | |
| (854) |
Gains (losses) from sales | |
| (10) | |
| 6 | |
| 16 | |
| 8 | |
| 19 |
Ending Balance | | $ | 2,344 | | $ | 2,773 | | $ | 4,159 | | $ | 4,397 | | $ | 4,444 |
(1) These are financial measures not calculated in accordance with GAAP. For a reconciliation of these non-GAAP financial measures, see Alternative Performance Measures (non-GAAP) section of the Key Financial Results.
Past Due Loans
Past due loans still accruing interest totaled $36.0 million or 0.25% of total loans held for investment at March 31, 2021, compared to $49.8 million or 0.36% of total loans held for investment at December 31, 2020, and $75.1 million or 0.59% of total loans held for investment at March 31, 2020. Excluding the impact of the PPP loans(1), past due loans still accruing interest were 0.28% of total adjusted loans held for investment at March 31, 2021, compared to 0.39% of total adjusted loans held for investment at December 31, 2020. Of the total past due loans still accruing interest, $9.8 million or 0.07% of total loans held for investment were loans past due 90 days or more at March 31, 2021, compared to $13.6 million or 0.10% of total loans held for investment at December 31, 2020, and $12.9 million or 0.10% of total loans held for investment at March 31, 2020.
Net Charge-offs
For the first quarter of 2021, net charge-offs were $1.2 million or 0.03% of total average loans on an annualized basis, compared to $1.8 million or 0.05% for the fourth quarter of 2020, and $5.0 million or 0.16% for the first quarter of 2020. Excluding the impact of the PPP loans(1), net charge-offs for the first quarter of 2021 were 0.04% of total adjusted average loans on an annualized basis, compared to 0.06% for the fourth quarter of 2020. The majority of net charge-offs in the first quarter of 2021 were related to the third-party consumer loan portfolio. The Company continues to hold the third-party consumer loan portfolio for investment but is not originating or acquiring any additional loans for this portfolio.
Provision for Credit Losses
The Company recorded a negative provision for credit losses of $13.6 million for the first quarter of 2021, which was approximately $189,000 smaller than the negative provision recorded in the previous quarter, and which decreased $73.8 million compared to the provision for credit losses of $60.2 million recorded during the same quarter in 2020. The provision for credit losses for the first quarter of 2021 reflected a negative provision of $16.4 million in provision for loan losses and $2.8 million in provision for unfunded commitments. The decrease in the provision for credit losses as compared to the same quarter in 2020 was driven by the benign credit impacts since the pandemic began, the significant recovery in the economy since last year as well as the improvement in the economic forecast utilized in estimating the ACL as of March 31, 2021.
Allowance for Credit Losses
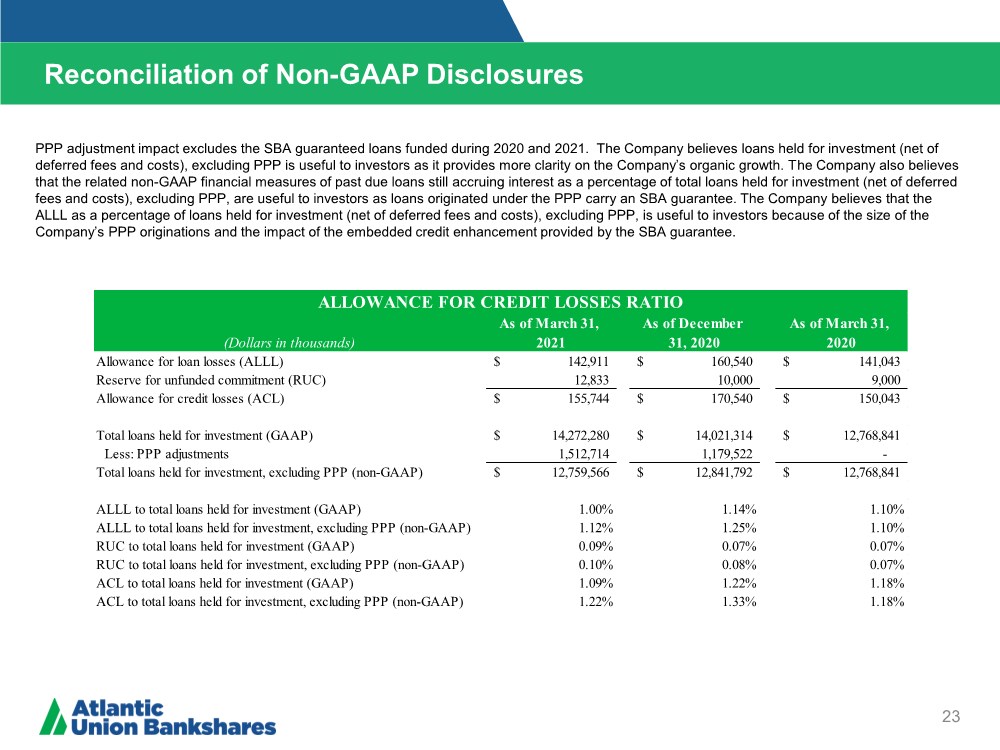
At March 31, 2021, the ACL was $155.7 million and included an allowance for loan and lease losses (“ALLL”) of $142.9 million and a reserve for unfunded commitments (“RUC”) of $12.8 million. The ACL at March 31, 2021 decreased $14.8 million from December 31, 2020, due to lower expected losses than previously estimated as a result of benign credit quality metrics to date and an improved economic outlook due to the roll-out of COVID-19 vaccines, as well as additional government stimulus inclusive of more PPP funding.
At March 31, 2021, the ALLL decreased $17.6 million and the RUC increased $2.8 million from December 31, 2020. The increase in the RUC was primarily due to increased funding assumptions on construction projects in the first quarter of 2021, attributable to less uncertainty related to COVID-19. The ALLL as a percentage of the total loan portfolio was 1.00% at March 31, 2021 and 1.14% at December 31, 2020. The ACL as percentage of total loans was 1.09% at March 31, 2021 and 1.22% at December 31, 2020. When excluding PPP loans(1), which are 100% guaranteed by the SBA, the ALLL as a percentage of total adjusted loans decreased 13 basis points from the prior quarter to 1.12% at March 31, 2021, and the ACL as a percentage of total adjusted loans at March 31, 2021 decreased 11 basis points to 1.22% from the prior quarter. The ratio of the ALLL to nonaccrual loans was 341.4% at March 31, 2021, compared to 378.2% at December 31, 2020.
NONINTEREST INCOME
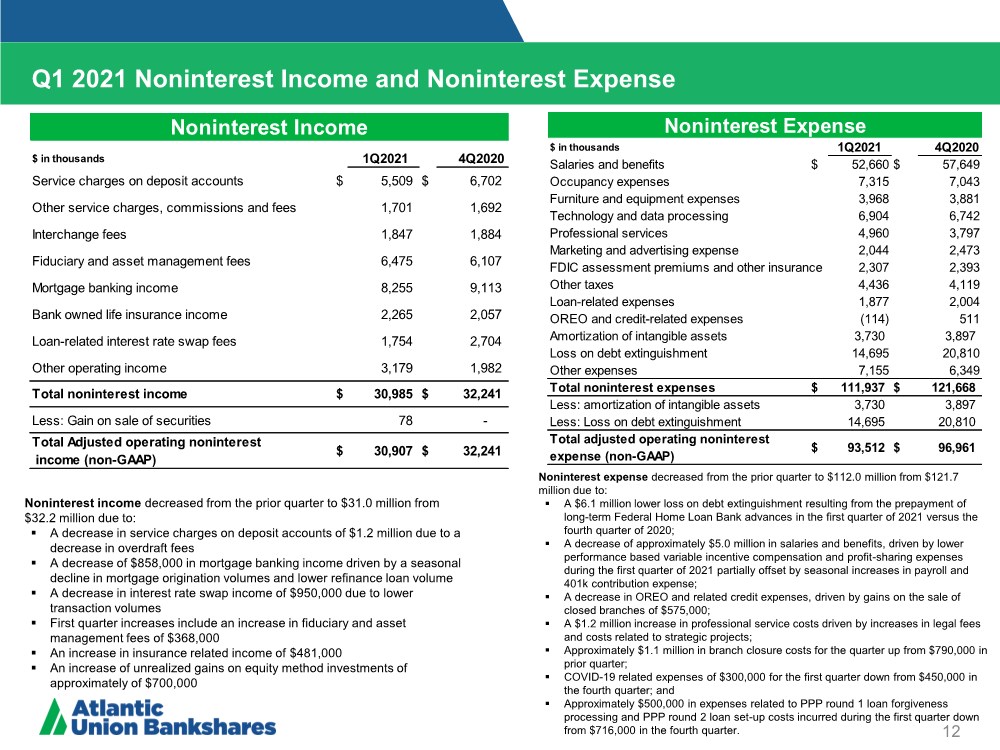
Noninterest income decreased $1.2 million to $31.0 million for the quarter ended March 31, 2021 from $32.2 million in the prior quarter, primarily driven by a $1.2 million decline in service charges on deposit accounts due to a decline in NSF and overdraft fees during the first quarter of 2021, a decrease in mortgage banking income of $858,000 driven by lower mortgage origination volumes, and lower loan-related interest rate swap income of $950,000 due to lower transaction volumes. These quarterly declines were partially offset by increases in several other non-interest income categories including an increase in fiduciary and asset management fees of $368,000, an increase in insurance related income of $481,000, and an increase in unrealized gains on equity method investments of approximately $700,000.
(1) These are financial measures not calculated in accordance with GAAP. For a reconciliation of these non-GAAP financial measures, see Alternative Performance Measures (non-GAAP) section of the Key Financial Results
NONINTEREST EXPENSE
Noninterest expense decreased $9.8 million to $111.9 million for the quarter ended March 31, 2021 from $121.7 million in the prior quarter. The decreases in non-interest expense related to the decline in debt extinguishment costs to $14.7 million during the quarter ended March 31, 2021, compared to $20.8 million in the prior quarter. In addition, noninterest expenses decreased by approximately $5.0 million in salaries and benefits, driven by lower performance based variable incentive compensation and profit-sharing expenses in the first quarter of 2021, partially offset by seasonal increases in payroll related taxes and 401(k) contribution expense. Also, OREO and related credit expenses declined from the fourth quarter of 2020 by approximately $625,000, primarily driven by gains of $575,000 on the sale of closed branches in the first quarter of 2021. These net reductions were offset by an increase of $1.2 million in professional services costs driven by an increase in legal fees and costs related to strategic projects. Noninterest expense for the first quarter of 2021 also included approximately $1.1 million in costs related to the Company’s closure of five branches in February 2021, approximately $300,000 in costs related to the Company’s response to the COVID-19 pandemic, and approximately $500,000 in expenses related to PPP loan forgiveness processing and PPP Round Two loan set-up costs incurred during the first quarter.
INCOME TAXES
The effective tax rate for the three months ended March 31, 2021 was 16.8%, compared to 15.1% for the three months ended December 31, 2020. The increase in the effective tax rate is primarily due to changes in the proportion of tax-exempt income to pre-tax income.
BALANCE SHEET
At March 31, 2021, total assets were $19.9 billion, an increase of $226.2 million or approximately 4.7% (annualized) from December 31, 2020, and an increase of $2.0 billion or approximately 11.2% from March 31, 2020. The increases in assets from both the prior quarter and prior year were primarily driven by growth in PPP loans, partially offset by PPP loan forgiveness, as well as net growth in the investment securities portfolio.
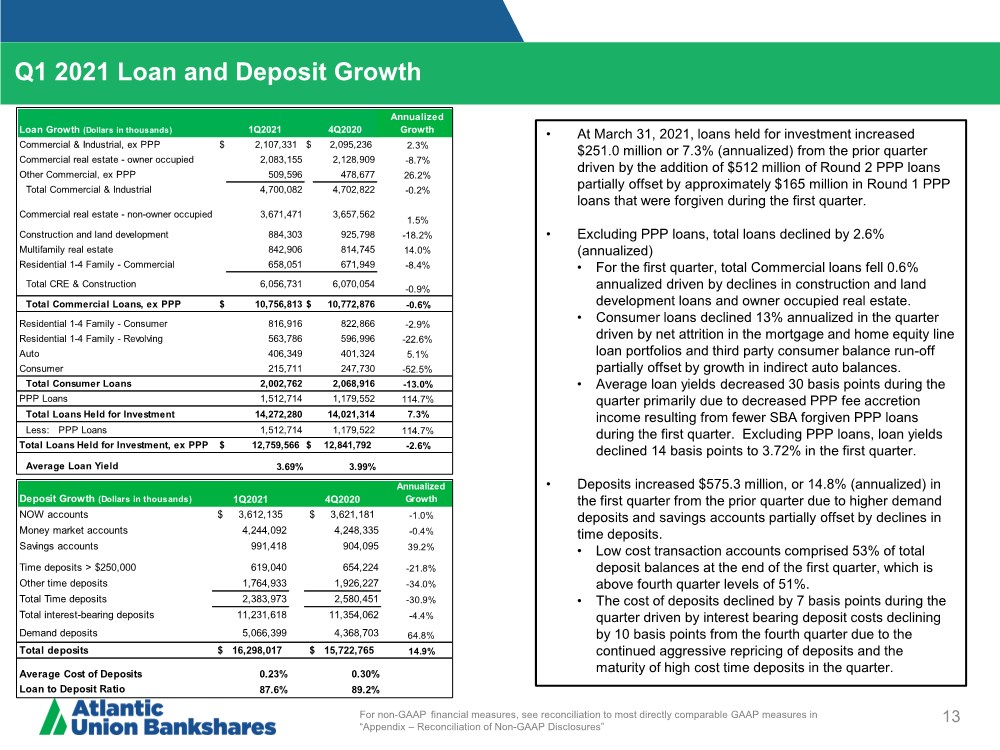
At March 31, 2021, loans held for investment (net of deferred fees and costs) were $14.3 billion, including $1.5 billion in PPP loans, an increase of $251.0 million or 7.3% (annualized) from December 31, 2020, while average loans decreased $124.5 million or 3.6% (annualized) from the prior quarter. Excluding the effects of the PPP(1), loans held for investment (net of deferred fees and costs) decreased $82.2 million, or 2.6% (annualized) from December 31, 2020 and average loans decreased $11.7 million, or 0.4% (annualized) from the prior quarter. Loans held for investment (net of deferred fees and costs) increased $1.5 billion or 11.8% from March 31, 2020, while quarterly average loans increased $1.5 billion or 11.7% from the same period in the prior year. Excluding the effects of the PPP(1), loans held for investment (net of deferred fees and costs) at March 31, 2021 decreased $9.3 million or 0.1% from the same period in the prior year, while quarterly average loans during the first quarter of 2021 increased $160.9 million or 1.3% from the same period in the prior year. In addition to an insignificant amount of PPP loan payoffs, the Company processed approximately $165.0 million of loan forgiveness on approximately 2,500 PPP loans during the first quarter of 2021, and funded $511.7 million in new PPP Round Two loans in the first quarter of 2021.
At March 31, 2021, total deposits were $16.3 billion, an increase of $575.3 million or approximately 14.8% (annualized) from December 31, 2020, while average deposits increased $178.5 million or 4.6% (annualized) from the prior quarter. Deposits increased $2.7 billion or 20.3% from March 31, 2020, while quarterly average deposits increased $2.7 billion or 20.4% from the prior year. The increases in deposits from both the prior quarter and the prior year were primarily due to the impact of PPP loan related deposits and government stimulus actions.
(1) These are financial measures not calculated in accordance with GAAP. For a reconciliation of these non-GAAP financial measures, see Alternative Performance Measures (non-GAAP) section of the Key Financial Results.
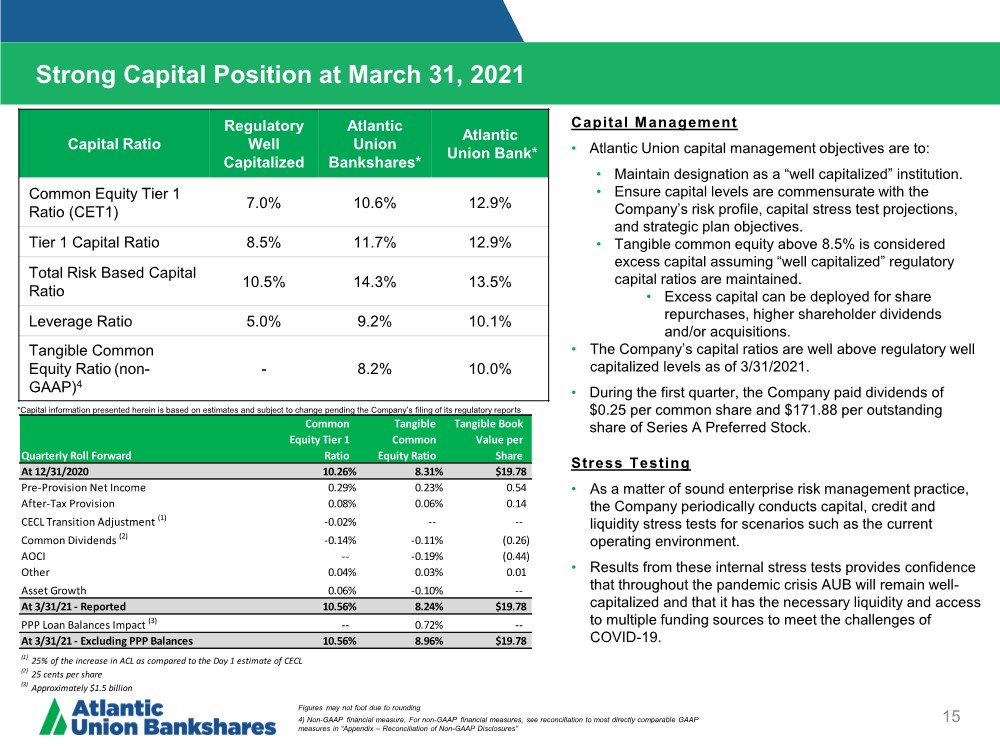
The following table shows the Company’s capital ratios at the quarters ended:
|
| March 31, |
| December 31, |
| March 31, |
|
| | 2021 | | 2020 | | 2020 |
|
Common equity Tier 1 capital ratio (2) |
| 10.56 | % | 10.26 | % | 9.74 | % |
Tier 1 capital ratio (2) |
| 11.70 | % | 11.39 | % | 9.74 | % |
Total capital ratio (2) |
| 14.25 | % | 14.00 | % | 12.37 | % |
Leverage ratio (Tier 1 capital to average assets) (2) |
| 9.18 | % | 8.95 | % | 8.44 | % |
Common equity to total assets |
| 12.81 | % | 12.95 | % | 13.59 | % |
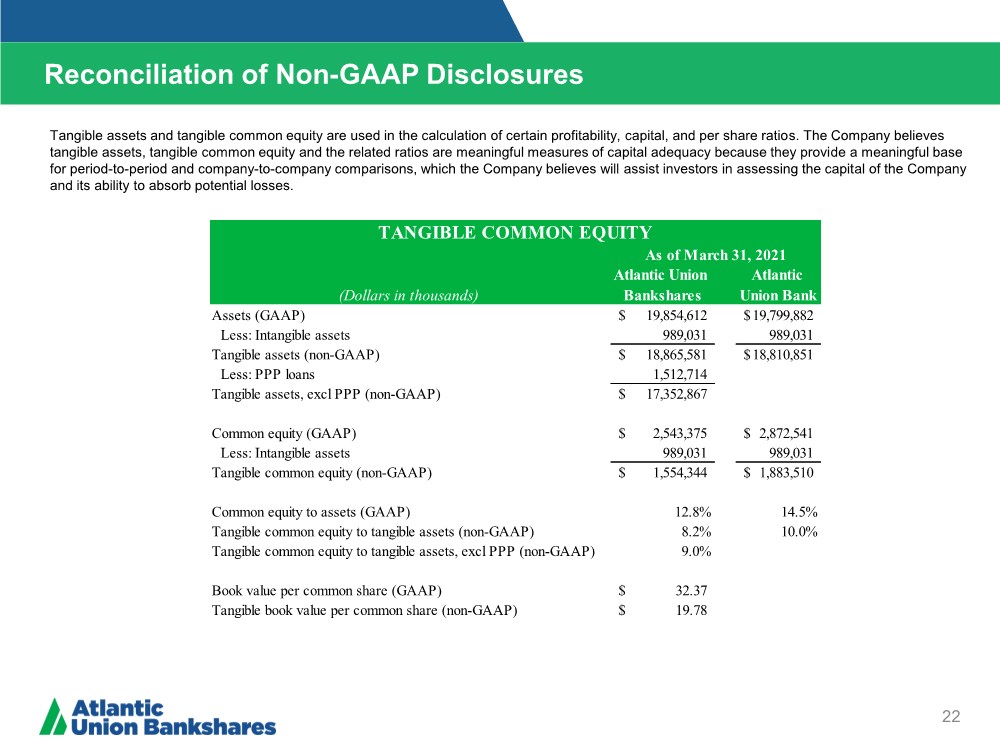
Tangible common equity to tangible assets (1) |
| 8.24 | % | 8.31 | % | 8.43 | % |
| (1) | These are financial measures not calculated in accordance with GAAP. For a reconciliation of these non-GAAP financial measures, see Alternative Performance Measures (non-GAAP) section of the Key Financial Results. |
| (2) | All ratios at March 31, 2021 are estimates and subject to change pending the Company’s filing of its FR Y9-C. All other periods are presented as filed. |
On June 9, 2020, the Company issued and sold 6,900,000 depositary shares, each representing a 1/400th ownership interest in a share of the Company’s 6.875% Perpetual Non-Cumulative Preferred Stock, Series A (“Series A Preferred Stock”), par value $10.00 per share of Series A Preferred Stock with a liquidation preference of $10,000 per share of Series A Preferred Stock. The net proceeds received from the issuance of the Series A Preferred Stock was approximately $166.4 million after deducting the underwriting discount and other offering expenses payable by the Company. The Series A Preferred Stock is included in Tier 1 capital.
During the first quarter of 2021, the Company declared and paid cash dividends of $0.25 per common share, consistent with the fourth quarter of 2020 and the first quarter of 2020. During the first quarter of 2021, the Company also declared and paid a quarterly dividend on the outstanding shares of Series A Preferred Stock of $171.88 per share (equivalent to $0.43 per outstanding depositary share).
On July 10, 2019, the Company announced that its Board of Directors had authorized a share repurchase program (effective July 8, 2019) to purchase up to $150.0 million of the Company’s common stock through June 30, 2021 in open market transactions or privately negotiated transactions. On March 20, 2020, the Company suspended its share repurchase program, which had $20.0 million remaining in the authorization when it was suspended. The Company repurchased an aggregate of approximately 3.7 million shares, at an average price of $35.48, per share under the authorization prior to the suspension.
(1) These are financial measures not calculated in accordance with GAAP. For a reconciliation of these non-GAAP financial measures, see Alternative Performance Measures (non-GAAP) section of the Key Financial Results.
ABOUT ATLANTIC UNION BANKSHARES CORPORATION
Headquartered in Richmond, Virginia, Atlantic Union Bankshares Corporation (Nasdaq: AUB) is the holding company for Atlantic Union Bank. Atlantic Union Bank has 129 branches and approximately 150 ATMs located throughout Virginia, and in portions of Maryland and North Carolina. Atlantic Union Bank Wealth Management is a brand name used by Atlantic Union Bank and certain affiliates when providing trust, wealth management, private banking, and investment advisory products and services. Certain non-bank affiliates of Atlantic Union Bank include: Old Dominion Capital Management, Inc., and its subsidiary, Outfitter Advisors, Ltd., and Dixon, Hubard, Feinour, & Brown, Inc., which provide investment advisory services; Atlantic Union Financial Consultants, LLC, which provides brokerage services; and Union Insurance Group, LLC, which offers various lines of insurance products.
FIRST QUARTER 2021 EARNINGS RELEASE CONFERENCE CALL
The Company will hold a conference call and webcast for analysts on Thursday, April 22, 2021 at 9:00 a.m. Eastern Time during which management will review the first quarter 2021 financial results and provide an update on recent activities. Interested parties may participate in the call toll-free by dialing (866) 220-4170; international callers wishing to participate may do so by dialing (864) 663-5235. The conference ID number is 6781658. Management will conduct a listen-only webcast with accompanying slides, which can be found at: https://edge.media-server.com/mmc/p/qh5352v7.
A replay of the webcast, and the accompanying slides, will be available on the Company’s website for 90 days at: https://investors.atlanticunionbank.com/.
NON-GAAP FINANCIAL MEASURES
In reporting the results of the quarter ended March 31, 2021, the Company has provided supplemental performance measures on a tax-equivalent, tangible, operating, adjusted or pre-tax pre-provision basis. These non-GAAP financial measures are a supplement to GAAP, which is used to prepare the Company’s financial statements, and should not be considered in isolation or as a substitute for comparable measures calculated in accordance with GAAP. In addition, the Company’s non-GAAP financial measures may not be comparable to non-GAAP financial measures of other companies. The Company uses the non-GAAP financial measures discussed herein in its analysis of the Company’s performance. The Company’s management believes that these non-GAAP financial measures provide additional understanding of ongoing operations, enhance comparability of results of operations with prior periods and show the effects of significant gains and charges in the periods presented without the impact of items or events that may obscure trends in the Company’s underlying performance. For a reconciliation of these measures to their most directly comparable GAAP measures and additional information about these non-GAAP financial measures, see Alternative Performance Measures (non-GAAP) section of the Key Financial Results.
FORWARD-LOOKING STATEMENTS
Certain statements in this press release may constitute “forward-looking statements” within the meaning of the Private Securities Litigation Reform Act of 1995. Forward-looking statements, including without limitation, statements made in Mr. Asbury’s quotes are statements that include, projections, predictions, expectations, or beliefs about future events or results that are not statements of historical fact. Such forward-looking statements are based on various assumptions as of the time they are made, and are inherently subject to known and unknown risks, uncertainties, and other factors, some of which cannot be predicted or quantified, that may cause actual results, performance, or achievements to be materially different from those expressed or implied by such forward-looking statements. Forward-looking statements are often accompanied by words that convey projected future events or outcomes such as “expect,” “believe,” “estimate,” “plan,” “project,” “anticipate,” “intend,” “will,” “may,” “view,” “opportunity,” “potential,” or words of similar meaning or other statements concerning opinions or judgment of the Company and its management about future events. Although the Company believes that its expectations with respect to forward-looking statements are based upon reasonable assumptions within the bounds of its existing knowledge of its business and operations, there can be no assurance that actual results, performance, or achievements of, or trends affecting, the Company will not differ materially from any projected future results, performance, or achievements expressed or implied by such forward-looking statements. Actual future results, performance, achievements or trends may differ materially from historical results or those anticipated depending on a variety of factors, including, but not limited to the effects of or changes in:
| ● | changes in interest rates; |
| ● | general economic and financial market conditions, in the United States generally and particularly in the markets in which the Company operates and which its loans are concentrated, including the effects of declines in real estate values, an increase in unemployment levels and slowdowns in economic growth, including as a result of COVID-19; |
| ● | the quality or composition of the loan or investment portfolios and changes therein; |
| ● | demand for loan products and financial services in the Company’s market area; |
| ● | the Company’s ability to manage its growth or implement its growth strategy; |
| ● | the effectiveness of expense reduction plans; |
| ● | the introduction of new lines of business or new products and services; |
| ● | the Company’s ability to recruit and retain key employees; |
| ● | the incremental cost and/or decreased revenues associated with exceeding $10 billion in assets; |
| ● | real estate values in the Bank’s lending area; |
| ● | an insufficient ACL; |
| ● | changes in accounting principles; |
| ● | the Company’s liquidity and capital positions; |
| ● | concentrations of loans secured by real estate, particularly commercial real estate; |
| ● | the effectiveness of the Company’s credit processes and management of the Company’s credit risk; |
| ● | the Company’s ability to compete in the market for financial services and increased competition from fintech companies; |
| ● | technological risks and developments, and cyber threats, attacks, or events; |
| ● | the potential adverse effects of unusual and infrequently occurring events, such as weather-related disasters, terrorist acts or public health events (such as COVID-19), and of governmental and societal responses thereto; these potential adverse effects may include, without limitation, adverse effects on the ability of the Company's borrowers to satisfy their obligations to the Company, on the value of collateral securing loans, on the demand for the Company's loans or its other products and services, on supply chains and methods used to distribute products and services, on incidents of cyberattack and fraud, on the Company’s liquidity or capital positions, on risks posed by reliance on third-party service providers, on other aspects of the Company's business operations and on financial markets and economic growth; |
| ● | the effect of steps the Company takes in response to COVID-19, the severity and duration of the pandemic, the uncertainty regarding new variants of COVID-19 that have emerged, the speed and efficacy of vaccine and treatment developments, the impact of loosening or tightening of government restrictions, the pace of recovery when the pandemic subsides and the heightened impact it has on many of the risks described herein; |
| ● | the discontinuation of LIBOR and its impact on the financial markets, and the Company’s ability to manage operational, legal and compliance risks related to the discontinuation of LIBOR and implementation of one or more alternate reference rates, |
| ● | performance by the Company’s counterparties or vendors; |
| ● | deposit flows; |
| ● | the availability of financing and the terms thereof; |
| ● | the level of prepayments on loans and mortgage-backed securities; |
| ● | legislative or regulatory changes and requirements, including the impact of the CARES Act, as amended by the CAA, and other legislative and regulatory reactions to COVID-19; |
| ● | potential claims, damages, and fines related to litigation or government actions, including litigation or actions arising from the Company’s participation in and administration of programs related to COVID-19, including, among other things, the CARES Act, as amended by the CAA; |
| ● | the effects of changes in federal, state or local tax laws and regulations; |
| ● | monetary and fiscal policies of the U.S. government, including policies of the U.S. Department of the Treasury and the Federal Reserve; |
| ● | changes to applicable accounting principles and guidelines; and |
| ● | other factors, many of which are beyond the control of the Company. |
Please refer to the “Risk Factors” and “Management’s Discussion and Analysis of Financial Condition and Results of Operations” sections of the Company’s Annual Report on Form 10-K for the year ended December 31, 2020 and related disclosures in other filings, which have been filed with the SEC and are available on the SEC’s website at www.sec.gov. All of the forward-looking statements made in this press release are expressly qualified by the cautionary statements contained or referred to herein. The actual results or developments anticipated may not be realized or, even if substantially realized, they may not have the expected consequences to or effects on the Company or its businesses or operations. Readers are cautioned not to rely too heavily on the forward-looking statements contained in this press release. Forward-looking statements speak only as of the date they are made and the Company does not undertake any obligation to update, revise or clarify these forward-looking statements, whether as a result of new information, future events or otherwise.
ATLANTIC UNION BANKSHARES CORPORATION AND SUBSIDIARIES
KEY FINANCIAL RESULTS
(Dollars in thousands, except share data)
| | As of & For Three Months Ended |
| |||||||
|
| 03/31/21 |
| 12/31/20 |
| 03/31/20 |
| |||
Results of Operations | | (unaudited) | | (unaudited) | | (unaudited) |
| |||
Interest and dividend income | | $ | 147,673 | | $ | 161,847 | | $ | 171,325 | |
Interest expense | |
| 12,775 | |
| 16,243 | |
| 36,317 | |
Net interest income | |
| 134,898 | |
| 145,604 | |
| 135,008 | |
Provision for credit losses | |
| (13,624) | |
| (13,813) | |
| 60,196 | |
Net interest income after provision for credit losses | |
| 148,522 | |
| 159,417 | |
| 74,812 | |
Noninterest income | |
| 30,985 | |
| 32,241 | |
| 28,907 | |
Noninterest expenses | |
| 111,937 | |
| 121,668 | |
| 95,645 | |
Income before income taxes | |
| 67,570 | |
| 69,990 | |
| 8,074 | |
Income tax expense | |
| 11,381 | |
| 10,560 | |
| 985 | |
Net income | | | 56,189 | | | 59,430 | | | 7,089 | |
Dividends on preferred stock | | | 2,967 | | | 2,967 | | | — | |
Net income available to common shareholders | | $ | 53,222 | | $ | 56,463 | | $ | 7,089 | |
| | | | | | | | | | |
Interest earned on earning assets (FTE) (1) | | $ | 150,726 | | $ | 164,931 | | $ | 174,083 | |
Net interest income (FTE) (1) | |
| 137,951 | |
| 148,688 | |
| 137,766 | |
Total revenue (FTE) (1) | | | 168,936 | | | 180,929 | | | 166,673 | |
Pre-tax pre-provision adjusted operating earnings (8) | | | 68,563 | | | 76,987 | | | 68,103 | |
| | | | | | | | | | |
Key Ratios | | | | | | | | | | |
Earnings per common share, diluted | | $ | 0.67 | | $ | 0.72 | | $ | 0.09 | |
Return on average assets (ROA) | |
| 1.16 | % |
| 1.19 | % |
| 0.16 | % |
Return on average equity (ROE) | |
| 8.38 | % |
| 8.82 | % |
| 1.15 | % |
Return on average tangible common equity (ROTCE) (2) (3) | |
| 14.58 | % |
| 15.60 | % |
| 2.87 | % |
Efficiency ratio | |
| 67.48 | % |
| 68.41 | % |
| 58.35 | % |
Net interest margin | |
| 3.09 | % |
| 3.25 | % |
| 3.49 | % |
Net interest margin (FTE) (1) | |
| 3.16 | % |
| 3.32 | % |
| 3.56 | % |
Yields on earning assets (FTE) (1) | |
| 3.46 | % |
| 3.69 | % |
| 4.50 | % |
Cost of interest-bearing liabilities | |
| 0.43 | % |
| 0.52 | % |
| 1.23 | % |
Cost of deposits | |
| 0.23 | % |
| 0.30 | % |
| 0.86 | % |
Cost of funds | |
| 0.30 | % |
| 0.37 | % |
| 0.94 | % |
| | | | | | | | | | |
Operating Measures (4) | | | | | | | | | | |
Adjusted operating earnings | | $ | 67,736 | | $ | 75,870 | | $ | 6,958 | |
Adjusted operating earnings available to common shareholders | | | 64,769 | | | 72,903 | | | 6,958 | |
Adjusted operating earnings per common share, diluted | | $ | 0.82 | | $ | 0.93 | | $ | 0.09 | |
Adjusted operating ROA | |
| 1.40 | % |
| 1.52 | % |
| 0.16 | % |
Adjusted operating ROE | |
| 10.10 | % |
| 11.27 | % |
| 1.13 | % |
Adjusted operating ROTCE (2) (3) | |
| 17.58 | % |
| 19.91 | % |
| 2.84 | % |
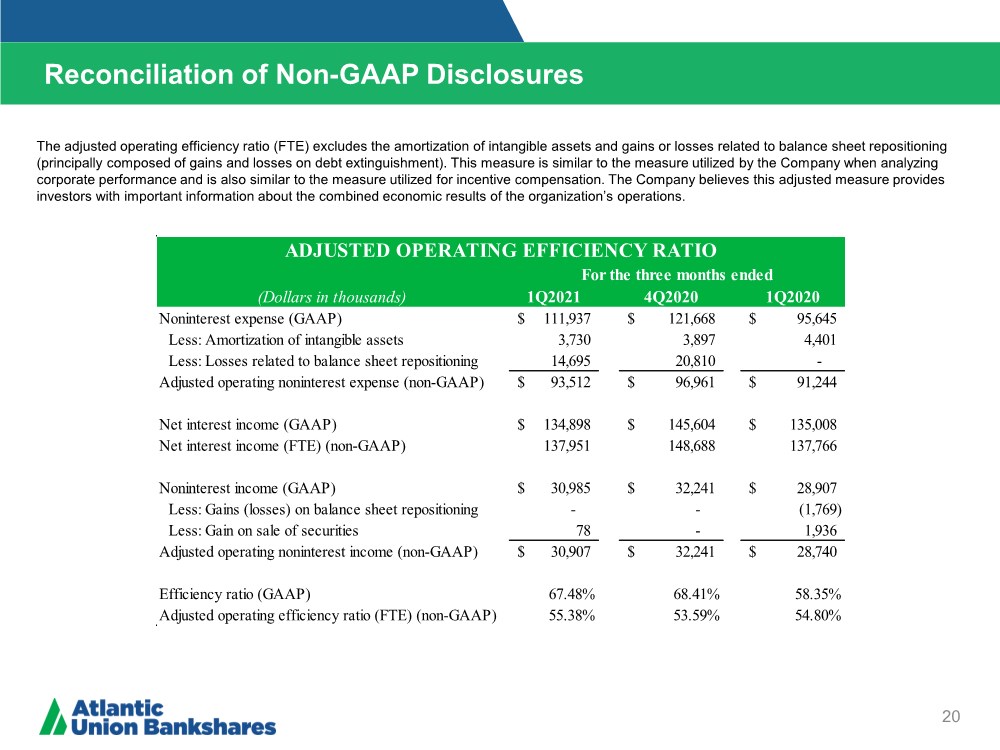
Adjusted operating efficiency ratio (FTE) (1)(7) | |
| 55.38 | % |
| 53.59 | % |
| 54.80 | % |
| | | | | | | | | | |
Per Share Data | | | | | | | | | | |
Earnings per common share, basic | | $ | 0.67 | | $ | 0.72 | | $ | 0.09 | |
Earnings per common share, diluted | |
| 0.67 | |
| 0.72 | |
| 0.09 | |
Cash dividends paid per common share | |
| 0.25 | |
| 0.25 | |
| 0.25 | |
Market value per share | |
| 38.36 | |
| 32.94 | |
| 21.90 | |
Book value per common share | |
| 32.37 | |
| 32.46 | |
| 30.99 | |
Tangible book value per common share (2) | |
| 19.78 | |
| 19.78 | |
| 18.15 | |
Price to earnings ratio, diluted | |
| 14.12 | |
| 11.50 | |
| 60.50 | |
Price to book value per common share ratio | |
| 1.19 | |
| 1.01 | |
| 0.71 | |
Price to tangible book value per common share ratio (2) | |
| 1.94 | |
| 1.67 | |
| 1.21 | |
Weighted average common shares outstanding, basic | |
| 78,863,468 | |
| 78,721,530 | |
| 79,290,352 | |
Weighted average common shares outstanding, diluted | |
| 78,884,235 | |
| 78,740,351 | |
| 79,317,382 | |
Common shares outstanding at end of period | |
| 79,006,331 | |
| 78,729,212 | |
| 78,710,448 | |
| | As of & For Three Months Ended |
| |||||||
|
| 03/31/21 |
| 12/31/20 |
| 03/31/20 |
| |||
Capital Ratios | | (unaudited) | | (unaudited) | | (unaudited) |
| |||
Common equity Tier 1 capital ratio (5) |
| | 10.56 | % | | 10.26 | % | | 9.74 | % |
Tier 1 capital ratio (5) |
| | 11.70 | % | | 11.39 | % | | 9.74 | % |
Total capital ratio (5) |
| | 14.25 | % | | 14.00 | % | | 12.37 | % |
Leverage ratio (Tier 1 capital to average assets) (5) |
| | 9.18 | % | | 8.95 | % | | 8.44 | % |
Common equity to total assets |
| | 12.81 | % | | 12.95 | % | | 13.59 | % |
Tangible common equity to tangible assets (2) |
| | 8.24 | % | | 8.31 | % | | 8.43 | % |
| | | | | | | | | | |
Financial Condition |
| |
|
| |
|
| |
| |
Assets | | $ | 19,854,612 | | $ | 19,628,449 | | $ | 17,847,376 | |
Loans held for investment, net | |
| 14,272,280 | |
| 14,021,314 | |
| 12,768,841 | |
Securities | |
| 3,317,442 | |
| 3,180,052 | |
| 2,655,306 | |
Earning Assets | |
| 17,889,174 | |
| 17,624,618 | |
| 15,813,780 | |
Goodwill | |
| 935,560 | |
| 935,560 | |
| 935,560 | |
Amortizable intangibles, net | |
| 53,471 | |
| 57,185 | |
| 69,298 | |
Deposits | |
| 16,298,017 | |
| 15,722,765 | |
| 13,553,035 | |
Borrowings | |
| 563,600 | |
| 840,717 | |
| 1,514,464 | |
Stockholders' equity | |
| 2,709,732 | |
| 2,708,490 | |
| 2,425,450 | |
Tangible common equity (2) | |
| 1,554,344 | |
| 1,549,388 | |
| 1,420,592 | |
| | | | | | | | | | |
Loans held for investment, net of deferred fees and costs | |
|
| |
|
| |
|
| |
Construction and land development | | $ | 884,303 | | $ | 925,798 | | $ | 1,318,252 | |
Commercial real estate - owner occupied | |
| 2,083,155 | |
| 2,128,909 | |
| 2,051,904 | |
Commercial real estate - non-owner occupied | |
| 3,671,471 | |
| 3,657,562 | |
| 3,328,012 | |
Multifamily real estate | |
| 842,906 | |
| 814,745 | |
| 679,390 | |
Commercial & Industrial | |
| 3,599,884 | |
| 3,263,460 | |
| 2,177,932 | |
Residential 1-4 Family - Commercial | |
| 658,051 | |
| 671,949 | |
| 721,800 | |
Residential 1-4 Family - Consumer | |
| 816,916 | |
| 822,866 | |
| 854,550 | |
Residential 1-4 Family - Revolving | |
| 563,786 | |
| 596,996 | |
| 652,135 | |
Auto | |
| 406,349 | |
| 401,324 | |
| 358,039 | |
Consumer | |
| 215,711 | |
| 247,730 | |
| 352,572 | |
Other Commercial | |
| 529,748 | |
| 489,975 | |
| 274,255 | |
Total loans held for investment | | $ | 14,272,280 | | $ | 14,021,314 | | $ | 12,768,841 | |
| | | | | | | | | | |
Deposits | |
|
| |
|
| |
|
| |
NOW accounts | | $ | 3,612,135 | | $ | 3,621,181 | | $ | 3,180,913 | |
Money market accounts | |
| 4,244,092 | |
| 4,248,335 | |
| 3,817,959 | |
Savings accounts | |
| 991,418 | |
| 904,095 | |
| 745,402 | |
Time deposits of $250,000 and over | |
| 619,040 | |
| 654,224 | |
| 696,520 | |
Other time deposits | | | 1,764,933 | | | 1,926,227 | | | 2,044,668 | |
Time deposits | |
| 2,383,973 | |
| 2,580,451 | |
| 2,741,188 | |
Total interest-bearing deposits | | $ | 11,231,618 | | $ | 11,354,062 | | $ | 10,485,462 | |
Demand deposits | |
| 5,066,399 | |
| 4,368,703 | |
| 3,067,573 | |
Total deposits | | $ | 16,298,017 | | $ | 15,722,765 | | $ | 13,553,035 | |
| | | | | | | | | | |
Averages | |
|
| |
|
| |
|
| |
Assets | | $ | 19,686,854 | | $ | 19,817,318 | | $ | 17,559,921 | |
Loans held for investment, net | |
| 14,064,123 | |
| 14,188,661 | |
| 12,593,923 | |
Loans held for sale | |
| 63,022 | |
| 59,312 | |
| 50,721 | |
Securities | |
| 3,209,377 | |
| 3,140,243 | |
| 2,621,437 | |
Earning assets | |
| 17,692,095 | |
| 17,801,490 | |
| 15,563,670 | |
Deposits | |
| 16,074,650 | |
| 15,896,149 | |
| 13,346,857 | |
Time deposits | |
| 2,490,432 | |
| 2,571,639 | |
| 2,755,500 | |
Interest-bearing deposits | |
| 11,491,129 | |
| 11,482,105 | |
| 10,421,419 | |
Borrowings | |
| 574,678 | |
| 891,699 | |
| 1,442,525 | |
Interest-bearing liabilities | |
| 12,065,807 | |
| 12,373,804 | |
| 11,863,944 | |
Stockholders' equity | |
| 2,719,941 | |
| 2,679,170 | |
| 2,485,646 | |
Tangible common equity (2) | |
| 1,562,575 | |
| 1,518,223 | |
| 1,478,803 | |
| | As of & For Three Months Ended |
| |||||||
|
| 03/31/21 |
| 12/31/20 |
| 03/31/20 |
| |||
Asset Quality | | (unaudited) | | (unaudited) | | (unaudited) |
| |||
Allowance for Credit Losses (ACL) |
| |
|
| |
|
| |
| |
Beginning balance, Allowance for loan and lease losses (ALLL) | | $ | 160,540 | | $ | 174,122 | | $ | 42,294 | |
Add: Day 1 impact from adoption of CECL | | | — | | | — | | | 47,484 | |
Add: Recoveries | |
| 2,469 | |
| 1,617 | |
| 2,160 | |
Less: Charge-offs | |
| 3,641 | |
| 3,386 | |
| 7,151 | |
Add: Provision for loan losses | |
| (16,457) | |
| (11,813) | |
| 56,256 | |
Ending balance, ALLL | | $ | 142,911 | | $ | 160,540 | | $ | 141,043 | |
| | | | | | | | | | |
Beginning balance, Reserve for unfunded commitment (RUC) | | $ | 10,000 | | $ | 12,000 | | $ | 900 | |
Add: Day 1 impact from adoption of CECL | | | — | | | — | | | 4,160 | |
Add: Provision for unfunded commitments | | | 2,833 | | | (2,000) | | | 3,940 | |
Ending balance, RUC | | $ | 12,833 | | $ | 10,000 | | $ | 9,000 | |
Total ACL | | $ | 155,744 | | $ | 170,540 | | $ | 150,043 | |
| | | | | | | | | | |
ACL / total outstanding loans | | | 1.09 | % | | 1.22 | % | | 1.18 | % |
ACL / total adjusted loans(9) | | | 1.22 | % | | 1.33 | % | | 1.18 | % |
ALLL / total outstanding loans | |
| 1.00 | % |
| 1.14 | % |
| 1.10 | % |
ALLL / total adjusted loans(9) | | | 1.12 | % | | 1.25 | % | | 1.10 | % |
Net charge-offs / total average loans | |
| 0.03 | % |
| 0.05 | % |
| 0.16 | % |
Net charge-offs / total adjusted average loans(9) | | | 0.04 | % | | 0.06 | % | | 0.16 | % |
Provision for loan losses/ total average loans | |
| (0.47) | % |
| (0.33) | % |
| 1.80 | % |
Provision for loan losses/ total adjusted average loans(9) | | | (0.52) | % | | (0.37) | % | | 1.80 | % |
| ` | | | | | | | | | |
Nonperforming Assets(6) | |
|
| |
|
| |
|
| |
Construction and land development | | $ | 2,637 | | $ | 3,072 | | $ | 3,234 | |
Commercial real estate - owner occupied | |
| 7,016 | |
| 7,128 | |
| 11,250 | |
Commercial real estate - non-owner occupied | |
| 1,958 | |
| 2,317 | |
| 1,642 | |
Multifamily real estate | | | — | | | 33 | | | 53 | |
Commercial & Industrial | |
| 2,023 | |
| 2,107 | |
| 3,431 | |
Residential 1-4 Family - Commercial | |
| 9,190 | |
| 9,993 | |
| 7,040 | |
Residential 1-4 Family - Consumer | |
| 14,770 | |
| 12,600 | |
| 13,088 | |
Residential 1-4 Family - Revolving | |
| 3,853 | |
| 4,629 | |
| 3,547 | |
Auto | |
| 303 | |
| 500 | |
| 550 | |
Consumer | | | 116 | | | 69 | | | 91 | |
Other Commercial | | | — | | | — | | | 96 | |
Nonaccrual loans | | $ | 41,866 | | $ | 42,448 | | $ | 44,022 | |
Foreclosed property | |
| 2,344 | |
| 2,773 | |
| 4,444 | |
Total nonperforming assets (NPAs) | | $ | 44,210 | | $ | 45,221 | | $ | 48,466 | |
Construction and land development | | $ | 189 | | $ | — | | $ | 317 | |
Commercial real estate - owner occupied | |
| 3,180 | |
| 3,727 | |
| 1,690 | |
Commercial real estate - non-owner occupied | | | 817 | | | 148 | | | 2,037 | |
Multifamily real estate | | | — | | | — | | | 377 | |
Commercial & Industrial | |
| 654 | |
| 1,114 | |
| 517 | |
Residential 1-4 Family - Commercial | |
| 576 | |
| 1,560 | |
| 777 | |
Residential 1-4 Family - Consumer | |
| 3,041 | |
| 5,699 | |
| 4,407 | |
Residential 1-4 Family - Revolving | |
| 917 | |
| 826 | |
| 2,005 | |
Auto | |
| 154 | |
| 166 | |
| 127 | |
Consumer | |
| 248 | |
| 394 | |
| 622 | |
Loans ≥ 90 days and still accruing | | $ | 9,776 | | $ | 13,634 | | $ | 12,876 | |
Total NPAs and loans ≥ 90 days | | $ | 53,986 | | $ | 58,855 | | $ | 61,342 | |
NPAs / total outstanding loans | | | 0.31 | % |
| 0.32 | % |
| 0.38 | % |
NPAs / total adjusted loans(9) | | | 0.35 | % | | 0.35 | % | | 0.38 | % |
NPAs / total assets | |
| 0.22 | % |
| 0.23 | % |
| 0.27 | % |
ALLL / nonaccrual loans | |
| 341.35 | % |
| 378.20 | % |
| 320.39 | % |
ALLL/ nonperforming assets | |
| 323.25 | % |
| 355.01 | % |
| 291.01 | % |
| |
|
| |
|
| |
|
| |
| | As of & For Three Months Ended |
| |||||||
|
| 03/31/21 |
| 12/31/20 |
| 03/31/20 |
| |||
Past Due Detail(6) | | (unaudited) | | (unaudited) | | (unaudited) |
| |||
Construction and land development | | $ | 865 | | $ | 1,903 | | $ | 2,786 | |
Commercial real estate - owner occupied | |
| 3,426 | |
| 1,870 | |
| 10,779 | |
Commercial real estate - non-owner occupied | |
| 1,055 | |
| 2,144 | |
| 2,087 | |
Multifamily real estate | |
| 187 | |
| 617 | |
| 623 | |
Commercial & Industrial | |
| 3,086 | |
| 1,848 | |
| 4,893 | |
Residential 1-4 Family - Commercial | |
| 1,803 | |
| 2,227 | |
| 4,145 | |
Residential 1-4 Family - Consumer | |
| 6,831 | |
| 10,182 | |
| 15,667 | |
Residential 1-4 Family - Revolving | |
| 1,397 | |
| 2,975 | |
| 4,308 | |
Auto | |
| 1,035 | |
| 2,076 | |
| 1,967 | |
Consumer | | | 595 | | | 1,166 | | | 1,612 | |
Other Commercial | | | 407 | | | 16 | | | 1 | |
Loans 30-59 days past due | | $ | 20,687 | | $ | 27,024 | | $ | 48,868 | |
Construction and land development | | $ | 473 | | $ | 547 | | $ | 316 | |
Commercial real estate - owner occupied | |
| 514 | |
| 1,380 | |
| 1,444 | |
Commercial real estate - non-owner occupied | |
| 1,413 | |
| 1,721 | |
| 2,765 | |
Multifamily real estate | | | 81 | | | — | | | 1,994 | |
Commercial & Industrial | |
| 613 | |
| 1,190 | |
| 1,218 | |
Residential 1-4 Family - Commercial | |
| 798 | |
| 818 | |
| 1,066 | |
Residential 1-4 Family - Consumer | |
| 808 | |
| 1,533 | |
| 570 | |
Residential 1-4 Family - Revolving | |
| 284 | |
| 1,044 | |
| 1,286 | |
Auto | |
| 165 | |
| 376 | |
| 311 | |
Consumer | | | 314 | | | 550 | | | 1,294 | |
Other Commercial | | | 88 | | | — | | | 1,068 | |
Loans 60-89 days past due | | $ | 5,551 | | $ | 9,159 | | $ | 13,332 | |
| | | | | | | | | | |
Past Due and still accruing | | $ | 36,014 | | $ | 49,817 | | $ | 75,076 | |
Past Due and still accruing / total loans | | | 0.25 | % | | 0.36 | % | | 0.59 | % |
Past Due and still accruing / total adjusted loans(9) | | | 0.28 | % | | 0.39 | % | | 0.59 | % |
| | | | | | | | | | |
Troubled Debt Restructurings | |
|
| |
|
| |
|
| |
Performing | | $ | 13,670 | | $ | 13,961 | | $ | 14,865 | |
Nonperforming | |
| 6,058 | |
| 6,655 | |
| 5,491 | |
Total troubled debt restructurings | | $ | 19,728 | | $ | 20,616 | | $ | 20,356 | |
| | | | | | | | | | |
Alternative Performance Measures (non-GAAP) | |
|
| |
|
| |
|
| |
Net interest income (FTE) (1) | |
|
| |
|
| |
|
| |
Net interest income (GAAP) | | $ | 134,898 | | $ | 145,604 | | $ | 135,008 | |
FTE adjustment | |
| 3,053 | |
| 3,084 | |
| 2,758 | |
Net interest income (FTE) (non-GAAP) | | $ | 137,951 | | $ | 148,688 | | $ | 137,766 | |
Noninterest income (GAAP) | | | 30,985 | | | 32,241 | | | 28,907 | |
Total revenue (FTE) (non-GAAP) | | $ | 168,936 | | $ | 180,929 | | $ | 166,673 | |
| | | | | | | | | | |
Average earning assets | | $ | 17,692,095 | | $ | 17,801,490 | | $ | 15,563,670 | |
Net interest margin | |
| 3.09 | % |
| 3.25 | % |
| 3.49 | % |
Net interest margin (FTE) | |
| 3.16 | % |
| 3.32 | % |
| 3.56 | % |
| | | | | | | | | | |
Tangible Assets (2) | |
|
| |
|
| |
|
| |
Ending assets (GAAP) | | $ | 19,854,612 | | $ | 19,628,449 | | $ | 17,847,376 | |
Less: Ending goodwill | |
| 935,560 | |
| 935,560 | |
| 935,560 | |
Less: Ending amortizable intangibles | |
| 53,471 | |
| 57,185 | |
| 69,298 | |
Ending tangible assets (non-GAAP) | | $ | 18,865,581 | | $ | 18,635,704 | | $ | 16,842,518 | |
| | | | | | | | | | |
Tangible Common Equity (2) | |
|
| |
|
| |
|
| |
Ending equity (GAAP) | | $ | 2,709,732 | | $ | 2,708,490 | | $ | 2,425,450 | |
Less: Ending goodwill | |
| 935,560 | |
| 935,560 | |
| 935,560 | |
Less: Ending amortizable intangibles | |
| 53,471 | |
| 57,185 | |
| 69,298 | |
Less: Perpetual preferred stock | | | 166,357 | | | 166,357 | | | - | |
Ending tangible common equity (non-GAAP) | | $ | 1,554,344 | | $ | 1,549,388 | | $ | 1,420,592 | |
| | | | | | | | | | |
Average equity (GAAP) | | $ | 2,719,941 | | $ | 2,679,170 | | $ | 2,485,646 | |
Less: Average goodwill | |
| 935,560 | |
| 935,560 | |
| 935,560 | |
Less: Average amortizable intangibles | |
| 55,450 | |
| 59,031 | |
| 71,283 | |
Less: Average perpetual preferred stock | | | 166,356 | | | 166,356 | | | - | |
Average tangible common equity (non-GAAP) | | $ | 1,562,575 | | $ | 1,518,223 | | $ | 1,478,803 | |
| | | | | | | | | | |
ROTCE (2)(3) | | | | | | | | | | |
Net income available to common shareholders (GAAP) | | $ | 53,222 | | $ | 56,463 | | $ | 7,089 | |
Plus: Amortization of intangibles, tax effected | | | 2,947 | | | 3,079 | | | 3,477 | |
Net income available to common shareholders before amortization of intangibles (non-GAAP) | | $ | 56,169 | | $ | 59,542 | | $ | 10,566 | |
| | | | | | | | | | |
Return on average tangible common equity (ROTCE) (2) (3) | | | 14.58 | % | | 15.60 | % | | 2.87 | % |
| | As of & For Three Months Ended |
| |||||||
|
| 03/31/21 |
| 12/31/20 |
| 03/31/20 |
| |||
| | (unaudited) | | (unaudited) | | (unaudited) |
| |||
Operating Measures (4) | |
|
| |
|
| |
|
| |
Net income (GAAP) | | $ | 56,189 | | $ | 59,430 | | $ | 7,089 | |
Plus: Net loss related to balance sheet repositioning, net of tax | | | 11,609 | | | 16,440 | | | 1,398 | |
Less: Gain on sale of securities, net of tax | | | 62 | | | — | | | 1,529 | |
Adjusted operating earnings (non-GAAP) | | | 67,736 | | | 75,870 | | | 6,958 | |
Less: Dividends on preferred stock | | | 2,967 | | | 2,967 | | | — | |
Adjusted operating earnings available to common shareholders (non-GAAP) | | $ | 64,769 | | $ | 72,903 | | $ | 6,958 | |
| | | | | | | | | | |
Noninterest expense (GAAP) | | $ | 111,937 | | $ | 121,668 | | $ | 95,645 | |
Less: Amortization of intangible assets | |
| 3,730 | |
| 3,897 | |
| 4,401 | |
Less: Losses related to balance sheet repositioning | | | 14,695 | | | 20,810 | | | — | |
Adjusted operating noninterest expense (non-GAAP) | | $ | 93,512 | | $ | 96,961 | | $ | 91,244 | |
| | | | | | | | | | |
Noninterest income (GAAP) | | $ | 30,985 | | $ | 32,241 | | $ | 28,907 | |
Less: Gains (losses) related to balance sheet repositioning | | | — | | | — | | | (1,769) | |
Less: Gain on sale of securities | | | 78 | | | — | | | 1,936 | |
Adjusted operating noninterest income (non-GAAP) | | $ | 30,907 | | $ | 32,241 | | $ | 28,740 | |
| | | | | | | | | | |
Net interest income (FTE) (non-GAAP) (1) | | $ | 137,951 | | $ | 148,688 | | $ | 137,766 | |
Adjusted operating noninterest income (non-GAAP) | |
| 30,907 | |
| 32,241 | |
| 28,740 | |
Total adjusted revenue (FTE) (non-GAAP) (1) | | $ | 168,858 | | $ | 180,929 | | $ | 166,506 | |
| | | | | | | | | | |
Efficiency ratio | |
| 67.48 | % |
| 68.41 | % |
| 58.35 | % |
Adjusted operating efficiency ratio (FTE) (1)(7) | |
| 55.38 | % |
| 53.59 | % |
| 54.80 | % |
| | | | | | | | | | |
Operating ROTCE (2)(3)(4) | |
|
| |
|
| |
|
| |
Adjusted operating earnings available to common shareholders (non-GAAP) | | $ | 64,769 | | $ | 72,903 | | $ | 6,958 | |
Plus: Amortization of intangibles, tax effected | |
| 2,947 | |
| 3,079 | |
| 3,477 | |
Adjusted operating earnings available to common shareholders before amortization of intangibles (non-GAAP) | | $ | 67,716 | | $ | 75,982 | | $ | 10,435 | |
| | | | | | | | | | |
Average tangible common equity (non-GAAP) | | $ | 1,562,575 | | $ | 1,518,223 | | $ | 1,478,803 | |
Adjusted operating return on average tangible common equity (non-GAAP) | |
| 17.58 | % |
| 19.91 | % |
| 2.84 | % |
| | | | | | | | | | |
Pre-tax pre-provision adjusted operating earnings (8) | | | | | | | | | | |
Net income (GAAP) | | $ | 56,189 | | $ | 59,430 | | $ | 7,089 | |
Plus: Provision for credit losses | | | (13,624) | | | (13,813) | | | 60,196 | |
Plus: Income tax expense | | | 11,381 | | | 10,560 | | | 985 | |
Plus: Net loss related to balance sheet repositioning | | | 14,695 | | | 20,810 | | | 1,769 | |
Less: Gain on sale of securities | | | 78 | | | — | | | 1,936 | |
Pre-tax pre-provision adjusted operating earnings (non-GAAP) | | $ | 68,563 | | $ | 76,987 | | $ | 68,103 | |
| | | | | | | | | | |
Weighted average common shares outstanding, diluted | | | 78,884,235 | | | 78,740,351 | | | 79,317,382 | |
Pre-tax pre-provision earnings per share, diluted | | $ | 0.87 | | $ | 0.98 | | $ | 0.86 | |
| | | | | | | | | | |
Paycheck Protection Program adjustment impact (9) | | | | | | | | | | |
Loans held for investment (net of deferred fees and costs)(GAAP) | | $ | 14,272,280 | | $ | 14,021,314 | | $ | 12,768,841 | |
Less: PPP adjustments (net of deferred fees and costs) | | | 1,512,714 | | | 1,179,522 | | | — | |
Loans held for investment (net of deferred fees and costs),net adjustments, excluding PPP (non-GAAP) | | $ | 12,759,566 | | $ | 12,841,792 | | $ | 12,768,841 | |
| | | | | | | | | | |
Average loans held for investment (net of deferred fees and costs)(GAAP) | | $ | 14,064,123 | | $ | 14,188,661 | | $ | 12,593,923 | |
Less: Average PPP adjustments (net of deferred fees and costs) | | | 1,309,326 | | | 1,445,602 | | | — | |
Average loans held for investment, net adjustments, excluding PPP (net of deferred fees and costs)(non-GAAP) | | $ | 12,754,797 | | $ | 12,743,059 | | $ | 12,593,923 | |
| | As of & For Three Months Ended |
| |||||||
|
| 03/31/21 |
| 12/31/20 |
| 03/31/20 |
| |||
| | (unaudited) | | (unaudited) | | (unaudited) |
| |||
Mortgage Origination Held for Sale Volume | |
|
| |
|
| |
|
| |
Refinance Volume | | $ | 157,312 | | $ | 204,576 | | $ | 68,382 | |
Construction Volume | |
| 13,248 | |
| 12,719 | |
| 7,837 | |
Purchase Volume | |
| 89,392 | |
| 112,873 | |
| 64,492 | |
Total Mortgage loan originations held for sale | | $ | 259,952 | | $ | 330,168 | | $ | 140,711 | |
% of originations that are refinances | |
| 60.5 | % |
| 62.0 | % |
| 48.6 | % |
| | | | | | | | | | |
Wealth | |
|
| |
|
| |
|
| |
Assets under management ("AUM") | | $ | 6,056,475 | | $ | 5,865,264 | | $ | 4,783,228 | |
| | | | | | | | | | |
Other Data | |
|
| |
|
| |
|
| |
End of period full-time employees | |
| 1,869 | |
| 1,879 | |
| 2,011 | |
Number of full-service branches | |
| 129 | |
| 134 | |
| 149 | |
Number of full automatic transaction machines ("ATMs") | |
| 153 | |
| 156 | |
| 169 | |
| (1) | These are non-GAAP financial measures. Net interest income (FTE) and total adjusted revenue (FTE), which are used in computing net interest margin (FTE) and adjusted operating efficiency ratio (FTE), respectively, provide valuable additional insight into the net interest margin and the efficiency ratio by adjusting for differences in tax treatment of interest income sources. The entire FTE adjustment is attributable to interest income on earning assets, which is used in computing yield on earning assets. Interest expense and the related cost of interest-bearing liabilities and cost of funds ratios are not affected by the FTE components. |
| (2) | These are non-GAAP financial measures. Tangible assets and tangible common equity are used in the calculation of certain profitability, capital, and per share ratios. The Company believes tangible assets, tangible common equity and the related ratios are meaningful measures of capital adequacy because they provide a meaningful base for period-to-period and company-to-company comparisons, which the Company believes will assist investors in assessing the capital of the Company and its ability to absorb potential losses. |
| (3) | These are non-GAAP financial measures. The Company believes that ROTCE is a meaningful supplement to GAAP financial measures and useful to investors because it measures the performance of a business consistently across time without regard to whether components of the business were acquired or developed internally. |
| (4) | These are non-GAAP financial measures. Adjusted operating measures exclude the gains or losses related to balance sheet repositioning (principally composed of gains and losses on debt extinguishment) and gains or losses on sale of securities. The Company believes these non-GAAP adjusted measures provide investors with important information about the combined economic results of the organization’s operations. |
| (5) | All ratios at March 31, 2021 are estimates and subject to change pending the Company’s filing of its FR Y9-C. All other periods are presented as filed. |
| (6) | These balances reflect the impact of the CARES Act and the Joint Guidance, which provides relief for TDR designations and also provides guidance on past due reporting for modified loans. |
| (7) | The adjusted operating efficiency ratio (FTE) excludes the amortization of intangible assets and gains or losses related to balance sheet repositioning (principally composed of gains and losses on debt extinguishment). This measure is similar to the measure utilized by the Company when analyzing corporate performance and is also similar to the measure utilized for incentive compensation. The Company believes this adjusted measure provides investors with important information about the combined economic results of the organization’s operations. |
| (8) | This is a non-GAAP financial measure. Pre-tax pre-provision adjusted earnings excludes the provision for credit losses, which can fluctuate significantly from period-to-period under the CECL methodology, income tax expense, gains or losses related to balance sheet repositioning (principally composed of gains and losses on debt extinguishment), and gains or losses on sale of securities. The Company believes this adjusted measure provides investors with important information about the combined economic results of the organization’s operations. |
| (9) | These are non-GAAP financial measures. PPP adjustment impact excludes the SBA guaranteed loans funded during 2020 and 2021. The Company believes loans held for investment (net of deferred fees and costs), excluding PPP is useful to investors as it provides more clarity on the Company’s organic growth. The Company also believes that the related non-GAAP financial measures of past due loans still accruing interest as a percentage of total loans held for investment (net of deferred fees and costs), excluding PPP, are useful to investors as loans originated under the PPP carry an SBA guarantee. The Company believes that the ALLL as a percentage of loans held for investment (net of deferred fees and costs), excluding PPP, is useful to investors because of the size of the Company’s PPP originations and the impact of the embedded credit enhancement provided by the SBA guarantee. |
ATLANTIC UNION BANKSHARES CORPORATION AND SUBSIDIARIES
CONSOLIDATED BALANCE SHEETS
(Dollars in thousands, except share data)
| March 31, | | December 31, | | March 31, | |||
| 2021 |
| 2020 |
| 2020 | |||
ASSETS | | (unaudited) | | | (audited) | | | (unaudited) |
Cash and cash equivalents: | | | | | | | | |
Cash and due from banks | $ | 155,972 | | $ | 172,307 | | $ | 197,521 |
Interest-bearing deposits in other banks | | 244,593 | | | 318,974 | | | 292,154 |
Federal funds sold | | 315 | | | 2,013 | | | 15,284 |
Total cash and cash equivalents | | 400,880 | | | 493,294 | | | 504,959 |
Securities available for sale, at fair value | | 2,697,043 | | | 2,540,419 | | | 1,972,903 |
Securities held to maturity, at carrying value | | 543,575 | | | 544,851 | | | 552,176 |
Restricted stock, at cost | | 76,824 | | | 94,782 | | | 130,227 |
Loans held for sale, at fair value | | 49,082 | | | 96,742 | | | 76,690 |
Loans held for investment, net of deferred fees and costs | | 14,272,280 | | | 14,021,314 | | | 12,768,841 |
Less allowance for loan and lease losses | | 142,911 | | | 160,540 | | | 141,043 |
Total loans held for investment, net | | 14,129,369 | | | 13,860,774 | | | 12,627,798 |
Premises and equipment, net | | 161,478 | | | 163,829 | | | 161,139 |
Goodwill | | 935,560 | | | 935,560 | | | 935,560 |
Amortizable intangibles, net | | 53,471 | | | 57,185 | | | 69,298 |
Bank owned life insurance | | 328,627 | | | 326,892 | | | 324,980 |
Other assets | | 478,703 | | | 514,121 | | | 491,646 |
Total assets | $ | 19,854,612 | | $ | 19,628,449 | | $ | 17,847,376 |
LIABILITIES | | | | | | | | |
Noninterest-bearing demand deposits | $ | 5,066,399 | | $ | 4,368,703 | | $ | 3,067,573 |
Interest-bearing deposits | | 11,231,618 | | | 11,354,062 | | | 10,485,462 |
Total deposits | | 16,298,017 | | | 15,722,765 | | | 13,553,035 |
Securities sold under agreements to repurchase | | 105,522 | | | 100,888 | | | 56,781 |
Other short-term borrowings | | 168,000 | | | 250,000 | | | 380,000 |
Long-term borrowings | | 290,078 | | | 489,829 | | | 1,077,683 |
Other liabilities | | 283,263 | | | 356,477 | | | 354,427 |
Total liabilities | | 17,144,880 | | | 16,919,959 | | | 15,421,926 |
Commitments and contingencies | | | | | | | | |
STOCKHOLDERS' EQUITY | | | | | | | | |
Preferred stock, $10.00 par value | | 173 | | | 173 | | | — |
Common stock, $1.33 par value | | 104,493 | | | 104,169 | | | 104,086 |
Additional paid-in capital | | 1,918,991 | | | 1,917,081 | | | 1,743,429 |
Retained earnings | | 649,574 | | | 616,052 | | | 529,606 |
Accumulated other comprehensive income (loss) | | 36,501 | | | 71,015 | | | 48,329 |
Total stockholders' equity | | 2,709,732 | | | 2,708,490 | | | 2,425,450 |
Total liabilities and stockholders' equity | $ | 19,854,612 | | $ | 19,628,449 | | $ | 17,847,376 |
| | | | | | | | |
Common shares outstanding | | 79,006,331 | | | 78,729,212 | | | 78,710,448 |
Common shares authorized | | 200,000,000 | | | 200,000,000 | | | 200,000,000 |
Preferred shares outstanding | | 17,250 | | | 17,250 | | | - |
Preferred shares authorized | | 500,000 | | | 500,000 | | | 500,000 |
ATLANTIC UNION BANKSHARES CORPORATION AND SUBSIDIARIES
CONSOLIDATED STATEMENTS OF INCOME
(Dollars in thousands, except share data)
| Three Months Ended | |||||||
| March 31, | | December 31, | | March 31, | |||
| 2021 |
| 2020 |
| 2020 | |||
| (Unaudited) | | (Unaudited) | | (Unaudited) | |||
Interest and dividend income: | | | | | | | | |
Interest and fees on loans | $ | 128,006 | | $ | 142,108 | | $ | 151,127 |
Interest on deposits in other banks | | 77 | | | 117 | | | 862 |
Interest and dividends on securities: | | | | | | | | |
Taxable | | 10,353 | | | 10,414 | | | 11,627 |
Nontaxable | | 9,237 | | | 9,208 | | | 7,709 |
Total interest and dividend income | | 147,673 | | | 161,847 | | | 171,325 |
Interest expense: | | | | | | | | |
Interest on deposits | | 9,128 | | | 12,000 | | | 28,513 |
Interest on short-term borrowings | | 48 | | | 93 | | | 1,340 |
Interest on long-term borrowings | | 3,599 | | | 4,150 | | | 6,464 |
Total interest expense | | 12,775 | | | 16,243 | | | 36,317 |
Net interest income | | 134,898 | | | 145,604 | | | 135,008 |
Provision for credit losses | | (13,624) | | | (13,813) | | | 60,196 |
Net interest income after provision for credit losses | | 148,522 | | | 159,417 | | | 74,812 |
Noninterest income: | | | | | | | | |
Service charges on deposit accounts | | 5,509 | | | 6,702 | | | 7,578 |
Other service charges, commissions and fees | | 1,701 | | | 1,692 | | | 1,624 |
Interchange fees | | 1,847 | | | 1,884 | | | 1,625 |
Fiduciary and asset management fees | | 6,475 | | | 6,107 | | | 5,984 |
Mortgage banking income | | 8,255 | | | 9,113 | | | 2,022 |
Gains on securities transactions | | 78 | | | — | | | 1,936 |
Bank owned life insurance income | | 2,265 | | | 2,057 | | | 2,049 |
Loan-related interest rate swap fees | | 1,754 | | | 2,704 | | | 3,948 |
Other operating income | | 3,101 | | | 1,982 | | | 2,141 |
Total noninterest income | | 30,985 | | | 32,241 | | | 28,907 |
Noninterest expenses: | | | | | | | | |
Salaries and benefits | | 52,660 | | | 57,649 | | | 50,117 |
Occupancy expenses | | 7,315 | | | 7,043 | | | 7,133 |
Furniture and equipment expenses | | 3,968 | | | 3,881 | | | 3,741 |
Technology and data processing | | 6,904 | | | 6,742 | | | 6,169 |
Professional services | | 4,960 | | | 3,797 | | | 3,307 |
Marketing and advertising expense | | 2,044 | | | 2,473 | | | 2,739 |
FDIC assessment premiums and other insurance | | 2,307 | | | 2,393 | | | 2,861 |
Other taxes | | 4,436 | | | 4,119 | | | 4,120 |
Loan-related expenses | | 1,877 | | | 2,004 | | | 2,697 |
OREO and credit-related expenses | | (114) | | | 511 | | | 688 |
Amortization of intangible assets | | 3,730 | | | 3,897 | | | 4,401 |
Loss on debt extinguishment | | 14,695 | | | 20,810 | | | — |
Other expenses | | 7,155 | | | 6,349 | | | 7,672 |
Total noninterest expenses | | 111,937 | | | 121,668 | | | 95,645 |
Income before income taxes | | 67,570 | | | 69,990 | | | 8,074 |
Income tax expense | | 11,381 | | | 10,560 | | | 985 |
Net income | $ | 56,189 | | $ | 59,430 | | $ | 7,089 |
Dividends on preferred stock | | 2,967 | | | 2,967 | | | — |
Net income available to common shareholders | $ | 53,222 | | $ | 56,463 | | $ | 7,089 |
| | | | | | | | |
Basic earnings per common share | $ | 0.67 | | $ | 0.72 | | $ | 0.09 |
Diluted earnings per common share | $ | 0.67 | | $ | 0.72 | | $ | 0.09 |
AVERAGE BALANCES, INCOME AND EXPENSES, YIELDS AND RATES (TAXABLE EQUIVALENT BASIS)
| For the Quarter Ended | ||||||||||||||
| March 31, 2021 | | December 31, 2020 | ||||||||||||
| Average |
| Interest |
| Yield / |
| Average |
| Interest |
| Yield / | ||||
| (unaudited) | | | (unaudited) | |||||||||||
Assets: | | | | | | | | | | | | | | | |
Securities: | | | | | | | | | | | | | | | |
Taxable | $ | 1,906,585 | | $ | 10,353 | | 2.20% | | $ | 1,848,655 | | $ | 10,414 | | 2.24% |
Tax-exempt | | 1,302,792 | | | 11,693 | | 3.64% | | | 1,291,588 | | | 11,656 | | 3.59% |
Total securities | | 3,209,377 | | | 22,046 | | 2.79% | | | 3,140,243 | | | 22,070 | | 2.80% |
Loans, net (3) (4) | | 14,064,123 | | | 128,122 | | 3.69% | | | 14,188,661 | | | 142,289 | | 3.99% |
Other earning assets | | 418,595 | | | 558 | | 0.54% | | | 472,586 | | | 572 | | 0.48% |
Total earning assets | | 17,692,095 | | $ | 150,726 | | 3.46% | | | 17,801,490 | | $ | 164,931 | | 3.69% |
Allowance for loan and lease losses | | (157,802) | | | | | | | | (174,761) | | | | | |
Total non-earning assets | | 2,152,561 | | | | | | | | 2,190,589 | | | | | |
Total assets | $ | 19,686,854 | | | | | | | $ | 19,817,318 | | | | | |
| | | | | | | | | | | | | | | |
Liabilities and Stockholders' Equity: | | | | | | | | | | | | | | | |
Interest-bearing deposits: | | | | | | | | | | | | | | | |
Transaction and money market accounts | $ | 8,060,328 | | $ | 2,152 | | 0.11% | | $ | 8,029,168 | | $ | 3,167 | | 0.16% |
Regular savings | | 940,369 | | | 59 | | 0.03% | | | 881,298 | | | 88 | | 0.04% |
Time deposits (5) | | 2,490,432 | | | 6,917 | | 1.13% | | | 2,571,639 | | | 8,745 | | 1.35% |
Total interest-bearing deposits | | 11,491,129 | | | 9,128 | | 0.32% | | | 11,482,105 | | | 12,000 | | 0.42% |
Other borrowings (6) | | 574,678 | | | 3,647 | | 2.57% | | | 891,699 | | | 4,243 | | 1.89% |
Total interest-bearing liabilities | | 12,065,807 | | $ | 12,775 | | 0.43% | | | 12,373,804 | | $ | 16,243 | | 0.52% |
| | | | | | | | | | | | | | | |
Noninterest-bearing liabilities: | | | | | | | | | | | | | | | |
Demand deposits | | 4,583,521 | | | | | | | | 4,414,044 | | | | | |
Other liabilities | | 317,585 | | | | | | | | 350,300 | | | | | |
Total liabilities | | 16,966,913 | | | | | | | | 17,138,148 | | | | | |
Stockholders' equity | | 2,719,941 | | | | | | | | 2,679,170 | | | | | |
Total liabilities and stockholders' equity | $ | 19,686,854 | | | | | | | $ | 19,817,318 | | | | | |
Net interest income | | | | $ | 137,951 | | | | | | | $ | 148,688 | | |
| | | | | | | | | | | | | | | |
Interest rate spread | | | | | | | 3.03% | | | | | | | | 3.17% |
Cost of funds | | | | | | | 0.30% | | | | | | | | 0.37% |
Net interest margin | | | | | | | 3.16% | | | | | | | | 3.32% |
| (1) | Income and yields are reported on a taxable equivalent basis using the statutory federal corporate tax rate of 21%. |
| (2) | Rates and yields are annualized and calculated from actual, not rounded amounts in thousands, which appear above. |
| (3) | Nonaccrual loans are included in average loans outstanding. |
| (4) | Interest income on loans includes $4.3 million and $4.5 million for the three months ended March 31, 2021 and December 31, 2020, respectively, in accretion of the fair market value adjustments related to acquisitions. |
| (5) | Interest expense on time deposits includes $20,000 and $22,000 for the three months ended March 31, 2021 and December 31, 2020, respectively, in accretion of the fair market value adjustments related to acquisitions. |
| (6) | Interest expense on borrowings includes $198,000 and $188,000 for the three months ended March 31, 2021 and December 31, 2020, in amortization of the fair market value adjustments related to acquisitions. |