Exhibit 99.2 Our Compelling Story: 2021 Investor Day February 25, 2021

Ed Vallejo Vice President, Investor Relations 2Ed Vallejo Vice
President, Investor Relations 2
Forward-Looking Statements Safe Harbor
This presentation includes forward‐looking statements within the meaning of the safe harbor provisions of the Private
Securities Litigation Reform Act of 1995 and the Federal securities laws. They are not guarantees or assurances of any
outcomes, financial results, levels of activity, performance or achievements, and readers are cautioned not to place undue
reliance upon them. The forward‐looking statements are subject to a number of estimates and assumptions, and known and
unknown risks, uncertainties and other factors. Actual results may differ materially from those discussed in the forward‐looking
statements included in this presentation. The factors that could cause actual results to differ, including uncertainties, risks and
other factors associated with the current novel coronavirus (COVID‐19) pandemic, are discussed in the Appendix to this
presentation, and in our Annual Report on Form 10‐K for the year ended December 31, 2020, as filed with the SEC on February
24, 2021. Non‐GAAP Financial Information
This presentation includes non‐GAAP financial measures. Further information regarding these non‐GAAP financial measures,
including a reconciliation of each of these measures to the most directly comparable GAAP measure, is included in the
Appendix to this presentation. 3Forward-Looking Statements Safe Harbor This presentation includes forward‐looking statements within the meaning of the safe harbor provisions of the Private Securities Litigation Reform Act of
1995 and the Federal securities laws. They are not guarantees or assurances of any outcomes, financial results, levels of activity, performance or achievements, and readers are cautioned not to place undue reliance upon them. The
forward‐looking statements are subject to a number of estimates and assumptions, and known and unknown risks, uncertainties and other factors. Actual results may differ materially from those discussed in the forward‐looking statements
included in this presentation. The factors that could cause actual results to differ, including uncertainties, risks and other factors associated with the current novel coronavirus (COVID‐19) pandemic, are discussed in the Appendix to this
presentation, and in our Annual Report on Form 10‐K for the year ended December 31, 2020, as filed with the SEC on February 24, 2021. Non‐GAAP Financial Information This presentation includes non‐GAAP financial measures. Further
information regarding these non‐GAAP financial measures, including a reconciliation of each of these measures to the most directly comparable GAAP measure, is included in the Appendix to this presentation. 3
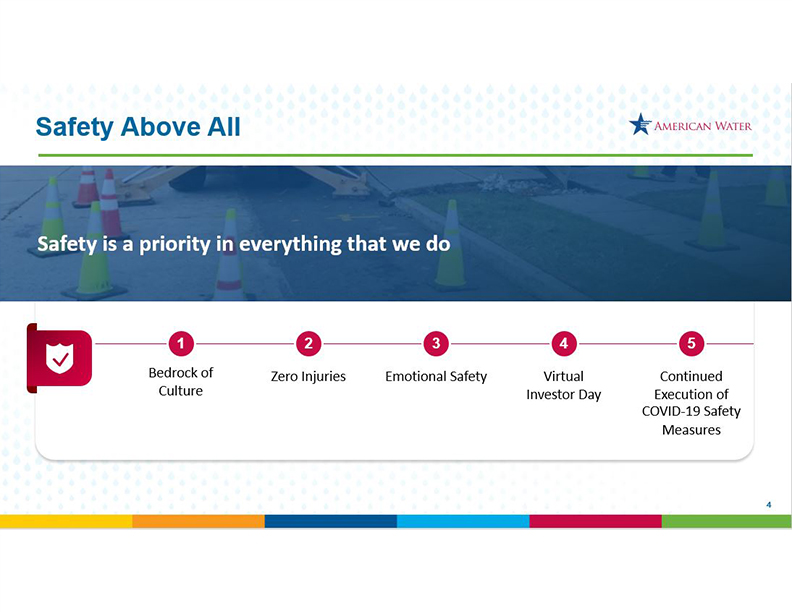
Safety Above All Safety is a priority in everything that we do 1 2 3 4
5 Bedrock of Zero Injuries Emotional Safety Virtual Continued Culture Investor Day Execution of
COVID-19 Safety Measures 4

Walter Lynch President and Chief Executive Officer 5
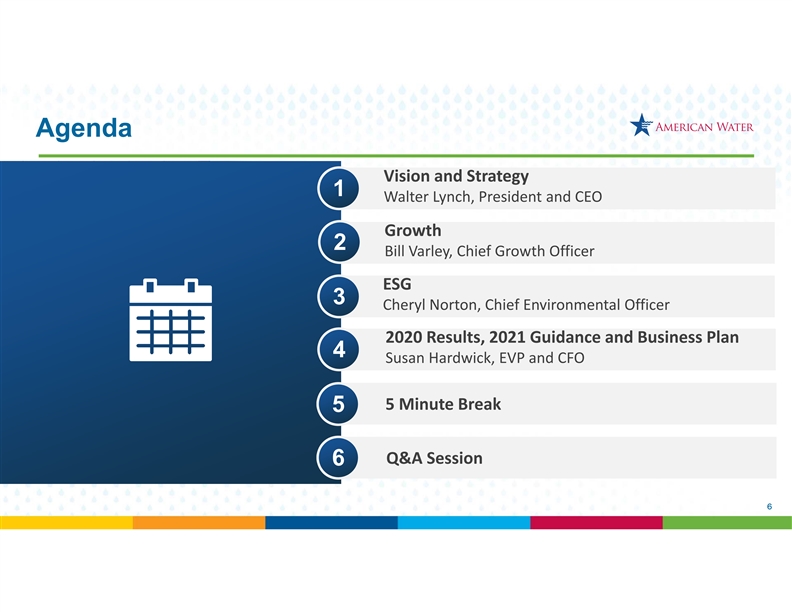
Agenda Vision and Strategy 1
Walter Lynch, President and CEO Growth 2 Bill Varley, Chief Growth Officer ESG 3 Cheryl Norton, Chief Environmental Officer
2020 Results, 2021 Guidance and Business Plan 4 Susan Hardwick, EVP and CFO 5 Minute Break 5 Q&A Session 6 6Agenda Vision and Strategy 1 Walter Lynch, President and CEO Growth 2
Bill Varley, Chief Growth Officer ESG 3 Cheryl Norton, Chief Environmental Officer 2020 Results, 2021 Guidance and Business Plan 4 Susan Hardwick, EVP and CFO 5 Minute Break 5 Q&A Session 6 6
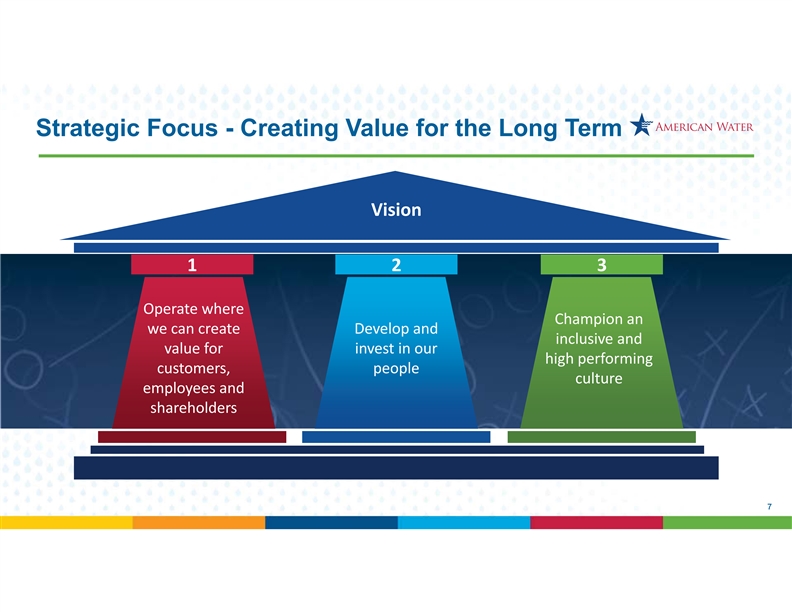
Strategic Focus - Creating Value for the Long Term Vision 1 2 3 Operate
where Champion an we can create Develop and inclusive and value for invest in our high performing customers, people culture employees and shareholders 7 7Strategic Focus - Creating Value for the Long Term Vision 1 2 3 Operate where Champion an we
can create Develop and inclusive and value for invest in our high performing customers, people culture employees and shareholders 7 7
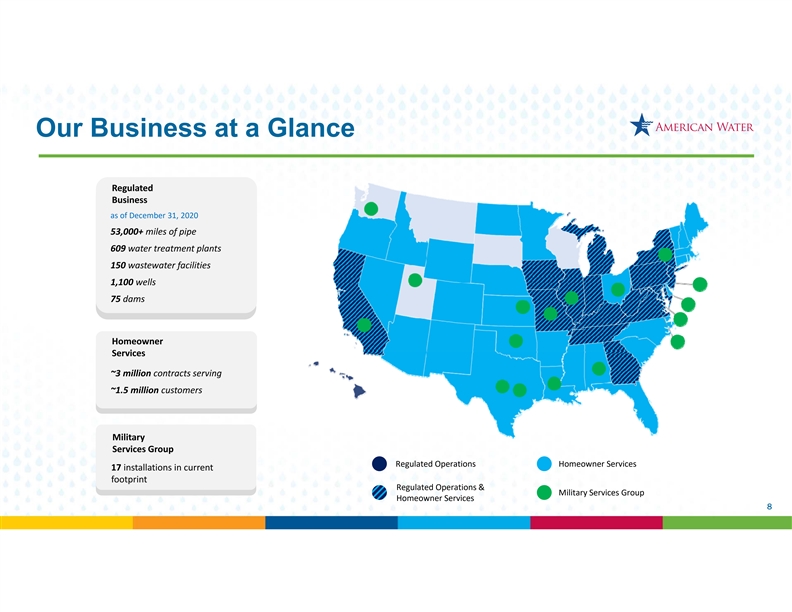
Our Business at a Glance Regulated Business
as of December 31, 2020 53,000+ miles of pipe 609 water treatment plants 150 wastewater facilities 1,100 wells 75 dams Homeowner Services ~3 million contracts serving
~1.5 million customers Military Services Group Regulated Operations Homeowner Services 17 installations in current footprint Regulated Operations & Military Services Group
Homeowner Services 8Our Business at a Glance Regulated Business as of December 31, 2020 53,000+ miles of pipe 609 water treatment plants 150 wastewater facilities 1,100 wells 75 dams Homeowner Services ~3 million contracts serving ~1.5 million
customers Military Services Group Regulated Operations Homeowner Services 17 installations in current footprint Regulated Operations & Military Services Group Homeowner Services 8
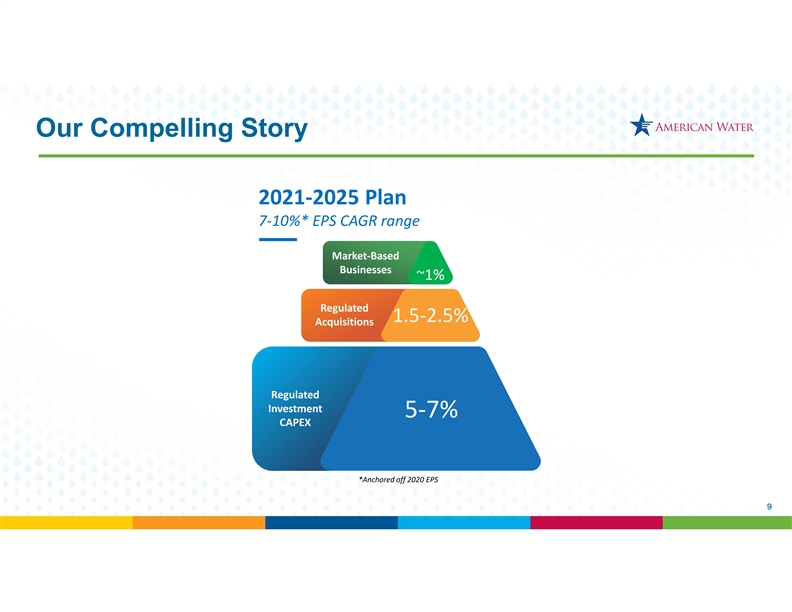
Our Compelling Story 2021‐2025 Plan
7‐10%* EPS CAGR range Market‐Based Businesses ~0.5% ~1% Regulated 1.5‐2.5% 2‐3% Acquisitions Regulated Investment 5‐7% 5‐7% CAPEX *Anchored off 2020 EPS 9Our Compelling
Story 2021‐2025 Plan 7‐10%* EPS CAGR range Market‐Based Businesses ~0.5% ~1% Regulated 1.5‐2.5% 2‐3% Acquisitions Regulated Investment 5‐7% 5‐7% CAPEX *Anchored off 2020 EPS 9
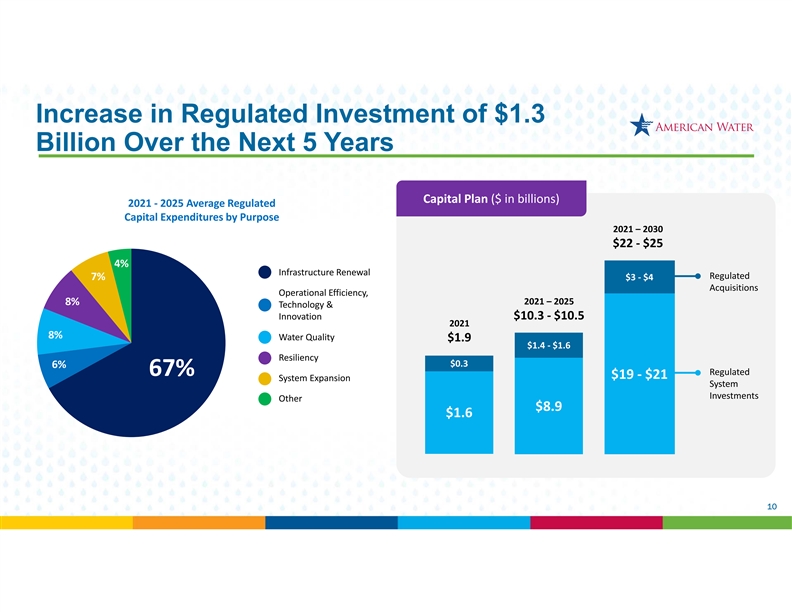
Increase in Regulated Investment of $1.3 Billion Over the Next 5 Years
Capital Plan ($ in billions) 2021 ‐ 2025 Average Regulated Capital Expenditures by Purpose 2021 – 2030 $22 ‐ $25 4% Infrastructure Renewal Regulated 7%
$3 ‐ $4 Acquisitions Operational Efficiency, 8% 2021 – 2025 Technology & Innovation $10.3 ‐ $10.5 2021 8% Water Quality $1.9 $1.4 ‐ $1.6 Resiliency $0.3 6% Regulated
67% $19 ‐ $21 System Expansion System Investments Other $8.9 $1.6 10Increase in Regulated Investment of $1.3 Billion Over the Next 5 Years Capital Plan ($ in billions) 2021 ‐ 2025 Average Regulated Capital Expenditures by
Purpose 2021 – 2030 $22 ‐ $25 4% Infrastructure Renewal Regulated 7% $3 ‐ $4 Acquisitions Operational Efficiency, 8% 2021 – 2025 Technology & Innovation $10.3 ‐ $10.5 2021 8% Water Quality $1.9 $1.4 ‐ $1.6
Resiliency $0.3 6% Regulated 67% $19 ‐ $21 System Expansion System Investments Other $8.9 $1.6 10
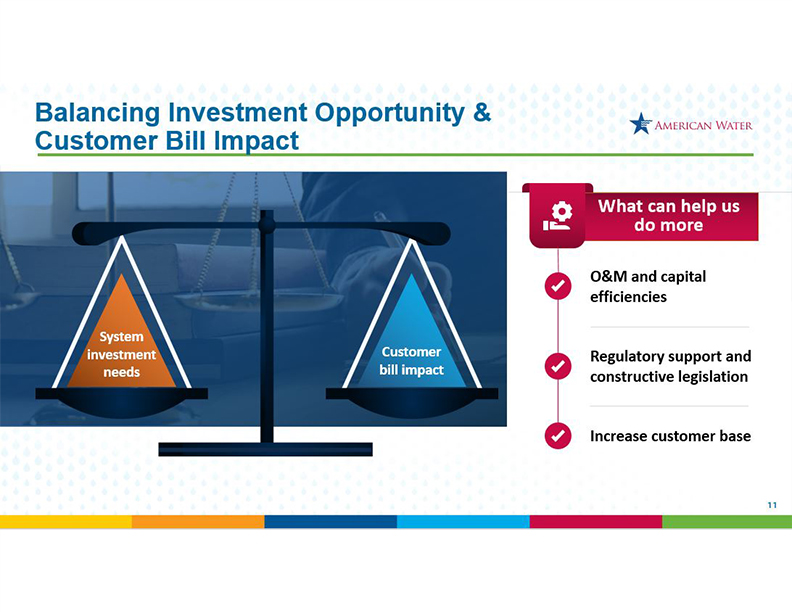
Balancing Investment Opportunity & Customer Bill Impact System investment needs Customer bill impact
What can help us do more O&M and capital efficiencies Regulatory support and constructive legislation Increase customer base 11
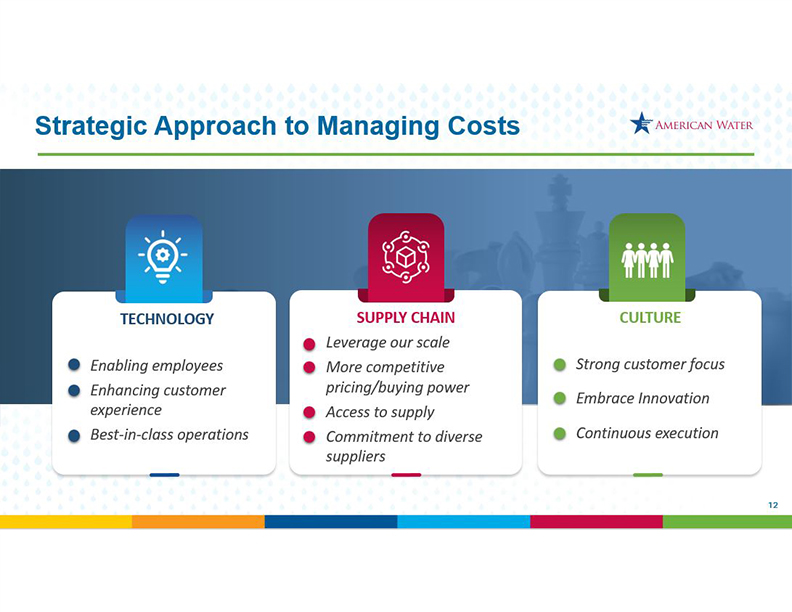
Strategic Approach to Managing Costs TECHNOLOGY Enabling employees Enhancing customer experience Best-in-class operations SUPPLY CHAIN Leverage our scale More competitive pricing/buying power Access to supply
Commitment to diverse suppliers CULTURE Strong customer focus Embrace Innovation Continuous execution 12
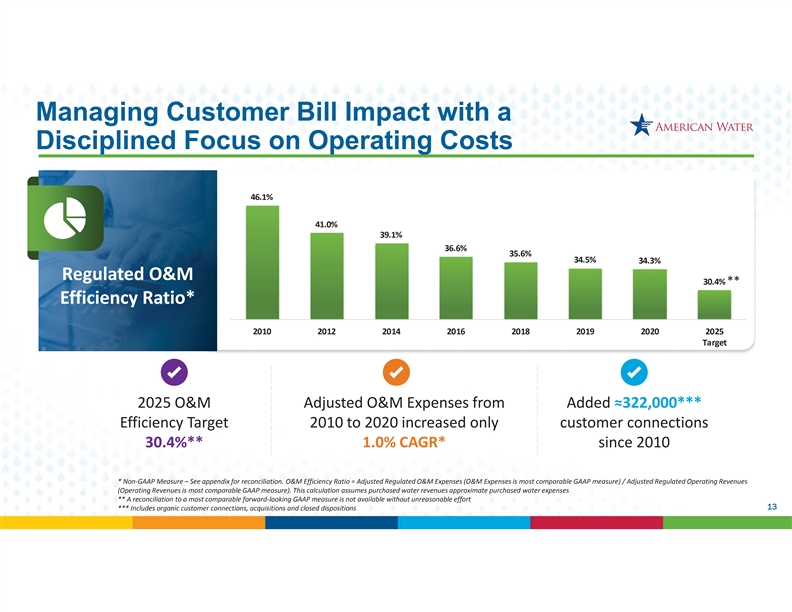
Managing Customer Bill Impact with a Disciplined Focus on Operating
Costs 46.1% 41.0% 39.1% 36.6% 35.6% 34.5% 34.3% Regulated O&M 30.4%** Efficiency Ratio* 2010 2012 2014 2016 2018 2019 2020 2025 Target 2025 O&M Adjusted O&M Expenses from Added≈322,000*** Efficiency Target 2010 to 2020 increased
only customer connections 30.4%** 1.0% CAGR* since 2010 * Non-GAAP Measure – See appendix for reconciliation. O&M Efficiency Ratio = Adjusted Regulated O&M Expenses (O&M Expenses is most comparable GAAP measure) / Adjusted
Regulated Operating Revenues (Operating Revenues is most comparable GAAP measure). This calculation assumes purchased water revenues approximate purchased water expenses ** A reconciliation to a most comparable forward-looking GAAP measure is not
available without unreasonable effort 1 13 *** Includes organic customer connections, acquisitions and closed dispositionsManaging Customer Bill Impact with a Disciplined Focus on Operating Costs 46.1% 41.0% 39.1% 36.6% 35.6% 34.5% 34.3% Regulated
O&M 30.4%** Efficiency Ratio* 2010 2012 2014 2016 2018 2019 2020 2025 Target 2025 O&M Adjusted O&M Expenses from Added≈322,000*** Efficiency Target 2010 to 2020 increased only customer connections 30.4%** 1.0% CAGR* since 2010 *
Non-GAAP Measure – See appendix for reconciliation. O&M Efficiency Ratio = Adjusted Regulated O&M Expenses (O&M Expenses is most comparable GAAP measure) / Adjusted Regulated Operating Revenues (Operating Revenues is most
comparable GAAP measure). This calculation assumes purchased water revenues approximate purchased water expenses ** A reconciliation to a most comparable forward-looking GAAP measure is not available without unreasonable effort 1 13 *** Includes
organic customer connections, acquisitions and closed dispositions

Market-Based Businesses Provide Strategic Value Military Services Group
17 installations in current footprint Opportunity for infrastructure upgrades on existing bases Homeowner Services ~3 million protection plan contracts serving
~1.5 million customers Over 40 different partnerships with municipal water, gas and electric utilities BENEFITS › Capital light › Builds relationships
Enhances customer satisfaction Cash flow positive Positive branding Leverage core competencies 14
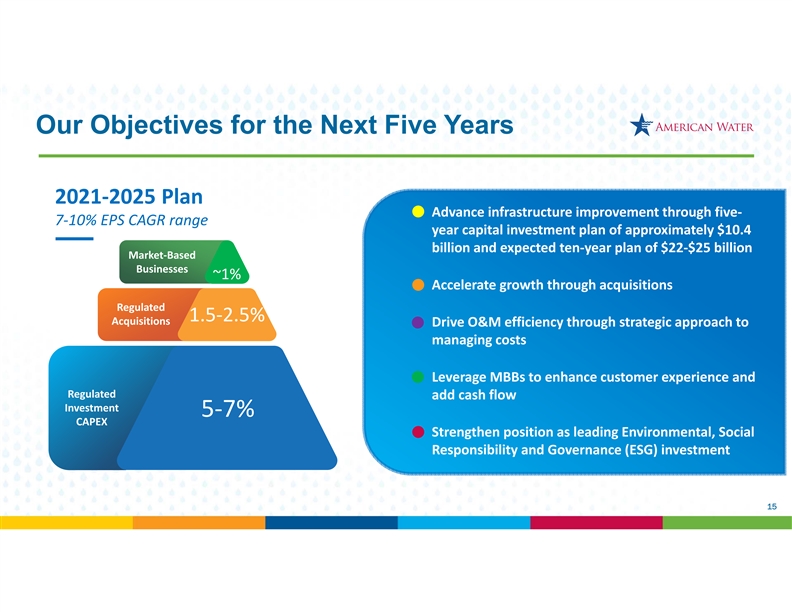
Our Objectives for the Next Five Years 2021‐2025 Plan
Advance infrastructure improvement through five‐ 7‐10% EPS CAGR range year capital investment plan of approximately $10.4
billion and expected ten‐year plan of $22‐$25 billion Market‐Based Businesses ~0.5% ~1% Accelerate growth through acquisitions Regulated 1.5‐2.5% 2‐3% Acquisitions
Drive O&M efficiency through strategic approach to managing costs Leverage MBBs to enhance customer experience and Regulated add cash flow Investment
5‐7% 5‐7% CAPEX Strengthen position as leading Environmental, Social Responsibility and Governance (ESG) investment 15Our Objectives for the Next Five Years 2021‐2025 Plan Advance
infrastructure improvement through five‐ 7‐10% EPS CAGR range year capital investment plan of approximately $10.4 billion and expected ten‐year plan of $22‐$25 billion Market‐Based Businesses ~0.5% ~1% Accelerate growth
through acquisitions Regulated 1.5‐2.5% 2‐3% Acquisitions Drive O&M efficiency through strategic approach to managing costs Leverage MBBs to enhance customer experience and Regulated add cash flow Investment 5‐7% 5‐7%
CAPEX Strengthen position as leading Environmental, Social Responsibility and Governance (ESG) investment 15
Bill Varley Chief Growth Officer 16Bill Varley Chief Growth Officer
16
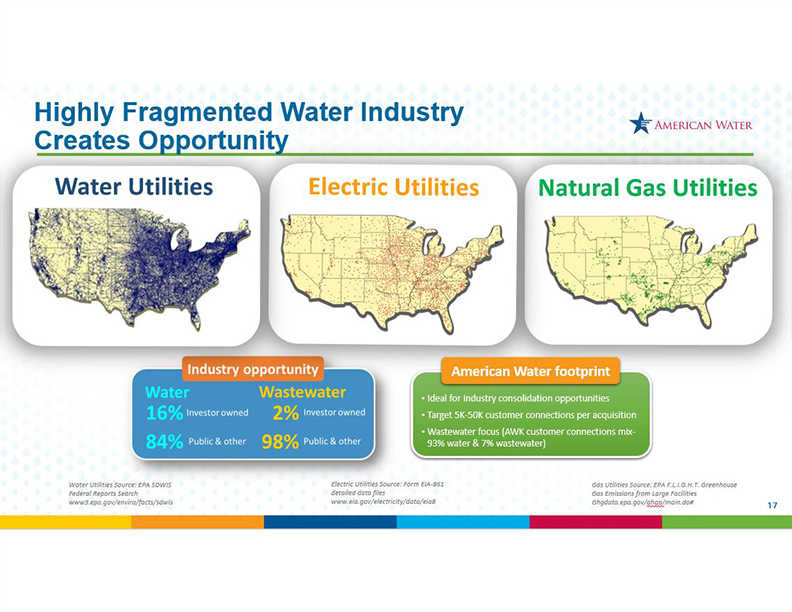
Highly Fragmented Water Industry Creates Opportunity Water Utilities Electric Utilities Natural gas Utilities
Industry opportunity Water 16% investor owned 2% investor owned 84% Public & other 98% Public & other Water Utilities Source: EPA SDWIS Federal Reports Search www3.epa.gov/enviro/facts/sdwis Electric Utilities Source: Form EIA-861 detailed data files www.eia.gov/electricity/data/eia8 Gas Utilities Source: EPA F.L.I.G.H.T. Greenhouse
Gas Emissions from Large Facilities Ghgdata.epa.gov/ghgp/main.do# 17
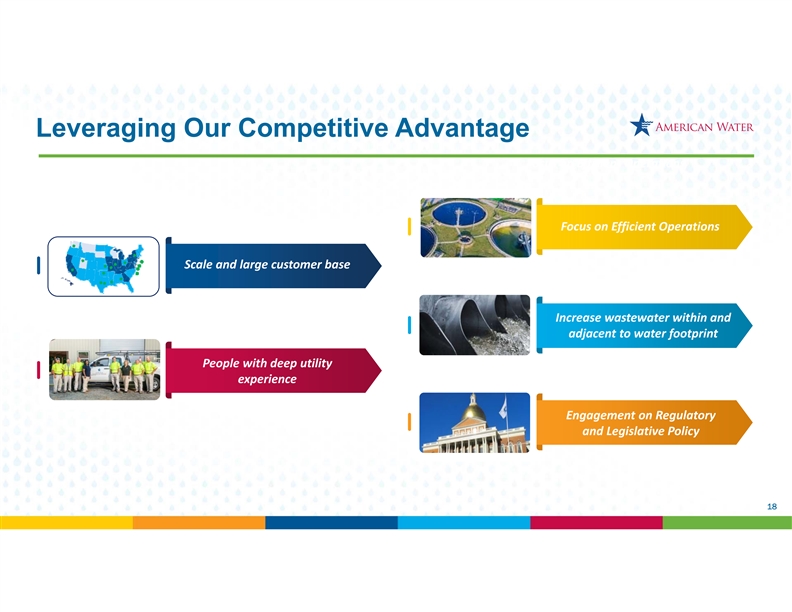
Leveraging Our Competitive Advantage
Focus on Efficient Operations Focus on Efficient Operations Scale and large customer base Increase wastewater within and adjacent to water footprint
People with deep utility experience Engagement on Regulatory and Legislative Policy 18Leveraging Our Competitive Advantage Focus on Efficient Operations Focus on Efficient Operations Scale and large
customer base Increase wastewater within and adjacent to water footprint People with deep utility experience Engagement on Regulatory and Legislative Policy 18
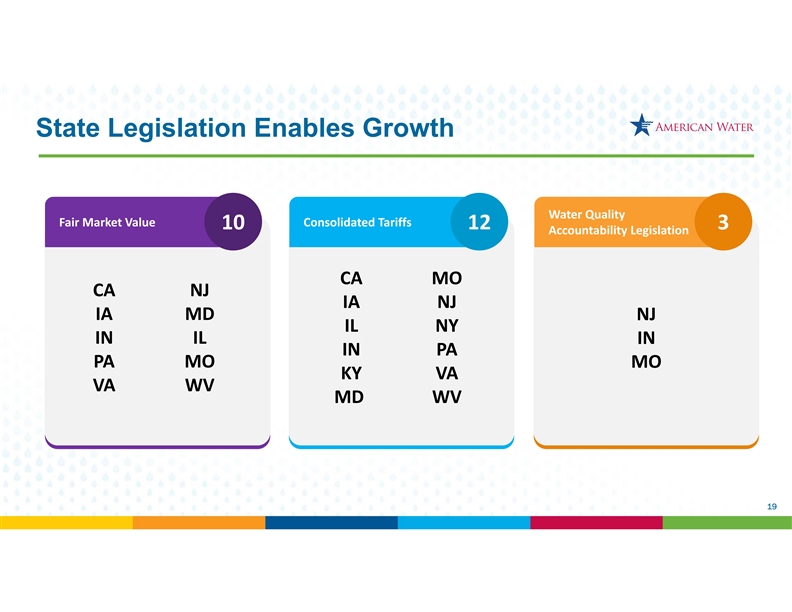
State Legislation Enables Growth Water Quality
Fair Market Value Consolidated Tariffs 10 12 3 Accountability Legislation CA MO CA NJ IA NJ IA MD NJ IL NY IN IL IN IN PA PA MO MO KY VA VA WV MD WV 19State Legislation Enables Growth Water Quality Fair Market Value
Consolidated Tariffs 10 12 3 Accountability Legislation CA MO CA NJ IA NJ IA MD NJ IL NY IN IL IN IN PA PA MO MO KY VA VA WV MD WV 19
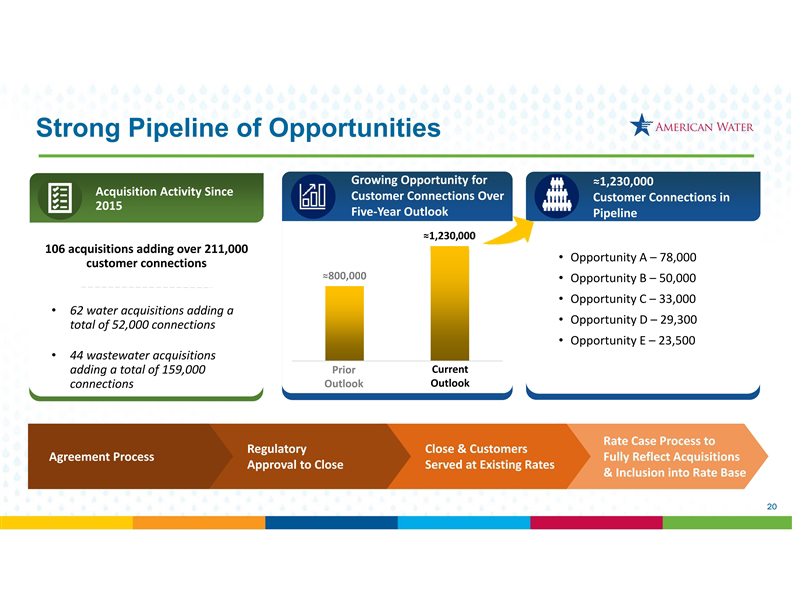
Strong Pipeline of Opportunities Growing Opportunity for 1,230,000 Acquisition Activity Since Customer
Connections Over Customer Connections in 2015 Five Year Outlook Pipeline 1,230, 000 106 acquisitions adding over 211,000 800,00 Opportunity A –78,000 customer connections 0 Opportunity B –50,000 Opportunity C –33,000 62 water
acquisitions adding a Opportunity D –29,300 total of 52,000 connections Opportunity E –23,500 44 wastewater acquisitions adding a total of 159,000 Prior Current 2020 2021 connections Outlook Outlook Rate Case Process to Regulatory Close
& Customers Agreement Process Fully Reflect Acquisitions Approval to Close Served at Existing Rates & Inclusion into Rate Base 20
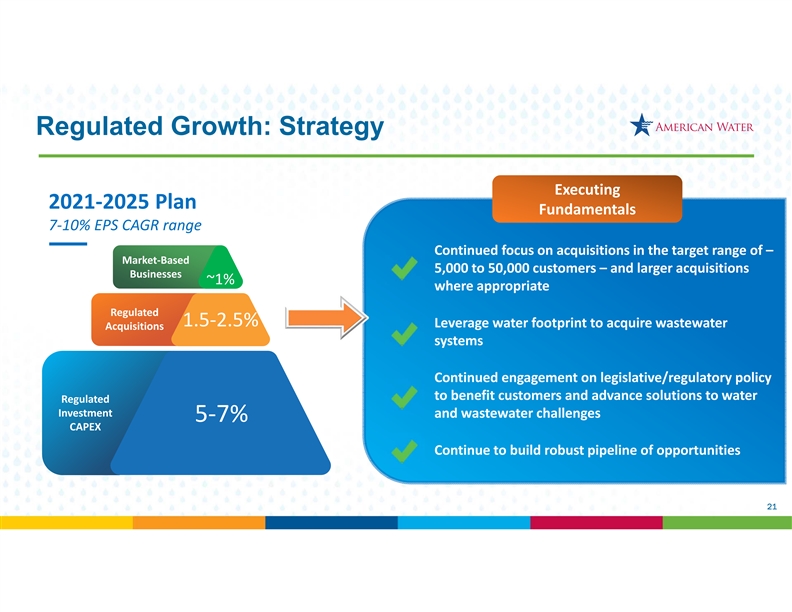
Regulated Growth: Strategy Executing 2021‐2025 Plan
Fundamentals 7‐10% EPS CAGR range Continued focus on acquisitions in the target range of – Market‐Based 5,000 to 50,000 customers –
and larger acquisitions Businesses ~0.5% ~1% where appropriate Regulated 1.5‐2.5% 2‐3% Leverage water footprint to acquire wastewater Acquisitions systems
Continued engagement on legislative/regulatory policy to benefit customers and advance solutions to water Regulated Investment and wastewater challenges 5‐7%
5‐7% CAPEX Continue to build robust pipeline of opportunities 21Regulated Growth: Strategy Executing 2021‐2025 Plan Fundamentals 7‐10% EPS CAGR range Continued focus on acquisitions in the target range
of – Market‐Based 5,000 to 50,000 customers – and larger acquisitions Businesses ~0.5% ~1% where appropriate Regulated 1.5‐2.5% 2‐3% Leverage water footprint to acquire wastewater Acquisitions systems Continued
engagement on legislative/regulatory policy to benefit customers and advance solutions to water Regulated Investment and wastewater challenges 5‐7% 5‐7% CAPEX Continue to build robust pipeline of opportunities 21
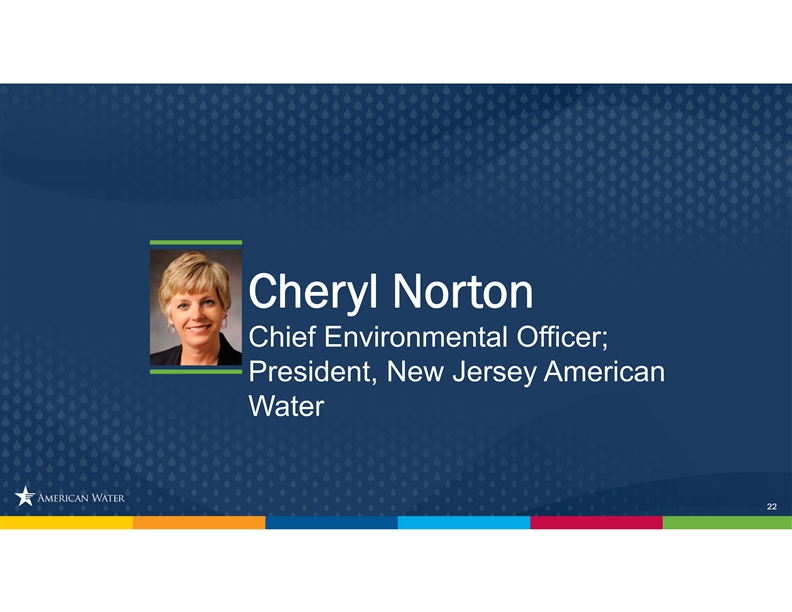
Cheryl Norton Chief Environmental Officer; President, New Jersey
American Water 22Cheryl Norton Chief Environmental Officer; President, New Jersey American Water 22
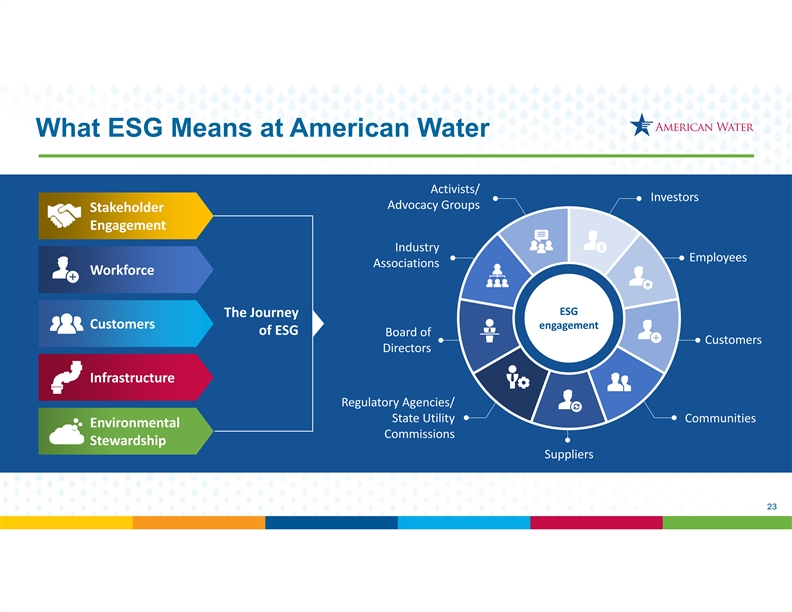
What ESG Means at American Water Activists/ Investors
Advocacy Groups Stakeholder Engagement Industry Employees Associations Workforce ESG The Journey Customers engagement of ESG Board of Customers Directors Infrastructure Regulatory Agencies/
State Utility Communities Environmental Commissions Stewardship Suppliers 23What ESG Means at American Water Activists/ Investors Advocacy Groups Stakeholder Engagement Industry Employees Associations Workforce ESG The Journey
Customers engagement of ESG Board of Customers Directors Infrastructure Regulatory Agencies/ State Utility Communities Environmental Commissions Stewardship Suppliers 23
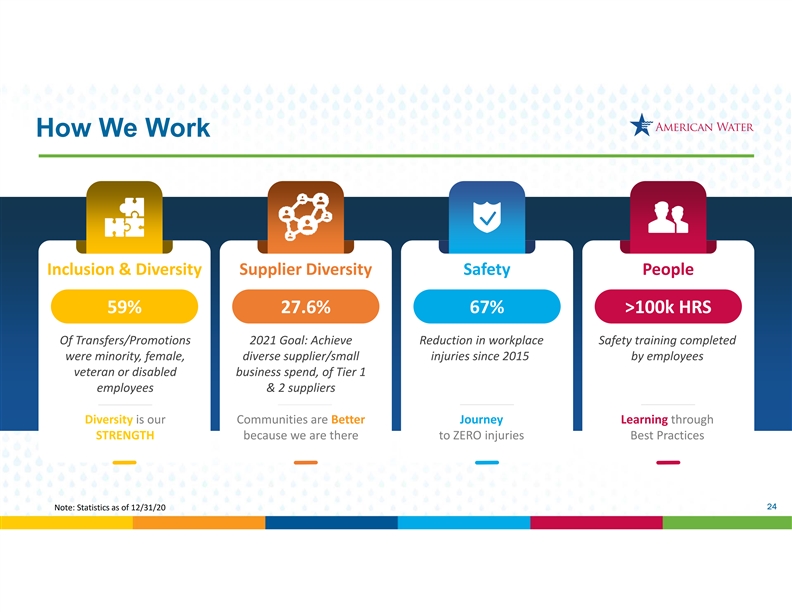
How We Work Inclusion & Diversity Supplier Diversity
Safety People 59% 27.6% 67% >100k HRS Of Transfers/Promotions 2021 Goal: Achieve Reduction in workplace Safety training completed were minority, female,
diverse supplier/small injuries since 2015 by employees veteran or disabled business spend, of Tier 1 employees & 2 suppliers Diversity is our
Communities are Better Journey Learning through STRENGTH because we are there to ZERO injuries Best Practices 24 Note: Statistics as of 12/31/20How We Work Inclusion & Diversity
Supplier Diversity Safety People 59% 27.6% 67% >100k HRS Of Transfers/Promotions 2021 Goal: Achieve Reduction in workplace Safety training completed were minority, female, diverse supplier/small injuries since 2015 by employees veteran or
disabled business spend, of Tier 1 employees & 2 suppliers Diversity is our Communities are Better Journey Learning through STRENGTH because we are there to ZERO injuries Best Practices 24 Note: Statistics as of 12/31/20
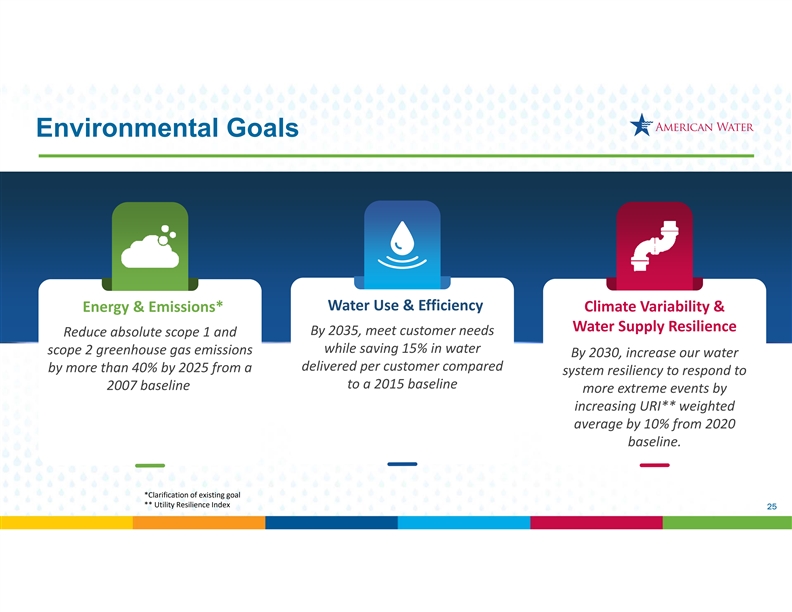
Environmental Goals Water Use & Efficiency
Energy & Emissions* Climate Variability & Water Supply Resilience B By y 2035, 2035, m mee eet cus t cust tomer omer n needs eeds R Re educ
duce absolut e absolute e s sc co ope 1 and pe 1 and while saving while saving 15% in wat 15% in wate er r sc
scope 2 greenhouse ope 2 greenhouse gas gas emissions emissions B By y 2030, 2030, i increase ncrease o our wat ur water er
delivered per cus delivered per cust to omer c mer co ompared mpared by by m more than ore than 40% by 40% by 2025 2025 from a
from a s sy ys st tem em r resiliency esiliency t to o respond t respond to o t to o a 2015 a 2015 baseline baseline 2007 2007 baseline
baseline more e more extreme e xtreme even vent ts by s by increasing URI** increasing URI** weigh weight ted ed average average by
by 10% from 2020 10% from 2020 baseline. baseline. *Clarification of existing goal ** Utility Resilience Index 25Environmental Goals Water Use & Efficiency Energy &
Emissions* Climate Variability & Water Supply Resilience B By y 2035, 2035, m mee eet cus t cust tomer omer n needs eeds R Re educ duce absolut e absolute e s sc co ope 1 and pe 1 and while saving while saving 15% in wat 15% in wate er r sc
scope 2 greenhouse ope 2 greenhouse gas gas emissions emissions B By y 2030, 2030, i increase ncrease o our wat ur water er delivered per cus delivered per cust to omer c mer co ompared mpared by by m more than ore than 40% by 40% by 2025 2025 from
a from a s sy ys st tem em r resiliency esiliency t to o respond t respond to o t to o a 2015 a 2015 baseline baseline 2007 2007 baseline baseline more e more extreme e xtreme even vent ts by s by increasing URI** increasing URI** weigh weight ted
ed average average by by 10% from 2020 10% from 2020 baseline. baseline. *Clarification of existing goal ** Utility Resilience Index 25
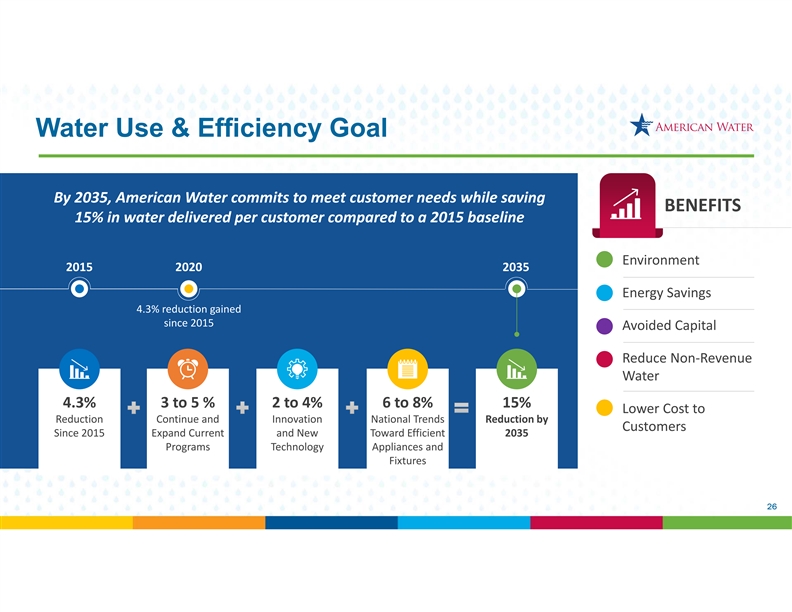
Water Use & Efficiency Goal
By 2035, American Water commits to meet customer needs while saving BENEFITS 15% in water delivered per customer compared to a 2015 baseline
› Environment 2015 2020 2035 › Energy Savings 4.3% reduction gained since 2015 › Avoided Capital › Reduce Non‐Revenue Water 4.3% 4.3% 3 t 3 to o 5 %
5 % 2 t 2 to o 4% 4% 6 t 6 to o 8% 8% 15% 15% › Lower Cost to R Re eduction duction Con Cont tinue inue a and nd Innov Innova
ation tion Na National tional T Tr re ends nds R Re eduction duction b by y Customers Since Since 2015 2015 Expand Expand Curr Curren ent t and
and New New T To ow wa ar rd d E Ef ff ficien icient t 2035 2035 Pr Progr ogra ams ms T Te echnology chnology Appliances Appliances a and nd Fix Fixt tur ures es 26Water Use &
Efficiency Goal By 2035, American Water commits to meet customer needs while saving BENEFITS 15% in water delivered per customer compared to a 2015 baseline › Environment 2015 2020 2035 › Energy Savings 4.3% reduction gained since 2015
› Avoided Capital › Reduce Non‐Revenue Water 4.3% 4.3% 3 t 3 to o 5 % 5 % 2 t 2 to o 4% 4% 6 t 6 to o 8% 8% 15% 15% › Lower Cost to R Re eduction duction Con Cont tinue inue a and nd Innov Innova ation tion Na National tional
T Tr re ends nds R Re eduction duction b by y Customers Since Since 2015 2015 Expand Expand Curr Curren ent t and and New New T To ow wa ar rd d E Ef ff ficien icient t 2035 2035 Pr Progr ogra ams ms T Te echnology chnology Appliances Appliances a
and nd Fix Fixt tur ures es 26
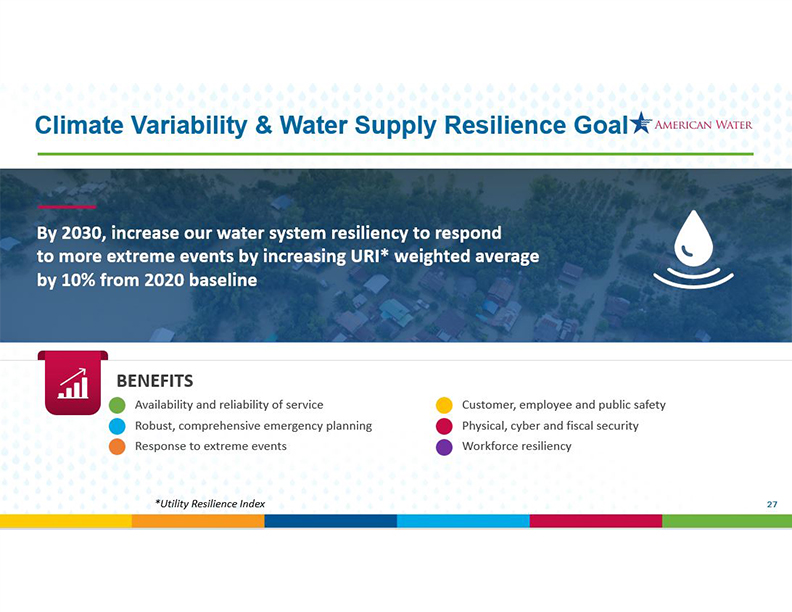
Climate Variability & Water Supply Resilience Goal
By 2030, increase our water system resiliency to respond
to more extreme events by increasing URI* weighted average by 10% from 2020 baseline
BENEFITS
› Availability and reliability of service
›
Robust, comprehensive emergency planning
› Response to extreme events
*Utility Resilience Index
Customer, employee and public safety
Physical, cyber and fiscal security Workforce resiliency
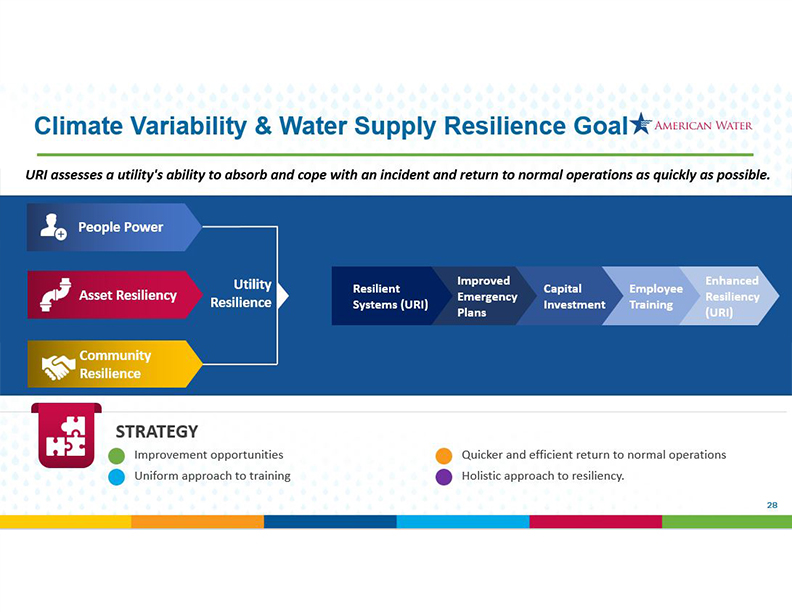
Climate Variability & Water Supply Resilience Goal
URI assesses a utility’s ability to absorb and cope with
an incident and return to normal operations as quickly as possible.
People Power
Asset Resiliency
Community Resilience
Utility Improved Enhanced Resilient Capital Employee Emergency Resiliency
Resilience Systems (URI) Investment Training Plans (URI)
STRATEGY
› Improvement opportunities
›
Uniform approach to training
Quicker and efficient return to normal operations
Holistic approach to resiliency.
28

Susan Hardwick Chief Financial Officer 29Susan Hardwick Chief Financial
Officer 29
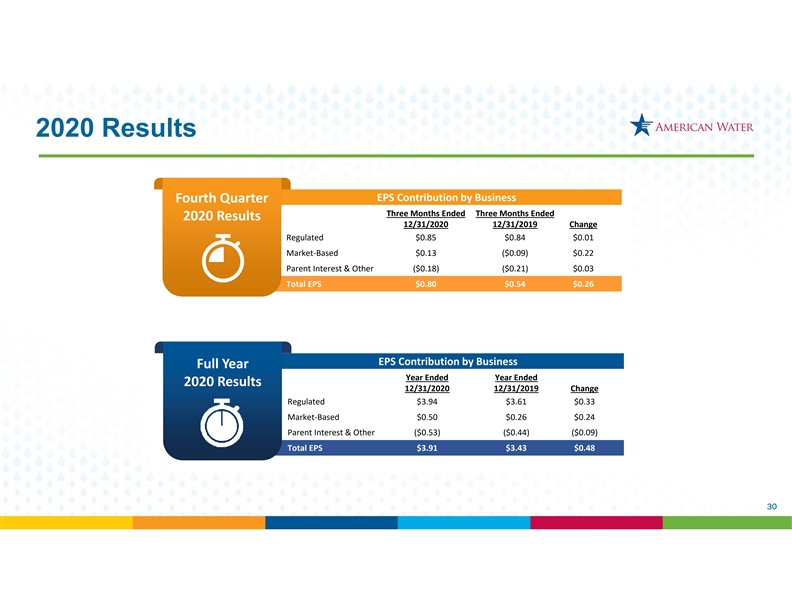
2020 Results EPS Contribution by Business
Fourth Quarter Three Months Ended Three Months Ended 2020 Results 12/31/2020 12/31/2019 Change Regulated $0.85 $0.84 $0.01 Market‐Based $0.13 ($0.09) $0.22
Parent Interest & Other ($0.18) ($0.21) $0.03 Total EPS $0.80 $0.54 $0.26 EPS Contribution by Business Full Year Year Ended Year Ended 2020 Results 12/31/2020
12/31/2019 Change Regulated $3.94 $3.61 $0.33 Market‐Based $0.50 $0.26 $0.24 Parent Interest & Other ($0.53) ($0.44) ($0.09) Total EPS $3.91 $3.43 $0.48 302020
Results EPS Contribution by Business Fourth Quarter Three Months Ended Three Months Ended 2020 Results 12/31/2020 12/31/2019 Change Regulated $0.85 $0.84 $0.01 Market‐Based $0.13 ($0.09) $0.22 Parent Interest & Other ($0.18) ($0.21) $0.03
Total EPS $0.80 $0.54 $0.26 EPS Contribution by Business Full Year Year Ended Year Ended 2020 Results 12/31/2020 12/31/2019 Change Regulated $3.94 $3.61 $0.33 Market‐Based $0.50 $0.26 $0.24 Parent Interest & Other ($0.53) ($0.44) ($0.09)
Total EPS $3.91 $3.43 $0.48 30
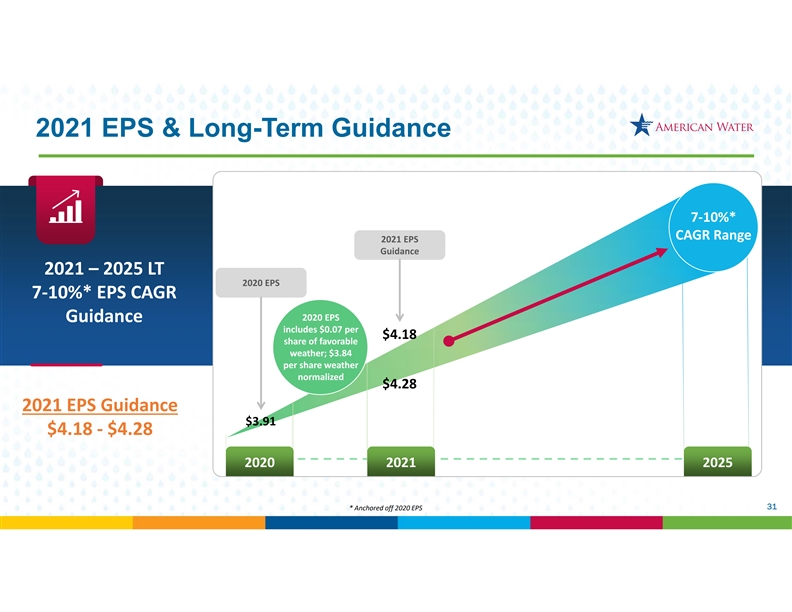
2021 EPS & Long-Term Guidance 7‐10%* CAGR Range
2021 EPS Guidance 2021 – 2025 LT 2020 EPS 7‐10%* EPS CAGR 2020 EPS Guidance includes $0.07 per $4.18 share of favorable
weather; $3.84 per share weather normalized $4.28 2021 EPS Guidance $3.91 $4.18 ‐ $4.28 2020 2021 2025 31 * Anchored off 2020 EPS2021 EPS & Long-Term Guidance 7‐10%* CAGR
Range 2021 EPS Guidance 2021 – 2025 LT 2020 EPS 7‐10%* EPS CAGR 2020 EPS Guidance includes $0.07 per $4.18 share of favorable weather; $3.84 per share weather normalized $4.28 2021 EPS Guidance $3.91 $4.18 ‐ $4.28 2020 2021 2025 31
* Anchored off 2020 EPS
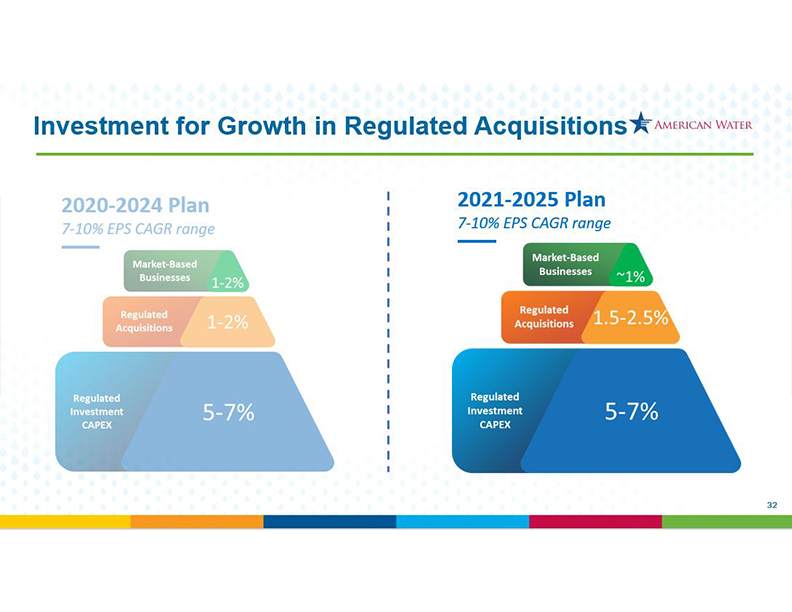
Investment for Growth in Regulated Acquisitions
Market-Based Businesses 1-2% Market-Based Businesses ~1%%
Regulated Acquisitions 1-2 % Regulated Acquisitions 1.5-2.5 % Regulated investment CAPEX 5-7% Regulated investment CAPEX 5-7%
32
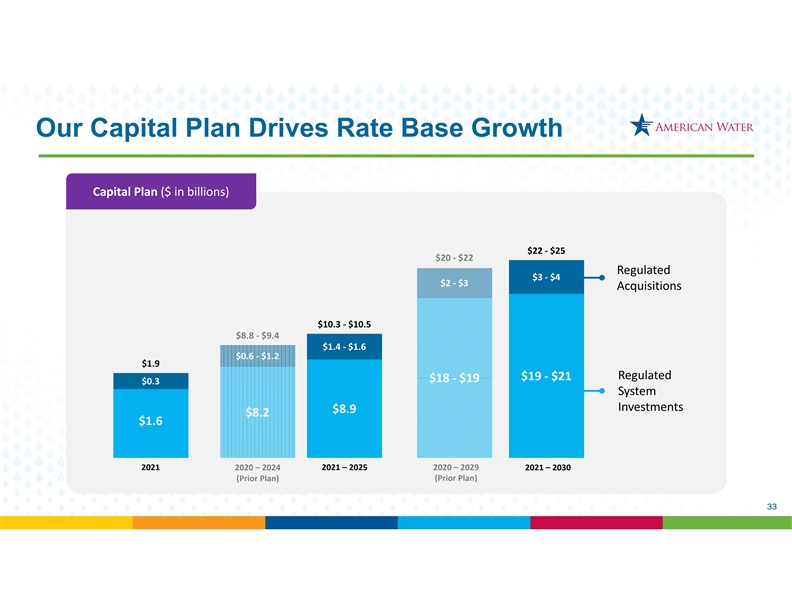
Our Capital Plan Drives Rate Base Growth
Capital Plan ($ in billions) $22 ‐ $25 $20 ‐ $22 Regulated $3 ‐ $4 $2 ‐ $3 Acquisitions $10.3 ‐ $10.5 $8.8 ‐ $9.4 $1.4 ‐ $1.6 $0.6 ‐ $1.2
$1.9 Regulated $19 ‐ $21 $18 ‐ $19 $0.3 System Investments $8.9 $8.2 $1.6 2021 2020 – 2024 2021 – 2025 2020 – 2029 2021 – 2030 (Prior Plan) (Prior Plan) 33Our
Capital Plan Drives Rate Base Growth Capital Plan ($ in billions) $22 ‐ $25 $20 ‐ $22 Regulated $3 ‐ $4 $2 ‐ $3 Acquisitions $10.3 ‐ $10.5 $8.8 ‐ $9.4 $1.4 ‐ $1.6 $0.6 ‐ $1.2 $1.9 Regulated $19 ‐
$21 $18 ‐ $19 $0.3 System Investments $8.9 $8.2 $1.6 2021 2020 – 2024 2021 – 2025 2020 – 2029 2021 – 2030 (Prior Plan) (Prior Plan) 33
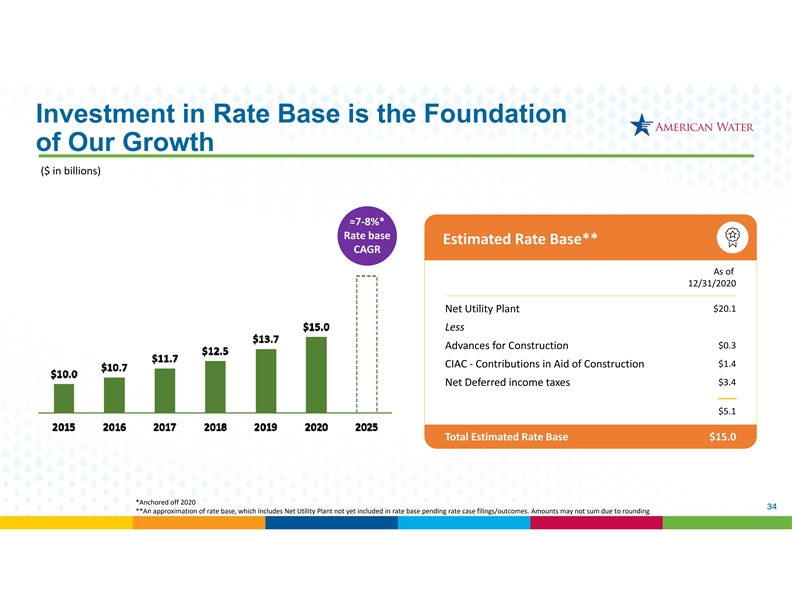
Investment in Rate Base is the Foundation of Our Growth
($ in billions) ≈7‐8%* Rate base Estimated Rate Base** CAGR As of 12/31/2020 Net Utility Plant $20.1 Less Advances for Construction $0.3 $1.4 CIAC ‐
Contributions in Aid of Construction $3.4 Net Deferred income taxes $5.1 Total Estimated Rate Base $15.0 *Anchored off 2020 34
**An approximation of rate base, which includes Net Utility Plant not yet included in rate base pending rate case filings/outcomes. Amounts
may not sum due to rounding Investment in Rate Base is the Foundation of Our Growth ($ in billions) ≈7‐8%* Rate base Estimated Rate Base** CAGR As of 12/31/2020 Net Utility Plant $20.1 Less Advances for
Construction $0.3 $1.4 CIAC ‐ Contributions in Aid of Construction $3.4 Net Deferred income taxes $5.1 Total Estimated Rate Base $15.0 *Anchored off 2020 34 **An approximation of rate base, which includes Net Utility Plant not yet included in
rate base pending rate case filings/outcomes. Amounts may not sum due to rounding
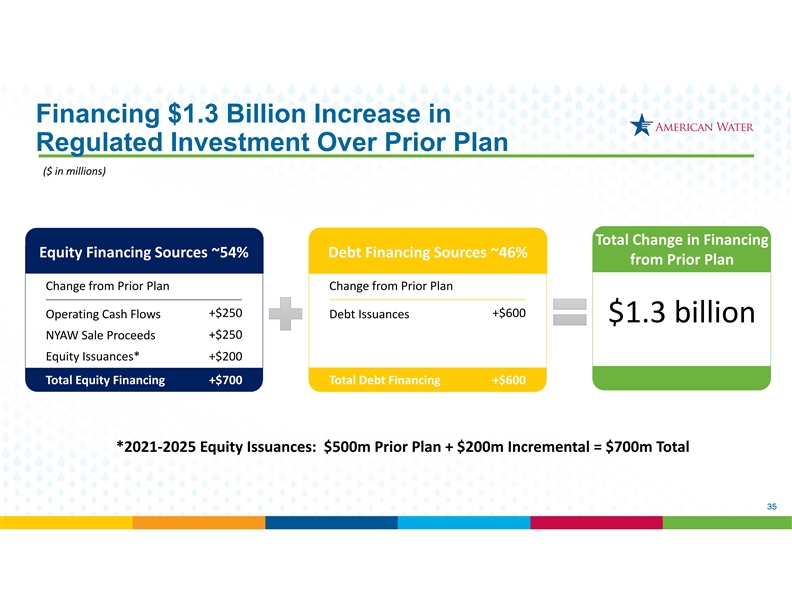
Financing $1.3 Billion Increase in Regulated Investment Over Prior Plan
($ in millions) Total Change in Financing Equity Financing Sources ~54% Debt Financing Sources ~46% from Prior Plan Change from Prior Plan
Change from Prior Plan +$250 +$600 Operating Cash Flows Debt Issuances $1.3 billion + NYAW Sale Proceeds +$250 $1.3 billion = = Equity Issuances* +$200 Total Equity Financing +$700
Total Debt Financing +$600 *2021‐2025 Equity Issuances: $500m Prior Plan + $200m Incremental = $700m Total 35Financing $1.3 Billion Increase in Regulated Investment Over
Prior Plan ($ in millions) Total Change in Financing Equity Financing Sources ~54% Debt Financing Sources ~46% from Prior Plan Change from Prior Plan Change from Prior Plan +$250 +$600 Operating Cash Flows Debt Issuances $1.3 billion + NYAW Sale
Proceeds +$250 $1.3 billion = = Equity Issuances* +$200 Total Equity Financing +$700 Total Debt Financing +$600 *2021‐2025 Equity Issuances: $500m Prior Plan + $200m Incremental = $700m Total 35
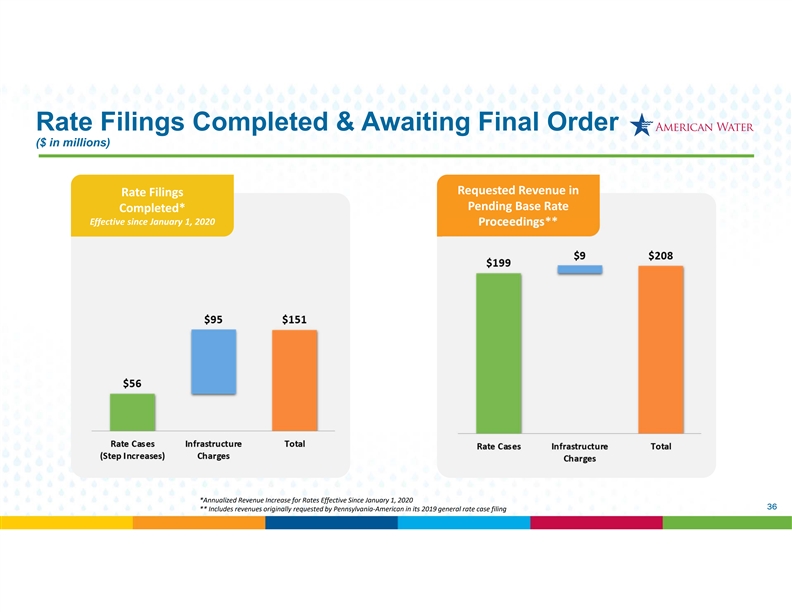
Rate Filings Completed & Awaiting Final Order ($ in millions)
Requested Revenue in Rate Filings Pending Base Rate Completed* Effective since January 1, 2020 Proceedings**
*Annualized Revenue Increase for Rates Effective Since January 1, 2020 36
** Includes revenues originally requested by Pennsylvania‐American in its 2019 general rate case filingRate Filings Completed & Awaiting Final Order ($ in millions) Requested
Revenue in Rate Filings Pending Base Rate Completed* Effective since January 1, 2020 Proceedings** *Annualized Revenue Increase for Rates Effective Since January 1, 2020 36 ** Includes revenues originally requested by Pennsylvania‐American in
its 2019 general rate case filing
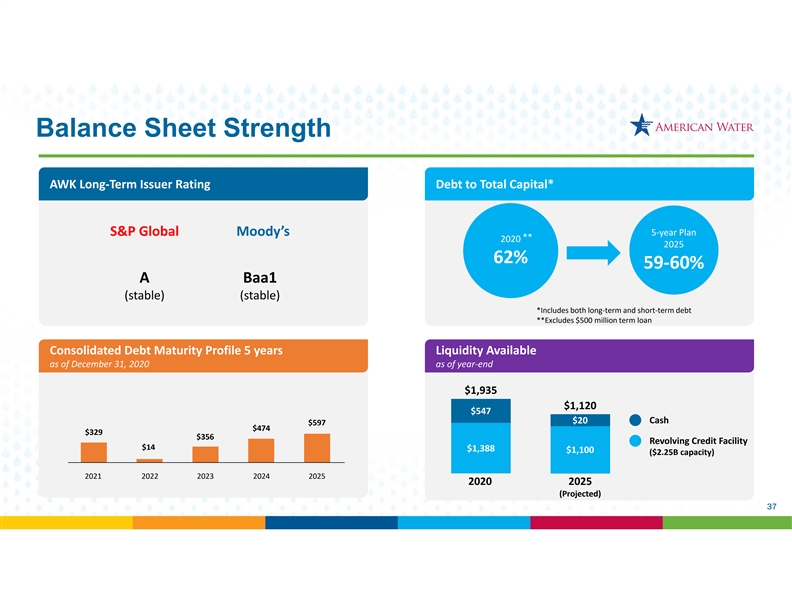
Balance Sheet Strength AWK Long‐Term Issuer Rating
Debt to Total Capital* S&P Global Moody’s 5‐year Plan ** 2020 2025 62% 59‐60% A Baa1 (stable) (stable) *Includes both long‐term and short‐term debt
**Excludes $500 million term loan Consolidated Debt Maturity Profile 5 years Liquidity Available as of December 31, 2020 as of year‐end $1,935 $1,120 $547 Cash $20
$597 $474 $329 $356 Revolving Credit Facility $14 $1,388 $1,100 ($2.25B capacity) 2021 2022 2023 2024 2025 2020 2025 (Projected) 37Balance Sheet Strength AWK Long‐Term Issuer Rating Debt to Total Capital* S&P Global
Moody’s 5‐year Plan ** 2020 2025 62% 59‐60% A Baa1 (stable) (stable) *Includes both long‐term and short‐term debt **Excludes $500 million term loan Consolidated Debt Maturity Profile 5 years Liquidity Available as of
December 31, 2020 as of year‐end $1,935 $1,120 $547 Cash $20 $597 $474 $329 $356 Revolving Credit Facility $14 $1,388 $1,100 ($2.25B capacity) 2021 2022 2023 2024 2025 2020 2025 (Projected) 37
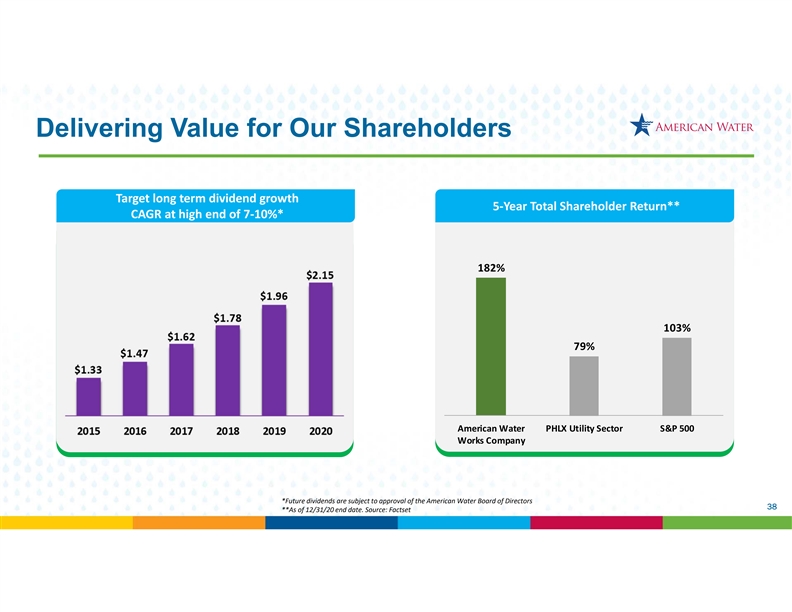
Delivering Value for Our Shareholders
Target long term dividend growth 5‐Year Total Shareholder Return** CAGR at high end of 7‐10%* 182% 103% 79% American Water PHLX Utility Sector S&P 500
Works Company *Future dividends are subject to approval of the American Water Board of Directors 38 **As of 12/31/20 end date. Source: FactsetDelivering
Value for Our Shareholders Target long term dividend growth 5‐Year Total Shareholder Return** CAGR at high end of 7‐10%* 182% 103% 79% American Water PHLX Utility Sector S&P 500 Works Company *Future dividends are subject to approval
of the American Water Board of Directors 38 **As of 12/31/20 end date. Source: Factset
Walter Lynch President and Chief Executive Officer 39Walter Lynch
President and Chief Executive Officer 39
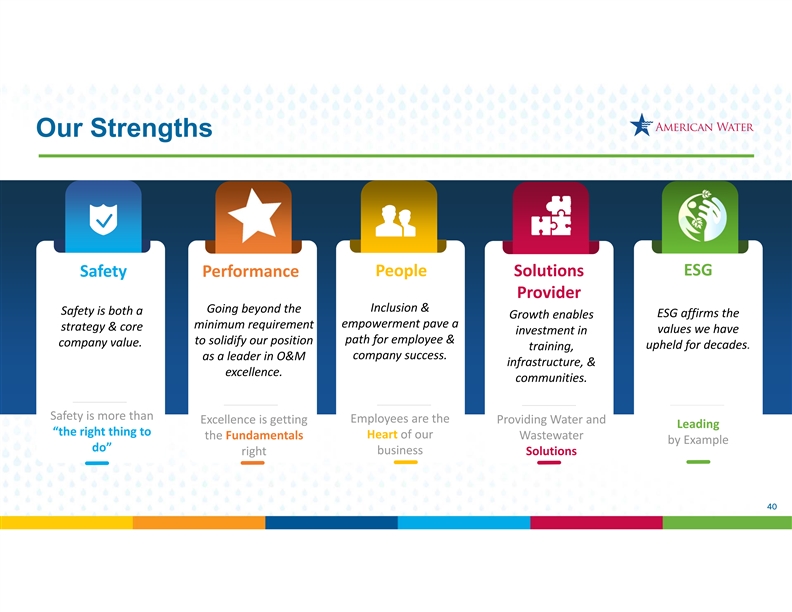
Our Strengths People Solutions ESG Safety Performance Provider
Inclusion & Going beyond the Safety is both a ESG affirms the Growth enables empowerment pave a minimum requirement
strategy & core values we have investment in path for employee & to solidify our position company value. upheld for decades.
training, company success. as a leader in O&M infrastructure, & excellence. communities. Safety is more than Employees are the
Excellence is getting Providing Water and Leading “the right thing to the Fundamentals Heart of our Wastewater by Example do” business right Solutions 40Our
Strengths People Solutions ESG Safety Performance Provider Inclusion & Going beyond the Safety is both a ESG affirms the Growth enables empowerment pave a minimum requirement strategy & core values we have investment in path for employee
& to solidify our position company value. upheld for decades. training, company success. as a leader in O&M infrastructure, & excellence. communities. Safety is more than Employees are the Excellence is getting Providing Water and
Leading “the right thing to the Fundamentals Heart of our Wastewater by Example do” business right Solutions 40
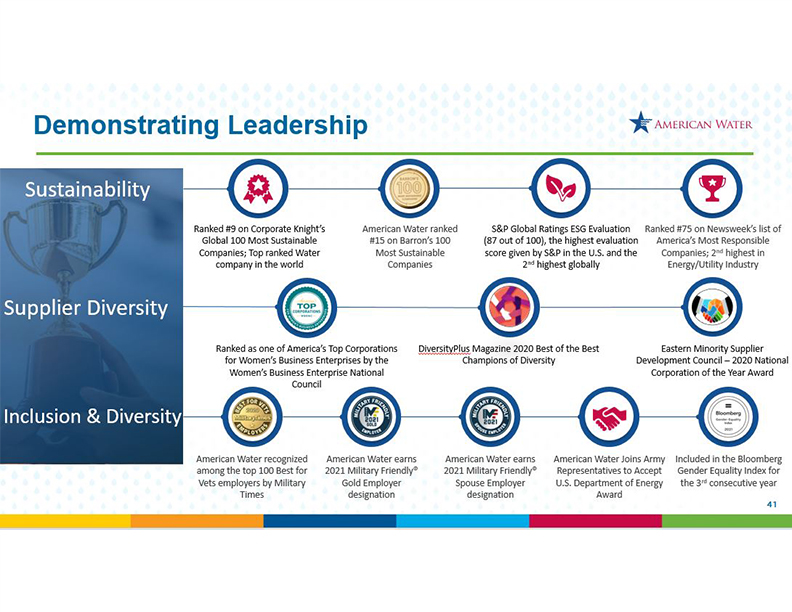
Demonstrating Leadership
Sustainability
Supplier Diversity
Ranked #9on Corporate Knight’s Global 100 Most Sustainable Companies; Top ranked Water company in the world
American Water ranked #15 on Barron’s 100 Most Sustainable Companies
S&P Global Ratings ESG Evaluation Ranked (87 out of 100), the highest evaluation
score given by S&P in the U.S. and the 2nd highest globally
Ranked #75 on Newsweek’s list of America’s Most Responsible Companies; 2nd highest in
Energy/Utility Industry
Ranked as one of America’s Top Corporations
for Women’s Business Enterprises by the Women’s Business Enterprise National Council
DiversityPlusMagazine 2020 Best of the Best Champions of Diversity
Eastern Minority Supplier Development Council –2020 National Corporation of the Year Award
American Water recognized among the top 100 Best for Vets employers by Military Times
American Water earns 2021 Military Friendly® Gold Employer designation
American Water earns 2021 Military Friendly® Spouse Employer designation
American Water Joins Army Representatives to Accept U.S. Department of Energy the Award Included in the Bloomberg
Gender Equality Index for the 3rd consecutive year 41
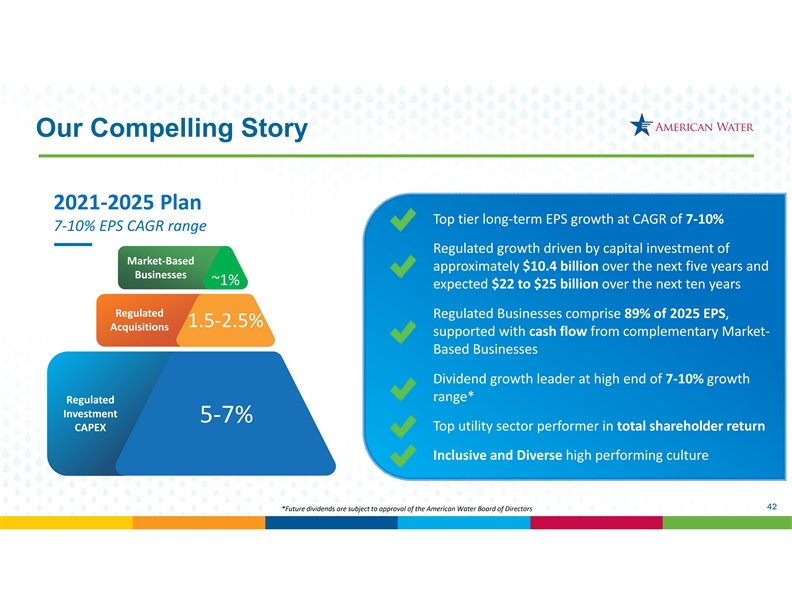
Our Compelling Story 2021‐2025 Plan
Top tier long‐term EPS growth at CAGR of 7‐10% 7‐10% EPS CAGR range Regulated growth driven by capital investment of
Market‐Based approximately $10.4 billion over the next five years and Businesses ~0.5% ~1% expected $22 to $25 billion over the next ten years
Regulated Regulated Businesses comprise 89% of 2025 EPS, 1.5‐2.5% 2‐3% Acquisitions supported with cash flow from complementary Market‐ Based Businesses
Dividend growth leader at high end of 7‐10% growth range* Regulated Investment 5‐7% 5‐7% CAPEX
Top utility sector performer in total shareholder return Inclusive and Diverse high performing culture 42
*Future dividends are subject to approval of the American Water Board of DirectorsOur Compelling Story 2021‐2025 Plan Top tier long‐term EPS growth at CAGR of 7‐10%
7‐10% EPS CAGR range Regulated growth driven by capital investment of Market‐Based approximately $10.4 billion over the next five years and Businesses ~0.5% ~1% expected $22 to $25 billion over the next ten years Regulated Regulated
Businesses comprise 89% of 2025 EPS, 1.5‐2.5% 2‐3% Acquisitions supported with cash flow from complementary Market‐ Based Businesses Dividend growth leader at high end of 7‐10% growth range* Regulated Investment 5‐7%
5‐7% CAPEX Top utility sector performer in total shareholder return Inclusive and Diverse high performing culture 42 *Future dividends are subject to approval of the American Water Board of Directors

5 Minute Break 435 Minute Break 43
Q&A Session 44 44Q&A Session 44 44

Investor Relations Contacts Ed Vallejo Vice President, Investor
Relations [email protected] Michael Tavani, CFA Senior Manager, Investor Relations [email protected] Abbey Barksdale Senior Manager, Investor Relations & ESG [email protected] 45Investor Relations Contacts Ed Vallejo
Vice President, Investor Relations [email protected] Michael Tavani, CFA Senior Manager, Investor Relations [email protected] Abbey Barksdale Senior Manager, Investor Relations & ESG [email protected] 45
Appendix 46 46Appendix 46 46
Forward-Looking Statements
Statements made, referred to or relied upon in this presentation, including, without limitation, with respect to: earnings per share guidance;
dividend growth guidance; the timing and outcome of pending or future acquisition activity; our
future financial performance, liquidity and cash flows; our ability to finance our current operations, capital expenditures and growth initiatives by
accessing the debt and equity capital markets; the impacts to us attributable to the current
pandemic health event resulting from the novel coronavirus (COVID‐19); the amount and allocation of future capital investments and expenditures;
estimated revenues, regulatory recovery and other decisions in general rate cases and other
proceedings; estimates regarding our projected rate base, growth, results of operations and financial condition; our projected regulated adjusted
operation and maintenance efficiency ratio; the expected timing of the completion of the
announced sale of our New York subsidiary and the amount of proceeds or after‐tax gain anticipated to be recognized therefrom; trends
in the industries in which we operate, including macro trends with respect to our efforts related to
customer, technology and work execution; our ability to execute our business and operational strategy; and regulatory, legislative, tax policy or
legal developments, are forward‐looking statements within the meaning of the safe harbor
provisions of the Private Securities Litigation Reform Act of 1995 and the Federal securities laws. In some cases, these forward‐looking
statements can be identified by words with prospective meanings such as “intend,” “plan,” “estimate,”
“believe,” “anticipate,” “expect,” “predict,” “project,” “propose,” “assume,” “forecast,”
“likely”, “uncertain”, “outlook,” “future,” “pending,” “goal,” “objective,” “potential,”
“continue,” “seek to,” “may,” “can,” “will,” “should” and “could” or
the negative of such terms or other variations or similar expressions. These forward‐looking statements are predictions based on
our current expectations and assumptions regarding future events. They are not guarantees or assurances of any
outcomes, financial results, levels of activity, performance or achievements, and readers are cautioned not to place undue reliance upon them.
The forward‐looking statements are subject to a number of estimates and assumptions, known and
unknown risks, uncertainties and other factors. Actual results may vary materially from those discussed in the forward‐looking statements included
in this presentation as a result of the factors discussed in our Annual Report on Form 10‐K for
the year ended December 31, 2020, as filed with the SEC on February 24, 2021, and subsequent filings with the SEC, and because of
factors including, without limitation: the decisions of governmental and regulatory bodies and the outcome of
regulatory commissions’ and other authorities’ actions; changes in customer demand for, and patterns of use of, water; limitations on the
availability of our water supplies or sources of water, or restrictions on its use thereof; a loss of one or
more large industrial or commercial customers; changes in laws, governmental regulations and policies; impacts resulting from
U.S., state and local elections; weather conditions and events, climate variability patterns, and natural disasters,
including drought or abnormally high rainfall, prolonged and abnormal ice or freezing conditions, strong winds, coastal and intercoastal flooding,
pandemics (including COVID‐19) and epidemics, earthquakes, landslides, hurricanes, tornadoes,
wildfires, electrical storms, sinkholes and solar flares; the outcome of litigation and similar governmental and regulatory proceedings, investigations or
actions; risks associated with our aging infrastructure and our ability to appropriately
improve the resiliency of or maintain and replace, current or future infrastructure and systems; exposure or infiltration of our
technology and critical infrastructure systems through physical or cyber attacks or other means; our ability to obtain
permits and other approvals for projects and construction of various water and wastewater facilities; changes in our capital requirements; our
ability to control operating expenses and to achieve efficiencies in our operations; the intentional or
unintentional actions of a third party, including contamination of our water supplies or the water provided to our customers;
our ability to obtain adequate and cost‐effective supplies of equipment, chemicals, electricity, fuel, water and other
raw materials; our ability to successfully meet growth projections for our businesses and capitalize on growth opportunities;
our ability to, among other things, acquire, close and successfully integrate regulated operations and market‐based
businesses, enter into contracts and other agreements with, or otherwise obtain, new customers in the Company’s market‐based businesses, and
realize anticipated benefits and synergies from new acquisitions; risks and uncertainties
associated with contracting with the U.S. government; cost overruns relating to our operations; our ability to successfully develop and implement
new technologies; our ability to maintain safe work sites; our exposure to liabilities related to
environmental laws and similar matters; changes in general economic, political, business and financial market conditions, including with respect to
the COVID‐19 pandemic; access to sufficient debt and/or equity capital on satisfactory terms
and when and as needed to support operations and capital expenditures; fluctuations in interest rates; our ability to comply with negative
and affirmative covenants in our current or future indebtedness; the issuance of new or modified credit
ratings or outlooks by credit rating agencies on us or on our current or future debt; fluctuations in the value of benefit plan
assets and liabilities; changes in federal or state general, income and other tax laws, including future significant tax
legislation, the availability of, or our compliance with, the terms of applicable tax credits and tax abatement programs and the
Company’s ability to utilize its U.S. federal and state income tax net operating loss carryforwards; the use by
municipalities of the power of eminent domain or other authority or the assertion of similar rights by private landowners; our inability to
obtain insurance; the incurrence of impairment charges related to goodwill or other assets; labor actions;
our ability to attract and retain qualified employees; civil disturbances, unrest or terrorist threats or acts; and other factors as may be
set forth in the Company’s SEC filings.
These and other forward‐looking statements are qualified by, and should be read together with, the risks and uncertainties set forth above
and the risk factors and cautionary statements included in our annual, quarterly and other SEC filings,
and readers should refer to such risks, uncertainties, risk factors and statements in evaluating such forward‐looking statements. Any
forward‐looking statements speak only as of the date this presentation was first used or given. We do not
have and do not undertake any obligation or intention to update or revise any forward‐looking statement, whether as a result of new
information, future events, changed circumstances or otherwise, except as otherwise required by the Federal
securities laws. New factors emerge from time to time, and it is not possible for us to predict all such factors. Furthermore, it
may not be possible to assess the impact of any such factor on our businesses, either viewed independently or
together, or the extent to which any factor, or combination of factors, may cause results to differ materially from those contained in
any forward‐looking statement. The foregoing factors should not be construed as exhaustive. 47Forward-Looking Statements Statements made, referred to or relied upon in this presentation,
including, without limitation, with respect to: earnings per share guidance; dividend growth guidance; the timing and outcome of pending or future acquisition activity; our future financial performance, liquidity and cash flows; our ability to
finance our current operations, capital expenditures and growth initiatives by accessing the debt and equity capital markets; the impacts to us attributable to the current pandemic health event resulting from the novel coronavirus (COVID‐19);
the amount and allocation of future capital investments and expenditures; estimated revenues, regulatory recovery and other decisions in general rate cases and other proceedings; estimates regarding our projected rate base, growth, results of
operations and financial condition; our projected regulated adjusted operation and maintenance efficiency ratio; the expected timing of the completion of the announced sale of our New York subsidiary and the amount of proceeds or after‐tax
gain anticipated to be recognized therefrom; trends in the industries in which we operate, including macro trends with respect to our efforts related to customer, technology and work execution; our ability to execute our business and operational
strategy; and regulatory, legislative, tax policy or legal developments, are forward‐looking statements within the meaning of the safe harbor provisions of the Private Securities Litigation Reform Act of 1995 and the Federal securities laws.
In some cases, these forward‐looking statements can be identified by words with prospective meanings such as “intend,” “plan,” “estimate,” “believe,” “anticipate,”
“expect,” “predict,” “project,” “propose,” “assume,” “forecast,” “likely”, “uncertain”, “outlook,” “future,”
“pending,” “goal,” “objective,” “potential,” “continue,” “seek to,” “may,” “can,” “will,” “should” and “could” or the
negative of such terms or other variations or similar expressions. These forward‐looking statements are predictions based on our current expectations and assumptions regarding future events. They are not guarantees or assurances of any
outcomes, financial results, levels of activity, performance or achievements, and readers are cautioned not to place undue reliance upon them. The forward‐looking statements are subject to a number of estimates and assumptions, known and
unknown risks, uncertainties and other factors. Actual results may vary materially from those discussed in the forward‐looking statements included in this presentation as a result of the factors discussed in our Annual Report on Form
10‐K for the year ended December 31, 2020, as filed with the SEC on February 24, 2021, and subsequent filings with the SEC, and because of factors including, without limitation: the decisions of governmental and regulatory bodies and the
outcome of regulatory commissions’ and other authorities’ actions; changes in customer demand for, and patterns of use of, water; limitations on the availability of our water supplies or sources of water, or restrictions on its use
thereof; a loss of one or more large industrial or commercial customers; changes in laws, governmental regulations and policies; impacts resulting from U.S., state and local elections; weather conditions and events, climate variability patterns, and
natural disasters, including drought or abnormally high rainfall, prolonged and abnormal ice or freezing conditions, strong winds, coastal and intercoastal flooding, pandemics (including COVID‐19) and epidemics, earthquakes, landslides,
hurricanes, tornadoes, wildfires, electrical storms, sinkholes and solar flares; the outcome of litigation and similar governmental and regulatory proceedings, investigations or actions; risks associated with our aging infrastructure and our ability
to appropriately improve the resiliency of or maintain and replace, current or future infrastructure and systems; exposure or infiltration of our technology and critical infrastructure systems through physical or cyber attacks or other means; our
ability to obtain permits and other approvals for projects and construction of various water and wastewater facilities; changes in our capital requirements; our ability to control operating expenses and to achieve efficiencies in our operations; the
intentional or unintentional actions of a third party, including contamination of our water supplies or the water provided to our customers; our ability to obtain adequate and cost‐effective supplies of equipment, chemicals, electricity, fuel,
water and other raw materials; our ability to successfully meet growth projections for our businesses and capitalize on growth opportunities; our ability to, among other things, acquire, close and successfully integrate regulated operations and
market‐based businesses, enter into contracts and other agreements with, or otherwise obtain, new customers in the Company’s market‐based businesses, and realize anticipated benefits and synergies from new acquisitions; risks and
uncertainties associated with contracting with the U.S. government; cost overruns relating to our operations; our ability to successfully develop and implement new technologies; our ability to maintain safe work sites; our exposure to liabilities
related to environmental laws and similar matters; changes in general economic, political, business and financial market conditions, including with respect to the COVID‐19 pandemic; access to sufficient debt and/or equity capital on
satisfactory terms and when and as needed to support operations and capital expenditures; fluctuations in interest rates; our ability to comply with negative and affirmative covenants in our current or future indebtedness; the issuance of new or
modified credit ratings or outlooks by credit rating agencies on us or on our current or future debt; fluctuations in the value of benefit plan assets and liabilities; changes in federal or state general, income and other tax laws, including future
significant tax legislation, the availability of, or our compliance with, the terms of applicable tax credits and tax abatement programs and the Company’s ability to utilize its U.S. federal and state income tax net operating loss
carryforwards; the use by municipalities of the power of eminent domain or other authority or the assertion of similar rights by private landowners; our inability to obtain insurance; the incurrence of impairment charges related to goodwill or other
assets; labor actions; our ability to attract and retain qualified employees; civil disturbances, unrest or terrorist threats or acts; and other factors as may be set forth in the Company’s SEC filings. These and other forward‐looking
statements are qualified by, and should be read together with, the risks and uncertainties set forth above and the risk factors and cautionary statements included in our annual, quarterly and other SEC filings, and readers should refer to such
risks, uncertainties, risk factors and statements in evaluating such forward‐looking statements. Any forward‐looking statements speak only as of the date this presentation was first used or given. We do not have and do not undertake any
obligation or intention to update or revise any forward‐looking statement, whether as a result of new information, future events, changed circumstances or otherwise, except as otherwise required by the Federal securities laws. New factors
emerge from time to time, and it is not possible for us to predict all such factors. Furthermore, it may not be possible to assess the impact of any such factor on our businesses, either viewed independently or together, or the extent to which any
factor, or combination of factors, may cause results to differ materially from those contained in any forward‐looking statement. The foregoing factors should not be construed as exhaustive. 47
Non-GAAP Financial Information
This presentation includes adjusted regulated segment O&M efficiency ratios, both historical and forward‐looking, which, in addition to the pro
forma adjustment for the impact of the Tax Cuts and Jobs Act (the “TCJA”), excludes from its
calculation (i) estimated purchased water and other revenues and purchased water expenses, (ii) the impact of the Freedom Industries chemical
spill in 2014 and certain related settlement activities recognized in 2016, 2018 and 2019, (iii) the
estimated impact in 2012 and 2014 of weather, and (iv) the allocable portion of non‐O&M support services costs, mainly depreciation
and general taxes. Also, an alternative presentation of this ratio has been provided for each of 2010, 2012,
2014 and 2016 which includes the pro forma adjustment for the impact of the TCJA and includes for 2012, 2014 and 2016 the impact
of our implementation of Accounting Standards Update 2017‐07, Compensation ‐ Retirement Benefits
(Topic 715): Improving the Presentation of Net Periodic Pension Cost and Net Periodic Post‐retirement Benefit, on January 1, 2018. These
adjusted O&M efficiency ratios constitute “non‐GAAP financial measures” under SEC rules. We
evaluate our operating performance using these ratios and believe that the presentation of them is useful to investors because the ratios
directly measure improvement in the operating performance and efficiency of our regulated
businesses. These ratios are derived from our consolidated financial information but are not presented in our consolidated financial statements
prepared in accordance with GAAP. These non‐GAAP financial measures supplement and should
be read in conjunction with our GAAP disclosures and should be considered as an addition to, and not a substitute for, any GAAP
measure. These ratios (i) are not accounting measures based on GAAP; (ii) are not based on a standard,
objective industry definition or method of calculation; (iii) may not be comparable to other companies’ operating measures; and (iv) should
not be used in place of the GAAP information provided elsewhere in this presentation. Management
is unable to present a reconciliation of adjustments to the components of the forward‐looking O&M efficiency ratio without unreasonable
effort because management cannot reliably predict the nature, amount or probable significance of all
the adjustments for future periods; however, these adjustments may, individually or in the aggregate, cause the non‐GAAP financial measure
component of the forward‐looking ratio to differ significantly from the most directly comparable GAAP financial measure.
Set forth in this appendix are tables that reconcile each of the components of our historical O&M efficiency ratios to its most
directly comparable GAAP financial measure. All references throughout this presentation to EPS refer to diluted EPS attributable to common shareholders.
48Non-GAAP Financial Information This presentation includes adjusted regulated segment O&M efficiency ratios, both historical and forward‐looking, which, in addition to the pro forma adjustment for the impact of the Tax Cuts and Jobs Act
(the “TCJA”), excludes from its calculation (i) estimated purchased water and other revenues and purchased water expenses, (ii) the impact of the Freedom Industries chemical spill in 2014 and certain related settlement activities
recognized in 2016, 2018 and 2019, (iii) the estimated impact in 2012 and 2014 of weather, and (iv) the allocable portion of non‐O&M support services costs, mainly depreciation and general taxes. Also, an alternative presentation of this
ratio has been provided for each of 2010, 2012, 2014 and 2016 which includes the pro forma adjustment for the impact of the TCJA and includes for 2012, 2014 and 2016 the impact of our implementation of Accounting Standards Update 2017‐07,
Compensation ‐ Retirement Benefits (Topic 715): Improving the Presentation of Net Periodic Pension Cost and Net Periodic Post‐retirement Benefit, on January 1, 2018. These adjusted O&M efficiency ratios constitute
“non‐GAAP financial measures” under SEC rules. We evaluate our operating performance using these ratios and believe that the presentation of them is useful to investors because the ratios directly measure improvement in the
operating performance and efficiency of our regulated businesses. These ratios are derived from our consolidated financial information but are not presented in our consolidated financial statements prepared in accordance with GAAP. These
non‐GAAP financial measures supplement and should be read in conjunction with our GAAP disclosures and should be considered as an addition to, and not a substitute for, any GAAP measure. These ratios (i) are not accounting measures based on
GAAP; (ii) are not based on a standard, objective industry definition or method of calculation; (iii) may not be comparable to other companies’ operating measures; and (iv) should not be used in place of the GAAP information provided elsewhere
in this presentation. Management is unable to present a reconciliation of adjustments to the components of the forward‐looking O&M efficiency ratio without unreasonable effort because management cannot reliably predict the nature, amount
or probable significance of all the adjustments for future periods; however, these adjustments may, individually or in the aggregate, cause the non‐GAAP financial measure component of the forward‐looking ratio to differ significantly
from the most directly comparable GAAP financial measure. Set forth in this appendix are tables that reconcile each of the components of our historical O&M efficiency ratios to its most directly comparable GAAP financial measure. All references
throughout this presentation to EPS refer to diluted EPS attributable to common shareholders. 48
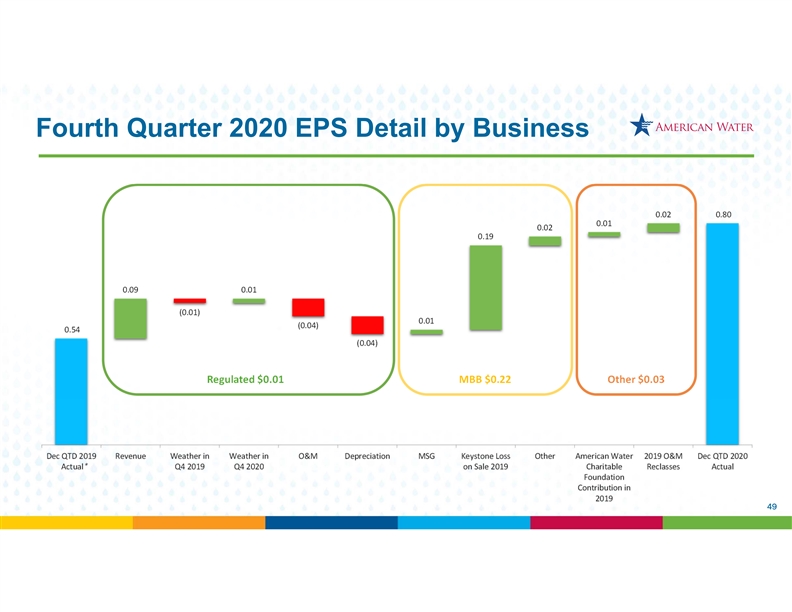
Fourth Quarter 2020 EPS Detail by Business Regulated $0.01
MBB $0.22 Other $0.03 * 49Fourth Quarter 2020 EPS Detail by Business Regulated $0.01 MBB $0.22 Other $0.03 * 49
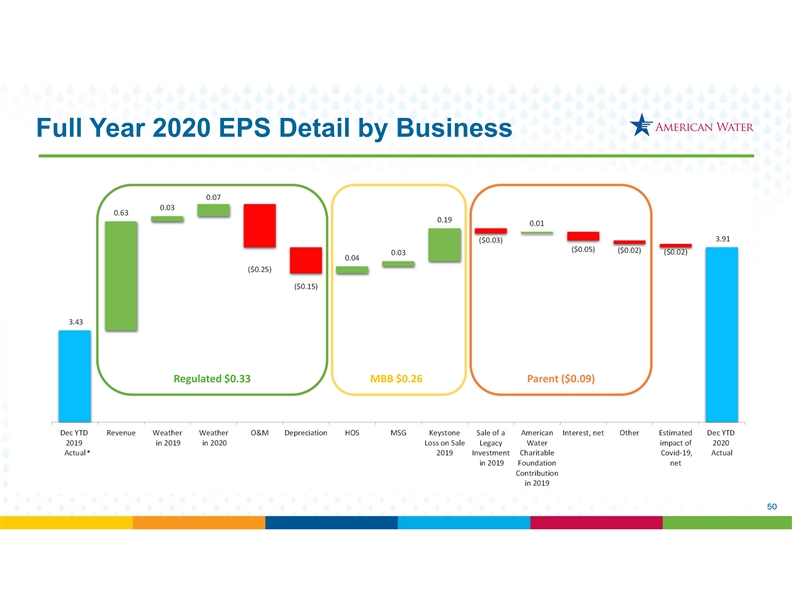
Full Year 2020 EPS Detail by Business Regulated $0.33
MBB $0.26 Parent ($0.09) * 50Full Year 2020 EPS Detail by Business Regulated $0.33 MBB $0.26 Parent ($0.09) * 50
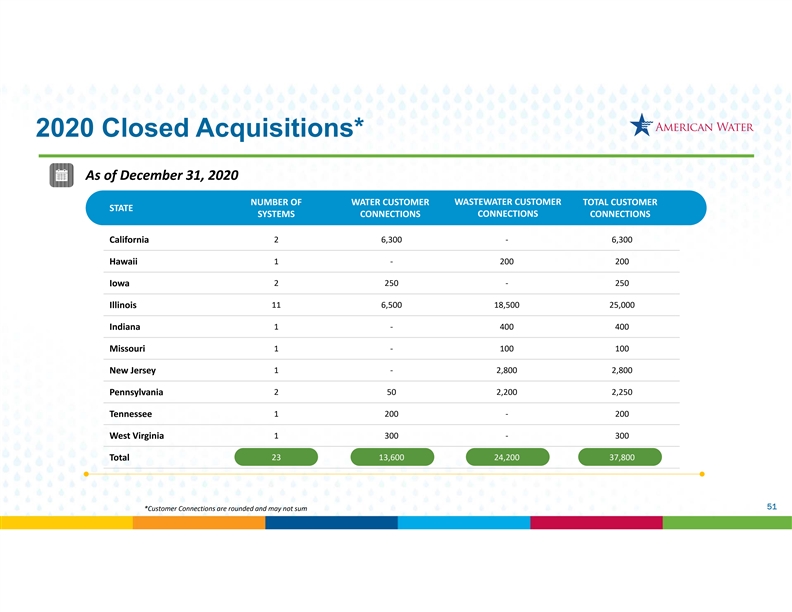
2020 Closed Acquisitions* As of December 31, 2020
NUMBER OF WATER CUSTOMER WASTEWATER CUSTOMER TOTAL CUSTOMER STATE SYSTEMS CONNECTIONS CONNECTIONS CONNECTIONS California 2 6,300 ‐ 6,300 1 ‐ 200 200 Hawaii Iowa 2 250 ‐ 250 Illinois
11 6,500 18,500 25,000 Indiana 1 ‐ 400 400 1 ‐ 100 100 Missouri 1 ‐ 2,800 2,800 New Jersey Pennsylvania 2 50 2,200 2,250 Tennessee 1 200 ‐ 200 West Virginia 1 300 ‐ 300 23 13,600 24,200 37,800 Total 51
*Customer Connections are rounded and may not sum2020 Closed Acquisitions* As of December 31, 2020 NUMBER OF WATER CUSTOMER WASTEWATER CUSTOMER TOTAL CUSTOMER STATE SYSTEMS CONNECTIONS CONNECTIONS CONNECTIONS
California 2 6,300 ‐ 6,300 1 ‐ 200 200 Hawaii Iowa 2 250 ‐ 250 Illinois 11 6,500 18,500 25,000 Indiana 1 ‐ 400 400 1 ‐ 100 100 Missouri 1 ‐ 2,800 2,800 New Jersey Pennsylvania 2 50 2,200 2,250 Tennessee 1 200
‐ 200 West Virginia 1 300 ‐ 300 23 13,600 24,200 37,800 Total 51 *Customer Connections are rounded and may not sum
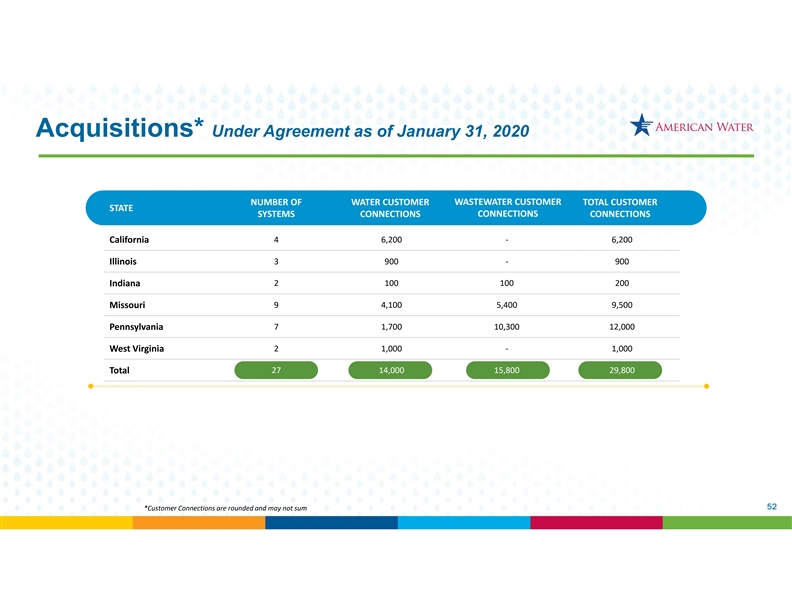
Acquisitions* Under Agreement as of January 31, 2020
NUMBER OF WATER CUSTOMER WASTEWATER CUSTOMER TOTAL CUSTOMER STATE SYSTEMS CONNECTIONS CONNECTIONS CONNECTIONS California 4 6,200 ‐ 6,200 3 900 ‐ 900 Illinois Indiana 2 100 100 200
Missouri 9 4,100 5,400 9,500 Pennsylvania 7 1,700 10,300 12,000 2 1,000 ‐ 1,000 West Virginia 27 14,000 15,800 29,800 Total 52 *Customer Connections are rounded and may not sumAcquisitions* Under
Agreement as of January 31, 2020 NUMBER OF WATER CUSTOMER WASTEWATER CUSTOMER TOTAL CUSTOMER STATE SYSTEMS CONNECTIONS CONNECTIONS CONNECTIONS California 4 6,200 ‐ 6,200 3 900 ‐ 900 Illinois Indiana 2 100 100 200 Missouri 9 4,100 5,400
9,500 Pennsylvania 7 1,700 10,300 12,000 2 1,000 ‐ 1,000 West Virginia 27 14,000 15,800 29,800 Total 52 *Customer Connections are rounded and may not sum
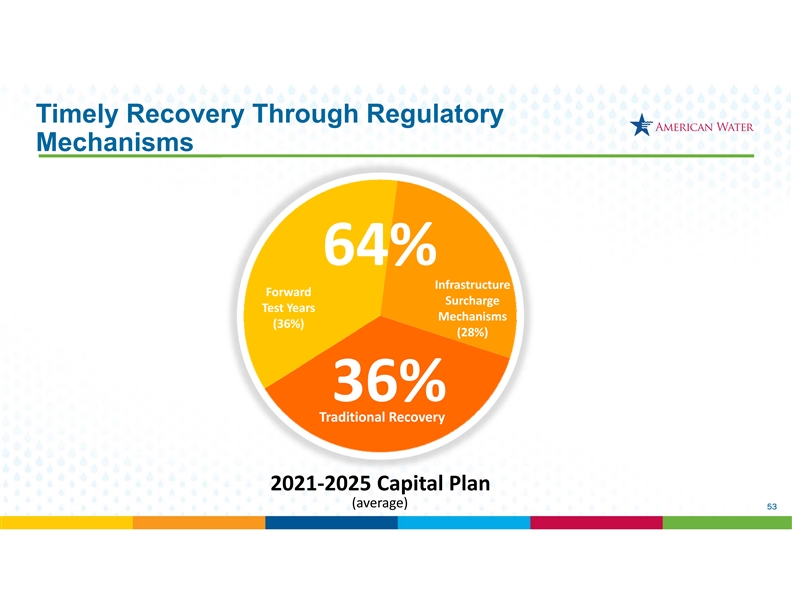
Timely Recovery Through Regulatory Mechanisms 64% Infrastructure
Forward Surcharge Test Years Mechanisms (36%) (28%) 36% Traditional Recovery 2021‐2025 Capital Plan (average) 53Timely Recovery Through Regulatory Mechanisms 64% Infrastructure Forward Surcharge Test
Years Mechanisms (36%) (28%) 36% Traditional Recovery 2021‐2025 Capital Plan (average) 53
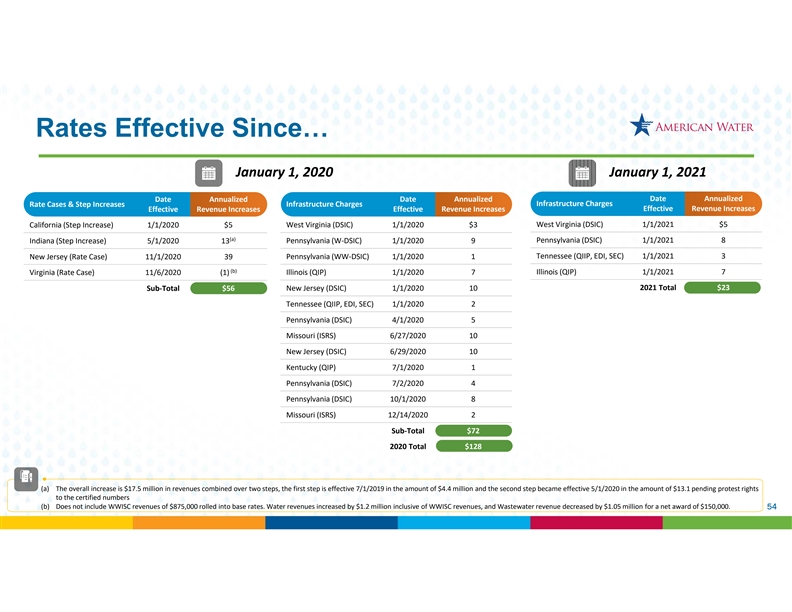
Rates Effective Since… January 1, 2020
January 1, 2021 Date Annualized Date Annualized Date Annualized Infrastructure Charges Rate Cases & Step Increases Infrastructure Charges Effective
Revenue Increases Effective Revenue Increases Effective Revenue Increases West Virginia (DSIC) 1/1/2020 $3 West Virginia (DSIC) 1/1/2021 $5 California (Step Increase) 1/1/2020 $5 (a)
Indiana (Step Increase) 5/1/2020 13 Pennsylvania (W‐DSIC) 1/1/2020 9 Pennsylvania (DSIC) 1/1/2021 8 New Jersey (Rate Case) 11/1/2020 39 Pennsylvania (WW‐DSIC) 1/1/2020 1
Tennessee (QIIP, EDI, SEC) 1/1/2021 3 (b) Illinois (QIP) 1/1/2021 7 Virginia (Rate Case) 11/6/2020 (1) Illinois (QIP) 1/1/2020 7 2021 Total $23 Sub‐Total $56 New Jersey (DSIC) 1/1/2020 10
Tennessee (QIIP, EDI, SEC) 1/1/2020 2 Pennsylvania (DSIC) 4/1/2020 5 Missouri (ISRS) 6/27/2020 10 New Jersey (DSIC) 6/29/2020 10 Kentucky (QIP) 7/1/2020 1 Pennsylvania (DSIC) 7/2/2020 4
Pennsylvania (DSIC) 10/1/2020 8 Missouri (ISRS) 12/14/2020 2 Sub‐Total $72 2020 Total $128 (a)
The overall increase is $17.5 million in revenues combined over two steps, the first step is effective 7/1/2019 in the amount of
$4.4 million and the second step became effective 5/1/2020 in the amount of $13.1 pending protest rights to the certified numbers (b)
Does not include WWISC revenues of $875,000 rolled into base rates. Water revenues increased by $1.2 million inclusive of WWISC revenues,
and Wastewater revenue decreased by $1.05 million for a net award of $150,000. 54Rates Effective Since… January 1, 2020 January 1, 2021 Date Annualized Date Annualized Date Annualized
Infrastructure Charges Rate Cases & Step Increases Infrastructure Charges Effective Revenue Increases Effective Revenue Increases Effective Revenue Increases West Virginia (DSIC) 1/1/2020 $3 West Virginia (DSIC) 1/1/2021 $5 California (Step
Increase) 1/1/2020 $5 (a) Indiana (Step Increase) 5/1/2020 13 Pennsylvania (W‐DSIC) 1/1/2020 9 Pennsylvania (DSIC) 1/1/2021 8 New Jersey (Rate Case) 11/1/2020 39 Pennsylvania (WW‐DSIC) 1/1/2020 1 Tennessee (QIIP, EDI, SEC) 1/1/2021 3 (b)
Illinois (QIP) 1/1/2021 7 Virginia (Rate Case) 11/6/2020 (1) Illinois (QIP) 1/1/2020 7 2021 Total $23 Sub‐Total $56 New Jersey (DSIC) 1/1/2020 10 Tennessee (QIIP, EDI, SEC) 1/1/2020 2 Pennsylvania (DSIC) 4/1/2020 5 Missouri (ISRS) 6/27/2020 10
New Jersey (DSIC) 6/29/2020 10 Kentucky (QIP) 7/1/2020 1 Pennsylvania (DSIC) 7/2/2020 4 Pennsylvania (DSIC) 10/1/2020 8 Missouri (ISRS) 12/14/2020 2 Sub‐Total $72 2020 Total $128 (a) The overall increase is $17.5 million in revenues combined
over two steps, the first step is effective 7/1/2019 in the amount of $4.4 million and the second step became effective 5/1/2020 in the amount of $13.1 pending protest rights to the certified numbers (b) Does not include WWISC revenues of $875,000
rolled into base rates. Water revenues increased by $1.2 million inclusive of WWISC revenues, and Wastewater revenue decreased by $1.05 million for a net award of $150,000. 54
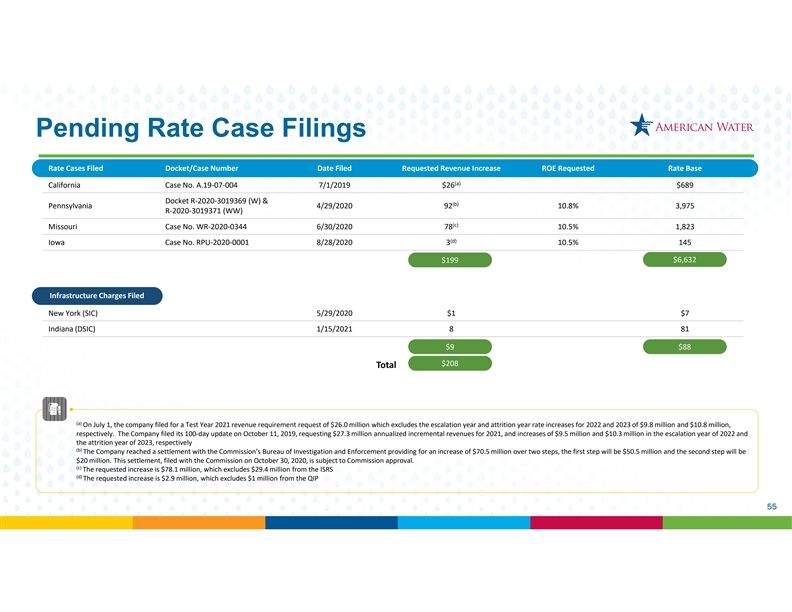
Pending Rate Case Filings Rate Cases Filed
Docket/Case Number Date Filed Requested Revenue Increase ROE Requested Rate Base (a) California Case No. A.19‐07‐004 7/1/2019 $26 $689
Docket R‐2020‐3019369 (W) & (b) Pennsylvania 4/29/2020 92 10.8% 3,975 R‐2020‐3019371 (WW) (c) Missouri Case No. WR‐2020‐0344 6/30/2020 78 10.5% 1,823 (d) Iowa
Case No. RPU‐2020‐0001 8/28/2020 3 10.5% 145 $6,632 $199 Infrastructure Charges Filed New York (SIC) 5/29/2020 $1 $7 Indiana (DSIC) 1/15/2021 8 81 $9 $88 $208 Total (a)
On July 1, the company filed for a Test Year 2021 revenue requirement request of $26.0 million which excludes the escalation year and
attrition year rate increases for 2022 and 2023 of $9.8 million and $10.8 million,
respectively. The Company filed its 100‐day update on October 11, 2019, requesting $27.3 million annualized incremental revenues for 2021,
and increases of $9.5 million and $10.3 million in the escalation year of 2022 and the attrition year of 2023, respectively (b)
The Company reached a settlement with the Commission’s Bureau of Investigation and Enforcement providing for an increase of $70.5 million
over two steps, the first step will be $50.5 million and the second step will be
$20 million. This settlement, filed with the Commission on October 30, 2020, is subject to Commission approval. (c)
The requested increase is $78.1 million, which excludes $29.4 million from the ISRS (d)
The requested increase is $2.9 million, which excludes $1 million from the QIP 55Pending Rate Case Filings Rate Cases Filed Docket/Case Number Date Filed Requested Revenue Increase ROE
Requested Rate Base (a) California Case No. A.19‐07‐004 7/1/2019 $26 $689 Docket R‐2020‐3019369 (W) & (b) Pennsylvania 4/29/2020 92 10.8% 3,975 R‐2020‐3019371 (WW) (c) Missouri Case No.
WR‐2020‐0344 6/30/2020 78 10.5% 1,823 (d) Iowa Case No. RPU‐2020‐0001 8/28/2020 3 10.5% 145 $6,632 $199 Infrastructure Charges Filed New York (SIC) 5/29/2020 $1 $7 Indiana (DSIC) 1/15/2021 8 81 $9 $88 $208 Total (a) On July
1, the company filed for a Test Year 2021 revenue requirement request of $26.0 million which excludes the escalation year and attrition year rate increases for 2022 and 2023 of $9.8 million and $10.8 million, respectively. The Company filed its
100‐day update on October 11, 2019, requesting $27.3 million annualized incremental revenues for 2021, and increases of $9.5 million and $10.3 million in the escalation year of 2022 and the attrition year of 2023, respectively (b) The Company
reached a settlement with the Commission’s Bureau of Investigation and Enforcement providing for an increase of $70.5 million over two steps, the first step will be $50.5 million and the second step will be $20 million. This settlement, filed
with the Commission on October 30, 2020, is subject to Commission approval. (c) The requested increase is $78.1 million, which excludes $29.4 million from the ISRS (d) The requested increase is $2.9 million, which excludes $1 million from the QIP
55
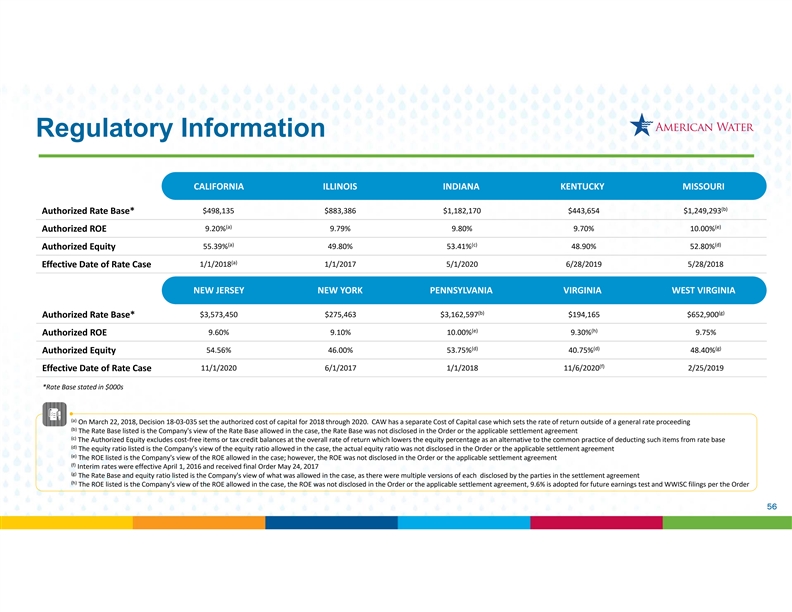
Regulatory Information CALIFORNIA ILLINOIS INDIANA KENTUCKY MISSOURI
(b) $498,135 $883,386 $1,182,170 $443,654 $1,249,293 Authorized Rate Base* (a) (e) 9.20% 9.79% 9.80% 9.70% 10.00% Authorized ROE (a) (c) (d) 55.39% 49.80% 53.41% 48.90% 52.80% Authorized Equity (a)
Effective Date of Rate Case 1/1/2018 1/1/2017 5/1/2020 6/28/2019 5/28/2018 NEW JERSEY NEW YORK PENNSYLVANIA VIRGINIA WEST VIRGINIA (b) (g) $3,573,450 $275,463 $3,162,597 $194,165 $652,900
Authorized Rate Base* (e) (h) 9.60% 9.10% 10.00% 9.30% 9.75% Authorized ROE (d) (d) (g) Authorized Equity 54.56% 46.00% 53.75% 40.75% 48.40% (f) Effective Date of Rate Case 11/1/2020 6/1/2017 1/1/2018
11/6/2020 2/25/2019 *Rate Base stated in $000s (a)
On March 22, 2018, Decision 18‐03‐035 set the authorized cost of capital for 2018 through 2020. CAW has a separate Cost
of Capital case which sets the rate of return outside of a general rate proceeding (b)
The Rate Base listed is the Company's view of the Rate Base allowed in the case, the Rate Base was not disclosed in the Order
or the applicable settlement agreement (c)
The Authorized Equity excludes cost‐free items or tax credit balances at the overall rate of return which lowers the equity percentage
as an alternative to the common practice of deducting such items from rate base (d)
The equity ratio listed is the Company's view of the equity ratio allowed in the case, the actual equity ratio was not disclosed
in the Order or the applicable settlement agreement (e)
The ROE listed is the Company's view of the ROE allowed in the case; however, the ROE was not disclosed in the Order or the
applicable settlement agreement (f) Interim rates were effective April 1, 2016 and received final Order May 24, 2017 (g)
The Rate Base and equity ratio listed is the Company's view of what was allowed in the case, as there were multiple versions of
each disclosed by the parties in the settlement agreement (h)
The ROE listed is the Company's view of the ROE allowed in the case, the ROE was not disclosed in the Order or the applicable
settlement agreement, 9.6% is adopted for future earnings test and WWISC filings per the Order 56Regulatory Information CALIFORNIA ILLINOIS INDIANA KENTUCKY MISSOURI (b)
$498,135 $883,386 $1,182,170 $443,654 $1,249,293 Authorized Rate Base* (a) (e) 9.20% 9.79% 9.80% 9.70% 10.00% Authorized ROE (a) (c) (d) 55.39% 49.80% 53.41% 48.90% 52.80% Authorized Equity (a) Effective Date of Rate Case 1/1/2018 1/1/2017 5/1/2020
6/28/2019 5/28/2018 NEW JERSEY NEW YORK PENNSYLVANIA VIRGINIA WEST VIRGINIA (b) (g) $3,573,450 $275,463 $3,162,597 $194,165 $652,900 Authorized Rate Base* (e) (h) 9.60% 9.10% 10.00% 9.30% 9.75% Authorized ROE (d) (d) (g) Authorized Equity 54.56%
46.00% 53.75% 40.75% 48.40% (f) Effective Date of Rate Case 11/1/2020 6/1/2017 1/1/2018 11/6/2020 2/25/2019 *Rate Base stated in $000s (a) On March 22, 2018, Decision 18‐03‐035 set the authorized cost of capital for 2018 through 2020.
CAW has a separate Cost of Capital case which sets the rate of return outside of a general rate proceeding (b) The Rate Base listed is the Company's view of the Rate Base allowed in the case, the Rate Base was not disclosed in the Order or the
applicable settlement agreement (c) The Authorized Equity excludes cost‐free items or tax credit balances at the overall rate of return which lowers the equity percentage as an alternative to the common practice of deducting such items from
rate base (d) The equity ratio listed is the Company's view of the equity ratio allowed in the case, the actual equity ratio was not disclosed in the Order or the applicable settlement agreement (e) The ROE listed is the Company's view of the ROE
allowed in the case; however, the ROE was not disclosed in the Order or the applicable settlement agreement (f) Interim rates were effective April 1, 2016 and received final Order May 24, 2017 (g) The Rate Base and equity ratio listed is the
Company's view of what was allowed in the case, as there were multiple versions of each disclosed by the parties in the settlement agreement (h) The ROE listed is the Company's view of the ROE allowed in the case, the ROE was not disclosed in the
Order or the applicable settlement agreement, 9.6% is adopted for future earnings test and WWISC filings per the Order 56
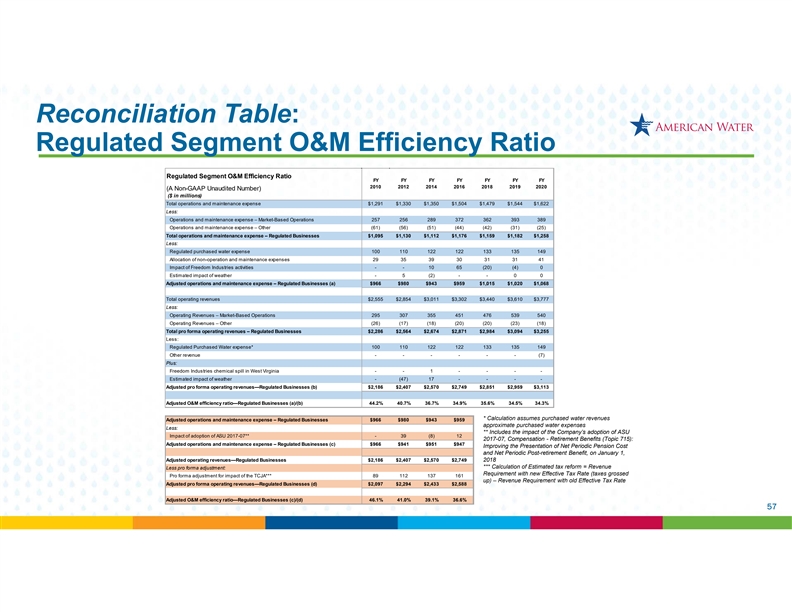
Reconciliation Table: Regulated Segment O&M Efficiency Ratio
Regulated Segment O&M Efficiency Ratio FY FY FY FY FY FY FY 2010 2012 2014 2016 2018 2019 2020 (A Non-GAAP Unaudited Number) ($ in millions) Total operations and maintenance expense $1,291 $1,330 $1,350 $1,504 $1,479 $1,544 $1,622 Less:
Operations and maintenance expense – Market-Based Operations 257 256 289 372 362 393 389 Operations and maintenance expense – Other (61) (56) (51) (44) (42) (31) (25) Total operations and maintenance expense – Regulated Businesses
$1,095 $1,130 $1,112 $1,176 $1,159 $1,182 $1,258 Less: Regulated purchased water expense 100 110 122 122 133 135 149 Allocation of non-operation and maintenance expenses 29 35 39 30 31 31 41 Impact of Freedom Industries activities - - 10 65 (20) (4)
0 Estimated impact of weather - 5 (2) - - 0 0 Adjusted operations and maintenance expense – Regulated Businesses (a) $966 $980 $943 $959 $1,015 $1,020 $1,068 Total operating revenues $2,555 $2,854 $3,011 $3,302 $3,440 $3,610 $3,777 Less:
Operating Revenues – Market-Based Operations 295 307 355 451 476 539 540 Operating Revenues – Other (26) (17) (18) (20) (20) (23) (18) Total pro forma operating revenues – Regulated Businesses $2,286 $2,564 $2,674 $2,871 $2,984
$3,094 $3,255 Less: Regulated Purchased Water expense* 100 110 122 122 133 135 149 Other revenue --- --- (7) Plus: Freedom Industries chemical spill in West Virginia - - 1 - - - - Estimated impact of weather - (47) 17 - - - - Adjusted pro forma
operating revenues—Regulated Businesses (b) $2,186 $2,407 $2,570 $2,749 $2,851 $2,959 $3,113 Adjusted O&M efficiency ratio—Regulated Businesses (a)/(b) 44.2% 40.7% 36.7% 34.9% 35.6% 34.5% 34.3% * Calculation assumes purchased water
revenues Adjusted operations and maintenance expense – Regulated Businesses $966 $980 $943 $959 approximate purchased water expenses Less: ** Includes the impact of the Company’s adoption of ASU Impact of adoption of ASU 2017-07** - 39
(8) 12 2017-07, Compensation - Retirement Benefits (Topic 715): Adjusted operations and maintenance expense – Regulated Businesses (c) $966 $941 $951 $947 Improving the Presentation of Net Periodic Pension Cost and Net Periodic Post-retirement
Benefit, on January 1, Adjusted operating revenues—Regulated Businesses $2,186 $2,407 $2,570 $2,749 2018 *** Calculation of Estimated tax reform = Revenue Less pro forma adjustment: Requirement with new Effective Tax Rate (taxes grossed Pro
forma adjustment for impact of the TCJA*** 89 112 137 161 up) – Revenue Requirement with old Effective Tax Rate Adjusted pro forma operating revenues—Regulated Businesses (d) $2,097 $2,294 $2,433 $2,588 Adjusted O&M efficiency
ratio—Regulated Businesses (c)/(d) 46.1% 41.0% 39.1% 36.6% 57Reconciliation Table: Regulated Segment O&M Efficiency Ratio Regulated Segment O&M Efficiency Ratio FY FY FY FY FY FY FY 2010 2012 2014 2016 2018 2019 2020 (A Non-GAAP
Unaudited Number) ($ in millions) Total operations and maintenance expense $1,291 $1,330 $1,350 $1,504 $1,479 $1,544 $1,622 Less: Operations and maintenance expense – Market-Based Operations 257 256 289 372 362 393 389 Operations and
maintenance expense – Other (61) (56) (51) (44) (42) (31) (25) Total operations and maintenance expense – Regulated Businesses $1,095 $1,130 $1,112 $1,176 $1,159 $1,182 $1,258 Less: Regulated purchased water expense 100 110 122 122 133
135 149 Allocation of non-operation and maintenance expenses 29 35 39 30 31 31 41 Impact of Freedom Industries activities - - 10 65 (20) (4) 0 Estimated impact of weather - 5 (2) - - 0 0 Adjusted operations and maintenance expense – Regulated
Businesses (a) $966 $980 $943 $959 $1,015 $1,020 $1,068 Total operating revenues $2,555 $2,854 $3,011 $3,302 $3,440 $3,610 $3,777 Less: Operating Revenues – Market-Based Operations 295 307 355 451 476 539 540 Operating Revenues – Other
(26) (17) (18) (20) (20) (23) (18) Total pro forma operating revenues – Regulated Businesses $2,286 $2,564 $2,674 $2,871 $2,984 $3,094 $3,255 Less: Regulated Purchased Water expense* 100 110 122 122 133 135 149 Other revenue --- --- (7) Plus:
Freedom Industries chemical spill in West Virginia - - 1 - - - - Estimated impact of weather - (47) 17 - - - - Adjusted pro forma operating revenues—Regulated Businesses (b) $2,186 $2,407 $2,570 $2,749 $2,851 $2,959 $3,113 Adjusted O&M
efficiency ratio—Regulated Businesses (a)/(b) 44.2% 40.7% 36.7% 34.9% 35.6% 34.5% 34.3% * Calculation assumes purchased water revenues Adjusted operations and maintenance expense – Regulated Businesses $966 $980 $943 $959 approximate
purchased water expenses Less: ** Includes the impact of the Company’s adoption of ASU Impact of adoption of ASU 2017-07** - 39 (8) 12 2017-07, Compensation - Retirement Benefits (Topic 715): Adjusted operations and maintenance expense –
Regulated Businesses (c) $966 $941 $951 $947 Improving the Presentation of Net Periodic Pension Cost and Net Periodic Post-retirement Benefit, on January 1, Adjusted operating revenues—Regulated Businesses $2,186 $2,407 $2,570 $2,749 2018 ***
Calculation of Estimated tax reform = Revenue Less pro forma adjustment: Requirement with new Effective Tax Rate (taxes grossed Pro forma adjustment for impact of the TCJA*** 89 112 137 161 up) – Revenue Requirement with old Effective Tax Rate
Adjusted pro forma operating revenues—Regulated Businesses (d) $2,097 $2,294 $2,433 $2,588 Adjusted O&M efficiency ratio—Regulated Businesses (c)/(d) 46.1% 41.0% 39.1% 36.6% 57
