8-K
false 0001410636 0001410636 2021-11-02 2021-11-02


UNITED STATES

SECURITIES AND EXCHANGE COMMISSION

Washington, D.C. 20549


Form 8-K


Current Report

Pursuant to Section 13 or 15(d)

of the Securities Exchange Act of 1934

Date of Report (Date of earliest event reported): November 2, 2021


American Water Works Company, Inc.

(Exact name of registrant as specified in its charter)


Commission File Number: 001-34028


Delaware   51-0063696

(State or other jurisdiction

of incorporation)


(IRS Employer

Identification No.)

1 Water Street

Camden, NJ 08102-1658

(Address of principal executive offices, including zip code)

(856) 955-4001

(Registrant’s telephone number, including area code)


Check the appropriate box below if the Form 8-K filing is intended to simultaneously satisfy the filing obligation of the registrant under any of the following provisions:


Written communications pursuant to Rule 425 under the Securities Act (17 CFR 230.425)


Soliciting material pursuant to Rule 14a-12 under the Exchange Act (17 CFR 240.14a-12)


Pre-commencement communications pursuant to Rule 14d-2(b) under the Exchange Act (17 CFR 240.14d-2(b))


Pre-commencement communications pursuant to Rule 13e-4(c) under the Exchange Act (17 CFR 240.13e-4(c))

Securities registered pursuant to Section 12(b) of the Act:


Title of Each Class


Trading

Symbol


Name of Each Exchange

on Which Registered

Common stock, par value $0.01 per share   AWK   New York Stock Exchange

Indicate by check mark whether the registrant is an emerging growth company as defined in Rule 405 of the Securities Act of 1933 (17 CFR 230.405) or Rule 12b-2 of the Securities Exchange Act of 1934 (17 CFR 240.12b-2).

Emerging growth company

If an emerging growth company, indicate by check mark if the registrant has elected not to use the extended transition period for complying with any new or revised financial accounting standards provided pursuant to Section 13(a) of the Exchange Act. ☐


Item 2.02.

Results of Operations and Financial Condition.

On November 2, 2021, American Water Works Company, Inc. (the “Company”) issued a press release announcing its financial results for the third quarter and nine months ended September 30, 2021. A copy of the press release has been included as Exhibit 99.1 and is incorporated by reference herein.

The information furnished in Item 2.02 of this Current Report, including Exhibit 99.1, shall not be deemed to be “filed” for purposes of Section 18 of the Securities Exchange Act of 1934, as amended (the “Exchange Act”), nor shall it be deemed to be incorporated by reference into any filing under the Securities Act of 1933, as amended (the “Securities Act”), or the Exchange Act, except as shall be expressly set forth by specific reference in such filing.


Item 7.01.

Regulation FD Disclosure.

The press release referenced in response to Item 2.02 above and included as Exhibit 99.1 hereto also announced the Company’s earnings per share guidance for 2021 and 2022, and provided certain other 2021, 2022 and long-term financial guidance with respect to the Company.

The presentation for the Company’s Investor Day is attached hereto as Exhibit 99.2 and is incorporated by reference herein.

The information furnished in Item 7.01 of this Current Report on Form 8-K, including Exhibits 99.1 and 99.2, shall not be deemed to be “filed” for purposes of Section 18 of the Exchange Act, nor shall it be deemed to be incorporated by reference into any filing under the Securities Act or the Exchange Act, except as shall be expressly set forth by specific reference in such filing.


Item 9.01.

Financial Statements and Exhibits.

(d) Exhibits.

The following exhibits to this Current Report have been provided herewith (as noted below):


Exhibit


Description

99.1*    Press Release, dated November 2, 2021, issued by American Water Works Company, Inc.
99.2*    American Water Works Company, Inc. November 2021 Investor Day Presentation
104    Cover Page Interactive Data File (the cover page XBRL tags are included and formatted as Inline XBRL)


*

Furnished herewith.


2


SIGNATURES

Pursuant to the requirements of the Securities Exchange Act of 1934, the registrant has duly caused this report to be signed on its behalf by the undersigned hereunto duly authorized.


    AMERICAN WATER WORKS COMPANY, INC.
Dated:November 2, 2021     By:  

/s/ M. SUSAN HARDWICK

      M. Susan Hardwick
      Executive Vice President and Chief Financial Officer


3

Exhibit 99.1


LOGO


November 2, 2021    Aaron Musgrave
   Senior Director, Investor Relations
   856-955-4029
   [email protected]
   Maureen Duffy
   Senior Vice President, Communications and External Affairs
   856-955-4163
   [email protected]

AMERICAN WATER REPORTS THIRD QUARTER 2021 RESULTS AND AFFIRMS 2021 GUIDANCE RANGE

ANNOUNCES 2022 GUIDANCE, LONG-TERM GROWTH TARGETS, AND CAPITAL INVESTMENT PLANS


Third quarter 2021 diluted earnings of $1.53 per share, compared to $1.46 per share in 2020; Year-to-date 2021 diluted earnings of $3.40 per share, compared to $3.11 per share in 2020


Quarter and year-to-date results reflect an estimated unfavorable impact of $0.07 per share and $0.04 per share, respectively, from cooler and wetter weather in 2021 compared to 2020; on a weather normalized basis, results increased 10% and 11% for the quarter and year-to-date periods, respectively


2021 diluted earnings per share (EPS) guidance range of $4.18 to $4.28 per share affirmed. This guidance range excludes any estimated impact from a closing of the announced sale of Homeowner Services business (HOS) in 2021


2022 diluted EPS guidance range of $4.39 to $4.49 established, reflective of continued growth of the Regulated Businesses and announced sale of HOS


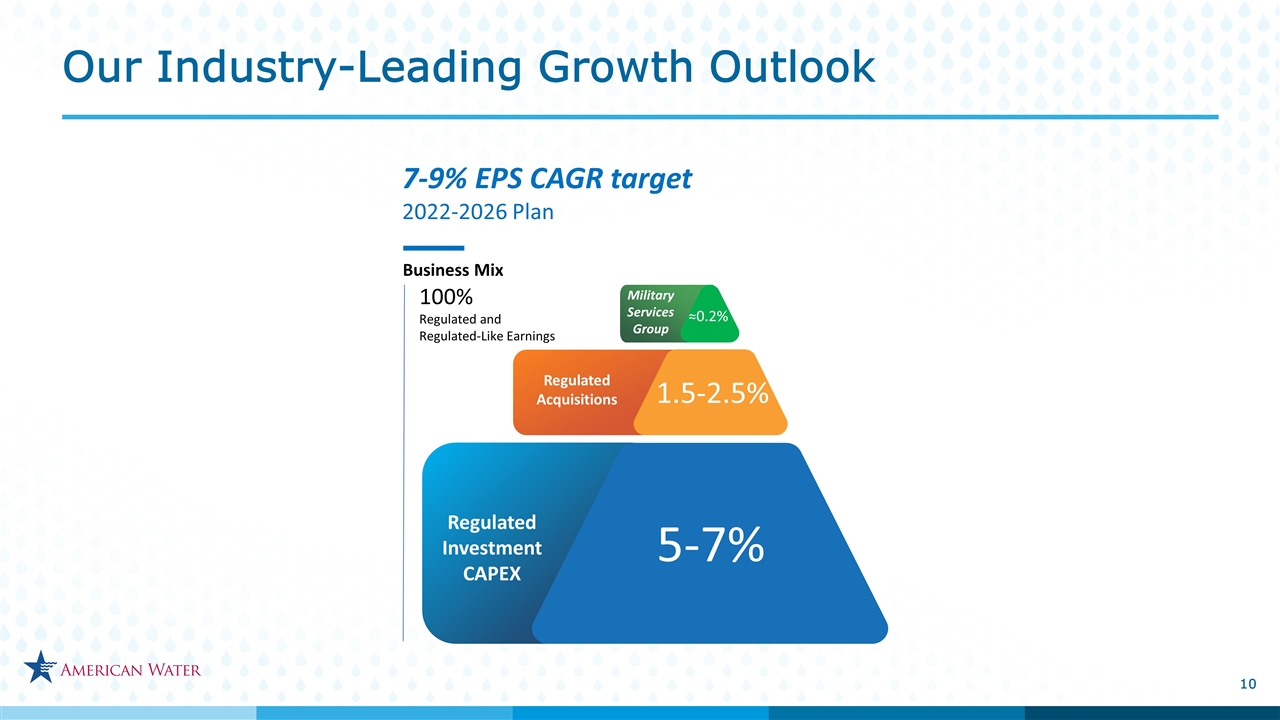
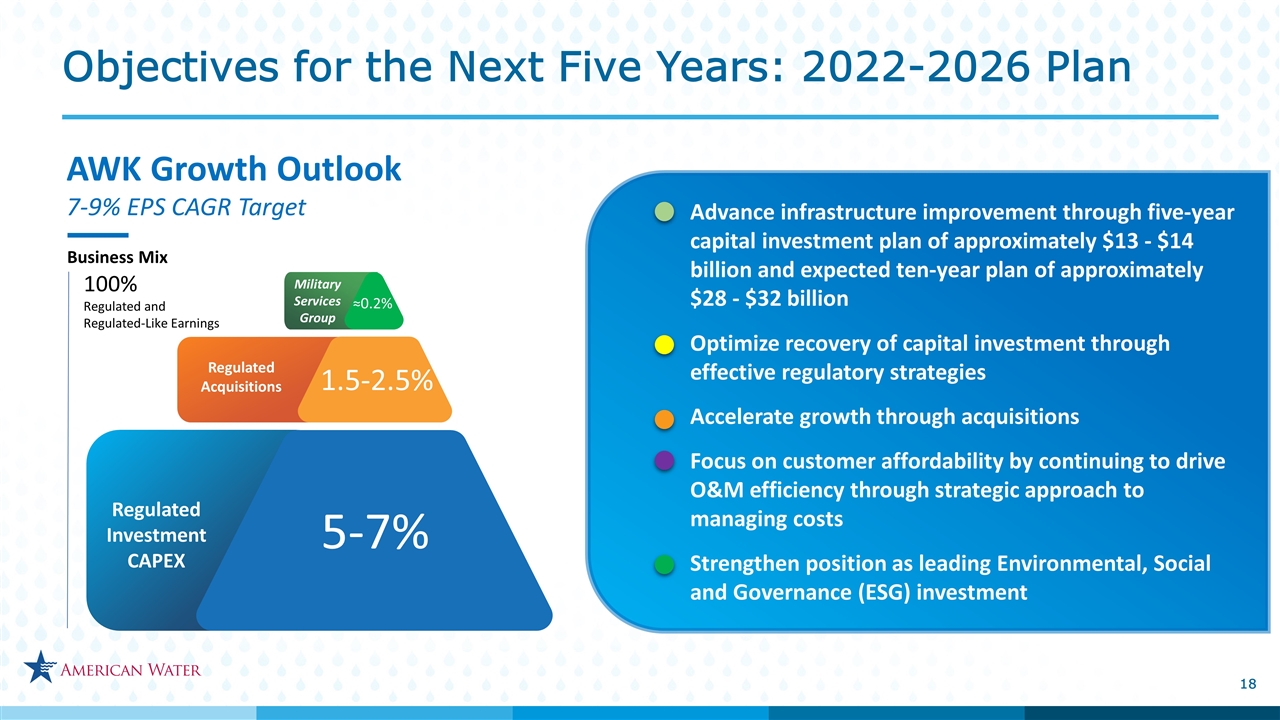
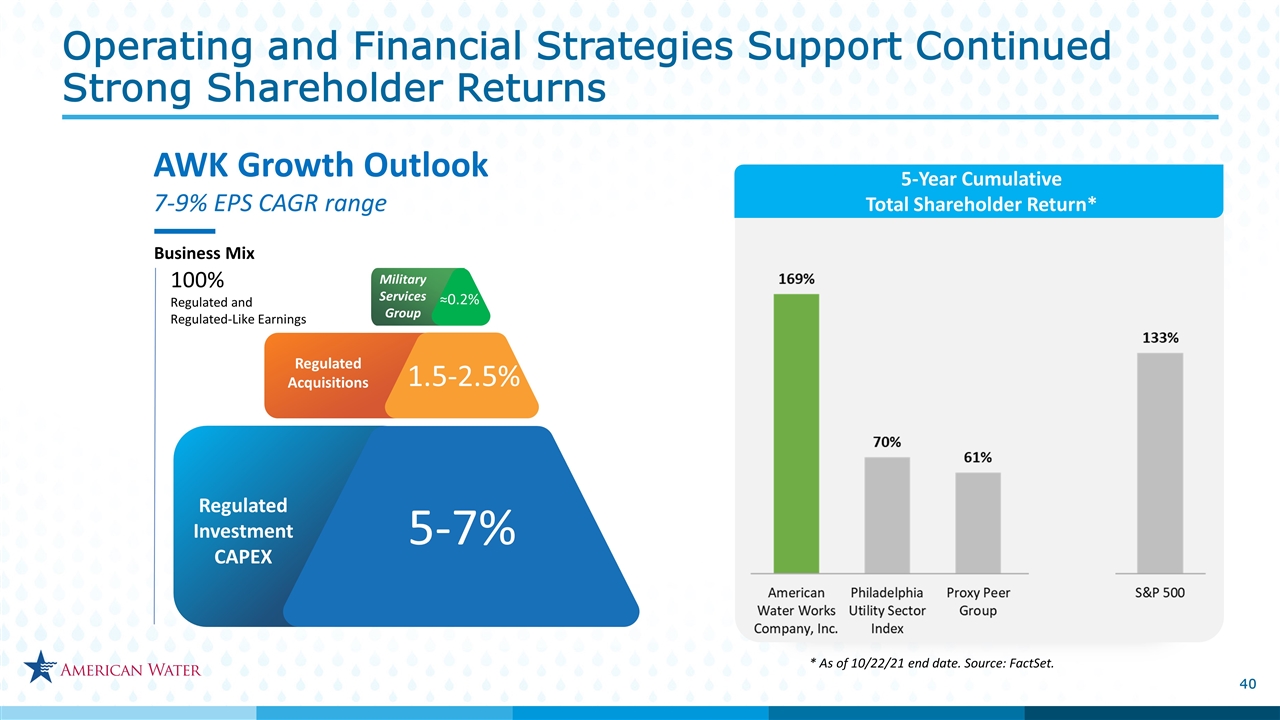
Long Term EPS compound annual growth rate (CAGR) established at a narrowed range of 7 to 9% for the 2022-2026 period


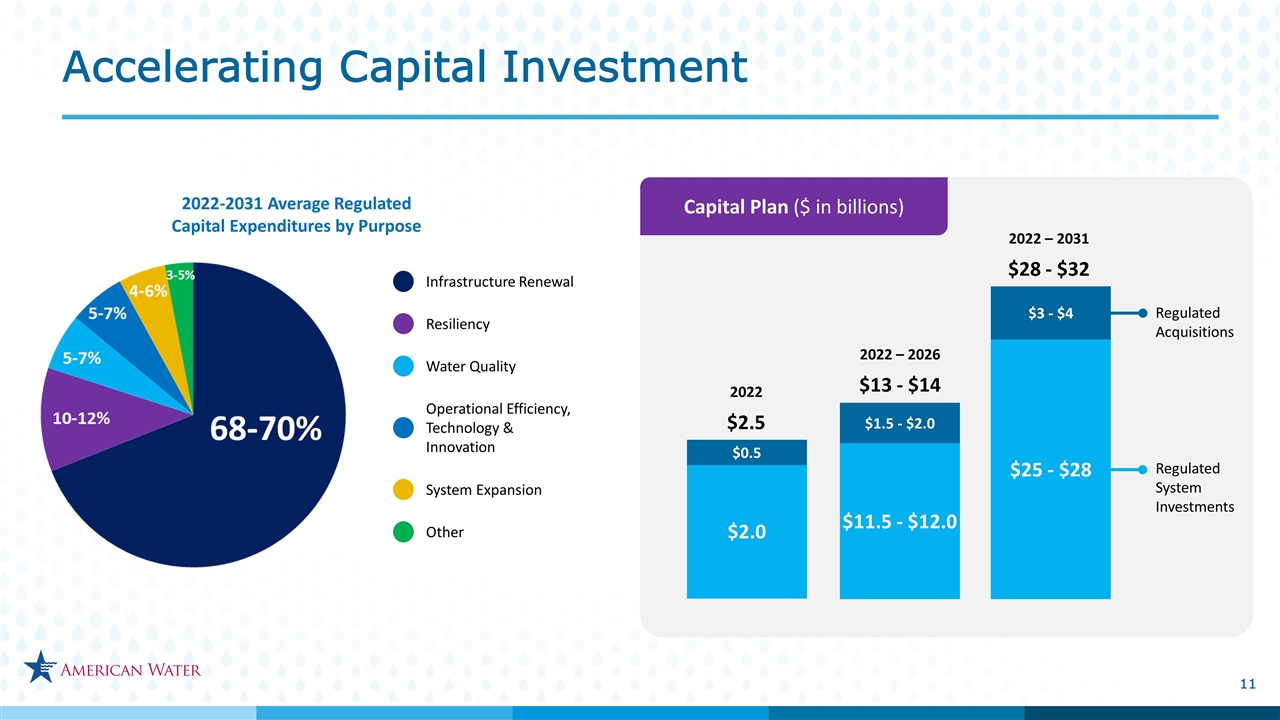
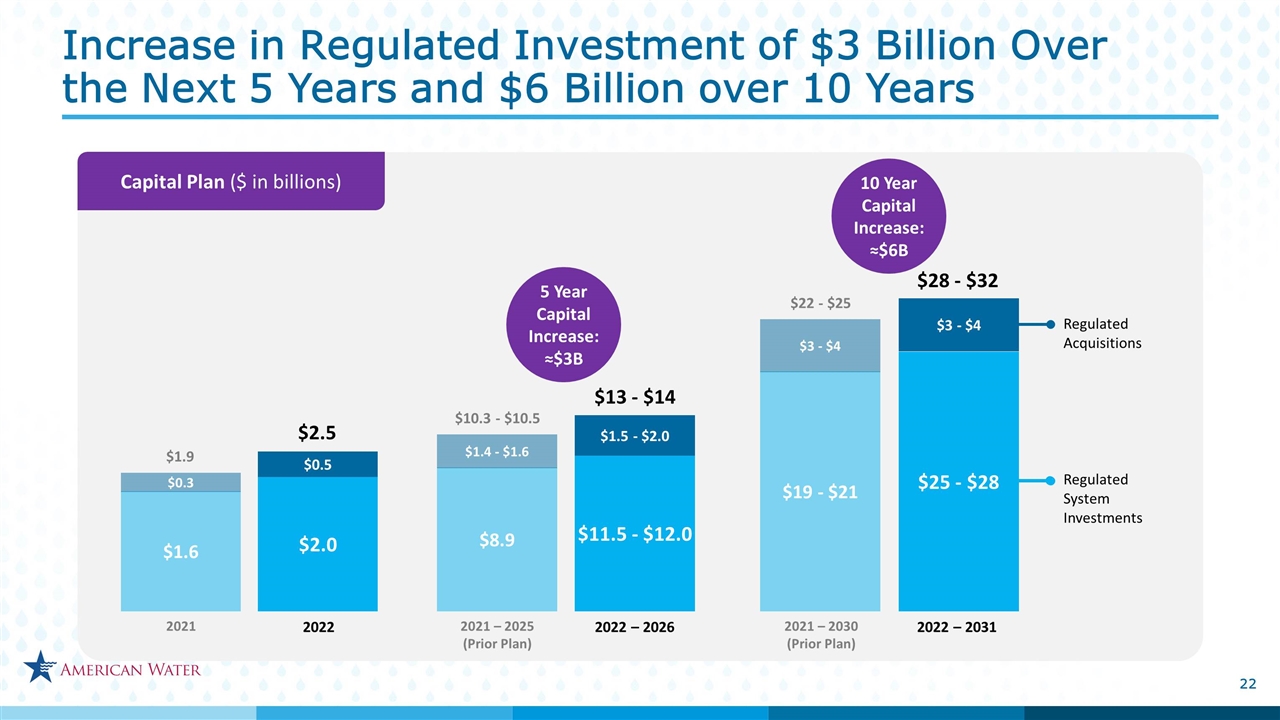
Increased regulated investment over the next 10 years by $6.0 billion to a range of $28-32 billion, reflective of redeployment of Homeowner Services sale proceeds

CAMDEN, N.J., November 2, 2021 - American Water Works Company, Inc. (NYSE: AWK) today reported results for the quarter ended September 30, 2021, of $1.53 per share, compared to $1.46 per share in 2020. The Company today also established 2022 diluted earnings per share guidance, and announced its long-term EPS growth target, and capital investment plans.

“We continue to deliver solid results with third quarter 2021 earnings in line with our expectations. These results demonstrate that we continue to grow our business through the consistent execution of our strategies,” said Walter Lynch, president and CEO of American Water. “Building on our year-over-year success, we have further strengthened our regulated business and will now deliver even higher quality earnings,” added Lynch. “With our recently announced sale of our Homeowner Services business, we can accelerate on our commitment to build and maintain reliable and resilient water and wastewater infrastructure, continue to put our customers first, and deliver water and wastewater solutions where we create the most value for customers and communities.

Additionally, 100% of our earnings going forward will come from our regulated and regulated-like businesses, providing long term, stable and steady growth.”


Sale of Homeowner Services Group

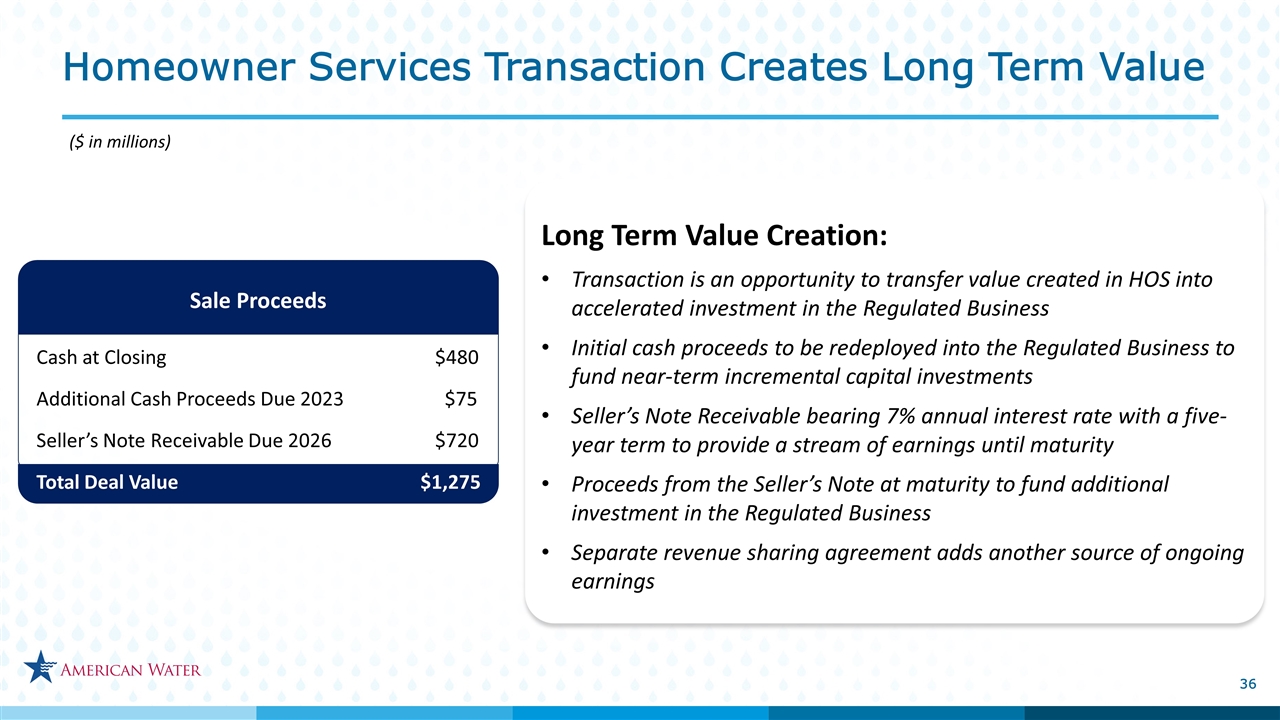
American Water announced on October 29, 2021, that it has agreed to sell its Homeowner Services Group to funds advised by Apax Partners LLP (“Apax”) in a deal valued at approximately $1.275 billion. Upon closing of the transaction, American Water will receive $480 million in cash and a $720 million secured Seller’s Note bearing a 7% annual interest rate with a five-year term. In addition, the transaction includes a delayed payment to American Water of $75 million if certain milestones are met by December 31, 2023. The structure of the transaction enables initial cash proceeds to be redeployed into the regulated water and wastewater business to fund near-term incremental capital investments, while interest on the Seller’s Note will provide a stream of earnings over the life of the note. Upon maturity, the proceeds from the repayment of the Seller’s Note are expected to be used to fund a continually growing capital investment in the regulated business. American Water will also enter into a revenue sharing agreement that provides for American Water to receive a percentage of revenue generated from previous on-bill billing arrangements with American Water customers. This agreement will also provide an ongoing income stream as Apax continues these relationships. American Water anticipates closing the transaction in the fourth quarter of 2021, subject to the satisfaction or waiver of customary closing conditions, including the expiration or termination of the applicable waiting period under the Hart-Scott-Rodino Antitrust Improvements Act of 1976.

Financial Targets Established for 2022-2026


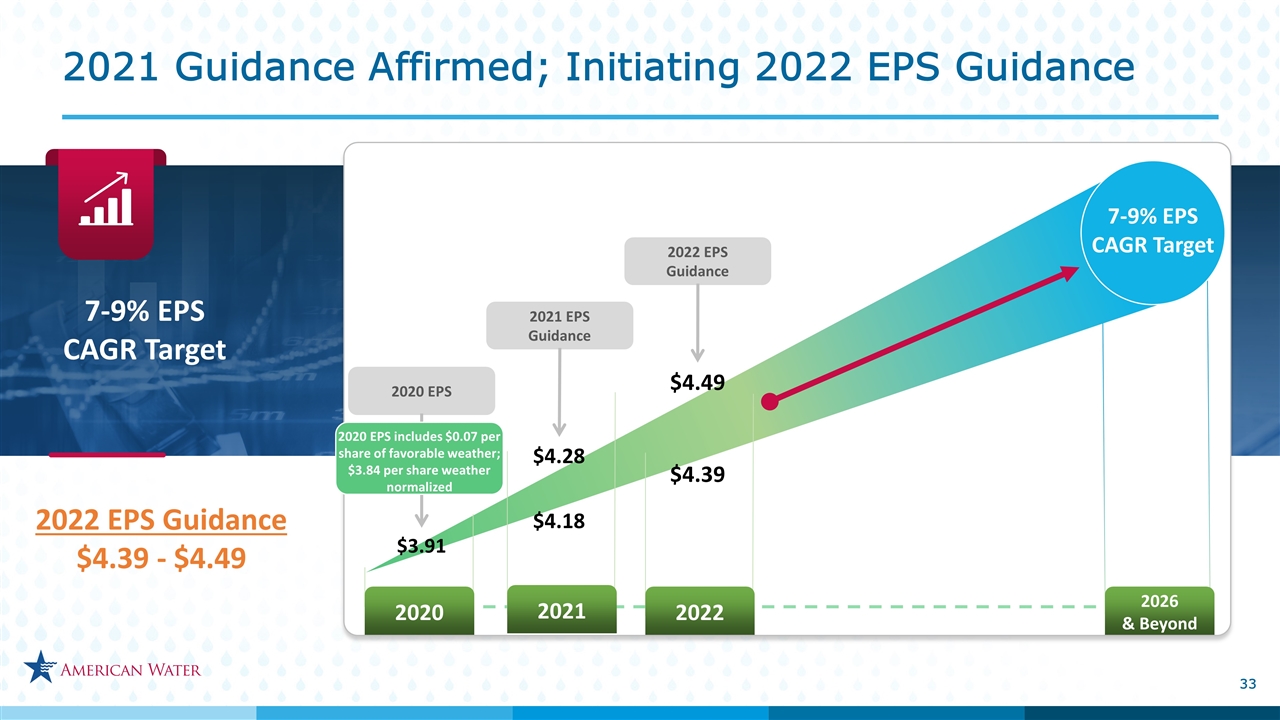
2022 earnings guidance range of $4.39 to $4.49 per share


Long-term EPS CAGR narrowed to a range of 7-9% for the 2022-2026 period


2022-2026 investment plan of $13-$14 billion and expected $28-$32 billion for the 10-year period of 2022-2031


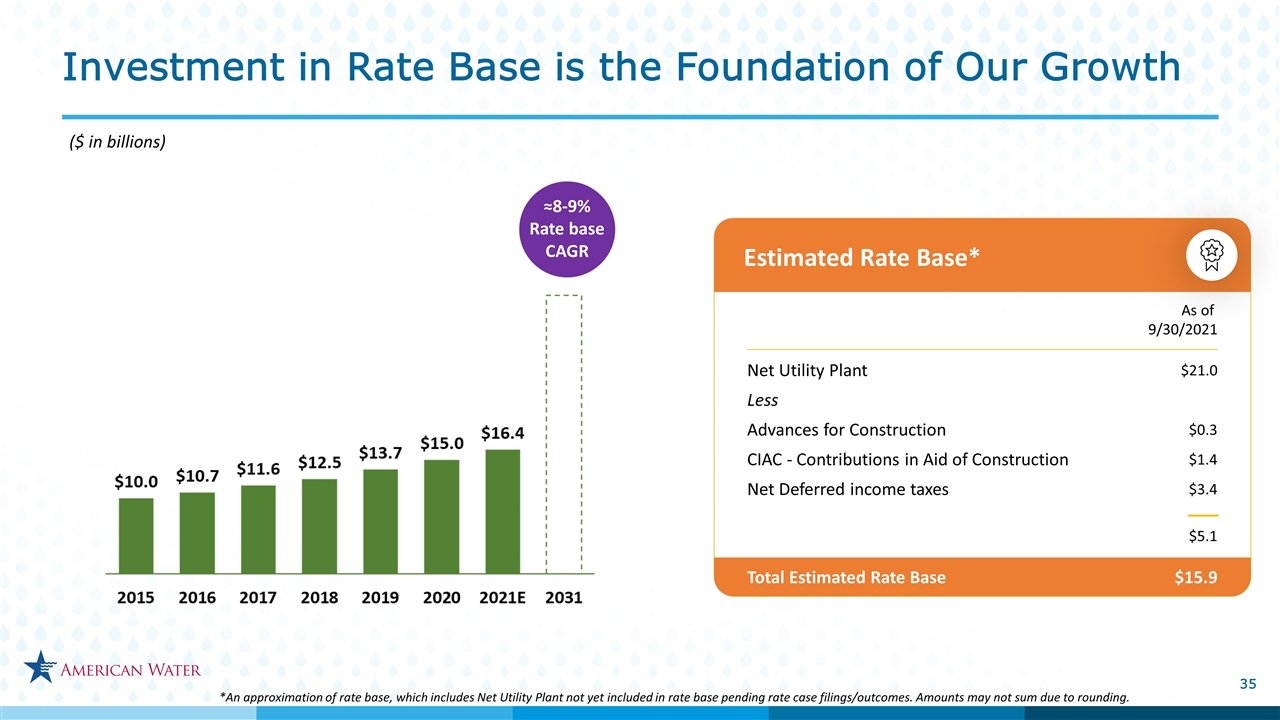
Rate base growth expectation of 8-9%, increased from 7-8%


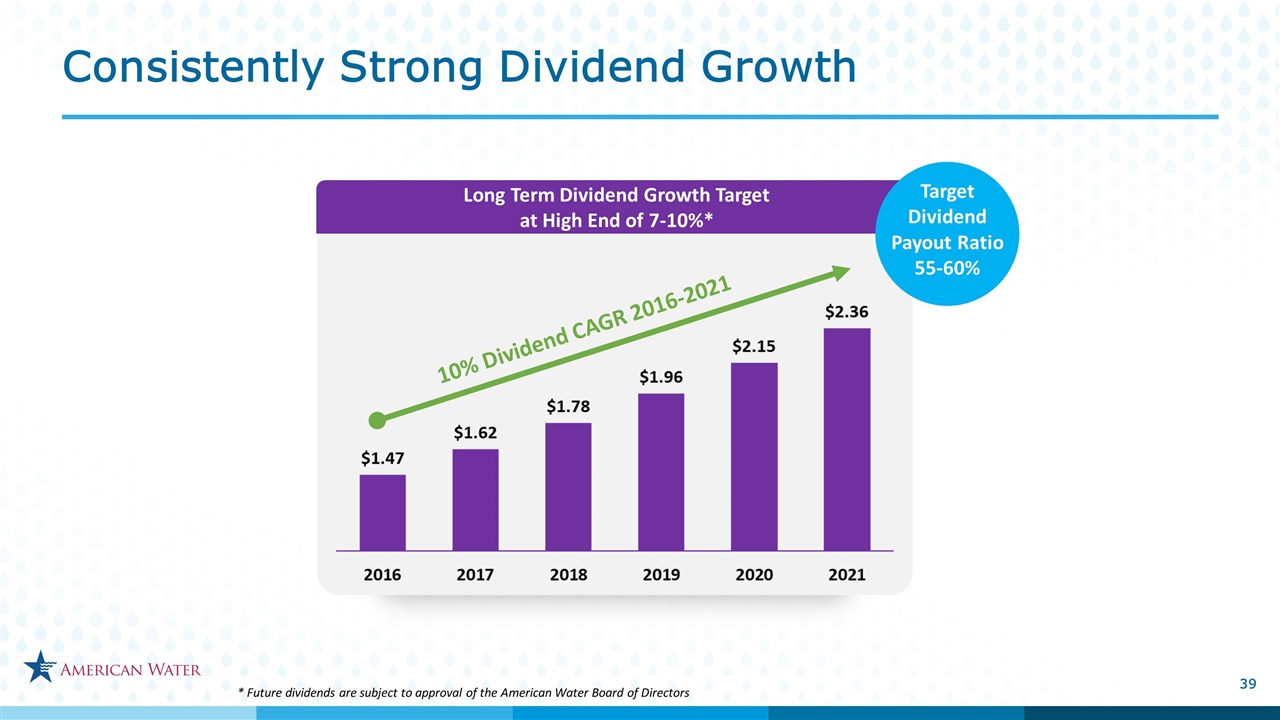
Long-term dividend growth expectation affirmed at the high end of a 7-10% range


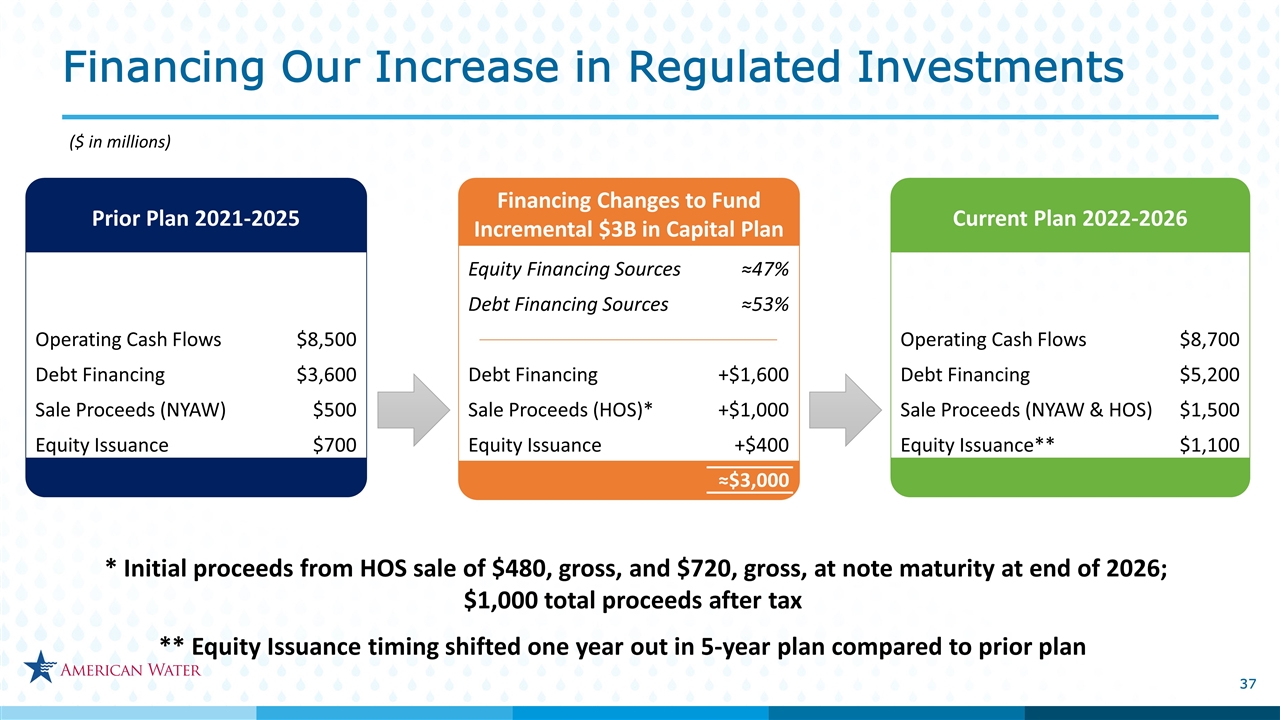
Long-term plan includes $1.275 billion in expected gross proceeds ($1.0 billion estimated after tax) from the Homeowner Services sale transaction fully redeployed into the regulated capital investment plan and $1.1 billion of public equity issuances to support growth


2026 O&M efficiency target of 30.0%

Consolidated Results

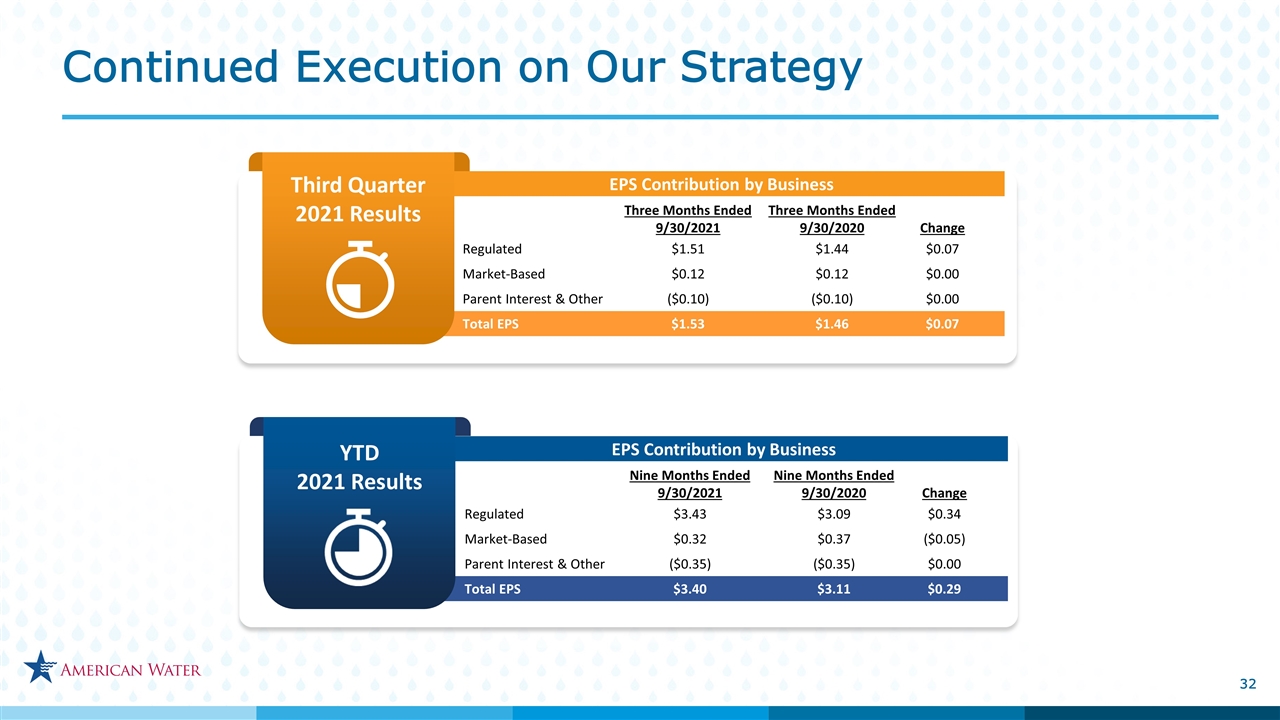
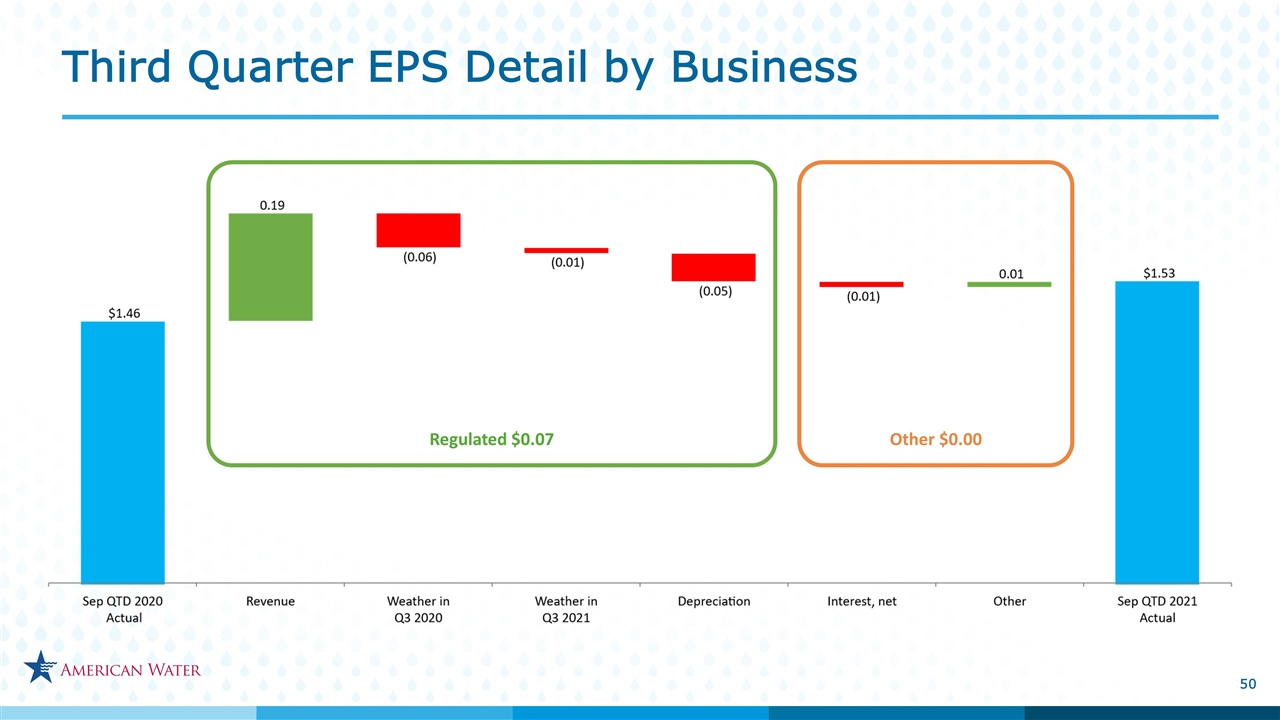
For the three months ended September 30, 2021, earnings per share were $1.53, an increase of $0.07 compared to the same period in 2020. This increase was primarily driven by continued growth in the Regulated Businesses from infrastructure investment, acquisitions and organic growth, partially offset by an estimated $0.07 per share impact from weather that was cooler and wetter in the third quarter 2021 compared to the same period in 2020. On a weather normalized basis, third quarter diluted earnings for 2021 and 2020 were $1.54 and $1.40 per share, respectively, an increase of 10%.

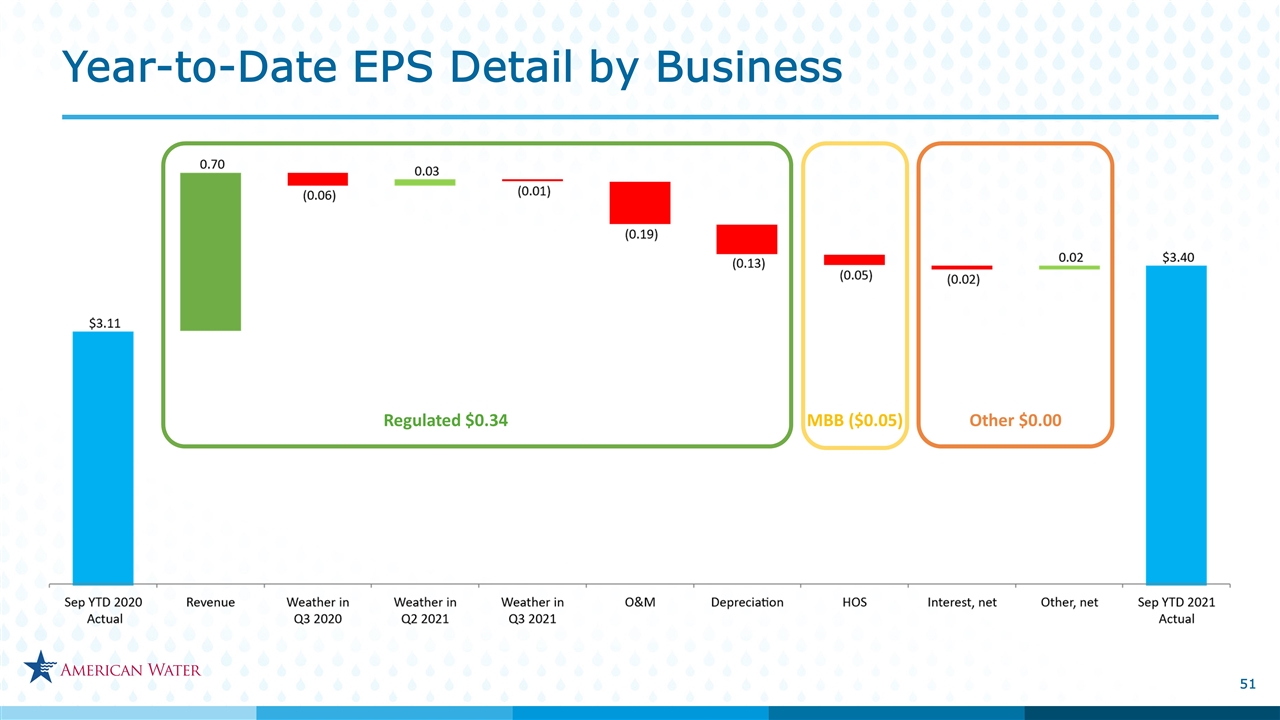
For the nine months ended September 30, 2021, earnings per share were $3.40, an increase of $0.29 compared to the same period in 2020. This increase was primarily driven by a $0.34 increase in the Regulated Businesses as earnings growth from infrastructure investment, acquisitions and organic growth, was partially offset by an estimated $0.04 per share impact from cooler and wetter weather in 2021 compared to the same period in 2020. On a weather normalized basis, diluted earnings for 2021 and 2020 year-to-date were $3.38 and $3.05 per share, respectively, an increase of nearly 11%. The consolidated results were also partially offset by lower results from the Homeowner Services Group due to an increase in claims expense in the first half of 2021.

For the first nine months of 2021, the Company made capital investments of approximately $1.3 billion, including $1.2 billion primarily for infrastructure improvements in the Regulated Businesses and $78 million for regulated acquisitions. The Company plans to invest approximately $1.9 billion across its footprint in 2021.


PRESS RELEASE    2    www.amwater.com


Regulated Businesses

In the third quarter of 2021, the Regulated Businesses’ net income was $273 million, compared to $261 million for the same period in 2020. Regulated revenue decreased approximately $1 million as increases from additional authorized revenues from infrastructure investments, acquisitions and organic growth were offset by lower demand due to weather compared to the prior year. Excluding revenue reductions for the amortization of excess accumulated deferred income tax (“EADIT”) of $24 million, which is offset with a like amount as lower tax expense, revenue increased $23 million. Results also reflect higher O&M expenses of $3 million to support growth in the Regulated Businesses and increased depreciation of $13 million, mainly related to infrastructure investment growth.

For the first nine months of 2021, the Regulated Businesses net income was $623 million, compared to $561 million for the same period in 2020. Regulated revenue increased approximately $88 million from additional authorized revenues from infrastructure investments, acquisitions and organic growth, partially offset by lower demand due to weather. Excluding agreed to revenue reductions for the amortization of EADIT of $68 million, which is offset with a like amount as lower tax expense, revenue increased $156 million. Results also reflect higher O&M expenses of $51 million to support growth in the Regulated Businesses and increased depreciation of $32 million, mainly related to infrastructure investment growth.

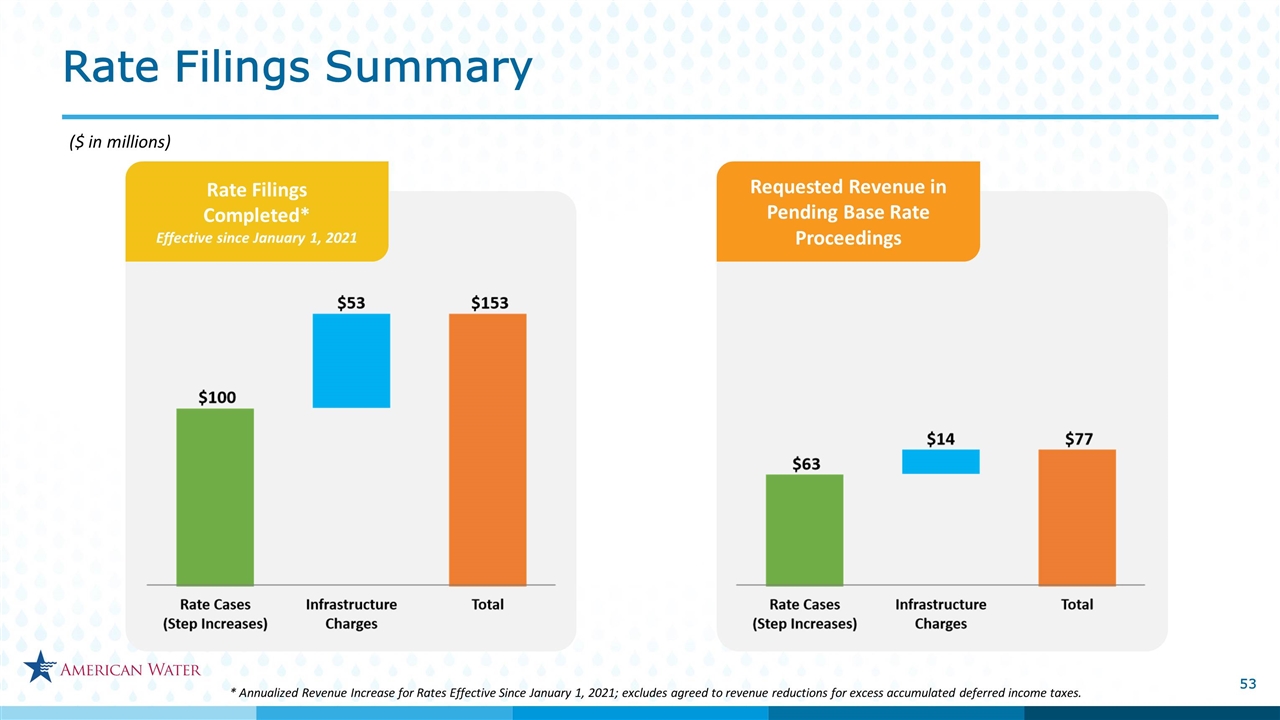
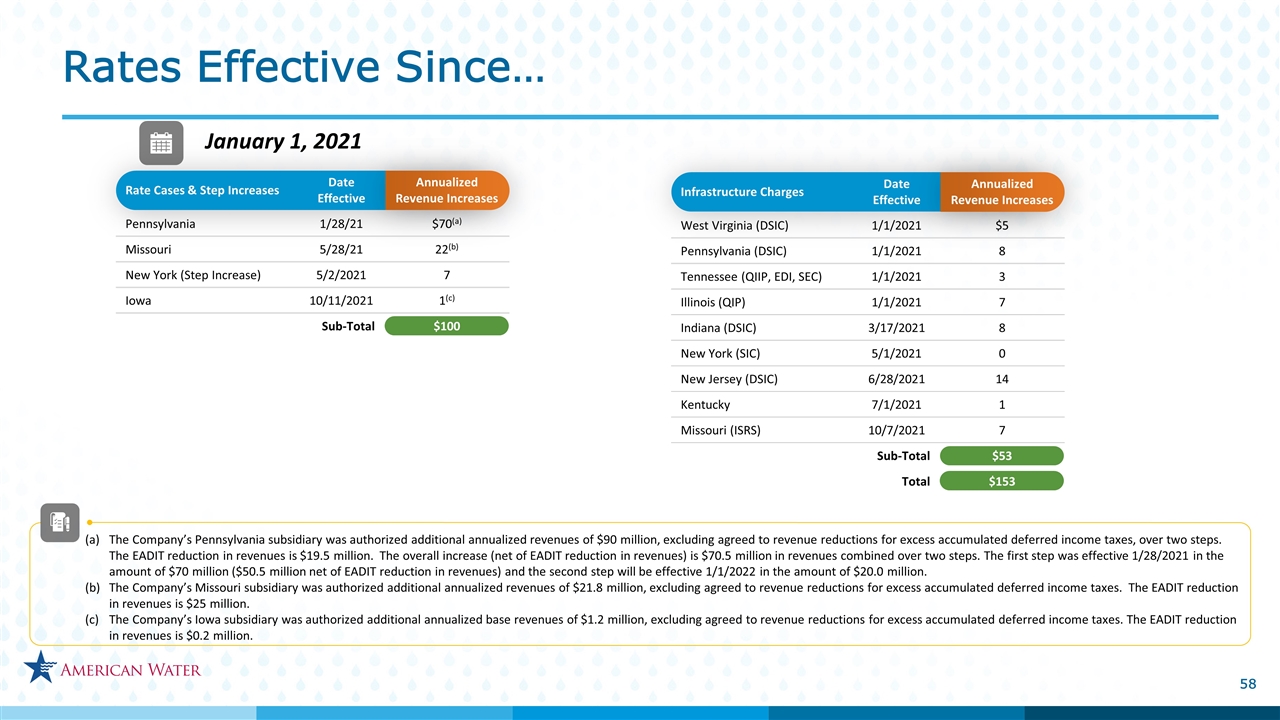
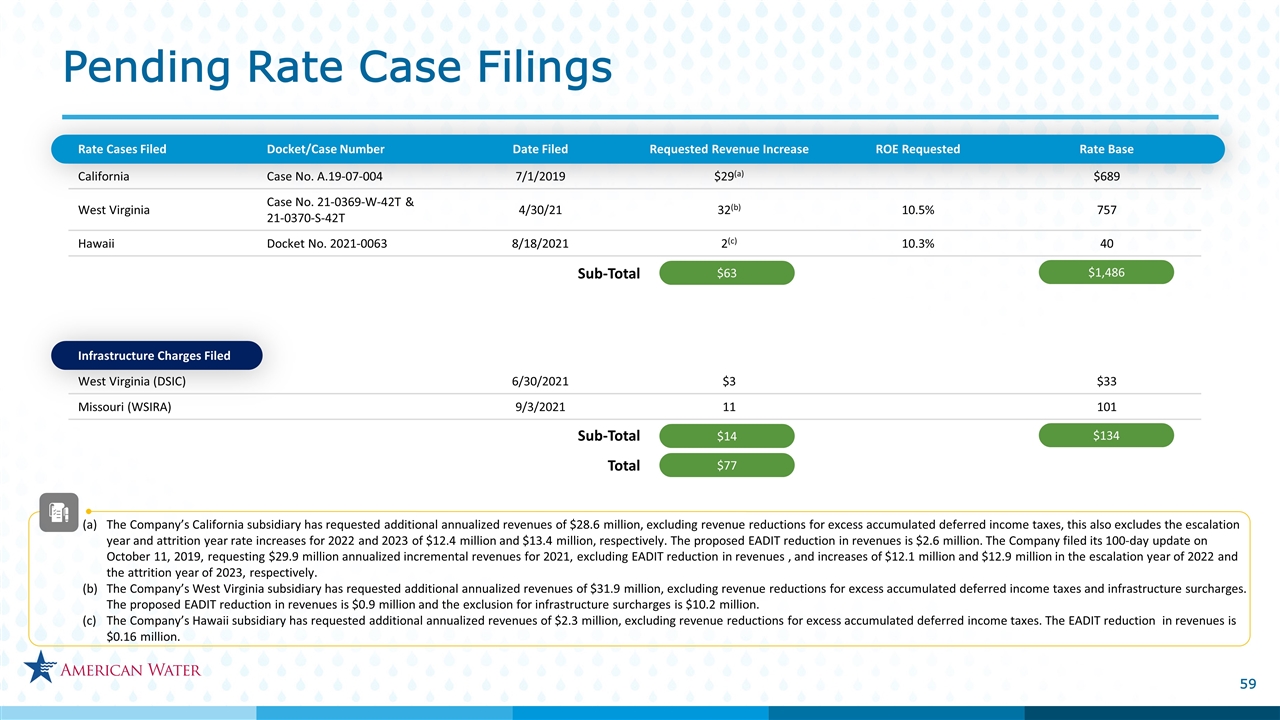
To date, the Company has been authorized additional annualized revenues, excluding agreed to reductions for EADIT, of approximately $120 million from general rate cases, with $100 million effective in 2021 and $20 million effective in 2022. In addition, approximately $53 million of additional annualized revenues from infrastructure surcharges have been authorized and are effective in 2021. The Company has general rate cases in progress in three jurisdictions and filed for infrastructure surcharges in two jurisdictions, reflecting a total annualized revenue request of approximately $77 million.

For the 12-month period ended September 30, 2021, the Company’s adjusted regulated O&M efficiency ratio (a non-GAAP financial measure) was 33.9%, a decrease from 34.2% for the 12-month period ended September 30, 2020. The improvement in this ratio reflects the continued focus on operating costs, as well as an increase in operating revenues for the Regulated Businesses after considering the adjustment for the amortization of the EADIT shown below.

Market-Based Businesses

In the third quarter of 2021, net income for the Market-Based Businesses was $23 million, unchanged from the same period in 2020.

For the first nine months of 2021, net income in the Market-Based Businesses was $59 million, compared to $68 million for the same period in 2020. The decrease was largely the result of increased claims costs in 2021 for the Homeowner Services business from extreme cold weather across the country during the first quarter of 2021, primarily in Texas and Illinois.

Dividends

On October 28, 2021, the Company’s Board of Directors declared a quarterly cash dividend payment of $0.6025 per share, payable on December 1, 2021, to shareholders of record as of November 10, 2021.

2021 Earnings Guidance

The Company affirms its 2021 earnings per share guidance range of $4.18 to $4.28. This guidance range assumes normal weather for the remainder of the year and does not reflect any estimated impact from the sale of HOS, which is expected to close in the fourth quarter of 2021. The Company’s earnings forecasts are subject to numerous risks and uncertainties, including, without limitation, those described under “Forward-Looking Statements” below and under “Risk Factors” in its annual, quarterly and current reports filed with the Securities and Exchange Commission (“SEC”).


PRESS RELEASE    3    www.amwater.com


Non-GAAP Financial Measures

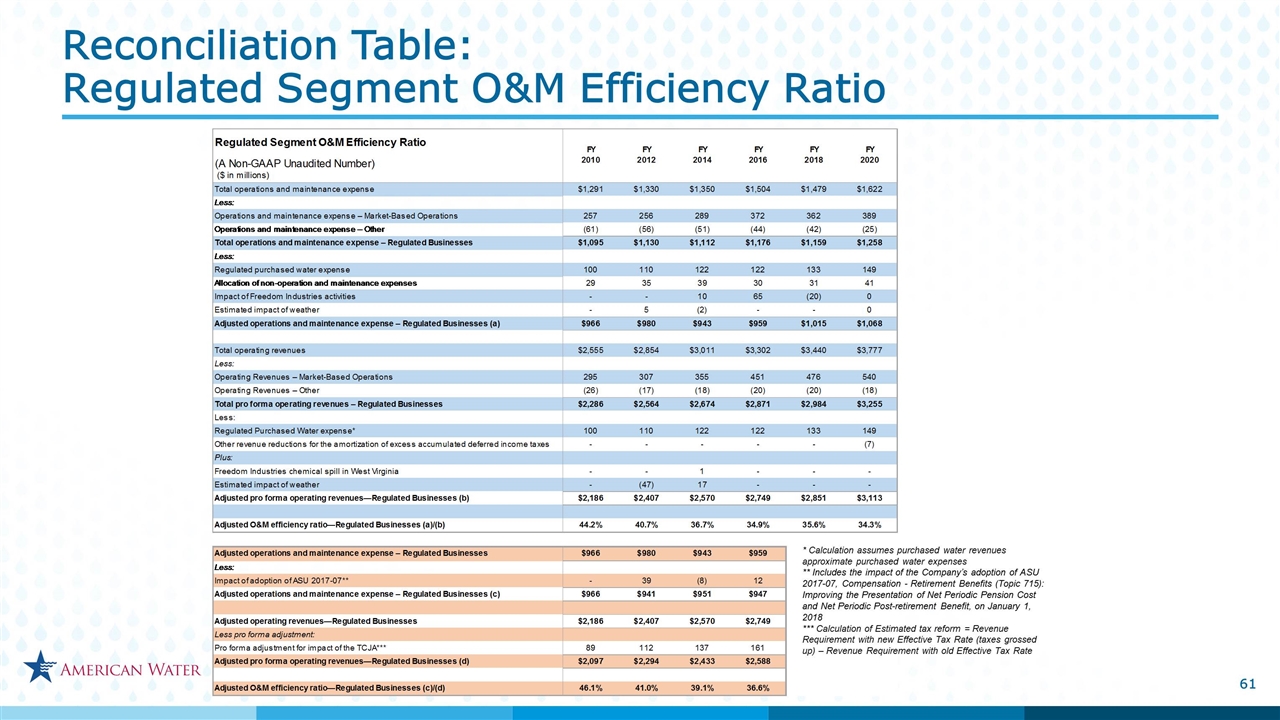
This press release includes a presentation of adjusted regulated O&M efficiency ratio, a “non-GAAP financial measure” under SEC rules, which excludes from its calculation estimated purchased water revenues and purchased water expenses, reductions for the amortization of EADIT, and the allocable portion of non-O&M support services costs, mainly depreciation and general taxes. These items were excluded from the O&M efficiency ratio calculation as they do not reflect management’s ability to increase the efficiency of the Regulated Businesses. This item is derived from American Water’s consolidated financial information but is not presented in its financial statements prepared in accordance with GAAP. This non-GAAP financial measure supplements and should be read in conjunction with the Company’s GAAP disclosures and should be considered as an addition to, and not a substitute for, any GAAP measure.

Management evaluates its operating performance using this ratio and believes that this non-GAAP financial measure is useful to the Company’s investors because it directly measures improvement in the operating performance and efficiency of the Company’s Regulated Businesses. The Company’s adjusted regulated O&M efficiency ratio (i) is not an accounting measure that is based on GAAP; (ii) is not based on a standard, objective industry definition or method of calculation; (iii) may not be comparable to other companies’ operating measures; and (iv) should not be used in place of the GAAP information provided elsewhere in this press release.

Set forth in this release is a table that calculates the Company’s adjusted regulated O&M efficiency ratio and reconciles each of the components used to calculate this ratio to the most directly comparable GAAP financial measure. Management is unable to present a reconciliation of adjustments to the components of the forward-looking regulated O&M efficiency ratio without unreasonable effort because management cannot reliably predict the nature, amount or probable significance of all of the adjustments for future periods; however, these adjustments may, individually or in the aggregate, cause the non-GAAP financial measure component of the forward-looking ratio to differ significantly from the most directly comparable GAAP financial measure.

Virtual Investor Day

American Water will host a virtual Investor Day on Wednesday, November 3, 2021, at 9:00 a.m. Eastern Daylight Time. The event will feature presentations by Walter Lynch, President and Chief Executive Officer; Susan Hardwick, Executive Vice President and Chief Financial Officer; and Cheryl Norton, Executive Vice President and Chief Operating Officer. The company will review the results for the third quarter of 2021 and will discuss its vision and strategy for the future, updated long-term financial plan, and the recently announced agreement to sell its Homeowner Services Group. The company will also discuss an increased capital investment program to provide reliable and sustainable water and wastewater services and its ongoing effort to enhance customer experience.

Interested parties may access the video webcast through a link on the Company’s Investor Relations website at ir.amwater.com. Presentation slides that will be used in conjunction with the event will also be made available online on the Company’s Investor Relations. The Company recognizes its Investor Relations website as a key channel of distribution to reach public investors and as a means of disclosing material non-public information to comply with its obligations under SEC Regulation FD.

Following the event, an archive of the webcast will be available for one year on American Water’s investor relations website at ir.amwater.com/events.

The company’s earnings guidance, capital spending, dividend growth, rate base growth and O&M efficiency forecasts are subject to numerous risks and uncertainties, including, without limitation, those described under “Cautionary Statement Concerning Forward-Looking Statements” below and under “Risk Factors” in its annual and quarterly reports filed with the Securities and Exchange Commission (SEC).


PRESS RELEASE    4    www.amwater.com


About American Water

With a history dating back to 1886, American Water is the largest and most geographically diverse U.S. publicly-traded water and wastewater utility company. The Company employs approximately 7,000 dedicated professionals who provide regulated and market-based drinking water, wastewater and other related services to over 15 million people in 46 states. More information can be found by visiting amwater.com and follow American Water on Twitter, Facebook and LinkedIn.

Throughout this press release, unless the context otherwise requires, references to the “Company” and “American Water” mean American Water Works Company, Inc. and all of its subsidiaries, taken together as a whole.

Cautionary Statement Concerning Forward-Looking Statements

Certain statements in this press release including, without limitation, 2021 and 2022 earnings guidance, future capital needs, earnings, rate base and dividend growth projections, the ability to complete the proposed sale of the Homeowner Services Group on a timely basis or at all (including without limitation the ability to obtain required antitrust approval and satisfy closing and other conditions, covenants and deliveries related to the proposed transaction), the accounting, financial and other impacts of the proposed transaction, the ability to achieve the Company’s goals related to the proposed transaction, including with respect to the repayment of the Seller’s note and the redeployment of net proceeds from the proposed transaction, the outcome of pending acquisition activity, the amount and allocation of projected capital expenditures; the Company’s long-term O&M efficiency ratio target, the impacts to the Company of the COVID-19 pandemic health event, and estimated revenues from rate cases and other government agency authorizations, are forward-looking statements within the meaning of the safe harbor provisions of the Private Securities Litigation Reform Act of 1995 and the Federal securities laws. In some cases, these forward-looking statements can be identified by words with prospective meanings such as “intend,” “plan,” “estimate,” “believe,” “anticipate,” “expect,” “predict,” “project,” “propose,” “assume,” “forecast,” “outlook,” “future,” “pending,” “goal,” “objective,” “potential,” “continue,” “seek to,” “may,” “can,” “will,” “should” and “could” and or the negative of such terms or other variations or similar expressions. These forward-looking statements are predictions based on American Water’s current expectations and assumptions regarding future events. They are not guarantees or assurances of any outcomes, financial results of levels of activity, performance or achievements, and readers are cautioned not to place undue reliance upon them. The forward-looking statements are subject to a number of estimates and assumptions, and known and unknown risks, uncertainties and other factors. Actual results may differ materially from those discussed in the forward-looking statements included in this press release as a result of the factors discussed in the Company’s Annual Report on Form 10-K for the year ended December 31, 2020, and subsequent filings with the SEC, and because of factors such as: the ability to obtain required consents and regulatory and other approvals required to complete, and satisfying other conditions to the closing of, the proposed transaction, including the expiration or termination of the early waiting period under the Hart-Scott-Rodino Antitrust Improvements Act of 1976; the amount of proceeds to be received from the proposed sale, due to, among other things, closing and post-closing adjustments to the purchase price as provided in the purchase agreement; unexpected costs, liabilities or delays associated with the contemplated transaction; the decisions of governmental and regulatory bodies, including decisions to raise or lower customer rates and regulatory responses to the COVID-19 pandemic; the timeliness and outcome of regulatory commissions’ and other authorities’ actions concerning rates, capital structure, authorized return on equity, capital investment, system acquisitions and dispositions, taxes, permitting, water supply and management, and other decisions; changes in customer demand for, and patterns of use of, water, such as may result from conservation efforts, impacts of the COVID-19 pandemic, or otherwise; a loss of one or more large industrial or commercial customers due to adverse economic conditions, the COVID-19 pandemic, or other factors; limitations on the availability of the Company’s water supplies or sources of water, or restrictions on its use thereof, resulting from allocation rights, governmental or regulatory requirements and restrictions, drought, overuse or other factors; changes in laws, governmental regulations and policies, including with respect to the environment, health and safety, consumer and data privacy, water quality and water quality accountability, contaminants of emerging concern, public utility and tax regulations and policies, and impacts resulting from U.S., state and local elections and changes in federal, state and local executive administrations; weather conditions and events, climate variability patterns, and natural disasters, including drought or abnormally high rainfall, prolonged and abnormal ice or freezing conditions, strong winds, coastal and intercoastal flooding, pandemics (including COVID-19) and epidemics, earthquakes, landslides, hurricanes, tornadoes, wildfires, electrical storms, sinkholes and solar flares; the outcome of litigation and similar governmental and regulatory proceedings, investigations


PRESS RELEASE    5    www.amwater.com


or actions; the risks associated with the Company’s aging infrastructure, and its ability to appropriately improve the resiliency of, or maintain and replace, current or future infrastructure and systems, including its technology and other assets, and manage the expansion of its businesses; exposure or infiltration of the Company’s technology and critical infrastructure systems, including the disclosure of sensitive, personal or confidential information contained therein, through physical or cyber attacks or other means; the Company’s ability to obtain permits and other approvals for projects and construction of various water and wastewater facilities; changes in the Company’s capital requirements; the Company’s ability to control operating expenses and to achieve operating efficiencies; the intentional or unintentional actions of a third party, including contamination of the Company’s water supplies or the water provided to its customers; the Company’s ability to obtain adequate and cost-effective supplies of equipment (including personal protective equipment), chemicals, electricity, fuel, water and other raw materials; the Company’s ability to successfully meet growth projections for the Regulated Businesses and the Market-Based Businesses, either individually or in the aggregate, and capitalize on growth opportunities, including, among other things, with respect to acquiring, closing and successfully integrating regulated operations and market-based businesses, entering into contracts and other agreements with, or otherwise obtaining, new customers or partnerships in the Market-Based Businesses, and realizing anticipated benefits and synergies from new acquisitions; risks and uncertainties associated with contracting with the U.S. government, including ongoing compliance with applicable government procurement and security regulations; cost overruns relating to improvements in or the expansion of the Company’s operations; the Company’s ability to successfully develop and implement new technologies and to protect related intellectual property; the Company’s ability to maintain safe work sites; the Company’s exposure to liabilities related to environmental laws and similar matters resulting from, among other things, water and wastewater service provided to customers; changes in general economic, political, business and financial market conditions, including without limitation conditions and collateral consequences associated with the COVID-19 pandemic health event; access to sufficient debt and/or equity capital on satisfactory terms and when and as needed to support operations and capital expenditures; fluctuations in interest rates; the ability to comply with affirmative or negative covenants in the current or future indebtedness of the Company or any of its subsidiaries, or the issuance of new or modified credit ratings or outlooks or other communications by credit rating agencies with respect to the Company or any of its subsidiaries (or any current or future indebtedness thereof), which could increase financing costs or funding requirements and affect the Company’s or its subsidiaries’ ability to issue, repay or redeem debt, pay dividends or make distributions; fluctuations in the value of benefit plan assets and liabilities that could increase the Company’s cost and funding requirements; changes in federal or state general, income and other tax laws, including (i) future significant tax legislation; (ii) further rules, regulations, interpretations and guidance by the U.S. Department of the Treasury and state or local taxing authorities related to the enactment of the Tax Cuts and Jobs Act of 2017; (iii) the availability of, or the Company’s compliance with, the terms of applicable tax credits and tax abatement programs; and (iv) the Company’s ability to utilize its U.S. federal and state income tax net operating loss carryforwards; migration of customers into or out of the Company’s service territories; the use by municipalities of the power of eminent domain or other authority to condemn the systems of one or more of the Company’s utility subsidiaries, or the assertion by private landowners of similar rights against such utility subsidiaries; any difficulty or inability to obtain insurance for the Company, its inability to obtain insurance at acceptable rates and on acceptable terms and conditions, or its inability to obtain reimbursement under existing or future insurance programs and coverages for any losses sustained; the incurrence of impairment charges related to the Company’s goodwill or other assets; labor actions, including work stoppages and strikes; the Company’s ability to retain and attract qualified employees; civil disturbances or unrest, or terrorist threats or acts, or public apprehension about future disturbances, unrest, or terrorist threats or acts; and the impact of new, and changes to existing, accounting standards.

These forward-looking statements are qualified by, and should be read together with, the risks and uncertainties set forth above and the risk factors included in American Water’s annual, quarterly and other SEC filings, and readers should refer to such risks, uncertainties and risk factors in evaluating such forward-looking statements. Any forward-looking statements American Water makes speak only as of the date of this press release. American Water does not have or undertake any obligation or intention to update or revise any forward-looking statement, whether as a result of new information, future events, changed circumstances or otherwise, except as otherwise required by the federal securities laws. New factors emerge from time to time, and it is not possible for the Company to predict all such factors. Furthermore, it may not be possible to assess the impact of any such factor on the Company’s businesses, either viewed independently or together, or the extent to which any factor, or combination of factors, may cause results to differ materially from those contained in any forward-looking statement. The foregoing factors should not be construed as exhaustive.

AWK IR


PRESS RELEASE    6    www.amwater.com


American Water Works Company, Inc. and Subsidiary Companies

Consolidated Statements of Operations (Unaudited)

(In millions, except per share data)


     For the Three Months Ended
September 30,
    For the Nine Months Ended
September 30,
 
     2021     2020     2021     2020  

Operating revenues

   $ 1,092   $ 1,079   $ 2,979   $ 2,854


Operating expenses:


Operation and maintenance

     436     419     1,286     1,193

Depreciation and amortization

     161     154     476     451

General taxes

     78     73     241     225


Total operating expenses, net

     675     646     2,003     1,869


Operating income

     417     433     976     985


Other income (expense):


Interest, net

     (101     (99     (300     (296

Non-operating benefit costs, net

     20     12     59     37

Other, net

     4     6     11     17


Total other (expense) income

     (77     (81     (230     (242


Income before income taxes

     340     352     746     743

Provision for income taxes

     62     88     128     179


Net income attributable to common shareholders

   $ 278   $ 264   $ 618   $ 564


Basic earnings per share: (a)


Net income attributable to common shareholders

   $ 1.53   $ 1.46   $ 3.40   $ 3.11


Diluted earnings per share: (a)


Net income attributable to common shareholders

   $ 1.53   $ 1.46   $ 3.40   $ 3.11


Weighted-average common shares outstanding:


Basic

     182     181     182     181


Diluted

     182     182     182     181


(a)

Amounts may not calculate due to rounding.


PRESS RELEASE    7    www.amwater.com


American Water Works Company, Inc. and Subsidiary Companies

Consolidated Balance Sheets (Unaudited)

(In millions, except share and per share data)


     September 30, 2021     December 31, 2020  

ASSETS


Property, plant and equipment

   $ 26,877   $ 25,614

Accumulated depreciation

     (6,292     (5,904


Property, plant and equipment, net

     20,585     19,710


Current assets:


Cash and cash equivalents

     70     547

Restricted funds

     30     29

Accounts receivable, net of allowance for uncollectible accounts of $76 and $60, respectively

     348     321

Unbilled revenues

     249     206

Materials and supplies

     53     47

Assets held for sale

     678     629

Other

     162     127


Total current assets

     1,590     1,906


Regulatory and other long-term assets:


Regulatory assets

     1,128     1,127

Operating lease right-of-use assets

     95     95

Goodwill

     1,511     1,504

Postretirement benefit assets

     175     173

Intangible assets

     47     55

Other

     202     196


Total regulatory and other long-term assets

     3,158     3,150


Total assets

   $ 25,333   $ 24,766


PRESS RELEASE    8    www.amwater.com


American Water Works Company, Inc. and Subsidiary Companies

Consolidated Balance Sheets (Unaudited)

(In millions, except share and per share data)


     September 30, 2021     December 31, 2020  

CAPITALIZATION AND LIABILITIES


Capitalization:


Common stock ($0.01 par value; 500,000,000 shares authorized; 186,795,975 and 186,466,707 shares issued, respectively)

   $ 2   $ 2

Paid-in-capital

     6,772     6,747

Retained earnings

     500     102

Accumulated other comprehensive loss

     (45     (49

Treasury stock, at cost (5,260,279 and 5,168,215 shares, respectively)

     (363     (348


Total common shareholders’ equity

     6,866     6,454


Long-term debt

     10,349     9,329

Redeemable preferred stock at redemption value

     3     4


Total long-term debt

     10,352     9,333


Total capitalization

     17,218     15,787


Current liabilities:


Short-term debt

     684     1,282

Current portion of long-term debt

     48     329

Accounts payable

     175     189

Accrued liabilities

     520     591

Accrued taxes

     73     50

Accrued interest

     103     88

Liabilities related to assets held for sale

     78     137

Other

     163     215


Total current liabilities

     1,844     2,881


Regulatory and other long-term liabilities:


Advances for construction

     284     270

Deferred income taxes and investment tax credits

     2,285     2,113

Regulatory liabilities

     1,660     1,770

Operating lease liabilities

     81     81

Accrued pension expense

     346     388

Other

     180     83


Total regulatory and other long-term liabilities

     4,836     4,705


Contributions in aid of construction

     1,435     1,393

Commitments and contingencies


Total capitalization and liabilities

   $ 25,333   $ 24,766


PRESS RELEASE    9    www.amwater.com


American Water Works Company, Inc. and Subsidiary Companies

Adjusted Regulated Operation and Maintenance Efficiency Ratio (A Non-GAAP, unaudited measure)

In millions


     For the Twelve Months Ended
September 30,
 
(Dollars in millions)    2021     2020  

Total operation and maintenance expenses

   $ 1,715   $ 1,605

Less:


Operation and maintenance expenses—Market-Based Businesses

     436     386

Operation and maintenance expenses—Other

     (30     (20


Total operation and maintenance expenses—Regulated Businesses

     1,309     1,239

Less:


Regulated purchased water expenses

     154     146

Allocation of non-operation and maintenance expenses

     41     34


Adjusted operation and maintenance expenses—Regulated Businesses (i)

   $ 1,114   $ 1,059


Total operating revenues

   $ 3,902   $ 3,756

Less:


Operating revenues—Market-Based Businesses

     575     536

Operating revenues—Other

     (16     (18


Total operating revenues—Regulated Businesses

     3,343     3,238

Less:


Regulated purchased water revenues (a)

     154     146

Revenue reductions for the amortization of EADIT

     (93     —    


Adjusted operating revenues—Regulated Businesses (ii)

   $ 3,282   $ 3,092


Adjusted O&M efficiency ratio—Regulated Businesses (i) / (ii)

     33.9     34.2


(a)

The calculation assumes regulated purchased water revenues approximate regulated purchased water expenses.


PRESS RELEASE    10    www.amwater.com

Slide 1

Fall 2021 Investor Day: Exciting Road Ahead as a Pure- Play Regulated Water Utility November 3, 2021 Exhibit 99.2


Slide 2

Aaron Musgrave Senior Director, Investor Relations


Slide 3

Forward-Looking Statements Safe Harbor This presentation includes forward-looking statements within the meaning of the safe harbor provisions of the Private Securities Litigation Reform Act of 1995 and the Federal securities laws. They are not guarantees or assurances of any outcomes, financial results, levels of activity, performance or achievements, and readers are cautioned not to place undue reliance upon them. The forward-looking statements are subject to a number of estimates and assumptions, and known and unknown risks, uncertainties and other factors. Actual results may differ materially from those discussed in the forward-looking statements included in this presentation. The factors that could cause actual results to differ, including uncertainties, risks and other factors associated with the coronavirus (COVID-19) pandemic, are discussed in the Appendix to this presentation, and in our Quarterly Report on Form 10-Q for the quarter ended September 30, 2021, as filed with the SEC on November 2, 2021. Non-GAAP Financial Information This presentation includes non-GAAP financial measures. Further information regarding these non-GAAP financial measures, including a reconciliation of each of these measures to the most directly comparable GAAP measure, is included in the Appendix to this presentation.


Slide 4

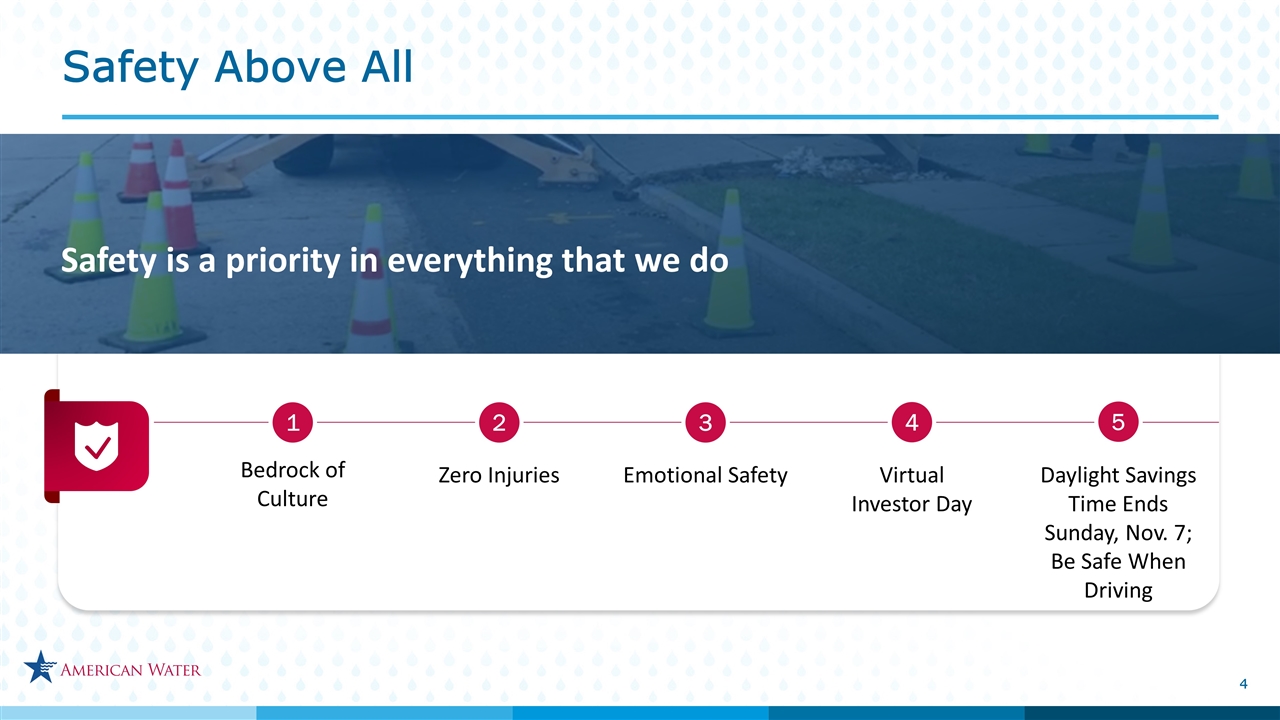
Safety Above All 1 Bedrock of Culture 2 Zero Injuries 3 Virtual Investor Day 4 Daylight Savings Time Ends Sunday, Nov. 7; Be Safe When Driving 5 Emotional Safety Safety is a priority in everything that we do


Slide 5

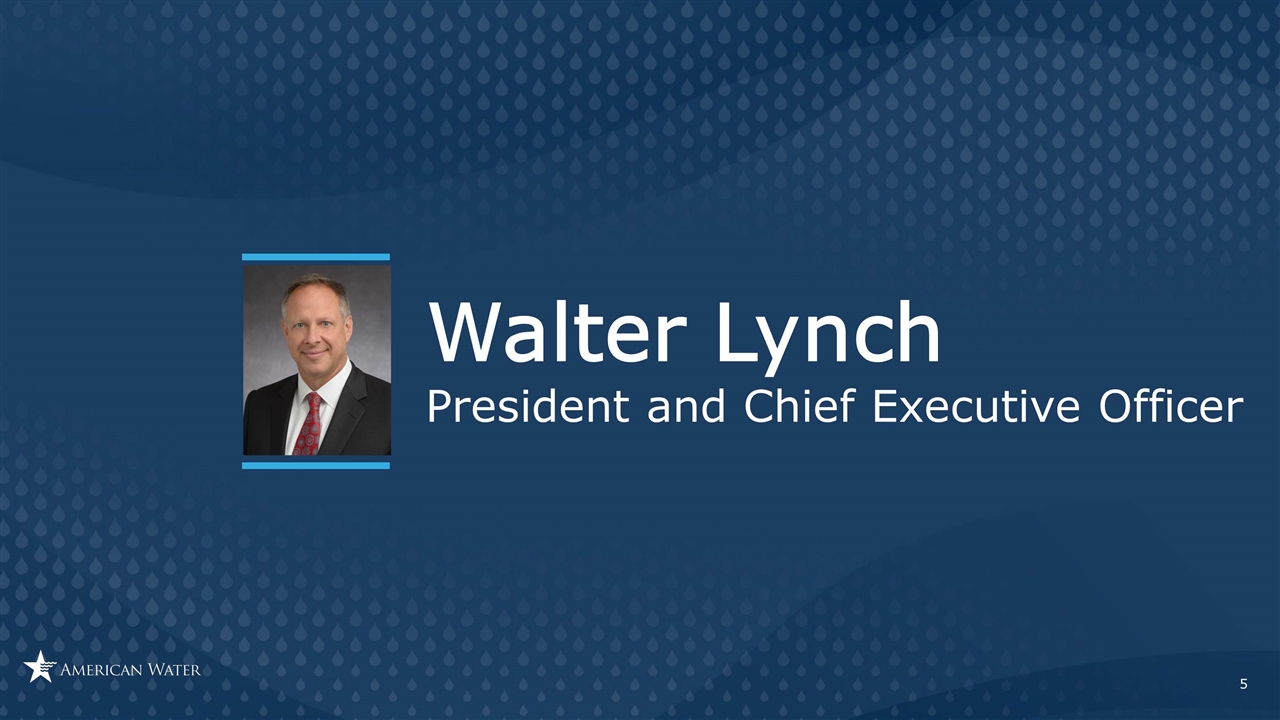
Walter Lynch President and Chief Executive Officer


Slide 6

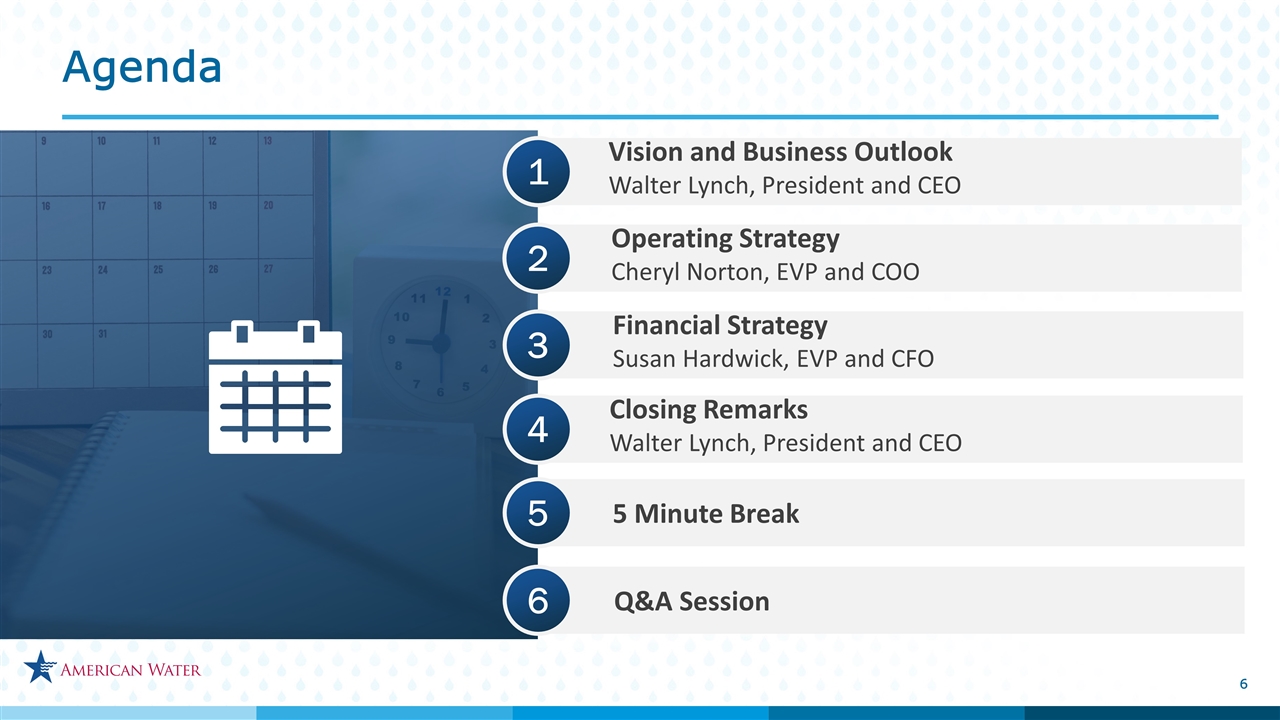
Agenda Q&A Session 5 Minute Break 5 Financial Strategy Susan Hardwick, EVP and CFO 3 Operating Strategy Cheryl Norton, EVP and COO 2 Vision and Business Outlook Walter Lynch, President and CEO 1 6 Closing Remarks Walter Lynch, President and CEO 4


Slide 7

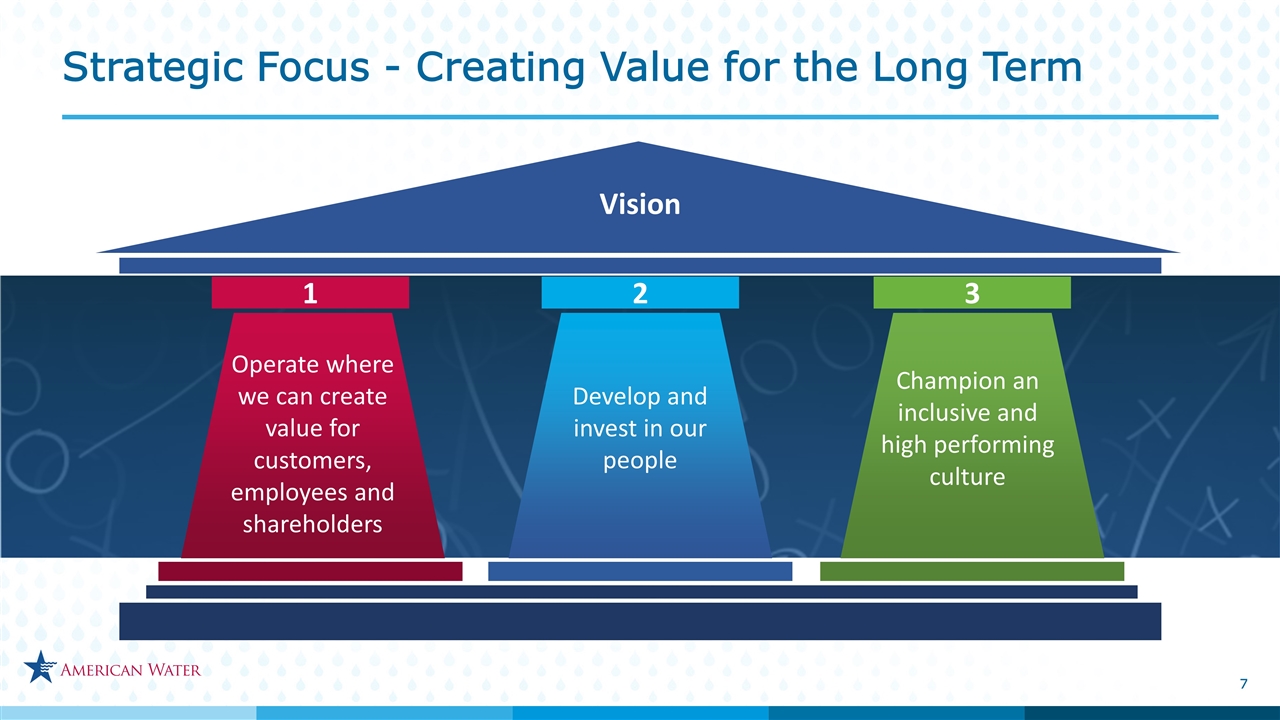
Strategic Focus - Creating Value for the Long Term 1 2 3 Vision Operate where we can create value for customers, employees and shareholders Develop and invest in our people Champion an inclusive and high performing culture


Slide 8

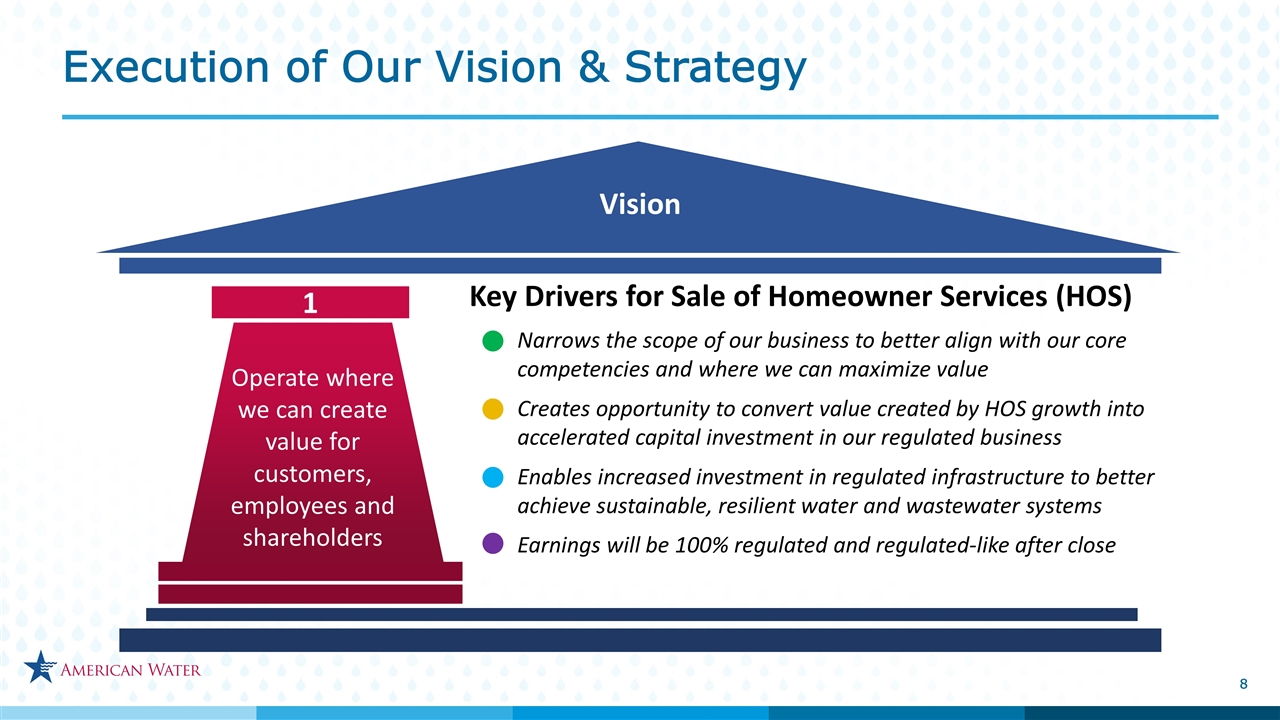
Execution of Our Vision & Strategy Key Drivers for Sale of Homeowner Services (HOS) Narrows the scope of our business to better align with our core competencies and where we can maximize value Creates opportunity to convert value created by HOS growth into accelerated capital investment in our regulated business Enables increased investment in regulated infrastructure to better achieve sustainable, resilient water and wastewater systems Earnings will be 100% regulated and regulated-like after close Vision 1 Operate where we can create value for customers, employees and shareholders Operate where we can create value for customers, employees and shareholders


Slide 9

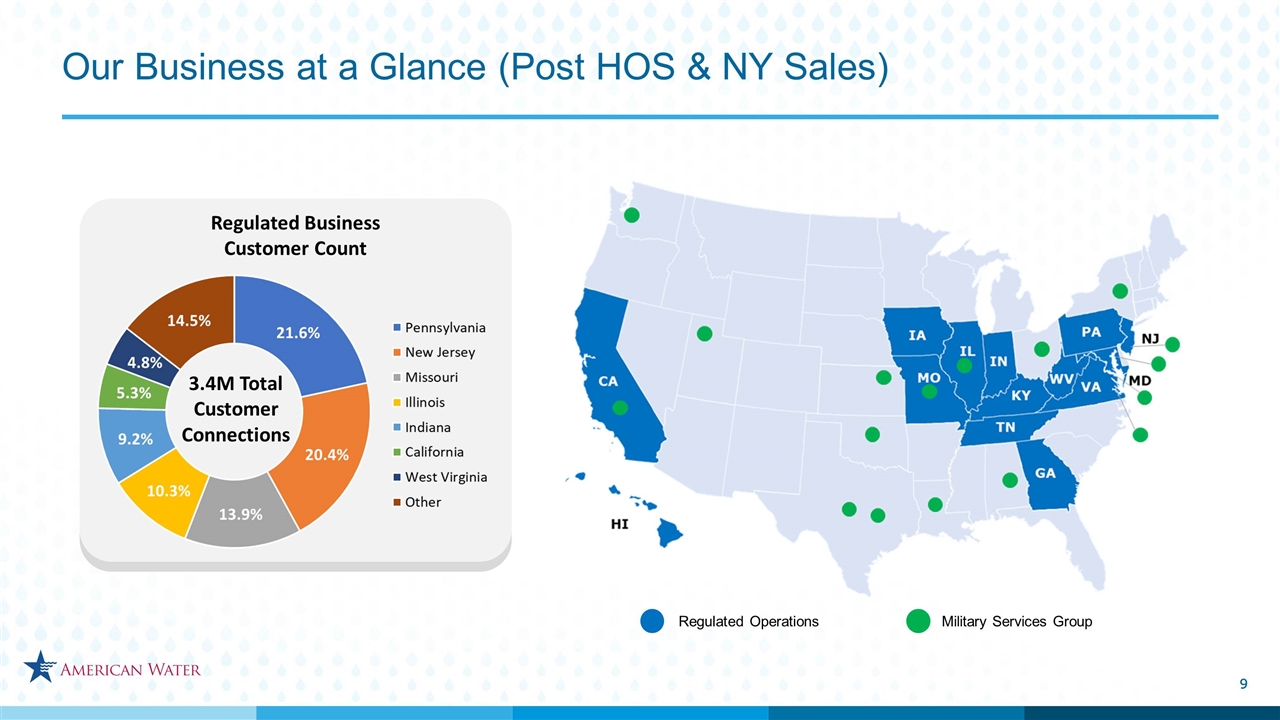
Our Business at a Glance (Post HOS & NY Sales) Regulated Operations Military Services Group Regulated Business Customer Count 3.4M Total Customer Connections


Slide 10

7-9% EPS CAGR target 2022-2026 Plan Regulated Investment CAPEX Regulated Investment CAPEX ~0.5% 5-7% 2-3% Regulated Investment CAPEX Regulated Acquisitions ~1% 5-7% 1.5-2.5% ≈0.2% Business Mix 100% Regulated and Regulated-Like Earnings Military Services Group Our Industry-Leading Growth Outlook


Slide 11

$11.5 - $12.0 $1.5 - $2.0 $25 - $28 $3 - $4 2022 – 2026 $13 - $14 2022 – 2031 $28 - $32 $2.0 $0.5 2022 $2.5 Regulated System Investments Regulated Acquisitions 2022-2031 Average Regulated Capital Expenditures by Purpose Capital Plan ($ in billions) Accelerating Capital Investment Infrastructure Renewal Operational Efficiency, Technology & Innovation Water Quality Resiliency System Expansion Other


Slide 12

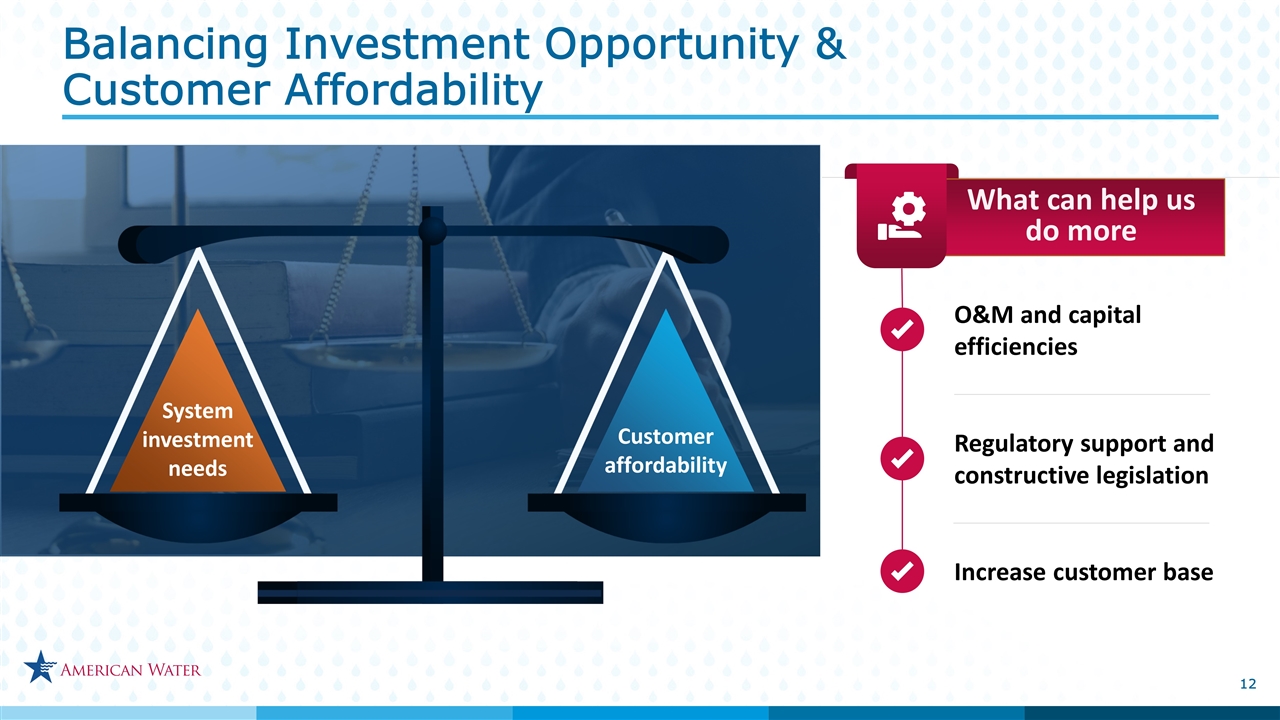
What can help us do more System investment needs Customer affordability O&M and capital efficiencies Regulatory support and constructive legislation Increase customer base Balancing Investment Opportunity & Customer Affordability


Slide 13

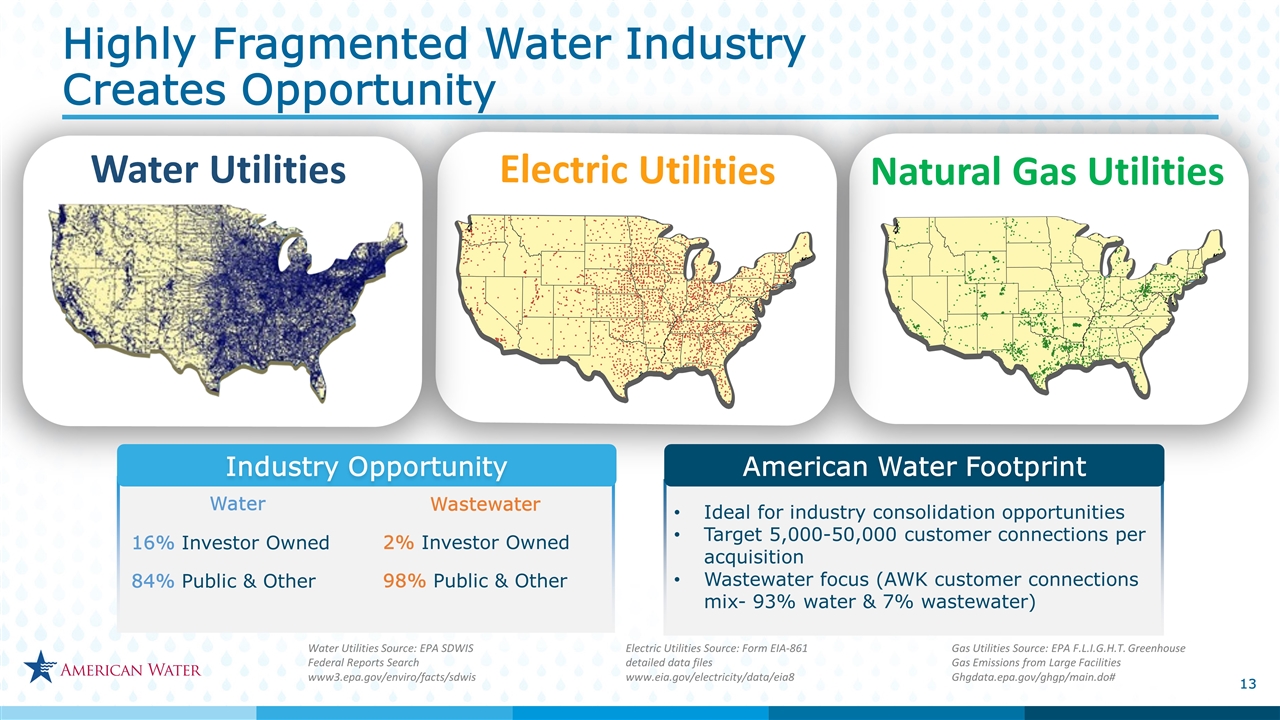
Natural Gas Utilities Electric Utilities Water Utilities Water Utilities Source: EPA SDWIS Federal Reports Search www3.epa.gov/enviro/facts/sdwis Electric Utilities Source: Form EIA-861 detailed data files www.eia.gov/electricity/data/eia8 Gas Utilities Source: EPA F.L.I.G.H.T. Greenhouse Gas Emissions from Large Facilities Ghgdata.epa.gov/ghgp/main.do# Industry Opportunity Water 16% Investor Owned 84% Public & Other Wastewater 2% Investor Owned 98% Public & Other American Water Footprint Ideal for industry consolidation opportunities Target 5,000-50,000 customer connections per acquisition Wastewater focus (AWK customer connections mix- 93% water & 7% wastewater) Highly Fragmented Water Industry Creates Opportunity


Slide 14

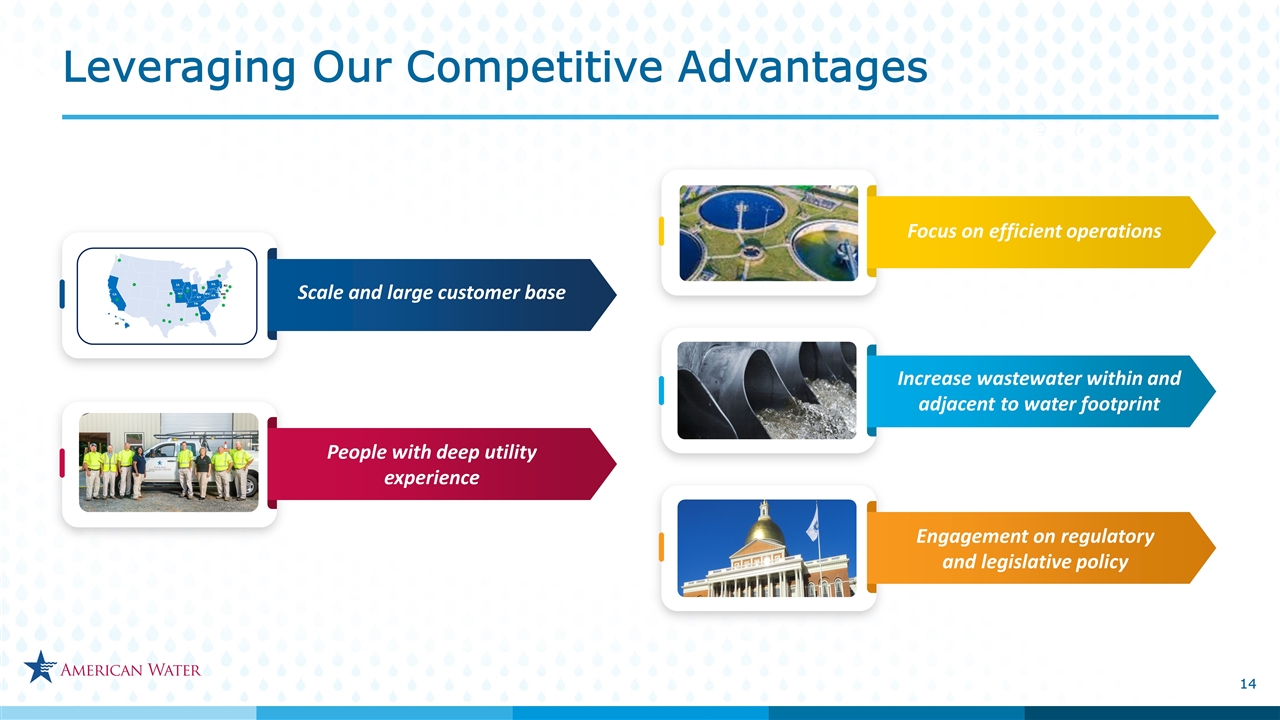
Engagement on regulatory and legislative policy Focus on Efficient Operations Scale and large customer base People with deep utility experience Increase wastewater within and adjacent to water footprint Focus on efficient operations Leveraging Our Competitive Advantages


Slide 15

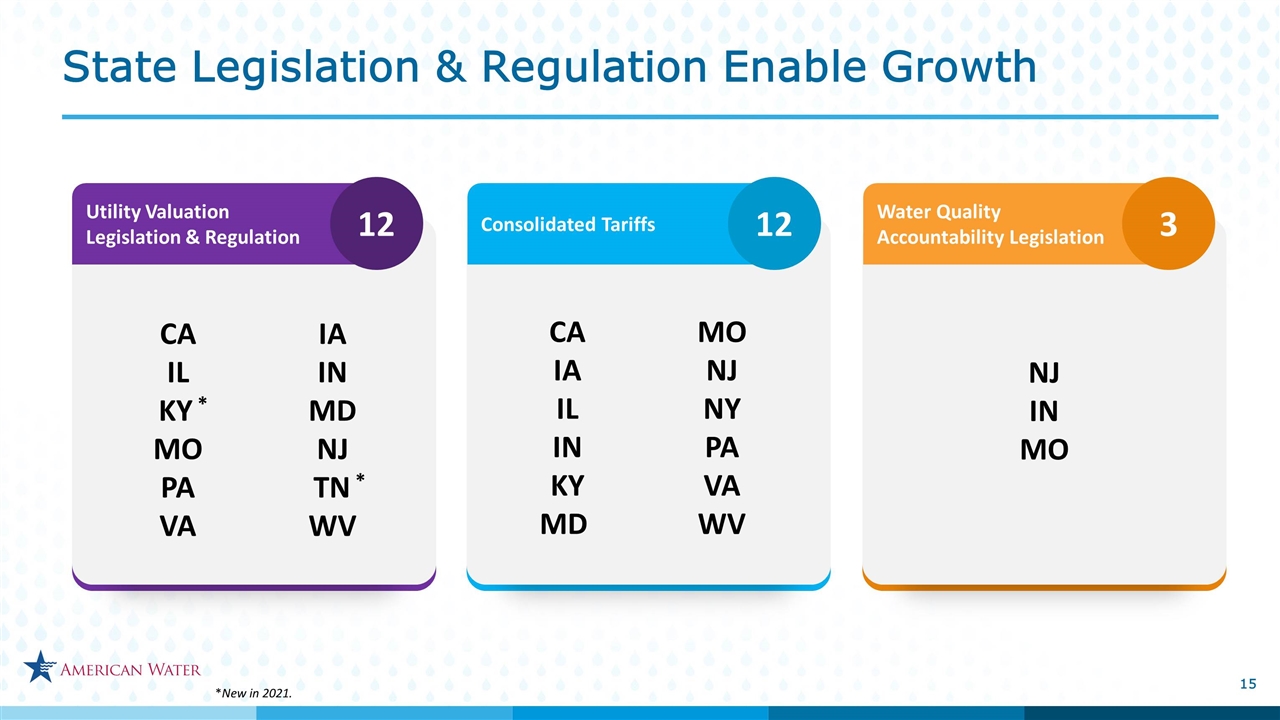
State Legislation & Regulation Enable Growth Utility Valuation Legislation & Regulation Consolidated Tariffs Water Quality Accountability Legislation 12 12 3 CA IL KY * MO PA VA IA IN MD NJ TN * WV CA IA IL IN KY MD MO NJ NY PA VA WV NJ IN MO *New in 2021.


Slide 16

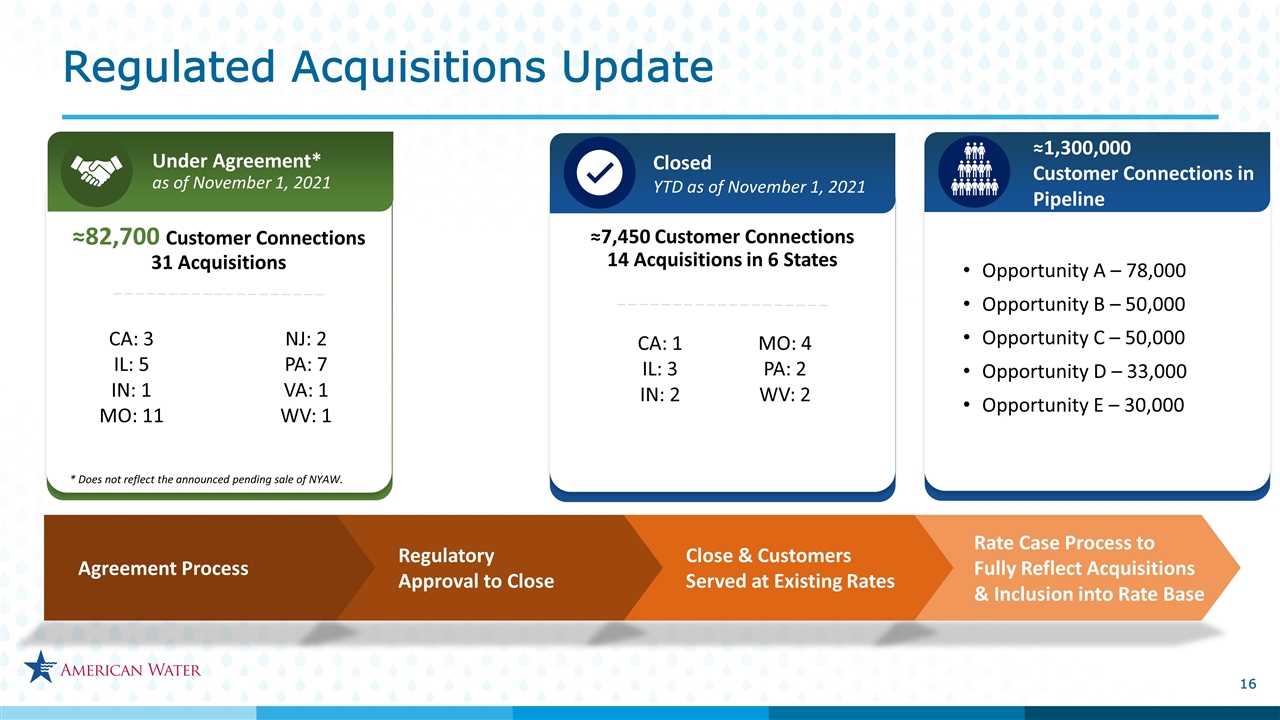
Rate Case Process to Fully Reflect Acquisitions & Inclusion into Rate Base Close & Customers Served at Existing Rates Regulatory Approval to Close Agreement Process Growing Opportunity for Customer Connections Over Five-Year Outlook Under Agreement* as of November 1, 2021 ≈82,700 Customer Connections 31 Acquisitions Closed YTD as of November 1, 2021 CA: 3 IL: 5 IN: 1 MO: 11 NJ: 2 PA: 7 VA: 1 WV: 1 ≈7,450 Customer Connections 14 Acquisitions in 6 States * Does not reflect the announced pending sale of NYAW. CA: 1 IL: 3 IN: 2 MO: 4 PA: 2 WV: 2 ≈1,300,000 Customer Connections in Pipeline Opportunity A – 78,000 Opportunity B – 50,000 Opportunity C – 50,000 Opportunity D – 33,000 Opportunity E – 30,000 Regulated Acquisitions Update


Slide 17

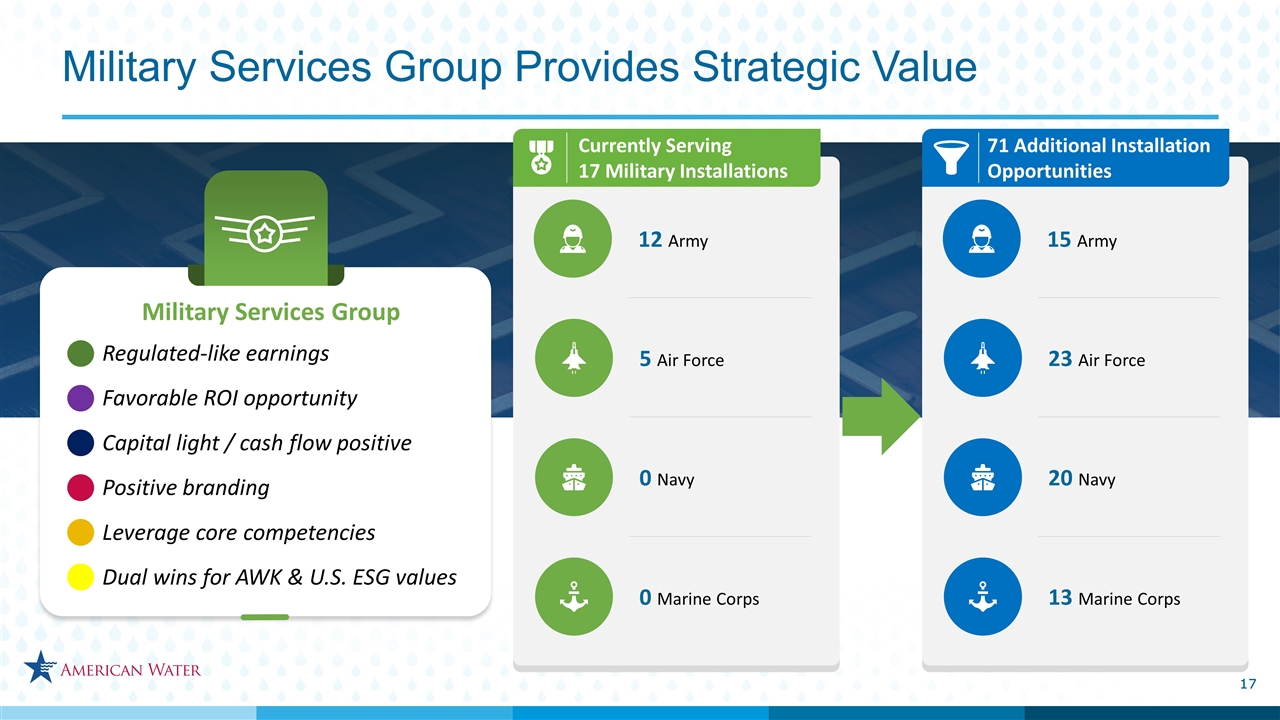
Regulated-like earnings Favorable ROI opportunity Capital light / cash flow positive Positive branding Leverage core competencies Dual wins for AWK & U.S. ESG values Military Services Group Currently Serving 17 Military Installations Military Services Group Provides Strategic Value 5 Air Force 0 Navy 0 Marine Corps 12 Army 71 Additional Installation Opportunities 23 Air Force 20 Navy 13 Marine Corps 15 Army


Slide 18

Objectives for the Next Five Years: 2022-2026 Plan Advance infrastructure improvement through five-year capital investment plan of approximately $13 - $14 billion and expected ten-year plan of approximately $28 - $32 billion Accelerate growth through acquisitions Strengthen position as leading Environmental, Social and Governance (ESG) investment Focus on customer affordability by continuing to drive O&M efficiency through strategic approach to managing costs Optimize recovery of capital investment through effective regulatory strategies AWK Growth Outlook 7-9% EPS CAGR Target Regulated Investment CAPEX Regulated Investment CAPEX ~0.5% 5-7% 2-3% Regulated Investment CAPEX Regulated Acquisitions ~1% 5-7% 1.5-2.5% Military Services Group ≈0.2% Business Mix 100% Regulated and Regulated-Like Earnings


Slide 19

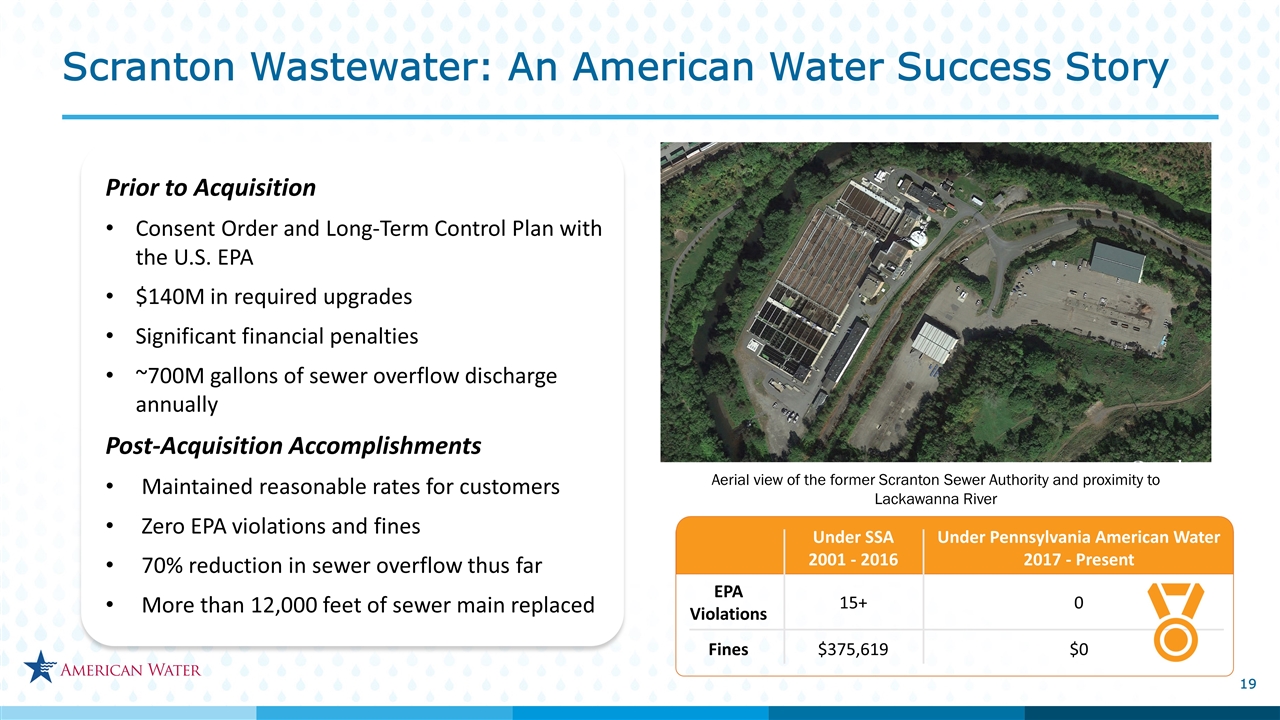
Scranton Wastewater: An American Water Success Story Aerial view of the former Scranton Sewer Authority and proximity to Lackawanna River Prior to Acquisition Consent Order and Long-Term Control Plan with the U.S. EPA $140M in required upgrades Significant financial penalties ~700M gallons of sewer overflow discharge annually Post-Acquisition Accomplishments Maintained reasonable rates for customers Zero EPA violations and fines 70% reduction in sewer overflow thus far More than 12,000 feet of sewer main replaced Under SSA 2001 - 2016 Under Pennsylvania American Water 2017 - Present EPA Violations 15+ 0 Fines $375,619 $0


Slide 20

Cheryl Norton Executive VP & Chief Operating Officer


Slide 21

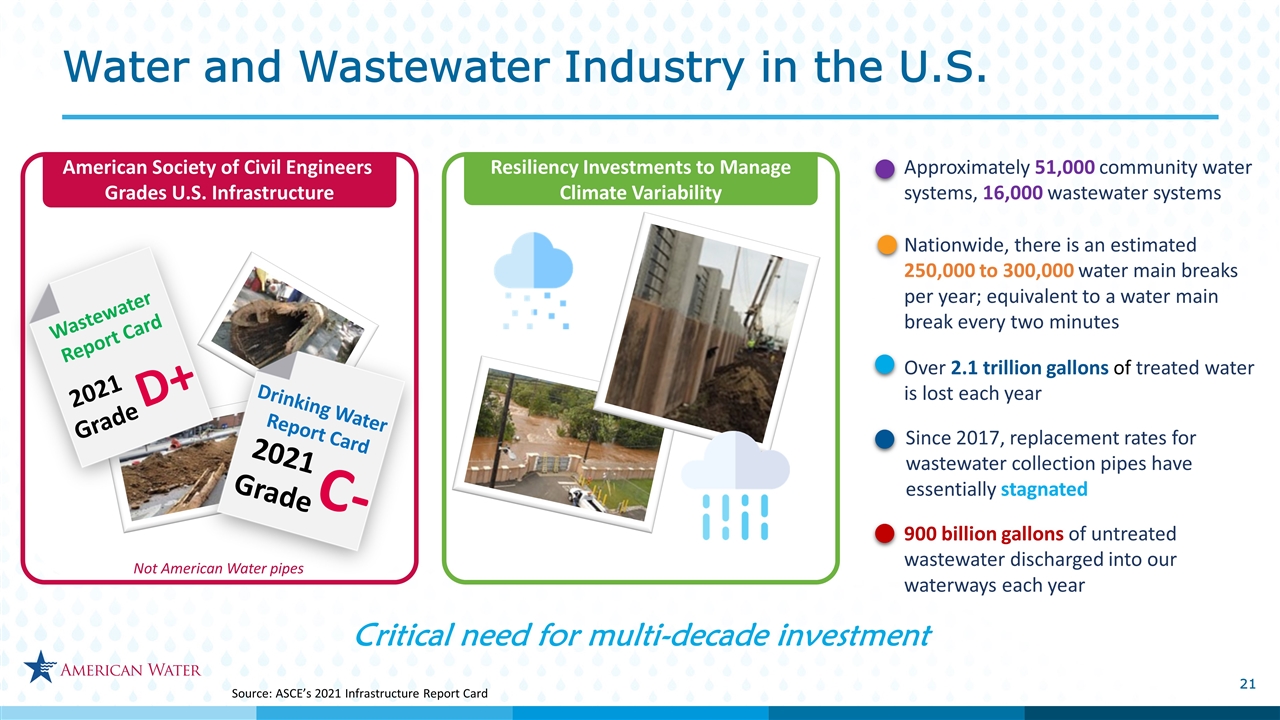
Water and Wastewater Industry in the U.S. 2021 Grade Drinking Water Report Card C- Not American Water pipes 2021 Grade Wastewater Report Card D+ Critical need for multi-decade investment Approximately 51,000 community water systems, 16,000 wastewater systems Nationwide, there is an estimated 250,000 to 300,000 water main breaks per year; equivalent to a water main break every two minutes Over 2.1 trillion gallons of treated water is lost each year American Society of Civil Engineers Grades U.S. Infrastructure Resiliency Investments to Manage Climate Variability Since 2017, replacement rates for wastewater collection pipes have essentially stagnated 900 billion gallons of untreated wastewater discharged into our waterways each year Source: ASCE’s 2021 Infrastructure Report Card


Slide 22

Capital Plan ($ in billions) $1.6 $8.9 $1.4 - $1.6 $19 - $21 $3 - $4 $10.3 - $10.5 $22 - $25 $1.9 $0.3 2021 2021 – 2025 (Prior Plan) 2021 – 2030 (Prior Plan) $2.0 $0.5 $2.5 $11.5 - $12.0 $1.5 - $2.0 $13 - $14 $25 - $28 $3 - $4 $28 - $32 Regulated System Investments Regulated Acquisitions 2022 2022 – 2026 2022 – 2031 5 Year Capital Increase: ≈$3B 10 Year Capital Increase: ≈$6B Increase in Regulated Investment of $3 Billion Over the Next 5 Years and $6 Billion over 10 Years


Slide 23

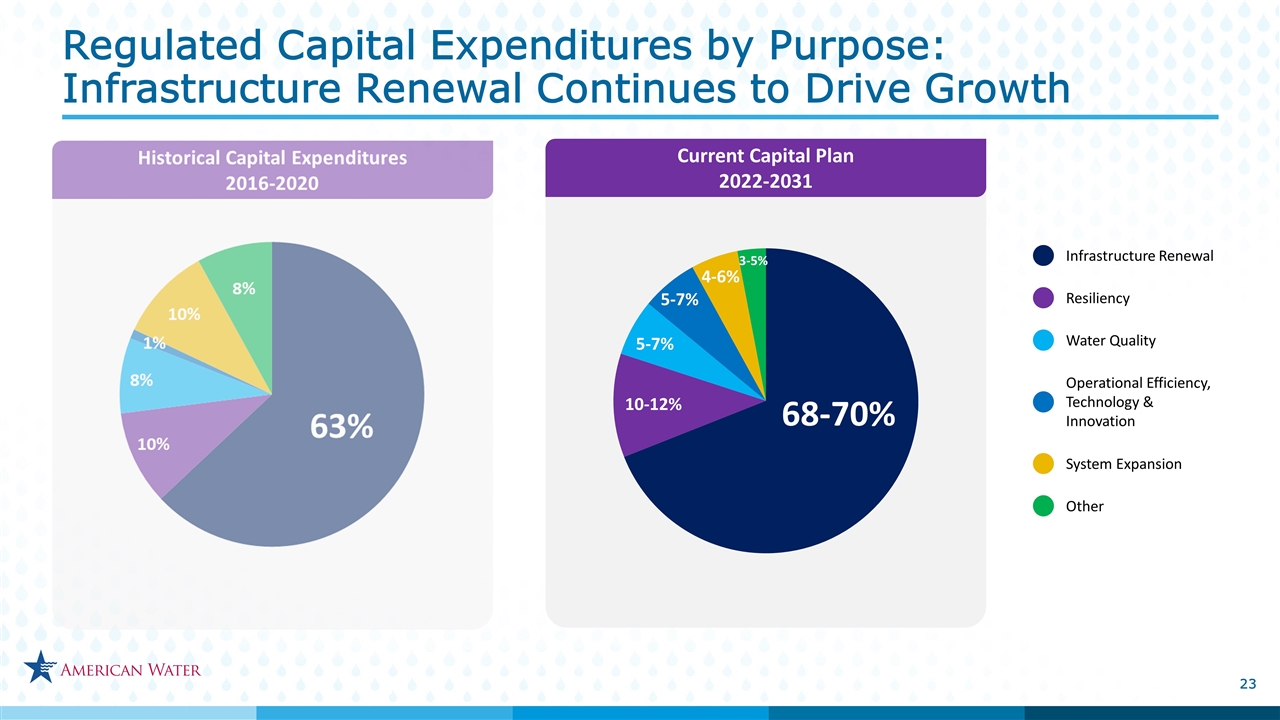
Regulated Capital Expenditures by Purpose: Infrastructure Renewal Continues to Drive Growth Infrastructure Renewal Operational Efficiency, Technology & Innovation Water Quality Resiliency System Expansion Other Current Capital Plan 2022-2031


Slide 24

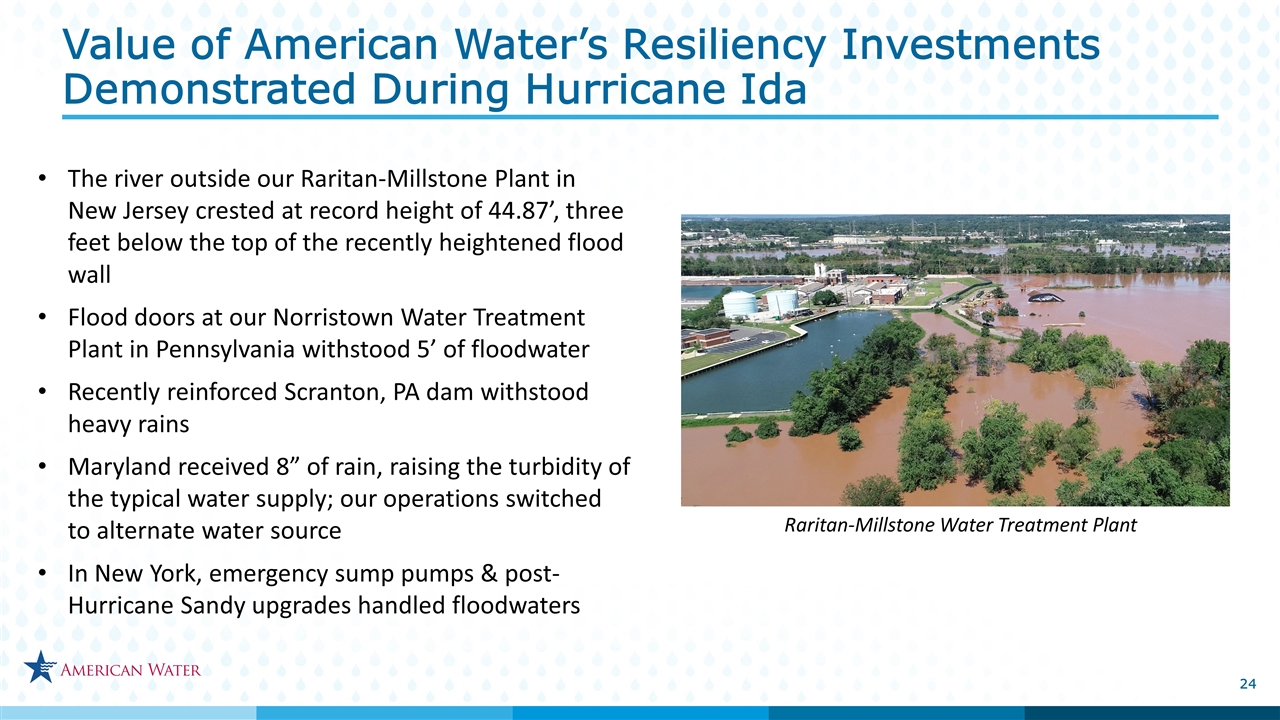
Value of American Water’s Resiliency Investments Demonstrated During Hurricane Ida The river outside our Raritan-Millstone Plant in New Jersey crested at record height of 44.87’, three feet below the top of the recently heightened flood wall Flood doors at our Norristown Water Treatment Plant in Pennsylvania withstood 5’ of floodwater Recently reinforced Scranton, PA dam withstood heavy rains Maryland received 8” of rain, raising the turbidity of the typical water supply; our operations switched to alternate water source In New York, emergency sump pumps & post-Hurricane Sandy upgrades handled floodwaters Raritan-Millstone Water Treatment Plant


Slide 25

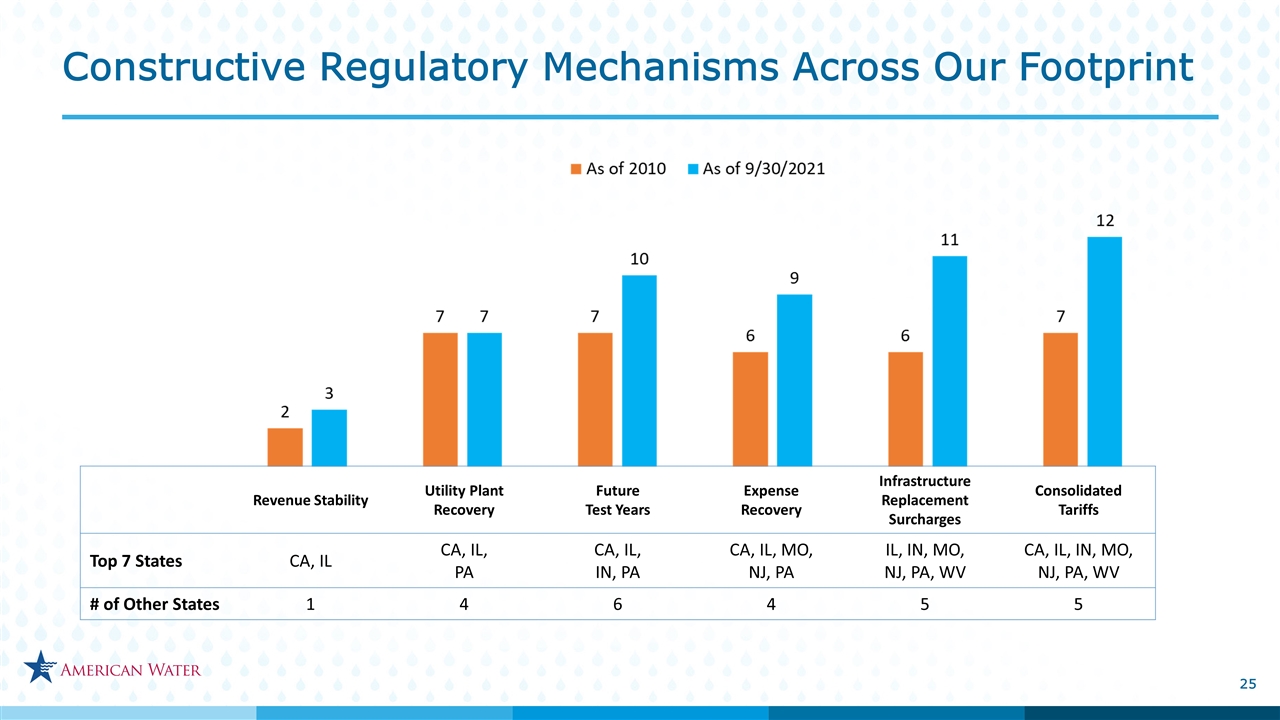
Constructive Regulatory Mechanisms Across Our Footprint Revenue Stability Utility Plant Recovery Future Test Years Expense Recovery Infrastructure Replacement Surcharges Consolidated Tariffs Top 7 States CA, IL CA, IL, PA CA, IL, IN, PA CA, IL, MO, NJ, PA IL, IN, MO, NJ, PA, WV CA, IL, IN, MO, NJ, PA, WV # of Other States 1 4 6 4 5 5


Slide 26

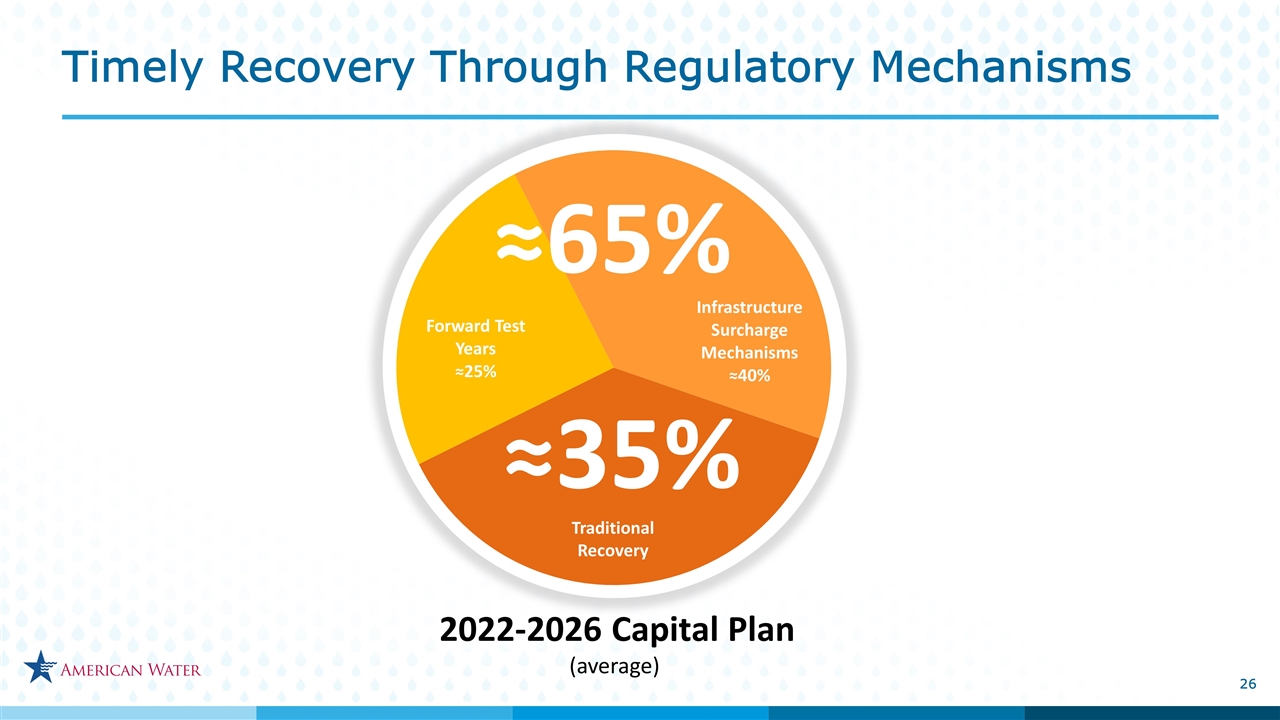
Timely Recovery Through Regulatory Mechanisms 2022-2026 Capital Plan (average) Traditional Recovery Forward Test Years (25%) Infrastructure Surcharge Mechanisms (38%) ≈35% ≈65%


Slide 27

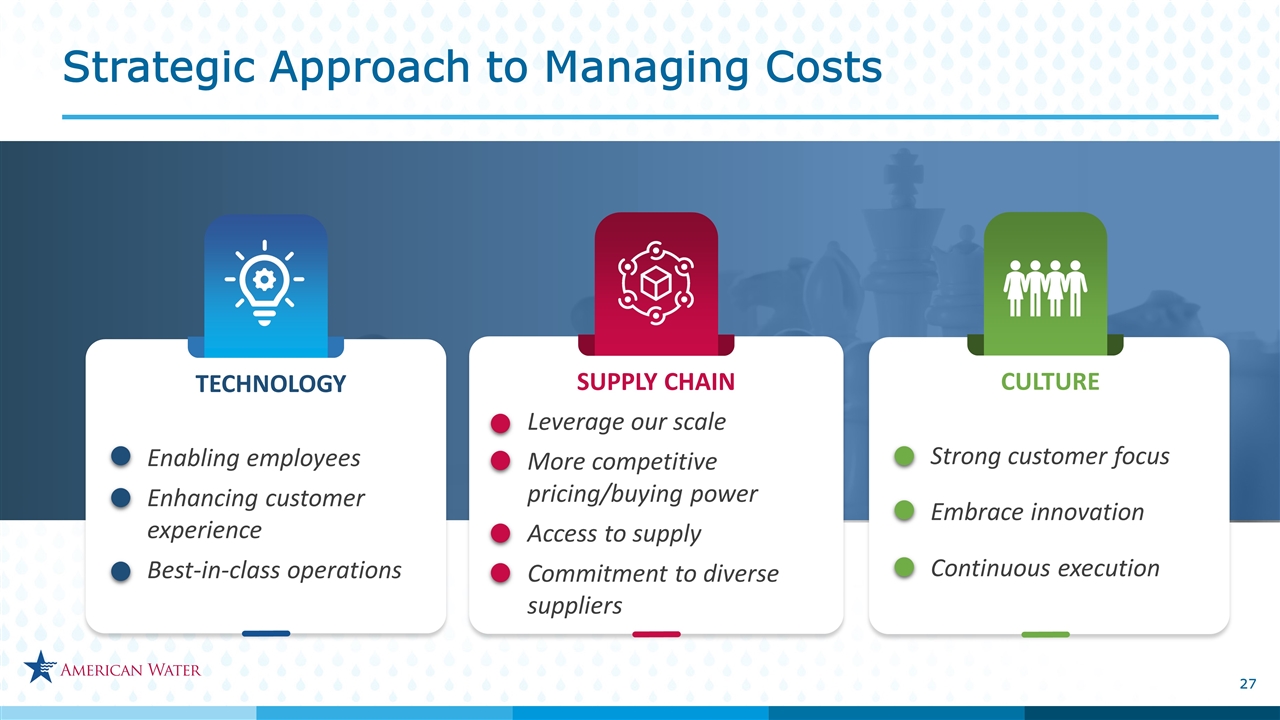
Strong customer focus Embrace innovation Continuous execution CULTURE SUPPLY CHAIN Enabling employees Enhancing customer experience Best-in-class operations TECHNOLOGY Leverage our scale More competitive pricing/buying power Access to supply Commitment to diverse suppliers Strategic Approach to Managing Costs


Slide 28

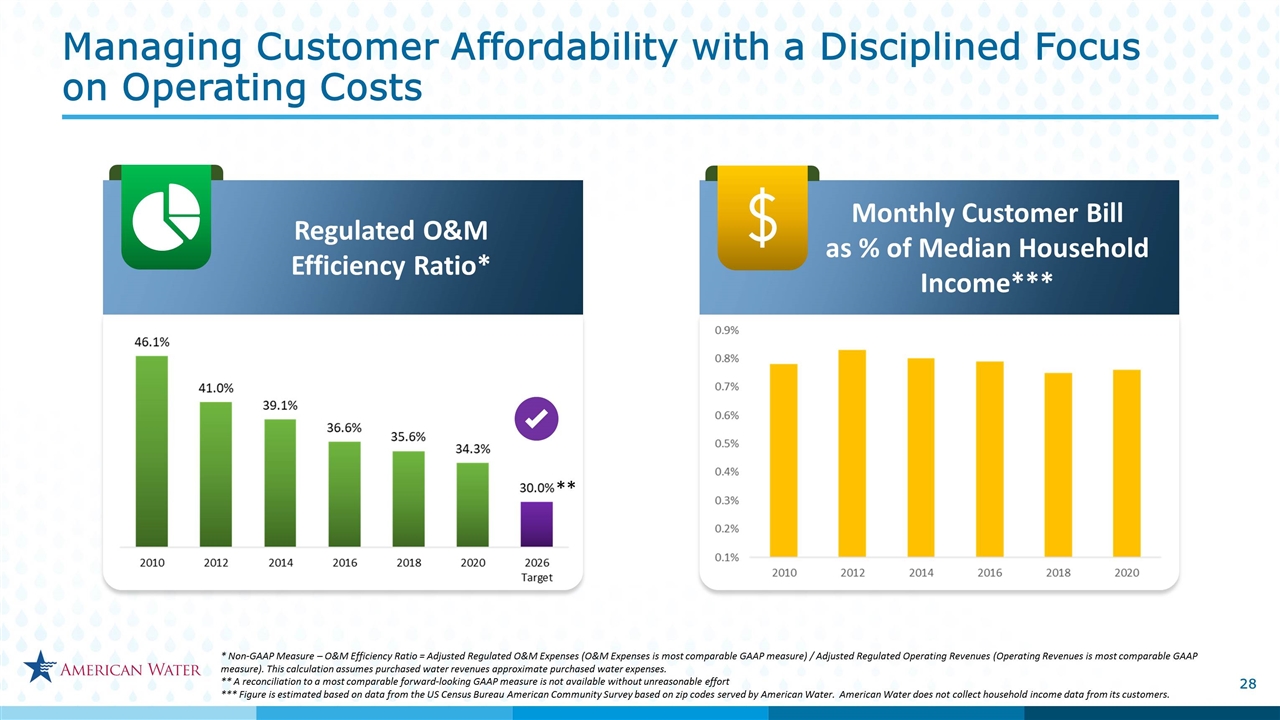
Monthly Customer Bill as % of Median Household Income*** Managing Customer Affordability with a Disciplined Focus on Operating Costs Regulated O&M Efficiency Ratio* * Non-GAAP Measure – O&M Efficiency Ratio = Adjusted Regulated O&M Expenses (O&M Expenses is most comparable GAAP measure) / Adjusted Regulated Operating Revenues (Operating Revenues is most comparable GAAP measure). This calculation assumes purchased water revenues approximate purchased water expenses. ** A reconciliation to a most comparable forward-looking GAAP measure is not available without unreasonable effort *** Figure is estimated based on data from the US Census Bureau American Community Survey based on zip codes served by American Water. American Water does not collect household income data from its customers. **


Slide 29

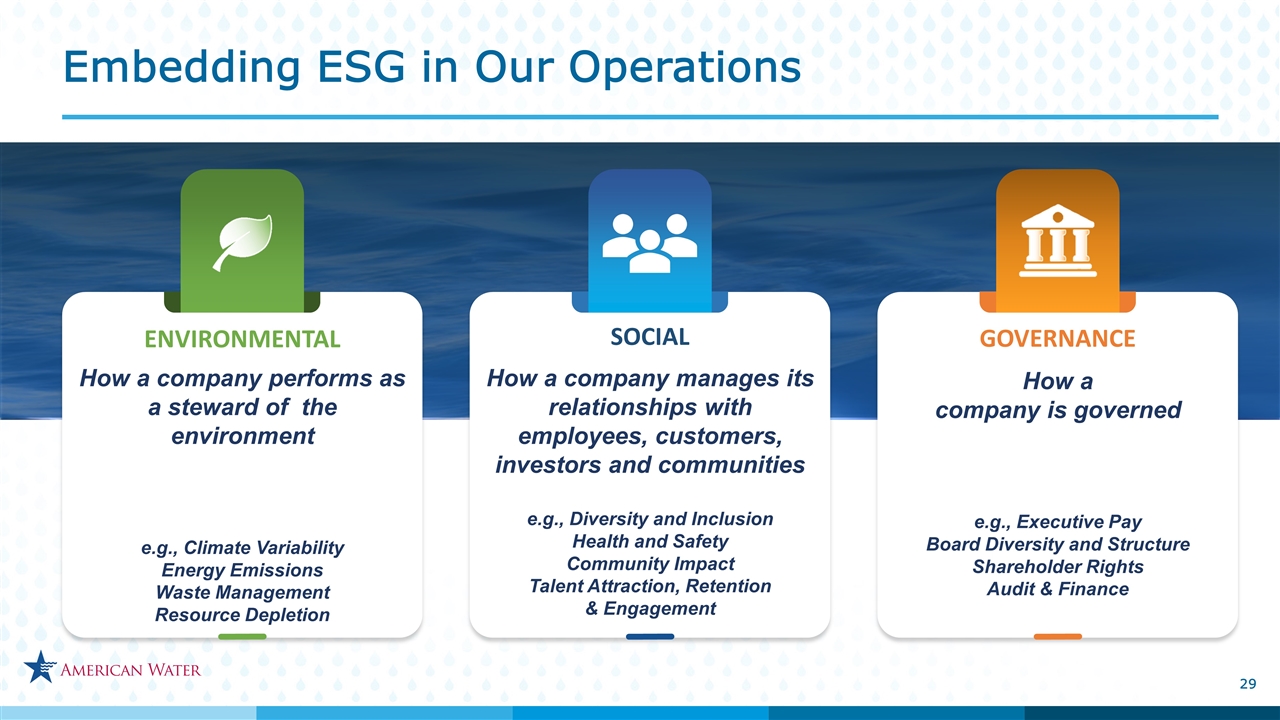
Embedding ESG in Our Operations How a company performs as a steward of the environment e.g., Climate Variability Energy Emissions Waste Management Resource Depletion ENVIRONMENTAL How a company is governed e.g., Executive Pay Board Diversity and Structure Shareholder Rights Audit & Finance GOVERNANCE How a company manages its relationships with employees, customers, investors and communities e.g., Diversity and Inclusion Health and Safety Community Impact Talent Attraction, Retention & Engagement SOCIAL


Slide 30

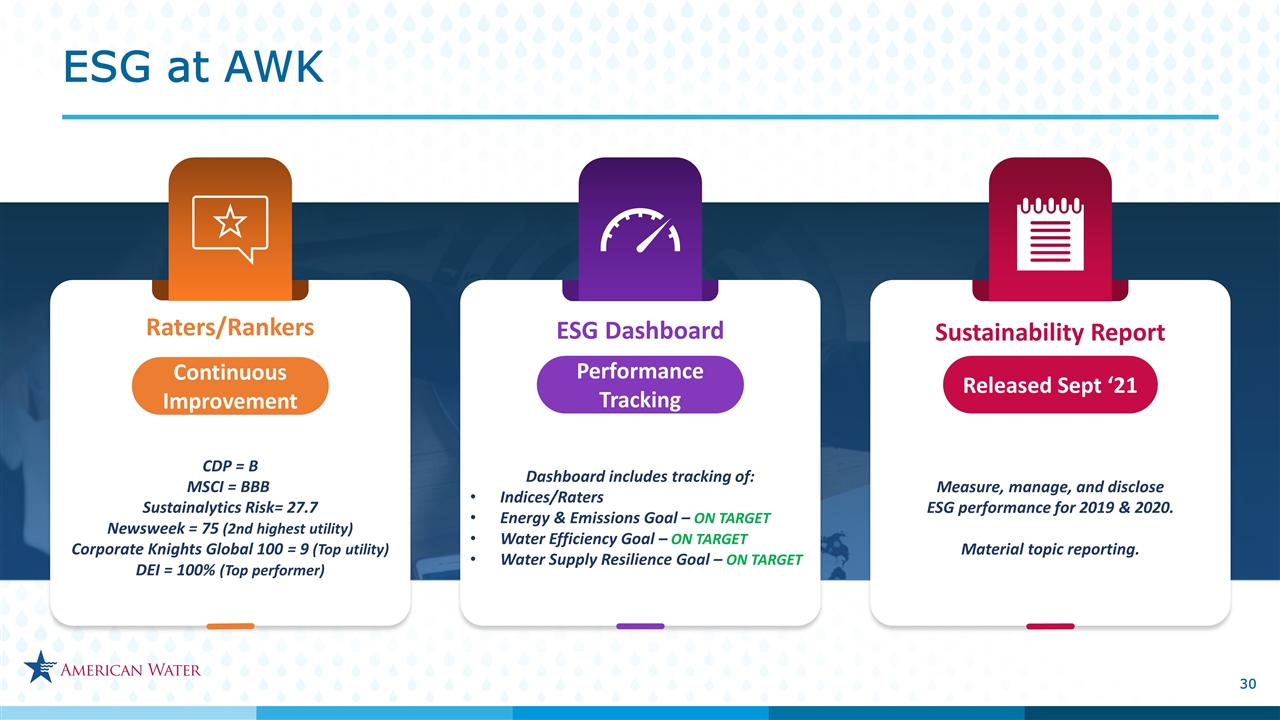
Raters/Rankers Continuous Improvement CDP = B MSCI = BBB  Sustainalytics Risk= 27.7 Newsweek = 75 (2nd highest utility) Corporate Knights Global 100 = 9 (Top utility) DEI = 100% (Top performer) ESG Dashboard Performance Tracking Dashboard includes tracking of: Indices/Raters Energy & Emissions Goal – ON TARGET Water Efficiency Goal – ON TARGET Water Supply Resilience Goal – ON TARGET Sustainability Report Measure, manage, and disclose ESG performance for 2019 & 2020. Material topic reporting. Released Sept ‘21 ESG at AWK


Slide 31

Susan Hardwick Executive VP & Chief Financial Officer


Slide 32

EPS Contribution by Business   Nine Months Ended 9/30/2021 Nine Months Ended 9/30/2020 Change     Regulated $3.43 $3.09 $0.34     Market-Based $0.32 $0.37 ($0.05)     Parent Interest & Other ($0.35) ($0.35) $0.00     Total EPS $3.40 $3.11 $0.29   EPS Contribution by Business Three Months Ended 9/30/2021 Three Months Ended 9/30/2020 Change Regulated $1.51 $1.44 $0.07 Market-Based $0.12 $0.12 $0.00 Parent Interest & Other ($0.10) ($0.10) $0.00   Total EPS $1.53 $1.46 $0.07   Third Quarter 2021 Results YTD 2021 Results Continued Execution on Our Strategy


Slide 33

2021 Guidance Affirmed; Initiating 2022 EPS Guidance 2020 2022 2026 & Beyond 2020 EPS 2022 EPS Guidance 7-9% EPS CAGR Target $4.49 $4.39 $3.91 7-9% EPS CAGR Target 2022 EPS Guidance $4.39 - $4.49 2020 EPS includes $0.07 per share of favorable weather; $3.84 per share weather normalized 2021 2021 EPS Guidance $4.28 $4.18


Slide 34

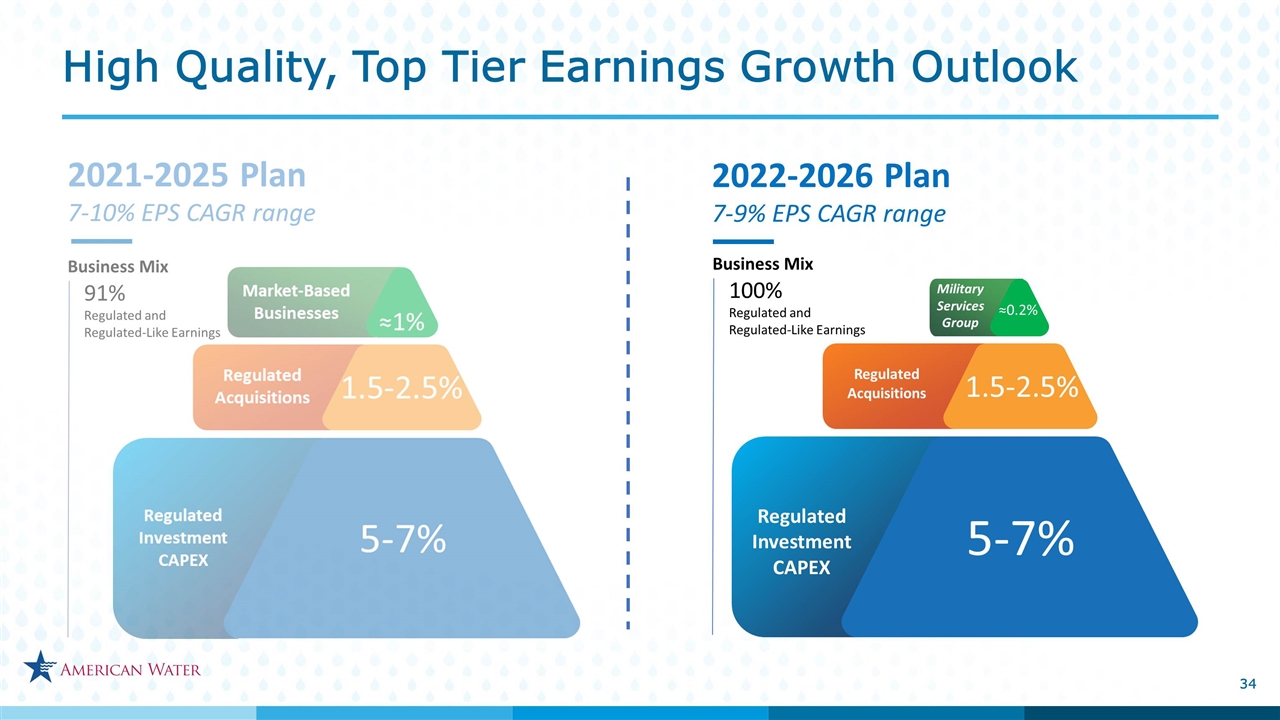
2022-2026 Plan 7-9% EPS CAGR range Regulated Investment CAPEX Regulated Investment CAPEX ~0.5% 5-7% 2-3% Regulated Investment CAPEX Regulated Acquisitions ~1% 5-7% 1.5-2.5% ≈0.2% Business Mix 100% Regulated and Regulated-Like Earnings Business Mix 91% Regulated and Regulated-Like Earnings 2021-2025 Plan 7-10% EPS CAGR range Military Services Group High Quality, Top Tier Earnings Growth Outlook


Slide 35

Investment in Rate Base is the Foundation of Our Growth ≈8-9% Rate base CAGR Estimated Rate Base* Net Utility Plant $21.0 Less Advances for Construction $0.3 CIAC - Contributions in Aid of Construction $1.4 Net Deferred income taxes $3.4 As of 9/30/2021 $5.1 Total Estimated Rate Base $15.9 *An approximation of rate base, which includes Net Utility Plant not yet included in rate base pending rate case filings/outcomes. Amounts may not sum due to rounding. ($ in billions)


Slide 36

($ in millions) Sale Proceeds Cash at Closing $480 Additional Cash Proceeds Due 2023 $75 Seller’s Note Receivable Due 2026 $720 Total Deal Value$1,275 Long Term Value Creation: Transaction is an opportunity to transfer value created in HOS into accelerated investment in the Regulated Business Initial cash proceeds to be redeployed into the Regulated Business to fund near-term incremental capital investments Seller’s Note Receivable bearing 7% annual interest rate with a five-year term to provide a stream of earnings until maturity Proceeds from the Seller’s Note at maturity to fund additional investment in the Regulated Business Separate revenue sharing agreement adds another source of ongoing earnings Homeowner Services Transaction Creates Long Term Value


Slide 37

($ in millions) Prior Plan 2021-2025 Financing Changes to Fund Incremental $3B in Capital Plan Current Plan 2022-2026 Financing Our Increase in Regulated Investments Operating Cash Flows $8,500 Debt Financing $3,600 Sale Proceeds (NYAW) $500 Equity Issuance $700 Operating Cash Flows $8,700 Debt Financing $5,200 Sale Proceeds (NYAW & HOS) $1,500 Equity Issuance** $1,100 Equity Financing Sources ≈47% Debt Financing Sources ≈53% Debt Financing +$1,600 Sale Proceeds (HOS)* +$1,000 Equity Issuance +$400 ≈$3,000 ** Equity Issuance timing shifted one year out in 5-year plan compared to prior plan * Initial proceeds from HOS sale of $480, gross, and $720, gross, at note maturity at end of 2026; $1,000 total proceeds after tax


Slide 38

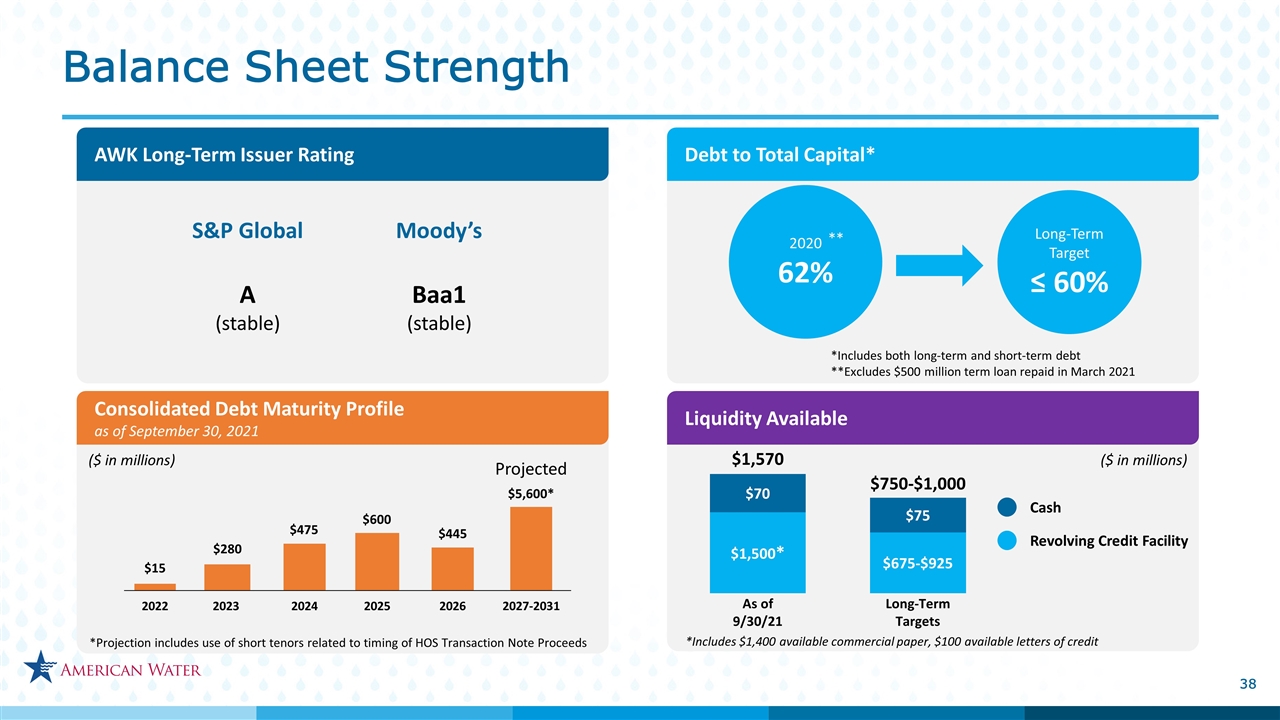
Balance Sheet Strength AWK Long-Term Issuer Rating Consolidated Debt Maturity Profile as of September 30, 2021 Liquidity Available A (stable) Baa1 (stable) S&P Global Moody’s $15 2022 $280 2023 $475 2024 $600 2025 2026 $445 $1,500* As of 9/30/21 $70 $1,570 $675-$925 Long-Term Targets $75 $750-$1,000 Revolving Credit Facility Cash 2027-2031 $5,600* Projected *Includes $1,400 available commercial paper, $100 available letters of credit *Projection includes use of short tenors related to timing of HOS Transaction Note Proceeds Debt to Total Capital* 2020 62% Long-Term Target ≤ 60% *Includes both long-term and short-term debt **Excludes $500 million term loan repaid in March 2021 ** ($ in millions) ($ in millions)


Slide 39

Consistently Strong Dividend Growth * Future dividends are subject to approval of the American Water Board of Directors Long Term Dividend Growth Target at High End of 7-10%* Target Dividend Payout Ratio 55-60% 10% Dividend CAGR 2016-2021


Slide 40

Operating and Financial Strategies Support Continued Strong Shareholder Returns 5-Year Cumulative Total Shareholder Return* * As of 10/22/21 end date. Source: FactSet. AWK Growth Outlook 7-9% EPS CAGR range Regulated Investment CAPEX Regulated Investment CAPEX ~0.5% 5-7% 2-3% Regulated Investment CAPEX Regulated Acquisitions ~1% 5-7% 1.5-2.5% ≈0.2% Business Mix 100% Regulated and Regulated-Like Earnings Military Services Group


Slide 41

Walter Lynch President and Chief Executive Officer


Slide 42

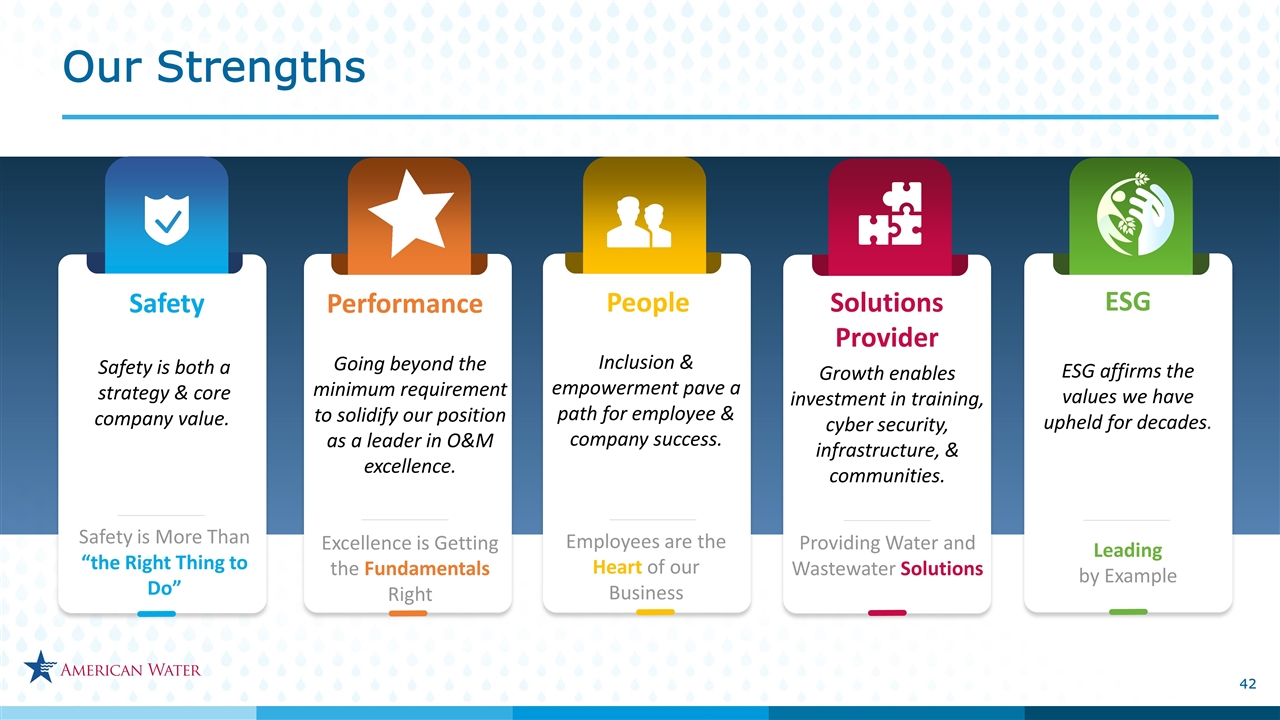
Our Strengths People Inclusion & empowerment pave a path for employee & company success. Employees are the Heart of our Business Performance Safety is both a strategy & core company value.  Safety is More Than “the Right Thing to Do” Safety Solutions Provider Growth enables investment in training, cyber security, infrastructure, & communities. Providing Water and Wastewater Solutions ESG ESG affirms the values we have upheld for decades. Leading by Example Going beyond the minimum requirement to solidify our position as a leader in O&M excellence. Excellence is Getting the Fundamentals Right


Slide 43

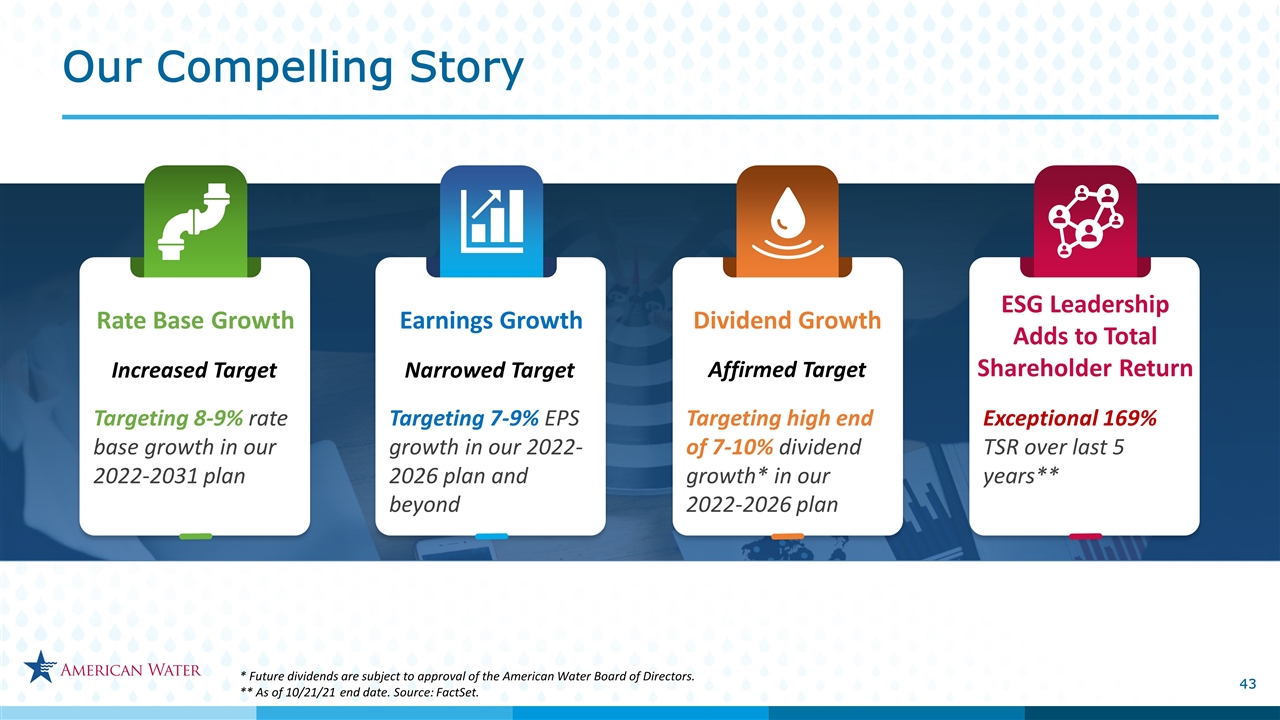
Dividend Growth Targeting high end of 7-10% dividend growth* in our 2022-2026 plan ESG Leadership Adds to Total Shareholder Return Exceptional 169% TSR over last 5 years** Earnings Growth Targeting 7-9% EPS growth in our 2022-2026 plan and beyond Rate Base Growth Targeting 8-9% rate base growth in our 2022-2031 plan * Future dividends are subject to approval of the American Water Board of Directors. ** As of 10/21/21 end date. Source: FactSet. Increased Target Narrowed Target Affirmed Target Our Compelling Story


Slide 44

5 Minute Break


Slide 45

Q&A Session


Slide 46

Investor Relations Contacts Aaron Musgrave, CPA Senior Director, Investor Relations [email protected] Michael Tavani, CFA Senior Manager, Investor Relations [email protected] Janelle McNally Senior Manager, Investor Relations & ESG [email protected] Upcoming Events November 7-9, 2021 EEI Financial Conference


Slide 47

Appendix


Slide 48

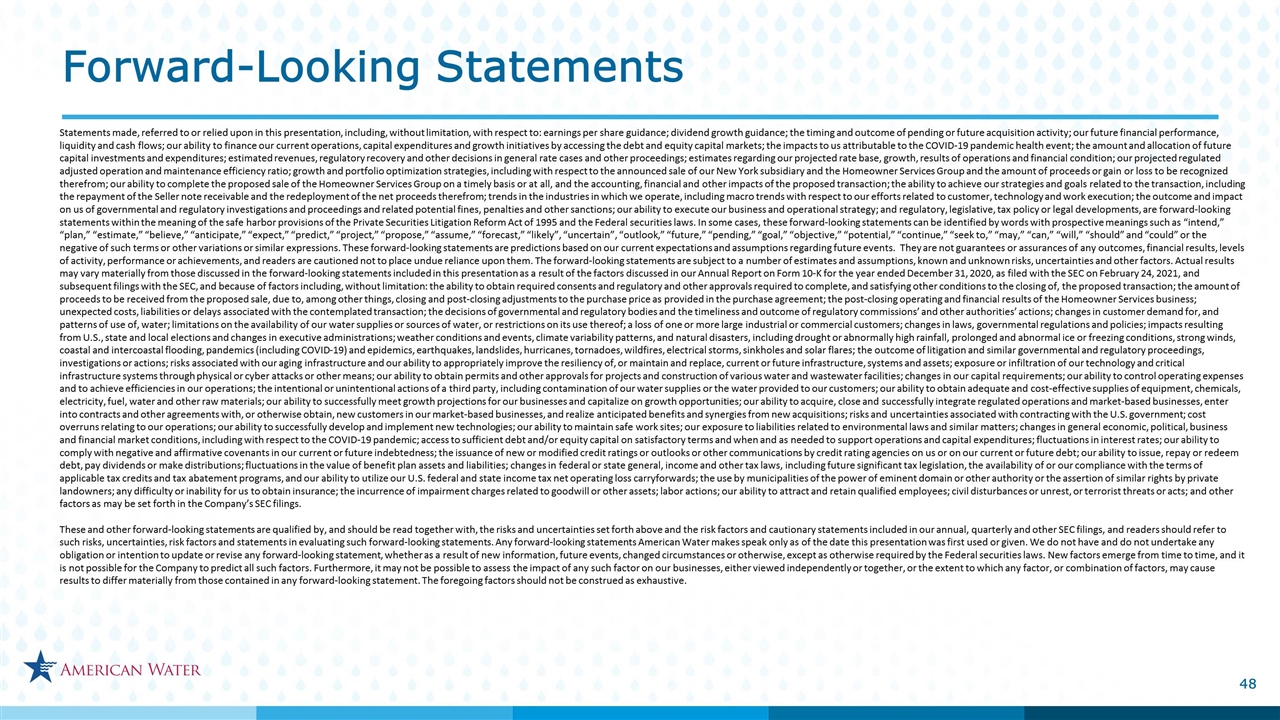
Forward-Looking Statements Statements made, referred to or relied upon in this presentation, including, without limitation, with respect to: earnings per share guidance; dividend growth guidance; the timing and outcome of pending or future acquisition activity; our future financial performance, liquidity and cash flows; our ability to finance our current operations, capital expenditures and growth initiatives by accessing the debt and equity capital markets; the impacts to us attributable to the COVID-19 pandemic health event; the amount and allocation of future capital investments and expenditures; estimated revenues, regulatory recovery and other decisions in general rate cases and other proceedings; estimates regarding our projected rate base, growth, results of operations and financial condition; our projected regulated adjusted operation and maintenance efficiency ratio; growth and portfolio optimization strategies, including with respect to the announced sale of our New York subsidiary and the Homeowner Services Group and the amount of proceeds or gain or loss to be recognized therefrom; our ability to complete the proposed sale of the Homeowner Services Group on a timely basis or at all, and the accounting, financial and other impacts of the proposed transaction; the ability to achieve our strategies and goals related to the transaction, including the repayment of the Seller note receivable and the redeployment of the net proceeds therefrom; trends in the industries in which we operate, including macro trends with respect to our efforts related to customer, technology and work execution; the outcome and impact on us of governmental and regulatory investigations and proceedings and related potential fines, penalties and other sanctions; our ability to execute our business and operational strategy; and regulatory, legislative, tax policy or legal developments, are forward-looking statements within the meaning of the safe harbor provisions of the Private Securities Litigation Reform Act of 1995 and the Federal securities laws. In some cases, these forward-looking statements can be identified by words with prospective meanings such as “intend,” “plan,” “estimate,” “believe,” “anticipate,” “expect,” “predict,” “project,” “propose,” “assume,” “forecast,” “likely”, “uncertain”, “outlook,” “future,” “pending,” “goal,” “objective,” “potential,” “continue,” “seek to,” “may,” “can,” “will,” “should” and “could” or the negative of such terms or other variations or similar expressions. These forward-looking statements are predictions based on our current expectations and assumptions regarding future events. They are not guarantees or assurances of any outcomes, financial results, levels of activity, performance or achievements, and readers are cautioned not to place undue reliance upon them. The forward-looking statements are subject to a number of estimates and assumptions, known and unknown risks, uncertainties and other factors. Actual results may vary materially from those discussed in the forward-looking statements included in this presentation as a result of the factors discussed in our Annual Report on Form 10-K for the year ended December 31, 2020, as filed with the SEC on February 24, 2021, and subsequent filings with the SEC, and because of factors including, without limitation: the ability to obtain required consents and regulatory and other approvals required to complete, and satisfying other conditions to the closing of, the proposed transaction; the amount of proceeds to be received from the proposed sale, due to, among other things, closing and post-closing adjustments to the purchase price as provided in the purchase agreement; the post-closing operating and financial results of the Homeowner Services business; unexpected costs, liabilities or delays associated with the contemplated transaction; the decisions of governmental and regulatory bodies and the timeliness and outcome of regulatory commissions’ and other authorities’ actions; changes in customer demand for, and patterns of use of, water; limitations on the availability of our water supplies or sources of water, or restrictions on its use thereof; a loss of one or more large industrial or commercial customers; changes in laws, governmental regulations and policies; impacts resulting from U.S., state and local elections and changes in executive administrations; weather conditions and events, climate variability patterns, and natural disasters, including drought or abnormally high rainfall, prolonged and abnormal ice or freezing conditions, strong winds, coastal and intercoastal flooding, pandemics (including COVID-19) and epidemics, earthquakes, landslides, hurricanes, tornadoes, wildfires, electrical storms, sinkholes and solar flares; the outcome of litigation and similar governmental and regulatory proceedings, investigations or actions; risks associated with our aging infrastructure and our ability to appropriately improve the resiliency of, or maintain and replace, current or future infrastructure, systems and assets; exposure or infiltration of our technology and critical infrastructure systems through physical or cyber attacks or other means; our ability to obtain permits and other approvals for projects and construction of various water and wastewater facilities; changes in our capital requirements; our ability to control operating expenses and to achieve efficiencies in our operations; the intentional or unintentional actions of a third party, including contamination of our water supplies or the water provided to our customers; our ability to obtain adequate and cost-effective supplies of equipment, chemicals, electricity, fuel, water and other raw materials; our ability to successfully meet growth projections for our businesses and capitalize on growth opportunities; our ability to acquire, close and successfully integrate regulated operations and market-based businesses, enter into contracts and other agreements with, or otherwise obtain, new customers in our market-based businesses, and realize anticipated benefits and synergies from new acquisitions; risks and uncertainties associated with contracting with the U.S. government; cost overruns relating to our operations; our ability to successfully develop and implement new technologies; our ability to maintain safe work sites; our exposure to liabilities related to environmental laws and similar matters; changes in general economic, political, business and financial market conditions, including with respect to the COVID-19 pandemic; access to sufficient debt and/or equity capital on satisfactory terms and when and as needed to support operations and capital expenditures; fluctuations in interest rates; our ability to comply with negative and affirmative covenants in our current or future indebtedness; the issuance of new or modified credit ratings or outlooks or other communications by credit rating agencies on us or on our current or future debt; our ability to issue, repay or redeem debt, pay dividends or make distributions; fluctuations in the value of benefit plan assets and liabilities; changes in federal or state general, income and other tax laws, including future significant tax legislation, the availability of or our compliance with the terms of applicable tax credits and tax abatement programs, and our ability to utilize our U.S. federal and state income tax net operating loss carryforwards; the use by municipalities of the power of eminent domain or other authority or the assertion of similar rights by private landowners; any difficulty or inability for us to obtain insurance; the incurrence of impairment charges related to goodwill or other assets; labor actions; our ability to attract and retain qualified employees; civil disturbances or unrest, or terrorist threats or acts; and other factors as may be set forth in the Company’s SEC filings. These and other forward-looking statements are qualified by, and should be read together with, the risks and uncertainties set forth above and the risk factors and cautionary statements included in our annual, quarterly and other SEC filings, and readers should refer to such risks, uncertainties, risk factors and statements in evaluating such forward-looking statements. Any forward-looking statements American Water makes speak only as of the date this presentation was first used or given. We do not have and do not undertake any obligation or intention to update or revise any forward-looking statement, whether as a result of new information, future events, changed circumstances or otherwise, except as otherwise required by the Federal securities laws. New factors emerge from time to time, and it is not possible for the Company to predict all such factors. Furthermore, it may not be possible to assess the impact of any such factor on our businesses, either viewed independently or together, or the extent to which any factor, or combination of factors, may cause results to differ materially from those contained in any forward-looking statement. The foregoing factors should not be construed as exhaustive.


Slide 49

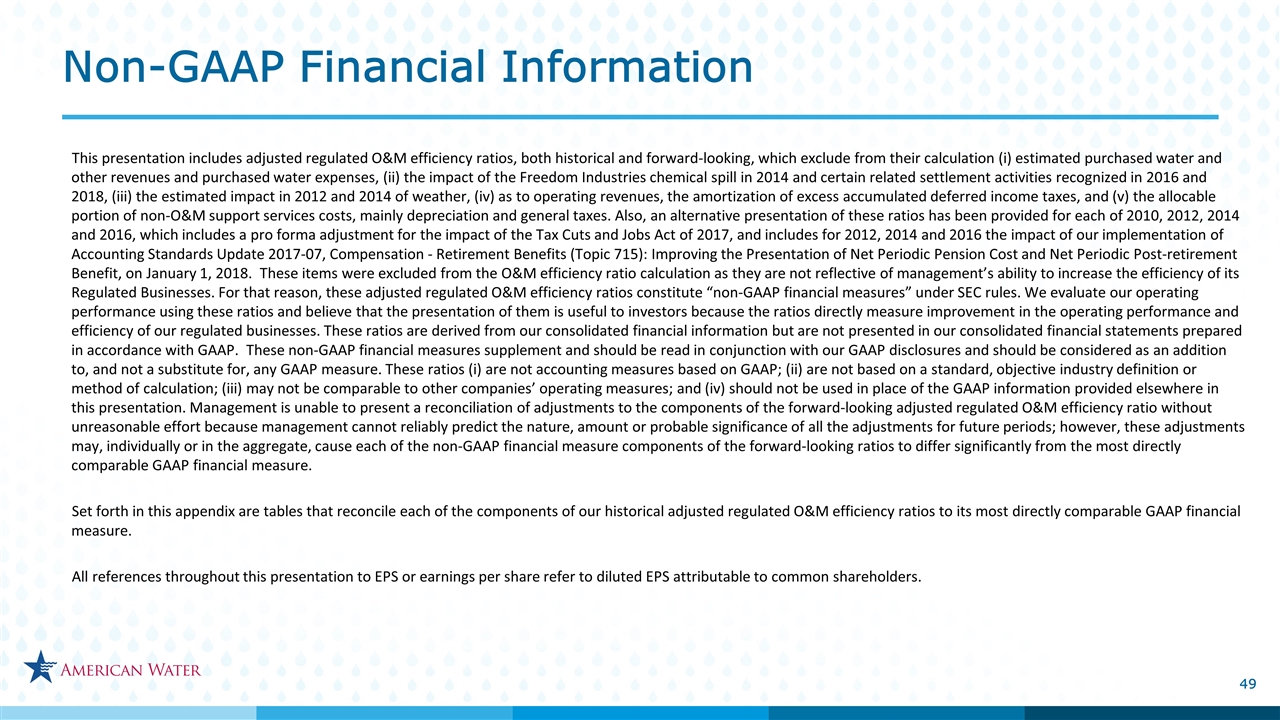
Non-GAAP Financial Information This presentation includes adjusted regulated O&M efficiency ratios, both historical and forward-looking, which exclude from their calculation (i) estimated purchased water and other revenues and purchased water expenses, (ii) the impact of the Freedom Industries chemical spill in 2014 and certain related settlement activities recognized in 2016 and 2018, (iii) the estimated impact in 2012 and 2014 of weather, (iv) as to operating revenues, the amortization of excess accumulated deferred income taxes, and (v) the allocable portion of non-O&M support services costs, mainly depreciation and general taxes. Also, an alternative presentation of these ratios has been provided for each of 2010, 2012, 2014 and 2016, which includes a pro forma adjustment for the impact of the Tax Cuts and Jobs Act of 2017, and includes for 2012, 2014 and 2016 the impact of our implementation of Accounting Standards Update 2017-07, Compensation - Retirement Benefits (Topic 715): Improving the Presentation of Net Periodic Pension Cost and Net Periodic Post-retirement Benefit, on January 1, 2018. These items were excluded from the O&M efficiency ratio calculation as they are not reflective of management’s ability to increase the efficiency of its Regulated Businesses. For that reason, these adjusted regulated O&M efficiency ratios constitute “non-GAAP financial measures” under SEC rules. We evaluate our operating performance using these ratios and believe that the presentation of them is useful to investors because the ratios directly measure improvement in the operating performance and efficiency of our regulated businesses. These ratios are derived from our consolidated financial information but are not presented in our consolidated financial statements prepared in accordance with GAAP. These non-GAAP financial measures supplement and should be read in conjunction with our GAAP disclosures and should be considered as an addition to, and not a substitute for, any GAAP measure. These ratios (i) are not accounting measures based on GAAP; (ii) are not based on a standard, objective industry definition or method of calculation; (iii) may not be comparable to other companies’ operating measures; and (iv) should not be used in place of the GAAP information provided elsewhere in this presentation. Management is unable to present a reconciliation of adjustments to the components of the forward-looking adjusted regulated O&M efficiency ratio without unreasonable effort because management cannot reliably predict the nature, amount or probable significance of all the adjustments for future periods; however, these adjustments may, individually or in the aggregate, cause each of the non-GAAP financial measure components of the forward-looking ratios to differ significantly from the most directly comparable GAAP financial measure. Set forth in this appendix are tables that reconcile each of the components of our historical adjusted regulated O&M efficiency ratios to its most directly comparable GAAP financial measure. All references throughout this presentation to EPS or earnings per share refer to diluted EPS attributable to common shareholders.


Slide 50

Third Quarter EPS Detail by Business Regulated $0.07 Other $0.00


Slide 51

Year-to-Date EPS Detail by Business MBB ($0.05) Regulated $0.34 Other $0.00


Slide 52

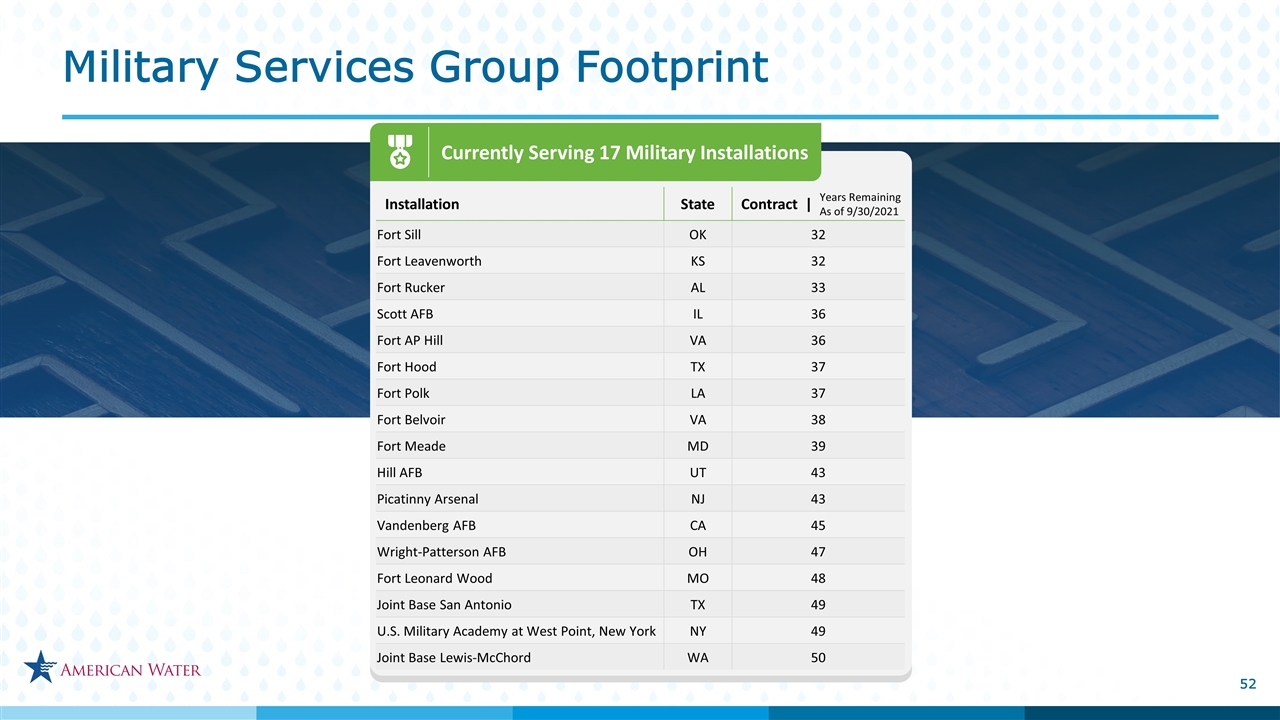
Installation State Contract | Fort Sill OK 32 Fort Leavenworth KS 32 Fort Rucker AL 33 Scott AFB IL 36 Fort AP Hill VA 36 Fort Hood TX 37 Fort Polk LA 37 Fort Belvoir VA 38 Fort Meade MD 39 Hill AFB UT 43 Picatinny Arsenal NJ 43 Vandenberg AFB CA 45 Wright-Patterson AFB OH 47 Fort Leonard Wood MO 48 Joint Base San Antonio TX 49 U.S. Military Academy at West Point, New York NY 49 Joint Base Lewis-McChord WA 50 Years Remaining As of 9/30/2021 Currently Serving 17 Military Installations Military Services Group Footprint

Slide 53

Rate Filings Summary Requested Revenue in Pending Base Rate Proceedings * Annualized Revenue Increase for Rates Effective Since January 1, 2021; excludes agreed to revenue reductions for excess accumulated deferred income taxes. Rate Filings Completed* Effective since January 1, 2021 ($ in millions)


Slide 54

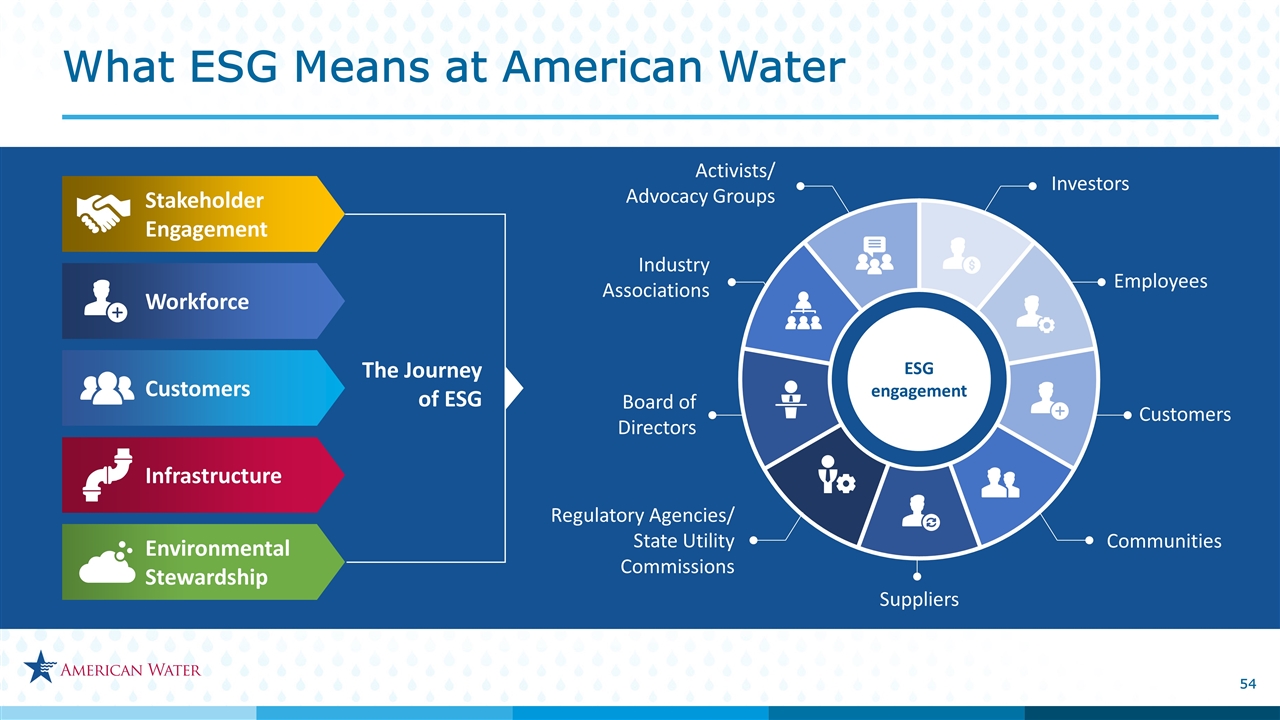
What ESG Means at American Water Investors ESG engagement Stakeholder Engagement Workforce Customers Infrastructure Environmental Stewardship The Journey of ESG Employees Customers Communities Suppliers Regulatory Agencies/ State Utility Commissions Board of Directors Industry Associations Activists/ Advocacy Groups


Slide 55

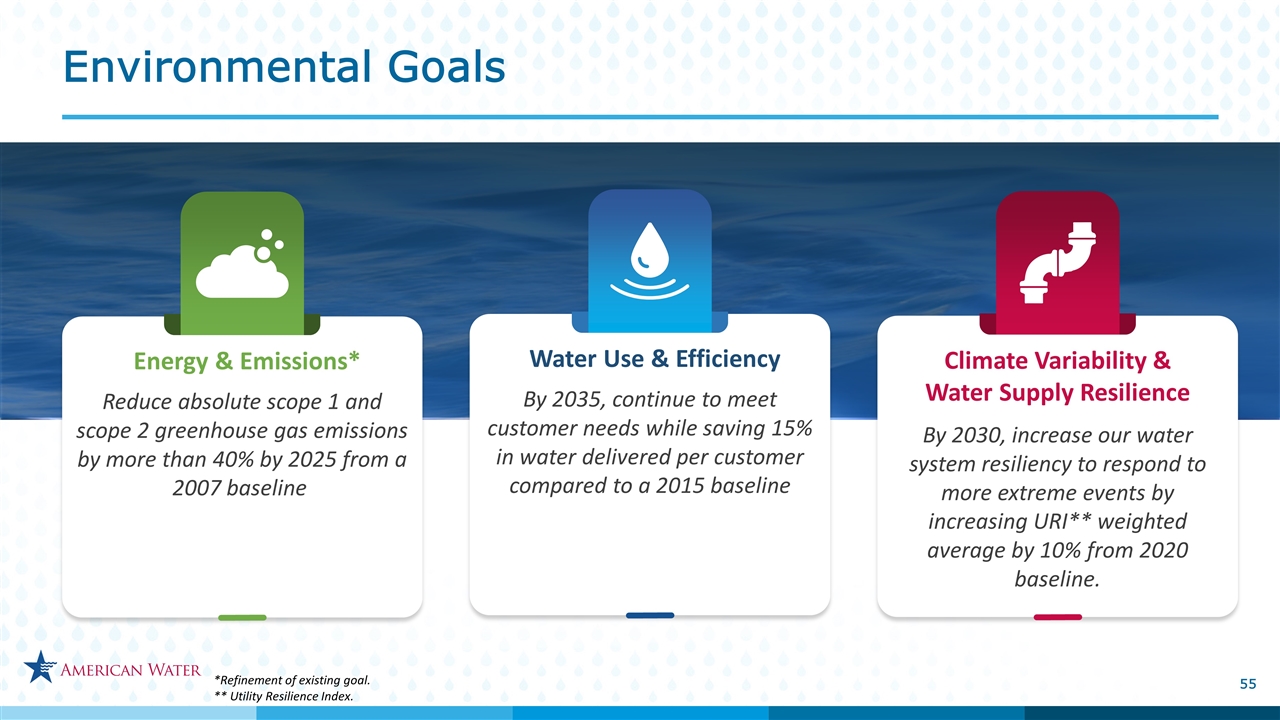
Environmental Goals *Refinement of existing goal. ** Utility Resilience Index. Reduce absolute scope 1 and scope 2 greenhouse gas emissions by more than 40% by 2025 from a 2007 baseline  Energy & Emissions* By 2030, increase our water system resiliency to respond to more extreme events by increasing URI** weighted average by 10% from 2020 baseline. Climate Variability & Water Supply Resilience By 2035, continue to meet customer needs while saving 15% in water delivered per customer compared to a 2015 baseline Water Use & Efficiency


Slide 56

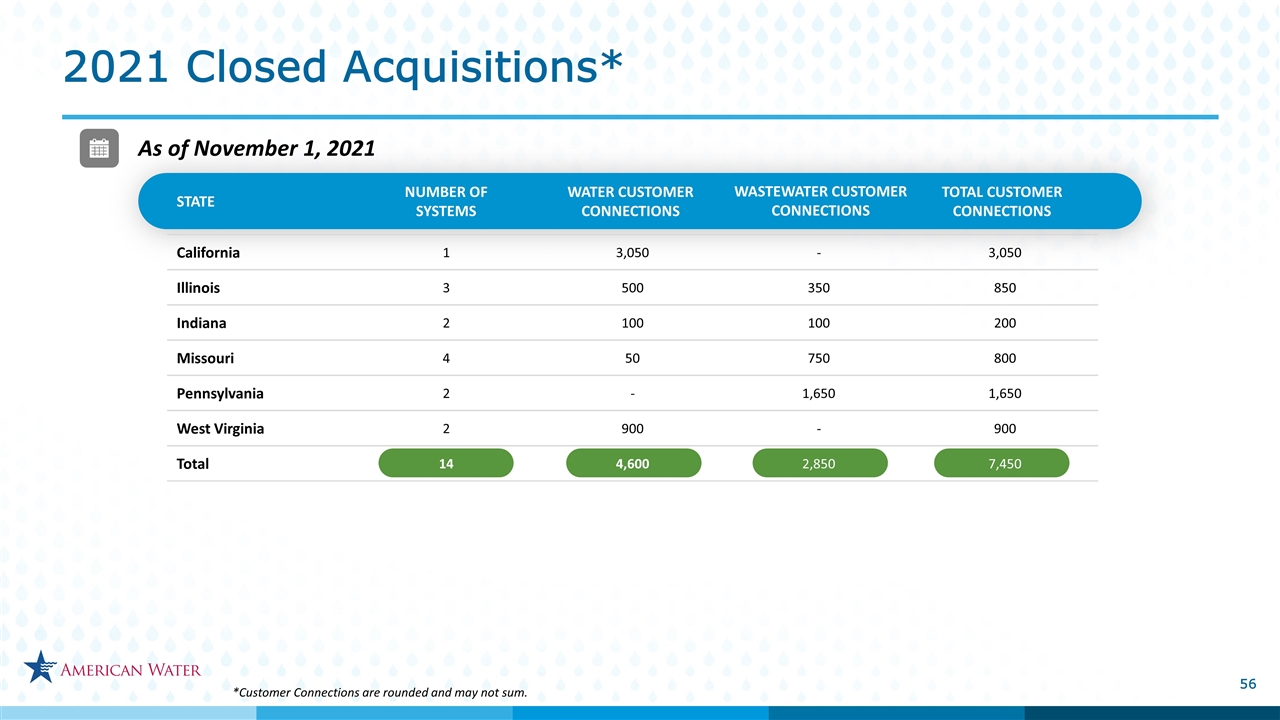
As of November 1, 2021 STATE NUMBER OF SYSTEMS WATER CUSTOMER CONNECTIONS WASTEWATER CUSTOMER CONNECTIONS TOTAL CUSTOMER CONNECTIONS California 1 3,050 - 3,050 Illinois 3 500 350 850 Indiana 2 100 100 200 Missouri 4 50 750 800 Pennsylvania 2 - 1,650 1,650 West Virginia 2 900 - 900 Total 14 4,600 2,850 7,450 2021 Closed Acquisitions* *Customer Connections are rounded and may not sum.


Slide 57

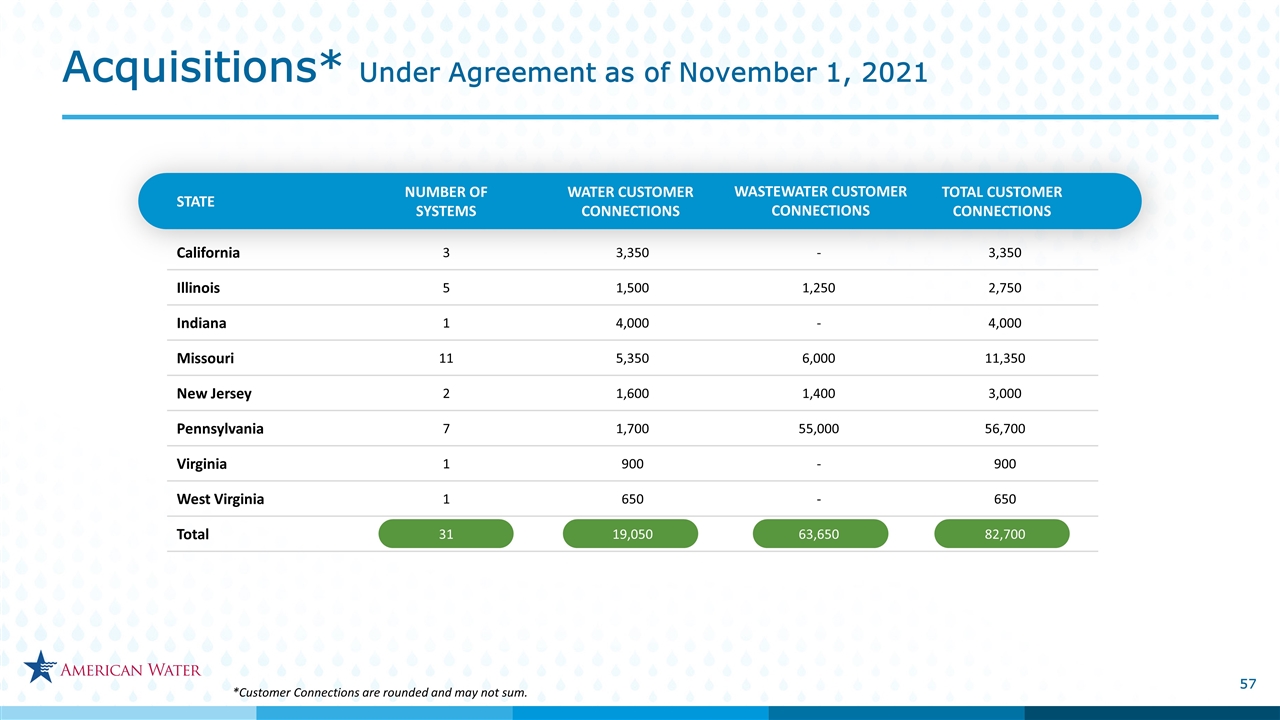
*Customer Connections are rounded and may not sum. STATE NUMBER OF SYSTEMS WATER CUSTOMER CONNECTIONS WASTEWATER CUSTOMER CONNECTIONS TOTAL CUSTOMER CONNECTIONS California 3 3,350 - 3,350 Illinois 5 1,500 1,250 2,750 Indiana 1 4,000 - 4,000 Missouri 11 5,350 6,000 11,350 New Jersey 2 1,600 1,400 3,000 Pennsylvania 7 1,700 55,000 56,700 Virginia 1 900 - 900 West Virginia 1 650 - 650 Total 31 19,050 63,650 82,700 Acquisitions* Under Agreement as of November 1, 2021


Slide 58

January 1, 2021 The Company’s Pennsylvania subsidiary was authorized additional annualized revenues of $90 million, excluding agreed to revenue reductions for excess accumulated deferred income taxes, over two steps. The EADIT reduction in revenues is $19.5 million. The overall increase (net of EADIT reduction in revenues) is $70.5 million in revenues combined over two steps. The first step was effective 1/28/2021 in the amount of $70 million ($50.5 million net of EADIT reduction in revenues) and the second step will be effective 1/1/2022 in the amount of $20.0 million. The Company’s Missouri subsidiary was authorized additional annualized revenues of $21.8 million, excluding agreed to revenue reductions for excess accumulated deferred income taxes. The EADIT reduction in revenues is $25 million. The Company’s Iowa subsidiary was authorized additional annualized base revenues of $1.2 million, excluding agreed to revenue reductions for excess accumulated deferred income taxes. The EADIT reduction in revenues is $0.2 million. Infrastructure Charges Date Effective Annualized Revenue Increases West Virginia (DSIC) 1/1/2021 $5 Pennsylvania (DSIC) 1/1/2021 8 Tennessee (QIIP, EDI, SEC) 1/1/2021 3 Illinois (QIP) 1/1/2021 7 Indiana (DSIC) 3/17/2021 8 New York (SIC) 5/1/2021 0 New Jersey (DSIC) 6/28/2021 14 Kentucky 7/1/2021 1 Missouri (ISRS) 10/7/2021 7 Sub-Total $53 Total $153 Rate Cases & Step Increases Date Effective Annualized Revenue Increases Pennsylvania 1/28/21 $70(a) Missouri 5/28/21 22(b) New York (Step Increase) 5/2/2021 7 Iowa 10/11/2021 1(c) Sub-Total $100 Rates Effective Since…


Slide 59

California Case No. A.19-07-004 7/1/2019 $29(a) $689 West Virginia Case No. 21-0369-W-42T & 21-0370-S-42T 4/30/21 32(b) 10.5% 757 Hawaii Docket No. 2021-0063 8/18/2021 2(c) 10.3% 40 $63 Sub-Total Rate Cases Filed Docket/Case Number Date Filed Requested Revenue Increase ROE Requested Rate Base $1,486 The Company’s California subsidiary has requested additional annualized revenues of $28.6 million, excluding revenue reductions for excess accumulated deferred income taxes, this also excludes the escalation year and attrition year rate increases for 2022 and 2023 of $12.4 million and $13.4 million, respectively. The proposed EADIT reduction in revenues is $2.6 million. The Company filed its 100-day update on October 11, 2019, requesting $29.9 million annualized incremental revenues for 2021, excluding EADIT reduction in revenues , and increases of $12.1 million and $12.9 million in the escalation year of 2022 and the attrition year of 2023, respectively. The Company’s West Virginia subsidiary has requested additional annualized revenues of $31.9 million, excluding revenue reductions for excess accumulated deferred income taxes and infrastructure surcharges. The proposed EADIT reduction in revenues is $0.9 million and the exclusion for infrastructure surcharges is $10.2 million. The Company’s Hawaii subsidiary has requested additional annualized revenues of $2.3 million, excluding revenue reductions for excess accumulated deferred income taxes. The EADIT reduction in revenues is $0.16 million. Pending Rate Case Filings Infrastructure Charges Filed West Virginia (DSIC) 6/30/2021 $3 $33 Missouri (WSIRA) 9/3/2021 11 101 $14 Total $134 $77 Sub-Total


Slide 60

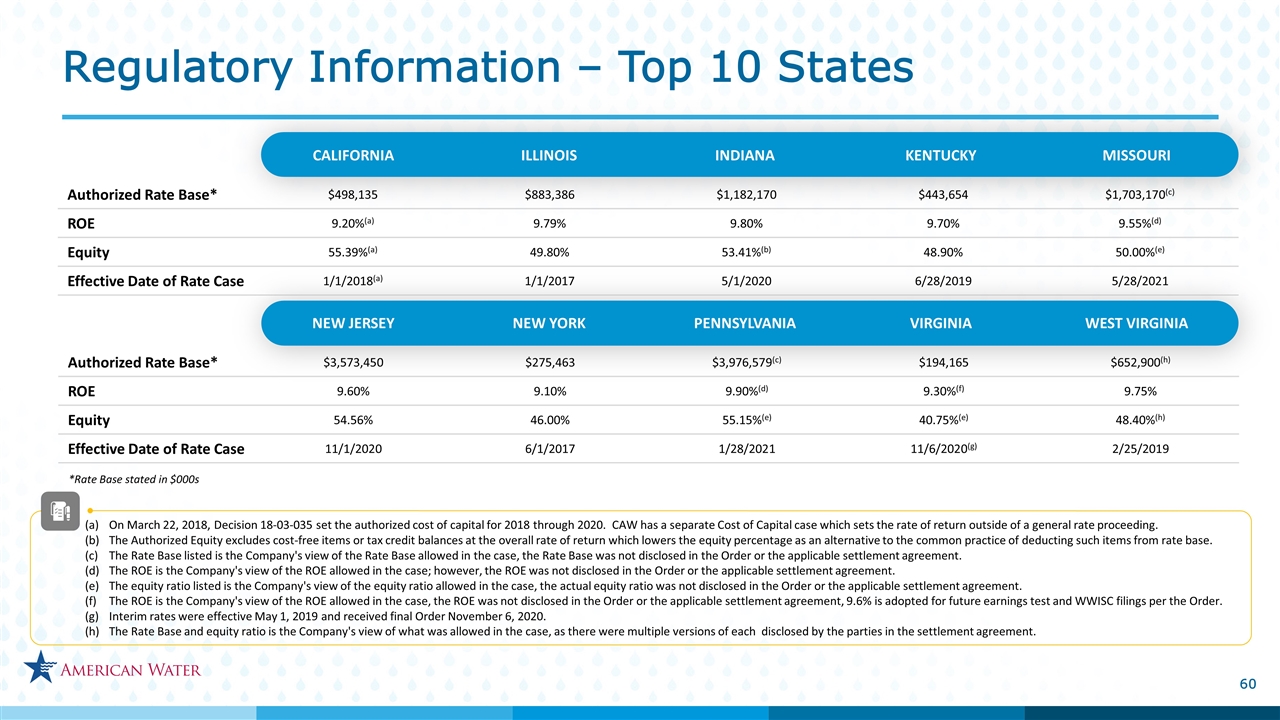
NEW JERSEY NEW YORK PENNSYLVANIA VIRGINIA WEST VIRGINIA CALIFORNIA ILLINOIS INDIANA KENTUCKY MISSOURI *Rate Base stated in $000s Authorized Rate Base* $498,135 $883,386 $1,182,170 $443,654 $1,703,170(c) ROE 9.20%(a) 9.79% 9.80% 9.70% 9.55%(d) Equity 55.39%(a) 49.80% 53.41%(b) 48.90% 50.00%(e) Effective Date of Rate Case 1/1/2018(a) 1/1/2017 5/1/2020 6/28/2019 5/28/2021 Authorized Rate Base* $3,573,450 $275,463 $3,976,579(c) $194,165 $652,900(h) ROE 9.60% 9.10% 9.90%(d) 9.30%(f) 9.75% Equity 54.56% 46.00% 55.15%(e) 40.75%(e) 48.40%(h) Effective Date of Rate Case 11/1/2020 6/1/2017 1/28/2021 11/6/2020(g) 2/25/2019 On March 22, 2018, Decision 18-03-035 set the authorized cost of capital for 2018 through 2020. CAW has a separate Cost of Capital case which sets the rate of return outside of a general rate proceeding. The Authorized Equity excludes cost-free items or tax credit balances at the overall rate of return which lowers the equity percentage as an alternative to the common practice of deducting such items from rate base. The Rate Base listed is the Company's view of the Rate Base allowed in the case, the Rate Base was not disclosed in the Order or the applicable settlement agreement. The ROE is the Company's view of the ROE allowed in the case; however, the ROE was not disclosed in the Order or the applicable settlement agreement. The equity ratio listed is the Company's view of the equity ratio allowed in the case, the actual equity ratio was not disclosed in the Order or the applicable settlement agreement. The ROE is the Company's view of the ROE allowed in the case, the ROE was not disclosed in the Order or the applicable settlement agreement, 9.6% is adopted for future earnings test and WWISC filings per the Order. Interim rates were effective May 1, 2019 and received final Order November 6, 2020. The Rate Base and equity ratio is the Company's view of what was allowed in the case, as there were multiple versions of each disclosed by the parties in the settlement agreement. Regulatory Information – Top 10 States


Slide 61

* Calculation assumes purchased water revenues approximate purchased water expenses ** Includes the impact of the Company’s adoption of ASU 2017-07, Compensation - Retirement Benefits (Topic 715): Improving the Presentation of Net Periodic Pension Cost and Net Periodic Post-retirement Benefit, on January 1, 2018 *** Calculation of Estimated tax reform = Revenue Requirement with new Effective Tax Rate (taxes grossed up) – Revenue Requirement with old Effective Tax Rate Reconciliation Table: Regulated Segment O&M Efficiency Ratio