Exhibit 99.1 | ||
News Release |  | |
Axalta Coating Systems 2001 Market Street Suite 3600 Philadelphia, PA 19103 USA | Contact Christopher Mecray D +1 215 255 7970 | |
For Immediate Release
Axalta Releases Fourth Quarter and Full Year 2019 Results
Fourth Quarter 2019 Highlights:
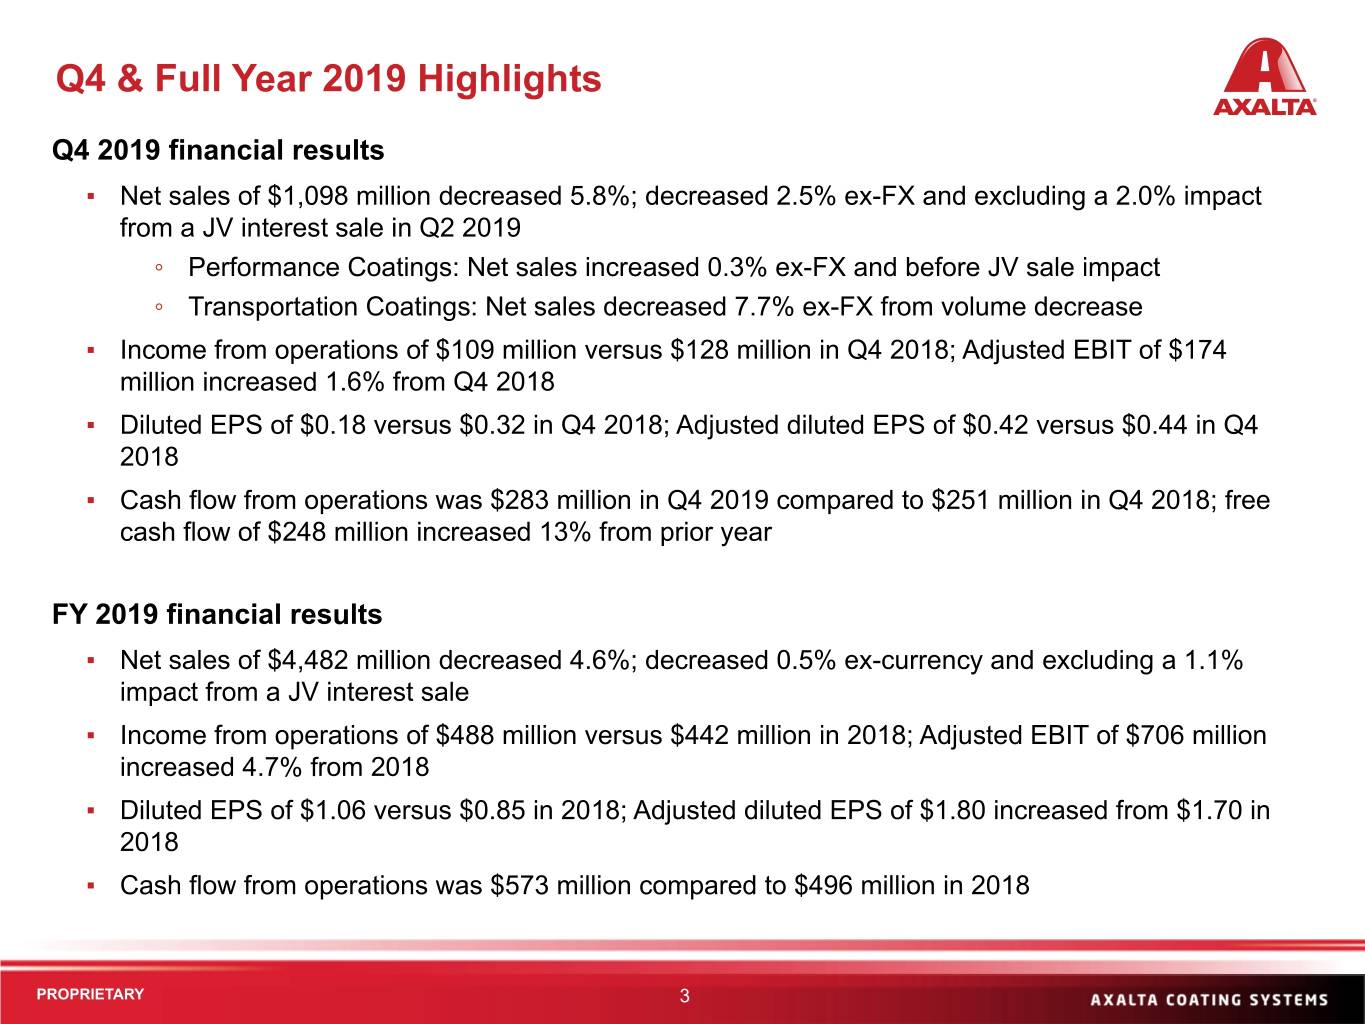
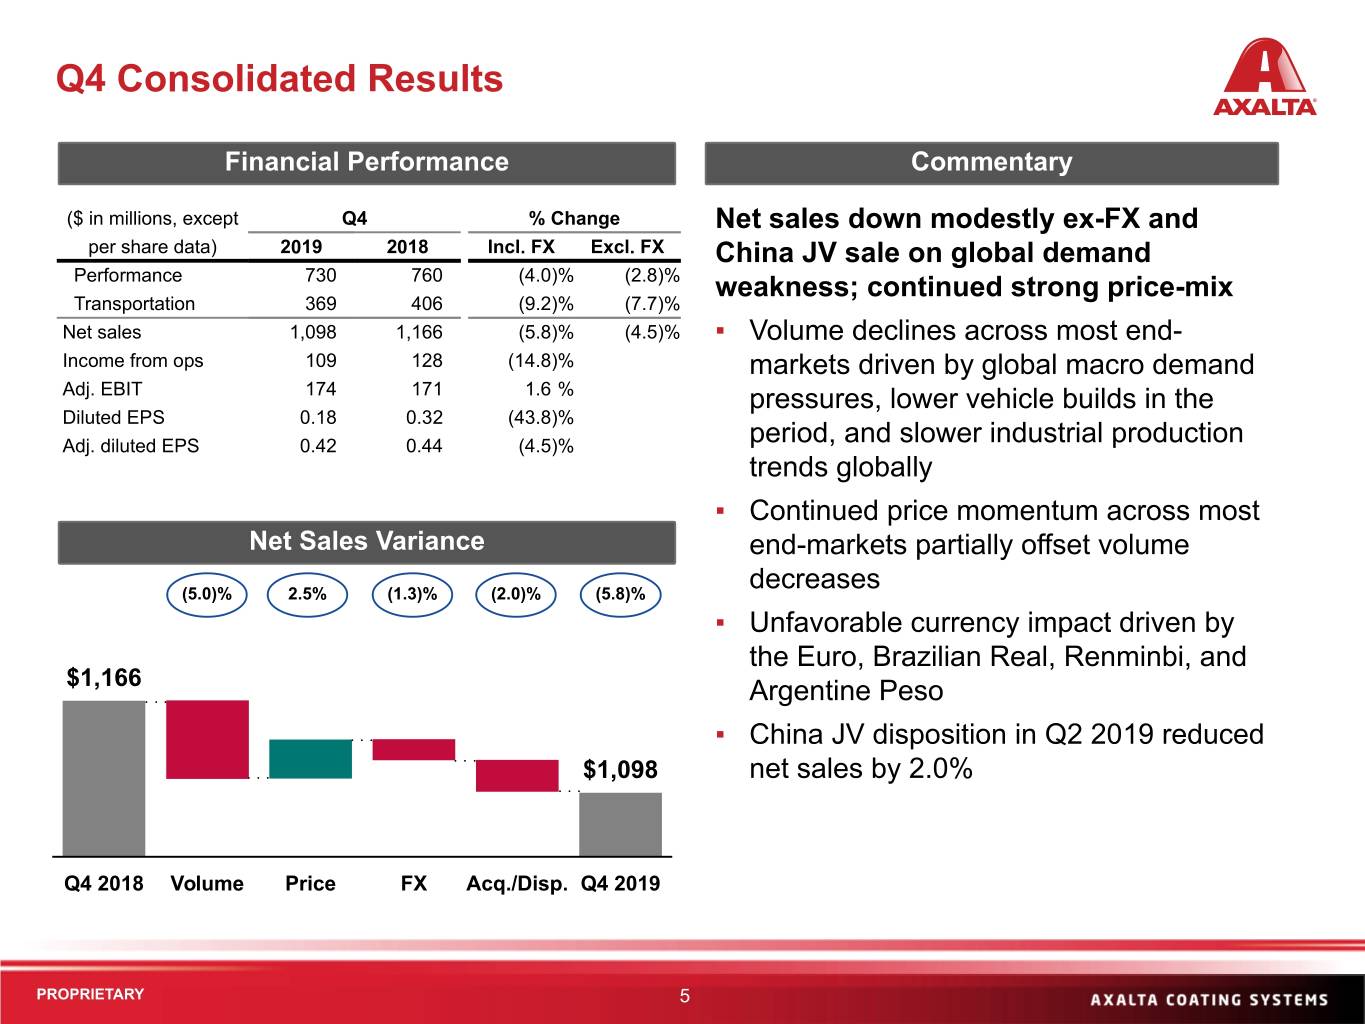
• | Net sales of $1,098.4 million, decreased 5.8%; decreased 2.5% on a constant currency basis and excluding a negative 2.0% impact from a consolidated Joint Venture sale |
• | Income from operations of $108.7 million versus $127.8 million in Q4 2018; Adjusted EBIT of $173.5 million increased 1.6% from Q4 2018 |
• | Diluted EPS of $0.18 versus $0.32 in Q4 2018; Adjusted diluted EPS of $0.42 decreased 4.5% from Q4 2018 |
• | Cash flow from operations was $283.3 million compared to $250.6 million in Q4 2018 |
Full Year 2019 Highlights:
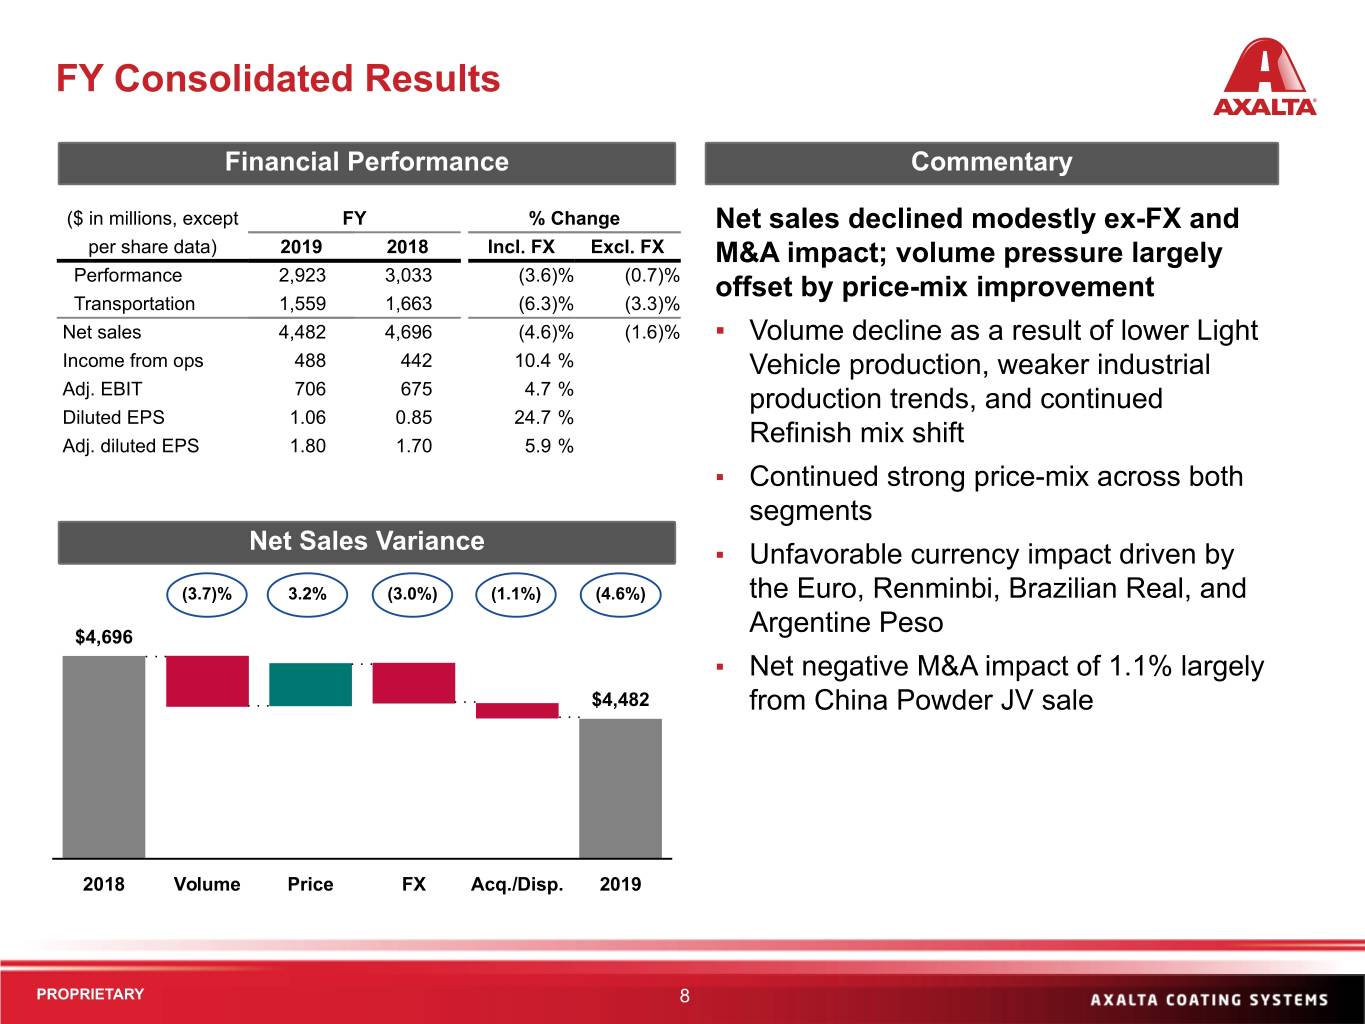
• | Net sales of $4,482.2 million, decreased 4.6%; decreased 0.5% on a constant currency basis and excluding a negative 1.1% impact from a consolidated Joint Venture sale |
• | Income from operations of $488.2 million versus $442.1 million in 2018; Adjusted EBIT of $706.0 million increased 4.7% from 2018 |
• | Diluted EPS of $1.06 versus $0.85 in 2018; Adjusted diluted EPS of $1.80 increased 5.9% from $1.70 in 2018 |
• | Cash flow from operations was $573.1 million compared to $496.1 million in 2018 |
• | Notable success in innovation witnessed in two Edison Awards in the Materials Science and Engineering category for our Acquire Quantum EFX spectrophotometer as well as our Voltaprem 5000 impregnating resin |
PHILADELPHIA, PA, January 30, 2020 - Axalta Coating Systems Ltd. (NYSE:AXTA) (“Axalta”), a leading global coatings company, announced its financial results for the fourth quarter and full year ended December 31, 2019.
Fourth Quarter Consolidated Financial Results
Net sales of $1,098.4 million for the fourth quarter decreased 5.8%, including 1.3% negative foreign currency translation impact and a 2.0% impact from the sale of a consolidated Joint Venture ("JV") interest in Q2 2019. Constant currency organic net sales decreased 2.5% in the period, with 2.5% higher average selling prices and product mix with contribution from both segments, offset by a 5.0% volume decrease. Net sales reflected volume weakness in both Performance and Transportation Coatings, although the Refinish end-market remained a stable offset, with net sales growth of 3.5% ex-FX.
Income from operations decreased to $108.7 million for the fourth quarter from $127.8 million in Q4 2018, driven principally by lower volume, headwind from incentive compensation expense, costs associated with our on-going strategic review as well as modest ongoing foreign exchange headwinds and charges of $17.7 million primarily related to the abandonment of engineering work for aspects of our China footprint project which has been adjusted due to evolving market conditions. This was partially offset primarily by improvement in overall price and product mix in the period, as well as by contribution from reduced variable costs.
Adjusted EBIT increased to $173.5 million for the fourth quarter from $170.8 million in Q4 2018, driven principally by improvement in overall price and product mix in the period, coupled with contribution from reduced variable costs and slightly lower operating expenditures, inclusive of a headwind from incentive compensation expense. This was offset in part by lower volume as well as modest ongoing foreign exchange headwinds. Adjusted EBIT margin increased 110 basis points for the quarter to 15.8% from the prior year period.
1
Regarding fourth quarter results, Robert W. Bryant, Axalta’s Chief Executive Officer and President commented, “Axalta finished 2019 with strong operating execution and financial performance, capping a solid year overall despite a backdrop of uneven demand in many markets we serve. In the fourth quarter, we generated record free cash flow, expanded operating margins, and continued to strengthen our balance sheet. Despite some incremental volume headwinds during the fourth quarter, we mostly offset this with progress in price and mix enhancement as well as with aggressive cost control. Our solid quarterly results reflected our keen focus on execution and success in commercializing new products across multiple business lines."
Full Year Consolidated Financial Results
Net sales of $4,482.2 million for 2019 decreased 4.6%, including 3.0% negative foreign currency translation impact and a 1.1% impact from the sale of a JV interest in Q2 2019. Constant currency organic net sales decreased 0.5% in the period, driven by 3.7% lower volume from both segments, partially offset by 3.2% higher average selling prices and product mix with contribution from both segments. The Refinish end-market remained a stable offset with net sales growth of 3.3% ex-FX.
Income from operations increased 10.4% to $488.2 million for 2019 from $442.1 million in 2018, driven principally by an improvement in overall price and product mix in the period, lower year-over-year expense for employee-related severance, and lower step-up depreciation and amortization expense. This was partly offset by lower volume, increased variable costs and modest ongoing foreign exchange headwinds, as well as modestly increased operating expense inclusive of lower net stock-based and incentive compensation expense. Income from operations also includes costs associated with the ongoing strategic review and $17.7 million of charges primarily related to the China footprint project.
Adjusted EBIT increased 4.7% to $706.0 million for 2019 from $674.5 million in 2018, driven principally by improvement in overall price and product mix in the period and somewhat lower operating expenditures inclusive of lower net stock-based and incentive compensation expense. This was offset in part by lower volumes, increased variable costs as well as ongoing foreign exchange headwinds. Adjusted EBIT margin for the year increased 140 basis points to 15.8%.
Mr. Bryant continued, “In 2019, Axalta made great progress; we introduced over 250 new products, and we continued to offset substantial input cost inflation from the last several years with necessary pricing actions and ongoing productivity enhancement. This enabled us to hit many of our primary goals and targets for the year, including noticeably exceeding our free cash flow goal, posting expanded operating margins despite slightly lower volumes, and also meeting objectives for both Adjusted EBIT and Adjusted Diluted EPS. We also finished the year with notably lower balance sheet net leverage at 3.0x.”
“We continue to see mixed demand across our end-markets for 2020, but still expect to produce ongoing earnings and cash flow growth, coupled with an opportunity for demand recovery if trade friction eases. Performance Coatings should benefit from the anchor of stable Refinish demand, and we target innovation-led growth in our Industrial end-market. Transportation Coatings faces some known headwinds in each end-market but we see the potential for stabilizing demand for global Light Vehicle as encouraging. We expect ongoing market outgrowth through product innovation and our differentiated services offerings, and remain focused on driving unique value for our customers every day,” Mr. Bryant stated. “Our key goals for 2020 include continued new business wins in core markets, execution to ongoing margin recovery, and optimization of our financial returns through capital allocation discipline and strong free cash flow generation.” Mr. Bryant continued, "Axalta’s review of strategic alternatives is also ongoing. We do not have news on that front to share with you, but we will provide updates as warranted."
Performance Coatings Fourth Quarter Results
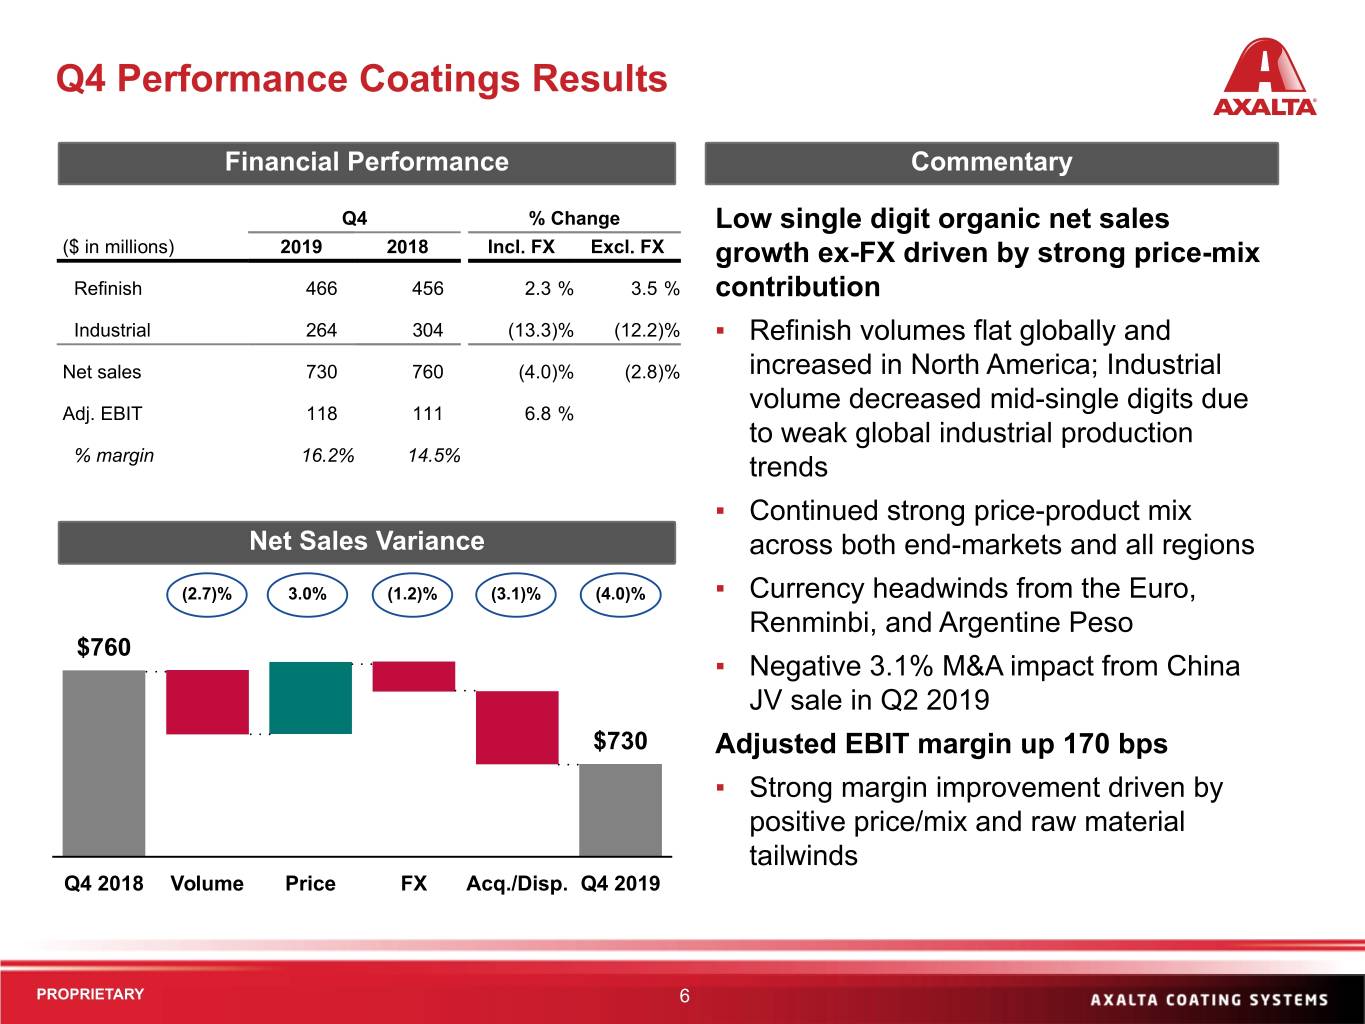
Performance Coatings net sales were $729.7 million in Q4 2019, a decrease of 4.0% year-over-year including 1.2% unfavorable foreign currency impact and a 3.1% impact from the sale of a consolidated JV interest in Q2 2019. Constant currency organic net sales increased 0.3%, driven by 3.0% higher average selling price and mix benefits, offset in part by a volume decrease of 2.7%.
Net sales in our Refinish end-market increased 2.3% in Q4 2019 (increased 3.5% excluding foreign currency translation), driven by price and mix benefits from all regions and essentially flat volumes overall, though the North America region reported renewed volume growth. Industrial end-market net sales decreased 13.3% in the fourth quarter (decreased 12.2% excluding foreign currency translation), including a 7.7% impact from the consolidated JV interest sale. Industrial organic volume decreased in the mid-single digits due to macroeconomic demand softness primarily in EMEA and the Americas, offset by low single digit increases in average price and product mix.
2
The Performance Coatings segment generated Adjusted EBIT of $118.0 million in the fourth quarter, a 6.8% year-over-year increase, driven by positive price and mix contribution and slightly lower variable costs, offset partly by headwinds from lower volume and to a lesser extent by foreign exchange and operating cost impacts. Adjusted EBIT margin of 16.2% in Q4 2019 reflected a 170 basis point increase compared to the corresponding prior year quarter.
Transportation Coatings Fourth Quarter Results
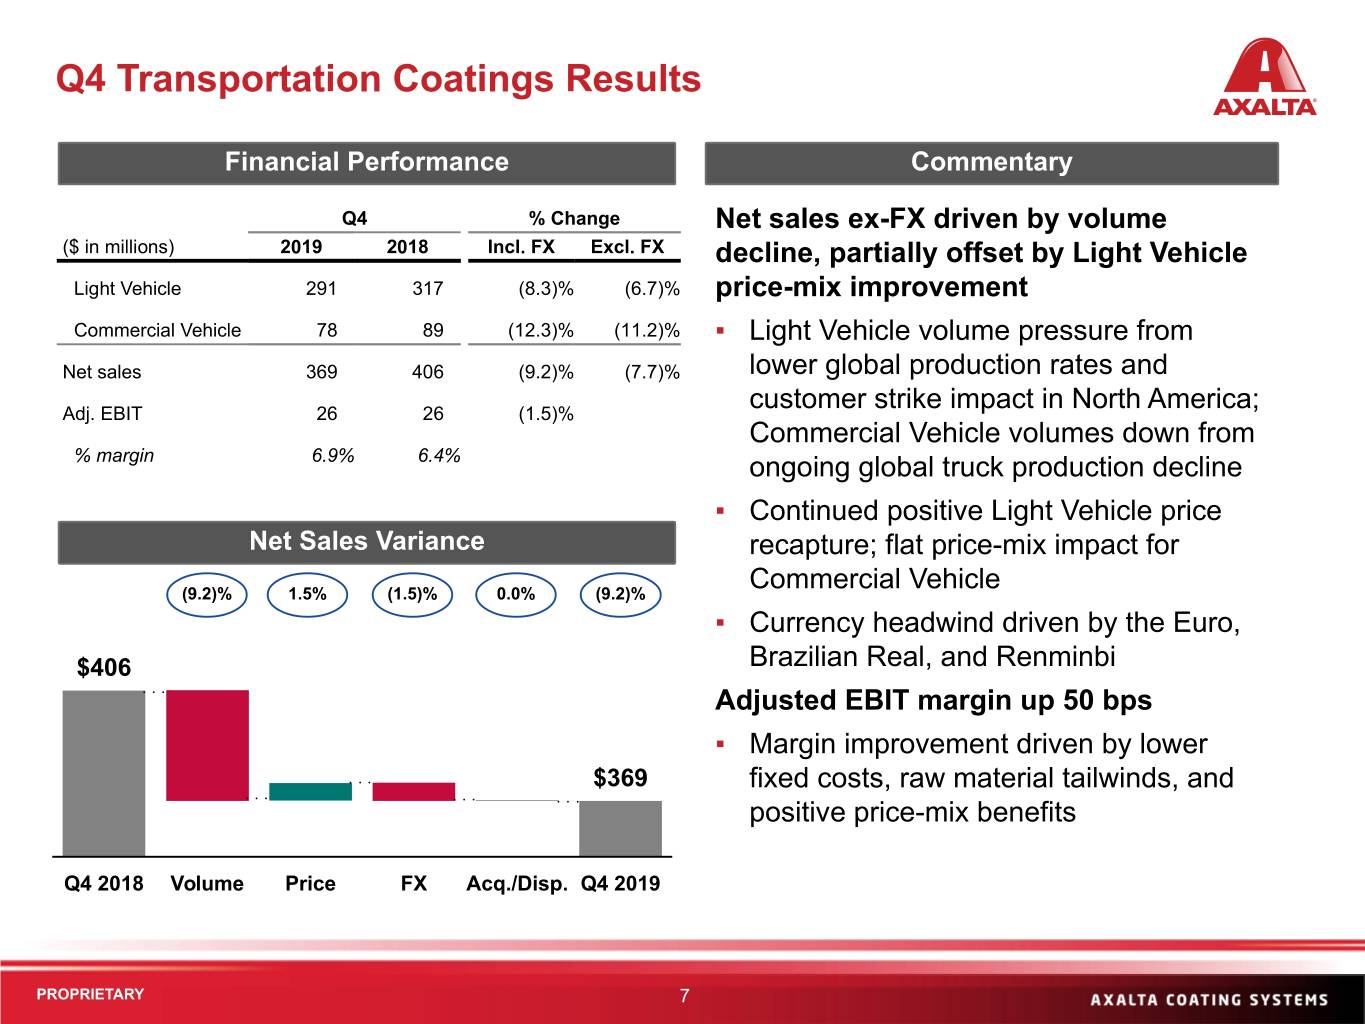
The Transportation Coatings segment reported net sales of $368.7 million in Q4 2019, a decrease of 9.2% versus Q4 2018, including a 1.5% impact from foreign exchange translation. Constant currency net sales decreased 7.7% year-over-year, driven by a 9.2% decrease in volumes, offset partly by 1.5% higher average selling price and mix benefits.
Light Vehicle net sales decreased 8.3% year-over-year (decreased 6.7% excluding foreign currency translation), impacted by lower sales across all regions consistent with global automotive production trends and including an impact from a customer strike in North America in 2H 2019. Commercial Vehicle net sales decreased 12.3% versus Q4 2018 (decreased 11.2% excluding foreign currency translation), driven by lower production rates across all regions for trucks as well as certain non-truck product categories.
The Transportation Coatings segment generated Adjusted EBIT of $25.6 million in Q4 2019, a decrease of 1.5% compared to Q4 2018, with lower volume essentially offset by price and product mix benefit, coupled with moderate variable cost and operating expense tailwinds. Segment Adjusted EBIT margin expansion of 50 basis points to 6.9% was driven by price realization, partially offset by decreased volumes.
Balance Sheet and Cash Flow Highlights
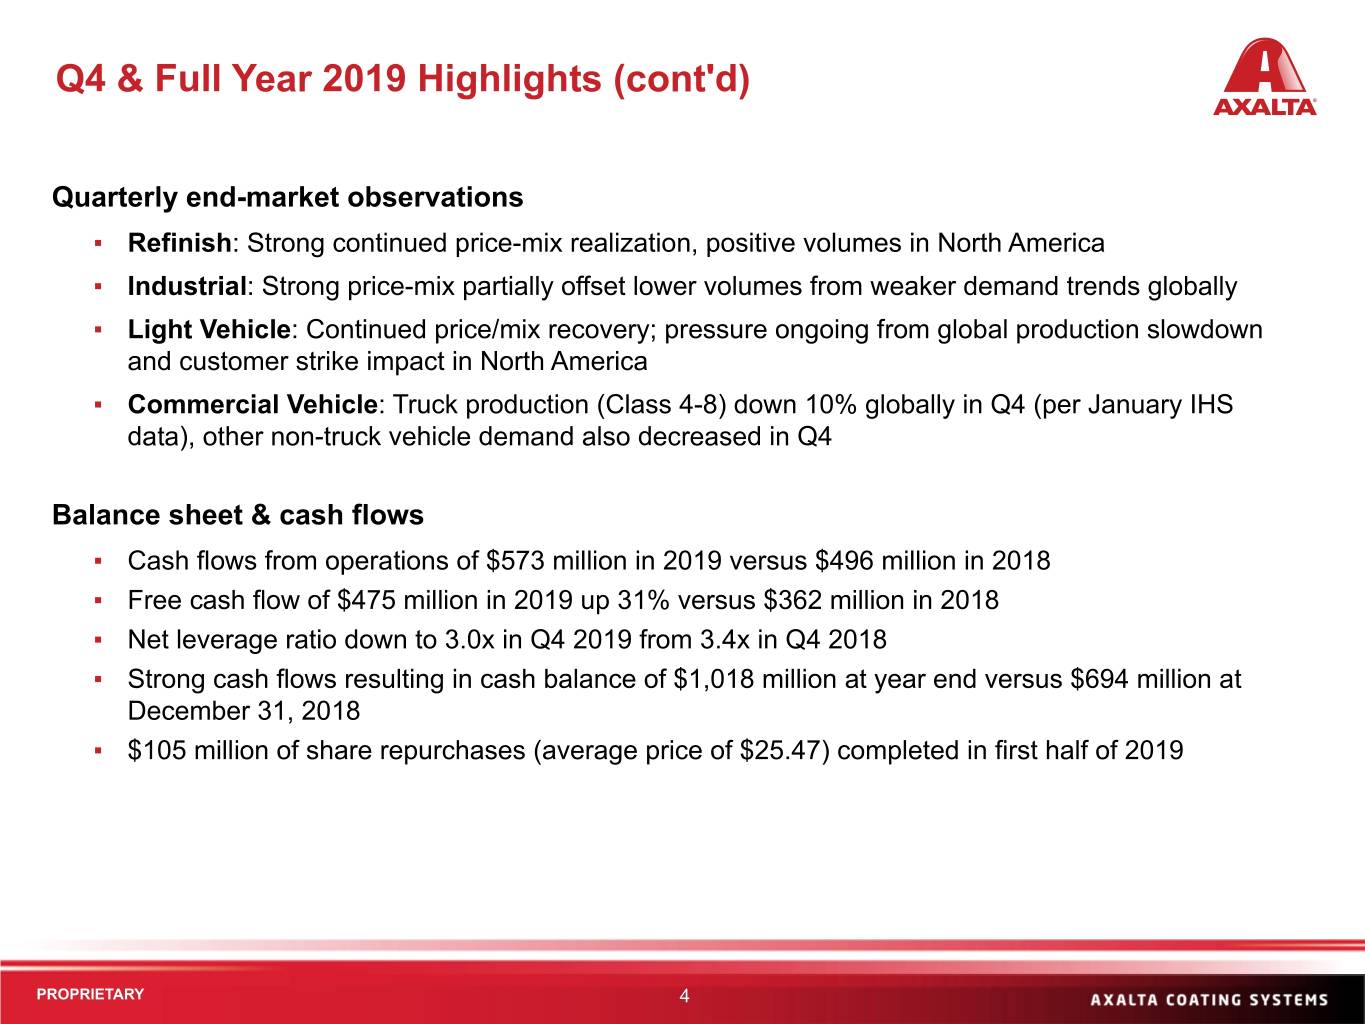
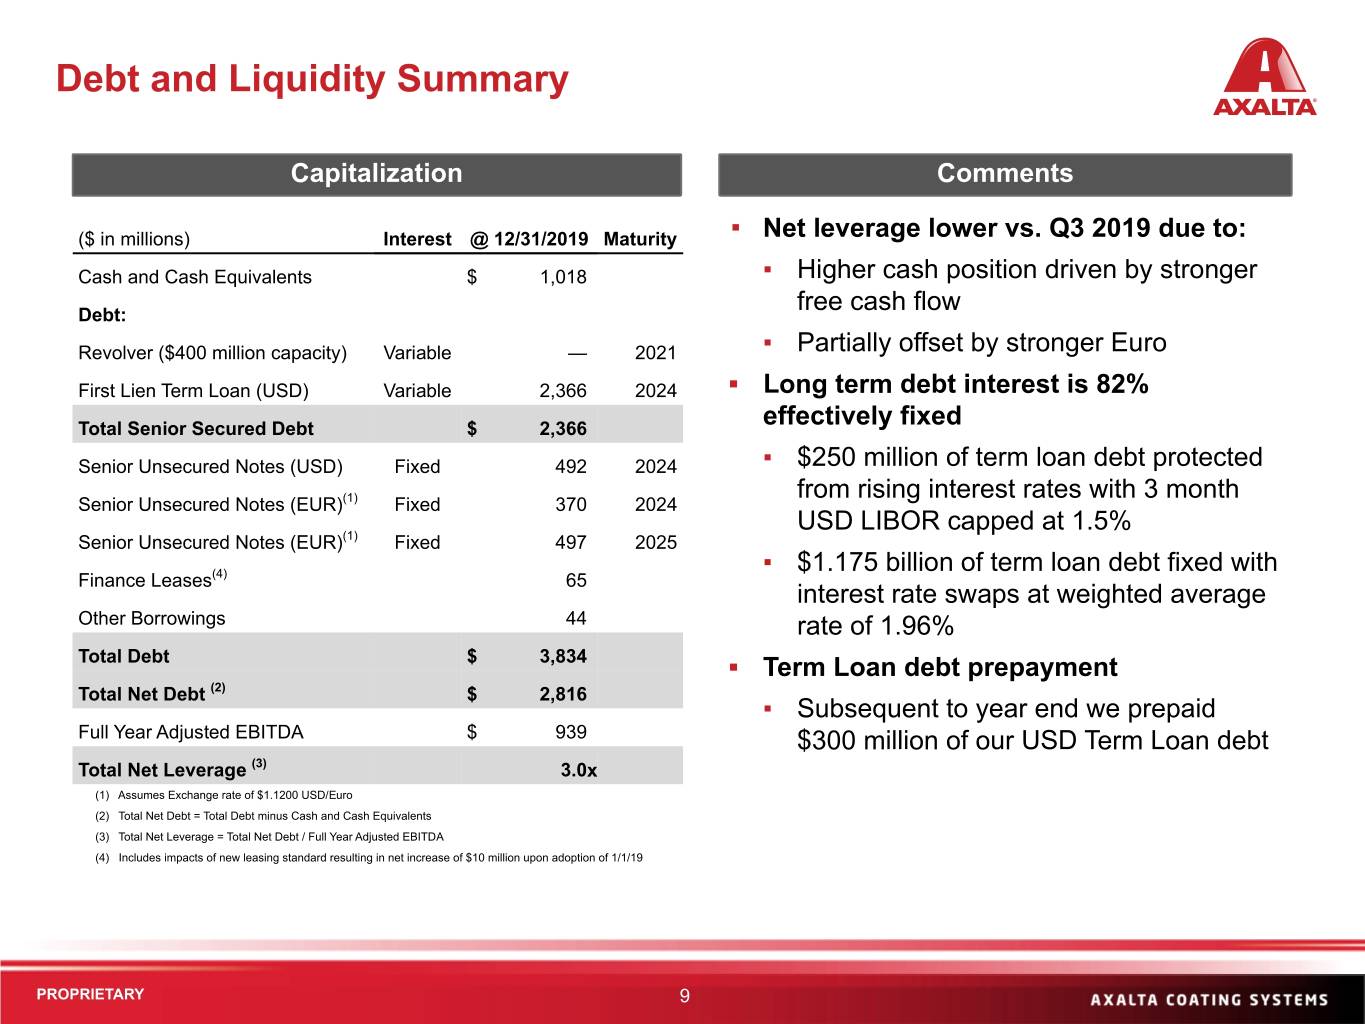
We ended the year with cash and cash equivalents of $1,017.5 million. Our net debt was $2.8 billion as of year-end, compared to $3.2 billion as of December 31, 2018, driven by higher cash balances. Net debt to Adjusted EBITDA was 3.0x at year-end versus 3.4x as of December 31, 2018. There were no share repurchases during the fourth quarter. Subsequent to year-end, we prepaid $300 million of our Term Loan debt utilizing excess cash on our balance sheet.
Cash flow from operations was $283.3 million in Q4 2019 compared to $250.6 million in Q4 2018. Free cash flow totaled $248.4 million after capital expenditures of $38.6 million, an improvement versus $220.2 million after capital expenditures of $33.9 million in the prior year fourth quarter. The increase was driven primarily by improved working capital outcomes for the period compared to the prior year, and includes approximately $26 million in cash payments associated with employee retention as well as advisory fees associated with the ongoing review of strategic alternatives.
“In 2019, Axalta continued to execute well operationally, and we met key financial objectives for both earnings and cash flow targets, while also improving the balance sheet. This was all accomplished within a challenging backdrop for general industrial and automotive-related markets,” said Sean M. Lannon, Axalta’s Senior Vice President and Chief Financial Officer. “Strong cash flow generation, reflecting solid operating and working capital execution, enabled us to finish the year with considerably reduced net leverage despite share repurchases completed in the first half. We also increased profit margins for the year despite volume headwinds as we continued to prioritize price recapture in the face of input inflation from the past several years. For 2020, we expect to maintain this operating and financial discipline and target modest potential margin upside in a continued subdued volume environment. In conjunction with our productivity focus, this should enable an avenue for margin expansion in the coming year, as well as strong free cash flow.”
3
2020 Guidance
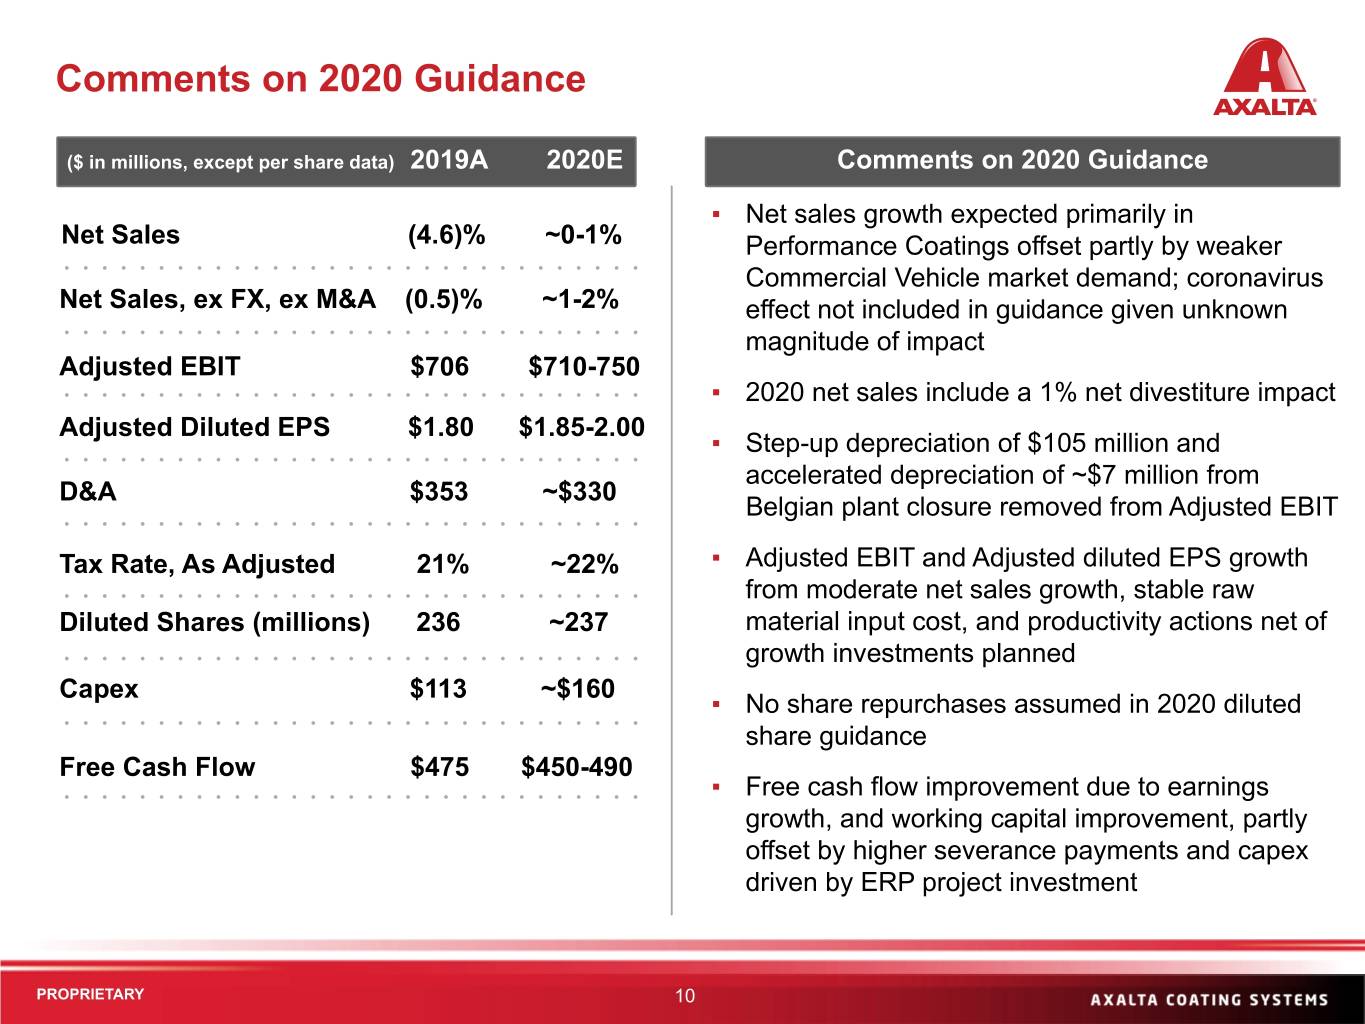
• | Net sales growth of ~0-1% |
• | Net sales, ex-FX, ex-M&A growth of ~1-2% |
• | Adjusted EBIT of $710-750 million |
• | Adjusted diluted EPS range of $1.85-2.00 |
• | Depreciation and amortization of ~$330 million, inclusive of ~$7 million accelerated depreciation from our Belgium site closure |
• | Income tax rate, as adjusted, of ~22% |
• | Diluted shares outstanding of ~237 million |
• | Capital expenditures of ~$160 million |
• | Free cash flow of $450-490 million |
Conference Call Information
As previously announced, Axalta will hold a conference call to discuss its fourth quarter and full year 2019 financial results on January 30, 2020 at 8:00 a.m. ET. The U.S. dial-in phone number for the conference call is 877-407-0784 and the international dial-in number is +1-201-689-8560. A live webcast of the conference call will also be available online at www.axalta.com/investorcall. For those unable to participate in the conference call, a replay will be available through February 6, 2020. The U.S. replay dial-in phone number is 844-512-2921 and the international replay dial-in number is +1-412-317-6671. The replay passcode is 13698205.
Reclassifications and Revisions
During the year ended December 31, 2019, we revised the presentation of the unaudited Condensed Consolidated Statements of Operations to reclassify prior year Other revenue into Net sales, as well as separately present Other operating charges, previously embedded within Selling, general and administrative expenses, as a separate line item within Income from operations. Other operating charges include termination benefits and other employee related costs, strategic review and retention costs, acquisition and divestiture-related costs, and impairment charges, details of which are included in our reconciliations of Adjusted EBIT and Adjusted net income.
During the year ended December 31, 2019, Axalta identified and corrected an error related to the prior year classification of the purchase of an additional financial interest in a consolidated joint venture within our Condensed Consolidated Statements of Cash Flows. This correction increased cash used for investing activities and reduced cash used for financing activities by $26.9 million, respectively, for the year ended December 31, 2018.
4
Cautionary Statement Concerning Forward-Looking Statements
This release may contain certain forward-looking statements regarding Axalta and its subsidiaries including our 2020 full year guidance, which includes net sales growth, currency effects, acquisition or divestment impacts, Adjusted EBIT, Adjusted diluted EPS, Adjusted EBITDA, interest expense, income tax rate, as adjusted, free cash flow, capital expenditures, depreciation and amortization, and diluted shares outstanding. All of these statements are based on management’s expectations as well as estimates and assumptions prepared by management that, although they believe to be reasonable, are inherently uncertain. These statements involve risks and uncertainties, including, but not limited to, economic, competitive, governmental and technological factors outside of Axalta’s control, as well as the previously announced review of strategic alternatives, that may cause its business, industry, strategy, financing activities or actual results to differ materially. More information on potential factors that could affect Axalta's financial results is available in the "Risk Factors" and "Management's Discussion and Analysis of Financial Condition and Results of Operations" section within Axalta's most recent annual report on Form 10-K, and in other documents that we have filed with, or furnished to, the U.S. Securities and Exchange Commission. Axalta undertakes no obligation to update or revise any of the forward-looking statements contained herein, whether as a result of new information, future events or otherwise.
Non-GAAP Financial Measures
The historical financial information included in this presentation includes financial information that is not presented in accordance with generally accepted accounting principles in the United States (“GAAP”), including constant currency net sales growth, income tax rate, as adjusted, EBIT, Adjusted EBIT, EBITDA, Adjusted EBITDA, Adjusted diluted EPS, free cash flow, net debt and Adjusted net income. Management uses these non-GAAP financial measures in the analysis of our financial and operating performance because they assist in the evaluation of underlying trends in our business. Adjusted EBITDA, Adjusted EBIT and Adjusted diluted EPS consist of EBITDA, EBIT and Diluted EPS, respectively, adjusted for (i) certain non-cash items included within net income, (ii) certain items Axalta does not believe are indicative of ongoing operating performance or (iii) certain nonrecurring, unusual or infrequent items that have not occurred within the last two years or we believe are not reasonably likely to recur within the next two years. We believe that making such adjustments provides investors meaningful information to understand our operating results and ability to analyze financial and business trends on a period-to-period basis. Adjusted net income shows the adjusted value of net income (loss) attributable to controlling interests after removing the items that are determined by management to be items that we do not consider indicative of our ongoing operating performance or unusual or nonrecurring in nature. Our use of the terms constant currency net sales growth, income tax rate, as adjusted, EBIT, Adjusted EBIT, EBITDA, Adjusted EBITDA, Adjusted diluted EPS, free cash flow, net debt and Adjusted net income may differ from that of others in our industry. Constant currency net sales growth, income tax rate, as adjusted, EBIT, Adjusted EBIT, EBITDA, Adjusted EBITDA, Adjusted diluted EPS, free cash flow, net debt and Adjusted net income should not be considered as alternatives to net sales, net income (loss), income (loss) before operations or any other performance measures derived in accordance with GAAP as measures of operating performance or operating cash flows or as measures of liquidity. Constant currency net sales growth, income tax rate, as adjusted, EBIT, Adjusted EBIT, EBITDA, Adjusted EBITDA, Adjusted diluted EPS, free cash flow, net debt and Adjusted net income have important limitations as analytical tools and should be considered in conjunction with, and not as substitutes for, our results as reported under GAAP. This presentation includes a reconciliation of certain non-GAAP financial measures with the most directly comparable financial measures calculated in accordance with GAAP. Axalta does not provide a reconciliation for non-GAAP estimates for constant currency net sales growth, Adjusted EBIT, Adjusted EBITDA, Adjusted diluted EPS, income tax rate, as adjusted, or free cash flow on a forward-looking basis because the information necessary to calculate a meaningful or accurate estimation of reconciling items is not available without unreasonable effort. For example, such reconciling items include the impact of foreign currency exchange gains or losses, gains or losses that are unusual or nonrecurring in nature, as well as discrete taxable events. We cannot estimate or project these items and they may have a substantial and unpredictable impact on our US GAAP results.
Constant Currency
Constant currency or ex-FX percentages are calculated by excluding the impact the change in average exchange rates between the current and comparable period by currency denomination exposure of the comparable period amount.
Organic Growth
Organic growth or ex-M&A percentages are calculated by excluding the impact of recent acquisitions and divestitures.
5
Segment Financial Measures
The primary measure of segment operating performance is Adjusted EBIT, which is a key metric that is used by management to evaluate business performance in comparison to budgets, forecasts and prior year financial results, providing a measure that management believes reflects Axalta’s core operating performance. As we do not measure segment operating performance based on net income, a reconciliation of this non-GAAP financial measure with the most directly comparable financial measure calculated in accordance with GAAP is not available.
About Axalta Coating Systems
Axalta is a global leader in the coatings industry, providing customers with innovative, colorful, beautiful and sustainable coatings solutions. From light vehicles, commercial vehicles and refinish applications to electric motors, building facades and other industrial applications, our coatings are designed to prevent corrosion, increase productivity and enhance durability. With more than 150 years of experience in the coatings industry, the 14,000 people of Axalta continue to find ways to serve our more than 100,000 customers in over 130 countries better every day with the finest coatings, application systems and technology. For more information visit axalta.com and follow us @axalta on Twitter.
6
Financial Statement Tables | ||||||||||||||||
AXALTA COATING SYSTEMS LTD. | ||||||||||||||||
Condensed Consolidated Statements of Operations (Unaudited) | ||||||||||||||||
(In millions, except per share data) | ||||||||||||||||
Three Months Ended December 31, | Years Ended December 31, | |||||||||||||||
2019 | 2018 | 2019 | 2018 | |||||||||||||
Net sales | $ | 1,098.4 | $ | 1,165.8 | $ | 4,482.2 | $ | 4,696.0 | ||||||||
Cost of goods sold | 710.8 | 777.4 | 2,917.9 | 3,106.3 | ||||||||||||
Selling, general and administrative expenses | 204.9 | 211.7 | 822.1 | 876.4 | ||||||||||||
Other operating charges | 29.3 | 1.6 | 70.7 | 82.7 | ||||||||||||
Research and development expenses | 16.7 | 18.8 | 70.2 | 73.1 | ||||||||||||
Amortization of acquired intangibles | 28.0 | 28.5 | 113.1 | 115.4 | ||||||||||||
Income from operations | 108.7 | 127.8 | 488.2 | 442.1 | ||||||||||||
Interest expense, net | 40.1 | 41.1 | 162.6 | 159.6 | ||||||||||||
Other (income) expense, net | (0.6 | ) | 3.6 | (4.4 | ) | 15.0 | ||||||||||
Income before income taxes | 69.2 | 83.1 | 330.0 | 267.5 | ||||||||||||
Provision for income taxes | 27.0 | 6.3 | 77.4 | 54.2 | ||||||||||||
Net income | 42.2 | 76.8 | 252.6 | 213.3 | ||||||||||||
Less: Net income attributable to noncontrolling interests | 0.5 | 1.4 | 3.6 | 6.2 | ||||||||||||
Net income attributable to controlling interests | $ | 41.7 | $ | 75.4 | $ | 249.0 | $ | 207.1 | ||||||||
Basic net income per share | $ | 0.18 | $ | 0.32 | $ | 1.06 | $ | 0.87 | ||||||||
Diluted net income per share | $ | 0.18 | $ | 0.32 | $ | 1.06 | $ | 0.85 | ||||||||
Basic weighted average shares outstanding | 234.5 | 236.0 | 233.9 | 239.0 | ||||||||||||
Diluted weighted average shares outstanding | 235.7 | 239.0 | 235.8 | 242.9 | ||||||||||||
7
AXALTA COATING SYSTEMS LTD. | ||||||||
Condensed Consolidated Balance Sheets (Unaudited) | ||||||||
(In millions, except per share data) | ||||||||
December 31, 2019 | December 31, 2018 | |||||||
Assets | ||||||||
Current assets: | ||||||||
Cash and cash equivalents | $ | 1,017.5 | $ | 693.6 | ||||
Restricted cash | 3.0 | 2.8 | ||||||
Accounts and notes receivable, net | 830.1 | 860.8 | ||||||
Inventories | 591.6 | 613.0 | ||||||
Prepaid expenses and other current assets | 131.2 | 139.4 | ||||||
Total current assets | 2,573.4 | 2,309.6 | ||||||
Property, plant and equipment, net | 1,223.0 | 1,298.2 | ||||||
Goodwill | 1,208.9 | 1,230.8 | ||||||
Identifiable intangibles, net | 1,223.9 | 1,348.0 | ||||||
Other assets | 588.8 | 489.1 | ||||||
Total assets | $ | 6,818.0 | $ | 6,675.7 | ||||
Liabilities, Shareholders’ Equity | ||||||||
Current liabilities: | ||||||||
Accounts payable | $ | 483.7 | $ | 522.8 | ||||
Current portion of borrowings | 43.9 | 42.2 | ||||||
Other accrued liabilities | 545.3 | 475.6 | ||||||
Total current liabilities | 1,072.9 | 1,040.6 | ||||||
Long-term borrowings | 3,790.2 | 3,821.8 | ||||||
Accrued pensions | 285.2 | 261.9 | ||||||
Deferred income taxes | 115.5 | 140.8 | ||||||
Other liabilities | 144.6 | 100.1 | ||||||
Total liabilities | 5,408.4 | 5,365.2 | ||||||
Shareholders’ equity | ||||||||
Common shares, $1.00 par, 1,000.0 shares authorized, 250.1 and 246.7 shares issued at December 31, 2019 and 2018, respectively | 249.9 | 245.3 | ||||||
Capital in excess of par | 1,474.1 | 1,409.5 | ||||||
Retained earnings | 443.2 | 198.6 | ||||||
Treasury shares, at cost, 15.2 and 11.1 shares at December 31, 2019 and 2018, respectively | (417.5 | ) | (312.2 | ) | ||||
Accumulated other comprehensive loss | (395.5 | ) | (336.1 | ) | ||||
Total Axalta shareholders’ equity | 1,354.2 | 1,205.1 | ||||||
Noncontrolling interests | 55.4 | 105.4 | ||||||
Total shareholders’ equity | 1,409.6 | 1,310.5 | ||||||
Total liabilities and shareholders’ equity | $ | 6,818.0 | $ | 6,675.7 | ||||
8
AXALTA COATING SYSTEMS LTD. | ||||||||
Condensed Consolidated Statements of Cash Flows (Unaudited) | ||||||||
(In millions) | ||||||||
Years Ended December 31, | ||||||||
2019 | 2018 | |||||||
Operating activities: | ||||||||
Net income | $ | 252.6 | $ | 213.3 | ||||
Adjustment to reconcile net income to cash provided by operating activities: | ||||||||
Depreciation and amortization | 353.0 | 369.1 | ||||||
Amortization of deferred financing costs and original issue discount | 8.8 | 8.0 | ||||||
Debt extinguishment and refinancing related costs | 0.2 | 9.5 | ||||||
Deferred income taxes | 15.7 | 6.1 | ||||||
Realized and unrealized foreign exchange losses, net | 5.9 | 17.3 | ||||||
Stock-based compensation | 15.7 | 37.3 | ||||||
Divestitures and impairments charges | 21.1 | — | ||||||
Interest income on swaps designated as net investment hedges | (14.7 | ) | (9.4 | ) | ||||
Other non-cash, net | (0.1 | ) | (0.9 | ) | ||||
Changes in operating assets and liabilities: | ||||||||
Trade accounts and notes receivable | (10.1 | ) | (22.3 | ) | ||||
Inventories | 10.8 | (48.1 | ) | |||||
Prepaid expenses and other assets | (118.9 | ) | (157.3 | ) | ||||
Accounts payable | 18.2 | 49.5 | ||||||
Other accrued liabilities | 5.3 | (8.4 | ) | |||||
Other liabilities | 9.6 | 32.4 | ||||||
Cash provided by operating activities | 573.1 | 496.1 | ||||||
Investing activities: | ||||||||
Acquisitions, net of cash acquired | (3.3 | ) | (82.8 | ) | ||||
Purchase of property, plant and equipment | (112.5 | ) | (143.4 | ) | ||||
Proceeds from sale of consolidated joint venture, net of cash divested | 8.2 | — | ||||||
Interest proceeds on swaps designated as net investment hedges | 14.7 | 9.4 | ||||||
Proceeds from settlement of swaps designated as net investment hedges | — | 22.5 | ||||||
Other investing activities, net | (1.0 | ) | 5.1 | |||||
Cash used for investing activities | (93.9 | ) | (189.2 | ) | ||||
Financing activities: | ||||||||
Proceeds from long-term borrowings | — | 468.9 | ||||||
Payments on short-term borrowings | (39.5 | ) | (44.7 | ) | ||||
Payments on long-term borrowings | (27.6 | ) | (511.3 | ) | ||||
Financing-related costs | (1.5 | ) | (10.8 | ) | ||||
Proceeds from option exercises | 50.3 | 17.4 | ||||||
Dividends paid to noncontrolling interests | (1.5 | ) | (1.0 | ) | ||||
Investments in noncontrolling interests | (31.1 | ) | (26.9 | ) | ||||
Purchase of treasury stock | (105.3 | ) | (253.8 | ) | ||||
Deferred acquisition-related consideration | (2.2 | ) | (6.0 | ) | ||||
Cash used for financing activities | (158.4 | ) | (368.2 | ) | ||||
Increase (decrease) in cash and cash equivalents | 320.8 | (61.3 | ) | |||||
Effect of exchange rate changes on cash | 3.3 | (15.2 | ) | |||||
Cash at beginning of period | 696.4 | 772.9 | ||||||
Cash at end of period | $ | 1,020.5 | $ | 696.4 | ||||
Cash at end of period reconciliation: | ||||||||
Cash and cash equivalents | $ | 1,017.5 | $ | 693.6 | ||||
Restricted cash | 3.0 | 2.8 | ||||||
Cash at end of period | $ | 1,020.5 | $ | 696.4 | ||||
9
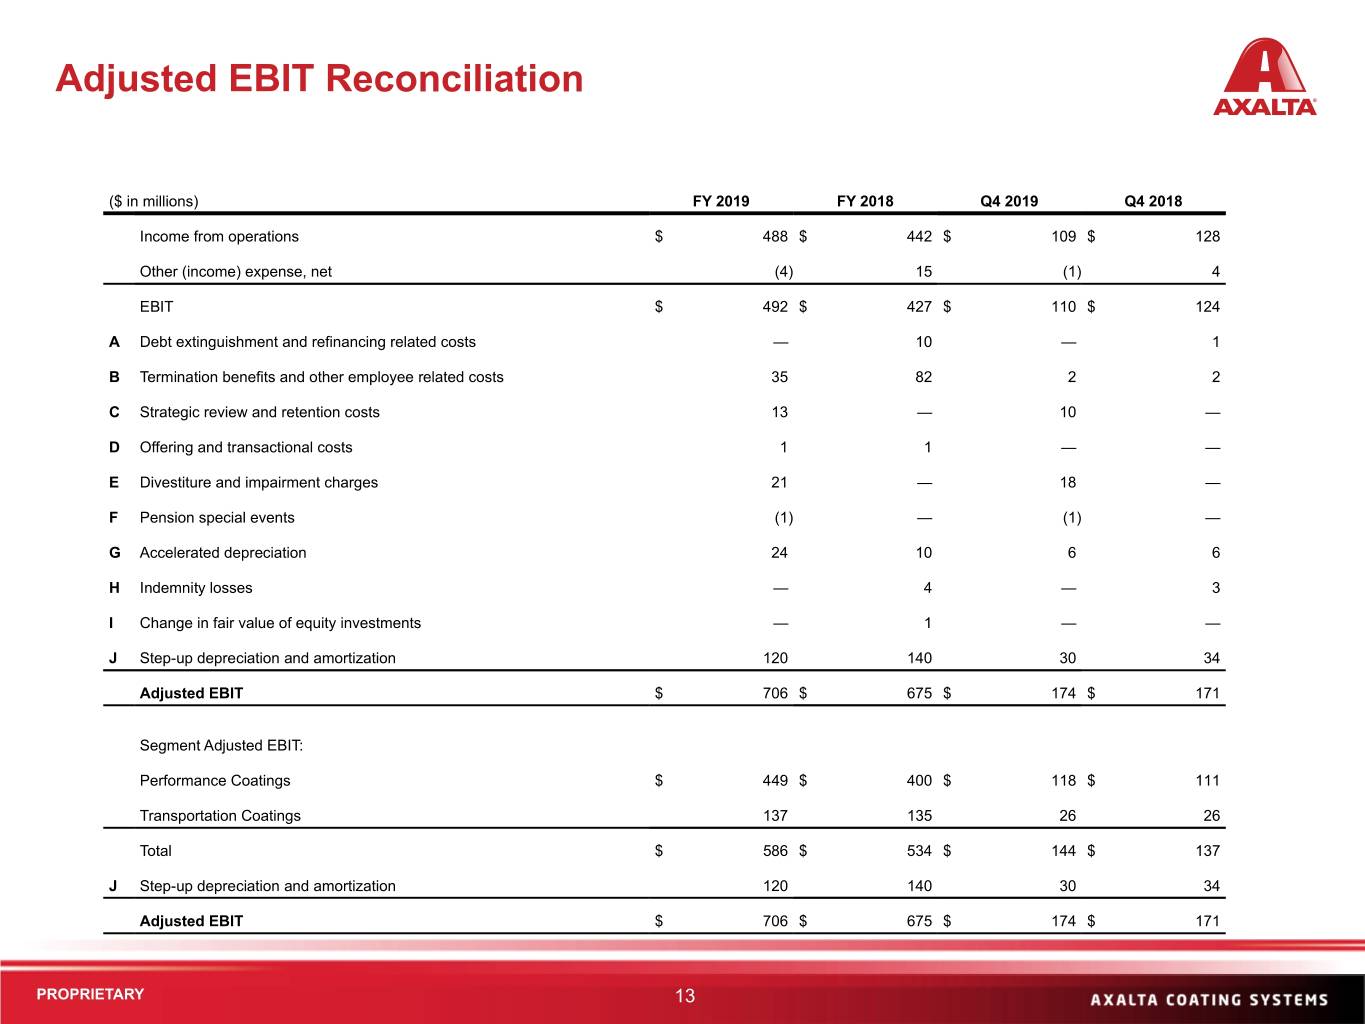
The following table reconciles income from operations to adjusted EBIT and segment adjusted EBIT for the periods presented (in millions):
Three Months Ended December 31, | Years Ended December 31, | |||||||||||||||
2019 | 2018 | 2019 | 2018 | |||||||||||||
Income from operations | $ | 108.7 | $ | 127.8 | $ | 488.2 | $ | 442.1 | ||||||||
Other (income) expense, net | (0.6 | ) | 3.6 | (4.4 | ) | 15.0 | ||||||||||
EBIT | 109.3 | 124.2 | 492.6 | 427.1 | ||||||||||||
Debt extinguishment and refinancing related costs (a) | — | 1.1 | 0.2 | 9.5 | ||||||||||||
Termination benefits and other employee related costs (b) | 1.9 | 1.5 | 35.2 | 81.7 | ||||||||||||
Strategic review and retention costs (c) | 9.6 | — | 13.4 | — | ||||||||||||
Offering and transactional costs (d) | 0.1 | 0.1 | 1.0 | 1.0 | ||||||||||||
Divestiture and impairment charges (e) | 17.7 | — | 21.1 | — | ||||||||||||
Pension special events (f) | (0.9 | ) | — | (0.9 | ) | — | ||||||||||
Accelerated depreciation (g) | 6.1 | 6.1 | 24.3 | 10.3 | ||||||||||||
Indemnity (income) losses (h) | (0.2 | ) | 3.4 | (0.4 | ) | 4.3 | ||||||||||
Change in fair value of equity investments (i) | — | 0.1 | — | 0.5 | ||||||||||||
Step-up depreciation and amortization (j) | 29.9 | 34.3 | 119.5 | 140.1 | ||||||||||||
Adjusted EBIT | $ | 173.5 | $ | 170.8 | $ | 706.0 | $ | 674.5 | ||||||||
Segment Adjusted EBIT: | ||||||||||||||||
Performance Coatings | $ | 118.0 | $ | 110.5 | $ | 449.1 | $ | 399.5 | ||||||||
Transportation Coatings | 25.6 | 26.0 | 137.4 | 134.9 | ||||||||||||
Total | 143.6 | 136.5 | 586.5 | 534.4 | ||||||||||||
Step-up depreciation and amortization (j) | 29.9 | 34.3 | 119.5 | 140.1 | ||||||||||||
Adjusted EBIT | $ | 173.5 | $ | 170.8 | $ | 706.0 | $ | 674.5 | ||||||||
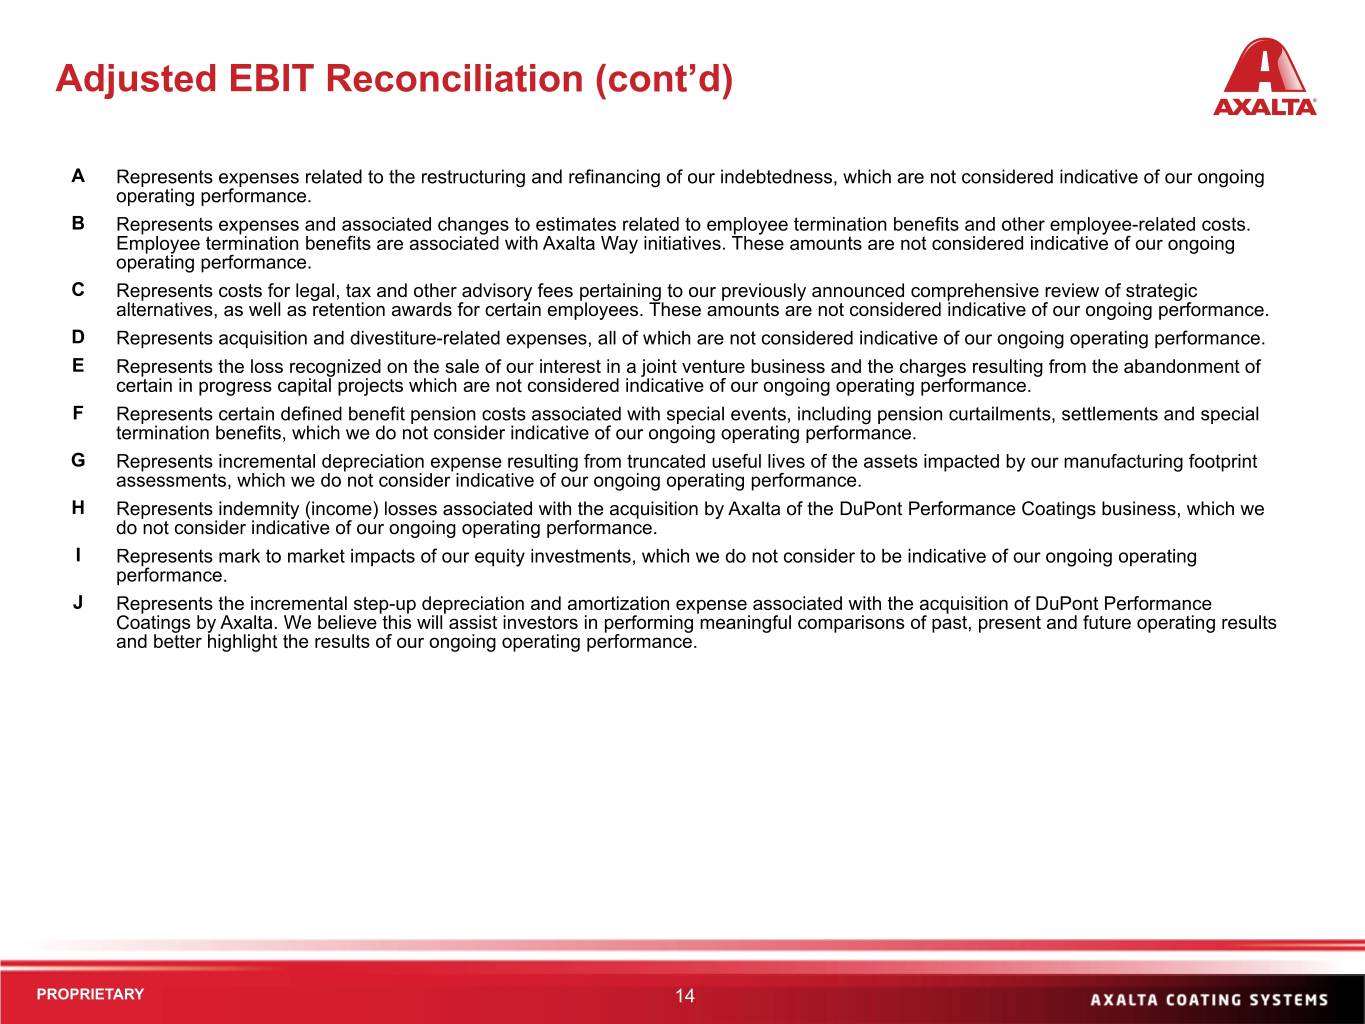
(a) | Represents expenses related to the restructuring and refinancing of our indebtedness, which are not considered indicative of our ongoing operating performance. |
(b) | Represents expenses and associated changes to estimates related to employee termination benefits and other employee-related costs. Employee termination benefits are associated with Axalta Way initiatives. These amounts are not considered indicative of our ongoing operating performance. |
(c) | Represents costs for legal, tax and other advisory fees pertaining to our previously announced comprehensive review of strategic alternatives, as well as retention awards for certain employees. These amounts are not considered indicative of our ongoing performance. |
(d) | Represents acquisition and divestiture-related expenses, all of which are not considered indicative of our ongoing operating performance. |
(e) | Represents the loss recognized on the sale of our interest in a joint venture business and the charges resulting from the abandonment of certain in progress capital projects which are not considered indicative of our ongoing operating performance. |
(f) | Represents certain defined benefit pension costs associated with special events, including pension curtailments, settlements and special termination benefits, which we do not consider indicative of our ongoing operating performance. |
(g) | Represents incremental depreciation expense resulting from truncated useful lives of the assets impacted by our manufacturing footprint assessments, which we do not consider indicative of our ongoing operating performance. |
(h) | Represents indemnity (income) losses associated with the acquisition by Axalta of the DuPont Performance Coatings business, which we do not consider indicative of our ongoing operating performance. |
(i) | Represents mark to market impacts of our equity investments, which we do not consider to be indicative of our ongoing operating performance. |
(j) | Represents the incremental step-up depreciation and amortization expense associated with the acquisition of DuPont Performance Coatings by Axalta. We believe this will assist investors in performing meaningful comparisons of past, present and future operating results and better highlight the results of our ongoing operating performance. |
10
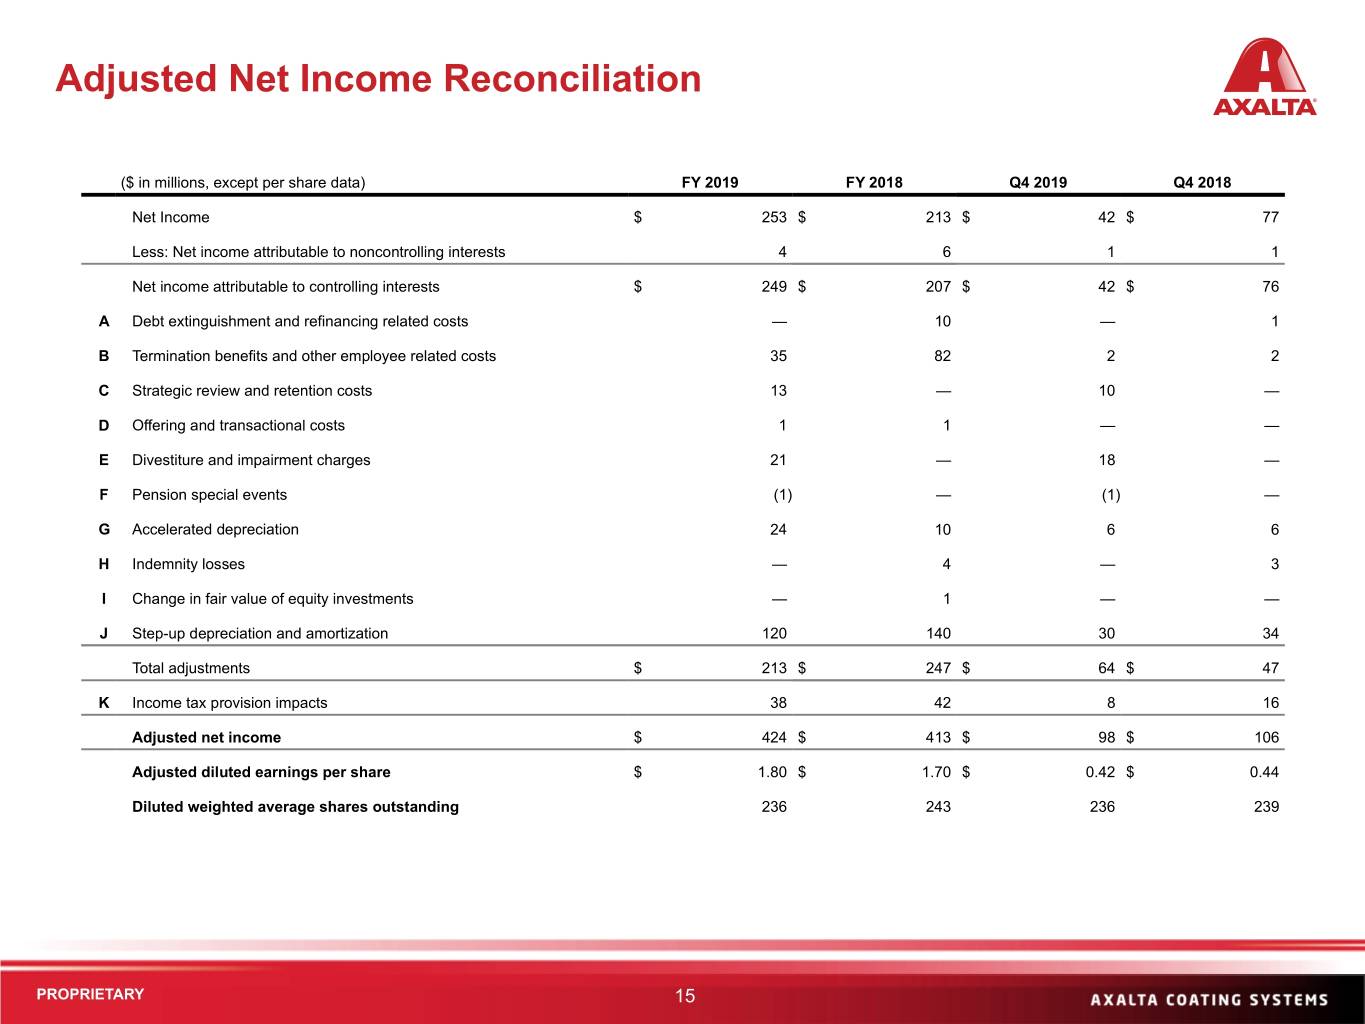
The following table reconciles net income to adjusted net income for the periods presented (in millions, except per share data):
Three Months Ended December 31, | Years Ended December 31, | |||||||||||||||
2019 | 2018 | 2019 | 2018 | |||||||||||||
Net income | $ | 42.2 | $ | 76.8 | $ | 252.6 | $ | 213.3 | ||||||||
Less: Net income attributable to noncontrolling interests | 0.5 | 1.4 | 3.6 | 6.2 | ||||||||||||
Net income attributable to controlling interests | 41.7 | 75.4 | 249.0 | 207.1 | ||||||||||||
Debt extinguishment and refinancing related costs (a) | — | 1.1 | 0.2 | 9.5 | ||||||||||||
Termination benefits and other employee related costs (b) | 1.9 | 1.5 | 35.2 | 81.7 | ||||||||||||
Strategic review and retention costs (c) | 9.6 | — | 13.4 | — | ||||||||||||
Offering and transactional costs (d) | 0.1 | 0.1 | 1.0 | 1.0 | ||||||||||||
Divestiture and impairment charges (e) | 17.7 | — | 21.1 | — | ||||||||||||
Pension special events (f) | (0.9 | ) | — | (0.9 | ) | — | ||||||||||
Accelerated depreciation (g) | 6.1 | 6.1 | 24.3 | 10.3 | ||||||||||||
Indemnity (income) losses (h) | (0.2 | ) | 3.4 | (0.4 | ) | 4.3 | ||||||||||
Change in fair value of equity investments (i) | — | 0.1 | — | 0.5 | ||||||||||||
Step-up depreciation and amortization (j) | 29.9 | 34.3 | 119.5 | 140.1 | ||||||||||||
Total adjustments | 64.2 | 46.6 | 213.4 | 247.4 | ||||||||||||
Income tax provision (benefit) impacts (k) | 7.9 | 16.3 | 38.0 | 42.0 | ||||||||||||
Adjusted net income | $ | 98.0 | $ | 105.7 | $ | 424.4 | $ | 412.5 | ||||||||
Adjusted diluted net income per share | $ | 0.42 | $ | 0.44 | $ | 1.80 | $ | 1.70 | ||||||||
Diluted weighted average shares outstanding | 235.7 | 239.0 | 235.8 | 242.9 | ||||||||||||
(a) | Represents expenses related to the restructuring and refinancing of our indebtedness, which are not considered indicative of our ongoing operating performance. |
(b) | Represents expenses and associated changes to estimates related to employee termination benefits and other employee-related costs. Employee termination benefits are associated with Axalta Way initiatives. These amounts are not considered indicative of our ongoing operating performance. |
(c) | Represents costs for legal, tax and other advisory fees pertaining to our previously announced comprehensive review of strategic alternatives, as well as retention awards for certain employees. These amounts are not considered indicative of our ongoing performance. |
(d) | Represents acquisition and divestiture-related expenses, all of which are not considered indicative of our ongoing operating performance. |
(e) | Represents the loss recognized on the sale of our interest in a joint venture business and the charges resulting from the abandonment of certain in progress capital projects which are not considered indicative of our ongoing operating performance. |
(f) | Represents certain defined benefit pension costs associated with special events, including pension curtailments, settlements and special termination benefits, which we do not consider indicative of our ongoing operating performance. |
(g) | Represents incremental depreciation expense resulting from truncated useful lives of the assets impacted by our manufacturing footprint assessments, which we do not consider indicative of our ongoing operating performance. |
(h) | Represents indemnity (income) losses associated with the acquisition by Axalta of the DuPont Performance Coatings business, which we do not consider indicative of our ongoing operating performance. |
(i) | Represents mark to market impacts of our equity investments, which we do not consider to be indicative of our ongoing operating performance. |
(j) | Represents the incremental step-up depreciation and amortization expense associated with the acquisition of DuPont Performance Coatings by Axalta. We believe this will assist investors in performing meaningful comparisons of past, present and future operating results and better highlight the results of our ongoing operating performance. |
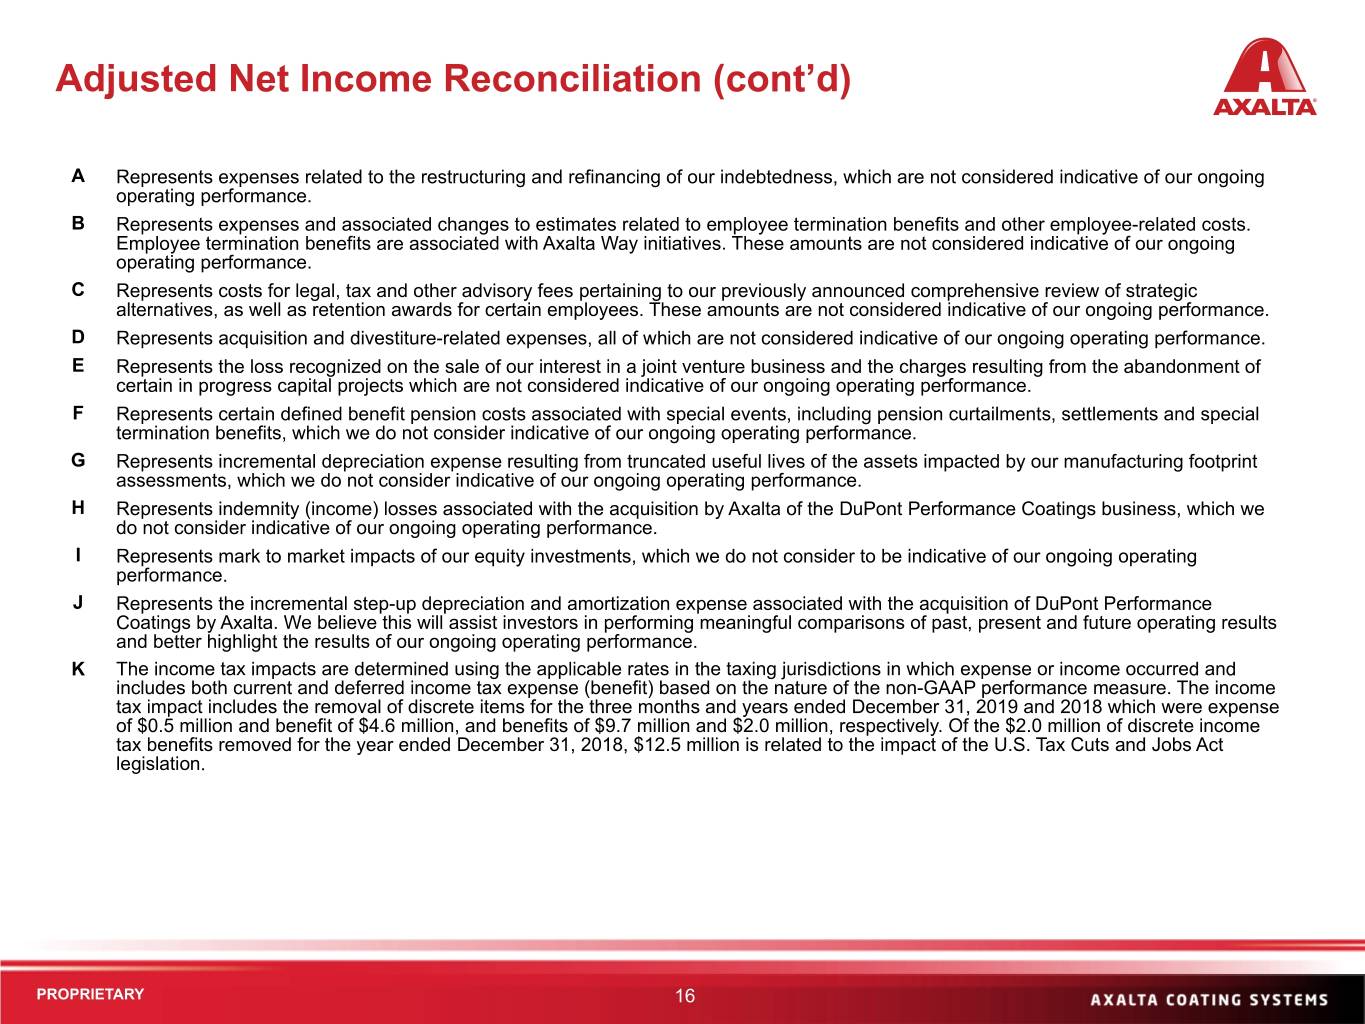
(k) | The income tax impacts are determined using the applicable rates in the taxing jurisdictions in which expense or income occurred and includes both current and deferred income tax expense (benefit) based on the nature of the non-GAAP performance measure. The income tax impact includes the removal of discrete items for the three months and years ended December 31, 2019 and 2018 which were expense of $0.5 million and benefit of $4.6 million, and benefits of $9.7 million and $2.0 million, respectively. Of the $2.0 million of discrete income tax benefits removed for the year ended December 31, 2018, $12.5 million is related to the impact of the U.S. Tax Cuts and Jobs Act legislation. |
11
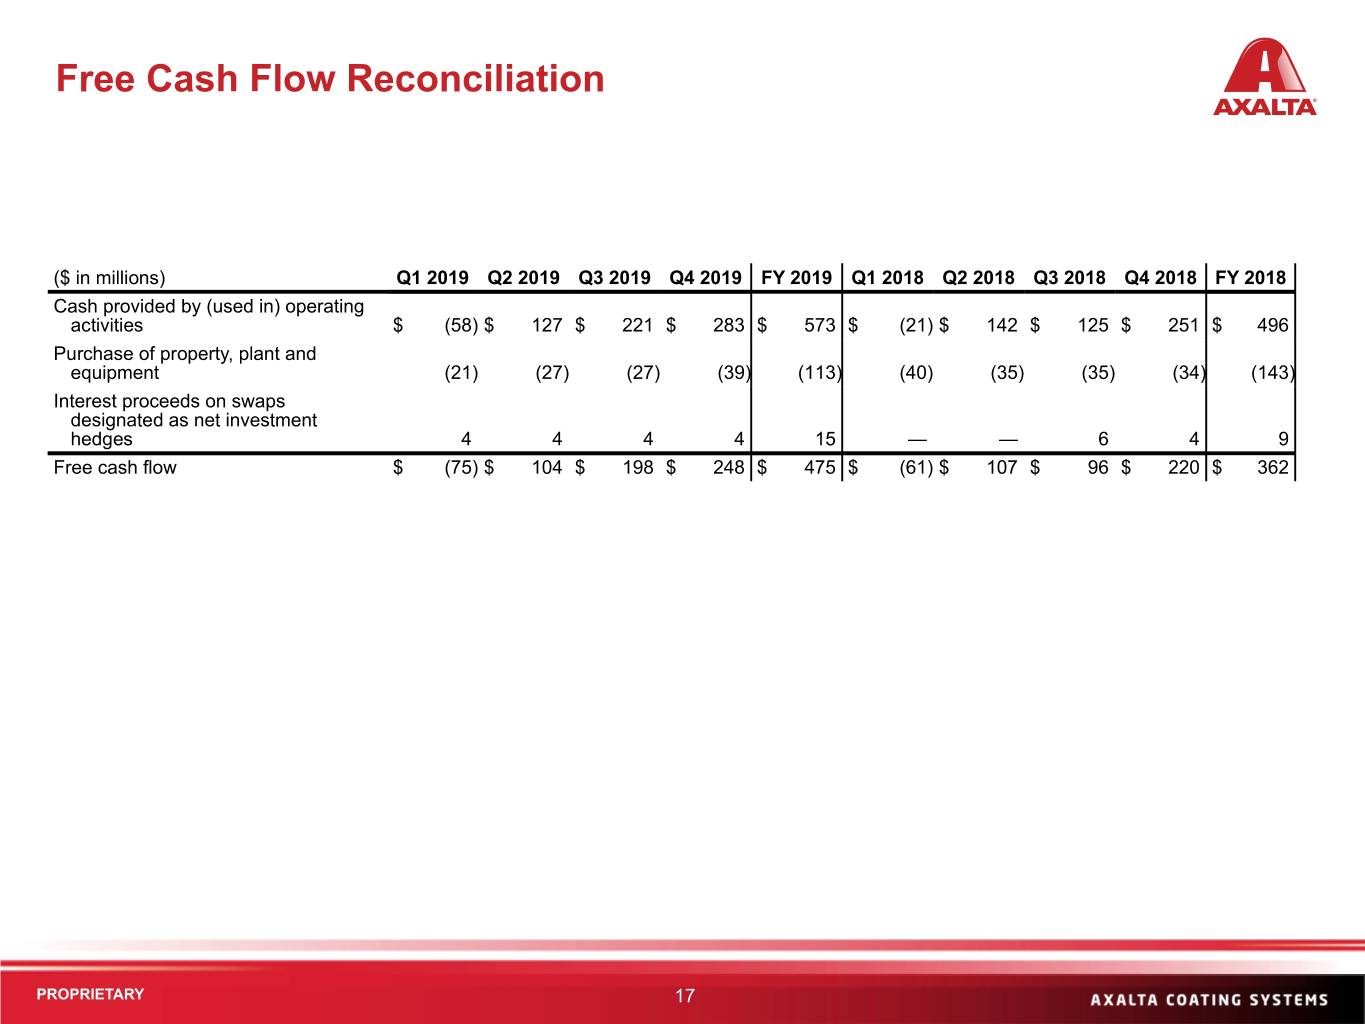
The following table reconciles cash (used in) provided by operating activities to free cash flow for the periods presented (in millions):
Three Months Ended March 31, | Three Months Ended June 30, | Three Months Ended September 30, | Three Months Ended December 31, | Years Ended December 31, | |||||||||||||||||||||||||||||||||||
2019 | 2018 | 2019 | 2018 | 2019 | 2018 | 2019 | 2018 | 2019 | 2018 | ||||||||||||||||||||||||||||||
Cash (used in) provided by operating activities | $ | (57.9 | ) | $ | (21.0 | ) | $ | 126.7 | $ | 142.0 | $ | 221.0 | $ | 124.5 | $ | 283.3 | $ | 250.6 | $ | 573.1 | $ | 496.1 | |||||||||||||||||
Purchase of property, plant and equipment | (20.5 | ) | (39.5 | ) | (26.7 | ) | (35.1 | ) | (26.7 | ) | (34.9 | ) | (38.6 | ) | (33.9 | ) | (112.5 | ) | (143.4 | ) | |||||||||||||||||||
Interest proceeds on swaps designated as net investment hedges | 3.5 | — | 3.7 | — | 3.8 | 5.9 | 3.7 | 3.5 | 14.7 | 9.4 | |||||||||||||||||||||||||||||
Free cash flow | $ | (74.9 | ) | $ | (60.5 | ) | $ | 103.7 | $ | 106.9 | $ | 198.1 | $ | 95.5 | $ | 248.4 | $ | 220.2 | $ | 475.3 | $ | 362.1 | |||||||||||||||||
12
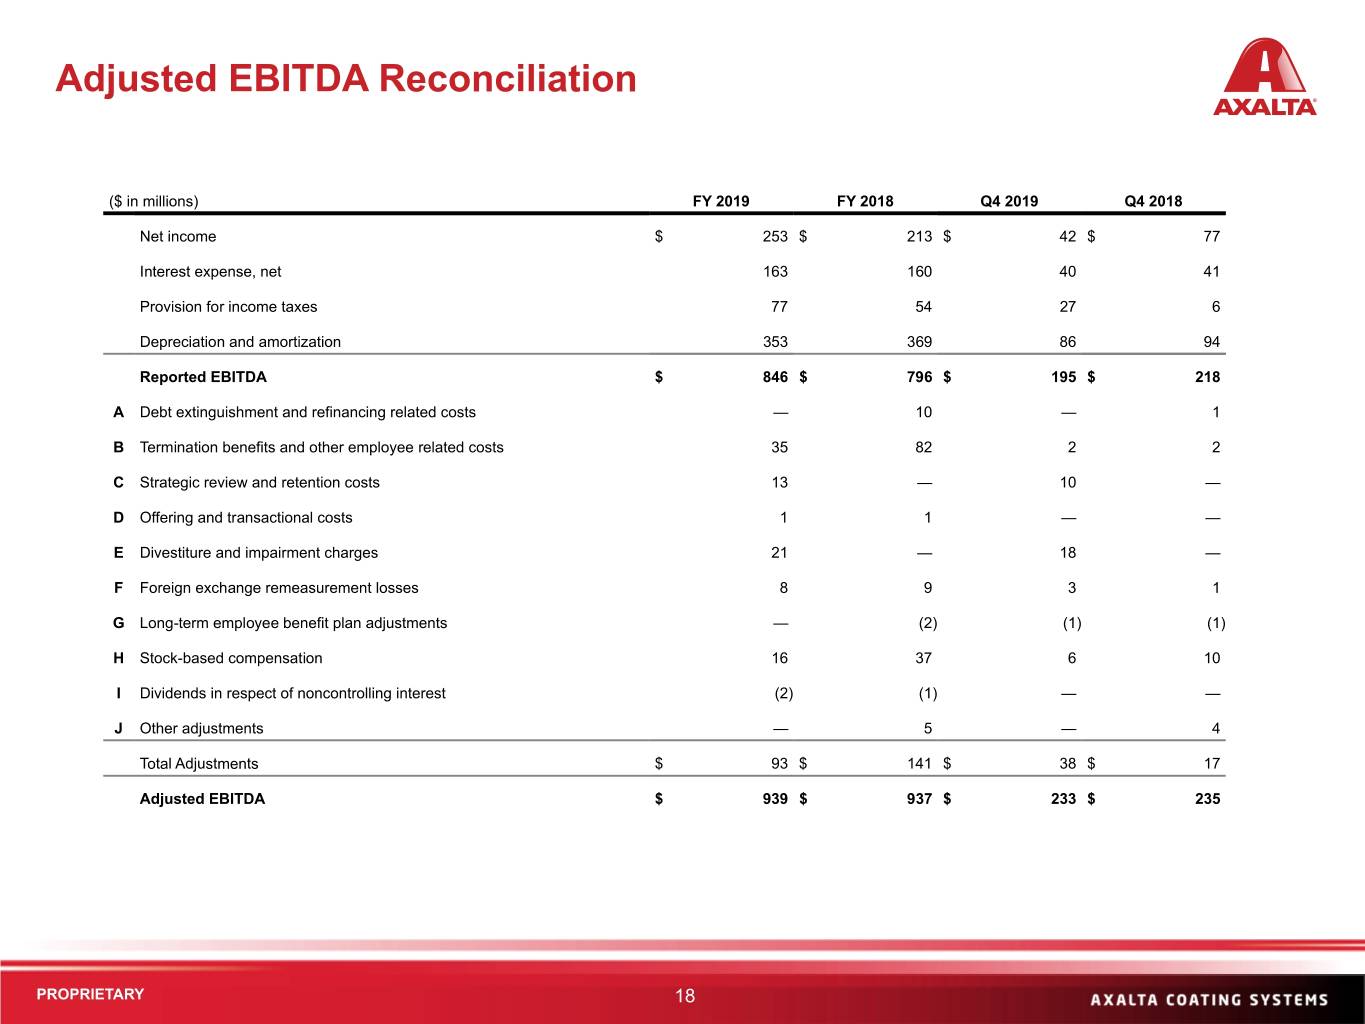
The following table reconciles net income to EBITDA and Adjusted EBITDA for the periods presented (in millions):
Three Months Ended December 31, | Years Ended December 31, | |||||||||||||||
2019 | 2018 | 2019 | 2018 | |||||||||||||
Net income | $ | 42.2 | $ | 76.8 | $ | 252.6 | $ | 213.3 | ||||||||
Interest expense, net | 40.1 | 41.1 | 162.6 | 159.6 | ||||||||||||
Provision for income taxes | 27.0 | 6.3 | 77.4 | 54.2 | ||||||||||||
Depreciation and amortization | 85.7 | 94.2 | 353.0 | 369.1 | ||||||||||||
EBITDA | 195.0 | 218.4 | 845.6 | 796.2 | ||||||||||||
Debt extinguishment and refinancing related costs (a) | — | 1.1 | 0.2 | 9.5 | ||||||||||||
Termination benefits and other employee related costs (b) | 1.9 | 1.5 | 35.2 | 81.7 | ||||||||||||
Strategic review and retention costs (c) | 9.6 | — | 13.4 | — | ||||||||||||
Offering and transactional costs (d) | 0.1 | 0.1 | 1.0 | 1.0 | ||||||||||||
Divestiture and impairment charges (e) | 17.7 | — | 21.1 | — | ||||||||||||
Foreign exchange remeasurement losses (f) | 3.0 | 0.5 | 8.3 | 9.2 | ||||||||||||
Long-term employee benefit plan adjustments (g) | (0.7 | ) | (0.5 | ) | 0.1 | (1.9 | ) | |||||||||
Stock-based compensation (h) | 6.2 | 9.8 | 15.7 | 37.3 | ||||||||||||
Dividends in respect of noncontrolling interest (i) | — | — | (1.5 | ) | (1.0 | ) | ||||||||||
Other adjustments (j) | (0.3 | ) | 4.0 | (0.2 | ) | 5.2 | ||||||||||
Adjusted EBITDA | $ | 232.5 | $ | 234.9 | $ | 938.9 | $ | 937.2 | ||||||||
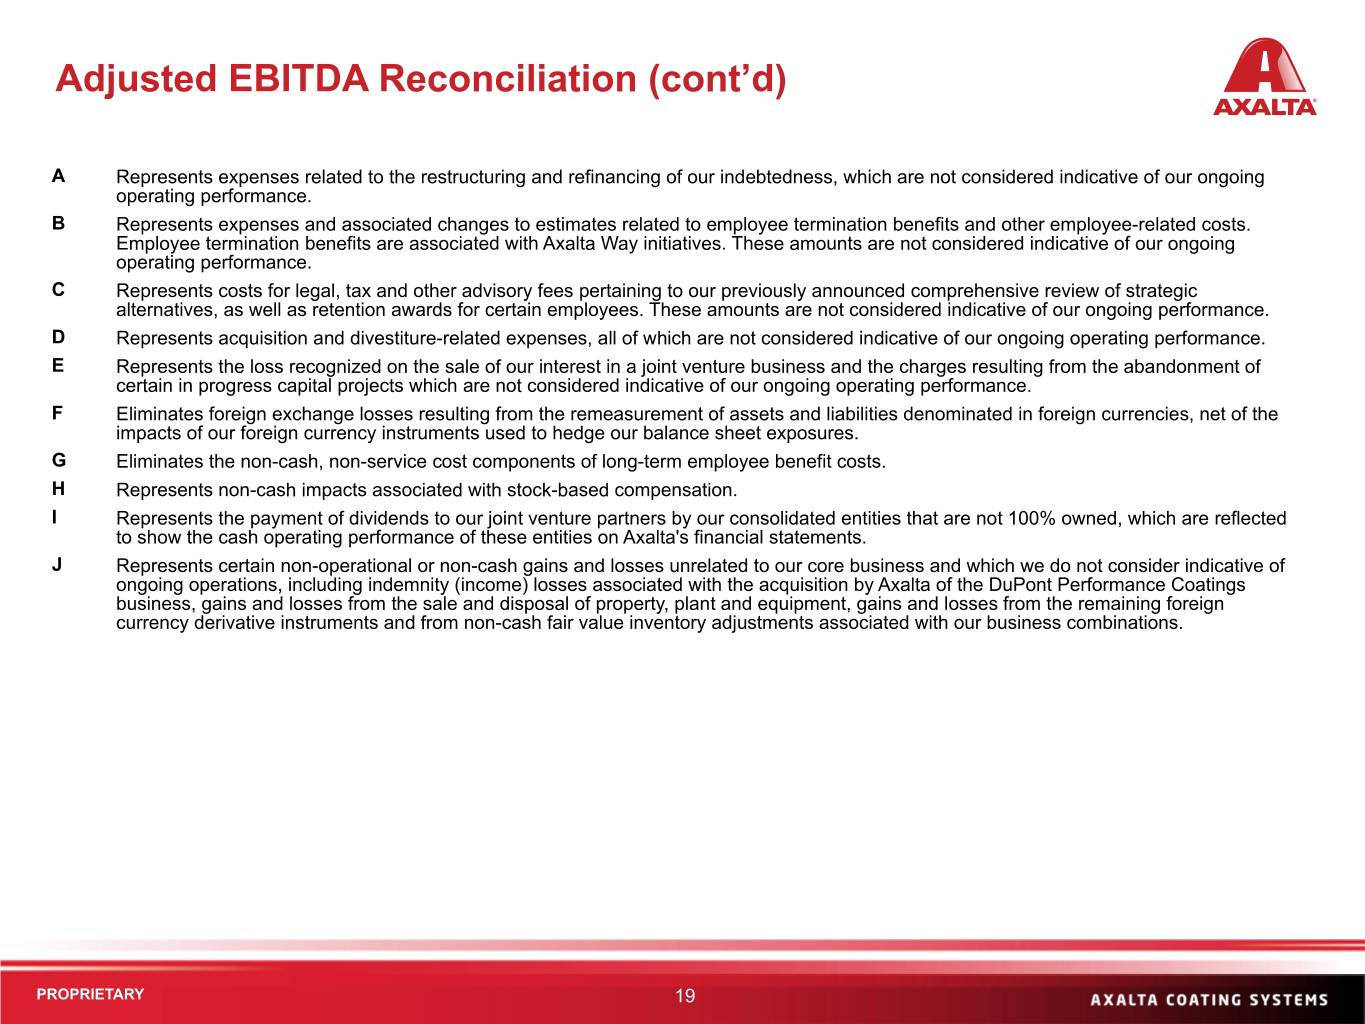
(a) | Represents expenses related to the restructuring and refinancing of our indebtedness, which are not considered indicative of our ongoing operating performance. |
(b) | Represents expenses and associated changes to estimates related to employee termination benefits and other employee-related costs. Employee termination benefits are associated with Axalta Way initiatives. These amounts are not considered indicative of our ongoing operating performance. |
(c) | Represents costs for legal, tax and other advisory fees pertaining to our previously announced comprehensive review of strategic alternatives, as well as retention awards for certain employees. These amounts are not considered indicative of our ongoing performance. |
(d) | Represents acquisition and divestiture-related expenses, all of which are not considered indicative of our ongoing operating performance. |
(e) | Represents the loss recognized on the sale of our interest in a joint venture business and the charges resulting from the abandonment of certain in progress capital projects which are not considered indicative of our ongoing operating performance. |
(f) | Eliminates foreign exchange losses resulting from the remeasurement of assets and liabilities denominated in foreign currencies, net of the impacts of our foreign currency instruments used to hedge our balance sheet exposures. |
(g) | Eliminates the non-cash, non-service cost components of long-term employee benefit costs. |
(h) | Represents non-cash impacts associated with stock-based compensation. |
(i) | Represents the payment of dividends to our joint venture partners by our consolidated entities that are not 100% owned, which are reflected to show the cash operating performance of these entities on Axalta's financial statements. |
(j) | Represents certain non-operational or non-cash gains and losses unrelated to our core business and which we do not consider indicative of ongoing operations, including indemnity (income) losses associated with the acquisition by Axalta of the DuPont Performance Coatings business, gains and losses from the sale and disposal of property, plant and equipment, gains and losses from the remaining foreign currency derivative instruments and from non-cash fair value inventory adjustments associated with our business combinations. |
13