Document
false0000008947 0000008947 2020-04-29 2020-04-29


UNITED STATES
SECURITIES AND EXCHANGE COMMISSION
Washington, D.C. 20549
 
FORM 8-K
CURRENT REPORT
PURSUANT TO SECTION 13 OR 15(d) OF THE SECURITIES EXCHANGE ACT OF 1934
April 29, 2020
Date of Report (Date of earliest event reported)
 
AZZ Inc.
(Exact name of Registrant as specified in its charter)
Texas
 
1-12777
 
75-0948250
(State or other jurisdiction
of incorporation)
 
(Commission
File Number)
 
(I.R.S. Employer
Identification No.)
One Museum Place, Suite 500
3100 West 7th Street
Fort Worth, Texas 76107
(Address of principal executive offices) (Zip Code)
(817) 810-0095
(Registrant’s telephone number, including area code)
Not applicable
(Former name or former address, if changed since last report.)
Check the appropriate box below if the Form 8-K filing is intended to simultaneously satisfy the filing obligation of the registrant under any of the following provisions:
Written communications pursuant to Rule 425 under the Securities Act (17 CFR 230.425)
Soliciting material pursuant to Rule 14a-12 under the Exchange Act (17 CFR 240.14a-12)
Pre-commencement communications pursuant to Rule 14d-2(b) under the Exchange Act (17 CFR 240.14d-2(b))
Pre-commencement communications pursuant to Rule 13e-4(c) under the Exchange Act (17 CFR 240.13e-4(c))
Securities registered pursuant to Section 12(b) of the Act:
Title of each class
  
Trading Symbol
 
Name of each exchange on which registered
Common Stock
  
AZZ
 
New York Stock Exchange
Indicate by check mark whether the Registrant is an emerging growth company as defined in Rule 405 of the Securities Act of 1933 (§230.405 of this chapter) or Rule 12b-2 of the Securities Exchange Act of 1934 (§240.12b-2 of this chapter). Emerging growth company
If an emerging growth company, indicate by check mark if the registrant has elected not to use the extended transition period for complying with any new or revised financial accounting standards provided pursuant to Section 13(a) of the Exchange Act.


Item 2.02 Results of Operations and Financial Condition.

On April 29, 2020, AZZ Inc. ("AZZ") issued a press release reporting AZZ’s fourth quarter and full year financial results for the period ended February 29, 2020. A copy of this press release is attached hereto as Exhibit 99.1 and incorporated herein by reference.

The information in this Item 2.02 (including Exhibit 99.1) is being furnished and shall not be deemed to be filed for purposes of Section 18 of the Securities Exchange Act of 1934, as amended, or subject to the liabilities of that Section or Sections 11 and 12(a)(2) of the Securities Act of 1933, as amended. Nor shall the information in this Current Report be incorporated by reference in any other filing with the U.S. Securities and Exchange Commission made by AZZ, whether made before or after the date hereof, unless specifically identified therein as being incorporated therein by reference in such filing.

Item 7.01 Regulation FD Disclosure.

On April 29, 2020, AZZ also posted an investor presentation to its website at https://www.azz.com/investor-relations. A copy of the investor presentation is attached hereto as Exhibit 99.2 and incorporated herein by reference.

The information in this Item 7.01 (including Exhibit 99.2) is being furnished and shall not be deemed to be filed for purposes of Section 18 of the Securities Exchange Act of 1934, as amended, or subject to the liabilities of that Section or Sections 11 and 12(a)(2) of the Securities Act of 1933, as amended. Nor shall the information in this Current Report be incorporated by reference in any other filing with the U.S. Securities and Exchange Commission made by AZZ, whether made before or after the date hereof, unless specifically identified there as being incorporated therein by reference in such filing.

Item 9.01 Financial Statements and Exhibits.

The following exhibits are filed as part of this report.

Exhibit
Description
99.1
99.2


SIGNATURES

Pursuant to the requirements of the Securities Exchange Act of 1934, the registrant has duly caused this report to be signed on its behalf by the undersigned hereunto duly authorized.

 
AZZ Inc.
Date: April 29, 2020

By: /s/ Paul W. Fehlman
 
Paul W. Fehlman
Senior Vice President and Chief Financial Officer


AZZ Inc. Reports Financial Results for Fiscal Year 2020

Full Year Fiscal 2020 Adjusted EPS of $2.71, up 38% over prior year, with reported EPS of $1.84

Annual Revenues of $1.06 billion, up 14.5% over prior year

Cash provided from operating activities increased 29.9% compared to prior year

Company discontinues previously issued Fiscal Year 2021 EPS guidance range of $2.65 to $3.15 and sales guidance range of $970 million to $1.06 billion due to market uncertainty associated with COVID-19 pandemic

April 29, 2020 - FORT WORTH, TX - AZZ Inc. (NYSE: AZZ), a global provider of metal coating solutions, welding solutions, specialty electrical equipment and highly engineered services, issued its 2020 audited consolidated financial statements contained in the Company's Fiscal Year 2020 Annual Report on Form 10-K for the year ended February 29, 2020.

Management Discussion
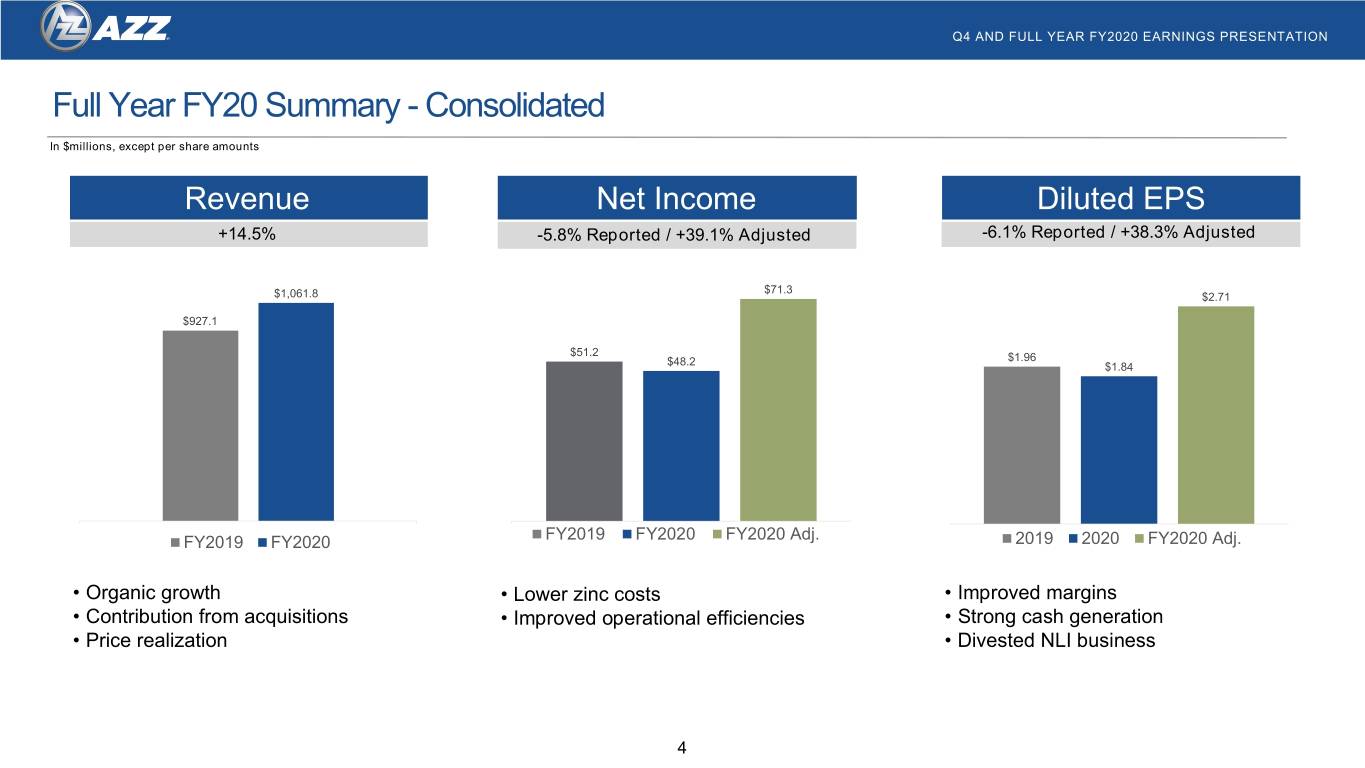
Tom Ferguson, president and chief executive officer of AZZ, stated, “In Fiscal 2020 we achieved solid double-digit year-over-year growth in both the topline as well as cash provided by operating activities, while posting our 33nd consecutive year of profitability. We experienced strong demand for galvanizing services, executed large refinery turnaround projects, and completed international projects for the Energy segment, resulting in overall revenue growth of 14.5% and a 5.8% decrease in reported net income as a result of three discrete non-recurring items discussed below. Our consolidated bookings for the year decreased 1.6% to $972.7 million while our backlog decreased 26.8% to $243.8 million, primarily due to the successful completion of large China orders booked in previous years. We continued our long history of strong cash flows by generating net cash provided by operating activities of 144.8 million, an increase of 29.9% compared to prior year. Reported EPS of $1.84 includes pre-tax adjusted items of $18.6 million for the loss on the disposal of the NLI business, $9.2 million from an impairment of certain assets in our WSI nuclear business, and $1.9 million of other tax adjustments related to NLI. Without these one-time items, adjusted net income was $71.3 million, up 39.3% compared to prior year, and EPS was $2.71, up 38.3% compared to $1.96 for the prior year, on a diluted basis.”


“During the year, we delivered solid top and bottom line growth, performed well in both our Metal Coatings and Energy segments, and took steps in our previously stated strategic plan to focus on core businesses as we successfully divested our Nuclear Logistics (“NLI”) business, and completed four acquisitions during the year: K2 Partners, Inc., NuZinc, LLC, Preferred Industries, Ltd., and Tennessee Galvanizing, Inc. Operational improvement initiatives, such as our investment in digital galvanizing systems (“DGS”), as well as business integration within our enclosure systems’ are meeting expectations, and our Surface Technology businesses continued to grow.”
    
“In Metal Coatings we returned to an operating margin of 21.6%, up from 19% for the previous year, driven primarily by higher volumes of steel processed in our kettles, lower zinc prices, and higher selling prices” said Mr. Ferguson. “Revenue gains in our Metal Coatings segment were driven by a combination of organic growth and acquisitions, demonstrating continued progress in growing this segment. We remain committed to delivering on the investments made in our Surface Technologies platform, which now totals seven locations. We will continue to drive operational efficiencies aggressively, and maintain an active M&A program to support our strategic growth initiatives, however, our ability to initiate new deals has recently slowed due to the COVID-19 pandemic. All of our Metal Coating operations in the United States are considered ‘essential’ under Homeland Security’s Cyber-Security and Infrastructure Agency guidelines. Our Metal Coatings plants remain open and, while many of our galvanizing plants are operating at pre-pandemic levels, a few are experiencing modest declines in volume as we enter the first quarter.”

Mr. Ferguson continued, Energy segment sales increased primarily due to the completion of a large electrical project in China and a large refinery turnaround project in Canada. We executed upon our previously stated strategic plan of focusing on core businesses through the successful divestiture of NLI at the end of the year. We believe this action, and impairing certain nuclear assets in WSI, was appropriate given the secular decline in the domestic nuclear power generation market. Our end markets for switchgear and e-houses were strong during the year, and we will continue to execute on the backlog we carry into fiscal year 2021. Our Energy products and services are essential to operating and maintaining infrastructure. Our customers count on our equipment and services to meet the needs of critical infrastructure throughout the United States and around the globe. Manufacturing operations within our electrical platform are, for the most part, uninterrupted. Our industrial field solutions platform is currently executing domestic turnaround projects, but at a significantly reduced level, due to limited refinery activity and travel restrictions. We are also seeing a decline in international refining turnarounds, as well as some customer requests to delay work to both the second the third quarter of FY2021 due to the COVID-19 pandemic.”


Discontinues Fiscal Year 2021 Guidance
Mr. Ferguson added, “Due to uncertainty associated with the recent COVID-19 pandemic on many of our end markets, we are discontinuing our previously issued fiscal 2021 sales and earnings per fully diluted share guidance range. We continue to operate as an ‘essential business’ in supporting critical infrastructure needs during these unprecedented times. Our low debt level and ample borrowing capacity, combined with our consistent ability to generate cash, gives us the confidence that we can manage both debt and liquidity satisfactorily throughout fiscal year 2021. We are conserving cash by moderately reducing capital expenditures, suspending share repurchases and taking selected staffing reductions in businesses with low demand. Additionally, we have not experienced any unusual slowdown in customer payments.”

Fourth Quarter and Fiscal Year Results
For the twelve-month period, the Company reported revenues of $1.06 billion compared to $927.1 million for the comparable period last year, an increase of 14.5%. Reported operating income increased 3.1% to $79.3 million compared to $77.0 million in last year’s comparable twelve month period. Operating income included a loss on sale of $18.6 million, as well as $9.2 in impairment charges and would have been $107.1 million on an adjusted basis, up 39.2% compared to prior year. Net income for the twelve months decreased 5.8% to $48.2 million, or $1.84 per diluted share on a reported basis, compared to $51.2 million, or $1.96 per diluted share compared to the prior fiscal year. The reported net income includes pre-tax adjusted items of $18.6 million on the loss on the disposal of the NLI business, $9.2 million from an impairment of certain assets in our WSI nuclear business, and $1.9 of other tax adjustments related to NLI. Without these one-time items, adjusted net income was $71.3 million, up 39.1% compared to prior year, and EPS would have been $2.71, up 38.3% compared to prior year.

Bookings for fiscal 2020 were $972.7 million, compared to $988.6 million for the prior year, a decrease of 1.6%. Backlog at the end of the 2020 fiscal year was $243.8 million, a decrease of 26.8% compared to backlog at the end of the prior year of $332.9 million. Incoming orders for the year were $972.7 million while revenues for the year totaled $1.06 billion, resulting in a book to bill ratio of 0.92. Approximately 33% of the $243.8 million in backlog is expected to be delivered outside of the U.S.

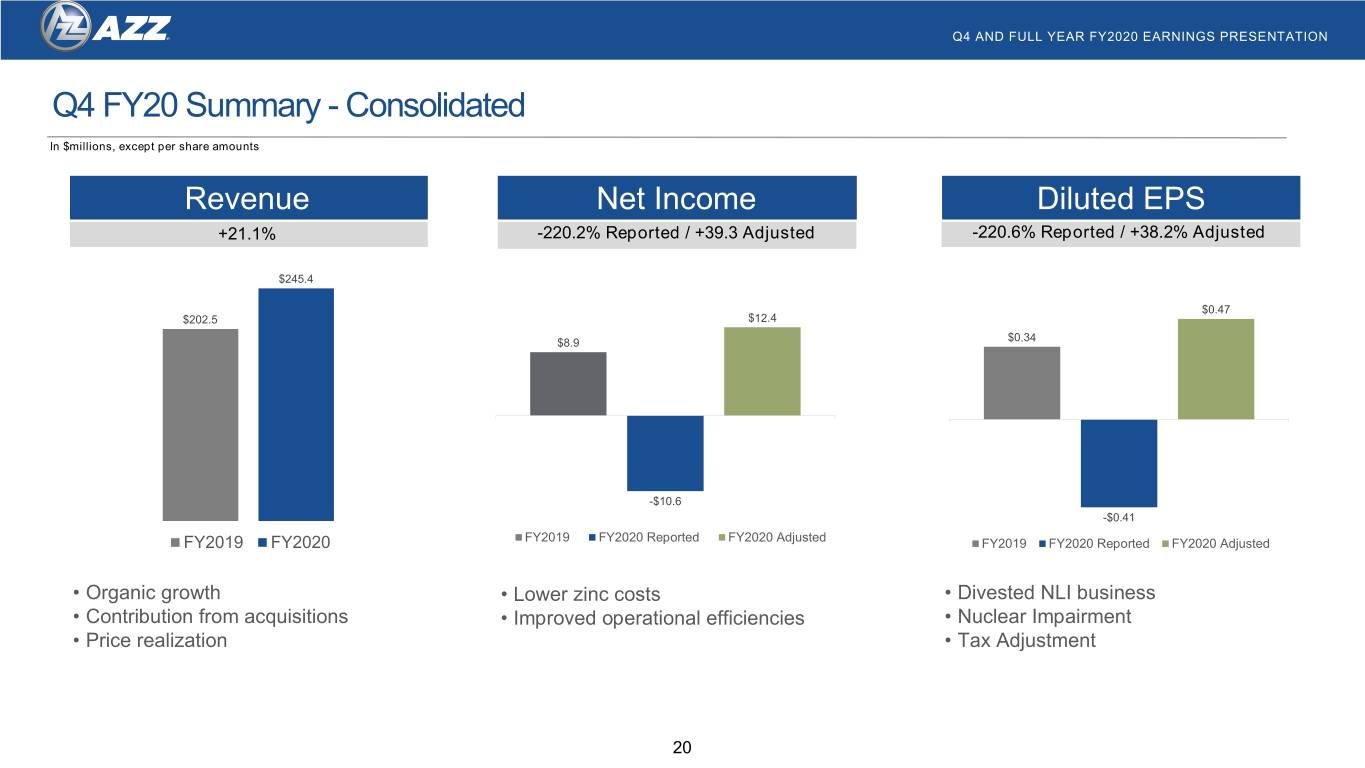
Revenues for the fourth quarter were $245.4 million compared to $202.5 million for the same quarter last year, an increase of 21.1%. Reported operating income for the fourth quarter decreased 154.3% to $(7.3) million compared to $13.4 million in last year’s fourth quarter. Operating income included pre-tax adjusted items of $18.6 million on the loss on the disposal of the NLI business, and $9.2 million from an impairment of certain assets in our WSI nuclear business. Without these items, adjusted operating income for the quarter


totaled $20.5 million or a 53.3% increase over the same quarter last year. Reported net income for the fourth quarter was $(10.6) million, or $(.41) per diluted share, compared to net income of $8.8 million, or $0.34 per diluted share, for last year’s fourth fiscal quarter. The fiscal 2020 fourth quarter net income included pre-tax adjusted items of $18.6 million on the loss on the disposal of the NLI business, $9.2 million from an impairment of certain assets in our WSI nuclear business, and $1.9 of other tax adjustments related to NLI. The adjusted non-GAAP net income without these items would have been $12.4 million or $0.47 per share, as disclosed in the accompanying tables to our press release of April 29, 2020.

Metal Coatings Segment
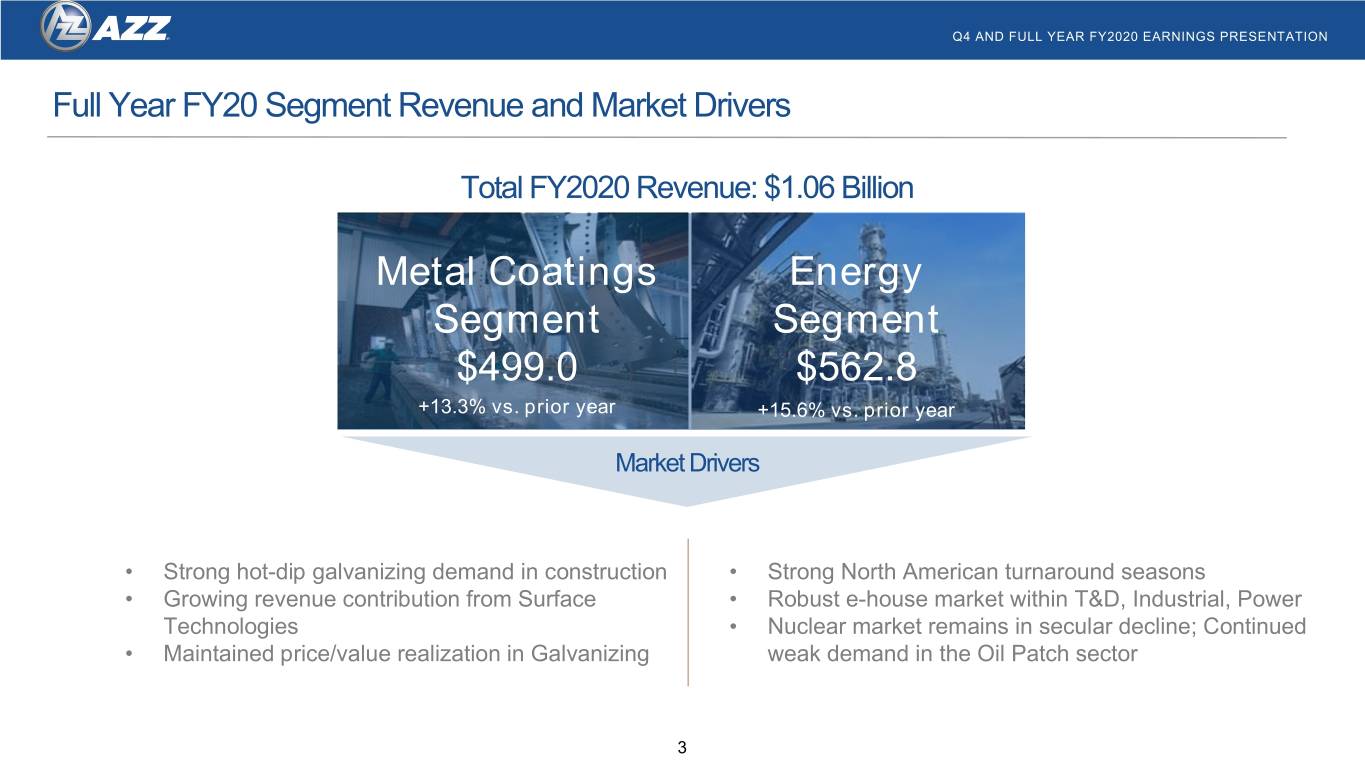
For full year fiscal 2020, Metal Coatings segment revenues increased 13.3% to $499 million and operating income increased 29.1% to $107.9 million compared to $440.3 million and $83.6 million respectively, for the prior fiscal year. The increased revenue was attributable to higher volumes of steel processed in our kettles, higher selling prices and contribution from our acquisitions. Operating margins for the 2020 fiscal year were 21.6% compared to 19.0% in the prior fiscal year. Operating margins were impacted by our ability to maintain price levels with lower zinc costs, while tightly managing productivity and operating efficiencies in the face of higher labor costs.

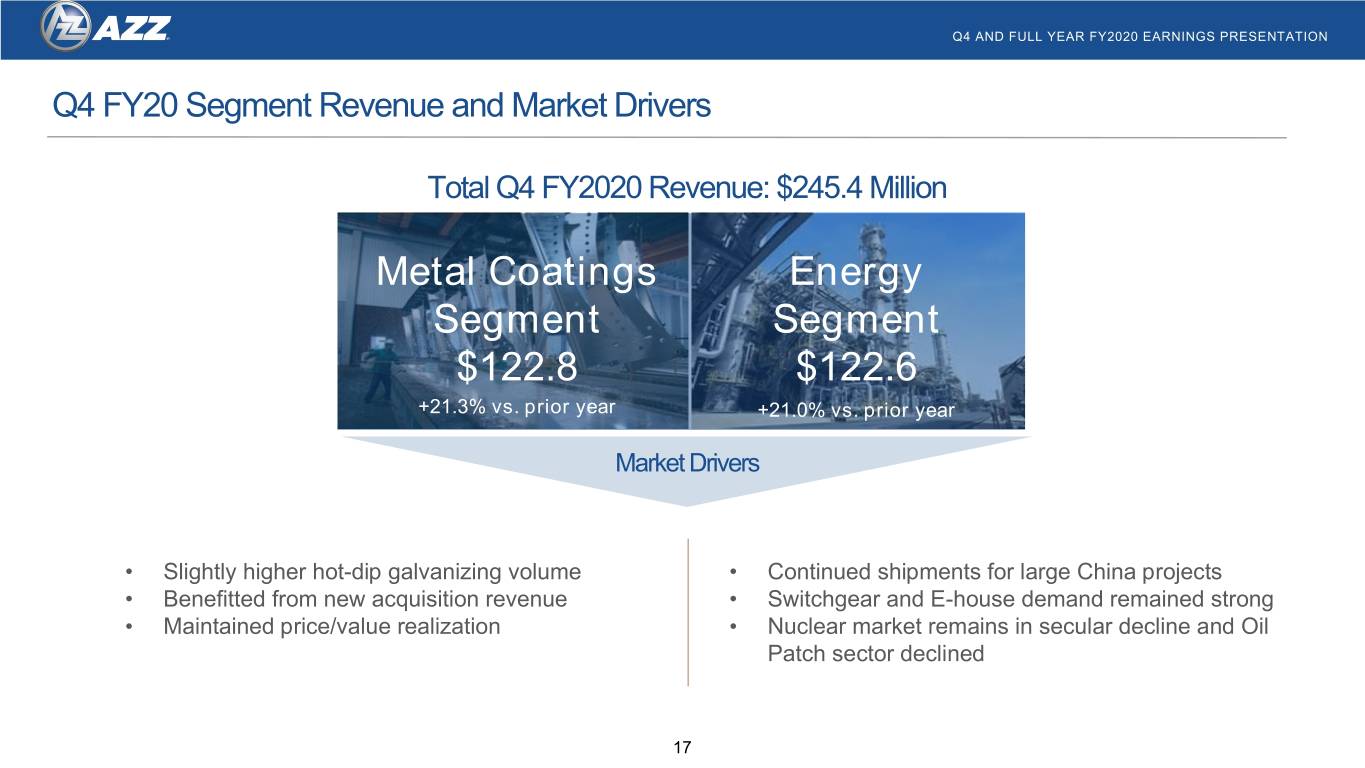
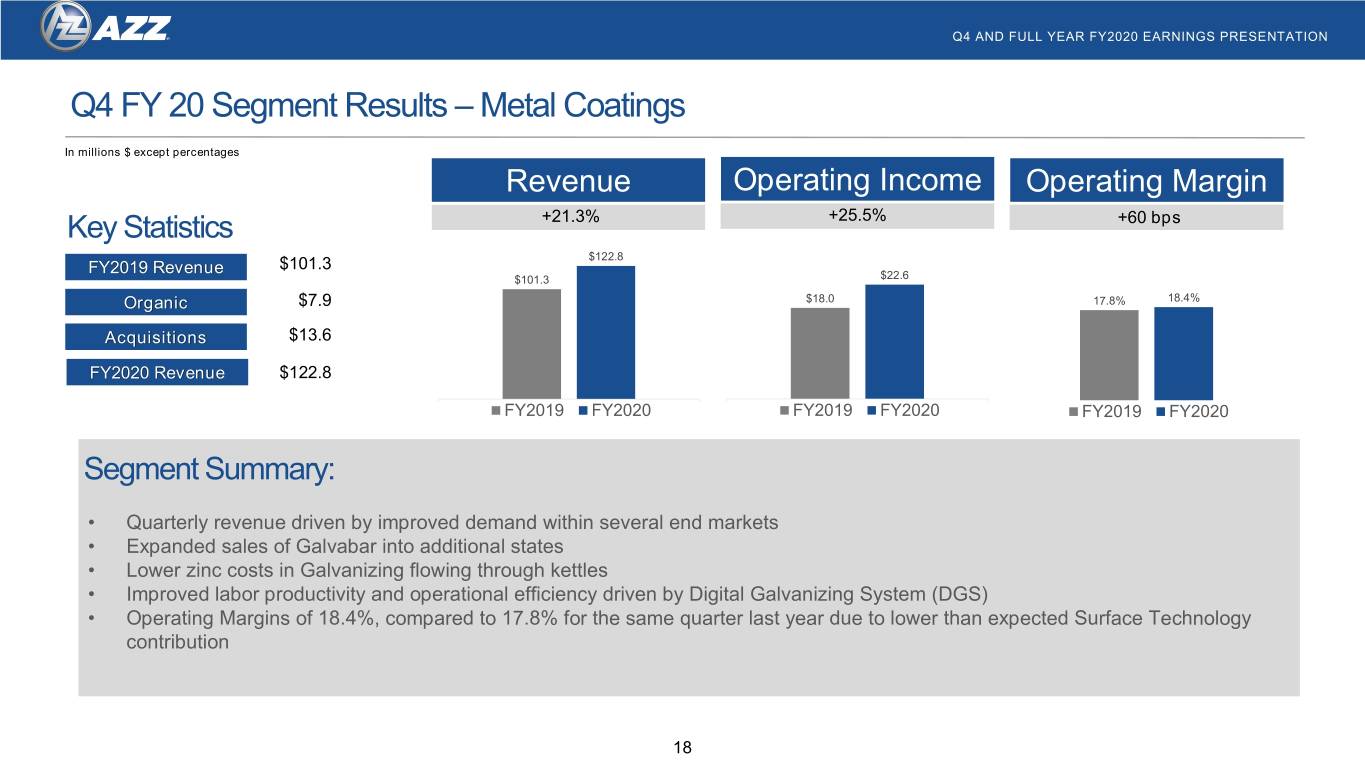
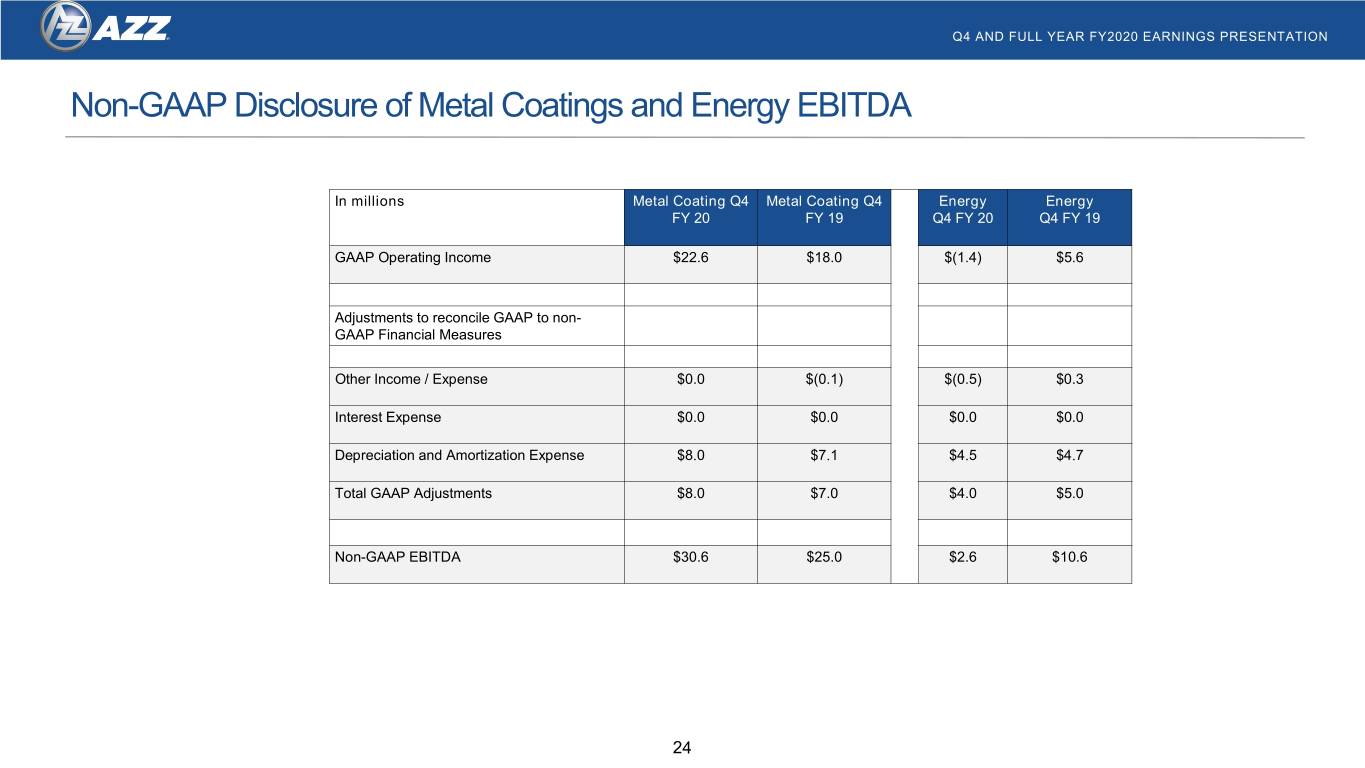
Revenues for the Company’s Metal Coatings segment for the fourth quarter of fiscal 2020 were $122.8 million, compared to the $101.3 million in the same period last year, an increase of 21.3%. Operating income was $22.6 million, an increase of 25.5% over the prior year fourth quarter. Operating margins for the fourth quarter grew by 60 basis points to 18.4%, compared to 17.8% in the same period last year. This was due to strong galvanizing margins, but somewhat offset by lower Surface Technologies margins.

Energy Segment
For full year fiscal 2020, Energy segment revenues increased 15.6% to $562.8 million and the operating income of $32.8 million was a 4.8% improvement over the prior year. The increase in net sales for fiscal 2020 was attributable to several factors including increased turnaround activity in the U.S. and international refinery market, completion of a large high voltage bus project in China and increases in our electrical switchgear and e-house business. Operating margins for the 2020 fiscal year were down 60 basis points to 5.8% as compared to 6.4% in the prior fiscal year. This decrease was primarily attributable to the $9.2 million impairment of certain assets in our WSI nuclear business, somewhat offset by improved refinery turnarounds described above, pricing increases, and improved project margins. Without this item, the segment operating income would have been $42.0 million, up 34.1% compared to prior year.


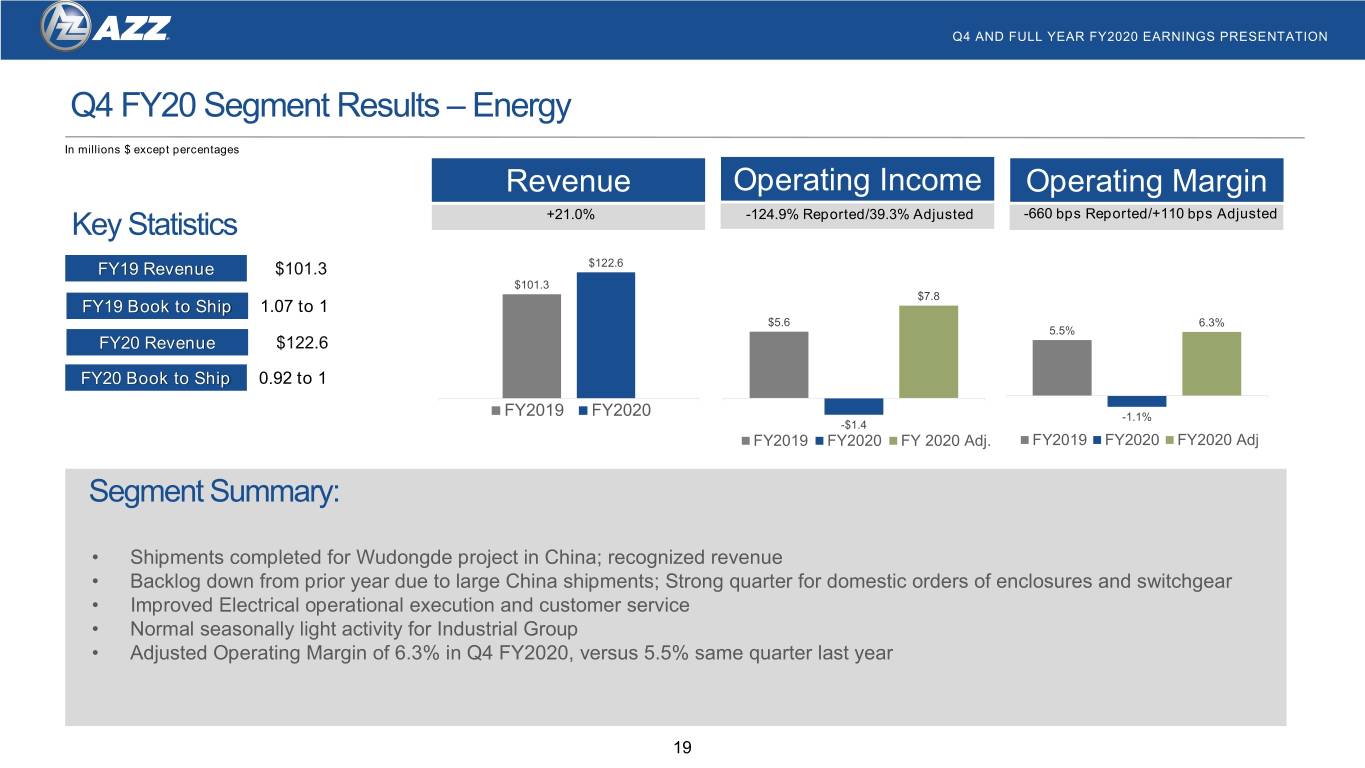
Revenues for the Energy segment for the fourth quarter of fiscal 2020 were $122.6 million as compared to $101.3 million for the same quarter last year, an increase of 21%. Operating income for the segment decreased to $(1.4) million compared to $5.6 million in the same period last year, a decrease of 124.9%. Operating margins for the fourth quarter declined 660 basis points to (1.1)% as compared to 5.5% in the prior year period, primarily attributable to the $9.2 million impairment of certain assets in our WSI nuclear business. Without this item, Energy segment operating income would have been $7.8 million, up 39.5% compared to prior year.

COVID-19 Business Continuity and Operations Update
Mr. Ferguson concluded “Employee health and safety remain our top priority, as well as continuing to support our customers during these difficult times.  AZZ will continue to follow the recommendations and guidelines provided by the CDC and World Health Organization. Pursuant to this commitment, we have taken proactive measures to protect our employees from COVID-19 while still meeting the needs of critical infrastructure throughout the United States and around the world. The Company has implemented a business continuity plan that encompasses all segments. All offices and plants have implemented physical distancing through increasing employee work station spacing, allowing flexible work arrangements, staggering shifts, cutting non-essential travel, cancelling certain events and significantly limiting outside visitors. We have increased cleaning, disinfecting, and employee access to sanitization tools.

Due to the worldwide COVID-19 pandemic, our Metal Coatings Segment has seen a modest drop in business in Q1 from some Galvanizing fabrication customers, and Surface Technologies has several large customers that have closed or reduced shifts into May. Within our Energy Platform, we are continuing to process backlog for switchgear, e-houses, and bus duct, while the hazardous duty lighting and tubular products are seeing less demand due to lower rig counts and less activity in the oil patch. Our industrial field services platform is seeing a shift in most of its work, originally scheduled for Q1 move to both Q2 and Q3 as refiners defer turnarounds amid travel restrictions.”


Today’s Conference Call Details

Interested parties can access the conference call by dialing (844) 855-9499 or (412) 317-5497 (international). A webcast of the call will be available on the Company’s Investor Relations page at http://www.azz.com/investor-relations.

A replay of the call will be available for three days at (877) 344-7529 or (412) 317-0088 (international), confirmation # 10142840, or for 30 days at http://www.azz.com/investor-relations.

There will be a slide presentation accompanying today’s event. The Company’s slide presentation for the call will be available on the Investor Relations page at http://www.azz.com/investor-relations.

About AZZ Inc.
AZZ Inc. is a global provider of metal coating solutions, welding solutions, specialty electrical equipment and highly engineered services to the markets of power generation, transmission, distribution and industrial in protecting metal and electrical systems used to build and enhance the world’s infrastructure. AZZ Metal Coatings is a leading provider of metal finishing solutions for corrosion protection, including hot dip galvanizing to the North American steel fabrication industry. AZZ Energy is dedicated to delivering safe and reliable transmission of power from generation sources to end customers, and automated weld overlay solutions for corrosion and erosion mitigation to critical infrastructure in the energy markets worldwide.

Safe Harbor Statement

Certain statements herein about our expectations of future events or results constitute forward-looking statements for purposes of the safe harbor provisions of The Private Securities Litigation Reform Act of 1995. You can identify forward-looking statements by terminology such as “may,” “should,” “expects,” “plans,” “anticipates,” “believes,” “estimates,” “predicts,” “potential,” “continue,” or the negative of these terms or other comparable terminology. Such forward-looking statements are based on currently available competitive, financial and economic data and management’s views and assumptions regarding future events. Such forward-looking statements are inherently uncertain, and investors must recognize that actual results may differ from those expressed or implied in the forward-looking statements. Certain factors could affect the outcome of the matters described herein. This press release may contain forward-looking statements that involve risks and uncertainties including, but not limited to, changes in customer demand for our products and services, including demand by the power generation markets, electrical transmission and distribution markets, the industrial markets, and the metal coatings markets. In addition, within each of the markets we serve, our customers and our operations could potentially be adversely impacted by the ongoing COVID-19 pandemic. We could also experience fluctuations in prices and raw material cost, including zinc and natural gas which are used in the hot dip galvanizing process; supply-chain vendor delays ; customer requested delays of our products or services; delays in additional acquisition opportunities; currency exchange rates; adequacy of financing; availability of experienced management and employees to implement AZZ’s growth strategy; a downturn in market conditions in any industry relating to the products we inventory or sell or the services that we provide; economic volatility or changes in the political stability in the United States and other foreign markets in which we operate; acts of war or terrorism inside the United States or abroad; and other changes in economic and financial conditions. AZZ has provided additional information regarding risks associated with the business in AZZ’s Annual Report on Form 10-K for the fiscal year ended February 29, 2020 and other filings with the Securities and Exchange Commission (“SEC”), available for viewing on AZZ’s website at www.azz.com and on the SEC’s website at www.sec.gov. You are urged to consider these factors carefully in evaluating the forward-looking statements herein and are cautioned not to place undue reliance on such forward-looking statements, which are qualified in their entirety by this cautionary statement. These statements are based on information as of the date hereof and AZZ assumes no obligation to update any forward-looking statements, whether as a result of new information, future events, or otherwise.


Contact:
Paul Fehlman, Senior Vice President - Finance and CFO
 
AZZ Inc. 817-810-0095
 
Internet: www.azz.com


Lytham Partners 602-889-9700
 
Joe Dorame, Robert Blum or Joe Diaz
 
Internet: www.lythampartners.com


---Financial tables on the following page---


AZZ Inc.
Condensed Consolidated Statements of Income
(in thousands, except per share data)
(unaudited)

 
Three Months Ended February 29/28,
 
Twelve Months Ended February 29/28,
 
2020
 
2019
 
2020
 
2019


Net sales
$
245,365

 
$
202,548

 
$
1,061,817

 
$
927,087

Costs of sales
194,261

 
159,291

 
824,589

 
728,466

     Gross margin
51,104

 
43,257

 
237,228

 
198,621


Selling, general and administrative
39,738

 
29,871

 
139,253

 
121,665

Loss on disposal of business
18,632


18,632


     Operating income (loss)
(7,266
)
 
13,386

 
79,343

 
76,956


Interest expense
3,030

 
3,430

 
13,463

 
14,971

Other (income) expense, net
623

 
(181
)
 
990

 
(1,020
)
     Income (loss) before income taxes
(10,919
)
 
10,137

 
64,890

 
63,005

Income tax expense (benefit)
(276
)
 
1,286

 
16,656

 
11,797

Net income (loss)
$
(10,643
)
 
$
8,851

 
$
48,234

 
$
51,208

Earnings (loss) per common share


      Basic
$
(0.41
)
 
$
0.34

 
$
1.84

 
$
1.97

      Diluted
$
(0.41
)
 
$
0.34

 
$
1.84

 
$
1.96


Diluted average shares outstanding
26,209

 
26,153

 
26,281

 
26,107


AZZ Inc.
Segment Reporting
(in thousands)
(unaudited)

 
Three Months Ended February 29/28,
 
Twelve Months Ended February 29/28,
 
2020
 
2019
 
2020
 
2019
Net sales:


Metal Coatings
$
122,796

 
$
101,251

 
$
498,989

 
$
440,264

Energy
122,569

 
101,297

 
562,828

 
486,823

 
$
245,365

 
$
202,548

 
$
1,061,817

 
$
927,087


Segment operating income (loss):


Metal Coatings
$
22,603

 
$
18,010

 
$
107,926

 
$
83,591

Energy
(1,386
)
 
5,569

 
32,845

 
31,332

Corporate
(9,851
)
 
(10,193
)
 
(42,796
)
 
(37,967
)
Loss on disposal of business
(18,632
)


(18,632
)


$
(7,266
)
 
$
13,386

 
$
79,343

 
$
76,956


AZZ Inc.
Condensed Consolidated Balance Sheets
(in thousands)
(unaudited)

 
February 29, 2020
 
February 28, 2019


Assets:


      Current assets
$
354,562

 
$
378,545

      Net property, plant and equipment
213,104

 
210,227

      Other assets, net
506,165

 
499,798

      Total assets
$
1,073,831

 
$
1,088,570


Liabilities and shareholders’ equity:


      Current liabilities
$
280,613

 
$
164,771

      Long term debt due after one year, net
77,878

 
240,745

      Other liabilities
80,974

 
79,326

      Shareholders’ equity
634,366

 
603,728

Total liabilities and shareholders’ equity
$
1,073,831

 
$
1,088,570


AZZ Inc.
Condensed Consolidated Statements of Cash Flows
(in thousands)
(unaudited)

 
Twelve Months Ended February 29/28,
 
2020
 
2019


Net cash provided by operating activities
$
144,759

 
$
111,476

Net cash used in investing activities
(71,748
)
 
(32,073
)
Net cash used in financing activities
(59,739
)
 
(74,812
)
Effect of exchange rate changes on cash
(590
)
 
(1,439
)
Net increase in cash and cash equivalents
$
12,682

 
$
3,152

Cash and cash equivalents at beginning of period
24,005

 
20,853

Cash and cash equivalents at end of period
$
36,687

 
$
24,005


AZZ incorporated
Non-GAAP Disclosure
Adjusted Operating Income, Adjusted Earnings and Adjusted Earnings Per Share

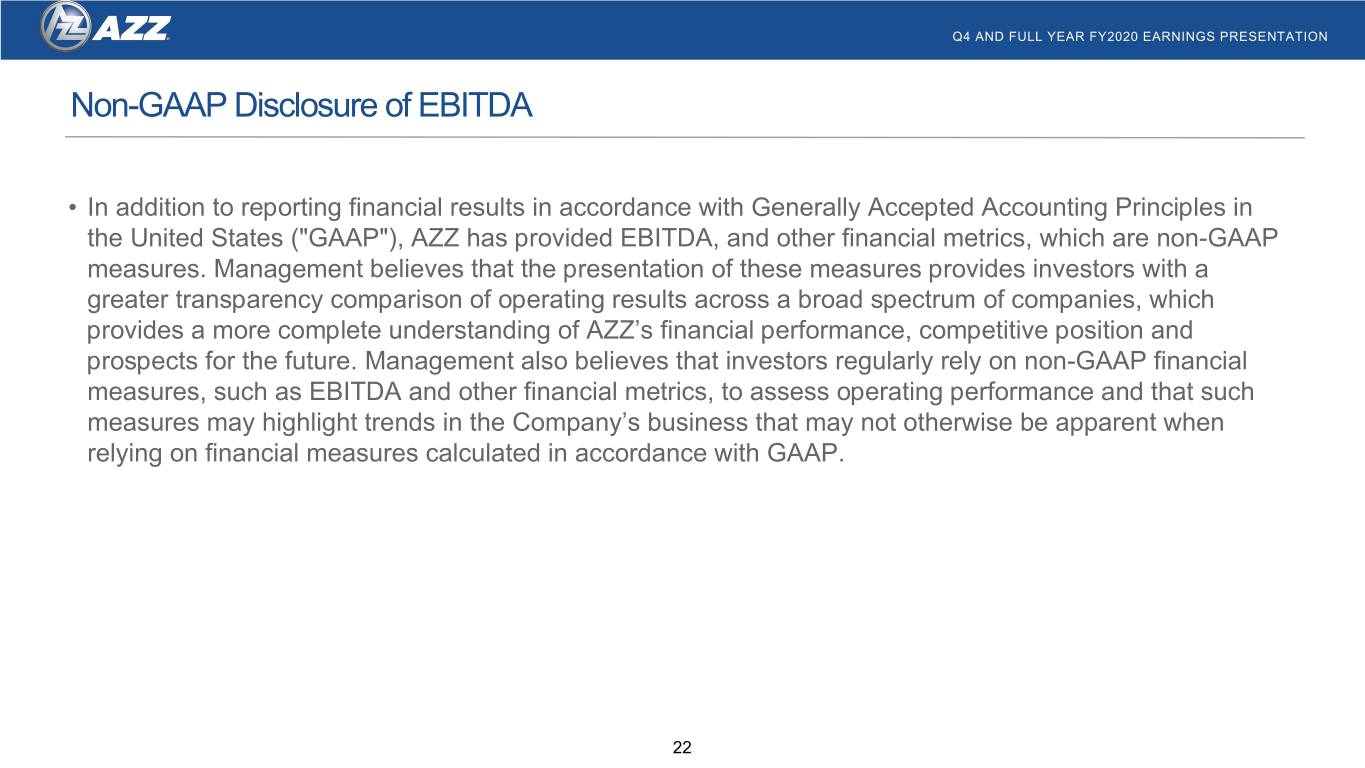
In addition to reporting financial results in accordance with Generally Accepted Accounting Principles in the United States ("GAAP"), AZZ has provided adjusted operating income, earnings and adjusted earnings per share, which are non-GAAP measures. Management believes that the presentation of these measures provides investors with a greater transparency comparison of operating results across a broad spectrum of companies, which provides a more complete understanding of AZZ’s financial performance, competitive position and prospects for the future. Management also believes that investors regularly rely on non-GAAP financial measures, such as adjusted operating income, adjusted earnings and adjusted earnings per share, to assess operating performance and that such measures may highlight trends in the Company’s business that may not otherwise be apparent when relying on financial measures calculated in accordance with GAAP.
The following tables provide a reconciliation for the year ended February 29, 2020 between the various measures calculated in accordance with GAAP to those calculated on a non-GAAP basis, which are shown net of tax (in thousands, except per share data):
 
Three Months Ended
 
Twelve Months Ended
 
February 29, 2020
 
February 29, 2020


GAAP operating income (loss)
$
(7,266
)
 
$
79,343

Loss on disposal of business
18,632

 
18,632

Impairment charges
9,157

 
9,157

Non-GAAP operating income
$
20,523

 
$
107,132

 
Three Months Ended
 
Twelve Months Ended
 
February 29, 2020
 
February 29, 2020
 
Amount
 
Per Diluted Share
 
Amount
 
Per Diluted Share


GAAP net income (loss) and GAAP diluted earnings (loss) per share
$
(10,643
)
 
$
(0.41
)
 
$
48,234

 
$
1.84


Adjustments to reconcile GAAP to non-GAAP financial measures


Loss on disposal of business
18,632

 
0.71

 
18,632

 
0.71

Impairment charges
9,157

 
0.35

 
9,157

 
0.34

Tax benefit related to loss on disposal and impairment
(6,697
)
 
(0.25
)
 
(6,697
)
 
(0.25
)
Tax adjustment
1,920

 
0.07

 
1,920

 
0.07


Total non-GAAP adjustments
23,012

 
0.88

 
23,012

 
0.87


Non-GAAP net income and diluted earnings per share
$
12,369

 
$
0.47

 
$
71,246

 
$
2.71


--END--


AZZ Inc. Fourth Quarter and Fiscal Year 2020 Earnings Presentation April 29, 2020

 
Q4 AND FULL YEAR FY2020 EARNINGS PRESENTATION Safe Harbor Statement Certain statements herein about our expectations of future events or results constitute forward-looking statements for purposes of the safe harbor provisions of The Private Securities Litigation Reform Act of 1995. You can identify forward-looking statements by terminology such as “may,” “should,” “expects,” “plans,” “anticipates,” “believes,” “estimates,” “predicts,” “potential,” “continue,” or the negative of these terms or other comparable terminology. Such forward-looking statements are based on currently available competitive, financial and economic data and management’s views and assumptions regarding future events. Such forward-looking statements are inherently uncertain, and investors must recognize that actual results may differ from those expressed or implied in the forward-looking statements. Certain factors could affect the outcome of the matters described herein. This press release may contain forward-looking statements that involve risks and uncertainties including, but not limited to, changes in customer demand for our products and services, including demand by the power generation markets, electrical transmission and distribution markets, the industrial markets, and the metal coatings markets. In addition, within each of the markets we serve, our customers and our operations could potentially be adversely impacted by the ongoing COVID-19 pandemic. We could also experience fluctuations in prices and raw material cost, including zinc and natural gas which are used in the hot dip galvanizing process; supply-chain vendor delays ; customer requested delays of our products or services; delays in additional acquisition opportunities; currency exchange rates; adequacy of financing; availability of experienced management and employees to implement AZZ’s growth strategy; a downturn in market conditions in any industry relating to the products we inventory or sell or the services that we provide; economic volatility or changes in the political stability in the United States and other foreign markets in which we operate; acts of war or terrorism inside the United States or abroad; and other changes in economic and financial conditions. AZZ has provided additional information regarding risks associated with the business in AZZ’s Annual Report on Form 10-K for the fiscal year ended February 29, 2020 and other filings with the Securities and Exchange Commission (“SEC”), available for viewing on AZZ’s website at www.azz.com and on the SEC’s website at www.sec.gov. You are urged to consider these factors carefully in evaluating the forward-looking statements herein and are cautioned not to place undue reliance on such forward-looking statements, which are qualified in their entirety by this cautionary statement. These statements are based on information as of the date hereof and AZZ assumes no obligation to update any forward-looking statements, whether as a result of new information, future events, or otherwise. 2

 
Q4 AND FULL YEAR FY2020 EARNINGS PRESENTATION Full Year FY20 Segment Revenue and Market Drivers Total FY2020 Revenue: $1.06 Billion Metal Coatings Energy Segment Segment $499.0 $562.8 +13.3% vs. prior year +15.6% vs. prior year Market Drivers • Strong hot-dip galvanizing demand in construction • Strong North American turnaround seasons • Growing revenue contribution from Surface • Robust e-house market within T&D, Industrial, Power Technologies • Nuclear market remains in secular decline; Continued • Maintained price/value realization in Galvanizing weak demand in the Oil Patch sector 3

 
Q4 AND FULL YEAR FY2020 EARNINGS PRESENTATION Full Year FY20 Summary - Consolidated In $millions, except per share amounts Revenue Net Income Diluted EPS +14.5% -5.8% Reported / +39.1% Adjusted -6.1% Reported / +38.3% Adjusted $71.3 $1,061.8 $2.71 $927.1 $51.2 $1.96 $48.2 $1.84 FY2019 FY2020 FY2019 FY2020 FY2020 Adj. 2019 2020 FY2020 Adj. • Organic growth • Lower zinc costs • Improved margins • Contribution from acquisitions • Improved operational efficiencies • Strong cash generation • Price realization • Divested NLI business 4
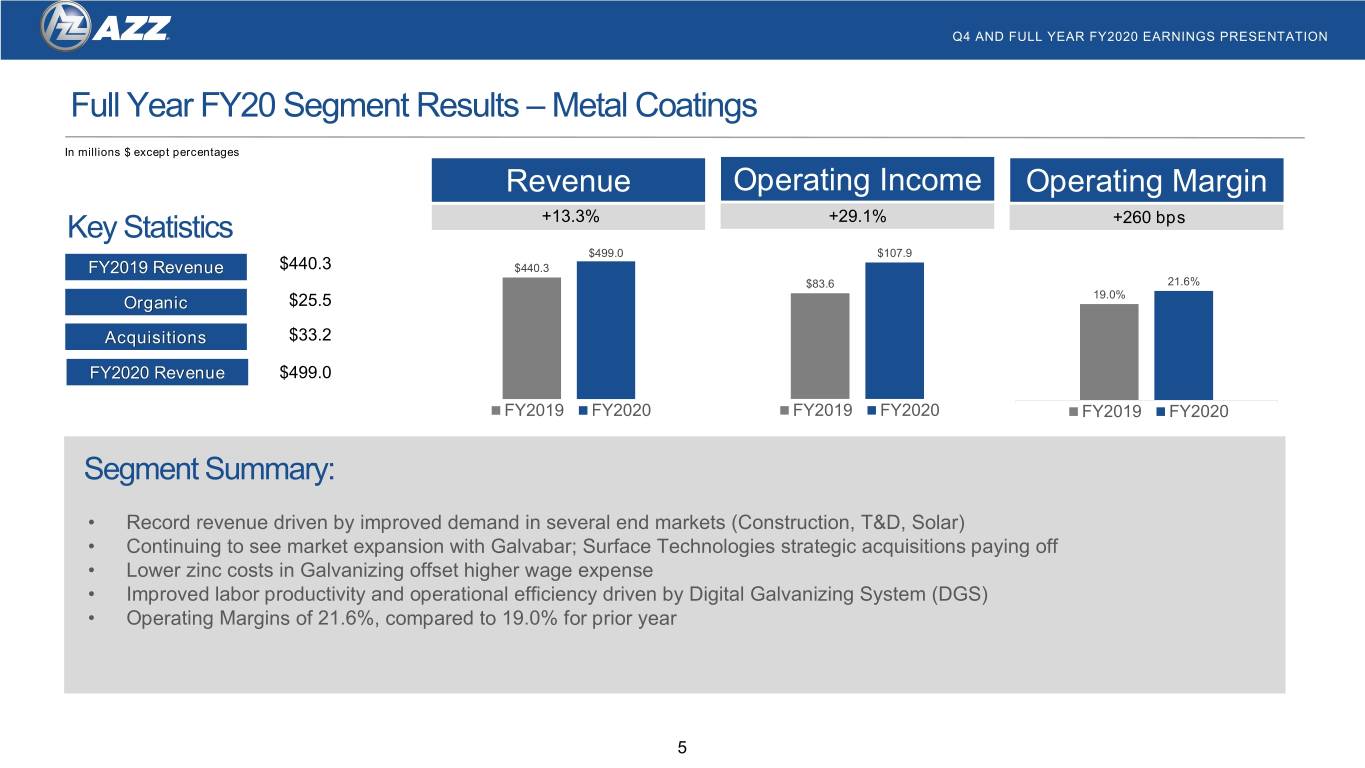

 
Q4 AND FULL YEAR FY2020 EARNINGS PRESENTATION Full Year FY20 Segment Results – Metal Coatings In millions $ except percentages Revenue Operating Income Operating Margin Key Statistics +13.3% +29.1% +260 bps $499.0 $107.9 FY2019 Revenue $440.3 $440.3 $83.6 21.6% Organic $25.5 19.0% Acquisitions $33.2 FY2020 Revenue $499.0 FY2019 FY2020 FY2019 FY2020 FY2019 FY2020 Segment Summary: • Record revenue driven by improved demand in several end markets (Construction, T&D, Solar) • Continuing to see market expansion with Galvabar; Surface Technologies strategic acquisitions paying off • Lower zinc costs in Galvanizing offset higher wage expense • Improved labor productivity and operational efficiency driven by Digital Galvanizing System (DGS) • Operating Margins of 21.6%, compared to 19.0% for prior year 5
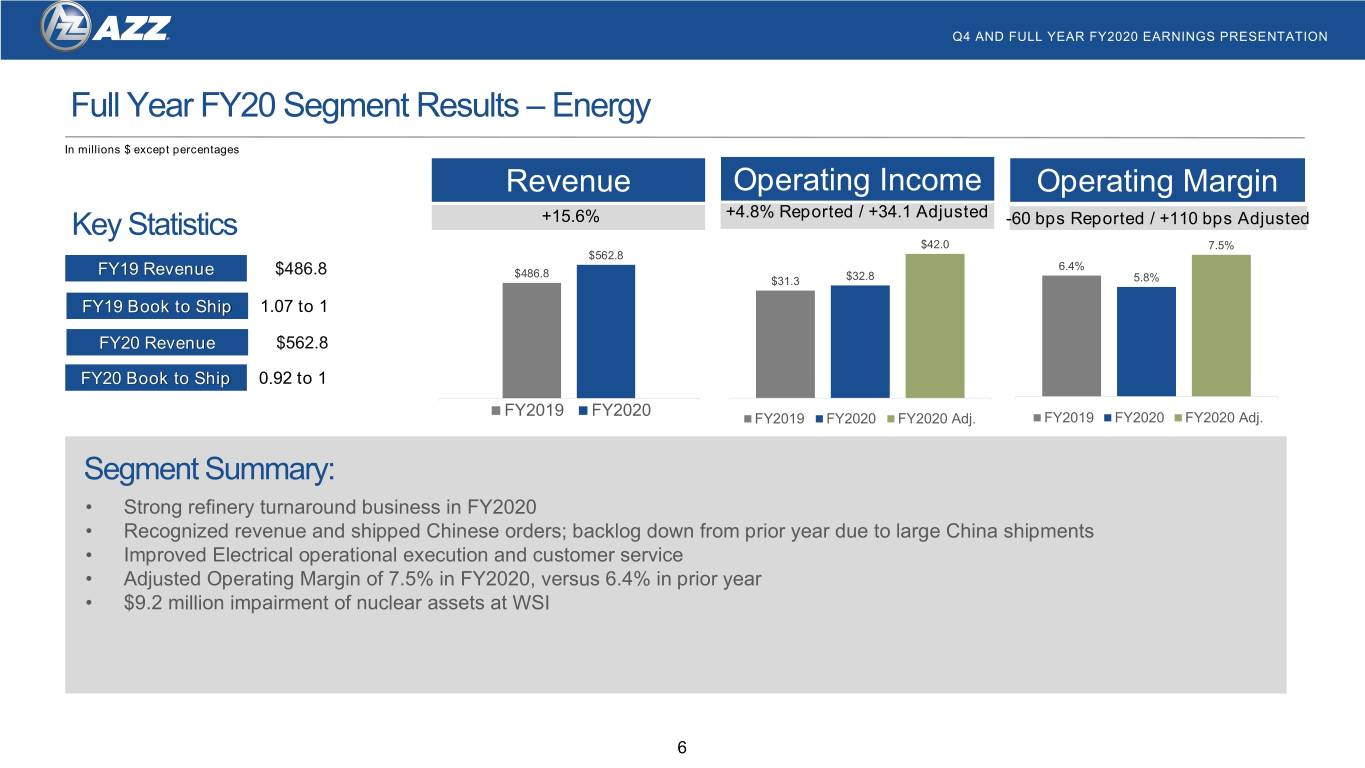

 
Q4 AND FULL YEAR FY2020 EARNINGS PRESENTATION Full Year FY20 Segment Results – Energy In millions $ except percentages Revenue Operating Income Operating Margin Key Statistics +15.6% +4.8% Reported / +34.1 Adjusted -60 bps Reported / +110 bps Adjusted $42.0 7.5% $562.8 6.4% FY19 Revenue $486.8 $486.8 $31.3 $32.8 5.8% FY19 Book to Ship 1.07 to 1 FY20 Revenue $562.8 FY20 Book to Ship 0.92 to 1 FY2019 FY2020 FY2019 FY2020 FY2020 Adj. FY2019 FY2020 FY2020 Adj. Segment Summary: • Strong refinery turnaround business in FY2020 • Recognized revenue and shipped Chinese orders; backlog down from prior year due to large China shipments • Improved Electrical operational execution and customer service • Adjusted Operating Margin of 7.5% in FY2020, versus 6.4% in prior year • $9.2 million impairment of nuclear assets at WSI 6
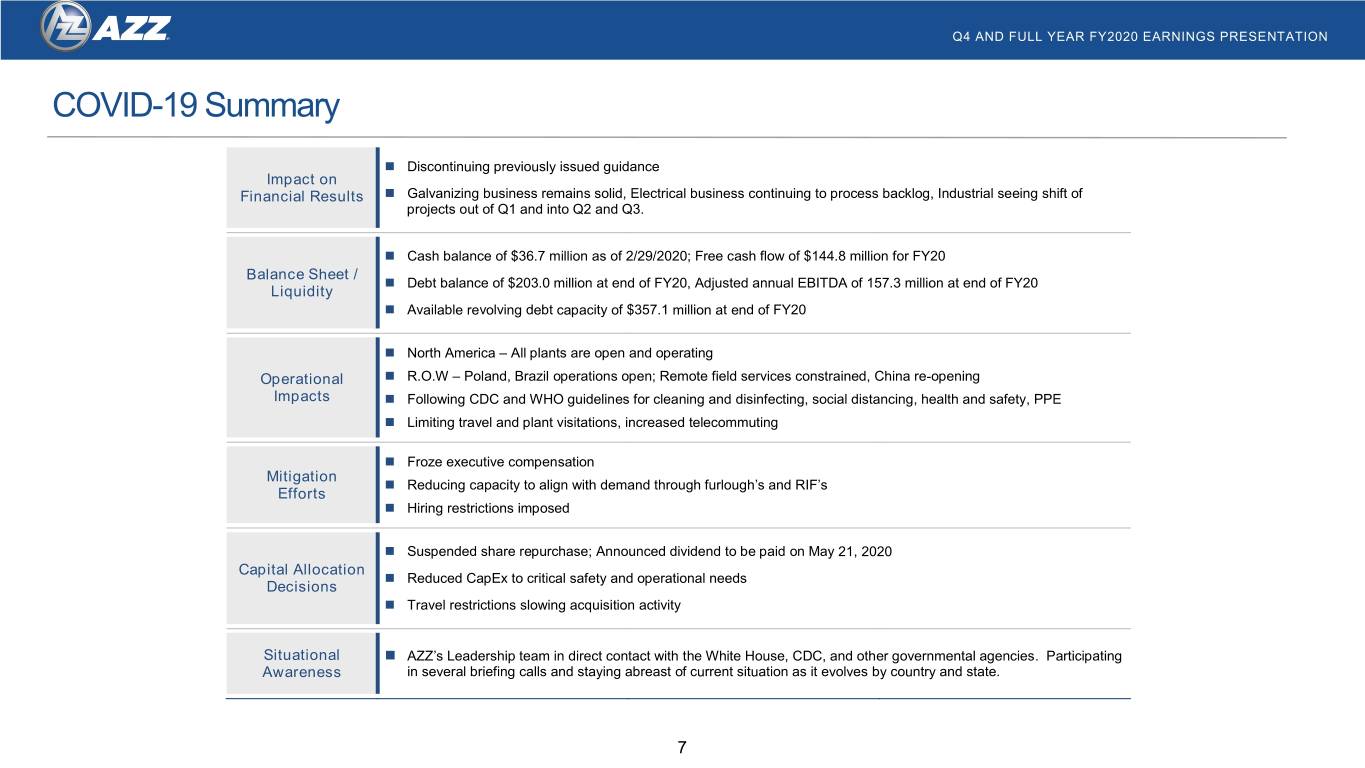

 
Q4 AND FULL YEAR FY2020 EARNINGS PRESENTATION COVID-19 Summary  Discontinuing previously issued guidance Impact on Financial Results  Galvanizing business remains solid, Electrical business continuing to process backlog, Industrial seeing shift of projects out of Q1 and into Q2 and Q3.  Cash balance of $36.7 million as of 2/29 /2020; Free cash flow of $144.8 million for FY20 Balance Sheet /  Debt balance of $203.0 million at end of FY20, Adjusted annual EBITDA of 157.3 million at end of FY20 Liquidity  Available revolving debt capacity of $357.1 million at end of FY20  North America – All plants are open and operating Operational  R.O.W – Poland, Brazil operations open; Remote field services constrained, China re-opening Impacts  Following CDC and WHO guidelines for cleaning and disinfecting, social distancing, health and safety, PPE  Limiting travel and plant visitations, increased telecommuting  Froze executive compensation Mitigation  Reducing capacity to align with demand through furlough’s and RIF’s Efforts  Hiring restrictions imposed  Suspended share repurchase; Announced dividend to be paid on May 21, 2020 Capital Allocation  Reduced CapEx to critical safety and operational needs Decisions  Travel restrictions slowing acquisition activity Situational  AZZ’s Leadership team in direct contact with the White House, CDC, and other governmental agencies. Participating Awareness in several briefing calls and staying abreast of current situation as it evolves by country and state. 7
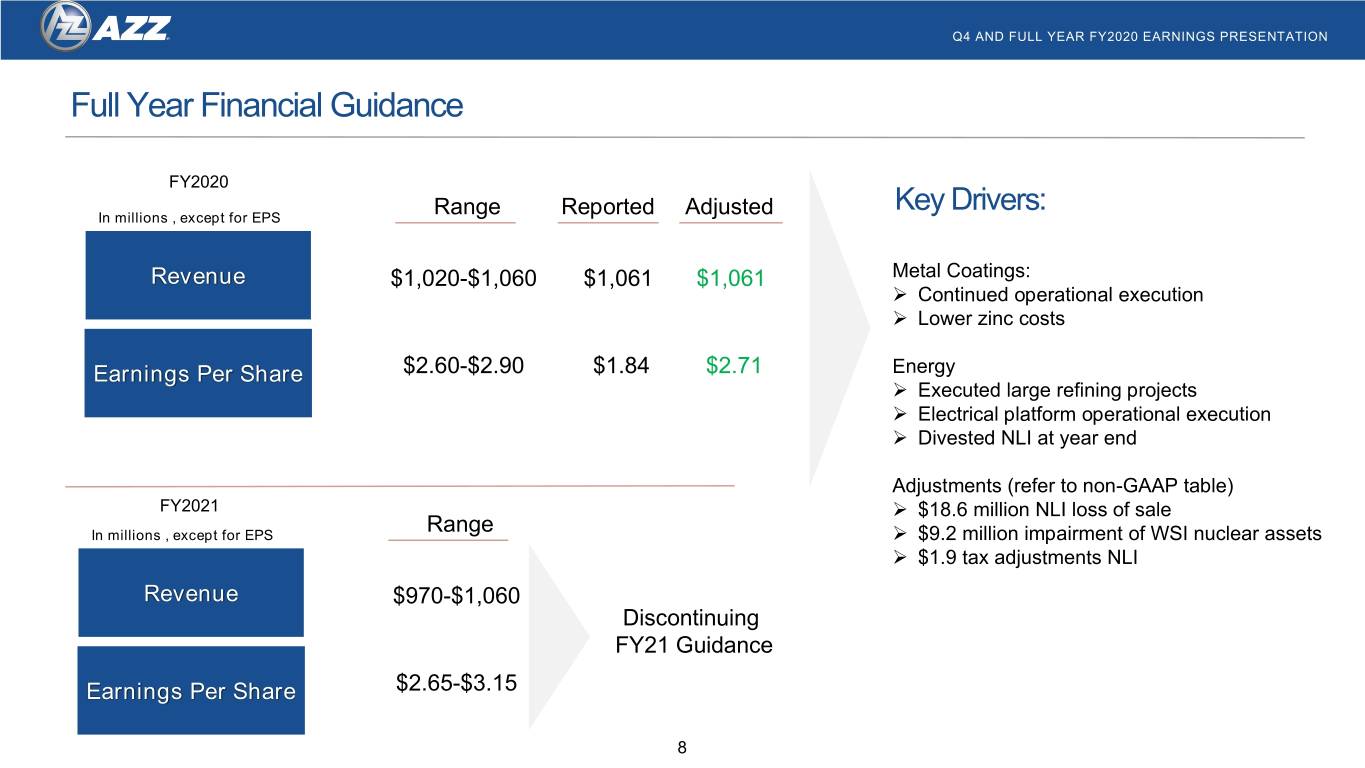

 
Q4 AND FULL YEAR FY2020 EARNINGS PRESENTATION Full Year Financial Guidance FY2020 Key Drivers: In millions , except for EPS Range Reported Adjusted Revenue $1,020-$1,060 $1,061 $1,061 Metal Coatings:  Continued operational execution  Lower zinc costs Earnings Per Share $2.60-$2.90 $1.84 $2.71 Energy  Executed large refining projects  Electrical platform operational execution  Divested NLI at year end Adjustments (refer to non-GAAP table) FY2021  $18.6 million NLI loss of sale Range In millions , except for EPS  $9.2 million impairment of WSI nuclear assets  $1.9 tax adjustments NLI Revenue $970-$1,060 Discontinuing FY21 Guidance Earnings Per Share $2.65-$3.15 8
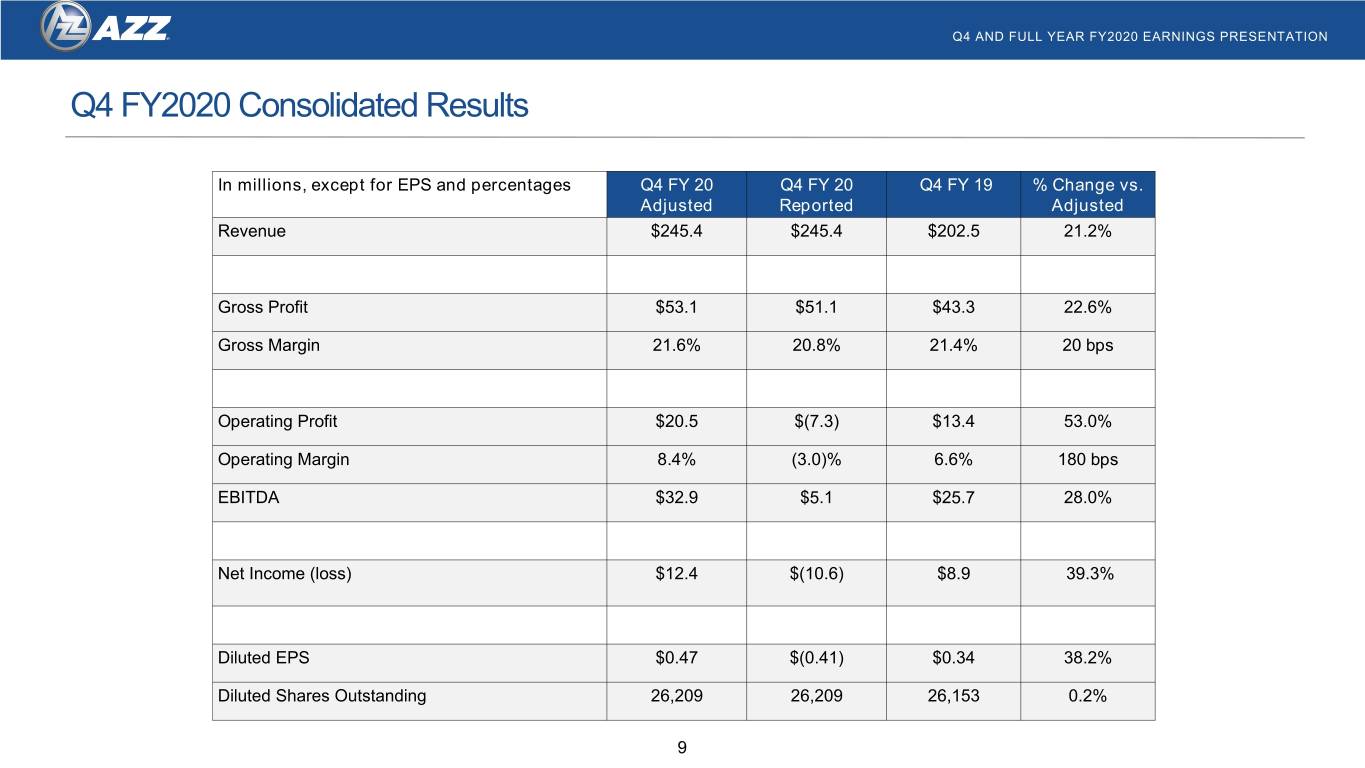

 
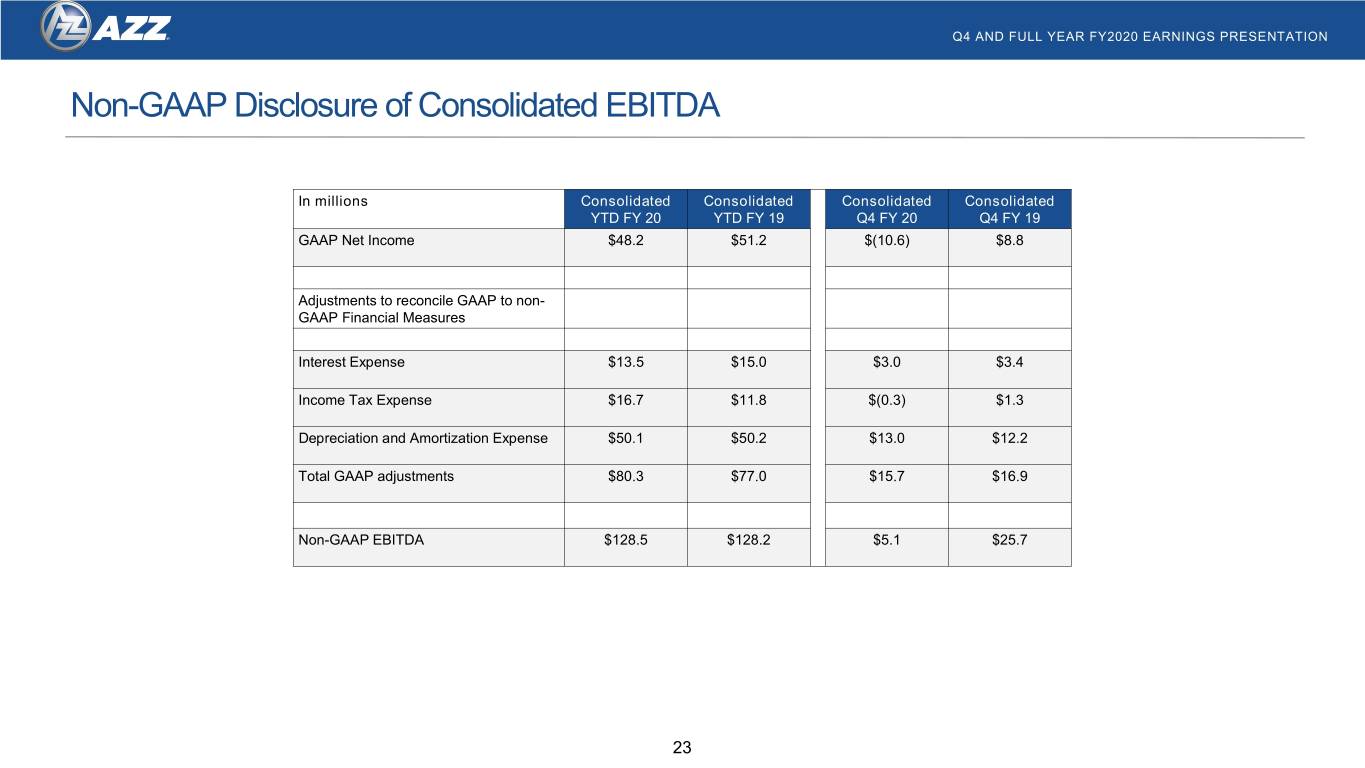
Q4 AND FULL YEAR FY2020 EARNINGS PRESENTATION Q4 FY2020 Consolidated Results In millions, except for EPS and percentages Q4 FY 20 Q4 FY 20 Q4 FY 19 % Change vs. Adjusted Reported Adjusted Revenue $245.4 $245.4 $202.5 21.2% Gross Profit $53.1 $51.1 $43.3 22.6% Gross Margin 21.6% 20.8% 21.4% 20 bps Operating Profit $20.5 $(7.3) $13.4 53.0% Operating Margin 8.4% (3.0)% 6.6% 180 bps EBITDA $32.9 $5.1 $25.7 28.0% Net Income (loss) $12.4 $(10.6) $8.9 39.3% Diluted EPS $0.47 $(0.41) $0.34 38.2% Diluted Shares Outstanding 26,209 26,209 26,153 0.2% 9
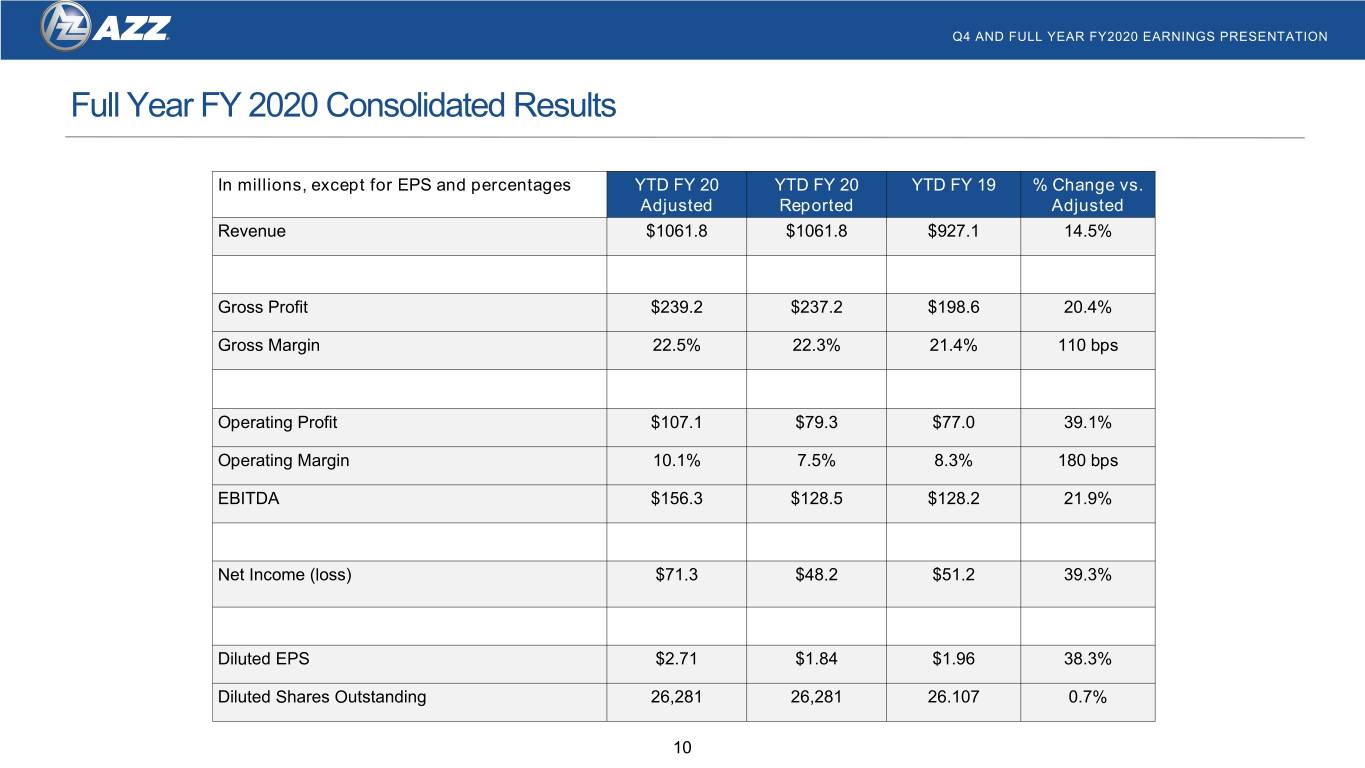

 
Q4 AND FULL YEAR FY2020 EARNINGS PRESENTATION Full Year FY 2020 Consolidated Results In millions, except for EPS and percentages YTD FY 20 YTD FY 20 YTD FY 19 % Change vs. Adjusted Reported Adjusted Revenue $1061.8 $1061.8 $927.1 14.5% Gross Profit $239.2 $237.2 $198.6 20.4% Gross Margin 22.5% 22.3% 21.4% 110 bps Operating Profit $107.1 $79.3 $77.0 39.1% Operating Margin 10.1% 7.5% 8.3% 180 bps EBITDA $156.3 $128.5 $128.2 21.9% Net Income (loss) $71.3 $48.2 $51.2 39.3% Diluted EPS $2.71 $1.84 $1.96 38.3% Diluted Shares Outstanding 26,281 26,281 26.107 0.7% 10
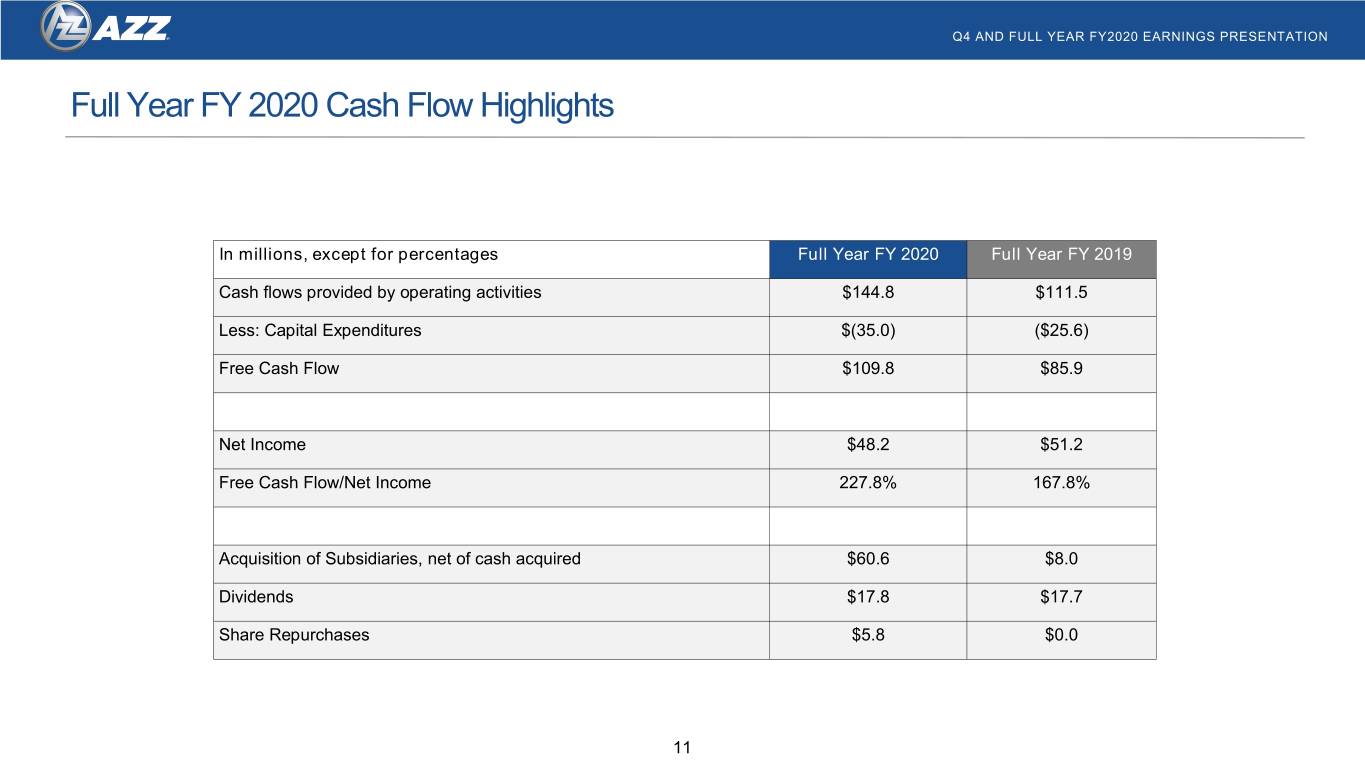

 
Q4 AND FULL YEAR FY2020 EARNINGS PRESENTATION Full Year FY 2020 Cash Flow Highlights In millions, except for percentages Full Year FY 2020 Full Year FY 2019 Cash flows provided by operating activities $144.8 $111.5 Less: Capital Expenditures $(35.0) ($25.6) Free Cash Flow $109.8 $85.9 Net Income $48.2 $51.2 Free Cash Flow/Net Income 227.8% 167.8% Acquisition of Subsidiaries, net of cash acquired $60.6 $8.0 Dividends $17.8 $17.7 Share Repurchases $5.8 $0.0 11
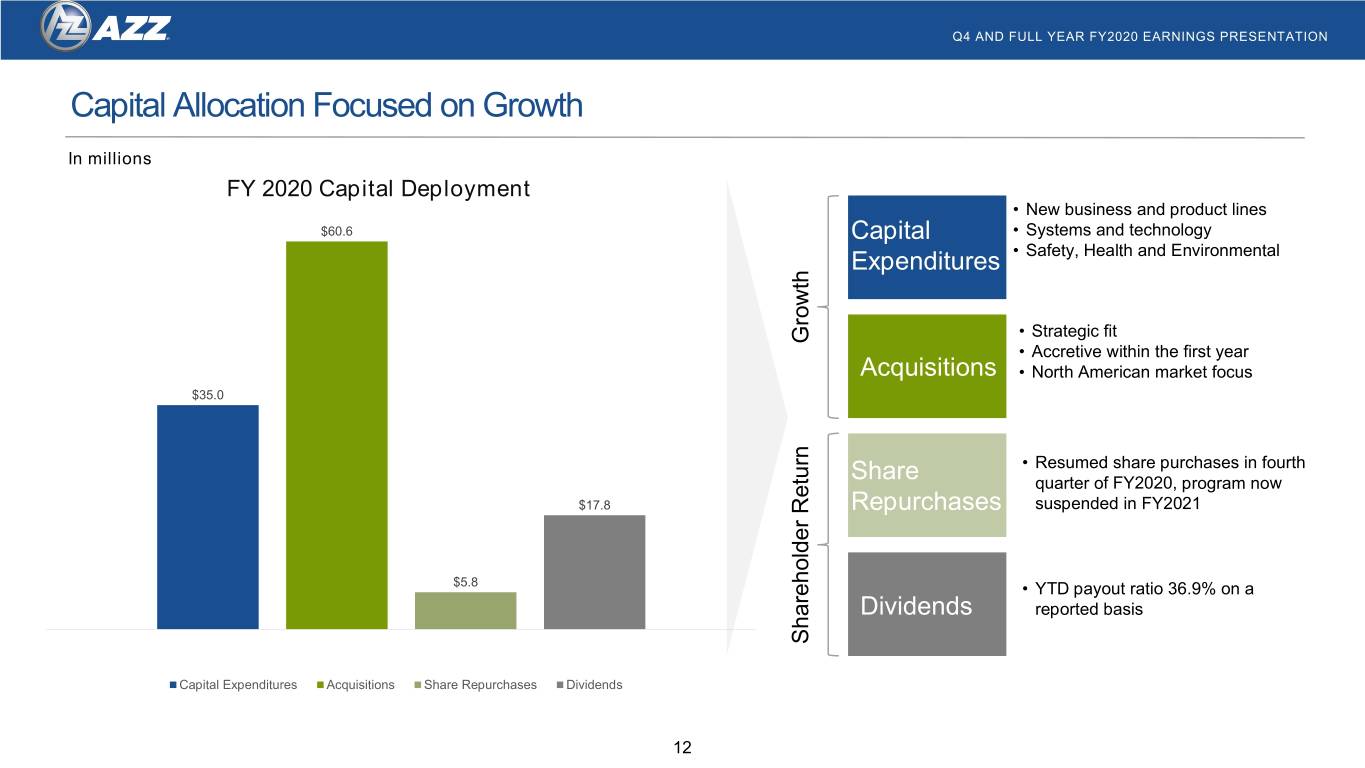

 
Q4 AND FULL YEAR FY2020 EARNINGS PRESENTATION Capital Allocation Focused on Growth In millions FY 2020 Capital Deployment • New business and product lines $60.6 Capital • Systems and technology Expenditures • Safety, Health and Environmental • Strategic fit Growth • Accretive within the first year Acquisitions • North American market focus $35.0 • Resumed share purchases in fourth Share quarter of FY2020, program now $17.8 Repurchases suspended in FY2021 $5.8 • YTD payout ratio 36.9% on a Dividends reported basis Shareholder Return Shareholder Capital Expenditures Acquisitions Share Repurchases Dividends 12

 
Key Indicators 13
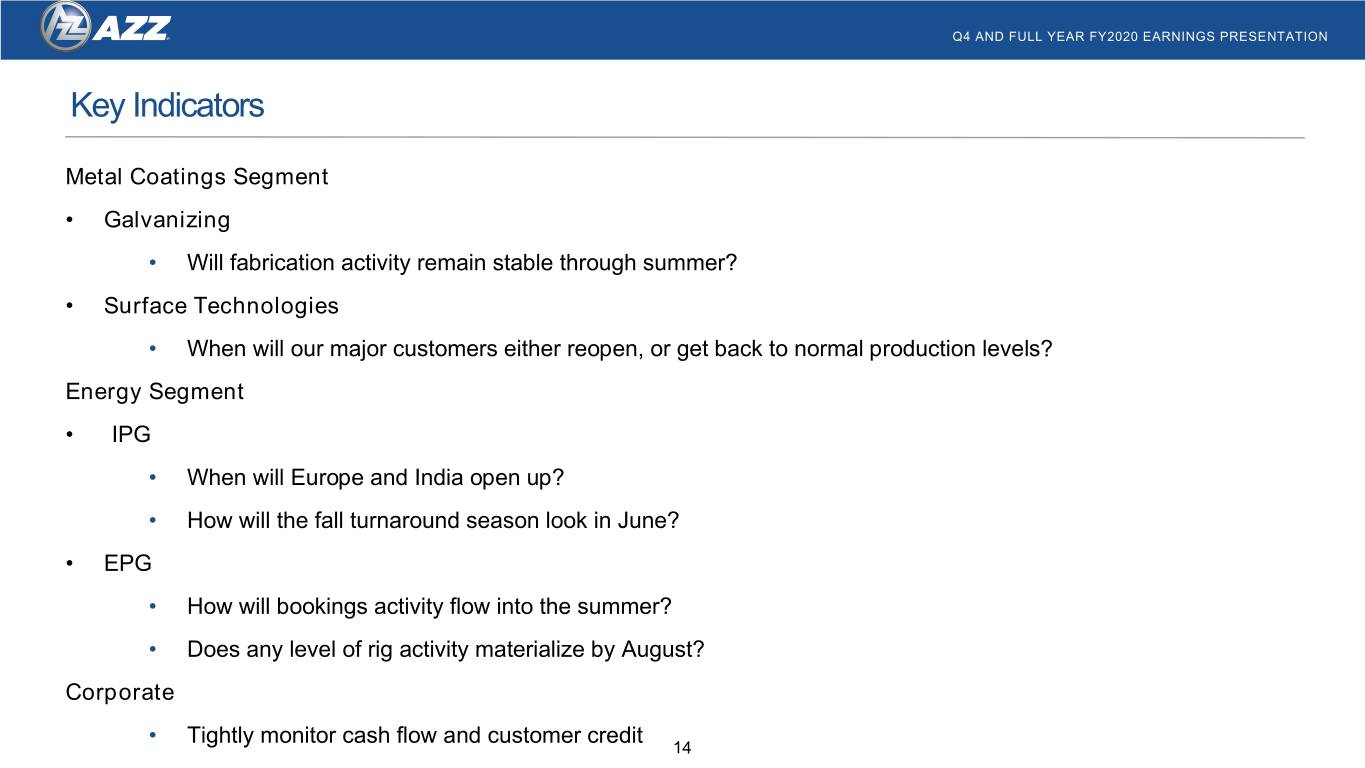

 
Q4 AND FULL YEAR FY2020 EARNINGS PRESENTATION Key Indicators Metal Coatings Segment • Galvanizing • Will fabrication activity remain stable through summer? • Surface Technologies • When will our major customers either reopen, or get back to normal production levels? Energy Segment • IPG • When will Europe and India open up? • How will the fall turnaround season look in June? • EPG • How will bookings activity flow into the summer? • Does any level of rig activity materialize by August? Corporate • Tightly monitor cash flow and customer credit 14
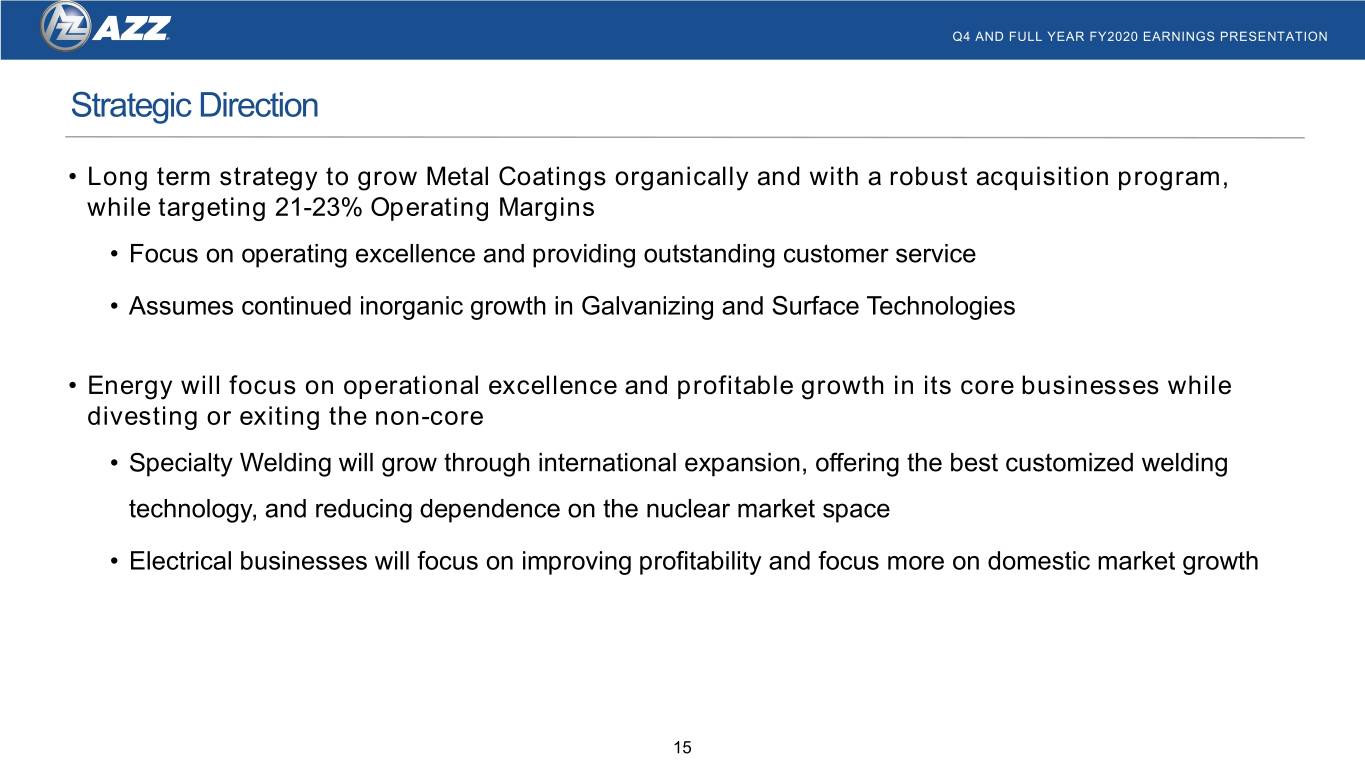

 
Q4 AND FULL YEAR FY2020 EARNINGS PRESENTATION Strategic Direction • Long term strategy to grow Metal Coatings organically and with a robust acquisition program, while targeting 21-23% Operating Margins • Focus on operating excellence and providing outstanding customer service • Assumes continued inorganic growth in Galvanizing and Surface Technologies • Energy will focus on operational excellence and profitable growth in its core businesses while divesting or exiting the non-core • Specialty Welding will grow through international expansion, offering the best customized welding technology, and reducing dependence on the nuclear market space • Electrical businesses will focus on improving profitability and focus more on domestic market growth 15

 
Q&A

 
Q4 AND FULL YEAR FY2020 EARNINGS PRESENTATION Q4 FY20 Segment Revenue and Market Drivers Total Q4 FY2020 Revenue: $245.4 Million Metal Coatings Energy Segment Segment $122.8 $122.6 +21.3% vs. prior year +21.0% vs. prior year Market Drivers • Slightly higher hot-dip galvanizing volume • Continued shipments for large China projects • Benefitted from new acquisition revenue • Switchgear and E-house demand remained strong • Maintained price/value realization • Nuclear market remains in secular decline and Oil Patch sector declined 17

 
Q4 AND FULL YEAR FY2020 EARNINGS PRESENTATION Q4 FY 20 Segment Results – Metal Coatings In millions $ except percentages Revenue Operating Income Operating Margin Key Statistics +21.3% +25.5% +60 bps $122.8 FY2019 Revenue $101.3 $101.3 $22.6 Organic $7.9 $18.0 17.8% 18.4% Acquisitions $13.6 FY2020 Revenue $122.8 FY2019 FY2020 FY2019 FY2020 FY2019 FY2020 Segment Summary: • Quarterly revenue driven by improved demand within several end markets • Expanded sales of Galvabar into additional states • Lower zinc costs in Galvanizing flowing through kettles • Improved labor productivity and operational efficiency driven by Digital Galvanizing System (DGS) • Operating Margins of 18.4%, compared to 17.8% for the same quarter last year due to lower than expected Surface Technology contribution 18

 
Q4 AND FULL YEAR FY2020 EARNINGS PRESENTATION Q4 FY20 Segment Results – Energy In millions $ except percentages Revenue Operating Income Operating Margin Key Statistics +21.0% -124.9% Reported/39.3% Adjusted -660 bps Reported/+110 bps Adjusted FY19 Revenue $101.3 $122.6 $101.3 $7.8 FY19 Book to Ship 1.07 to 1 $5.6 6.3% 5.5% FY20 Revenue $122.6 FY20 Book to Ship 0.92 to 1 FY2019 FY2020 -1.1% -$1.4 FY2019 FY2020 FY 2020 Adj. FY2019 FY2020 FY2020 Adj Segment Summary: • Shipments completed for Wudongde project in China; recognized revenue • Backlog down from prior year due to large China shipments; Strong quarter for domestic orders of enclosures and switchgear • Improved Electrical operational execution and customer service • Normal seasonally light activity for Industrial Group • Adjusted Operating Margin of 6.3% in Q4 FY2020, versus 5.5% same quarter last year 19

 
Q4 AND FULL YEAR FY2020 EARNINGS PRESENTATION Q4 FY20 Summary - Consolidated In $millions, except per share amounts Revenue Net Income Diluted EPS +21.1% -220.2% Reported / +39.3 Adjusted -220.6% Reported / +38.2% Adjusted $245.4 $0.47 $202.5 $12.4 $8.9 $0.34 -$10.6 -$0.41 FY2019 FY2020 FY2019 FY2020 Reported FY2020 Adjusted FY2019 FY2020 Reported FY2020 Adjusted • Organic growth • Lower zinc costs • Divested NLI business • Contribution from acquisitions • Improved operational efficiencies • Nuclear Impairment • Price realization • Tax Adjustment 20

 
Reg G Tables

 
Q4 AND FULL YEAR FY2020 EARNINGS PRESENTATION Non-GAAP Disclosure of EBITDA • In addition to reporting financial results in accordance with Generally Accepted Accounting Principles in the United States ("GAAP"), AZZ has provided EBITDA, and other financial metrics, which are non-GAAP measures. Management believes that the presentation of these measures provides investors with a greater transparency comparison of operating results across a broad spectrum of companies, which provides a more complete understanding of AZZ’s financial performance, competitive position and prospects for the future. Management also believes that investors regularly rely on non-GAAP financial measures, such as EBITDA and other financial metrics, to assess operating performance and that such measures may highlight trends in the Company’s business that may not otherwise be apparent when relying on financial measures calculated in accordance with GAAP. 22

 
Q4 AND FULL YEAR FY2020 EARNINGS PRESENTATION Non-GAAP Disclosure of Consolidated EBITDA In millions Consolidated Consolidated Consolidated Consolidated YTD FY 20 YTD FY 19 Q4 FY 20 Q4 FY 19 GAAP Net Income $48.2 $51.2 $(10.6) $8.8 Adjustments to reconcile GAAP to non- GAAP Financial Measures Interest Expense $13.5 $15.0 $3.0 $3.4 Income Tax Expense $16.7 $11.8 $(0.3) $1.3 Depreciation and Amortization Expense $50.1 $50.2 $13.0 $12.2 Total GAAP adjustments $80.3 $77.0 $15.7 $16.9 Non-GAAP EBITDA $128.5 $128.2 $5.1 $25.7 23

 
Q4 AND FULL YEAR FY2020 EARNINGS PRESENTATION Non-GAAP Disclosure of Metal Coatings and Energy EBITDA In millions Metal Coating Q4 Metal Coating Q4 Energy Energy FY 20 FY 19 Q4 FY 20 Q4 FY 19 GAAP Operating Income $22.6 $18.0 $(1.4) $5.6 Adjustments to reconcile GAAP to non- GAAP Financial Measures Other Income / Expense $0.0 $(0.1) $(0.5) $0.3 Interest Expense $0.0 $0.0 $0.0 $0.0 Depreciation and Amortization Expense $8.0 $7.1 $4.5 $4.7 Total GAAP Adjustments $8.0 $7.0 $4.0 $5.0 Non-GAAP EBITDA $30.6 $25.0 $2.6 $10.6 24
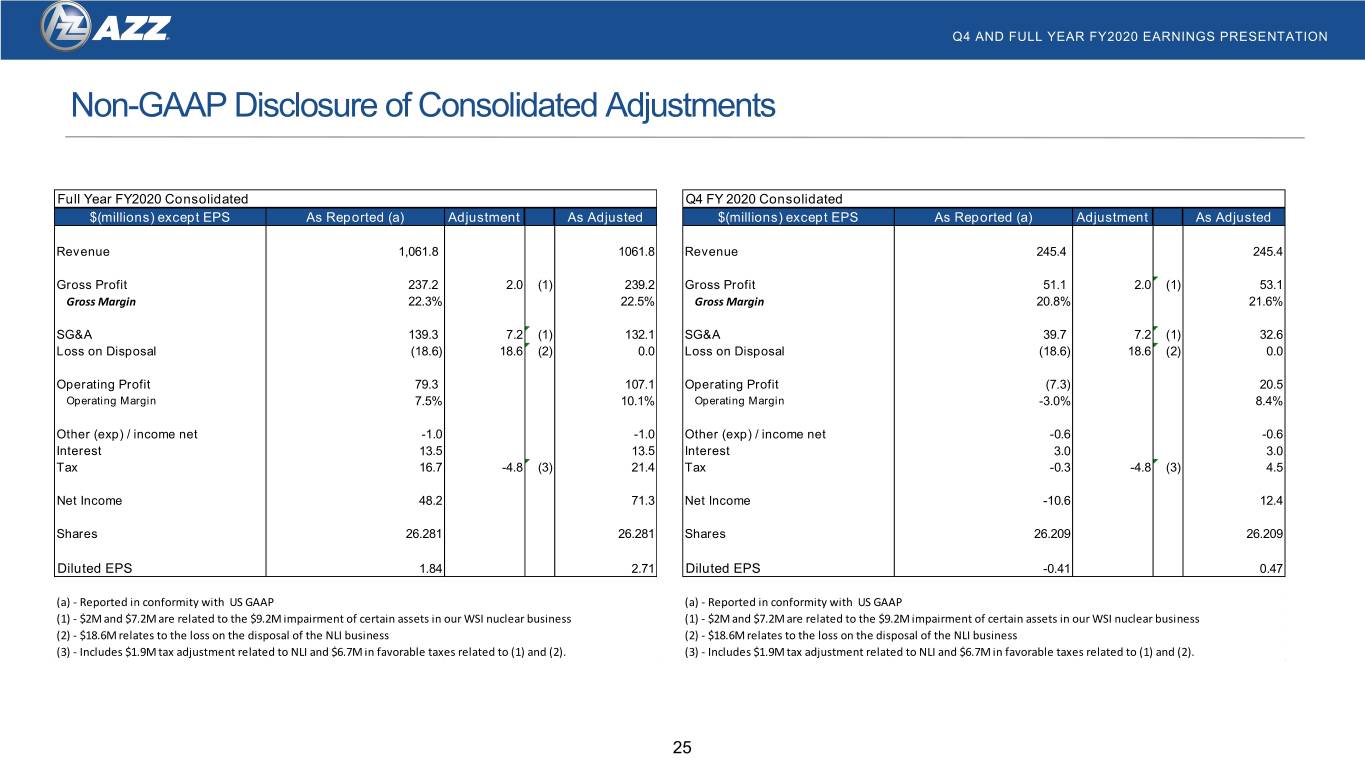

 
Q4 AND FULL YEAR FY2020 EARNINGS PRESENTATION Non-GAAP Disclosure of Consolidated Adjustments Full Year FY2020 Consolidated Q4 FY 2020 Consolidated $(millions) except EPS As Reported (a) Adjustment As Adjusted $(millions) except EPS As Reported (a) Adjustment As Adjusted Revenue 1,061.8 1061.8 Revenue 245.4 245.4 Gross Profit 237.2 2.0 (1) 239.2 Gross Profit 51.1 2.0 (1) 53.1 Gross Margin 22.3% 22.5% Gross Margin 20.8% 21.6% SG&A 139.3 7.2 (1) 132.1 SG&A 39.7 7.2 (1) 32.6 Loss on Disposal (18.6) 18.6 (2) 0.0 Loss on Disposal (18.6) 18.6 (2) 0.0 Operating Profit 79.3 107.1 Operating Profit (7.3) 20.5 Operating Margin 7.5% 10.1% Operating Margin -3.0% 8.4% Other (exp) / income net -1.0 -1.0 Other (exp) / income net -0.6 -0.6 Interest 13.5 13.5 Interest 3.0 3.0 Tax 16.7 -4.8 (3) 21.4 Tax -0.3 -4.8 (3) 4.5 Net Income 48.2 71.3 Net Income -10.6 12.4 Shares 26.281 26.281 Shares 26.209 26.209 Diluted EPS 1.84 2.71 Diluted EPS -0.41 0.47 (a) - Reported in conformity with US GAAP (a) - Reported in conformity with US GAAP (1) - $2M and $7.2M are related to the $9.2M impairment of certain assets in our WSI nuclear business (1) - $2M and $7.2M are related to the $9.2M impairment of certain assets in our WSI nuclear business (2) - $18.6M relates to the loss on the disposal of the NLI business (2) - $18.6M relates to the loss on the disposal of the NLI business (3) - Includes $1.9M tax adjustment related to NLI and $6.7M in favorable taxes related to (1) and (2). (3) - Includes $1.9M tax adjustment related to NLI and $6.7M in favorable taxes related to (1) and (2). 25
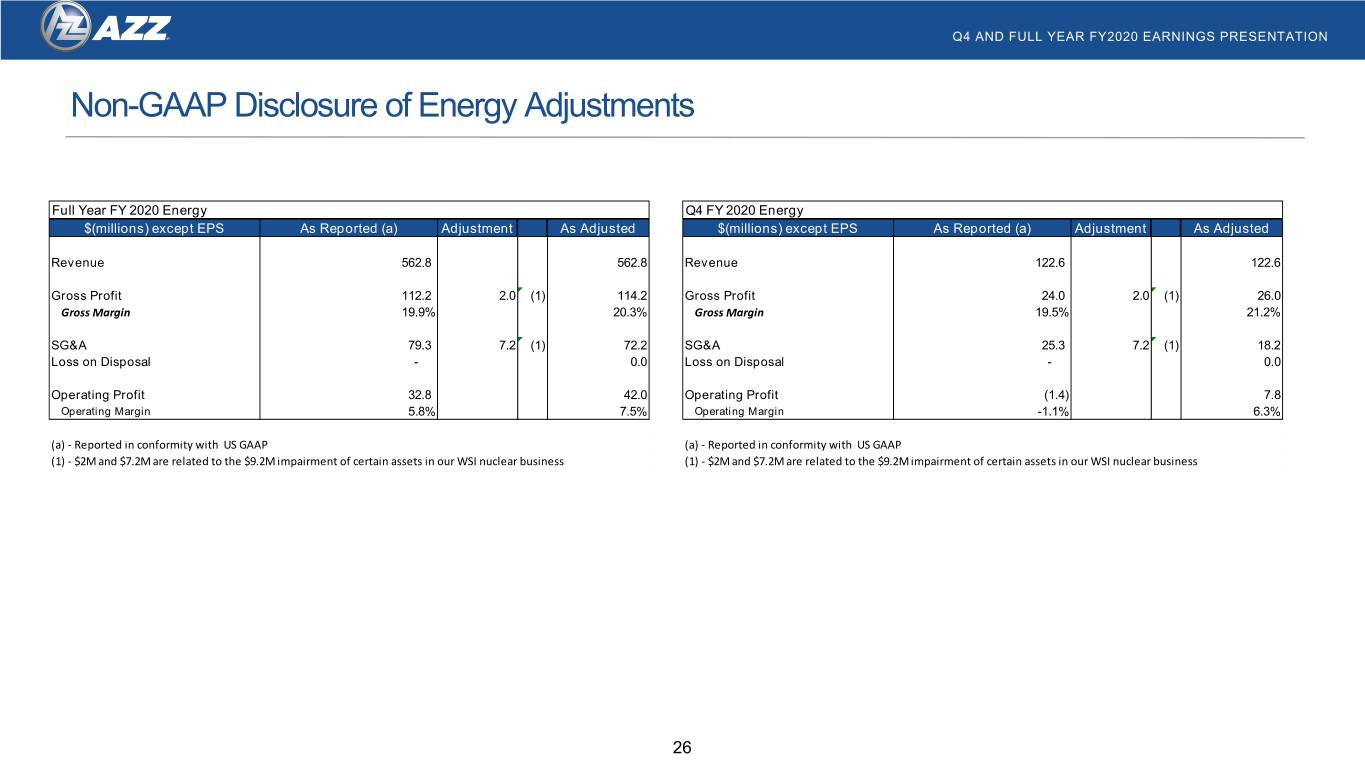

 
Q4 AND FULL YEAR FY2020 EARNINGS PRESENTATION Non-GAAP Disclosure of Energy Adjustments Full Year FY 2020 Energy Q4 FY 2020 Energy $(millions) except EPS As Reported (a) Adjustment As Adjusted $(millions) except EPS As Reported (a) Adjustment As Adjusted Revenue 562.8 562.8 Revenue 122.6 122.6 Gross Profit 112.2 2.0 (1) 114.2 Gross Profit 24.0 2.0 (1) 26.0 Gross Margin 19.9% 20.3% Gross Margin 19.5% 21.2% SG&A 79.3 7.2 (1) 72.2 SG&A 25.3 7.2 (1) 18.2 Loss on Disposal - 0.0 Loss on Disposal - 0.0 Operating Profit 32.8 42.0 Operating Profit (1.4) 7.8 Operating Margin 5.8% 7.5% Operating Margin -1.1% 6.3% (a) - Reported in conformity with US GAAP (a) - Reported in conformity with US GAAP (1) - $2M and $7.2M are related to the $9.2M impairment of certain assets in our WSI nuclear business (1) - $2M and $7.2M are related to the $9.2M impairment of certain assets in our WSI nuclear business 26
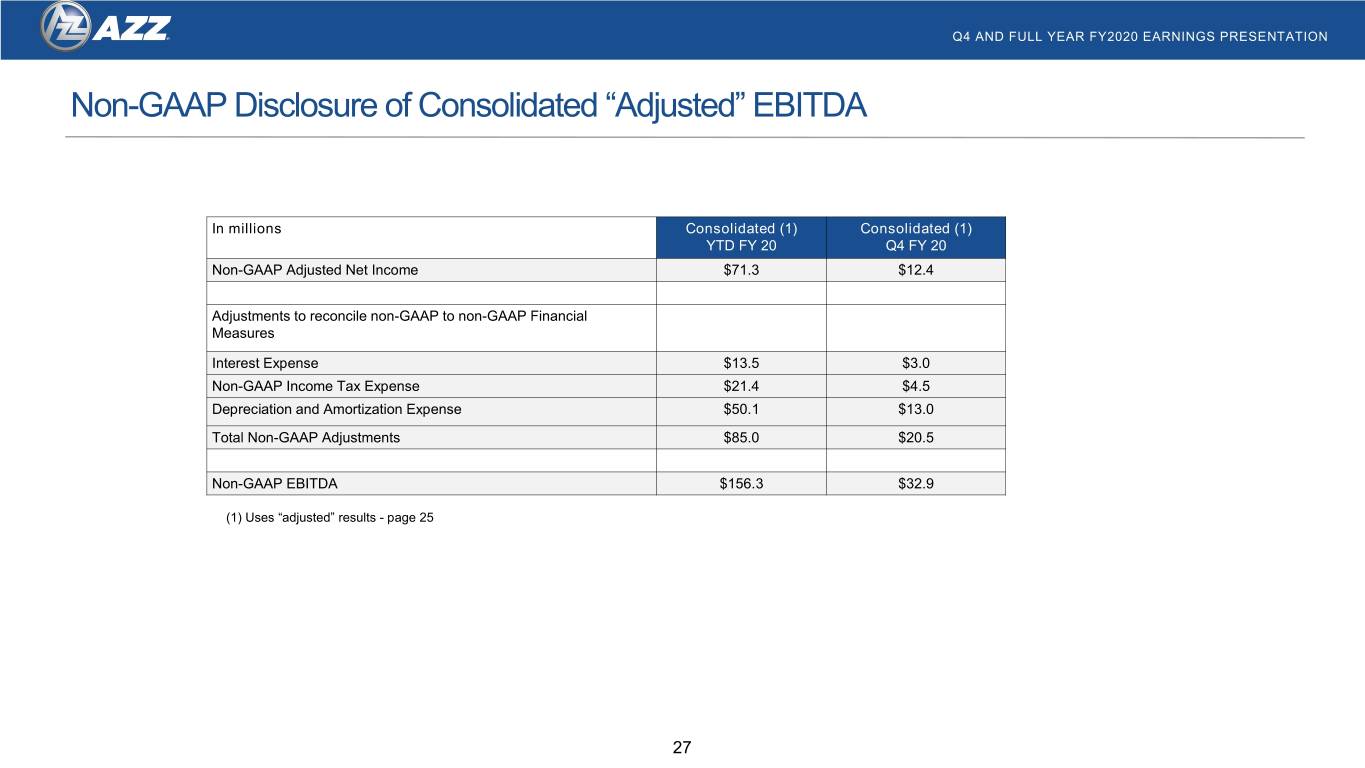

 
Q4 AND FULL YEAR FY2020 EARNINGS PRESENTATION Non-GAAP Disclosure of Consolidated “Adjusted” EBITDA In millions Consolidated (1) Consolidated (1) YTD FY 20 Q4 FY 20 Non-GAAP Adjusted Net Income $71.3 $12.4 Adjustments to reconcile non-GAAP to non-GAAP Financial Measures Interest Expense $13.5 $3.0 Non-GAAP Income Tax Expense $21.4 $4.5 Depreciation and Amortization Expense $50.1 $13.0 Total Non-GAAP Adjustments $85.0 $20.5 Non-GAAP EBITDA $156.3 $32.9 (1) Uses “adjusted” results - page 25 27
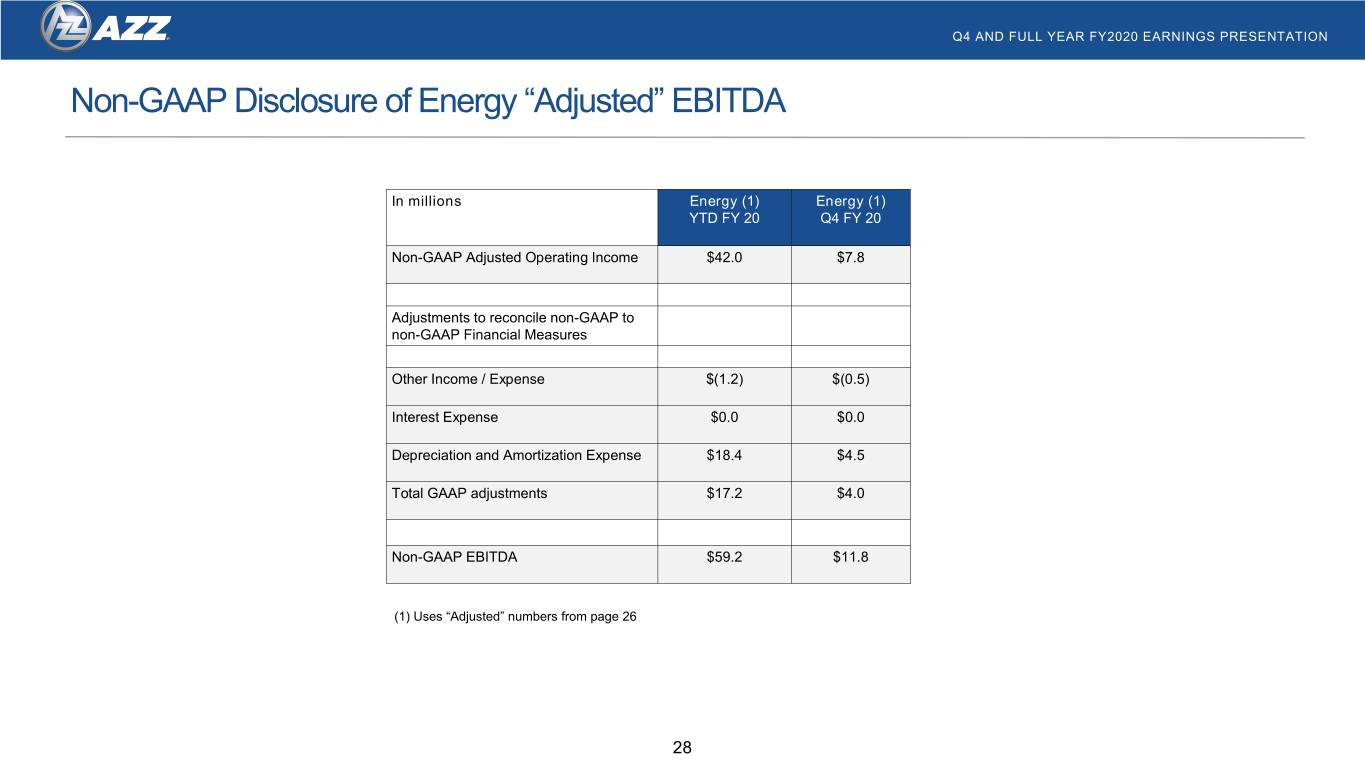

 
Q4 AND FULL YEAR FY2020 EARNINGS PRESENTATION Non-GAAP Disclosure of Energy “Adjusted” EBITDA In millions Energy (1) Energy (1) YTD FY 20 Q4 FY 20 Non-GAAP Adjusted Operating Income $42.0 $7.8 Adjustments to reconcile non-GAAP to non-GAAP Financial Measures Other Income / Expense $(1.2) $(0.5) Interest Expense $0.0 $0.0 Depreciation and Amortization Expense $18.4 $4.5 Total GAAP adjustments $17.2 $4.0 Non-GAAP EBITDA $59.2 $11.8 (1) Uses “Adjusted” numbers from page 26 28