EX 99.1

Banc of California Reports Third Quarter 2020 Financial Results
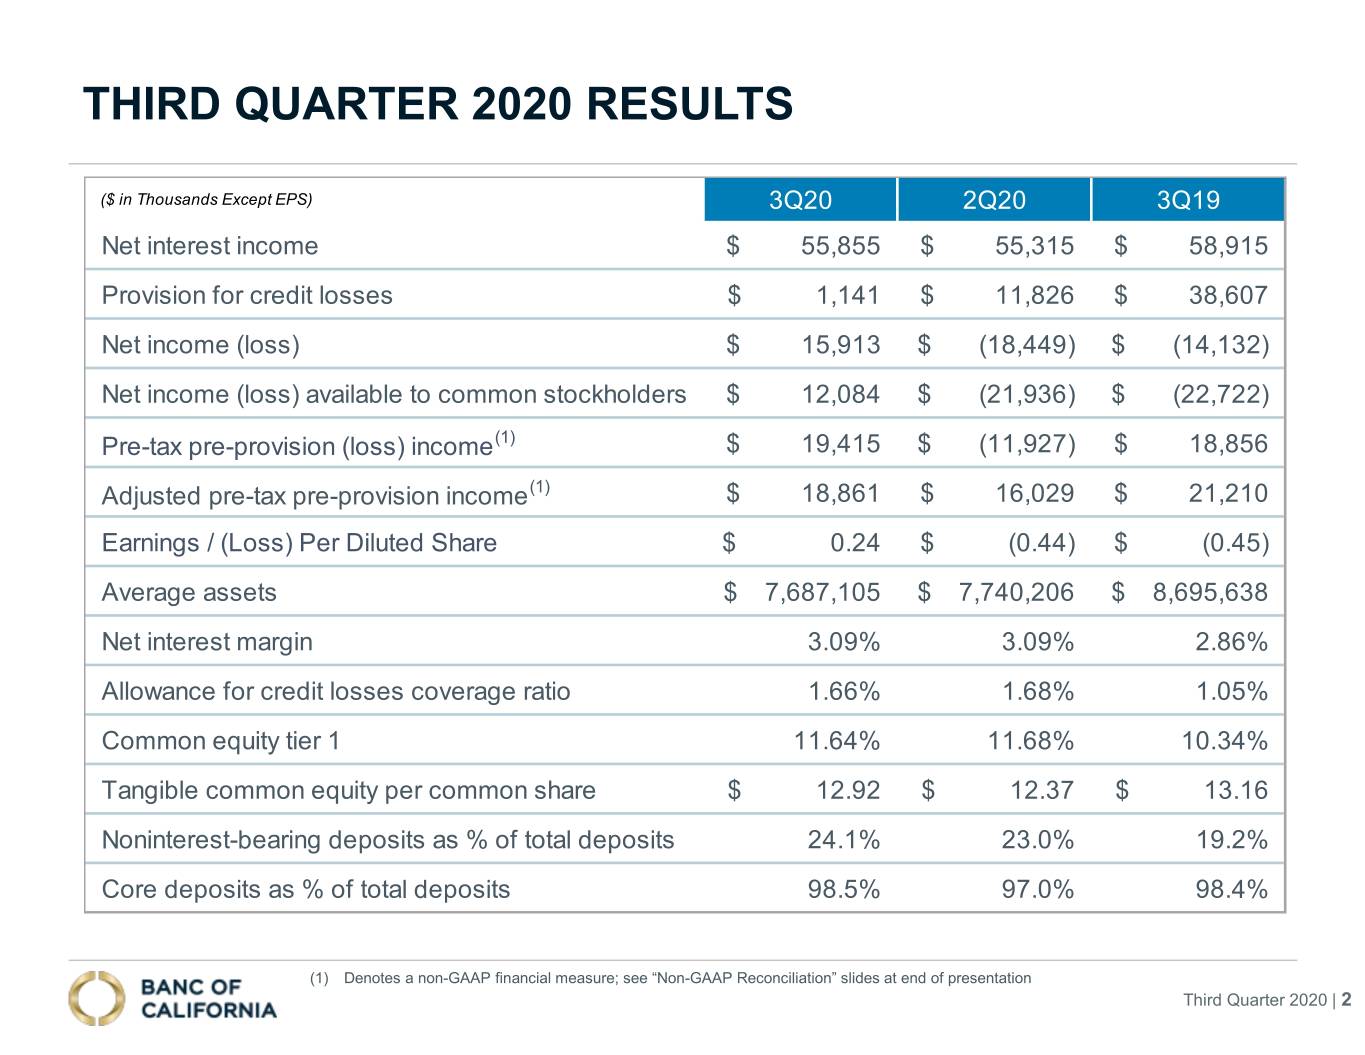
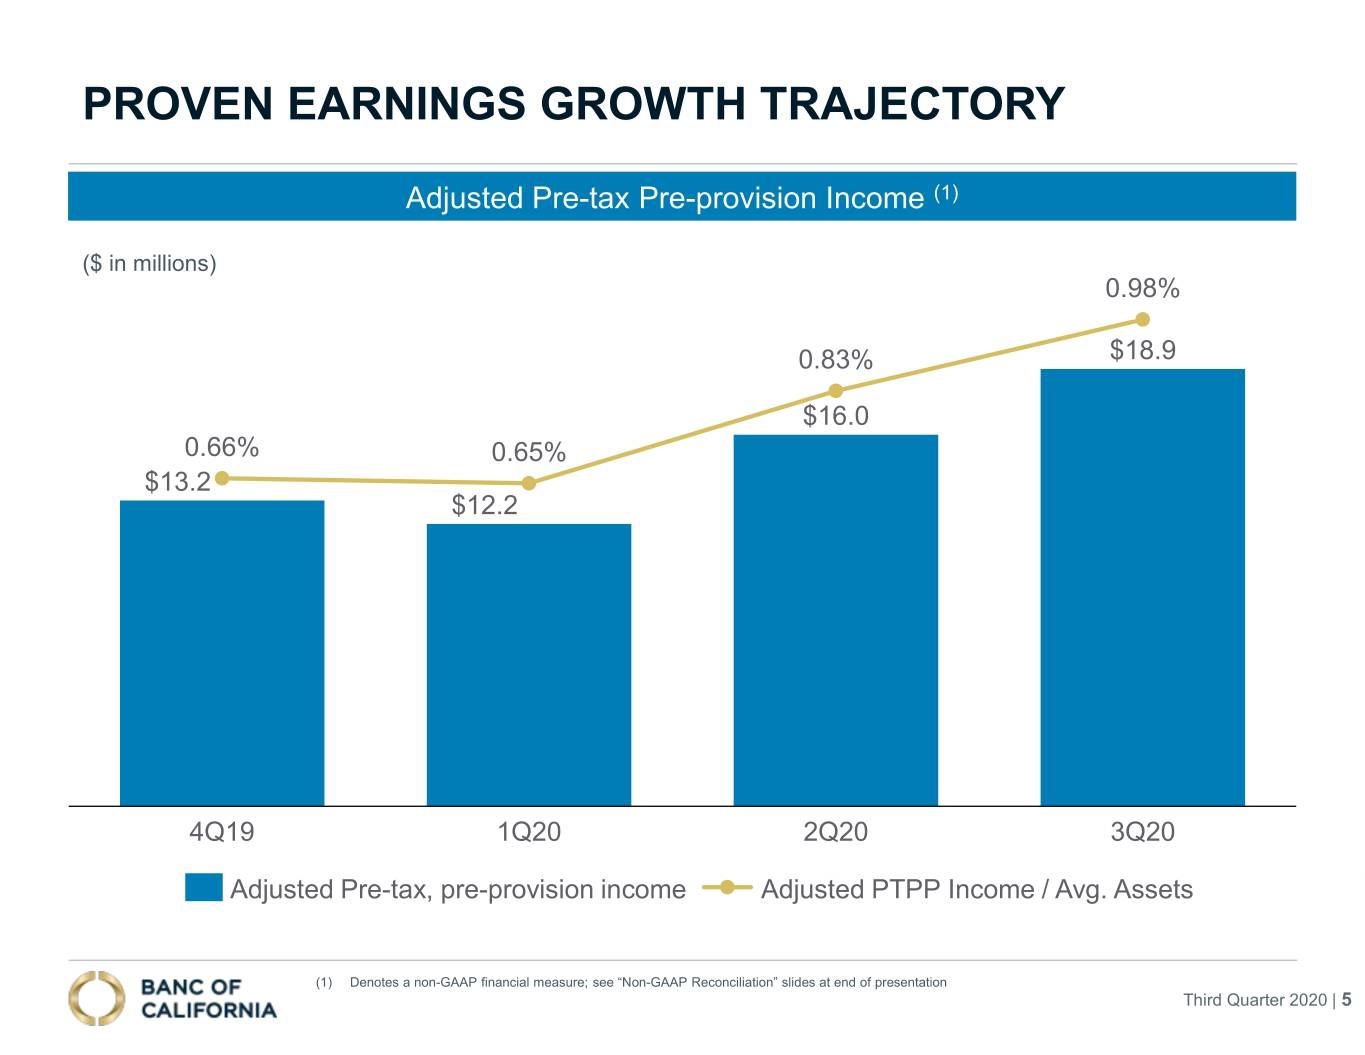
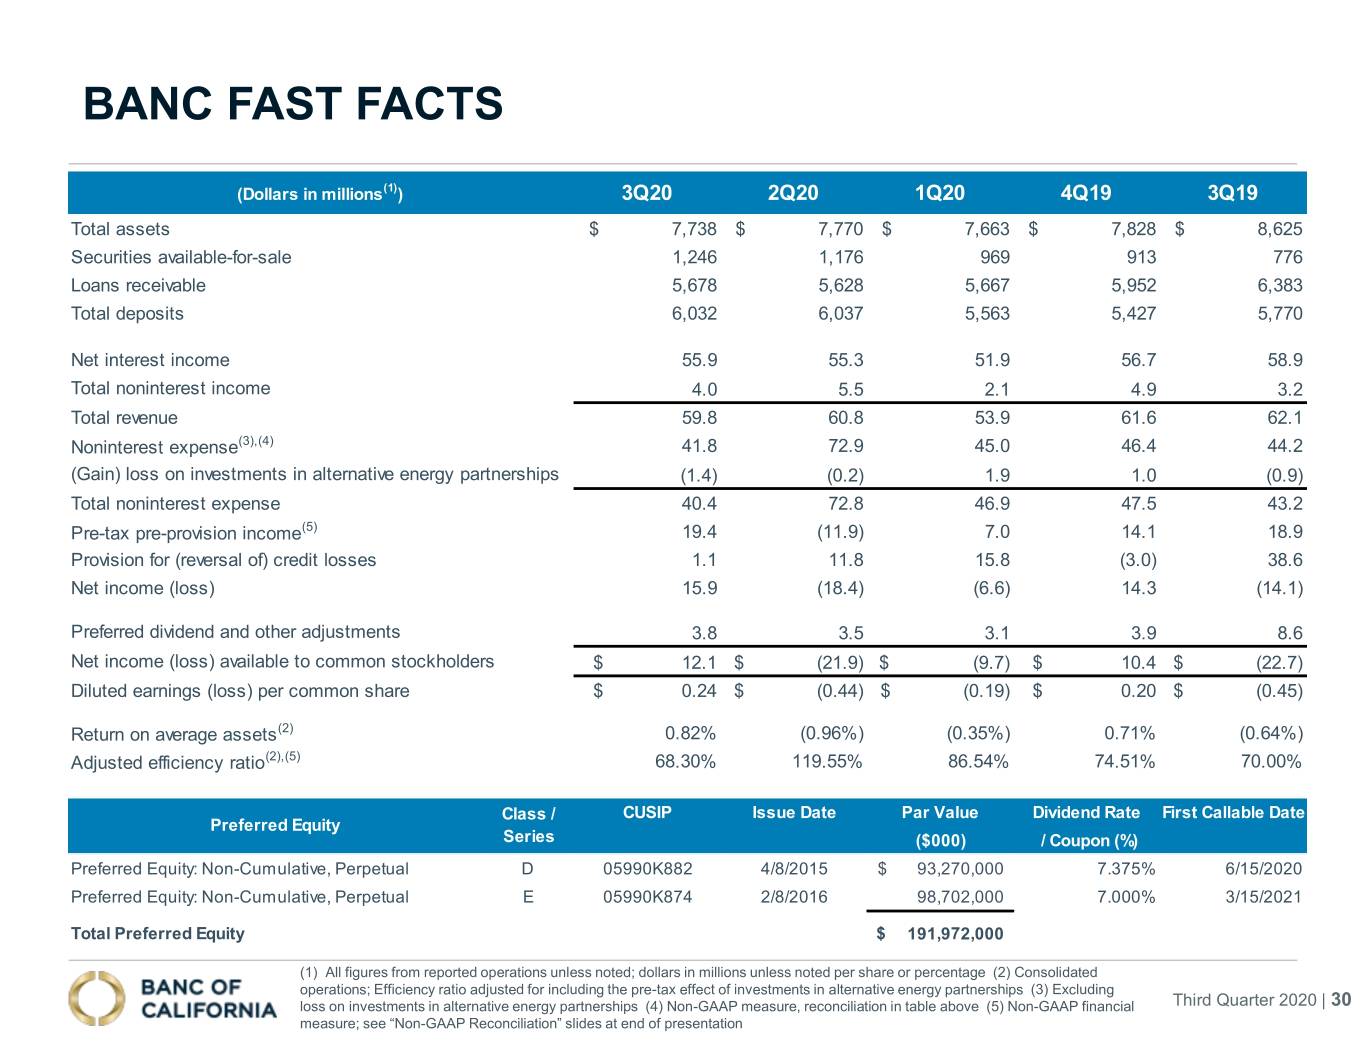
SANTA ANA, Calif., (October 22, 2020) — Banc of California, Inc. (NYSE: BANC) today reported net income available to common stockholders for the third quarter of 2020 of $12.1 million, or diluted earnings per common share of $0.24.
Highlights for the third quarter included:
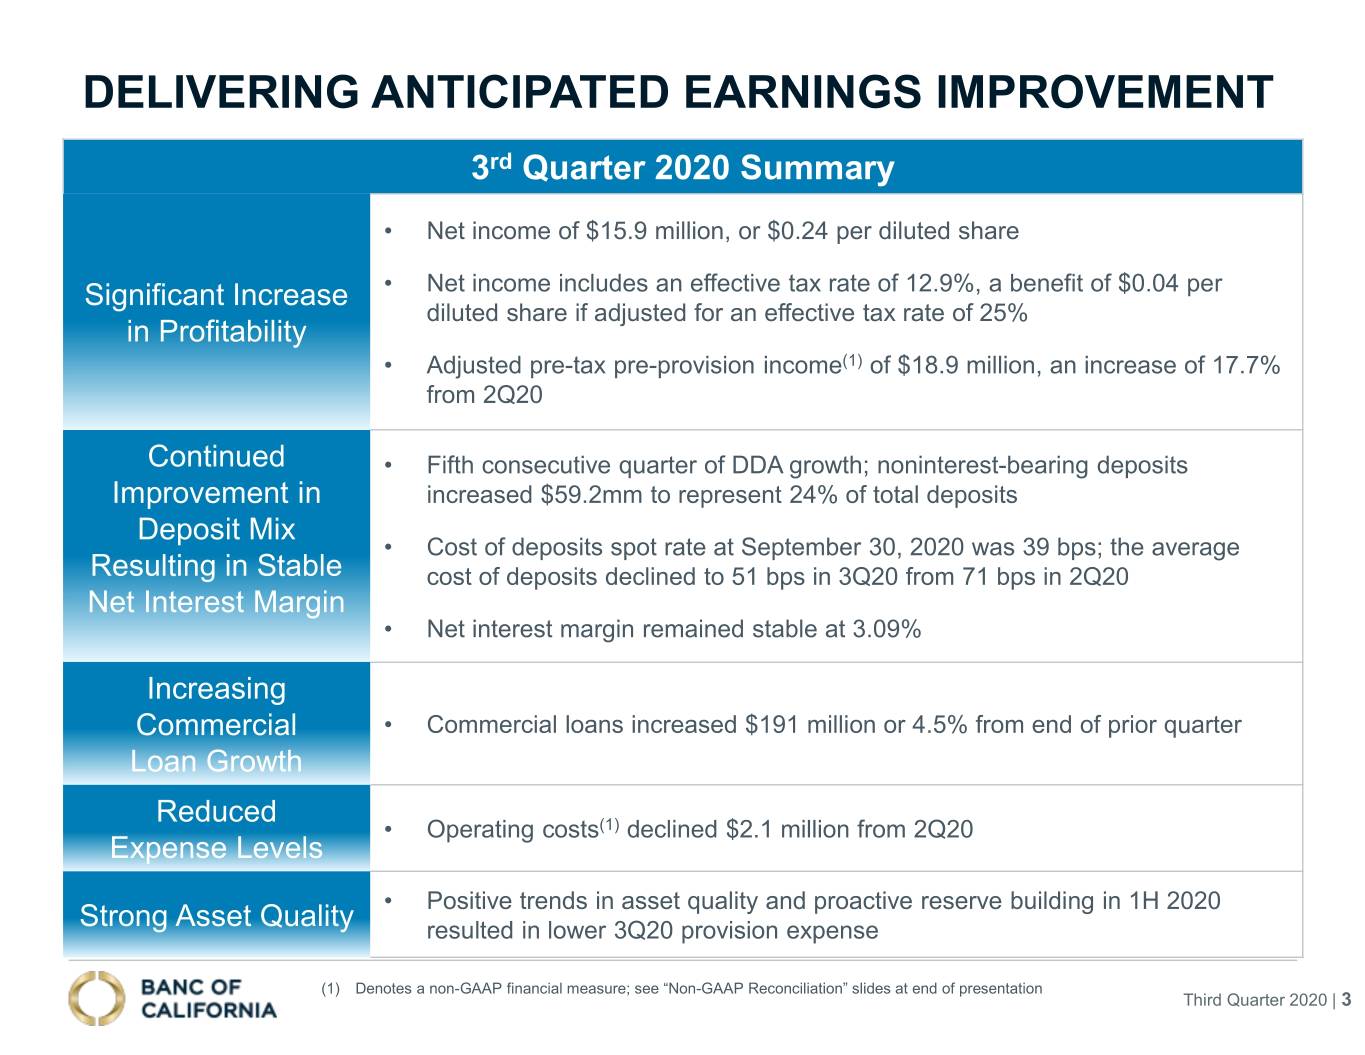
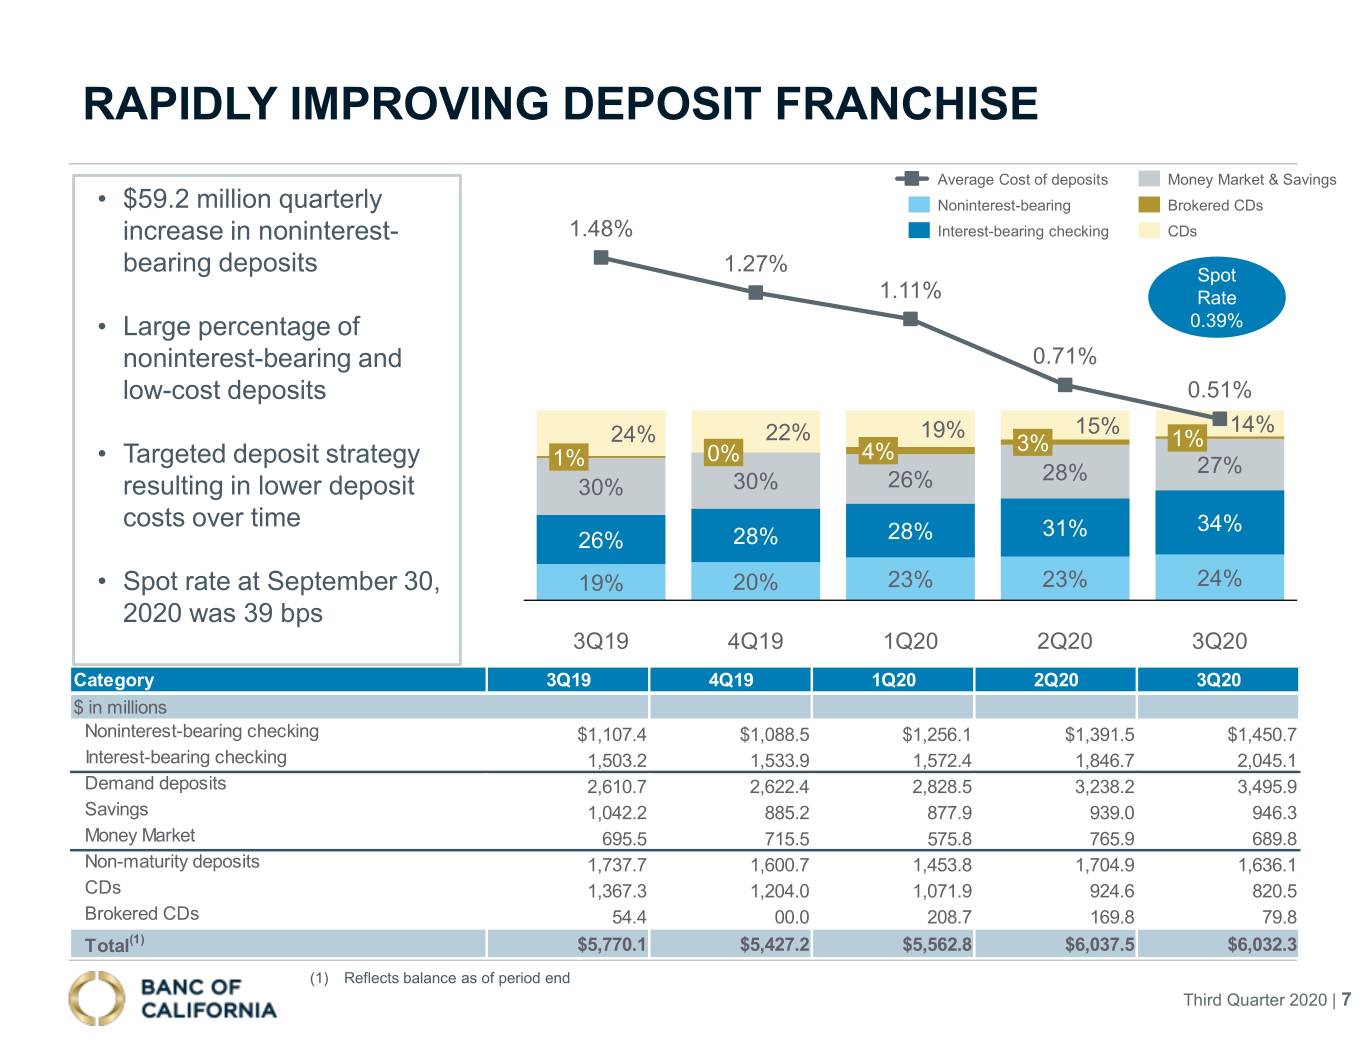
•Noninterest-bearing deposit balances increased $59.2 million during the quarter and represented 24% of total deposits at September 30, 2020, up from 19% a year earlier
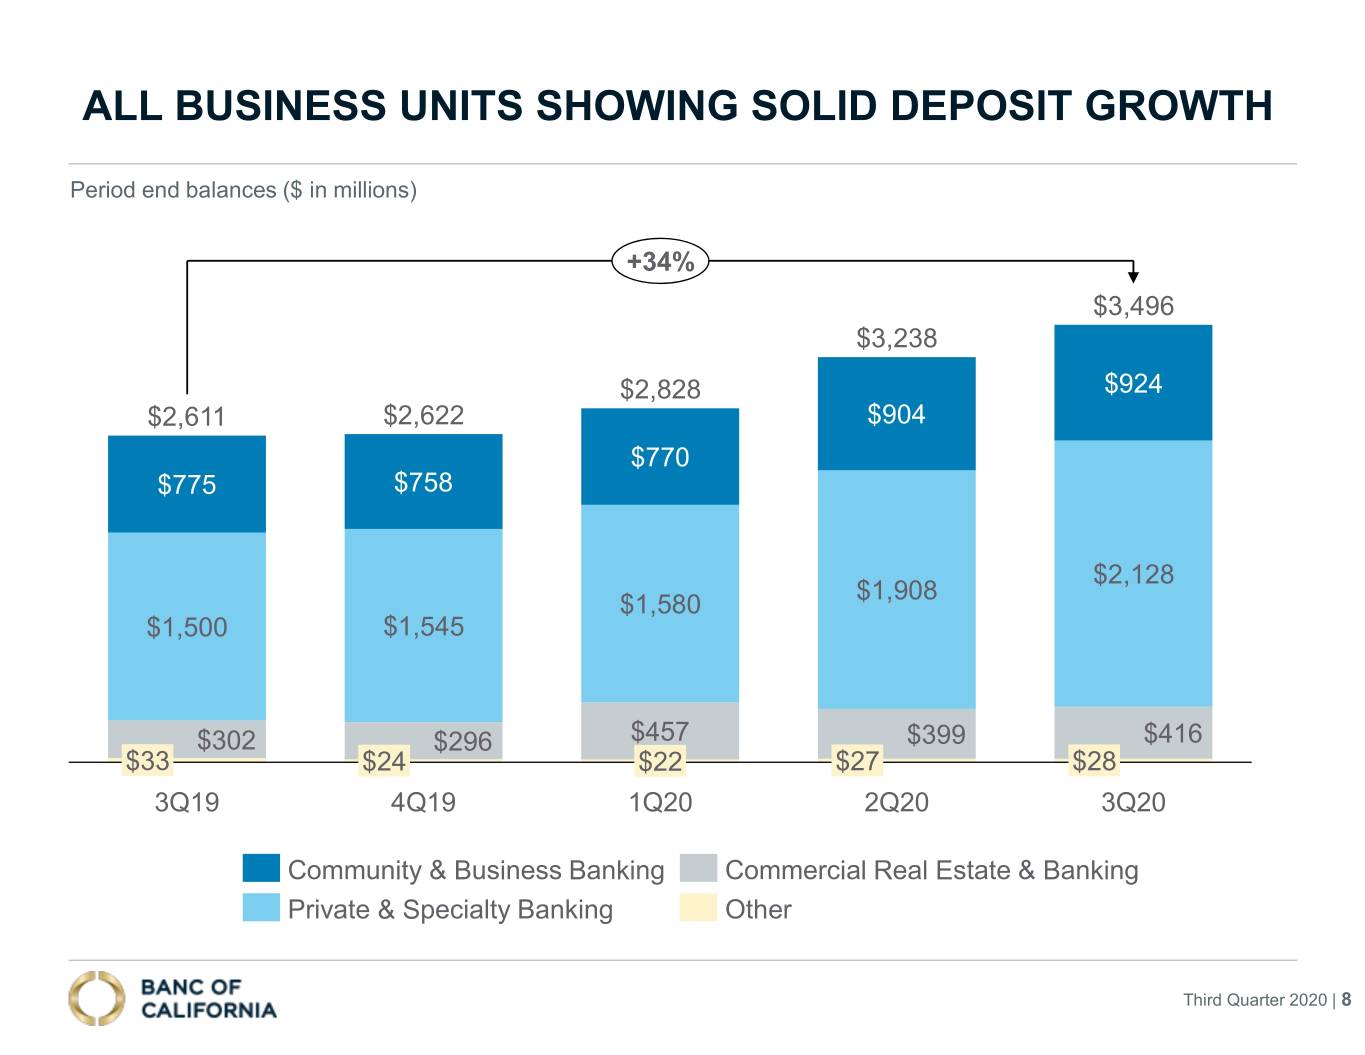
•Total checking balances increased $257.7 million during the quarter and represented 58% of total deposits at September 30, 2020, up from 45% a year earlier
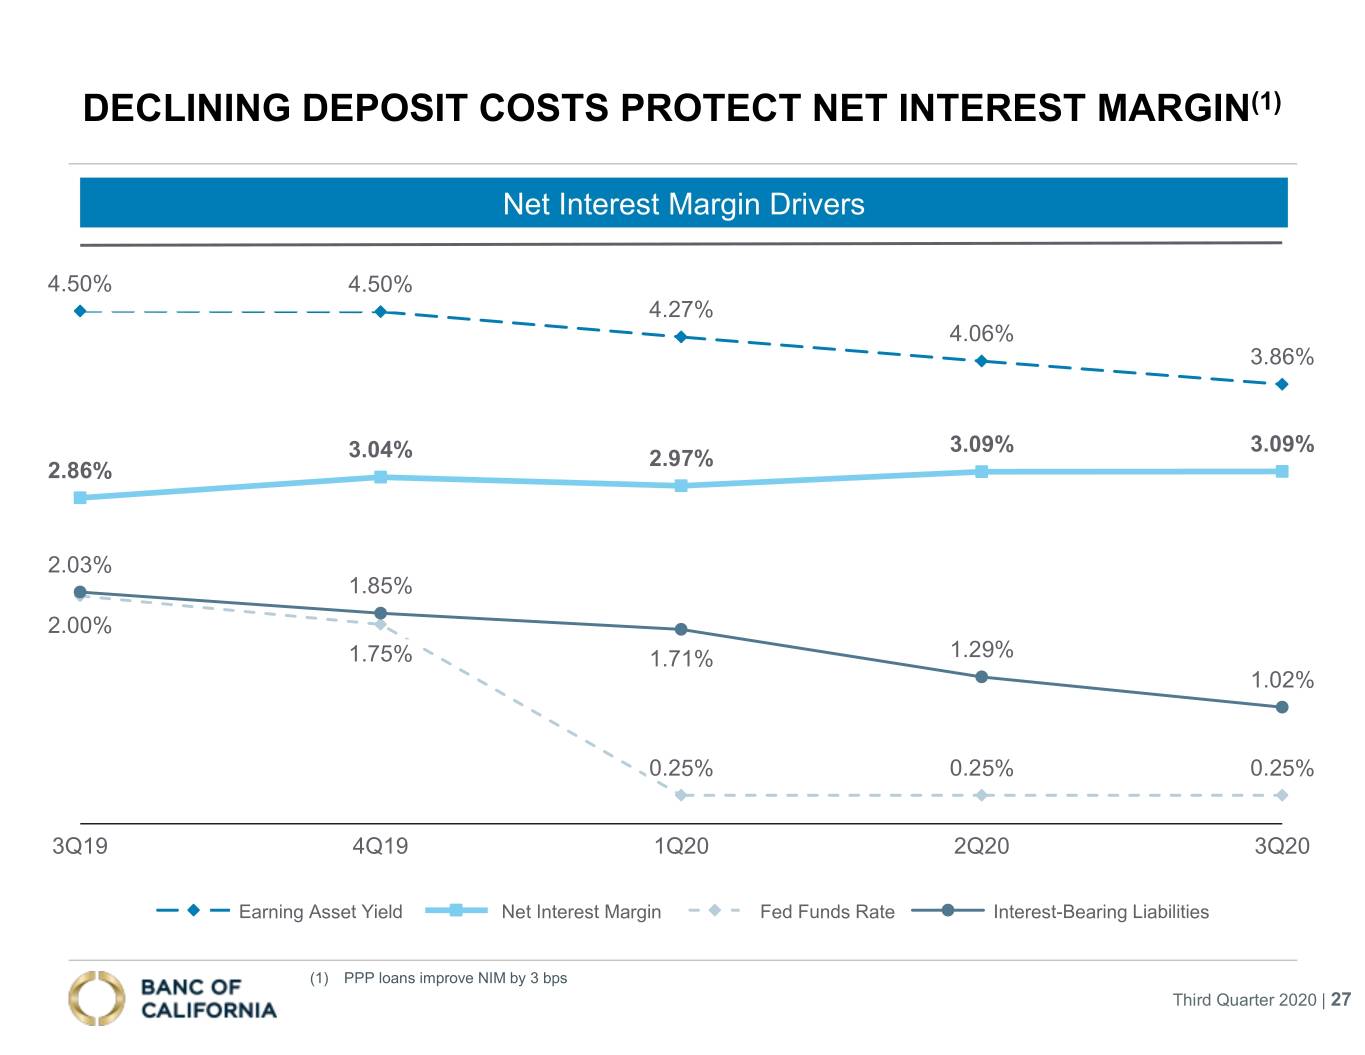
•Net interest margin remained stable at 3.09%
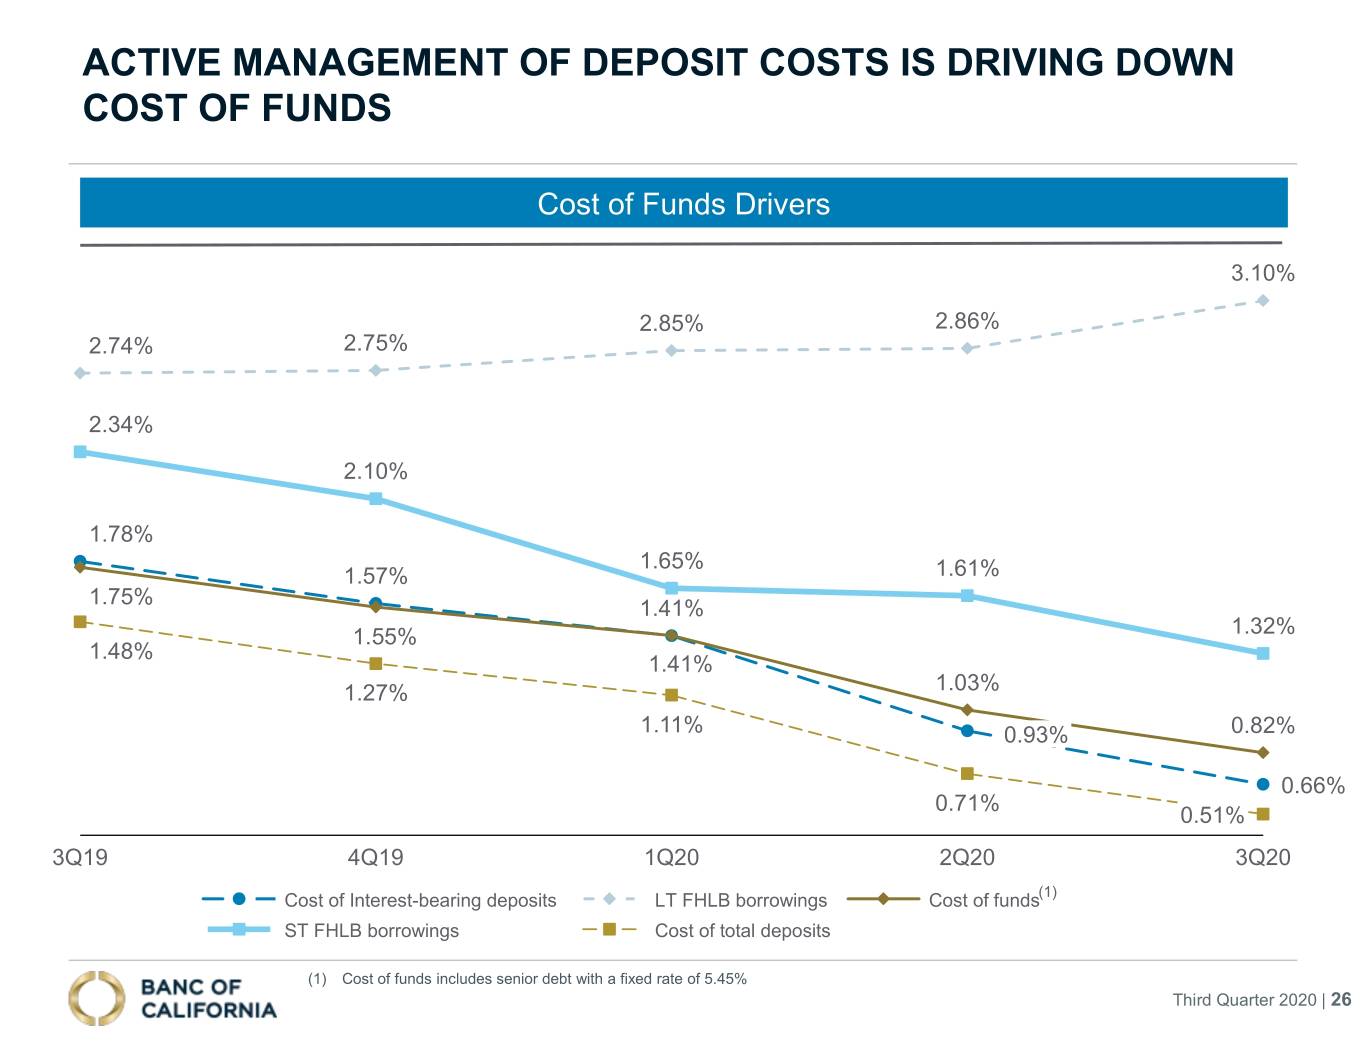
•Average cost of total deposits declined 20 basis points from the prior quarter to 0.51%, with period-end cost of deposits at 0.39%
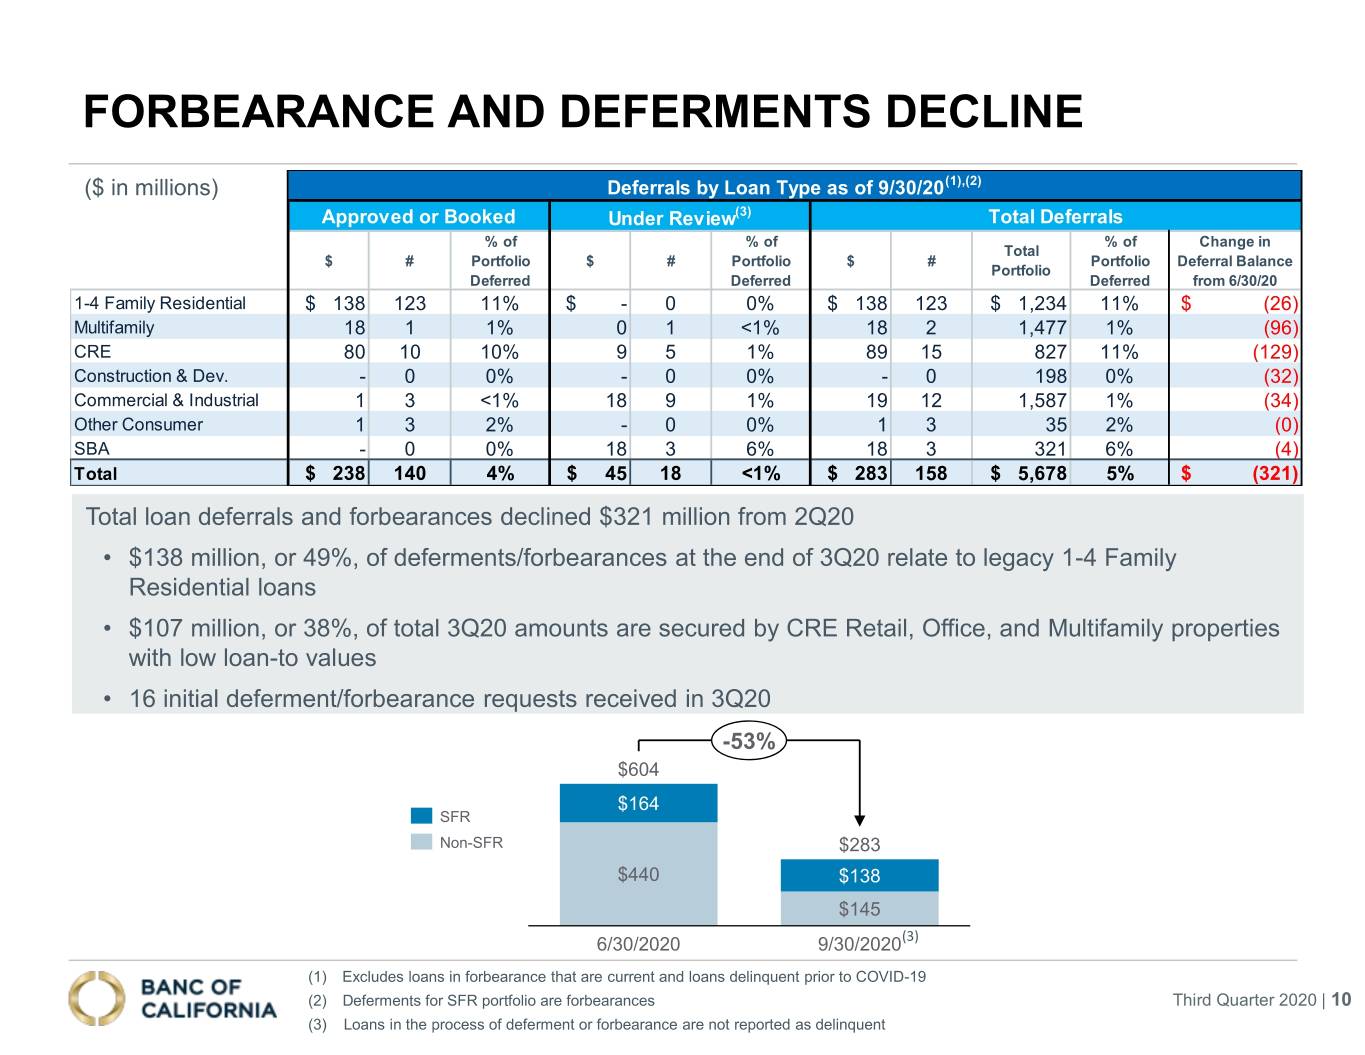
•Total deferrals/forbearances declined to $282.5 million at September 30, 2020 from $604.2 million
•Allowance for credit losses remained strong at 1.66% of total loans
•Common Equity Tier 1 capital at 11.64%
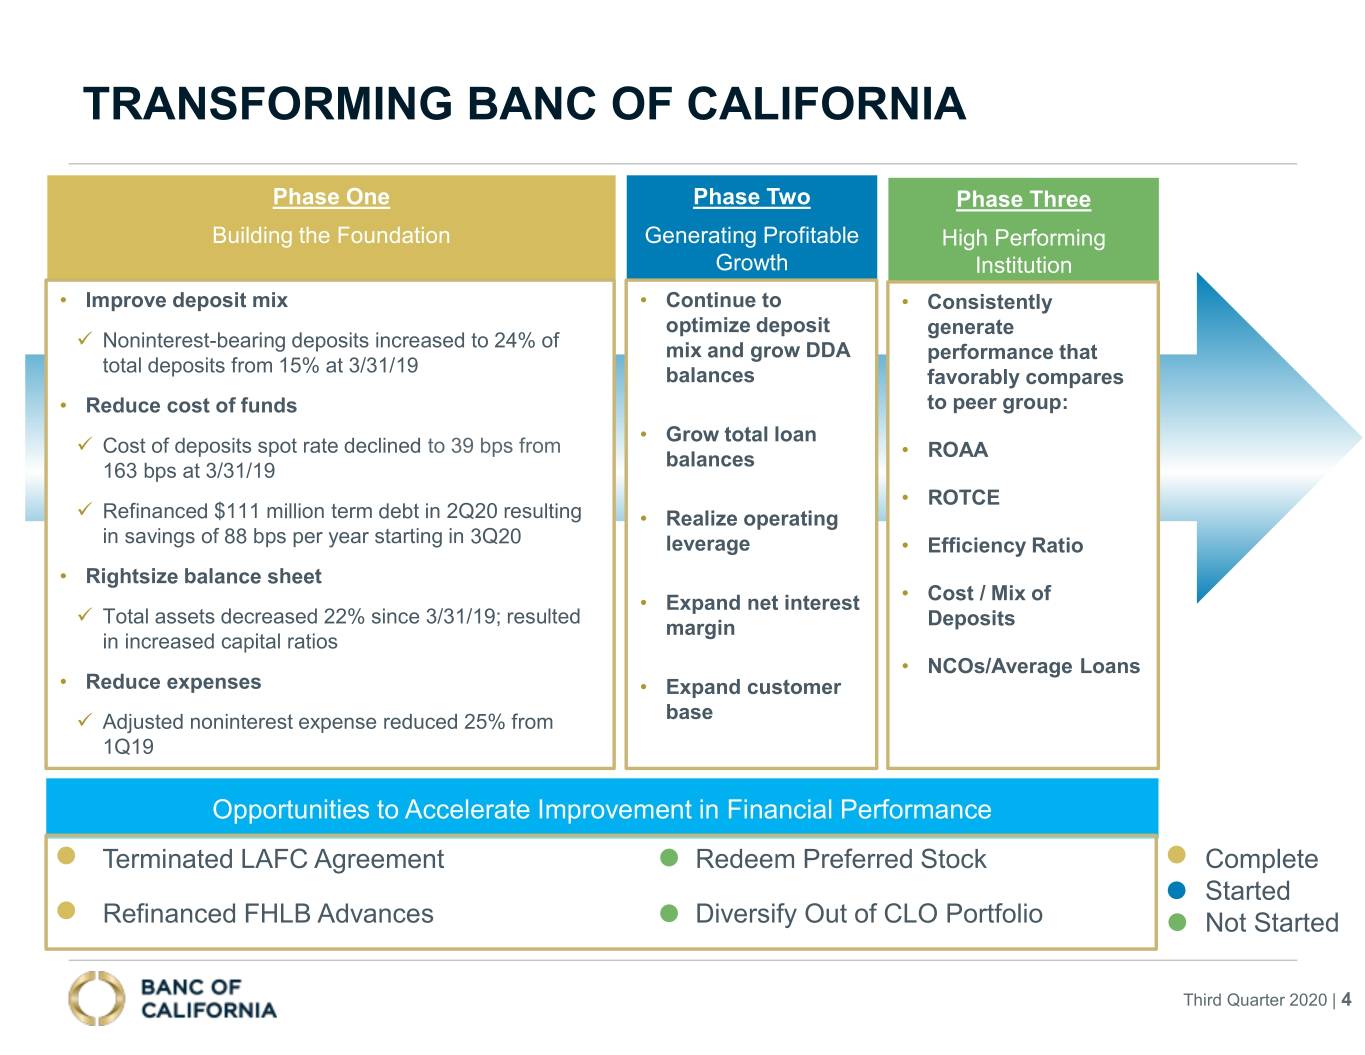
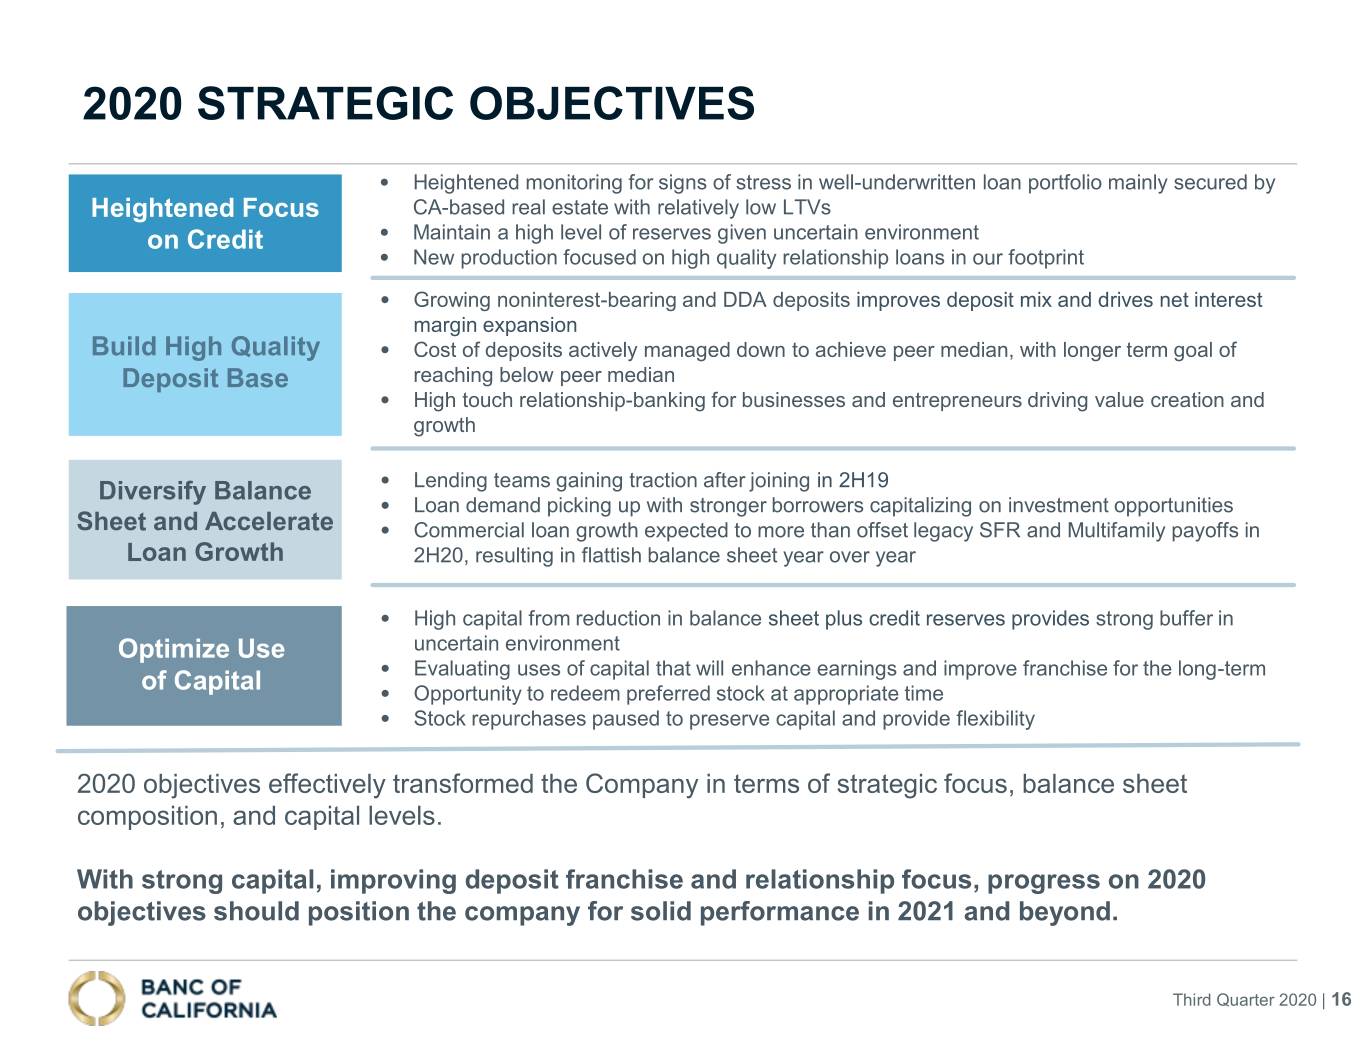
Jared Wolff, President & CEO of Banc of California, commented, “Our third quarter results reflect the growing earnings momentum that we have been building following nearly 18 months of restructuring our operations. Our strong execution on the strategies we have identified to enhance the value of our franchise continued to result in positive trends on many fronts including a further reduction in our cost of deposits, a stable net interest margin, and improved operating efficiencies. These efforts translated into a significant improvement in earnings and pre-tax pre-provision income.”
“Our business development efforts continue to gain traction despite the impact of the COVID-19 pandemic. We are consistently adding new commercial banking relationships, which resulted in our fifth consecutive quarter of demand deposit account growth and further improvement in our mix of deposits. The commercial banking team we have built is also effectively bringing in new, high quality commercial loans to offset the planned run-off of our single-family residential portfolio. As a result, we saw an increase in total loan balances in the third quarter, while our mix of loans continued to shift more towards relationship-based business loans.”
“We believe that we continue to have many levers to pull that will further improve our financial performance. While the ongoing pandemic creates a level of near-term uncertainty, we believe that over the longer-term, we are very well positioned to generate earning asset growth, expand our net interest margin, realize additional operating leverage, and deliver a higher level of earnings and returns for our shareholders as the economy strengthens,” said Mr. Wolff.”
Lynn Hopkins, Chief Financial Officer of Banc of California, said, “We are very pleased with our third quarter performance and results which are a reflection of executing on our strategic vision. Our net interest margin remained unchanged at 3.09% as we successfully lowered our average cost of funds 21 basis points which helped absorb the decrease in our average earning assets yield. Our period end total deposits costs also fell 20 basis points to 39 basis points. Our loan portfolio remains well-positioned as it is heavily weighted towards real estate loans with low loan-to-values and we saw lower levels of loans on deferment and forbearance. Our allowance for credit losses to total loans was 1.66% and is a reflection of the considerable uncertainty of the timing and magnitude of the impact of the pandemic. Nonetheless, we are confident in our ability to continue to execute on our initiatives and optimize our capital in ways that will be accretive to earnings and create further value for our shareholders.”
1
EX 99.1
Income Statement Highlights
| Three Months Ended | Nine Months Ended | ||||||||||||||||||||||||||||||||||||||||
| September 30, 2020 | June 30, 2020 | March 31, 2020 | December 31, 2019 | September 30, 2019 | September 30, 2020 | September 30, 2019 | |||||||||||||||||||||||||||||||||||
| ($ in thousands) | |||||||||||||||||||||||||||||||||||||||||
| Total interest and dividend income | $ | 69,666 | $ | 72,697 | $ | 74,714 | $ | 83,702 | $ | 92,657 | $ | 217,077 | $ | 307,409 | |||||||||||||||||||||||||||
| Total interest expense | 13,811 | 17,382 | 22,853 | 27,042 | 33,742 | 54,046 | 115,906 | ||||||||||||||||||||||||||||||||||
| Net interest income | 55,855 | 55,315 | 51,861 | 56,660 | 58,915 | 163,031 | 191,503 | ||||||||||||||||||||||||||||||||||
| Total noninterest income | 3,954 | 5,528 | 2,061 | 4,930 | 3,181 | 11,543 | 7,186 | ||||||||||||||||||||||||||||||||||
| Total revenue | 59,809 | 60,843 | 53,922 | 61,590 | 62,096 | 174,574 | 198,689 | ||||||||||||||||||||||||||||||||||
| Total noninterest expense | 40,394 | 72,770 | 46,919 | 47,483 | 43,240 | 160,083 | 148,989 | ||||||||||||||||||||||||||||||||||
| Pre-tax / pre-provision income (loss) | 19,415 | (11,927) | 7,003 | 14,107 | 18,856 | 14,491 | 49,700 | ||||||||||||||||||||||||||||||||||
| Provision for (reversal of) credit losses | 1,141 | 11,826 | 15,761 | (2,976) | 38,607 | 28,728 | 38,805 | ||||||||||||||||||||||||||||||||||
| Income tax expense (benefit) | 2,361 | (5,304) | (2,165) | 2,811 | (5,619) | (5,108) | 1,408 | ||||||||||||||||||||||||||||||||||
| Net income (loss) | $ | 15,913 | $ | (18,449) | $ | (6,593) | $ | 14,272 | $ | (14,132) | $ | (9,129) | $ | 9,487 | |||||||||||||||||||||||||||
Net income (loss) available to common stockholders(1) | $ | 12,084 | $ | (21,936) | $ | (9,694) | $ | 10,415 | $ | (22,722) | $ | (19,265) | $ | (8,015) | |||||||||||||||||||||||||||
(1)Balance represents the net income (loss) available to common stockholders after subtracting preferred stock dividends, income allocated to participating securities, participating securities dividends and impact of preferred stock redemption from net income (loss). Refer to the Statement of Operations for additional detail on these amounts.
Net interest income
Q3-2020 vs Q2-2020
Net interest income increased $0.5 million to $55.9 million for the third quarter due mostly to lower funding costs, offset by lower yields on interest-earning assets. Compared to the prior quarter, average interest-earning assets declined by $14.4 million to $7.18 billion, due to lower average loans of $174.0 million, offset by higher average securities of $126.8 million and other interest-earning assets of $32.8 million. During the third quarter, average deposits increased $164.3 million, consisting of higher average interest-bearing deposits of $156.6 million and higher average noninterest-bearing deposits of $7.7 million. Average FHLB advances decreased $211.0 million due to current quarter deposit growth and the impact of the early payoff of $100.0 million in FHLB advances at the end of the second quarter.
The net interest margin remained unchanged compared to the prior quarter at 3.09% for the third quarter as the average cost of funds decreased 21 basis points, offset by a 20 basis point decrease in the average earning-assets yield. The yield on average interest-earning assets decreased to 3.86% for the third quarter from 4.06% for the second quarter due to lower yields on most interest-earning asset classes and the change in the mix of interest-earning assets. The average yield on loans declined only 2 basis points to 4.46% during the third quarter as higher prepayment penalty fees and PPP fee income helped to offset the decreases in loan yields due to the mix of loans and lower interest rate environment. The third quarter includes $2.1 million of PPP fee income, which increased the net interest margin by 11 basis points, compared to $1.7 million in the second quarter which increased the net interest margin by 10 basis points. The average yield on securities decreased 69 basis points to 2.26% due mostly to a 106 basis point decrease in the collateralized loan obligations (CLOs) yield to 2.16% for the third quarter from 3.22% for the second quarter as these securities reprice quarterly.
The average cost of funds decreased 21 basis points to 0.82% for the third quarter from 1.03% for the second quarter. This decrease was driven by the lower average cost of interest-bearing liabilities and improved funding mix, including higher average noninterest-bearing deposits during the third quarter. We continue to reduce our reliance on high cost transaction accounts, non-brokered certificates of deposits, and wholesale funds as we continue to execute on our relationship-focused business banking strategy. The average cost of interest-bearing liabilities decreased 27 basis points to 1.02% for the third quarter from 1.29% for the second quarter due to actively managing down the cost of interest-bearing deposits into the current rate environment. The average cost of interest-bearing deposits declined 27 basis points to 0.66% for the third quarter from 0.93% for the prior quarter. Additionally, average noninterest-bearing deposits increased by $7.7 million and represented 22.9% of total average deposits in the third quarter compared to 23.4% of total average deposits for the second quarter. Our total cost of average deposits decreased 20 basis points to 0.51% for the third quarter. The spot rate of total deposits at the end of the third quarter of 2020 was 0.39%.
2
EX 99.1
YTD 2020 vs YTD 2019
Net interest income for the nine months ended September 30, 2020 decreased $28.5 million to $163.0 million from $191.5 million for the same 2019 period. Net interest income was impacted by the overall decrease in market interest rates between periods and lower average interest-earning assets, as a result of targeted sales of securities and loans during 2019, in line with our strategy of remixing the loan portfolio towards relationship-based lending, offset by a higher net interest margin. For the nine months ended September 30, 2020, average interest-earning assets declined $1.87 billion to $7.14 billion, and the net interest margin increased 21 basis points to 3.05% for the nine months ended September 30, 2020 compared to 2.84% for the same 2019 period.
Our average yield on interest-earning assets decreased 50 basis points to 4.06% for the nine months ended September 30, 2020 as compared to 4.56% during the same 2019 period. The decrease in yield was primarily attributable to lower average yields on the loan and securities portfolios. Our average yield on loans was 4.50% for the nine months ended September 30, 2020, compared to 4.77% for the same 2019 period, primarily due to lower market interest rates and a lower percentage of higher-yielding commercial and industrial balances in the portfolio. Our average yield on securities decreased 109 basis points due mostly to CLOs repricing into the lower rate environment and a decrease in average CLO balances.
The average cost of funds decreased to 1.08% for the nine months ended September 30, 2020 from 1.83% for the same 2019 period. This decrease was driven by the lower average cost of interest-bearing liabilities and the improved funding mix, including higher average noninterest-bearing deposits. The 74 basis point decline in the average cost of interest-bearing liabilities to 1.34% for the nine months ended September 30, 2020 from 2.08% for the same 2019 period was driven by the lower average cost of interest-bearing deposits as they reprice into the lower interest rate environment and the lower average cost of FHLB term advances resulting from maturities and early repayments during the year and as a result of the refinancing of advances during the second quarter of 2020. The average cost of interest-bearing deposits declined 89 basis points to 0.98% from the prior period due to actively managing down deposit rates in response to the interest rate cuts by the Federal Reserve in March of 2020 and a lower reliance on brokered deposits. Additionally, average noninterest-bearing deposits increased by $245.8 million when compared to the same 2019 period. Our cost of average total deposits decreased 83 basis points to 0.76% for the nine months ended September 30, 2020 when compared to the same 2019 period.
Provision for credit losses
Q3-2020 vs Q2-2020
The provision for credit losses totaled $1.1 million for the third quarter, compared to $11.8 million for the second quarter. The third quarter provision for credit losses is comprised of $0.9 million in general reserves and $1.2 million related to specific reserves, offset by provision release of $1.0 million related to unfunded commitments. The general provision is due to changes in key macro-economic forecast variables, such as unemployment and gross domestic product, improved credit quality metrics, and higher period end loan balances of $50.3 million.
YTD 2020 vs YTD 2019
During the nine months ended September 30, 2020, the provision for credit losses totaled $28.7 million under the CECL model, compared to $38.8 million under the incurred loss model during 2019. The lower provision for credit losses was primarily the result of lower net charge-offs and lower period end loan balances of $705.3 million, offset by increases from using the new CECL model, the estimated future impact of the health crisis on our loans, and higher specific reserves.
Noninterest income
Q3-2020 vs Q2-2020
Noninterest income decreased $1.6 million, or 28%, to $4.0 million for the third quarter due mostly to lower gains on sale of securities. The second quarter of 2020 included a $2.0 million gain on the sale of $20.7 million in securities; there were no sales of securities in the third quarter. The third quarter included a $0.3 million gain on sale of $17.8 million in single-family residential mortgage loans held for sale; there were no sales of loans during second quarter of 2020.
YTD 2020 vs YTD 2019
Noninterest income for the nine months ended September 30, 2020 increased $4.4 million, or 60.6%, to $11.5 million compared to the prior year. The increase was primarily attributable to (i) higher net gain on sale of investment securities of $6.9 million, and (ii) higher other income of $7.4 million as the third quarter of 2019 included a previously reported $9.6 million realized loss from interest rate swap agreements entered into in order to offset variability in the fair value of the Freddie Mac
3
EX 99.1
securitization completed during the third quarter of 2019. These increases were partially offset by (i) lower net gain on sale of loans of $8.4 million as the third quarter of 2019 included a $9.0 million realized gain from the aforementioned securitization, (ii) a $1.6 million loss due to decreases in the fair value of loans held for sale, and (iii) lower customer fees of $0.7 million.
Noninterest expense
Q3-2020 vs Q2-2020
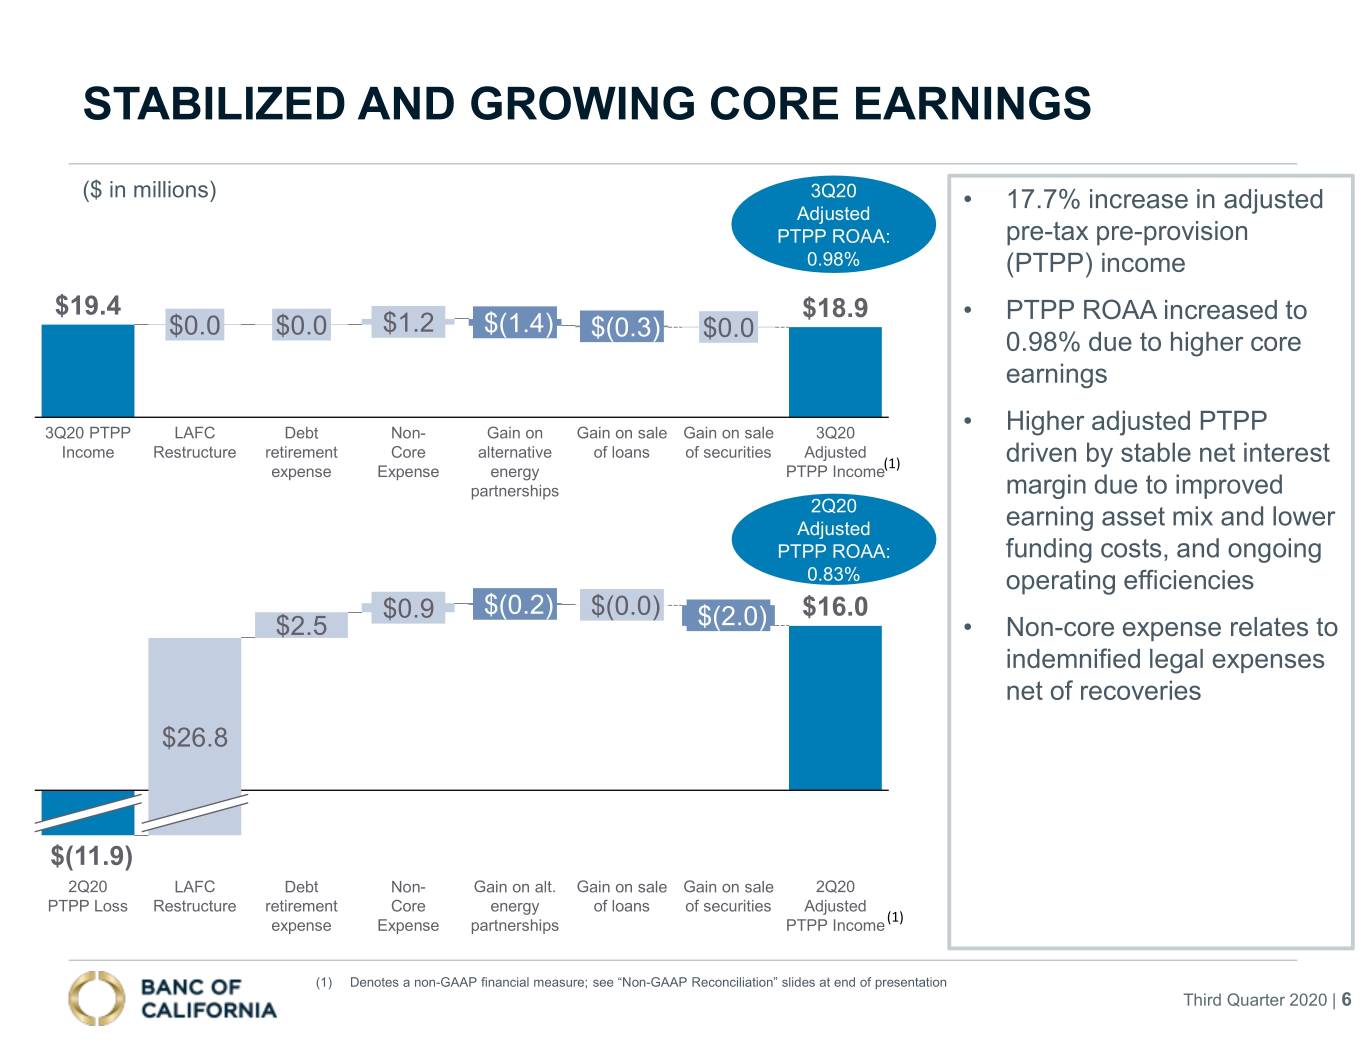
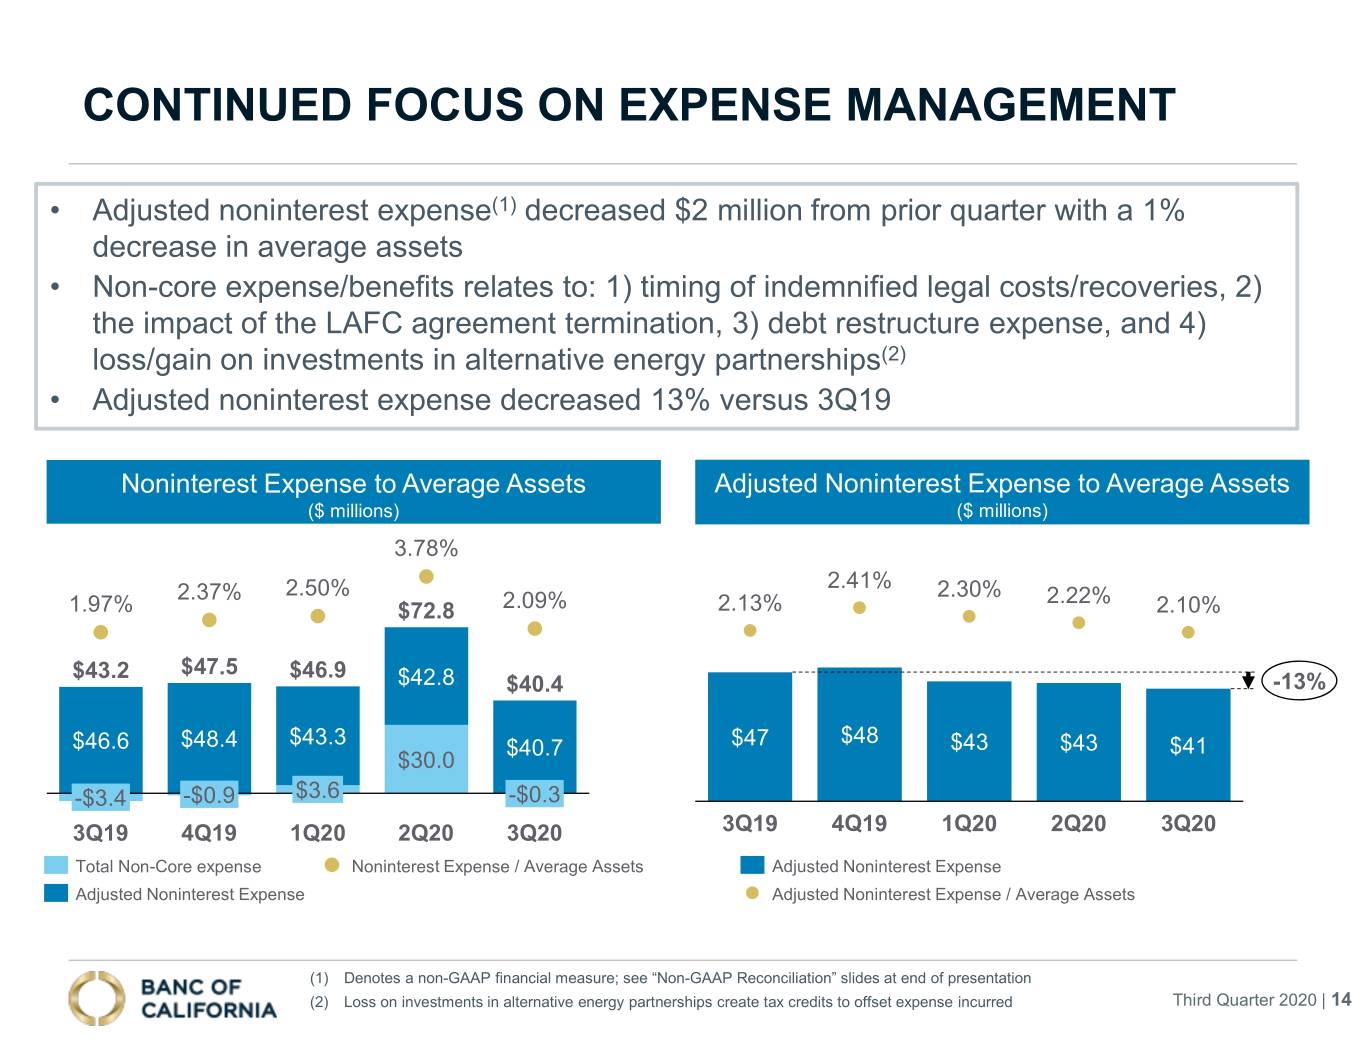
Noninterest expense decreased $32.4 million to $40.4 million for the third quarter compared to the prior quarter. The decrease was primarily due to the second quarter of 2020 including a $26.8 million charge related to the termination of the LAFC naming rights agreements and a $2.5 million debt extinguishment fee, included in all other expenses, associated with the early repayment of certain FHLB term advances. There were no similar expenses during the third quarter. In addition, noninterest expense decreased during the quarter due to (i) lower salaries and benefits expense of $1.0 million due mostly to lower incentive accruals, (ii) a larger gain on investments in alternative energy partnerships of $1.3 million, and (iii) lower advertising costs of $0.9 million due to the termination of the LAFC naming rights agreements. These decreases were partially offset by higher professional fees of $0.6 million. Total operating costs, defined as noninterest expense adjusted for certain non-core items (refer to section Non-GAAP Measures), decreased $2.1 million to $40.7 million for the third quarter compared to $42.8 million for the prior quarter.
YTD 2020 vs YTD 2019
Noninterest expense for the nine months ended September 30, 2020 increased $11.1 million, or 7.4%, to $160.1 million compared to the prior year. The increase was primarily due to: (i) the aforementioned $26.8 million one-time charge related to the termination of our LAFC naming rights agreements, (ii) a $2.5 million debt extinguishment fee, included in all other expenses, associated with the early repayment of certain FHLB term advances, and (iii) higher professional fees of $6.1 million, due to overall reductions in recoveries of $18.4 million related to indemnified legal fees for resolved legal proceedings and various other litigations. These increases were offset by: (i) $4.0 million in lower consulting fees for bank projects and initiatives, (ii) lower salaries and benefits expense of $10.9 million resulting from lower headcount, (iii) lower advertising costs of $3.1 million due to the termination of our LAFC naming rights agreements and reductions in overall events and media spending, and (iv) lower regulatory assessments of $3.9 million due to changes in our asset size and an FDIC assessment credit.
Income taxes
Q3-2020 vs Q2-2020
Income tax expense totaled $2.4 million for the third quarter resulting in an effective tax rate of 12.9% compared to a $5.3 million benefit for the second quarter resulting in an effective tax rate of 22.3%. Based on our actual and projected level of earnings and permanent tax differences for 2020, our estimated effective tax rate for the full year was refined this quarter to a negative tax rate ranging from approximately 10% to 15%. As a result of the change, we expect our fourth quarter effective tax rate to be approximately 25%.
YTD 2020 vs YTD 2019
Income tax benefit totaled $5.1 million for the nine months ended September 30, 2020, representing an effective tax rate of 35.9%, compared to a $1.4 million expense and an effective tax rate of 12.9% for nine months ended September 30, 2019.
4
EX 99.1
Balance Sheet
At September 30, 2020, total assets were $7.74 billion, which represented a linked-quarter decrease of $32.0 million. The following table shows selected balance sheet line items as of the dates indicated.
| As of and for the Three Months Ended | Amount Change | ||||||||||||||||||||||||||||||||||||||||
| September 30, 2020 | June 30, 2020 | March 31, 2020 | December 31, 2019 | September 30, 2019 | Q3-20 vs. Q2-20 | Q3-20 vs. Q3-19 | |||||||||||||||||||||||||||||||||||
| ($ in thousands) | |||||||||||||||||||||||||||||||||||||||||
| Total assets | $ | 7,738,106 | $ | 7,770,138 | $ | 7,662,607 | $ | 7,828,410 | $ | 8,625,337 | $ | (32,032) | $ | (887,231) | |||||||||||||||||||||||||||
| Securities available-for-sale | $ | 1,245,867 | $ | 1,176,029 | $ | 969,427 | $ | 912,580 | $ | 775,662 | $ | 69,838 | $ | 470,205 | |||||||||||||||||||||||||||
| Loans held-for-investment | $ | 5,678,002 | $ | 5,627,696 | $ | 5,667,464 | $ | 5,951,885 | $ | 6,383,259 | $ | 50,306 | $ | (705,257) | |||||||||||||||||||||||||||
| Loans held-for-sale | $ | 1,849 | $ | 19,768 | $ | 20,234 | $ | 22,642 | $ | 23,936 | $ | (17,919) | $ | (22,087) | |||||||||||||||||||||||||||
| Demand deposits | $ | 3,495,859 | $ | 3,238,202 | $ | 2,828,470 | $ | 2,622,398 | $ | 2,602,011 | $ | 257,657 | $ | 893,848 | |||||||||||||||||||||||||||
| Other core deposits | 2,446,593 | 2,619,502 | 2,515,703 | 2,794,769 | 3,074,936 | (172,909) | (628,343) | ||||||||||||||||||||||||||||||||||
| Brokered deposits | 89,814 | 179,761 | 218,665 | 10,000 | 93,111 | (89,947) | (3,297) | ||||||||||||||||||||||||||||||||||
| Total Deposits | $ | 6,032,266 | $ | 6,037,465 | $ | 5,562,838 | $ | 5,427,167 | $ | 5,770,058 | $ | (5,199) | $ | 262,208 | |||||||||||||||||||||||||||
| As percentage of total deposits | |||||||||||||||||||||||||||||||||||||||||
| Demand deposits | 57.95 | % | 53.64 | % | 50.85 | % | 48.32 | % | 45.10 | % | 4.31 | % | 12.85 | % | |||||||||||||||||||||||||||
| Other core deposits | 40.56 | % | 43.39 | % | 45.22 | % | 51.50 | % | 53.29 | % | (2.83) | % | (12.73) | % | |||||||||||||||||||||||||||
| Brokered deposits | 1.49 | % | 2.98 | % | 3.93 | % | 0.18 | % | 1.61 | % | (1.49) | % | (0.12) | % | |||||||||||||||||||||||||||
| Average loan yield | 4.46 | % | 4.48 | % | 4.56 | % | 4.71 | % | 4.75 | % | (0.02) | % | (0.29) | % | |||||||||||||||||||||||||||
| Average cost of interest-bearing deposits | 0.66 | % | 0.93 | % | 1.41 | % | 1.57 | % | 1.78 | % | (0.27) | % | (1.12) | % | |||||||||||||||||||||||||||
| Average cost of total deposits | 0.51 | % | 0.71 | % | 1.11 | % | 1.27 | % | 1.48 | % | (0.20) | % | (0.97) | % | |||||||||||||||||||||||||||
Investments
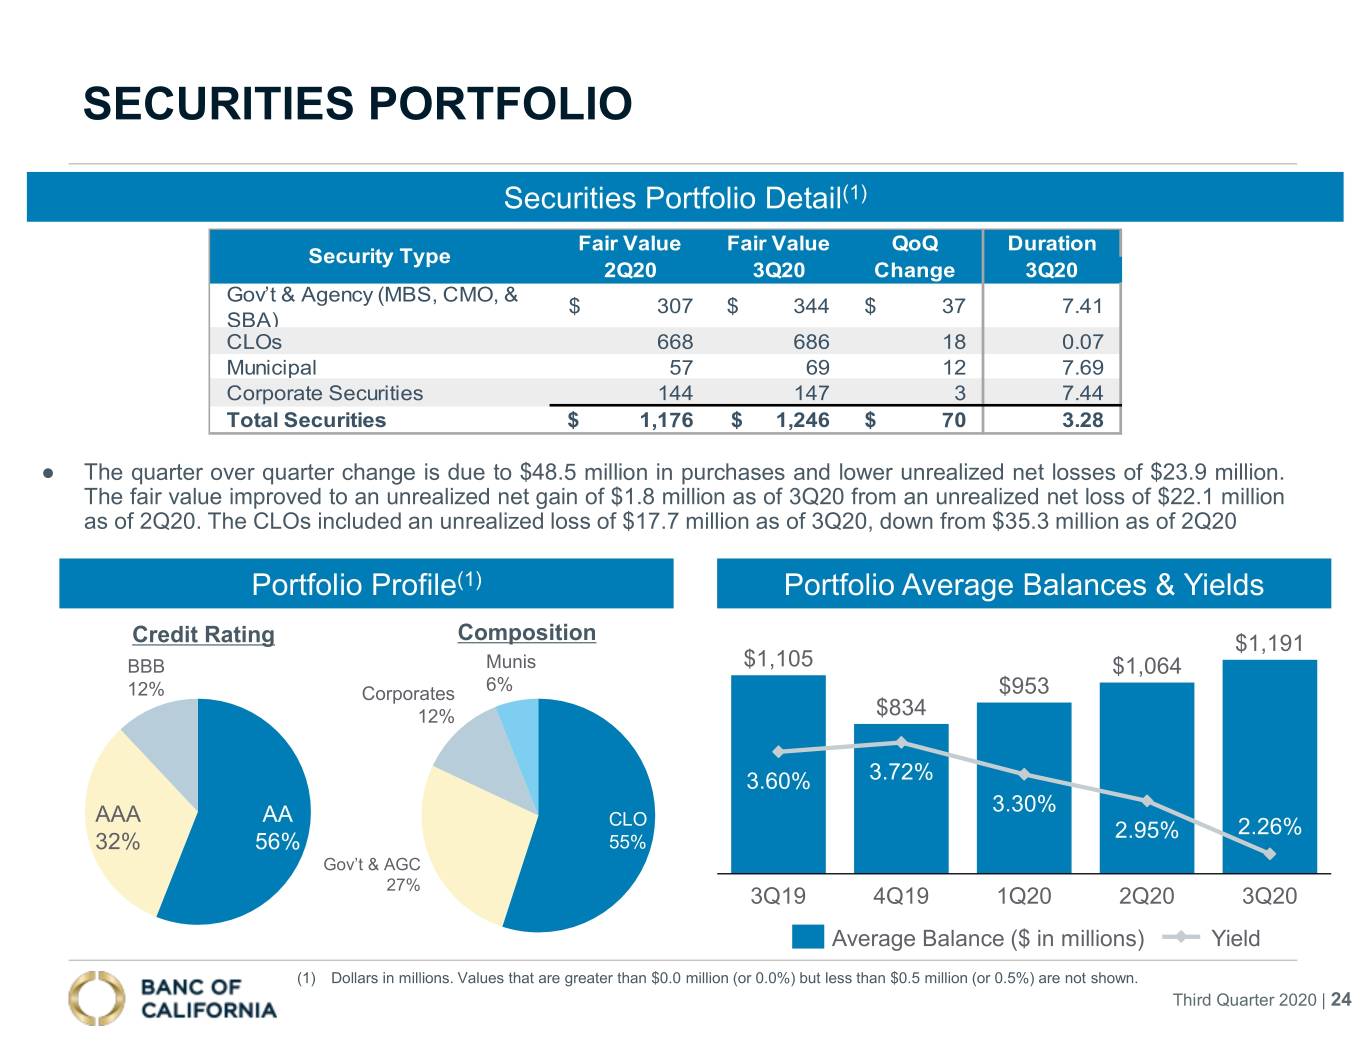
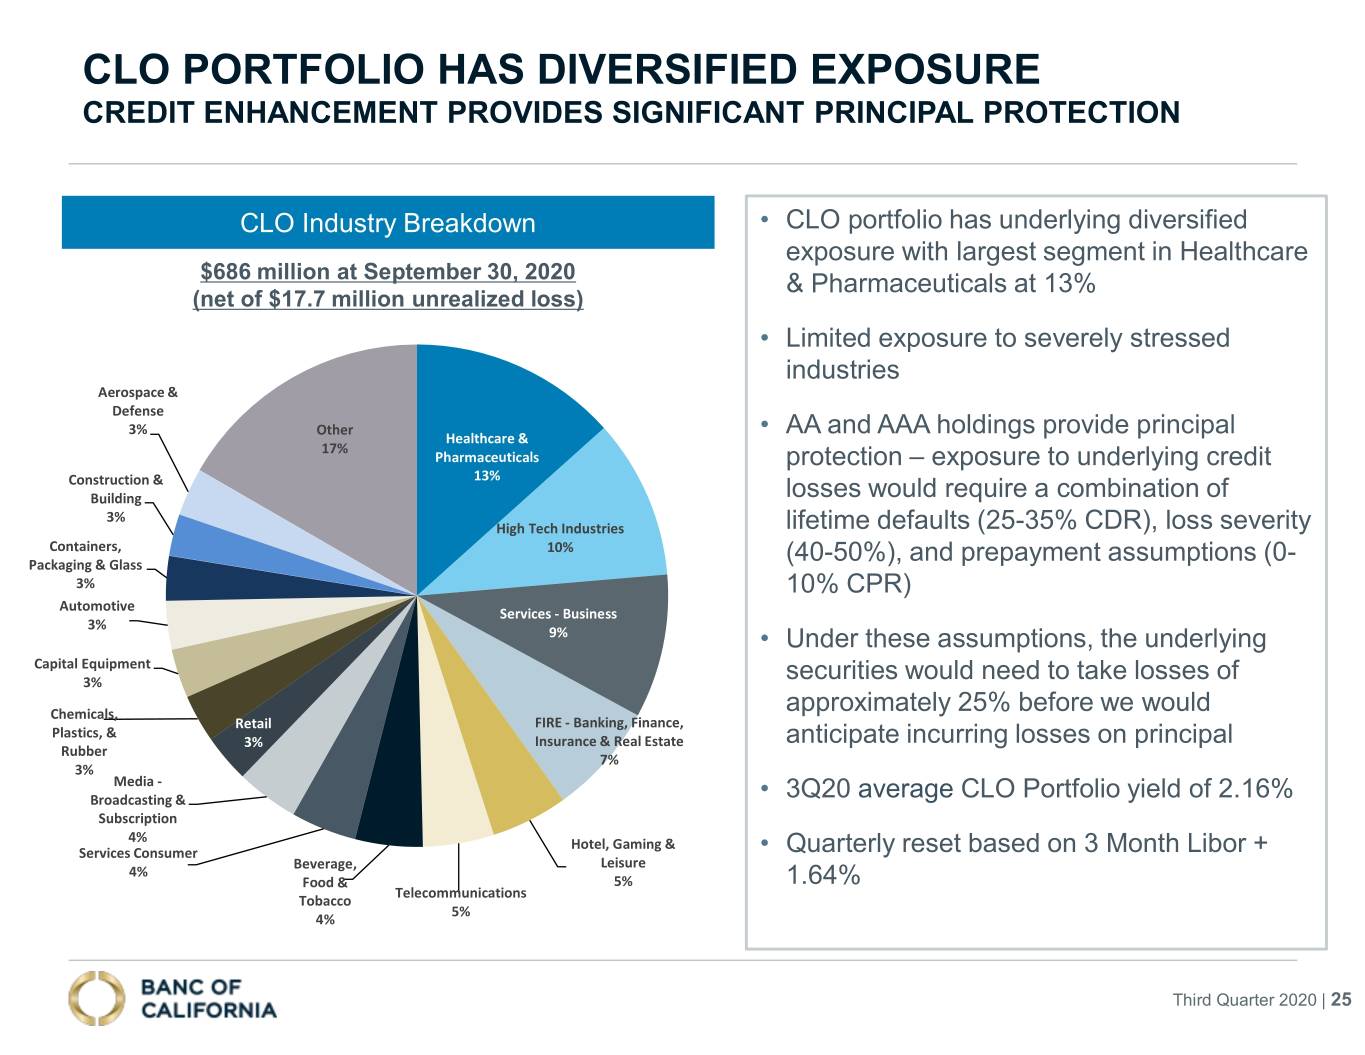
Securities available-for-sale increased $69.8 million to $1.25 billion at September 30, 2020 due to purchases of $48.5 million and lower unrealized net losses of $23.9 million. The decrease in the unrealized net losses was due mostly to credit spreads tightening during the quarter for a positive change on the pricing of the CLOs and corporate debt securities. Securities purchased included municipal bonds, government agency securities and floating rate SBA pool securities. There were no sales of securities during the third quarter. As of September 30, 2020, our securities portfolio included $685.9 million of CLOs, $325.8 million of agency securities, $69.2 million of municipal securities, $146.9 million of corporate debt securities, and $17.8 million of SBA pool securities. The CLO portfolio, which is comprised only of AA and AAA rated securities, represented 55.1% of the total securities portfolio and the carrying value included an unrealized net loss of $17.7 million at September 30, 2020 compared to an unrealized net loss of $35.3 million at June 30, 2020.
5
EX 99.1
Loans
The following table sets forth the composition, by loan category, of our loan portfolio as of the dates indicated:
| September 30, 2020 | June 30, 2020 | March 31, 2020 | December 31, 2019 | September 30, 2019 | |||||||||||||||||||||||||
| ($ in thousands) | |||||||||||||||||||||||||||||
| Composition of held-for-investment loans | |||||||||||||||||||||||||||||
| Commercial real estate | $ | 826,683 | $ | 822,694 | $ | 810,024 | $ | 818,817 | $ | 891,029 | |||||||||||||||||||
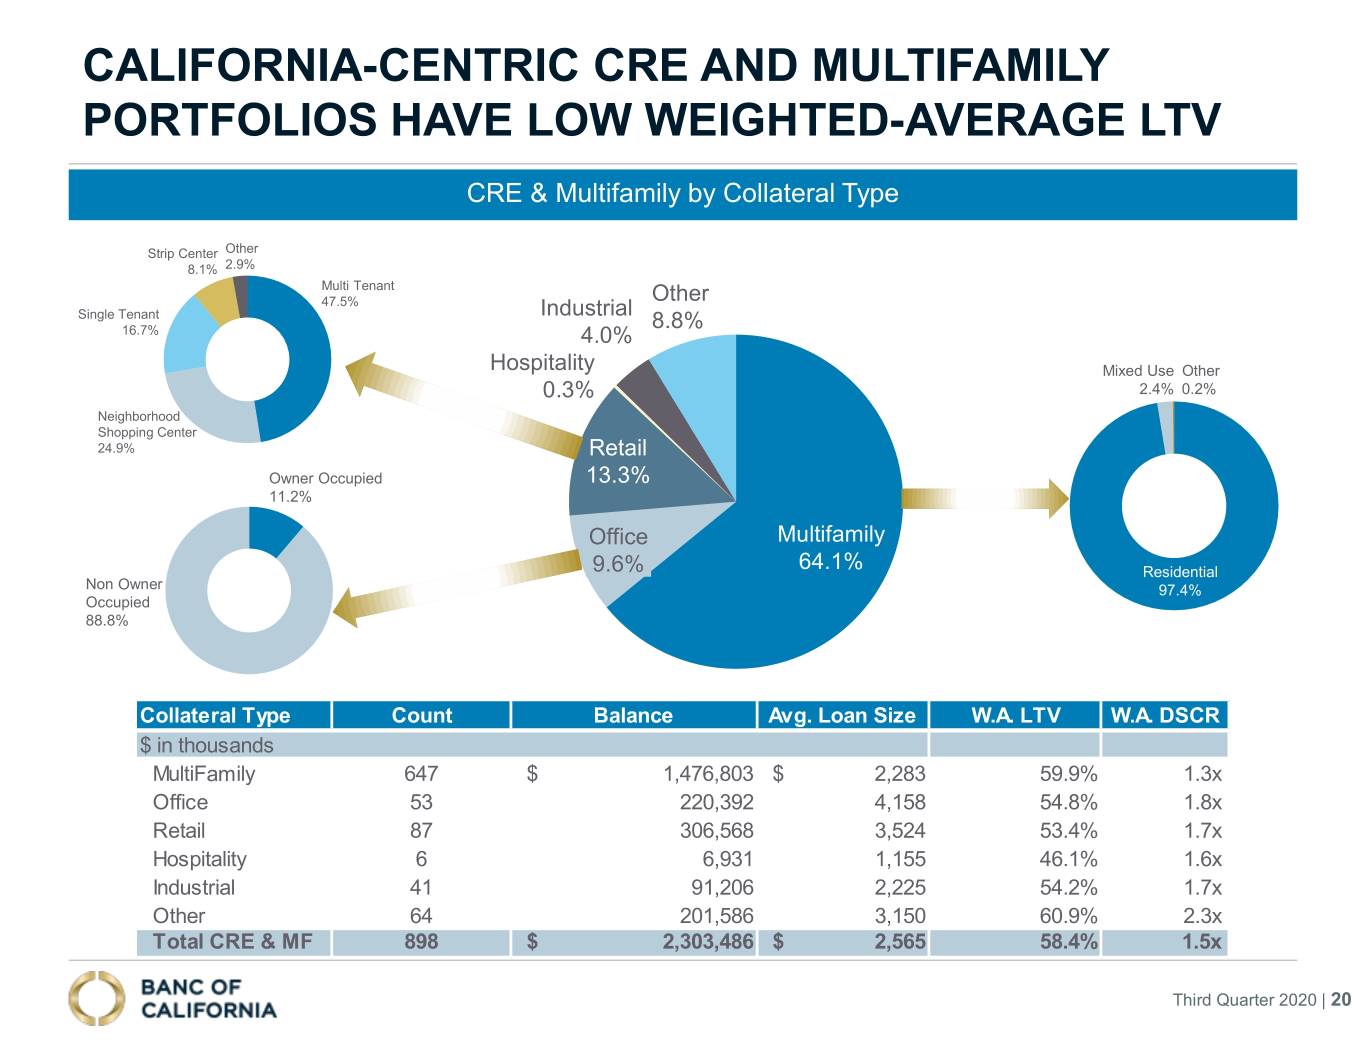
| Multifamily | 1,476,803 | 1,434,071 | 1,466,083 | 1,494,528 | 1,563,757 | ||||||||||||||||||||||||
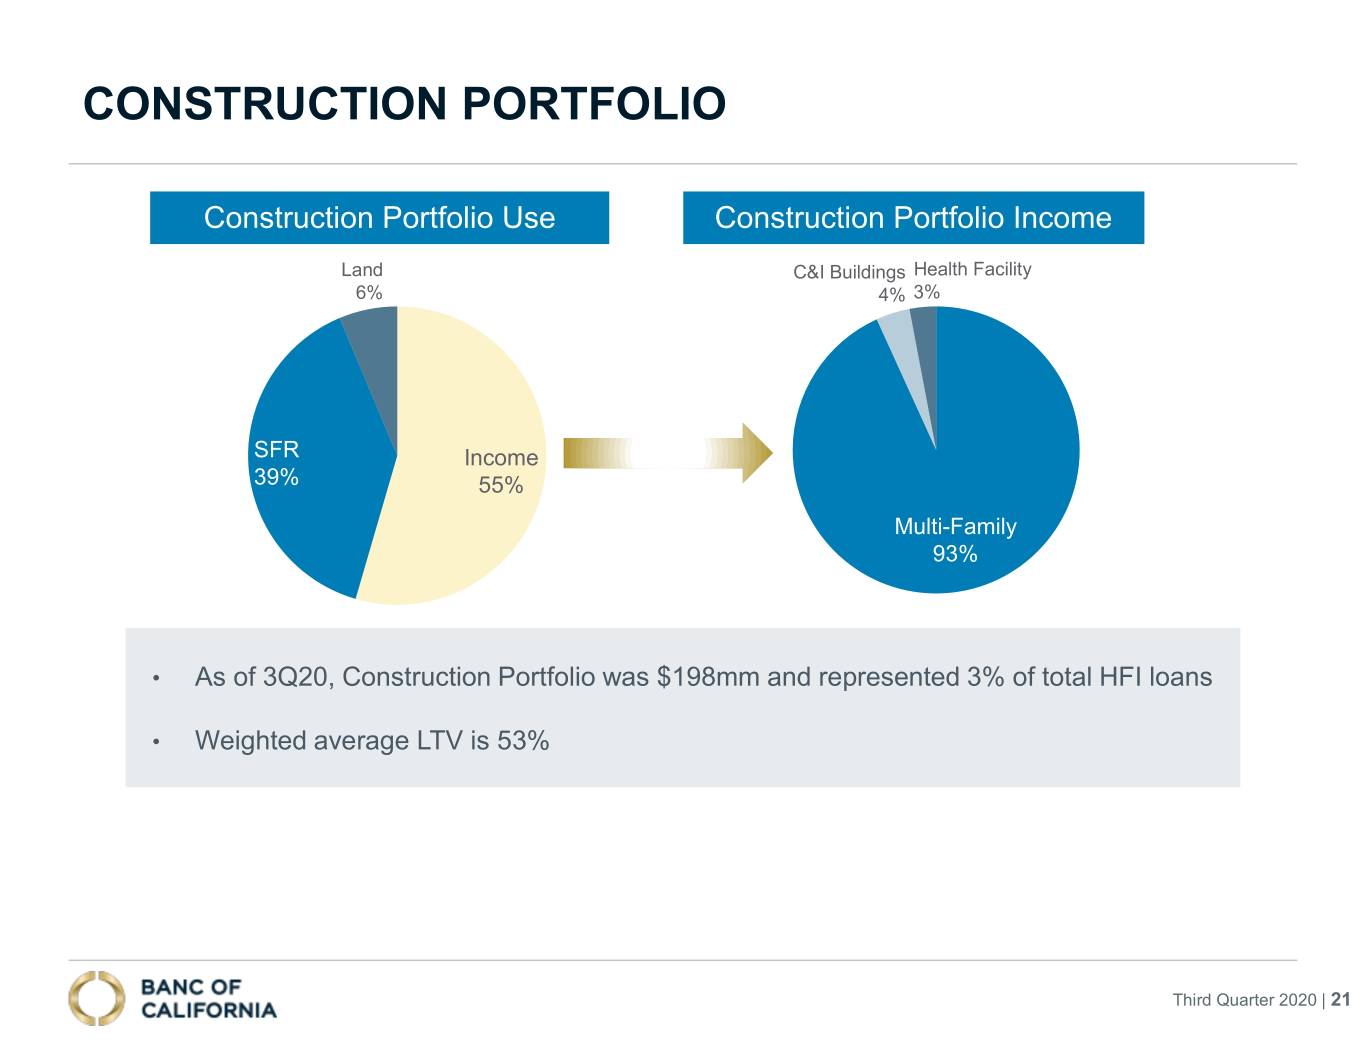
| Construction | 197,629 | 212,979 | 227,947 | 231,350 | 228,561 | ||||||||||||||||||||||||
| Commercial and industrial | 1,586,824 | 1,436,990 | 1,578,223 | 1,691,270 | 1,789,478 | ||||||||||||||||||||||||
| SBA | 320,573 | 310,784 | 70,583 | 70,981 | 75,359 | ||||||||||||||||||||||||
| Total commercial loans | 4,408,512 | 4,217,518 | 4,152,860 | 4,306,946 | 4,548,184 | ||||||||||||||||||||||||
| Single-family residential mortgage | 1,234,479 | 1,370,785 | 1,467,375 | 1,590,774 | 1,775,953 | ||||||||||||||||||||||||
| Other consumer | 35,011 | 39,393 | 47,229 | 54,165 | 59,122 | ||||||||||||||||||||||||
| Total consumer loans | 1,269,490 | 1,410,178 | 1,514,604 | 1,644,939 | 1,835,075 | ||||||||||||||||||||||||
| Total gross loans | $ | 5,678,002 | $ | 5,627,696 | $ | 5,667,464 | $ | 5,951,885 | $ | 6,383,259 | |||||||||||||||||||
| Composition percentage of held-for-investment loans | |||||||||||||||||||||||||||||
| Commercial real estate | 14.6 | % | 14.6 | % | 14.3 | % | 13.8 | % | 14.0 | % | |||||||||||||||||||
| Multifamily | 26.0 | % | 25.5 | % | 25.9 | % | 25.1 | % | 24.5 | % | |||||||||||||||||||
| Construction | 3.5 | % | 3.8 | % | 4.0 | % | 3.9 | % | 3.6 | % | |||||||||||||||||||
| Commercial and industrial | 28.0 | % | 25.5 | % | 27.9 | % | 28.4 | % | 28.0 | % | |||||||||||||||||||
| SBA | 5.6 | % | 5.5 | % | 1.2 | % | 1.2 | % | 1.2 | % | |||||||||||||||||||
| Total commercial loans | 77.7 | % | 74.9 | % | 73.3 | % | 72.4 | % | 71.3 | % | |||||||||||||||||||
| Single-family residential mortgage | 21.7 | % | 24.4 | % | 25.9 | % | 26.7 | % | 27.8 | % | |||||||||||||||||||
| Other consumer | 0.6 | % | 0.7 | % | 0.8 | % | 0.9 | % | 0.9 | % | |||||||||||||||||||
| Total consumer loans | 22.3 | % | 25.1 | % | 26.7 | % | 27.6 | % | 28.7 | % | |||||||||||||||||||
| Total gross loans | 100.0 | % | 100.0 | % | 100.0 | % | 100.0 | % | 100.0 | % | |||||||||||||||||||
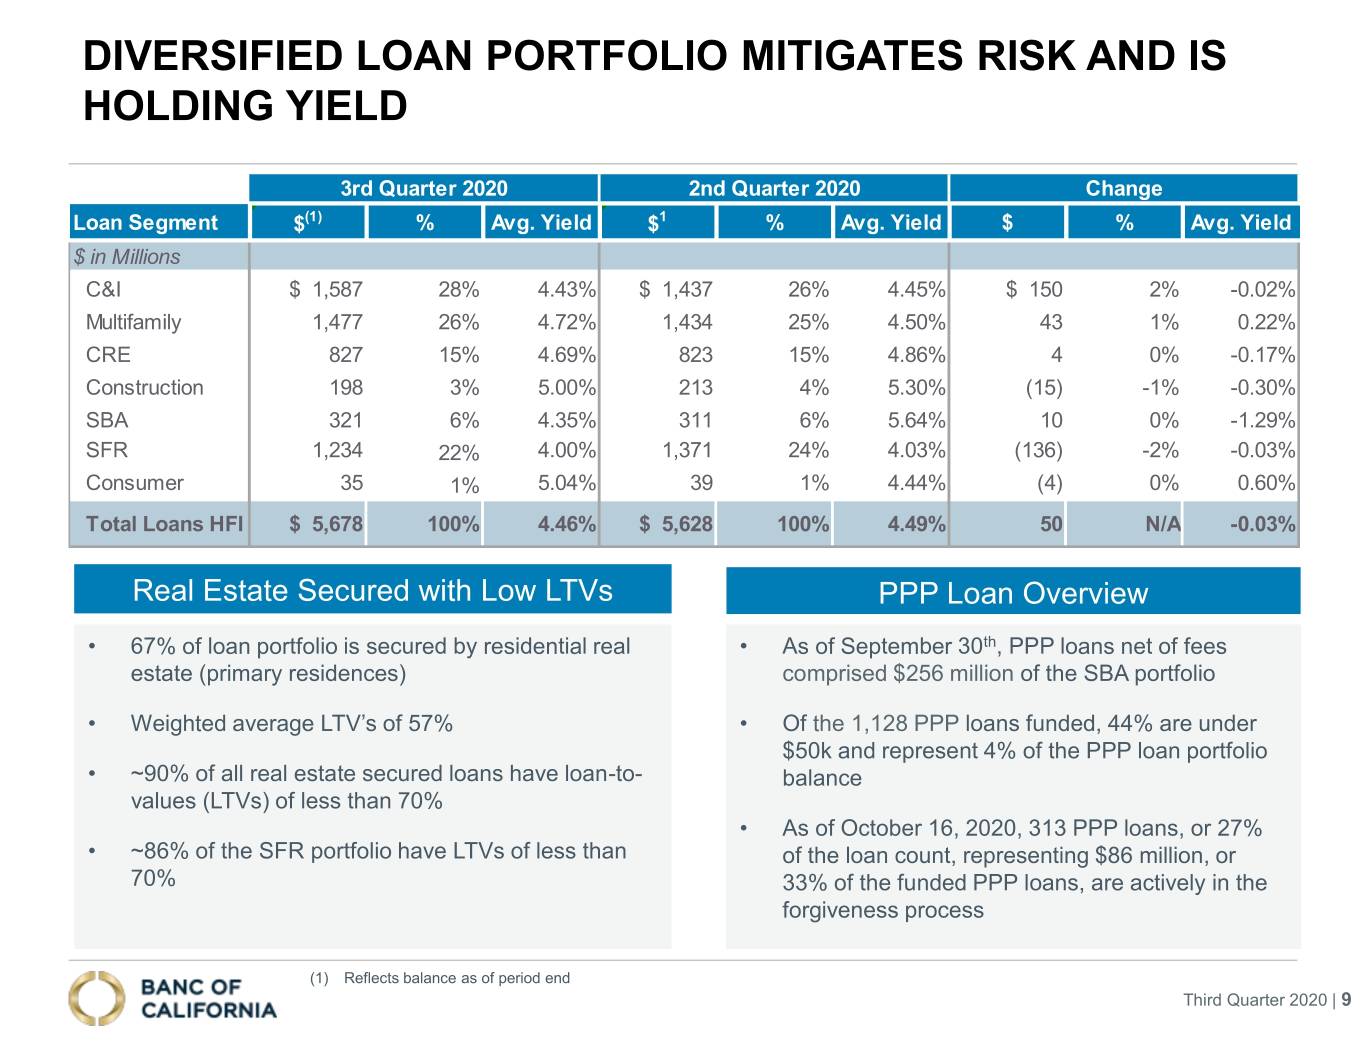
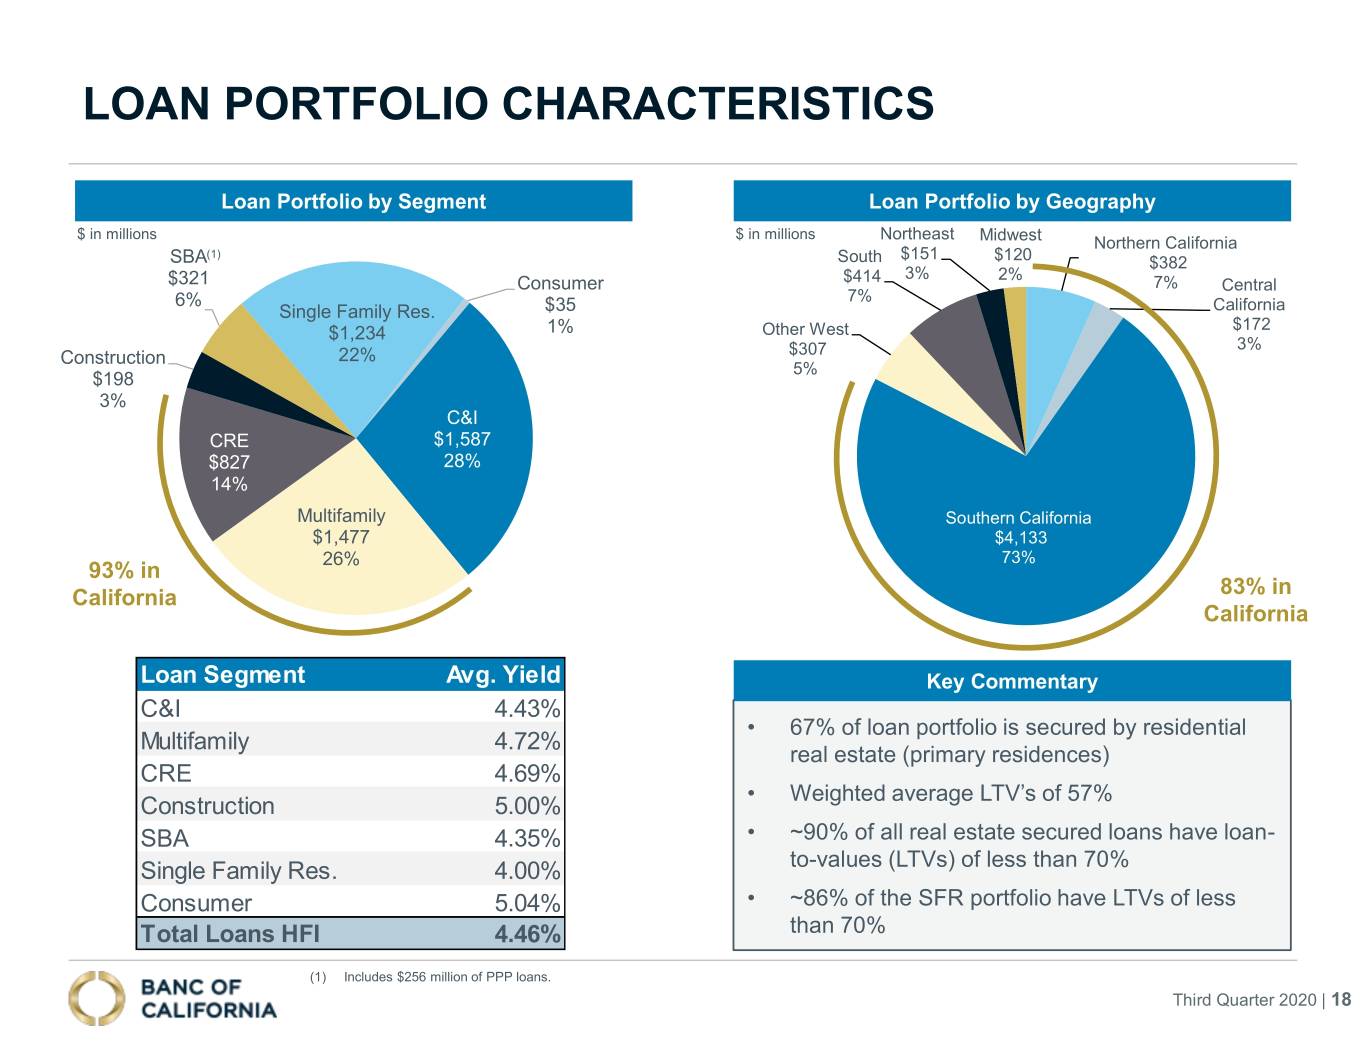
Held-for-investment loans increased $50.3 million to $5.68 billion from the prior quarter, resulting from higher commercial and industrial (C&I) loans of $149.8 million due, in part, to increased utilization of credit facilities, and higher multifamily loans of $42.7 million. These increases were offset partially by lower single-family residential mortgage loans of $136.3 million and construction loans of $15.4 million. The decline in single-family residential is attributed to payoffs as the loans refinance away in the lower rate environment. The decline in construction loans is attributed to general fluctuations in volume and certain payoffs. At September 30, 2020, SBA loans included $255.8 million of PPP loans, net of fees.
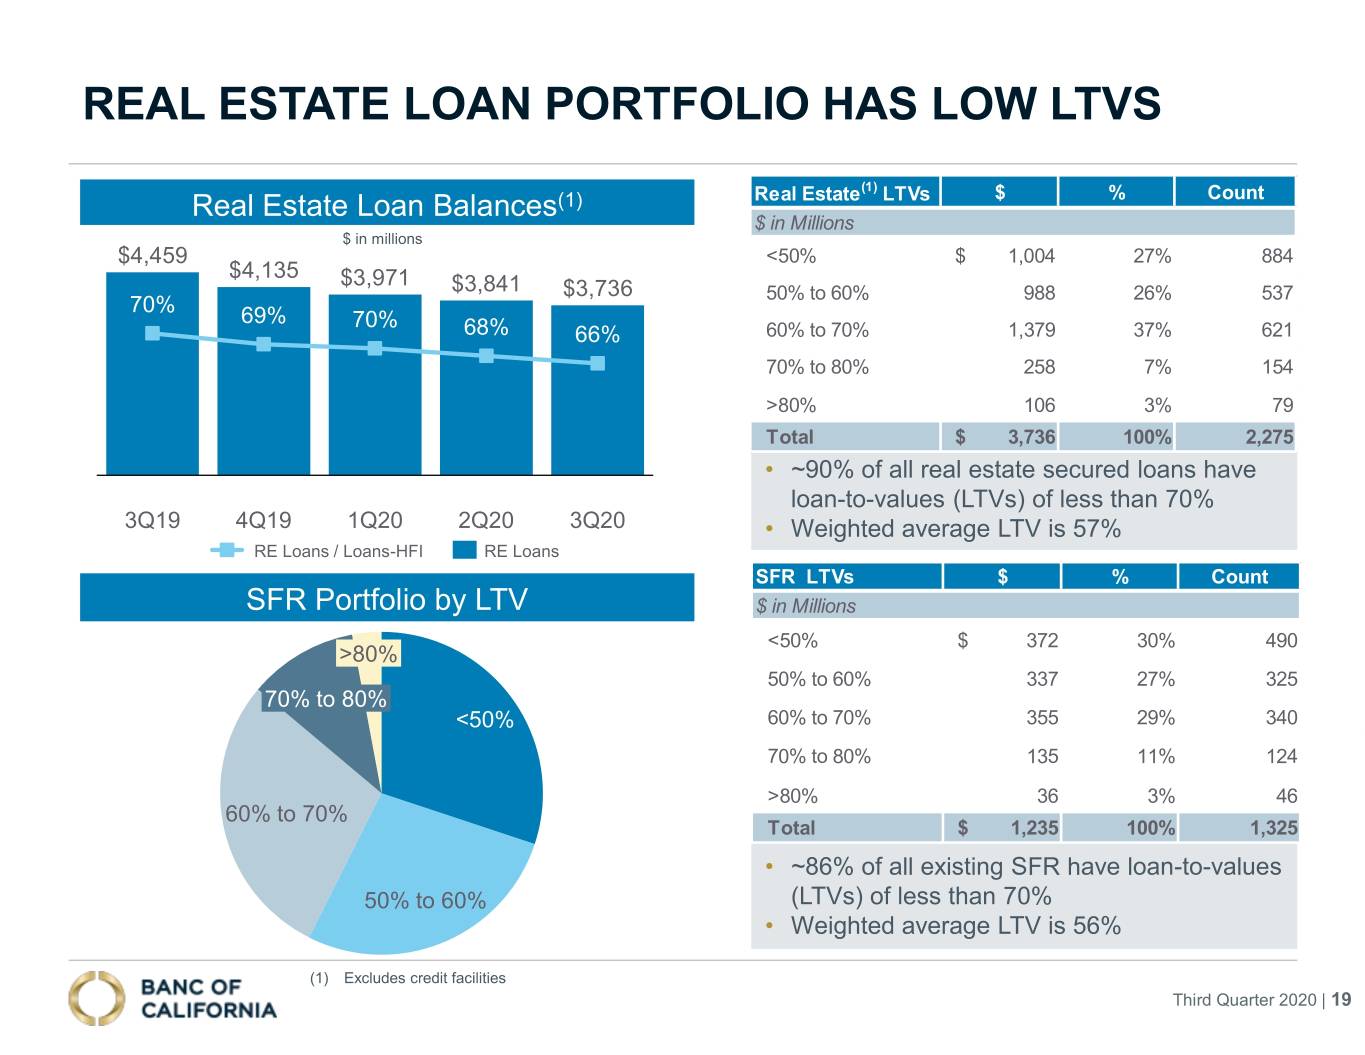
We continue to focus the real estate loan portfolio toward relationship-based multifamily, bridge, light infill construction, and commercial real estate loans. Currently, loans secured by residential real estate (single-family, multifamily, single-family construction, and warehouse credit facilities) represent approximately 67% of our total loans outstanding.
6
EX 99.1
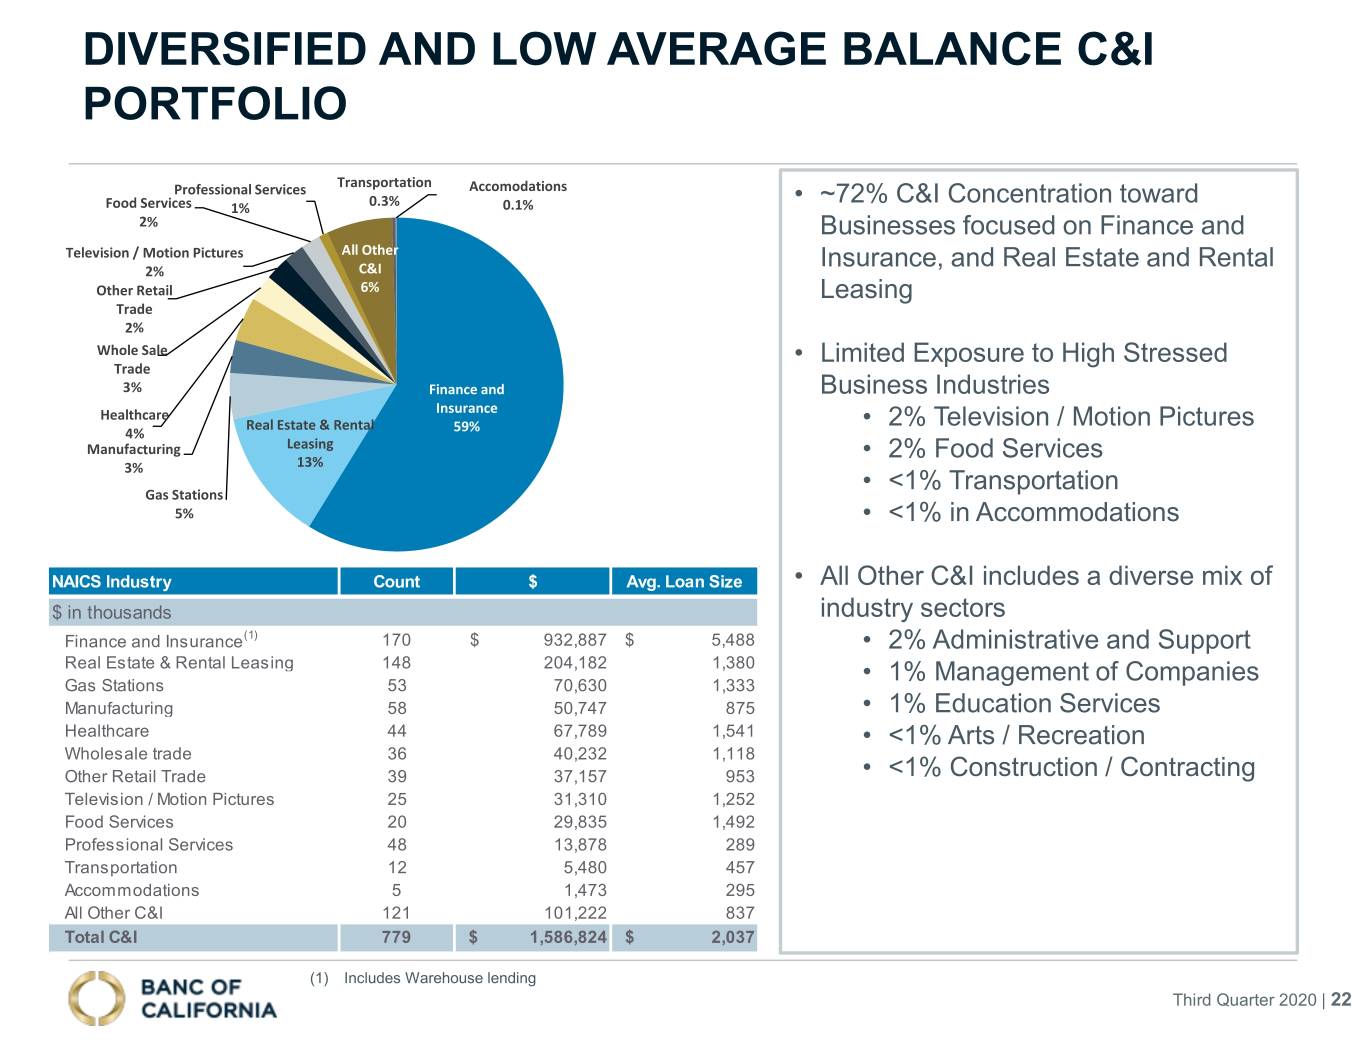
The C&I portfolio has limited exposure to certain business sectors undergoing severe stress. The C&I industry concentrations in dollars and as a percentage of total outstanding C&I loan balances are summarized below:
| September 30, 2020 | |||||||||||
| Amount | % of Portfolio | ||||||||||
| ($ in thousands) | |||||||||||
| C&I Portfolio by Industry | |||||||||||
| Finance and insurance (includes Warehouse lending) | $ | 932,887 | 59 | % | |||||||
| Real estate and rental leasing | 204,182 | 13 | % | ||||||||
| Gas stations | 70,630 | 4 | % | ||||||||
| Manufacturing | 50,747 | 3 | % | ||||||||
| Healthcare | 67,789 | 4 | % | ||||||||
| Wholesale trade | 40,232 | 3 | % | ||||||||
| Other retail trade | 37,157 | 2 | % | ||||||||
| Television/motion pictures | 31,310 | 2 | % | ||||||||
| Food services | 29,835 | 2 | % | ||||||||
| Professional services | 13,878 | 1 | % | ||||||||
| Transportation | 5,480 | — | % | ||||||||
| Accommodations | 1,473 | — | % | ||||||||
| All other | 101,224 | 6 | % | ||||||||
| Total | $ | 1,586,824 | 100 | % | |||||||
Deposits
The following table sets forth the composition of our deposits at the dates indicated.
| September 30, 2020 | June 30, 2020 | March 31, 2020 | December 31, 2019 | September 30, 2019 | |||||||||||||||||||||||||
| ($ in thousands) | |||||||||||||||||||||||||||||
| Composition of deposits | |||||||||||||||||||||||||||||
| Noninterest-bearing checking | $ | 1,450,744 | $ | 1,391,504 | $ | 1,256,081 | $ | 1,088,516 | $ | 1,107,442 | |||||||||||||||||||
| Interest-bearing checking | 2,045,115 | 1,846,698 | 1,572,389 | 1,533,882 | 1,503,208 | ||||||||||||||||||||||||
| Money market | 689,769 | 765,854 | 575,820 | 715,479 | 695,530 | ||||||||||||||||||||||||
| Savings | 946,293 | 939,018 | 877,947 | 885,246 | 1,042,162 | ||||||||||||||||||||||||
| Non-brokered certificates of deposit | 820,531 | 924,630 | 1,071,936 | 1,204,044 | 1,367,284 | ||||||||||||||||||||||||
| Brokered certificates of deposit | 79,814 | 169,761 | 208,665 | — | 54,432 | ||||||||||||||||||||||||
| Total deposits | $ | 6,032,266 | $ | 6,037,465 | $ | 5,562,838 | $ | 5,427,167 | $ | 5,770,058 | |||||||||||||||||||
| Composition percentage of deposits | |||||||||||||||||||||||||||||
| Noninterest-bearing checking | 24.1 | % | 23.0 | % | 22.6 | % | 20.1 | % | 19.2 | % | |||||||||||||||||||
| Interest-bearing checking | 33.9 | % | 30.6 | % | 28.3 | % | 28.2 | % | 26.1 | % | |||||||||||||||||||
| Money market | 11.4 | % | 12.7 | % | 10.3 | % | 13.2 | % | 12.0 | % | |||||||||||||||||||
| Savings | 15.7 | % | 15.6 | % | 15.8 | % | 16.3 | % | 18.1 | % | |||||||||||||||||||
| Non-brokered certificates of deposit | 13.6 | % | 15.3 | % | 19.3 | % | 22.2 | % | 23.7 | % | |||||||||||||||||||
| Brokered certificates of deposit | 1.3 | % | 2.8 | % | 3.7 | % | — | % | 0.9 | % | |||||||||||||||||||
| Total deposits | 100.0 | % | 100.0 | % | 100.0 | % | 100.0 | % | 100.0 | % | |||||||||||||||||||
Total deposits decreased $5.2 million during the third quarter of 2020 to $6.03 billion due to lower brokered certificates of deposit of $89.9 million, non-brokered certificates of deposit of $104.1 million, and money market balances of $76.1 million, offset by higher noninterest-bearing checking balances of $59.2 million, interest-bearing checking of $198.4 million, and savings balances of $7.3 million. We continue to focus on growing relationship-based deposits, strategically augmented by wholesale funding, as we proactively reduce our deposit costs in response to the interest rate cuts by the Federal Reserve in March of 2020. Noninterest-bearing deposits totaled $1.45 billion and represented 24.1% of total deposits at September 30,
7
EX 99.1
2020 compared to $1.39 billion, or 23.0% of total deposits, at June 30, 2020 and $1.11 billion, or 19.2% of total deposits, one year ago.
Debt
Advances from the FHLB decreased $57.7 million, or 9%, to $559.5 million, as of September 30, 2020, due to maturities of $58.0 million. At the end of the third quarter, FHLB advances included no overnight borrowings, $105.0 million maturing within three months, and $461.0 million maturing beyond three months with a weighted average life of 4.7 years and weighted average interest rate of 2.51%.
Equity
At September 30, 2020, total stockholders’ equity increased by $27.3 million to $874.3 million and tangible common equity increased by $27.8 million to $649.3 million on a linked-quarter basis. The increase in total stockholders’ equity for the three months ended September 30, 2020, was a result of net income of $15.9 million and lower net accumulated other comprehensive loss of $16.8 million, offset by dividends to common and preferred stockholders of $6.6 million, and redemption of preferred stock of $0.2 million. Tangible book value per share increased to $12.92 as of September 30, 2020 from $12.37 at June 30, 2020.
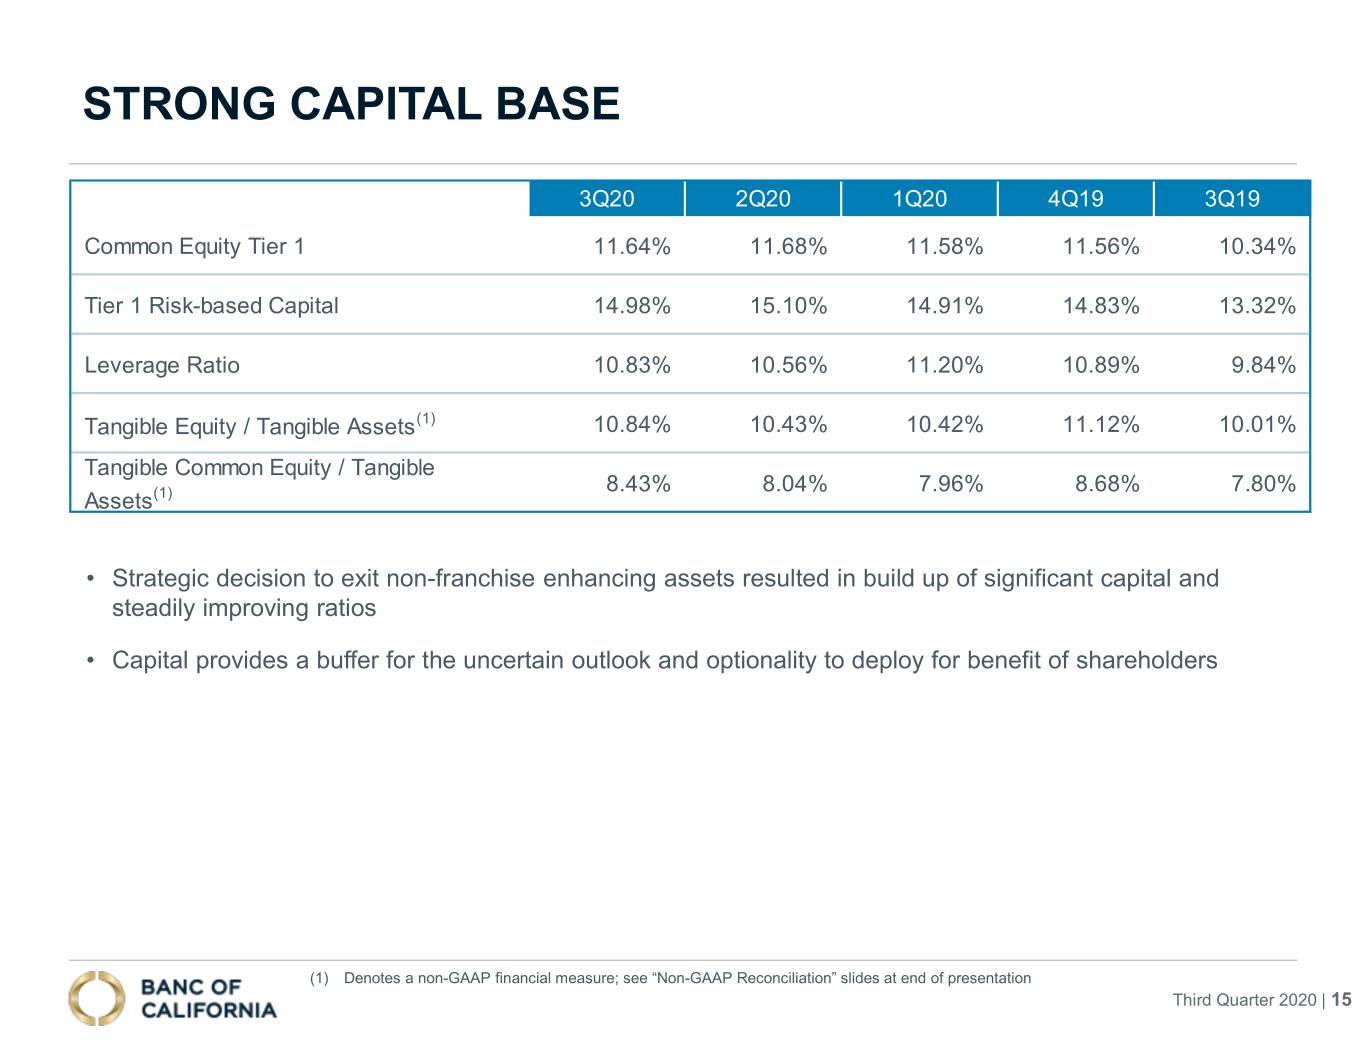
Capital ratios remain strong with total risk-based capital at 16.24% and a tier 1 leverage ratio of 10.83%. The following table sets forth our regulatory capital ratios at September 30, 2020 and the previous four quarters. The interim capital relief related to the adoption of CECL increased the Bank's leverage ratio approximately 12 basis points at September 30, 2020.
| September 30, 2020 | June 30, 2020 | March 31, 2020 | December 31, 2019 | September 30, 2019 | |||||||||||||||||||||||||
Capital Ratios(1) | |||||||||||||||||||||||||||||
| Banc of California, Inc. | |||||||||||||||||||||||||||||
| Total risk-based capital ratio | 16.24 | % | 16.35 | % | 16.16 | % | 15.90 | % | 14.37 | % | |||||||||||||||||||
| Tier 1 risk-based capital ratio | 14.98 | % | 15.10 | % | 14.91 | % | 14.83 | % | 13.32 | % | |||||||||||||||||||
| Common equity tier 1 capital ratio | 11.64 | % | 11.68 | % | 11.58 | % | 11.56 | % | 10.34 | % | |||||||||||||||||||
| Tier 1 leverage ratio | 10.83 | % | 10.56 | % | 11.20 | % | 10.89 | % | 9.84 | % | |||||||||||||||||||
| Banc of California, NA | |||||||||||||||||||||||||||||
| Total risk-based capital ratio | 18.20 | % | 18.17 | % | 18.21 | % | 17.46 | % | 15.65 | % | |||||||||||||||||||
| Tier 1 risk-based capital ratio | 16.94 | % | 16.92 | % | 16.96 | % | 16.39 | % | 14.60 | % | |||||||||||||||||||
| Common equity tier 1 capital ratio | 16.94 | % | 16.92 | % | 16.96 | % | 16.39 | % | 14.60 | % | |||||||||||||||||||
| Tier 1 leverage ratio | 12.24 | % | 11.84 | % | 12.67 | % | 12.02 | % | 10.75 | % | |||||||||||||||||||
(1)September 30, 2020 capital ratios are preliminary.
8
EX 99.1
Credit Quality
| September 30, 2020 | June 30, 2020 | March 31, 2020 | December 31, 2019 | September 30, 2019 | |||||||||||||||||||||||||
| Asset quality information and ratios | ($ in thousands) | ||||||||||||||||||||||||||||
| Delinquent loans held-for-investment | |||||||||||||||||||||||||||||
| 30 to 89 days delinquent | $ | 51,229 | $ | 49,810 | $ | 56,338 | $ | 32,873 | $ | 39,122 | |||||||||||||||||||
| 90+ days delinquent | 31,809 | 45,384 | 28,632 | 24,734 | 17,220 | ||||||||||||||||||||||||
| Total delinquent loans | $ | 83,038 | $ | 95,194 | $ | 84,970 | $ | 57,607 | $ | 56,342 | |||||||||||||||||||
| Total delinquent loans to total loans | 1.46 | % | 1.69 | % | 1.50 | % | 0.97 | % | 0.88 | % | |||||||||||||||||||
| Non-performing assets, excluding loans held-for-sale | |||||||||||||||||||||||||||||
| Non-performing loans | $ | 66,337 | $ | 72,703 | $ | 56,471 | $ | 43,354 | $ | 45,169 | |||||||||||||||||||
| 90+ days delinquent and still accruing loans | 547 | — | — | — | — | ||||||||||||||||||||||||
| Other real estate owned | — | — | — | — | — | ||||||||||||||||||||||||
| Non-performing assets | $ | 66,884 | $ | 72,703 | $ | 56,471 | $ | 43,354 | $ | 45,169 | |||||||||||||||||||
| ALL to non-performing loans | 135.95 | % | 124.30 | % | 138.55 | % | 132.97 | % | 139.31 | % | |||||||||||||||||||
| Non-performing loans to total loans held-for-investment | 1.18 | % | 1.29 | % | 1.00 | % | 0.73 | % | 0.71 | % | |||||||||||||||||||
| Non-performing assets to total assets | 0.86 | % | 0.94 | % | 0.74 | % | 0.55 | % | 0.52 | % | |||||||||||||||||||
| Troubled debt restructurings (TDRs) | |||||||||||||||||||||||||||||
| Performing TDRs | $ | 5,408 | $ | 5,597 | $ | 6,100 | $ | 6,620 | $ | 6,800 | |||||||||||||||||||
| Non-performing TDRs | 20,002 | 20,275 | 20,852 | 21,837 | 14,605 | ||||||||||||||||||||||||
| Total TDRs | $ | 25,410 | $ | 25,872 | $ | 26,952 | $ | 28,457 | $ | 21,405 | |||||||||||||||||||
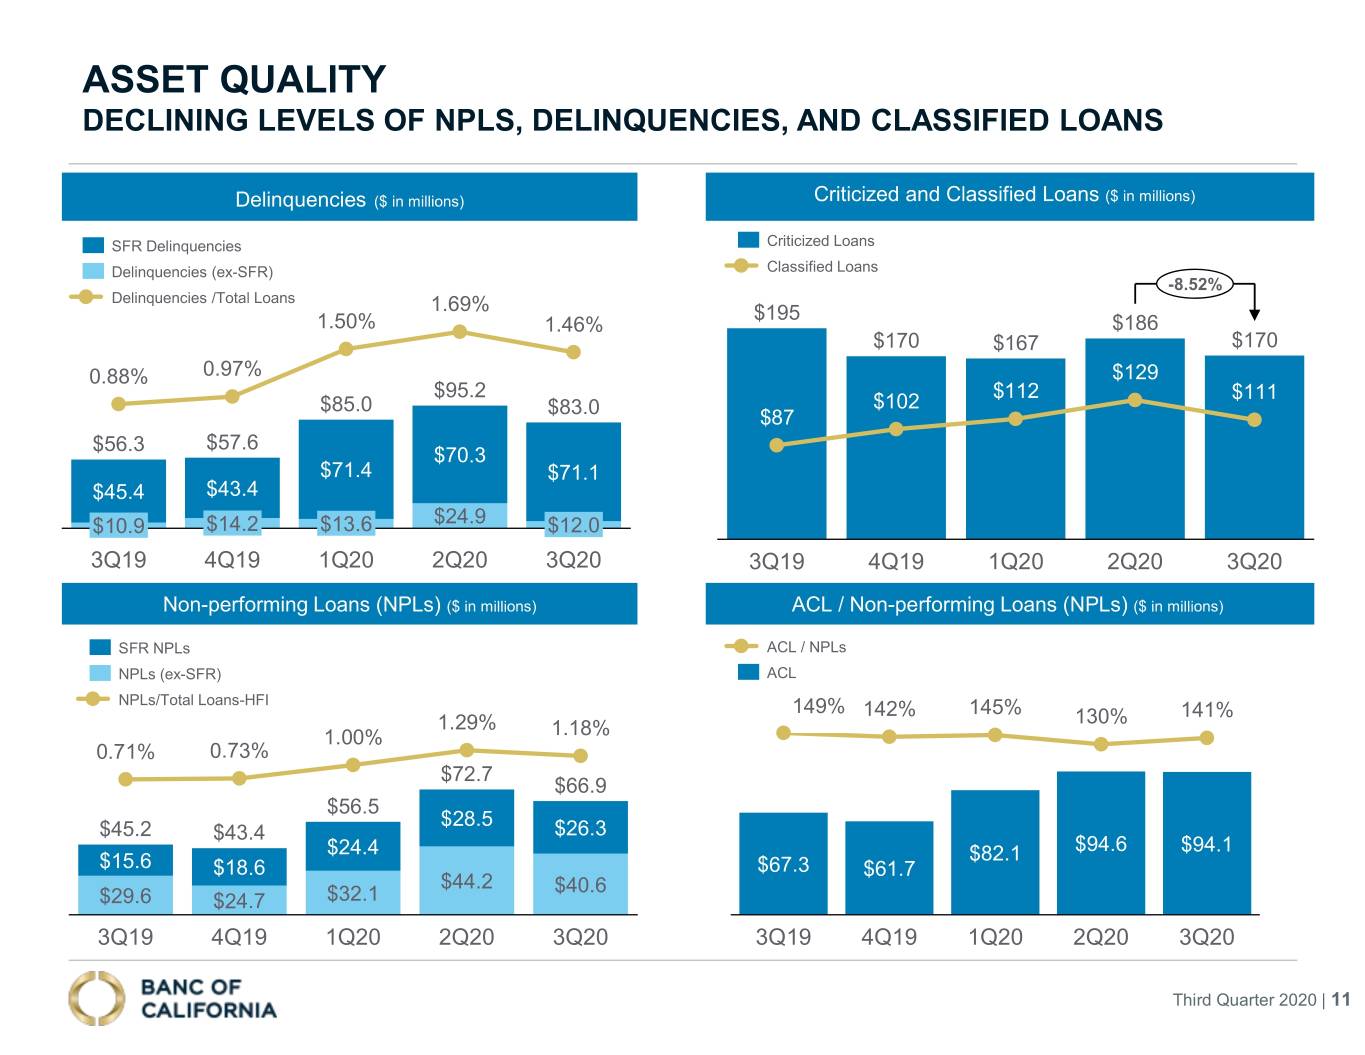
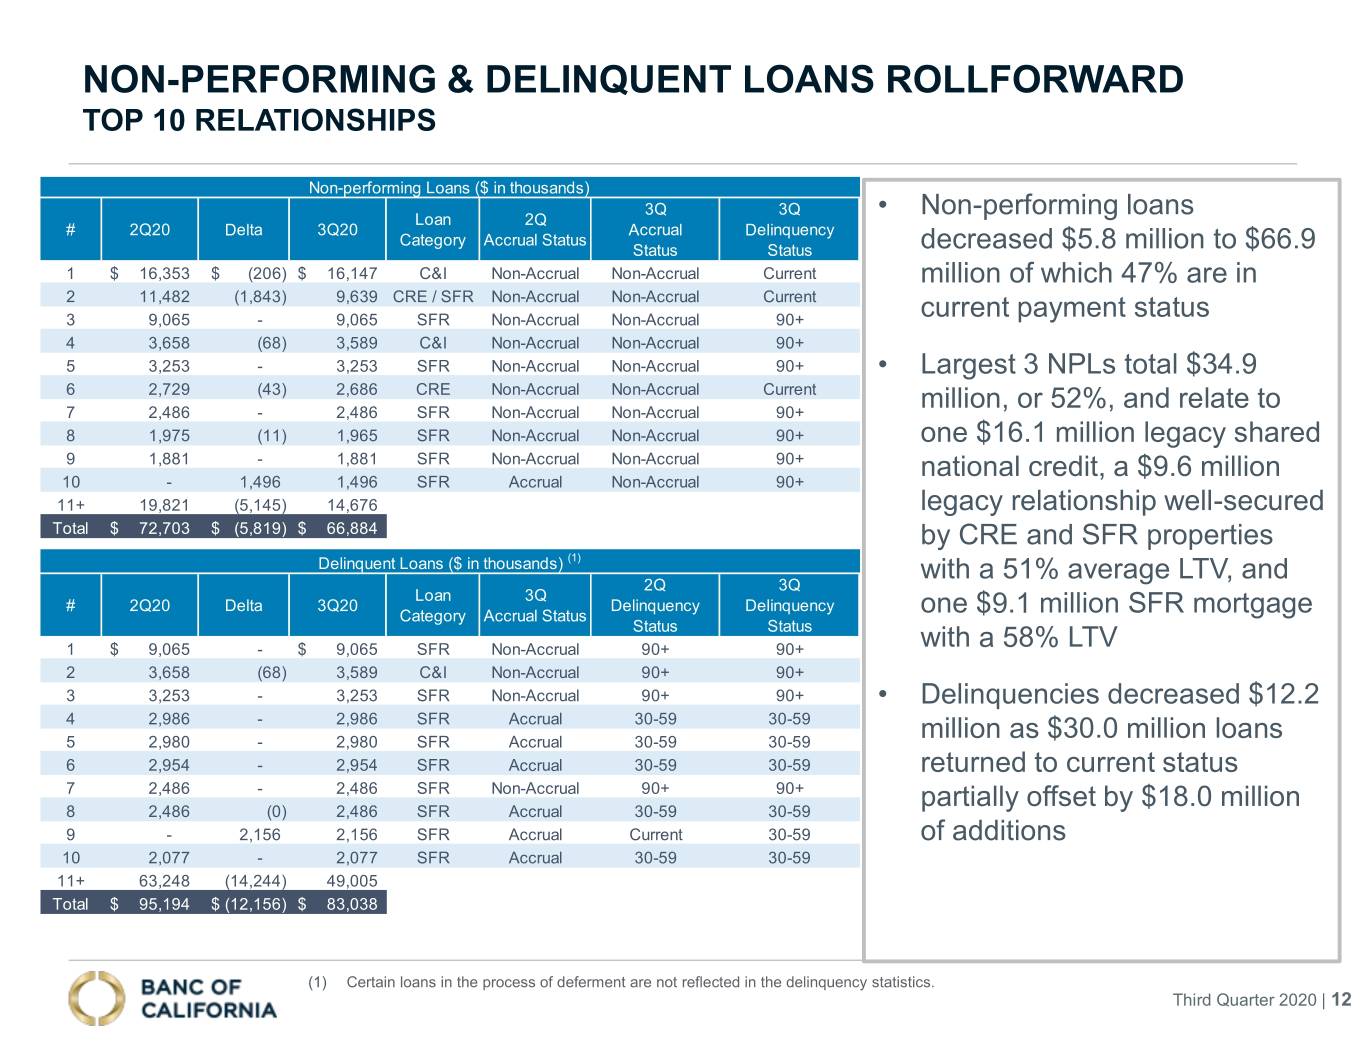
Total delinquent loans decreased $12.2 million in the third quarter to $83.0 million at September 30, 2020, due to $30.0 million returning to current status and $0.2 million of principal payments or payoffs, offset by $18.0 million of additions. Delinquent loans included primarily legacy single-family residential loans, which accounted for 86% of the balance at quarter end and represented an increase of $0.8 million quarter over quarter. Excluding delinquent single-family residential loans, delinquent loans totaled $12.0 million, or 0.27% of total loans at September 30, 2020.
Non-performing loans decreased $5.8 million to $66.9 million as of September 30, 2020, of which $31.5 million, or 47% relates to loans in a current payment status. The third quarter decrease was due primarily to $10.2 million in cured loans and payoffs, offset by $4.4 million of loans placed on nonaccrual status. The quarter-end balance includes three large loan relationships totaling $34.9 million, or 52% of total nonperforming loans, which consist of one $16.1 million legacy shared national credit, a $9.1 million single-family mortgage residential loan with a loan-to-value ratio of 58%, and a $9.6 million legacy relationship well-secured by commercial real estate and single-family residential properties with an average loan-to-value ratio of 51%. Aside from those three loan relationships, non-performing single-family residential loans totaled $17.7 million and the remaining non-performing loans totaled $14.3 million.
In light of the pandemic, during the second and third quarters we provided support to clients by granting loan deferments or forbearances. As of September 30, 2020 loans on deferment or forbearance status totaled $282.5 million as shown below:
| September 30, 2020 | June 30, 2020 | ||||||||||||||||||||||||||||||||||
| Count | Amount(1) | % of Loans in Category | Count | Amount | % of Loans in Category | ||||||||||||||||||||||||||||||
| ($ in thousands) | |||||||||||||||||||||||||||||||||||
| Single-family residential mortgage | 123 | $ | 137,510 | 11 | % | 142 | $ | 163,815 | 12 | % | |||||||||||||||||||||||||
| All other loans | 35 | 145,036 | 3 | % | 156 | 440,420 | 10 | % | |||||||||||||||||||||||||||
| Total | 158 | $ | 282,546 | 5 | % | 298 | $ | 604,235 | 11 | % | |||||||||||||||||||||||||
(1)Loans in the process of deferment or forbearance are not reported as delinquent.
Of the balances as of September 30, 2020, $98.1 million of all other loans are in their second deferment. Further, as of September 30, 2020, 18 commercial loans totaling $45.3 million were under review and pending approval for a second deferral. We continue to actively monitor and manage all lending relationships in a manner that supports our clients and protects the Bank.
9
EX 99.1
Allowance for Credit Losses
| Three Months Ended | |||||||||||||||||||||||||||||
| September 30, 2020 | June 30, 2020 | March 31, 2020 | December 31, 2019 | September 30, 2019 | |||||||||||||||||||||||||
| ($ in thousands) | |||||||||||||||||||||||||||||
| Allowance for loan losses (ALL) | |||||||||||||||||||||||||||||
| Balance at beginning of period | $ | 90,370 | $ | 78,243 | $ | 57,649 | $ | 62,927 | $ | 59,523 | |||||||||||||||||||
Adoption of ASU 2016-13 (1) | — | — | 7,609 | — | — | ||||||||||||||||||||||||
| Loans charged off | (1,821) | — | (2,076) | (2,706) | (35,546) | ||||||||||||||||||||||||
| Recoveries | 248 | 608 | 350 | 106 | 410 | ||||||||||||||||||||||||
| Net (charge-offs) recoveries | (1,573) | 608 | (1,726) | (2,600) | (35,136) | ||||||||||||||||||||||||
| Provision for (reversal of) loan losses | 2,130 | 11,519 | 14,711 | (2,678) | 38,540 | ||||||||||||||||||||||||
| Balance at end of period | $ | 90,927 | $ | 90,370 | $ | 78,243 | $ | 57,649 | $ | 62,927 | |||||||||||||||||||
| Reserve for unfunded loan commitments | |||||||||||||||||||||||||||||
| Balance at beginning of period | $ | 4,195 | $ | 3,888 | $ | 4,064 | $ | 4,362 | $ | 4,295 | |||||||||||||||||||
Adoption of ASU 2016-13 (1) | — | — | (1,226) | — | — | ||||||||||||||||||||||||
| (Reversal of) provision for credit losses | (989) | 307 | 1,050 | (298) | 67 | ||||||||||||||||||||||||
| Balance at end of period | 3,206 | 4,195 | 3,888 | 4,064 | 4,362 | ||||||||||||||||||||||||
| Allowance for credit losses (ACL) | $ | 94,133 | $ | 94,565 | $ | 82,131 | $ | 61,713 | $ | 67,289 | |||||||||||||||||||
| ALL to total loans | 1.60 | % | 1.61 | % | 1.38 | % | 0.97 | % | 0.99 | % | |||||||||||||||||||
| ACL to total loans | 1.66 | % | 1.68 | % | 1.45 | % | 1.04 | % | 1.05 | % | |||||||||||||||||||
| ACL to total loans, excluding PPP loans | 1.74 | % | 1.76 | % | 1.45 | % | 1.04 | % | 1.05 | % | |||||||||||||||||||
| Annualized net loan charge-offs (recoveries) to average total loans held-for-investment | 0.12 | % | (0.04) | % | 0.12 | % | 0.17 | % | 2.19 | % | |||||||||||||||||||
| Reserve for loss on repurchased loans | |||||||||||||||||||||||||||||
| Balance at beginning of period | $ | 5,567 | $ | 5,601 | $ | 6,201 | $ | 6,561 | $ | 2,478 | |||||||||||||||||||
| Initial provision for loan repurchases | 11 | — | — | — | 4,415 | ||||||||||||||||||||||||
| Reversal of provision for loan repurchases | (91) | (34) | (600) | (360) | (123) | ||||||||||||||||||||||||
| Utilization of reserve for loan repurchases | — | — | — | — | (209) | ||||||||||||||||||||||||
| Balance at end of period | $ | 5,487 | $ | 5,567 | $ | 5,601 | $ | 6,201 | $ | 6,561 | |||||||||||||||||||
(1)Represents the impact of adopting ASU 2016-13, Financial Instruments - Credit Losses on January 1, 2020. As a result of adopting ASU 2016-13, our methodology to compute our allowance for credit losses is based on a current expected credit loss methodology, rather than the previously applied incurred loss methodology.
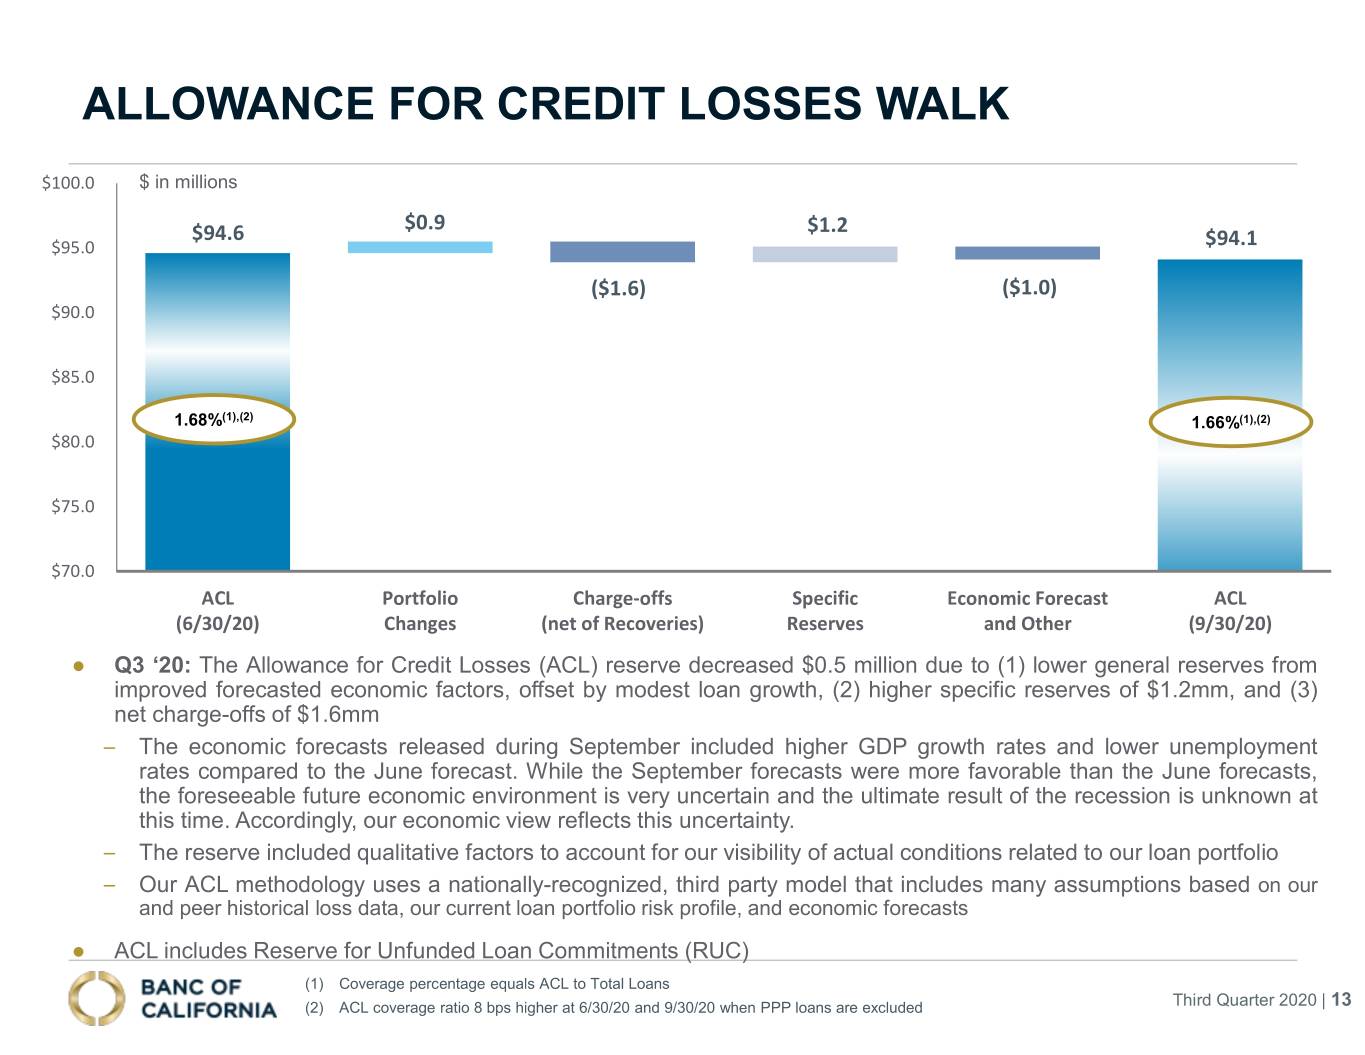
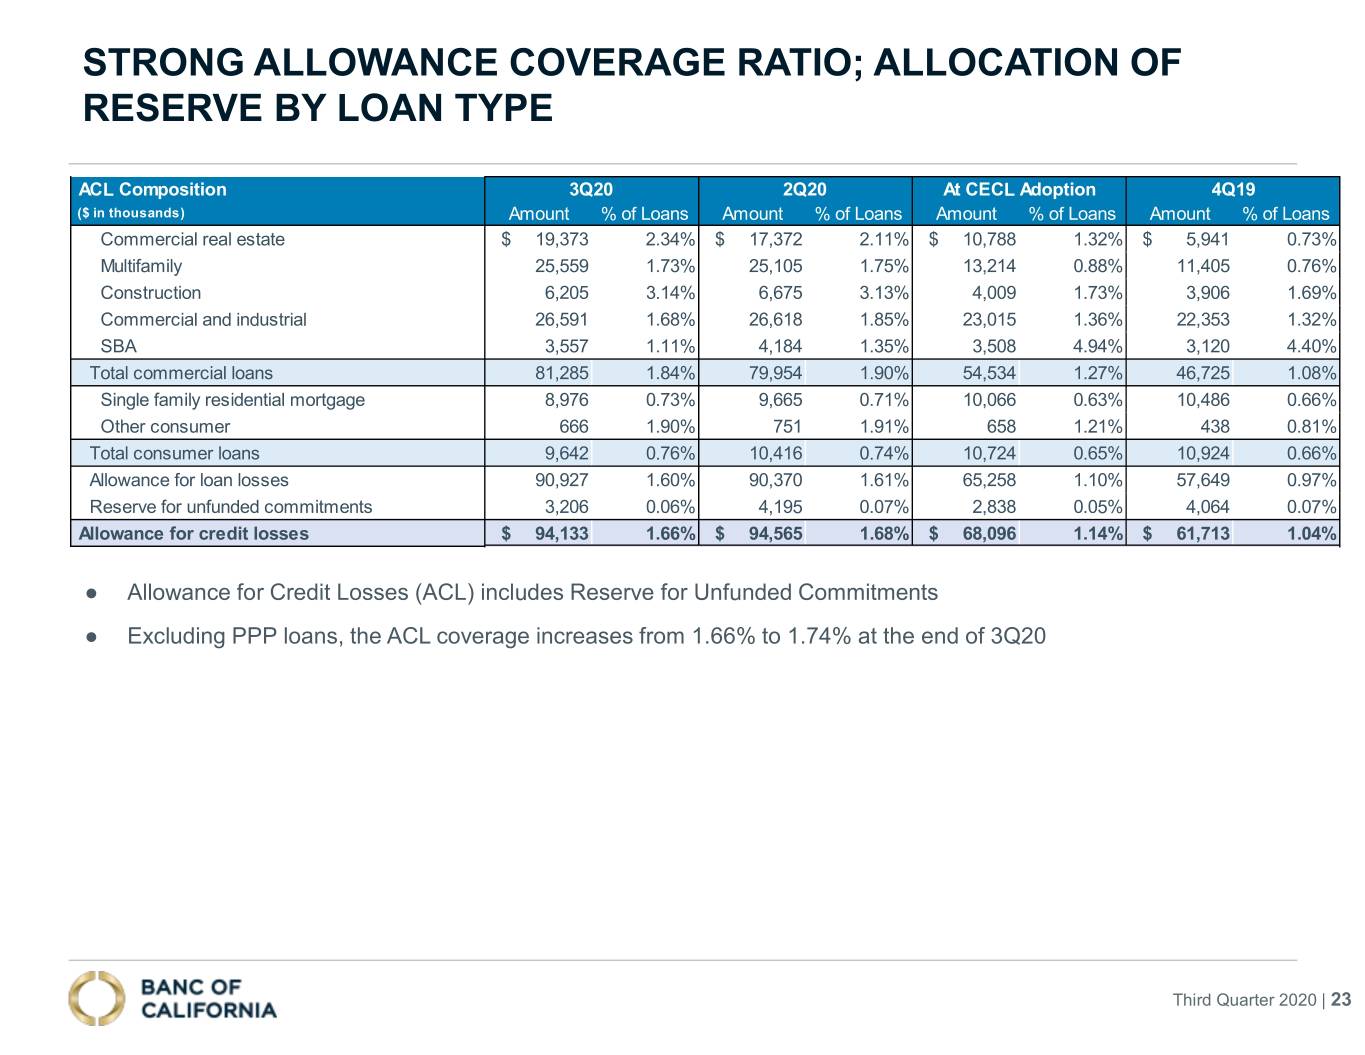
The allowance for expected credit losses ("ACL"), which includes the reserve for unfunded loan commitments, totaled $94.1 million, or 1.66% of total loans, at September 30, 2020 compared to $94.6 million or 1.68% of total loans, at June 30, 2020. The $0.4 million decrease in the ACL was due to: (i) net charge-offs of $1.6 million and (ii) a negative provision for unfunded loan commitments of $1.0 million, offset by (iii) specific reserves of $1.2 million, and (iv) general reserves of $0.9 million due to the impact of higher loan balances, updated forecasts, and improved credit quality metrics. The ACL coverage of nonperforming loans was 141% at September 30, 2020 compared to 130% at June 30, 2020 and 142% at December 31, 2019.
Our ACL methodology and resulting provision continues to be impacted by the current economic uncertainty and volatility caused by the COVID-19 pandemic. The ACL methodology uses a nationally recognized, third-party model that includes many assumptions based on historical and peer loss data, current loan portfolio risk profile including risk ratings, and economic forecasts including macroeconomic variables ("MEVs") released by our model provider during September 2020. In contrast to the June 2020 forecasts, these September forecasts reflect a more favorable view of the economy (i.e. higher GDP growth rates and lower unemployment rates). Despite this, the Company-specific economic view recognizes that the foreseeable future is uncertain with respect to the search for a vaccine and effective treatments for COVID-19; the lack of clarity regarding the timing and amount of a potential government stimulus; the unknown impact of the COVID-19 pandemic on the economy and certain industry segments; and the unknown benefit from Federal Reserve and other government actions. Accordingly, the ACL level and resulting provision reflect these uncertainties. The ACL also incorporated qualitative factors to account for certain loan portfolio characteristics that are not taken into consideration by the third-party model including underlying strengths and weaknesses in the loan portfolio. As is the case with all estimates, the ACL is expected to be impacted in future periods by
10
EX 99.1
economic volatility, changing economic forecasts, underlying model assumptions, and asset quality metrics, all of which may be better than or worse than current estimates.
The Company will host a conference call to discuss its third quarter 2020 financial results at 10:00 a.m. Pacific Time (PT) on Thursday, October 22, 2020. Interested parties are welcome to attend the conference call by dialing (888) 317-6003, and referencing event code 8723927. A live audio webcast will also be available and the webcast link will be posted on the Company’s Investor Relations website at www.bancofcal.com/investor. The slide presentation for the call will also be available on the Company's Investor Relations website prior to the call. A replay of the call will be made available approximately one hour after the call has ended on the Company’s Investor Relations website at www.bancofcal.com/investor or by dialing (877) 344-7529 and referencing event code 10145608.
About Banc of California, Inc.
Banc of California, Inc. (NYSE: BANC) is a bank holding company with approximately $7.7 billion in assets and one wholly-owned banking subsidiary, Banc of California, N.A. (the “Bank”). The Bank has 39 offices including 31 full-service branches located throughout Southern California. Through our dedicated professionals, we provide customized and innovative banking and lending solutions to businesses, entrepreneurs and individuals throughout California. We help to improve the communities where we live and work, by supporting organizations that provide financial literacy and job training, small business support and affordable housing. With a commitment to service and building enduring relationships, we provide a higher standard of banking. We look forward to helping you achieve your goals. For more information, please visit us at www.bancofcal.com.
Forward-Looking Statements
This press release includes forward-looking statements within the meaning of the “Safe-Harbor” provisions of the Private Securities Litigation Reform Act of 1995. These statements are necessarily subject to risk and uncertainty and actual results could differ materially from those anticipated due to various factors, including those set forth from time to time in the documents filed or furnished by Banc of California, Inc. with the Securities and Exchange Commission. In addition to those, statements about the potential effects of the COVID-19 pandemic on the business, financial results and condition of Banc of California, Inc. and its subsidiaries may constitute forward-looking statements and are subject to the risk that the actual effects may differ, possibly materially, from what is reflected in those forward-looking statements due to factors and future developments that are uncertain, unpredictable and in many cases beyond the control of Banc of California, Inc., including the scope and duration of the pandemic, actions taken by governmental authorities in response to the pandemic, and the direct and indirect impact of the pandemic on Banc of California Inc. and its subsidiaries, their customers and third parties. You should not place undue reliance on forward-looking statements and Banc of California, Inc. undertakes no obligation to update any such statements to reflect circumstances or events that occur after the date on which the forward-looking statement is made.
| Source: Banc of California, Inc. | ||
| Investor Relations Inquiries: | ||
| Banc of California, Inc. | ||
| (855) 361-2262 | ||
| Jared Wolff, (949) 385-8700 | ||
| Lynn Hopkins, (949) 265-6599 | ||
11
EX 99.1
Banc of California, Inc.
Consolidated Statements of Financial Condition (Unaudited)
(Dollars in thousands)
| September 30, 2020 | June 30, 2020 | March 31, 2020 | December 31, 2019 | September 30, 2019 | |||||||||||||||||||||||||
| ASSETS | |||||||||||||||||||||||||||||
| Cash and cash equivalents | $ | 292,490 | $ | 420,640 | $ | 435,992 | $ | 373,472 | $ | 526,874 | |||||||||||||||||||
| Securities available-for-sale | 1,245,867 | 1,176,029 | 969,427 | 912,580 | 775,662 | ||||||||||||||||||||||||
| Loans held-for-sale | 1,849 | 19,768 | 20,234 | 22,642 | 23,936 | ||||||||||||||||||||||||
| Loans held-for-investment | 5,678,002 | 5,627,696 | 5,667,464 | 5,951,885 | 6,383,259 | ||||||||||||||||||||||||
| Allowance for loan losses | (90,927) | (90,370) | (78,243) | (57,649) | (62,927) | ||||||||||||||||||||||||
| Federal Home Loan Bank and other bank stock | 44,809 | 46,585 | 57,237 | 59,420 | 71,679 | ||||||||||||||||||||||||
| Servicing rights, net | 1,621 | 1,753 | 2,009 | 2,299 | 2,407 | ||||||||||||||||||||||||
| Premises and equipment, net | 123,812 | 125,247 | 127,379 | 128,021 | 128,979 | ||||||||||||||||||||||||
| Investments in alternative energy partnerships, net | 27,786 | 26,967 | 27,347 | 29,300 | 27,039 | ||||||||||||||||||||||||
| Goodwill | 37,144 | 37,144 | 37,144 | 37,144 | 37,144 | ||||||||||||||||||||||||
| Other intangible assets, net | 2,939 | 3,292 | 3,722 | 4,151 | 4,605 | ||||||||||||||||||||||||
| Deferred income tax, net | 43,744 | 48,288 | 63,849 | 44,906 | 45,950 | ||||||||||||||||||||||||
| Income tax receivable | 10,701 | 13,094 | 7,198 | 4,233 | 4,459 | ||||||||||||||||||||||||
| Bank owned life insurance investment | 111,115 | 110,487 | 110,397 | 109,819 | 108,720 | ||||||||||||||||||||||||
| Right of use assets | 18,909 | 19,408 | 20,882 | 22,540 | 23,907 | ||||||||||||||||||||||||
| Due from unsettled securities sales | — | — | — | — | 334,769 | ||||||||||||||||||||||||
| Other assets | 188,245 | 184,110 | 190,569 | 183,647 | 188,875 | ||||||||||||||||||||||||
| Total assets | $ | 7,738,106 | $ | 7,770,138 | $ | 7,662,607 | $ | 7,828,410 | $ | 8,625,337 | |||||||||||||||||||
| LIABILITIES AND STOCKHOLDERS’ EQUITY | |||||||||||||||||||||||||||||
| Noninterest-bearing deposits | $ | 1,450,744 | $ | 1,391,504 | $ | 1,256,081 | $ | 1,088,516 | $ | 1,107,442 | |||||||||||||||||||
| Interest-bearing deposits | 4,581,522 | 4,645,961 | 4,306,757 | 4,338,651 | 4,662,616 | ||||||||||||||||||||||||
| Total deposits | 6,032,266 | 6,037,465 | 5,562,838 | 5,427,167 | 5,770,058 | ||||||||||||||||||||||||
| Advances from Federal Home Loan Bank | 559,482 | 617,170 | 978,000 | 1,195,000 | 1,650,000 | ||||||||||||||||||||||||
| Notes payable, net | 173,623 | 173,537 | 173,479 | 173,421 | 173,339 | ||||||||||||||||||||||||
| Reserve for loss on repurchased loans | 5,487 | 5,567 | 5,601 | 6,201 | 6,561 | ||||||||||||||||||||||||
| Lease liabilities | 19,938 | 20,531 | 22,075 | 23,692 | 25,210 | ||||||||||||||||||||||||
| Accrued expenses and other liabilities | 73,056 | 68,909 | 85,612 | 95,684 | 99,181 | ||||||||||||||||||||||||
| Total liabilities | 6,863,852 | 6,923,179 | 6,827,605 | 6,921,165 | 7,724,349 | ||||||||||||||||||||||||
| Commitments and contingent liabilities | |||||||||||||||||||||||||||||
| Preferred stock | 184,878 | 185,037 | 187,687 | 189,825 | 189,825 | ||||||||||||||||||||||||
| Common stock | 522 | 522 | 520 | 520 | 520 | ||||||||||||||||||||||||
| Common stock, class B non-voting non-convertible | 5 | 5 | 5 | 5 | 5 | ||||||||||||||||||||||||
| Additional paid-in capital | 633,409 | 632,117 | 631,125 | 629,848 | 628,774 | ||||||||||||||||||||||||
| Retained earnings | 95,001 | 85,670 | 110,640 | 127,733 | 120,221 | ||||||||||||||||||||||||
| Treasury stock | (40,827) | (40,827) | (40,827) | (28,786) | (28,786) | ||||||||||||||||||||||||
| Accumulated other comprehensive income (loss), net | 1,266 | (15,565) | (54,148) | (11,900) | (9,571) | ||||||||||||||||||||||||
| Total stockholders’ equity | 874,254 | 846,959 | 835,002 | 907,245 | 900,988 | ||||||||||||||||||||||||
| Total liabilities and stockholders’ equity | $ | 7,738,106 | $ | 7,770,138 | $ | 7,662,607 | $ | 7,828,410 | $ | 8,625,337 | |||||||||||||||||||
12
EX 99.1
Banc of California, Inc.
Consolidated Statements of Operations (Unaudited)
(Dollars in thousands, except per share data)
| Three Months Ended | Nine Months Ended | ||||||||||||||||||||||||||||||||||||||||
| September 30, 2020 | June 30, 2020 | March 31, 2020 | December 31, 2019 | September 30, 2019 | September 30, 2020 | September 30, 2019 | |||||||||||||||||||||||||||||||||||
| Interest and dividend income | |||||||||||||||||||||||||||||||||||||||||
| Loans, including fees | $ | 62,019 | $ | 63,642 | $ | 65,534 | $ | 73,930 | $ | 80,287 | $ | 191,195 | $ | 260,004 | |||||||||||||||||||||||||||
| Securities | 6,766 | 7,816 | 7,820 | 7,812 | 10,024 | 22,402 | 40,322 | ||||||||||||||||||||||||||||||||||
| Other interest-earning assets | 881 | 1,239 | 1,360 | 1,960 | 2,346 | 3,480 | 7,083 | ||||||||||||||||||||||||||||||||||
| Total interest and dividend income | 69,666 | 72,697 | 74,714 | 83,702 | 92,657 | 217,077 | 307,409 | ||||||||||||||||||||||||||||||||||
| Interest expense | |||||||||||||||||||||||||||||||||||||||||
| Deposits | 7,564 | 10,205 | 14,611 | 18,247 | 22,811 | 32,380 | 82,852 | ||||||||||||||||||||||||||||||||||
| Federal Home Loan Bank advances | 3,860 | 4,818 | 5,883 | 6,396 | 8,519 | 14,561 | 25,889 | ||||||||||||||||||||||||||||||||||
| Notes payable and other interest-bearing liabilities | 2,387 | 2,359 | 2,359 | 2,399 | 2,412 | 7,105 | 7,165 | ||||||||||||||||||||||||||||||||||
| Total interest expense | 13,811 | 17,382 | 22,853 | 27,042 | 33,742 | 54,046 | 115,906 | ||||||||||||||||||||||||||||||||||
| Net interest income | 55,855 | 55,315 | 51,861 | 56,660 | 58,915 | 163,031 | 191,503 | ||||||||||||||||||||||||||||||||||
| Provision for (reversal of) credit losses | 1,141 | 11,826 | 15,761 | (2,976) | 38,607 | 28,728 | 38,805 | ||||||||||||||||||||||||||||||||||
| Net interest income after provision for (reversal of) credit losses | 54,714 | 43,489 | 36,100 | 59,636 | 20,308 | 134,303 | 152,698 | ||||||||||||||||||||||||||||||||||
| Noninterest income | |||||||||||||||||||||||||||||||||||||||||
| Customer service fees | 1,498 | 1,224 | 1,096 | 1,451 | 1,582 | 3,818 | 4,531 | ||||||||||||||||||||||||||||||||||
| Loan servicing income | 186 | 95 | 75 | 312 | 128 | 356 | 367 | ||||||||||||||||||||||||||||||||||
| Income from bank owned life insurance | 629 | 591 | 578 | 599 | 588 | 1,798 | 1,693 | ||||||||||||||||||||||||||||||||||
| Impairment loss on investment securities | — | — | — | — | (731) | — | (731) | ||||||||||||||||||||||||||||||||||
| Net gain (loss) on sale of securities available for sale | — | 2,011 | — | 3 | (5,063) | 2,011 | (4,855) | ||||||||||||||||||||||||||||||||||
| Fair value adjustment on loans held for sale | 24 | 25 | (1,586) | 30 | 16 | (1,537) | 76 | ||||||||||||||||||||||||||||||||||
| Net gain (loss) on sale of loans | 272 | — | (27) | (863) | 4,310 | 245 | 8,629 | ||||||||||||||||||||||||||||||||||
| All other income (loss) | 1,345 | 1,582 | 1,925 | 3,398 | 2,351 | 4,852 | (2,524) | ||||||||||||||||||||||||||||||||||
| Total noninterest income | 3,954 | 5,528 | 2,061 | 4,930 | 3,181 | 11,543 | 7,186 | ||||||||||||||||||||||||||||||||||
| Noninterest expense | |||||||||||||||||||||||||||||||||||||||||
| Salaries and employee benefits | 23,277 | 24,260 | 23,436 | 24,036 | 25,934 | 70,973 | 81,879 | ||||||||||||||||||||||||||||||||||
| Naming rights termination | — | 26,769 | — | — | — | 26,769 | — | ||||||||||||||||||||||||||||||||||
| Occupancy and equipment | 7,457 | 7,090 | 7,243 | 7,900 | 7,767 | 21,790 | 23,408 | ||||||||||||||||||||||||||||||||||
| Professional fees | 5,147 | 4,596 | 5,964 | 2,611 | 1,463 | 15,707 | 9,601 | ||||||||||||||||||||||||||||||||||
| Data processing | 1,657 | 1,536 | 1,773 | 1,684 | 1,568 | 4,966 | 4,736 | ||||||||||||||||||||||||||||||||||
| Advertising | 219 | 1,157 | 1,756 | 2,227 | 2,090 | 3,132 | 6,195 | ||||||||||||||||||||||||||||||||||
| Regulatory assessments | 784 | 725 | 484 | 1,854 | 1,239 | 1,993 | 5,857 | ||||||||||||||||||||||||||||||||||
| Reversal of loan repurchase reserves | (91) | (34) | (600) | (360) | (123) | (725) | (300) | ||||||||||||||||||||||||||||||||||
| Amortization of intangible assets | 353 | 430 | 429 | 454 | 500 | 1,212 | 1,741 | ||||||||||||||||||||||||||||||||||
| Restructuring expense | — | — | — | 1,626 | — | — | 2,637 | ||||||||||||||||||||||||||||||||||
| All other expenses | 3,021 | 6,408 | 4,529 | 4,412 | 3,742 | 13,958 | 12,580 | ||||||||||||||||||||||||||||||||||
| Total noninterest expense excluding (gain) loss on investments in alternative energy partnerships | 41,824 | 72,937 | 45,014 | 46,444 | 44,180 | 159,775 | 148,334 | ||||||||||||||||||||||||||||||||||
| (Gain) loss on investments in alternative energy partnerships | (1,430) | (167) | 1,905 | 1,039 | (940) | 308 | 655 | ||||||||||||||||||||||||||||||||||
| Total noninterest expense | 40,394 | 72,770 | 46,919 | 47,483 | 43,240 | 160,083 | 148,989 | ||||||||||||||||||||||||||||||||||
| Income (loss) from operations before income taxes | 18,274 | (23,753) | (8,758) | 17,083 | (19,751) | (14,237) | 10,895 | ||||||||||||||||||||||||||||||||||
| Income tax expense (benefit) | 2,361 | (5,304) | (2,165) | 2,811 | (5,619) | (5,108) | 1,408 | ||||||||||||||||||||||||||||||||||
| Net income (loss) | 15,913 | (18,449) | (6,593) | 14,272 | (14,132) | (9,129) | 9,487 | ||||||||||||||||||||||||||||||||||
| Preferred stock dividends | 3,447 | 3,442 | 3,533 | 3,540 | 3,403 | 10,422 | 12,019 | ||||||||||||||||||||||||||||||||||
| Income allocated to participating securities | 281 | — | — | 224 | — | — | — | ||||||||||||||||||||||||||||||||||
| Participating securities dividends | 94 | 94 | 94 | 93 | 94 | 282 | 390 | ||||||||||||||||||||||||||||||||||
| Impact of preferred stock redemption | 7 | (49) | (526) | — | 5,093 | (568) | 5,093 | ||||||||||||||||||||||||||||||||||
| Net income (loss) available to common stockholders | $ | 12,084 | $ | (21,936) | $ | (9,694) | $ | 10,415 | $ | (22,722) | $ | (19,265) | $ | (8,015) | |||||||||||||||||||||||||||
13
EX 99.1
| Earnings (loss) per common share: | |||||||||||||||||||||||||||||||||||||||||
| Basic | $ | 0.24 | $ | (0.44) | $ | (0.19) | $ | 0.21 | $ | (0.45) | $ | (0.38) | $ | (0.16) | |||||||||||||||||||||||||||
| Diluted | $ | 0.24 | $ | (0.44) | $ | (0.19) | $ | 0.20 | $ | (0.45) | $ | (0.38) | $ | (0.16) | |||||||||||||||||||||||||||
| Weighted average number of common shares outstanding | |||||||||||||||||||||||||||||||||||||||||
| Basic | 50,108,655 | 50,030,919 | 50,464,777 | 50,699,915 | 50,882,227 | 50,201,112 | 50,804,429 | ||||||||||||||||||||||||||||||||||
| Diluted | 50,190,933 | 50,030,919 | 50,464,777 | 50,927,978 | 50,882,227 | 50,201,112 | 50,804,429 | ||||||||||||||||||||||||||||||||||
| Dividends declared per common share | $ | 0.06 | $ | 0.06 | $ | 0.06 | $ | 0.06 | $ | 0.06 | $ | 0.18 | $ | 0.25 | |||||||||||||||||||||||||||
14
EX 99.1
Banc of California, Inc.
Selected Financial Data
(Unaudited)
| Three Months Ended | |||||||||||||||||||||||||||||
| September 30, 2020 | June 30, 2020 | March 31, 2020 | December 31, 2019 | September 30, 2019 | |||||||||||||||||||||||||
| Profitability and other ratios of consolidated operations | |||||||||||||||||||||||||||||
Return on average assets(1) | 0.82 | % | (0.96) | % | (0.35) | % | 0.71 | % | (0.64) | % | |||||||||||||||||||
Return on average equity(1) | 7.32 | % | (8.69) | % | (2.89) | % | 6.20 | % | (5.83) | % | |||||||||||||||||||
Return on average tangible common equity(2) | 7.92 | % | (13.77) | % | (5.44) | % | 6.46 | % | (12.49) | % | |||||||||||||||||||
Dividend payout ratio(3) | 25.00 | % | (13.64) | % | (31.58) | % | 28.57 | % | (13.33) | % | |||||||||||||||||||
| Net interest spread | 2.84 | % | 2.77 | % | 2.56 | % | 2.65 | % | 2.47 | % | |||||||||||||||||||
Net interest margin(1) | 3.09 | % | 3.09 | % | 2.97 | % | 3.04 | % | 2.86 | % | |||||||||||||||||||
Noninterest income to total revenue(4) | 6.61 | % | 9.09 | % | 3.82 | % | 8.00 | % | 5.12 | % | |||||||||||||||||||
Noninterest income to average total assets(1) | 0.20 | % | 0.29 | % | 0.11 | % | 0.25 | % | 0.15 | % | |||||||||||||||||||
Noninterest expense to average total assets(1) | 2.09 | % | 3.78 | % | 2.50 | % | 2.37 | % | 1.97 | % | |||||||||||||||||||
Adjusted noninterest expense to average total assets(1) | 2.10 | % | 2.22 | % | 2.30 | % | 2.41 | % | 2.13 | % | |||||||||||||||||||
Efficiency ratio(2)(5) | 67.54 | % | 119.60 | % | 87.01 | % | 77.10 | % | 69.63 | % | |||||||||||||||||||
Adjusted efficiency ratio including the pre-tax effect of investments in alternative energy partnerships(2)(5) | 68.30 | % | 119.55 | % | 86.54 | % | 74.51 | % | 70.00 | % | |||||||||||||||||||
| Average loans held-for-investment to average deposits | 92.86 | % | 98.51 | % | 108.54 | % | 108.50 | % | 105.92 | % | |||||||||||||||||||
| Average securities available-for-sale to average total assets | 15.49 | % | 13.75 | % | 12.60 | % | 10.48 | % | 12.71 | % | |||||||||||||||||||
| Average stockholders’ equity to average total assets | 11.26 | % | 11.04 | % | 12.11 | % | 11.47 | % | 11.06 | % | |||||||||||||||||||
(1)Ratios are presented on an annualized basis.
(2)The ratios are determined by methods other than in accordance with U.S. generally accepted accounting principles (GAAP). See Non-GAAP measures section for reconciliation of the calculation.
(3)The ratio is calculated by dividing dividends declared per common share by basic earnings (loss) per common share.
(4)Total revenue is equal to the sum of net interest income before provision for (reversal of) credit losses and noninterest income.
(5)The ratios are calculated by dividing noninterest expense by the sum of net interest income before provision for credit losses and noninterest income.
15
EX 99.1
Banc of California, Inc.
Average Balance, Average Yield Earned, and Average Cost Paid
(Dollars in thousands)
(Unaudited)
| Three Months Ended | |||||||||||||||||||||||||||||||||||||||||||||||||||||
| September 30, 2020 | June 30, 2020 | March 31, 2020 | |||||||||||||||||||||||||||||||||||||||||||||||||||
| Average | Yield | Average | Yield | Average | Yield | ||||||||||||||||||||||||||||||||||||||||||||||||
| Balance | Interest | / Cost | Balance | Interest | / Cost | Balance | Interest | / Cost | |||||||||||||||||||||||||||||||||||||||||||||
| Interest-earning assets | |||||||||||||||||||||||||||||||||||||||||||||||||||||
| Loans held-for-sale | $ | 19,544 | $ | 139 | 2.83 | % | $ | 19,967 | $ | 155 | 3.12 | % | $ | 22,273 | $ | 220 | 3.97 | % | |||||||||||||||||||||||||||||||||||
| SFR mortgage | 1,311,513 | 13,178 | 4.00 | % | 1,416,358 | 14,187 | 4.03 | % | 1,532,967 | 15,295 | 4.01 | % | |||||||||||||||||||||||||||||||||||||||||
| Commercial real estate, multifamily, and construction | 2,493,408 | 29,666 | 4.73 | % | 2,524,477 | 29,459 | 4.69 | % | 2,564,485 | 30,223 | 4.74 | % | |||||||||||||||||||||||||||||||||||||||||
| Commercial and industrial, SBA, and lease financing | 1,673,548 | 18,585 | 4.42 | % | 1,706,120 | 19,392 | 4.57 | % | 1,613,324 | 19,157 | 4.78 | % | |||||||||||||||||||||||||||||||||||||||||
| Other consumer | 35,563 | 451 | 5.05 | % | 40,697 | 449 | 4.44 | % | 47,761 | 639 | 5.38 | % | |||||||||||||||||||||||||||||||||||||||||
| Gross loans and leases | 5,533,576 | 62,019 | 4.46 | % | 5,707,619 | 63,642 | 4.48 | % | 5,780,810 | 65,534 | 4.56 | % | |||||||||||||||||||||||||||||||||||||||||
| Securities | 1,190,765 | 6,766 | 2.26 | % | 1,063,941 | 7,816 | 2.95 | % | 952,966 | 7,820 | 3.30 | % | |||||||||||||||||||||||||||||||||||||||||
| Other interest-earning assets | 457,558 | 881 | 0.77 | % | 424,776 | 1,239 | 1.17 | % | 297,444 | 1,360 | 1.84 | % | |||||||||||||||||||||||||||||||||||||||||
| Total interest-earning assets | 7,181,899 | 69,666 | 3.86 | % | 7,196,336 | 72,697 | 4.06 | % | 7,031,220 | 74,714 | 4.27 | % | |||||||||||||||||||||||||||||||||||||||||
| Allowance for loan losses | (89,679) | (78,528) | (60,470) | ||||||||||||||||||||||||||||||||||||||||||||||||||
| BOLI and noninterest-earning assets | 594,885 | 622,398 | 592,192 | ||||||||||||||||||||||||||||||||||||||||||||||||||
| Total assets | $ | 7,687,105 | $ | 7,740,206 | $ | 7,562,942 | |||||||||||||||||||||||||||||||||||||||||||||||
| Interest-bearing liabilities | |||||||||||||||||||||||||||||||||||||||||||||||||||||
| Savings | $ | 948,898 | $ | 2,353 | 0.99 | % | $ | 905,997 | $ | 2,718 | 1.21 | % | $ | 890,830 | $ | 3,296 | 1.49 | % | |||||||||||||||||||||||||||||||||||
| Interest-bearing checking | 1,919,327 | 1,660 | 0.34 | % | 1,710,038 | 2,186 | 0.51 | % | 1,520,922 | 3,728 | 0.99 | % | |||||||||||||||||||||||||||||||||||||||||
| Money market | 681,421 | 645 | 0.38 | % | 592,872 | 850 | 0.58 | % | 608,926 | 1,760 | 1.16 | % | |||||||||||||||||||||||||||||||||||||||||
| Certificates of deposit | 1,030,829 | 2,906 | 1.12 | % | 1,214,939 | 4,451 | 1.47 | % | 1,151,518 | 5,827 | 2.04 | % | |||||||||||||||||||||||||||||||||||||||||
| Total interest-bearing deposits | 4,580,475 | 7,564 | 0.66 | % | 4,423,846 | 10,205 | 0.93 | % | 4,172,196 | 14,611 | 1.41 | % | |||||||||||||||||||||||||||||||||||||||||
| FHLB advances | 608,169 | 3,860 | 2.52 | % | 819,166 | 4,818 | 2.37 | % | 1,039,055 | 5,883 | 2.28 | % | |||||||||||||||||||||||||||||||||||||||||
| Securities sold under repurchase agreements | 1,309 | 2 | 0.61 | % | 1,024 | 2 | 0.79 | % | — | — | — | % | |||||||||||||||||||||||||||||||||||||||||
| Long-term debt and other interest-bearing liabilities | 173,911 | 2,385 | 5.46 | % | 173,977 | 2,357 | 5.45 | % | 174,056 | 2,359 | 5.45 | % | |||||||||||||||||||||||||||||||||||||||||
| Total interest-bearing liabilities | 5,363,864 | 13,811 | 1.02 | % | 5,418,013 | 17,382 | 1.29 | % | 5,385,307 | 22,853 | 1.71 | % | |||||||||||||||||||||||||||||||||||||||||
| Noninterest-bearing deposits | 1,357,411 | 1,349,735 | 1,133,306 | ||||||||||||||||||||||||||||||||||||||||||||||||||
| Noninterest-bearing liabilities | 100,424 | 118,208 | 128,282 | ||||||||||||||||||||||||||||||||||||||||||||||||||
| Total liabilities | 6,821,699 | 6,885,956 | 6,646,895 | ||||||||||||||||||||||||||||||||||||||||||||||||||
| Total stockholders’ equity | 865,406 | 854,250 | 916,047 | ||||||||||||||||||||||||||||||||||||||||||||||||||
| Total liabilities and stockholders’ equity | $ | 7,687,105 | $ | 7,740,206 | $ | 7,562,942 | |||||||||||||||||||||||||||||||||||||||||||||||
| Net interest income/spread | $ | 55,855 | 2.84 | % | $ | 55,315 | 2.77 | % | $ | 51,861 | 2.56 | % | |||||||||||||||||||||||||||||||||||||||||
| Net interest margin | 3.09 | % | 3.09 | % | 2.97 | % | |||||||||||||||||||||||||||||||||||||||||||||||
| Ratio of interest-earning assets to interest-bearing liabilities | 133.89 | % | 132.82 | % | 130.56 | % | |||||||||||||||||||||||||||||||||||||||||||||||
| Total deposits | $ | 5,937,886 | $ | 7,564 | 0.51 | % | $ | 5,773,581 | $ | 10,205 | 0.71 | % | $ | 5,305,502 | $ | 14,611 | 1.11 | % | |||||||||||||||||||||||||||||||||||
Total funding (1) | $ | 6,721,275 | $ | 13,811 | 0.82 | % | $ | 6,767,748 | $ | 17,382 | 1.03 | % | $ | 6,518,613 | $ | 22,853 | 1.41 | % | |||||||||||||||||||||||||||||||||||
(1)Total funding is the sum of interest-bearing liabilities and noninterest-bearing deposits. The cost of total funding is calculated as annualized total interest expense divided by average total funding.
16
EX 99.1
| Three Months Ended | |||||||||||||||||||||||||||||||||||
| December 31, 2019 | September 30, 2019 | ||||||||||||||||||||||||||||||||||
| Average | Yield | Average | Yield | ||||||||||||||||||||||||||||||||
| Balance | Interest | / Cost | Balance | Interest | / Cost | ||||||||||||||||||||||||||||||
| Interest-earning assets | |||||||||||||||||||||||||||||||||||
| Loans held-for-sale | $ | 23,527 | $ | 221 | 3.73 | % | $ | 216,746 | $ | 1,894 | 3.47 | % | |||||||||||||||||||||||
| SFR mortgage | 1,689,228 | 16,788 | 3.94 | % | 1,866,103 | 19,179 | 4.08 | % | |||||||||||||||||||||||||||
| Commercial real estate, multifamily, and construction | 2,633,342 | 32,763 | 4.94 | % | 2,717,609 | 33,343 | 4.87 | % | |||||||||||||||||||||||||||
| Commercial and industrial, SBA, and lease financing | 1,821,064 | 23,381 | 5.09 | % | 1,840,202 | 24,970 | 5.38 | % | |||||||||||||||||||||||||||
| Other consumer | 54,088 | 777 | 5.70 | % | 58,652 | 901 | 6.09 | % | |||||||||||||||||||||||||||
| Gross loans and leases | 6,221,249 | 73,930 | 4.71 | % | 6,699,312 | 80,287 | 4.75 | % | |||||||||||||||||||||||||||
| Securities | 833,726 | 7,812 | 3.72 | % | 1,105,499 | 10,024 | 3.60 | % | |||||||||||||||||||||||||||
| Other interest-earning assets | 330,950 | 1,960 | 2.35 | % | 362,613 | 2,346 | 2.57 | % | |||||||||||||||||||||||||||
| Total interest-earning assets | 7,385,925 | 83,702 | 4.50 | % | 8,167,424 | 92,657 | 4.50 | % | |||||||||||||||||||||||||||
| Allowance for loan losses | (61,642) | (55,976) | |||||||||||||||||||||||||||||||||
| BOLI and noninterest-earning assets | 630,308 | 584,190 | |||||||||||||||||||||||||||||||||
| Total assets | $ | 7,954,591 | $ | 8,695,638 | |||||||||||||||||||||||||||||||
| Interest-bearing liabilities | |||||||||||||||||||||||||||||||||||
| Savings | 981,346 | 3,889 | 1.57 | % | 1,055,086 | 4,722 | 1.78 | % | |||||||||||||||||||||||||||
| Interest-bearing checking | 1,546,322 | 4,234 | 1.09 | % | 1,511,432 | 4,483 | 1.18 | % | |||||||||||||||||||||||||||
| Money market | 743,695 | 2,593 | 1.38 | % | 755,114 | 3,093 | 1.63 | % | |||||||||||||||||||||||||||
| Certificates of deposit | 1,332,911 | 7,531 | 2.24 | % | 1,750,970 | 10,513 | 2.38 | % | |||||||||||||||||||||||||||
| Total interest-bearing deposits | 4,604,274 | 18,247 | 1.57 | % | 5,072,602 | 22,811 | 1.78 | % | |||||||||||||||||||||||||||
| FHLB advances | 1,020,478 | 6,396 | 2.49 | % | 1,333,739 | 8,519 | 2.53 | % | |||||||||||||||||||||||||||
| Securities sold under repurchase agreements | 2,223 | 15 | 2.68 | % | 1,922 | 13 | 2.68 | % | |||||||||||||||||||||||||||
| Long-term debt and other interest-bearing liabilities | 174,092 | 2,384 | 5.43 | % | 174,111 | 2,399 | 5.47 | % | |||||||||||||||||||||||||||
| Total interest-bearing liabilities | 5,801,067 | 27,042 | 1.85 | % | 6,582,374 | 33,742 | 2.03 | % | |||||||||||||||||||||||||||
| Noninterest-bearing deposits | 1,108,077 | 1,047,858 | |||||||||||||||||||||||||||||||||
| Noninterest-bearing liabilities | 132,698 | 103,667 | |||||||||||||||||||||||||||||||||
| Total liabilities | 7,041,842 | 7,733,899 | |||||||||||||||||||||||||||||||||
| Total stockholders’ equity | 912,749 | 961,739 | |||||||||||||||||||||||||||||||||
| Total liabilities and stockholders’ equity | $ | 7,954,591 | $ | 8,695,638 | |||||||||||||||||||||||||||||||
| Net interest income/spread | $ | 56,660 | 2.65 | % | $ | 58,915 | 2.47 | % | |||||||||||||||||||||||||||
| Net interest margin | 3.04 | % | 2.86 | % | |||||||||||||||||||||||||||||||
| Ratio of interest-earning assets to interest-bearing liabilities | 127.32 | % | 124.08 | % | |||||||||||||||||||||||||||||||
| Total deposits | $ | 5,712,351 | $ | 18,247 | 1.27 | % | $ | 6,120,460 | $ | 22,811 | 1.48 | % | |||||||||||||||||||||||
Total funding (1) | $ | 6,909,144 | $ | 27,042 | 1.55 | % | $ | 7,630,232 | $ | 33,742 | 1.75 | % | |||||||||||||||||||||||
(1)Total funding is the sum of interest-bearing liabilities and noninterest-bearing deposits. The cost of total funding is calculated as annualized total interest expense divided by average total funding.
17
EX 99.1
| Nine Months Ended | |||||||||||||||||||||||||||||||||||
| September 30, 2020 | September 30, 2019 | ||||||||||||||||||||||||||||||||||
| Average | Yield | Average | Yield | ||||||||||||||||||||||||||||||||
| Balance | Interest | / Cost | Balance | Interest | / Cost | ||||||||||||||||||||||||||||||
| Interest-earning assets | |||||||||||||||||||||||||||||||||||
| Loans held-for-sale | $ | 20,591 | $ | 515 | 3.34 | % | $ | 99,130 | $ | 2,388 | 3.22 | % | |||||||||||||||||||||||
| SFR mortgage | 1,419,882 | 42,660 | 4.01 | % | 2,077,932 | 64,631 | 4.16 | % | |||||||||||||||||||||||||||
| Commercial real estate, multifamily, and construction | 2,527,331 | 89,348 | 4.72 | % | 3,168,206 | 111,119 | 4.69 | % | |||||||||||||||||||||||||||
| Commercial and industrial, SBA, and lease financing | 1,664,365 | 57,134 | 4.59 | % | 1,877,277 | 79,145 | 5.64 | % | |||||||||||||||||||||||||||
| Other consumer | 41,319 | 1,538 | 4.97 | % | 60,324 | 2,721 | 6.03 | % | |||||||||||||||||||||||||||
| Gross loans and leases | 5,673,488 | 191,195 | 4.50 | % | 7,282,869 | 260,004 | 4.77 | % | |||||||||||||||||||||||||||
| Securities | 1,069,668 | 22,402 | 2.80 | % | 1,384,928 | 40,322 | 3.89 | % | |||||||||||||||||||||||||||
| Other interest-earning assets | 393,495 | 3,480 | 1.18 | % | 342,597 | 7,083 | 2.76 | % | |||||||||||||||||||||||||||
| Total interest-earning assets | 7,136,651 | 217,077 | 4.06 | % | 9,010,394 | 307,409 | 4.56 | % | |||||||||||||||||||||||||||
| Allowance for credit losses | (76,275) | (60,294) | |||||||||||||||||||||||||||||||||
| BOLI and noninterest-earning assets | 603,128 | 579,992 | |||||||||||||||||||||||||||||||||
| Total assets | $ | 7,663,504 | $ | 9,530,092 | |||||||||||||||||||||||||||||||
| Interest-bearing liabilities | |||||||||||||||||||||||||||||||||||
| Savings | 915,364 | 8,366 | 1.22 | % | 1,112,949 | 15,152 | 1.82 | % | |||||||||||||||||||||||||||
| Interest-bearing checking | 1,717,483 | 7,575 | 0.59 | % | 1,548,655 | 13,562 | 1.17 | % | |||||||||||||||||||||||||||
| Money market | 627,927 | 3,255 | 0.69 | % | 831,401 | 11,124 | 1.79 | % | |||||||||||||||||||||||||||
| Certificates of deposit | 1,132,058 | 13,184 | 1.56 | % | 2,419,158 | 43,014 | 2.38 | % | |||||||||||||||||||||||||||
| Total interest-bearing deposits | 4,392,832 | 32,380 | 0.98 | % | 5,912,163 | 82,852 | 1.87 | % | |||||||||||||||||||||||||||
| FHLB advances | 821,349 | 14,561 | 2.37 | % | 1,347,330 | 25,889 | 2.57 | % | |||||||||||||||||||||||||||
| Securities sold under repurchase agreements | 779 | 4 | 0.69 | % | 2,146 | 47 | 2.93 | % | |||||||||||||||||||||||||||
| Long-term debt and other interest-bearing liabilities | 173,981 | 7,101 | 5.45 | % | 174,167 | 7,118 | 5.46 | % | |||||||||||||||||||||||||||
| Total interest-bearing liabilities | 5,388,941 | 54,046 | 1.34 | % | 7,435,806 | 115,906 | 2.08 | % | |||||||||||||||||||||||||||
| Noninterest-bearing deposits | 1,280,461 | 1,034,697 | |||||||||||||||||||||||||||||||||
| Noninterest-bearing liabilities | 115,582 | 99,113 | |||||||||||||||||||||||||||||||||
| Total liabilities | 6,784,984 | 8,569,616 | |||||||||||||||||||||||||||||||||
| Total stockholders’ equity | 878,520 | 960,476 | |||||||||||||||||||||||||||||||||
| Total liabilities and stockholders’ equity | $ | 7,663,504 | $ | 9,530,092 | |||||||||||||||||||||||||||||||
| Net interest income/spread | $ | 163,031 | 2.72 | % | $ | 191,503 | 2.48 | % | |||||||||||||||||||||||||||
| Net interest margin | 3.05 | % | 2.84 | % | |||||||||||||||||||||||||||||||
| Ratio of interest-earning assets to interest-bearing liabilities | 132.43 | % | 121.18 | % | |||||||||||||||||||||||||||||||
| Total deposits | $ | 5,673,293 | $ | 32,380 | 0.76 | % | $ | 6,946,860 | $ | 82,852 | 1.59 | % | |||||||||||||||||||||||
Total funding (1) | $ | 6,669,402 | $ | 54,046 | 1.08 | % | $ | 8,470,503 | $ | 115,906 | 1.83 | % | |||||||||||||||||||||||
(1)Total funding is the sum of interest-bearing liabilities and noninterest-bearing deposits. The cost of total funding is calculated as annualized total interest expense divided by average total funding.
18
EX 99.1
Banc of California, Inc.
Consolidated Operations
Non-GAAP Measures
(Dollars in thousands, except per share data)
(Unaudited)
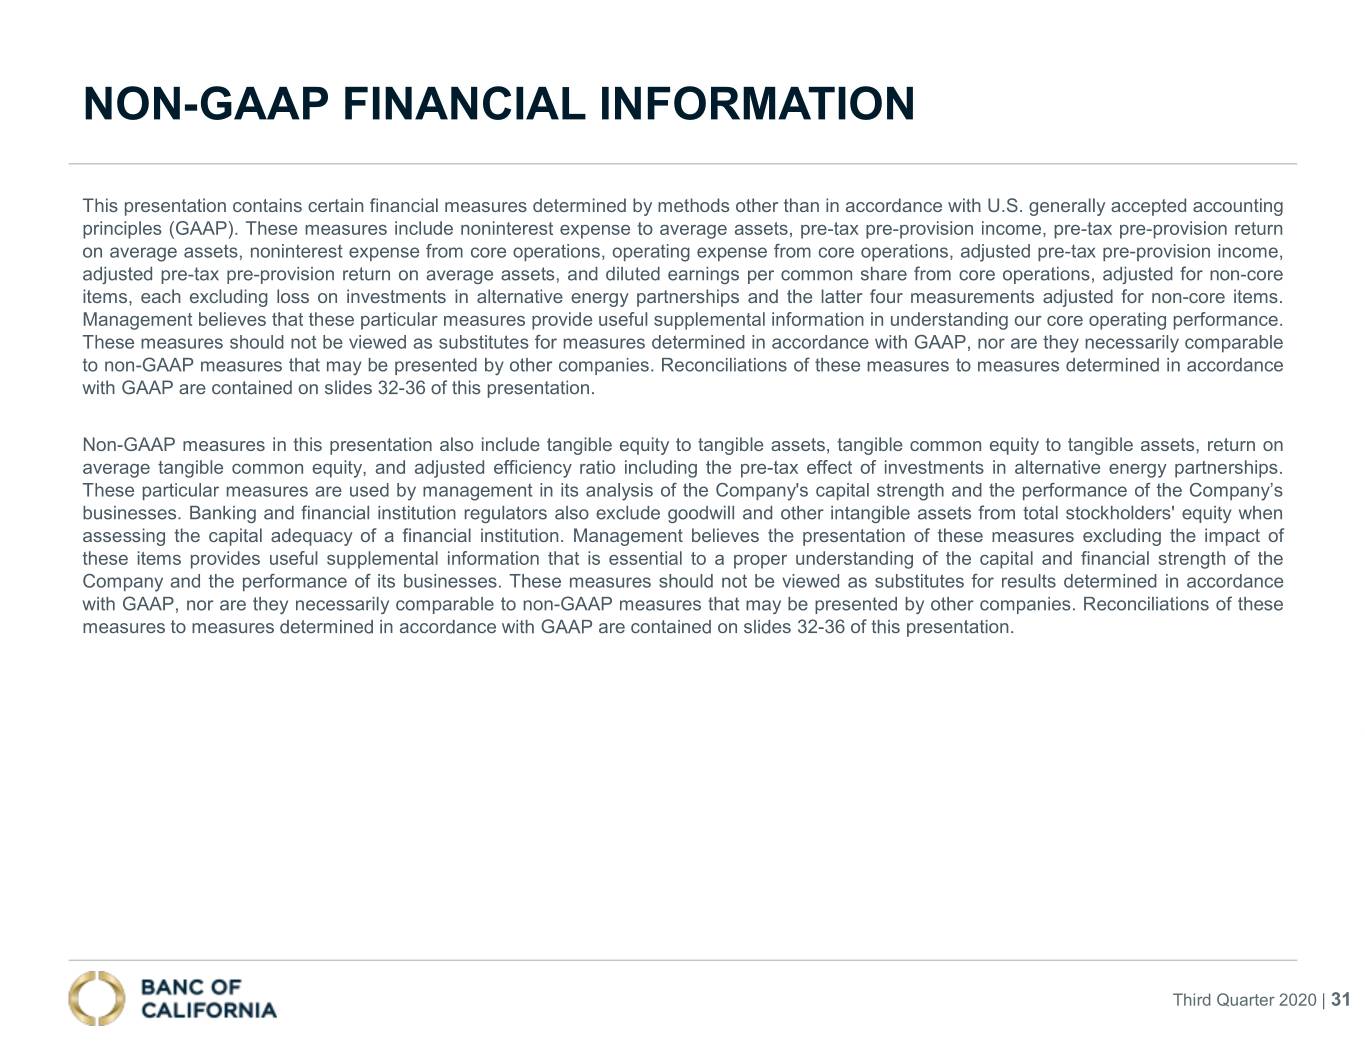
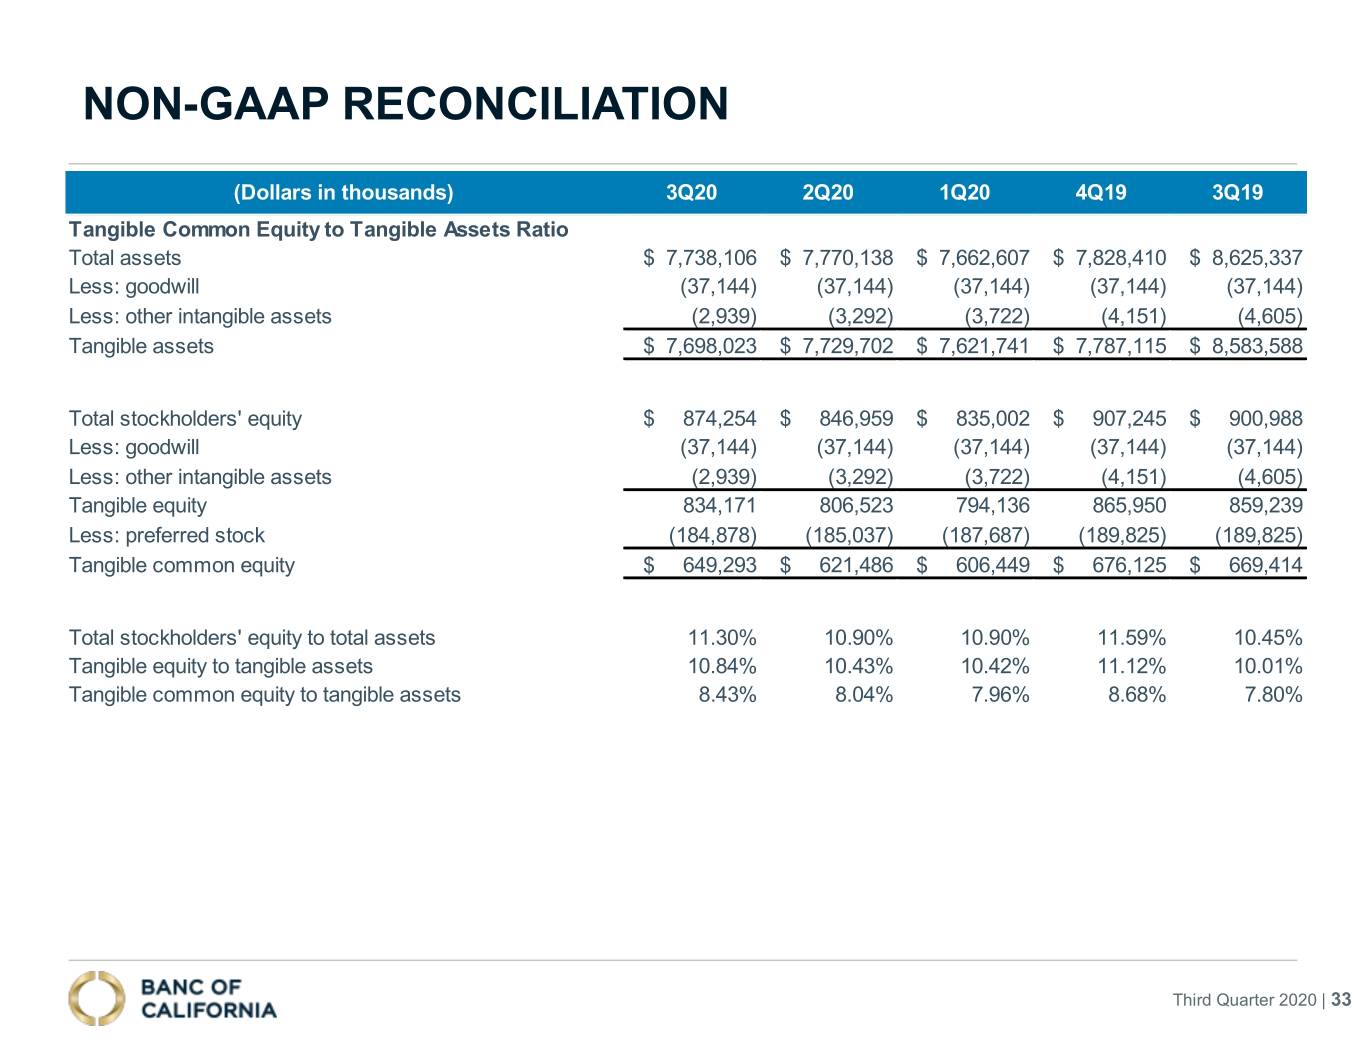
Under Item 10(e) of SEC Regulation S-K, public companies disclosing financial measures in filings with the SEC that are not calculated in accordance with GAAP must also disclose, along with each non-GAAP financial measure, certain additional information, including a presentation of the most directly comparable GAAP financial measure, a reconciliation of the non-GAAP financial measure to the most directly comparable GAAP financial measure, as well as a statement of the reasons why the company's management believes that presentation of the non-GAAP financial measure provides useful information to investors regarding the company's financial condition and results of operations and, to the extent material, a statement of the additional purposes, if any, for which the company's management uses the non-GAAP financial measure.
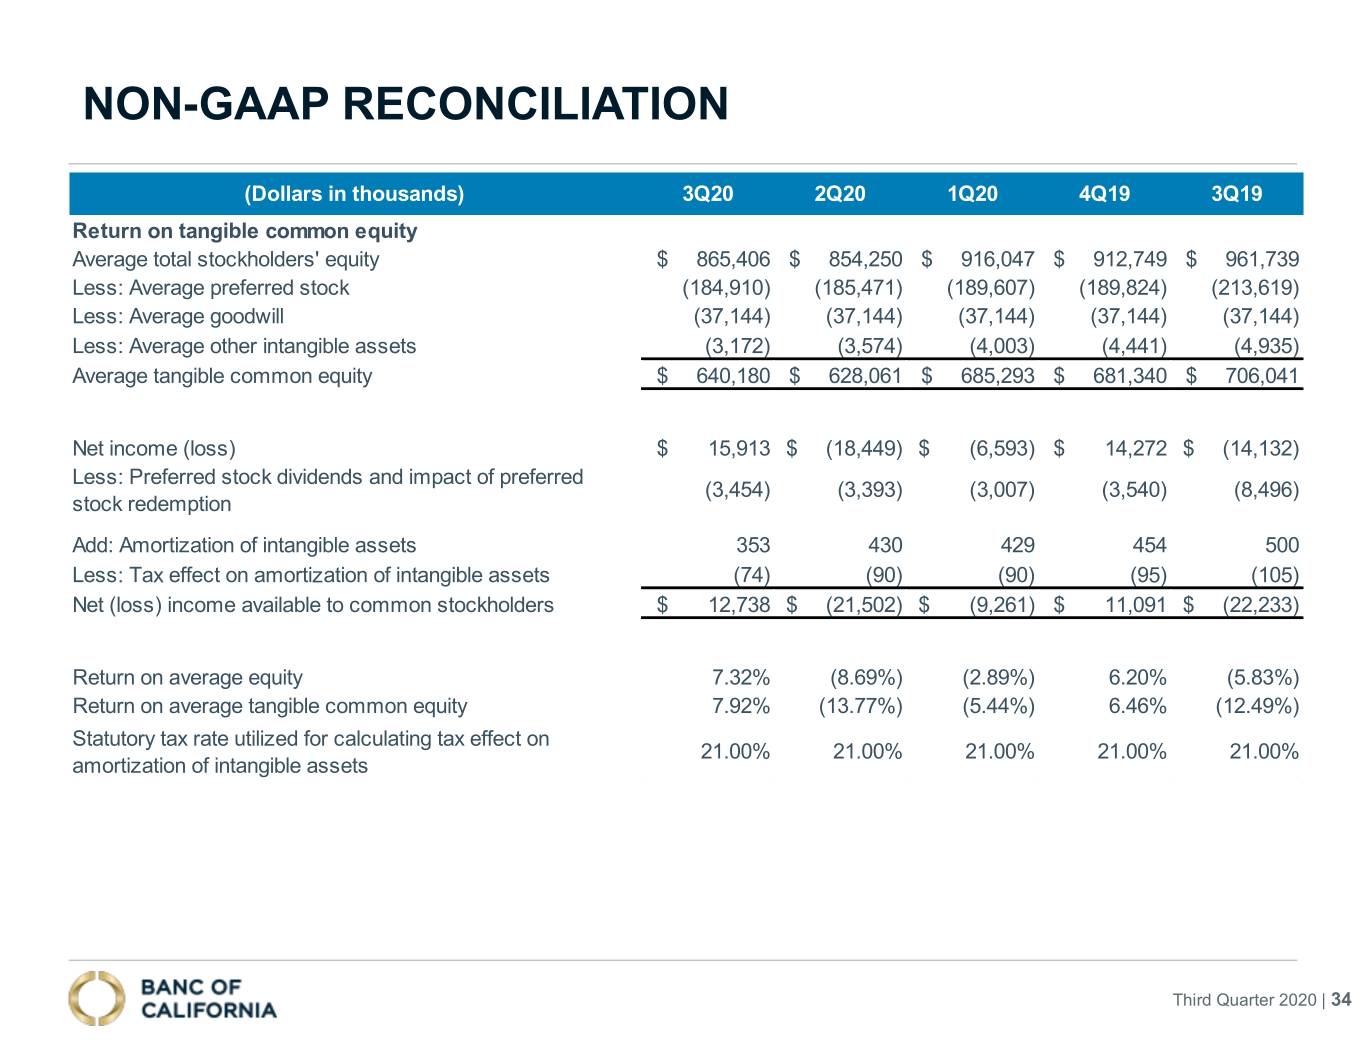
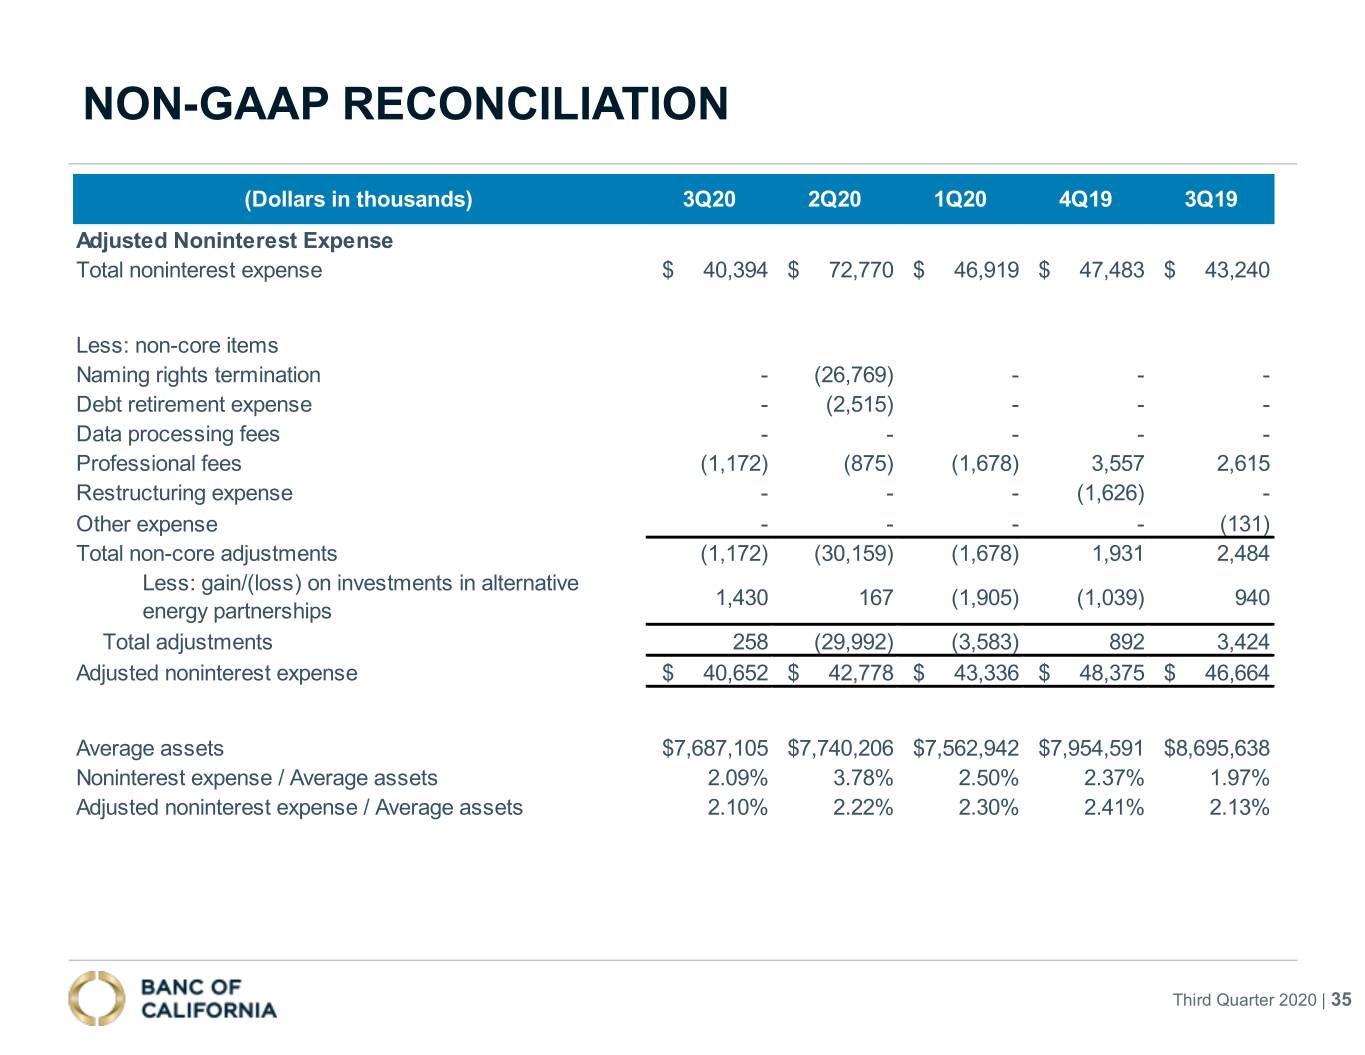
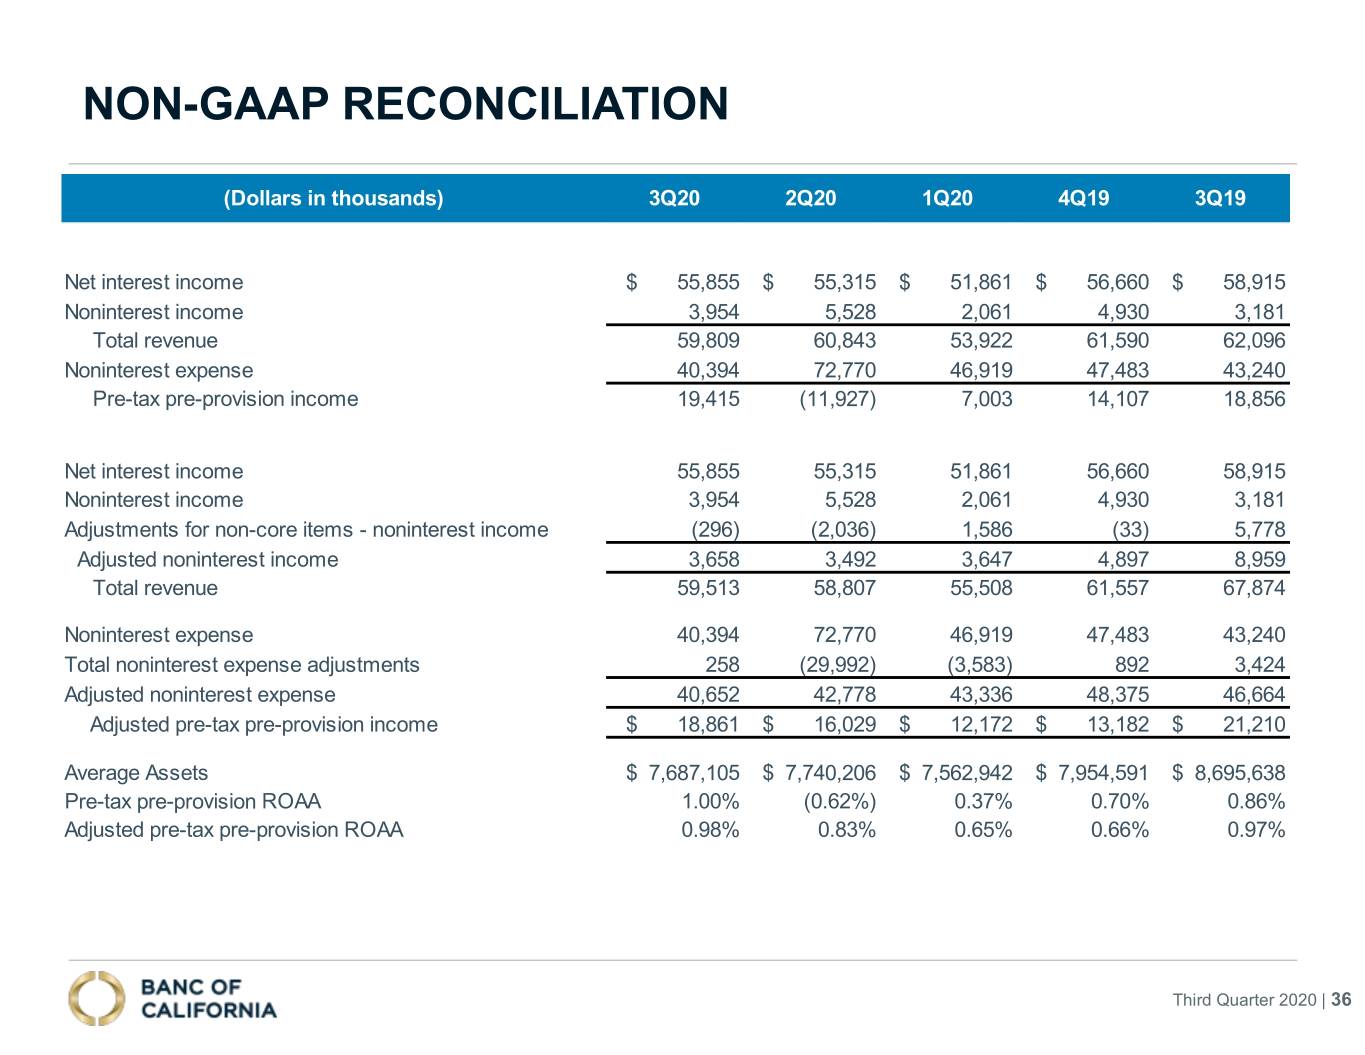
Return on average tangible common equity and efficiency ratio, as adjusted, tangible common equity, tangible common equity to tangible assets, tangible common equity per common share, and pre-tax pre-provision income and return on average assets ("ROAA") constitute supplemental financial information determined by methods other than in accordance with GAAP. These non-GAAP measures are used by management in its analysis of the Company's performance.
Tangible common equity is calculated by subtracting preferred stock, goodwill, and other intangible assets from stockholders' equity. Tangible assets is calculated by subtracting goodwill and other intangible assets from total assets. Banking regulators also exclude goodwill and other intangible assets from stockholders' equity when assessing the capital adequacy of a financial institution.
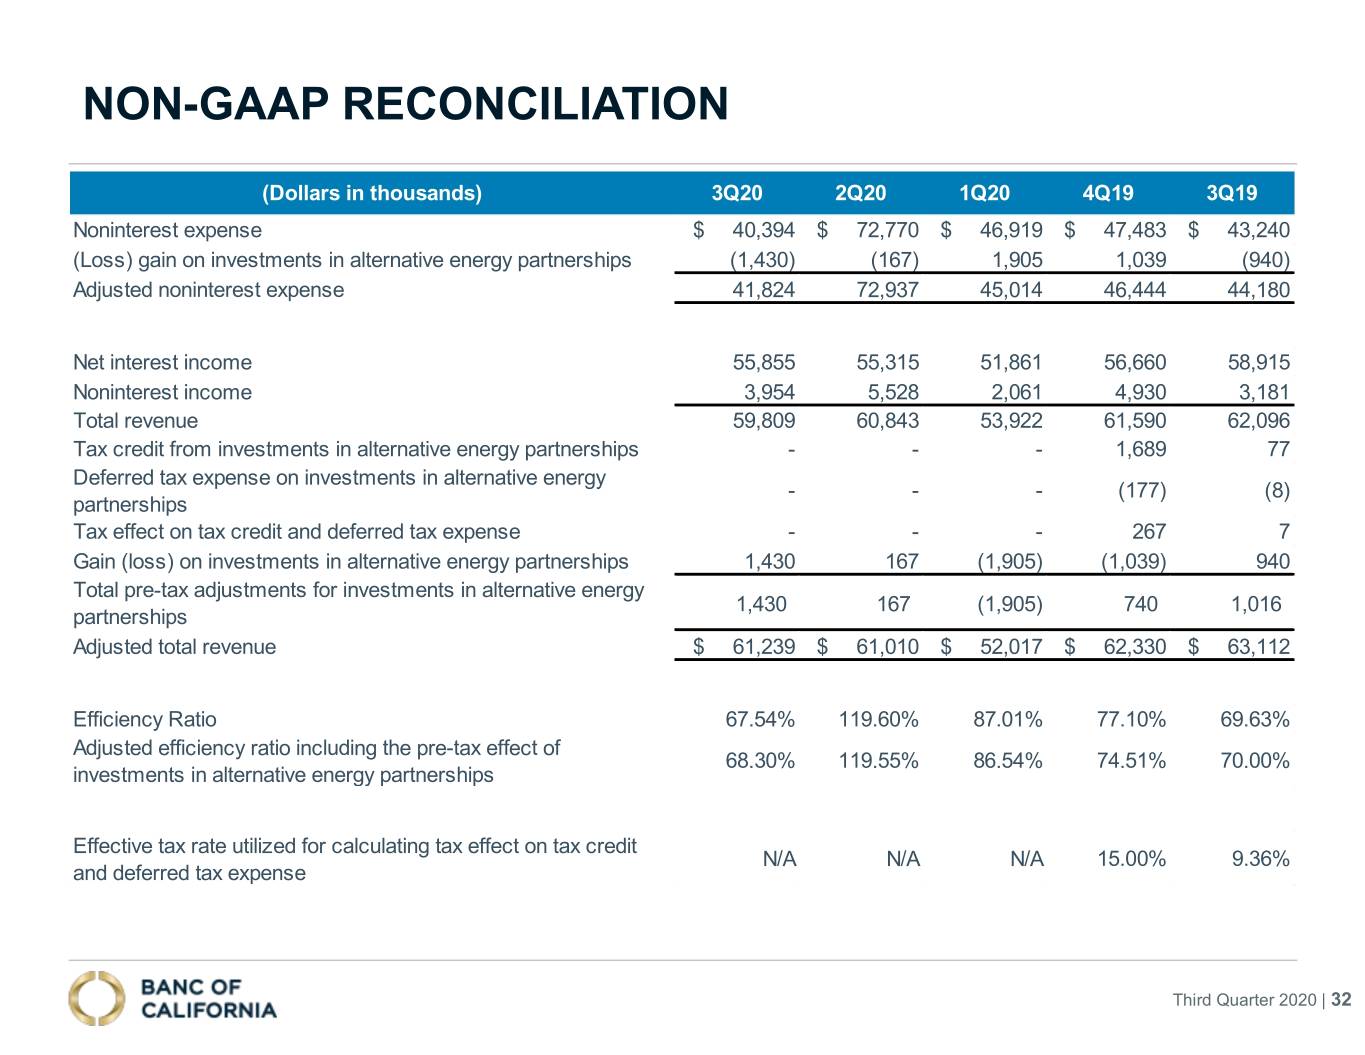
Adjusted efficiency ratio is calculated by excluding (gain) loss on investments in alternative energy partnerships from noninterest expense and adding total pre-tax return, which includes the (gain) loss on investments in alternative energy partnerships, to the sum of net interest income and noninterest income (total revenue). Pre-tax pre-provision income is calculated by adding total revenue and subtracting noninterest expense. Management believes the presentation of these financial measures adjusting the impact of these items provides useful supplemental information that is essential to a proper understanding of the financial results and operating performance of the Company.
This disclosure should not be viewed as a substitute for results determined in accordance with GAAP, nor is it necessarily comparable to non-GAAP performance measures that may be presented by other companies.
The following tables provide reconciliations of the non-GAAP measures with financial measures defined by GAAP.
19
EX 99.1
| September 30, 2020 | June 30, 2020 | March 31, 2020 | December 31, 2019 | September 30, 2019 | |||||||||||||||||||||||||
| Tangible common equity, and tangible common equity to tangible assets ratio | |||||||||||||||||||||||||||||
| Total assets | $ | 7,738,106 | $ | 7,770,138 | $ | 7,662,607 | $ | 7,828,410 | $ | 8,625,337 | |||||||||||||||||||
| Less goodwill | (37,144) | (37,144) | (37,144) | (37,144) | (37,144) | ||||||||||||||||||||||||
| Less other intangible assets | (2,939) | (3,292) | (3,722) | (4,151) | (4,605) | ||||||||||||||||||||||||
Tangible assets(1) | $ | 7,698,023 | $ | 7,729,702 | $ | 7,621,741 | $ | 7,787,115 | $ | 8,583,588 | |||||||||||||||||||
| Total stockholders' equity | $ | 874,254 | $ | 846,959 | $ | 835,002 | $ | 907,245 | $ | 900,988 | |||||||||||||||||||
| Less goodwill | (37,144) | (37,144) | (37,144) | (37,144) | (37,144) | ||||||||||||||||||||||||
| Less other intangible assets | (2,939) | (3,292) | (3,722) | (4,151) | (4,605) | ||||||||||||||||||||||||
Tangible equity(1) | 834,171 | 806,523 | 794,136 | 865,950 | 859,239 | ||||||||||||||||||||||||
| Less preferred stock | (184,878) | (185,037) | (187,687) | (189,825) | (189,825) | ||||||||||||||||||||||||
Tangible common equity(1) | $ | 649,293 | $ | 621,486 | $ | 606,449 | $ | 676,125 | $ | 669,414 | |||||||||||||||||||
| Total stockholders' equity to total assets | 11.30 | % | 10.90 | % | 10.90 | % | 11.59 | % | 10.45 | % | |||||||||||||||||||
Tangible equity to tangible assets(1) | 10.84 | % | 10.43 | % | 10.42 | % | 11.12 | % | 10.01 | % | |||||||||||||||||||
Tangible common equity to tangible assets(1) | 8.43 | % | 8.04 | % | 7.96 | % | 8.68 | % | 7.80 | % | |||||||||||||||||||
| Common shares outstanding | 49,760,543 | 49,750,958 | 49,593,077 | 50,413,681 | 50,406,763 | ||||||||||||||||||||||||
| Class B non-voting non-convertible common shares outstanding | 477,321 | 477,321 | 477,321 | 477,321 | 477,321 | ||||||||||||||||||||||||
| Total common shares outstanding | 50,237,864 | 50,228,279 | 50,070,398 | 50,891,002 | 50,884,084 | ||||||||||||||||||||||||
Tangible common equity per common share(1) | $ | 12.92 | $ | 12.37 | $ | 12.11 | $ | 13.29 | $ | 13.16 | |||||||||||||||||||
| Book value per common share | $ | 13.72 | $ | 13.18 | $ | 12.93 | $ | 14.10 | $ | 13.98 | |||||||||||||||||||
(1)Non-GAAP measure.
20
EX 99.1
Banc of California, Inc.
Consolidated Operations
Non-GAAP Measures, Continued
(Dollars in thousands, except per share data)
(Unaudited)
| Three Months Ended | |||||||||||||||||||||||||||||
| September 30, 2020 | June 30, 2020 | March 31, 2020 | December 31, 2019 | September 30, 2019 | |||||||||||||||||||||||||
| Return on tangible common equity | |||||||||||||||||||||||||||||
| Average total stockholders' equity | $ | 865,406 | $ | 854,250 | $ | 916,047 | $ | 912,749 | $ | 961,739 | |||||||||||||||||||
| Less average preferred stock | (184,910) | (185,471) | (189,607) | (189,824) | (213,619) | ||||||||||||||||||||||||
| Less average goodwill | (37,144) | (37,144) | (37,144) | (37,144) | (37,144) | ||||||||||||||||||||||||
| Less average other intangible assets | (3,172) | (3,574) | (4,003) | (4,441) | (4,935) | ||||||||||||||||||||||||
Average tangible common equity(1) | $ | 640,180 | $ | 628,061 | $ | 685,293 | $ | 681,340 | $ | 706,041 | |||||||||||||||||||
| Net income (loss) | $ | 15,913 | $ | (18,449) | $ | (6,593) | $ | 14,272 | $ | (14,132) | |||||||||||||||||||
| Less preferred stock dividends and impact of preferred stock redemption | (3,454) | (3,393) | (3,007) | (3,540) | (8,496) | ||||||||||||||||||||||||
| Add amortization of intangible assets | 353 | 430 | 429 | 454 | 500 | ||||||||||||||||||||||||
| Less tax effect on amortization and impairment of intangible assets | (74) | (90) | (90) | (95) | (105) | ||||||||||||||||||||||||
Net income (loss) available to common stockholders(1) | $ | 12,738 | $ | (21,502) | $ | (9,261) | $ | 11,091 | $ | (22,233) | |||||||||||||||||||
| Return on average equity | 7.32 | % | (8.69) | % | (2.89) | % | 6.20 | % | (5.83) | % | |||||||||||||||||||
Return on average tangible common equity(1) | 7.92 | % | (13.77) | % | (5.44) | % | 6.46 | % | (12.49) | % | |||||||||||||||||||
| Statutory tax rate utilized for calculating tax effect on amortization of intangible assets | 21.00 | % | 21.00 | % | 21.00 | % | 21.00 | % | 21.00 | % | |||||||||||||||||||
| Three Months Ended | |||||||||||||||||||||||||||||
| September 30, 2020 | June 30, 2020 | March 31, 2020 | December 31, 2019 | September 30, 2019 | |||||||||||||||||||||||||
| Adjusted efficiency ratio including the pre-tax effect of investments in alternative energy partnerships | |||||||||||||||||||||||||||||
| Noninterest expense | $ | 40,394 | $ | 72,770 | $ | 46,919 | $ | 47,483 | $ | 43,240 | |||||||||||||||||||
| Gain (loss) on investments in alternative energy partnerships | 1,430 | 167 | (1,905) | (1,039) | 940 | ||||||||||||||||||||||||
Total noninterest expense excluding (gain) loss on investments in alternative energy partnerships(1) | $ | 41,824 | $ | 72,937 | $ | 45,014 | $ | 46,444 | $ | 44,180 | |||||||||||||||||||
| Net interest income | $ | 55,855 | $ | 55,315 | $ | 51,861 | $ | 56,660 | $ | 58,915 | |||||||||||||||||||
| Noninterest income | 3,954 | 5,528 | 2,061 | 4,930 | 3,181 | ||||||||||||||||||||||||
| Total revenue | 59,809 | 60,843 | 53,922 | 61,590 | 62,096 | ||||||||||||||||||||||||
| Tax credit from investments in alternative energy partnerships | — | — | — | 1,689 | 77 | ||||||||||||||||||||||||
| Deferred tax expense on investments in alternative energy partnerships | — | — | — | (177) | (8) | ||||||||||||||||||||||||
| Tax effect on tax credit and deferred tax expense | — | — | — | 267 | 7 | ||||||||||||||||||||||||
| (Loss) gain on investments in alternative energy partnerships | 1,430 | 167 | (1,905) | (1,039) | 940 | ||||||||||||||||||||||||
| Total pre-tax adjustments for investments in alternative energy partnerships | 1,430 | 167 | (1,905) | 740 | 1,016 | ||||||||||||||||||||||||
Adjusted total revenue(1) | $ | 61,239 | $ | 61,010 | $ | 52,017 | $ | 62,330 | $ | 63,112 | |||||||||||||||||||
Efficiency ratio(1) | 67.54 | % | 119.60 | % | 87.01 | % | 77.10 | % | 69.63 | % | |||||||||||||||||||
Adjusted efficiency ratio including the pre-tax effect of investments in alternative energy partnerships(1) | 68.30 | % | 119.55 | % | 86.54 | % | 74.51 | % | 70.00 | % | |||||||||||||||||||
| Effective tax rate utilized for calculating tax effect on tax credit and deferred tax expense | N/A | N/A | N/A | 15.00 | % | 9.36 | % | ||||||||||||||||||||||
(1)Non-GAAP measure.
21
EX 99.1
Banc of California, Inc.
Consolidated Operations
Non-GAAP Measures, Continued
(Dollars in thousands, except per share data)
(Unaudited)
| Three Months Ended | |||||||||||||||||||||||||||||
| September 30, 2020 | June 30, 2020 | March 31, 2020 | December 31, 2019 | September 30, 2019 | |||||||||||||||||||||||||
| Adjusted noninterest income and expense | |||||||||||||||||||||||||||||
| Total noninterest income | $ | 3,954 | $ | 5,528 | $ | 2,061 | $ | 4,930 | $ | 3,181 | |||||||||||||||||||
| Adjustments for non-core items: | |||||||||||||||||||||||||||||
| Net (gain) loss on securities available for sale | — | (2,011) | — | (3) | 5,794 | ||||||||||||||||||||||||
| Net (gain) loss on sale of legacy SFR loans held for sale | (272) | — | — | — | — | ||||||||||||||||||||||||
| Fair value adjustment on legacy SFR loans held for sale | (24) | (25) | 1,586 | (30) | (16) | ||||||||||||||||||||||||
| Total non-core adjustments - noninterest income | (296) | (2,036) | 1,586 | (33) | 5,778 | ||||||||||||||||||||||||
Adjusted noninterest income(1) | $ | 3,658 | $ | 3,492 | $ | 3,647 | $ | 4,897 | $ | 8,959 | |||||||||||||||||||
| Total noninterest expense | $ | 40,394 | $ | 72,770 | $ | 46,919 | $ | 47,483 | $ | 43,240 | |||||||||||||||||||
| Adjustments for non-core items: | |||||||||||||||||||||||||||||
| Naming rights termination | — | (26,769) | — | — | — | ||||||||||||||||||||||||
| Extinguishment of debt | — | (2,515) | — | — | — | ||||||||||||||||||||||||
| Professional (fees) recoveries | (1,172) | (875) | (1,678) | 3,557 | 2,615 | ||||||||||||||||||||||||
| Restructuring expense | — | — | — | (1,626) | — | ||||||||||||||||||||||||
| Other expenses | — | — | — | — | (131) | ||||||||||||||||||||||||
| Total non-core adjustments - noninterest expense | (1,172) | (30,159) | (1,678) | 1,931 | 2,484 | ||||||||||||||||||||||||
| Gain (loss) on investments in alternative energy partnerships | 1,430 | 167 | (1,905) | (1,039) | 940 | ||||||||||||||||||||||||
| Total adjustments - noninterest expense | 258 | (29,992) | (3,583) | 892 | 3,424 | ||||||||||||||||||||||||
Adjusted noninterest expense(1) | $ | 40,652 | $ | 42,778 | $ | 43,336 | $ | 48,375 | $ | 46,664 | |||||||||||||||||||
| Three Months Ended | |||||||||||||||||||||||||||||
| September 30, 2020 | June 30, 2020 | March 31, 2020 | December 31, 2019 | September 30, 2019 | |||||||||||||||||||||||||
| Adjusted pre-tax pre-provision income | |||||||||||||||||||||||||||||
| Net interest income | $ | 55,855 | $ | 55,315 | $ | 51,861 | $ | 56,660 | $ | 58,915 | |||||||||||||||||||
| Noninterest income | 3,954 | 5,528 | 2,061 | 4,930 | 3,181 | ||||||||||||||||||||||||
| Total revenue | 59,809 | 60,843 | 53,922 | 61,590 | 62,096 | ||||||||||||||||||||||||
| Noninterest expense | 40,394 | 72,770 | 46,919 | 47,483 | 43,240 | ||||||||||||||||||||||||
Pre-tax pre-provision income (loss)(1) | $ | 19,415 | $ | (11,927) | $ | 7,003 | $ | 14,107 | $ | 18,856 | |||||||||||||||||||
| Net interest income | $ | 55,855 | $ | 55,315 | $ | 51,861 | $ | 56,660 | $ | 58,915 | |||||||||||||||||||
| Noninterest income | 3,954 | 5,528 | 2,061 | 4,930 | 3,181 | ||||||||||||||||||||||||
| Total non-core adjustments - noninterest income | (296) | (2,036) | 1,586 | (33) | 5,778 | ||||||||||||||||||||||||
Adjusted noninterest income(1) | 3,658 | 3,492 | 3,647 | 4,897 | 8,959 | ||||||||||||||||||||||||
| Total revenue | 59,513 | 58,807 | 55,508 | 61,557 | 67,874 | ||||||||||||||||||||||||
| Noninterest expense | 40,394 | 72,770 | 46,919 | 47,483 | 43,240 | ||||||||||||||||||||||||
| Total adjustments - noninterest expense | 258 | (29,992) | (3,583) | 892 | 3,424 | ||||||||||||||||||||||||
Adjusted noninterest expense(1) | 40,652 | 42,778 | 43,336 | 48,375 | 46,664 | ||||||||||||||||||||||||
Adjusted pre-tax pre-provision income(1) | $ | 18,861 | $ | 16,029 | $ | 12,172 | $ | 13,182 | $ | 21,210 | |||||||||||||||||||
| Average assets | $ | 7,687,105 | $ | 7,740,206 | $ | 7,562,942 | $ | 7,954,591 | $ | 8,695,638 | |||||||||||||||||||
| Pre-tax pre-provision income (loss) ROAA | 1.00 | % | (0.62) | % | 0.37 | % | 0.70 | % | 0.86 | % | |||||||||||||||||||
Adjusted pre-tax pre-provision income ROAA(1) | 0.98 | % | 0.83 | % | 0.65 | % | 0.66 | % | 0.97 | % | |||||||||||||||||||
(1)Non-GAAP measure.
22