Exhibit 99.1
 |
 |
CONTACT:
|
MARK J. GRESCOVICH,
|
|
PRESIDENT & CEO
|
|||
|
PETER J. CONNER, CFO
|
|||
|
(509) 527-3636
|
|||
|
NEWS RELEASE
|
|||
Banner Corporation Reports Net Income of $23.5 Million, or $0.67 Per Diluted Share, in Second Quarter 2020
Declares Quarterly Cash Dividend of $0.41 Per Share
Provides Update to Pandemic Relief and Community Support Actions
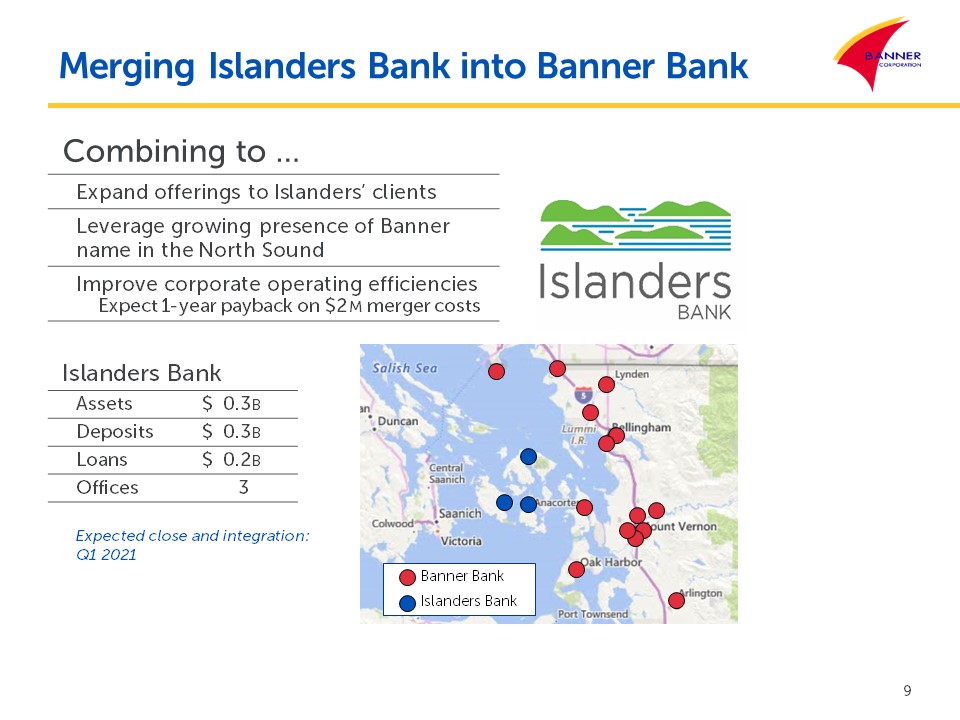
Walla Walla, WA - July 22, 2020 - Banner Corporation (NASDAQ GSM: BANR) ("Banner"), the parent company of Banner Bank and Islanders
Bank, today reported net income of $23.5 million, or $0.67 per diluted share, for the second quarter 2020, compared to $16.9 million, or $0.47 per diluted share, in the preceding quarter and $39.7 million, or $1.14 per diluted share, in the second
quarter of 2019. Banner's second quarter earnings reflect the continuing impact of the COVID-19 pandemic in all the western states that Banner operates. Second quarter of 2020 results also include $336,000 of acquisition-related expenses, compared
to $1.1 million of acquisition-related expenses in the preceding quarter and $301,000 in the second quarter of 2019. In the first six months of 2020, net income was $40.4 million, or $1.14 per diluted share, compared to $73.0 million, or $2.09 per
diluted share, in the first six months a year ago. The results for the first six months of 2020 include $1.5 million of acquisition-related expenses, compared to $2.4 million of acquisition-related expenses in the first six months of 2019.
Banner also announced that its Board of Directors declared a regular quarterly cash dividend of $0.41 per share. The dividend will be
payable August 13, 2020, to common shareholders of record on August 4, 2020.
“With strong loan and deposit growth, Banner’s core operating performance generated solid revenue growth with increases in both net
interest income and non-interest income compared to both the preceding quarter and the same quarter last year. However; second quarter earnings were impacted by a number of items, including the anticipated impact of the COVID-19 pandemic on the
economy, and subsequently, the increase in our allowance for credit losses,” said Mark Grescovich, President and CEO. “To provide support for our clients, we have made available several assistance programs. Banner has provided SBA paycheck
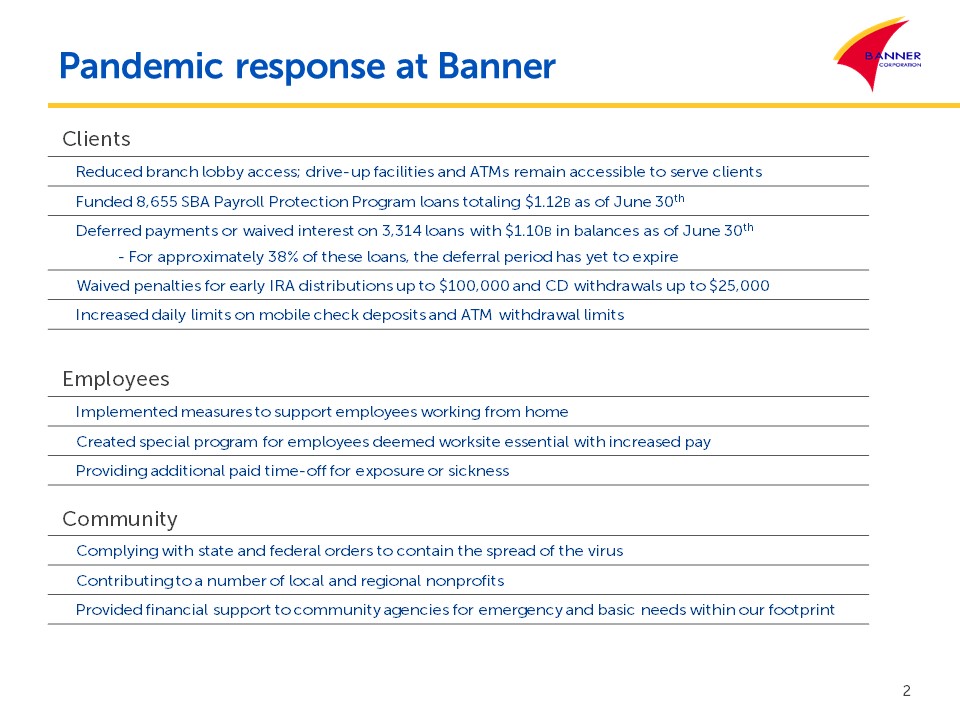
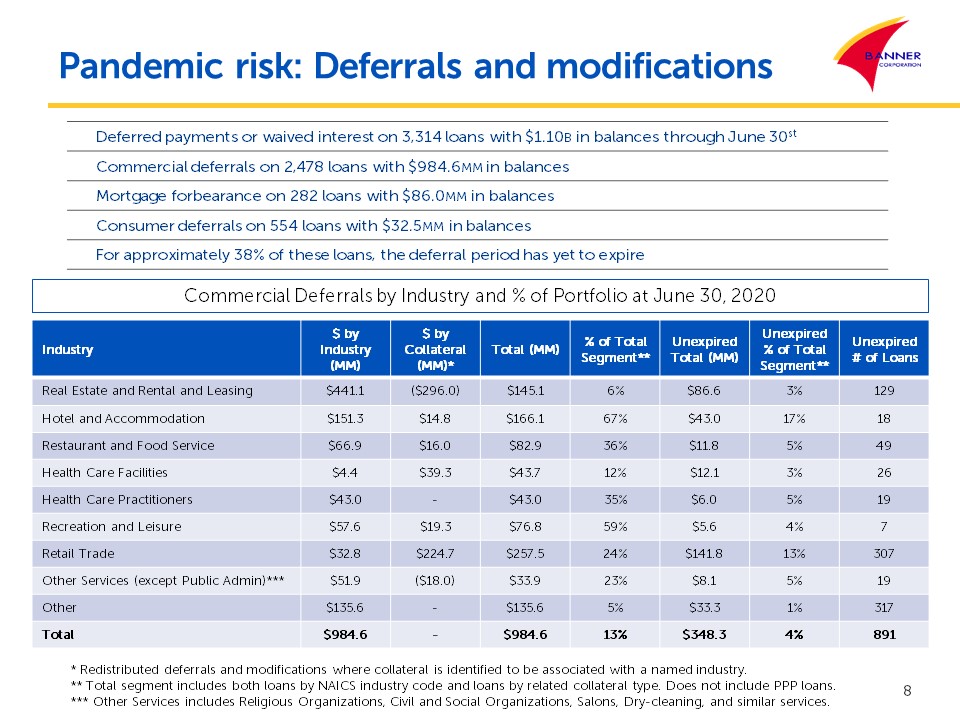
protection funds totaling nearly $1.12 billion for 8,655 businesses and provided deferred payments or waived interest on 3,314 loans totaling $1.1 billion as of June 30, 2020. We will continue to do the right thing for our clients, our communities,
our colleagues, our company and our shareholders while providing a consistent and reliable source of commerce and capital through all economic cycles and changing events. I am very proud of our more than 2,100 colleagues that are working extremely
hard to assist our clients and communities during these difficult times."
“We have proactively downgraded certain modified loans and other loans we consider at risk due to the COVID-19 induced economic slowdown. As a result,
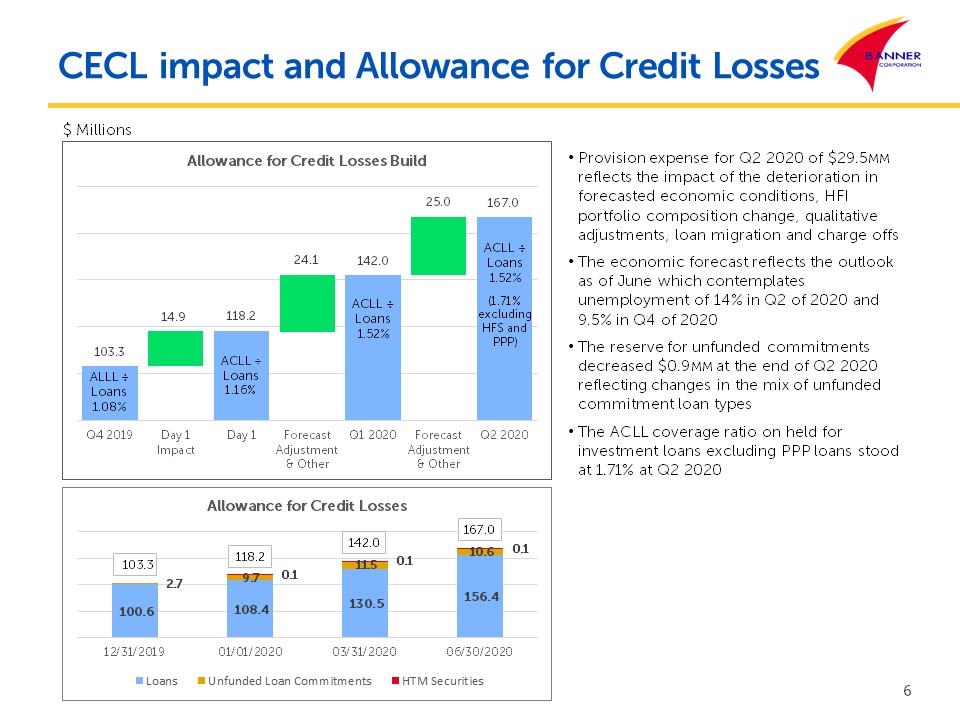
along with recent further deterioration in economic conditions, we increased the allowance for credit losses to $156.4 million with the addition of $29.5 million in credit loss provisions during the quarter ended June 30, 2020,” Grescovich added.
"This provision compares to a $21.7 million provision for credit losses during the preceding quarter and a $2.0 million provision for loan losses in the second quarter a year ago. The allowance for credit losses - loans was 1.52% of total loans and
418% of non-performing loans at the end of the second quarter of 2020."
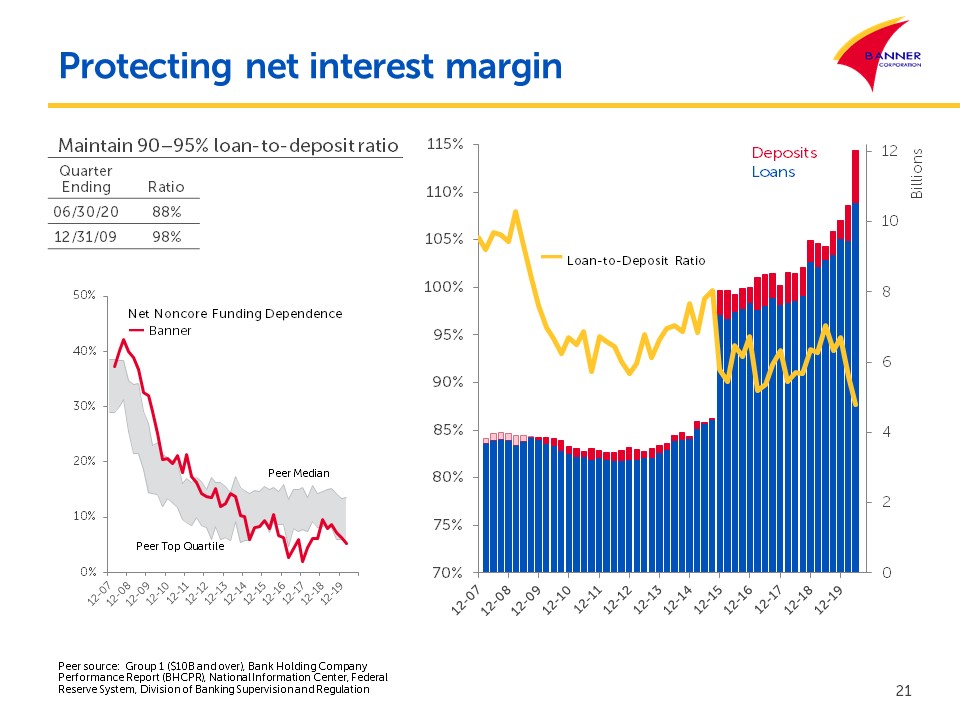
At June 30, 2020, Banner Corporation had $14.41 billion in assets, $10.13 billion in net loans and $12.02 billion in deposits. Banner
operates 176 branch offices, including branches located in eight of the top 20 largest western Metropolitan Statistical Areas by population.
COVID-19 Pandemic Update
|
•
|
SBA Paycheck Protection Program. The
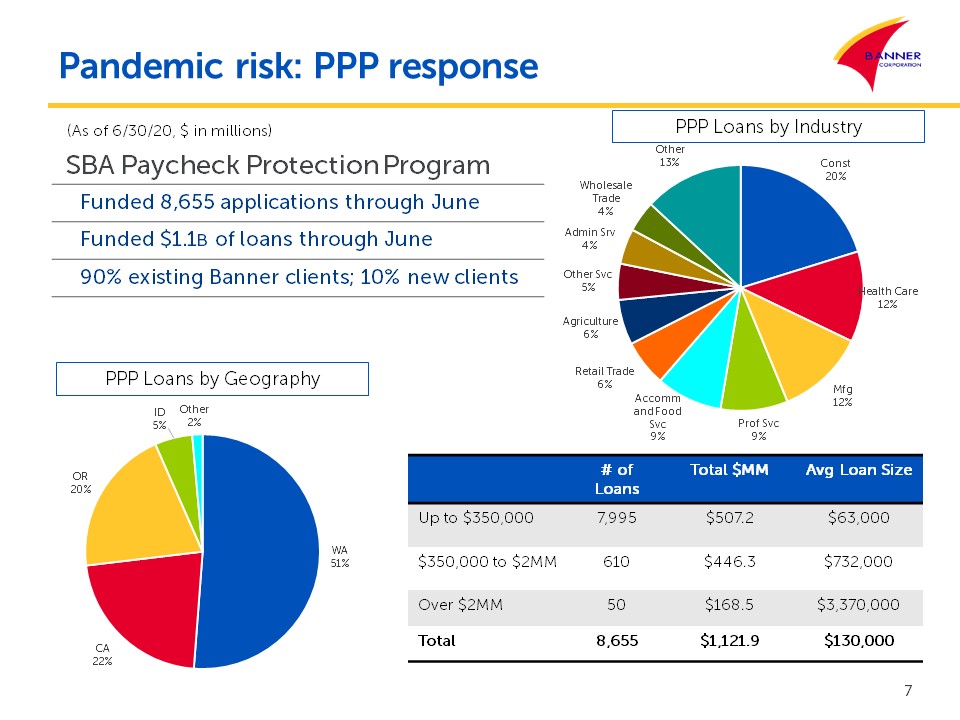
U.S. Small Business Administration (SBA) provides assistance to small businesses impacted by COVID-19 through the Paycheck Protection Program (PPP), which was designed to provide near-term relief to help small businesses sustain
operations. As of June 30, 2020, Banner had funded 8,655 applications totaling $1.12 billion of loans in its service area through the PPP program. The deadline for PPP loan applications to the SBA has been extended to August 8, 2020.
Banner is continuing to accept new PPP applications based on this extended deadline and is assisting small businesses with other borrowing options as they become available, including the Main Street Lending Program and other government
sponsored lending programs, as appropriate.
|
|
•
|
Loan Accommodations. Banner is
continuing to offer payment and financial relief programs for borrowers impacted by COVID-19. These programs include initial loan payment deferrals or interest-only payments for up to 90 days, waived late fees, and, on a more limited
basis, waived interest and temporarily suspended foreclosure proceedings. Deferred loans are re-evaluated at the end of the initial deferral period and will either return to the original loan terms or could be eligible for an additional
deferral period for up to 90 days. In addition, Banner has entered into payment forbearance agreements with other customers for periods of up to six months. Banner had deferred payment or waived interest on 3,314 loans totaling $1.1
billion through June 30, 2020. Since these loans were performing loans that were current on their payments prior to the COVID-19 pandemic, these modifications are not considered to be troubled debt restructurings through June 30, 2020
pursuant to applicable accounting and regulatory guidance. As of June 30, 2020, the deferral period had ended for approximately 62% of these loans.
|
|
•
|
Allowance for Credit Losses - Loans.
Banner recorded a provision for credit losses of $29.5 million for the second quarter of 2020, compared to a $21.7 million provision in the preceding quarter and a $2.0 million provision in the second quarter a year ago. The provisions
for the current and
|
BANR - Second Quarter 2020 Results
July 22, 2020
Page 2
|
|
preceding quarters reflect expected lifetime credit losses based upon the conditions and economic outlook that existed as of June 30, 2020 and
March 31, 2020, respectively.
|
|
•
|
Branch Operations, IT Changes and One-Time
Expenses. Banner has taken various steps to help protect customers and staff by limiting branch activities to appointment only and use of drive-up facilities, and by encouraging the use of digital and electronic banking channels.
In select markets on a test basis, Banner has begun taking steps to resume more normal branch activities with specific guidelines in place to ensure the safety of our clients and our personnel. To further the well-being of staff and
customers, Banner implemented measures to allow employees to work from home to the extent practicable. To facilitate this approach, Banner allocated additional computer equipment to staff and enhanced Banner's network capabilities with
several upgrades. These expenses plus other expenses incurred in response to the COVID-19 pandemic resulted in $2.2 million of related costs during the second quarter of 2020, compared to $239,000 of related costs in the first quarter of
2020.
|
|
•
|
Capital Management. At June 30, 2020,
the tangible common shareholders' equity to tangible assets* ratio was 8.76% and Banner’s capital was well in excess of all regulatory requirements. On June 30, 2020, Banner issued and sold in an underwritten offering $100.0 million
aggregate principal amount of 5.000% Fixed-to-Floating Rate Subordinated Notes due 2030 (Notes) at a public offering price equal to 100% of the aggregate principal amount of the Notes, resulting in net proceeds, after underwriting discounts
and estimated offering expenses, of approximately $98.1 million. During the preceding quarter, prior to the COVID-19 pandemic outbreak, Banner repurchased 624,780 shares of its common stock. To preserve capital, Banner has discontinued
any additional repurchase of shares under its stock repurchase program until further notice and will closely monitor capital levels going forward.
|
Second Quarter 2020 Highlights
|
•
|
Revenues increased to $147.3 million, compared to $138.4 million in the preceding quarter, and increased 6% when compared to $139.4 million in
the second quarter a year ago.
|
|
•
|
Net interest income, before the provision for credit losses, was $119.5 million in the second quarter of 2020, compared to $119.3 million in the
preceding quarter and $116.7 million in the second quarter a year ago.
|
|
•
|
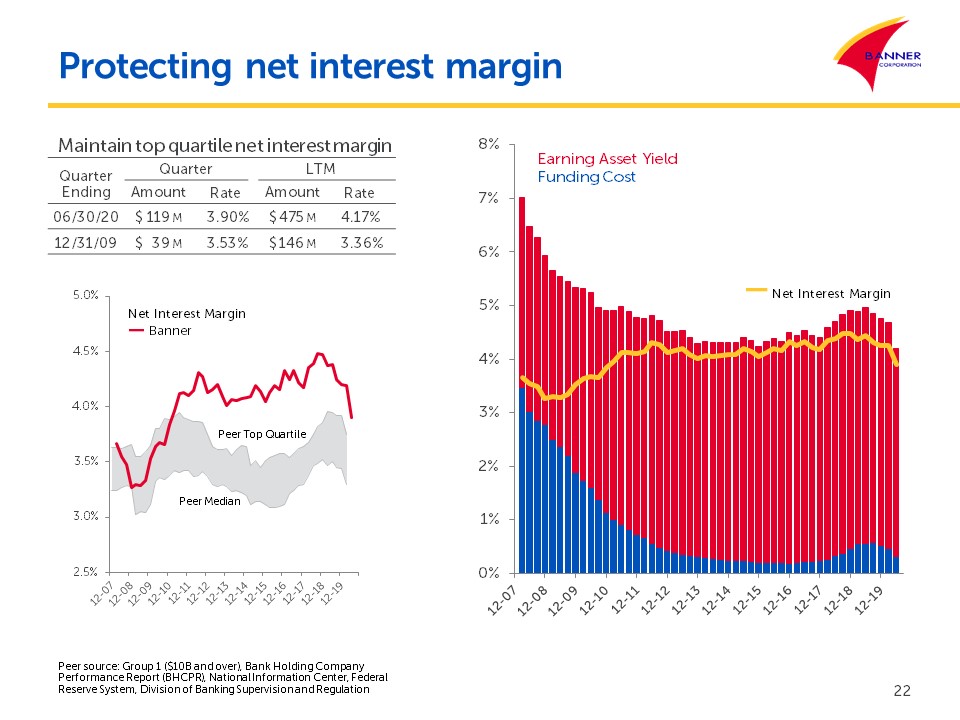
Net interest margin as reported was 3.84%, compared to 4.19% in the preceding quarter and 4.38% in the second quarter a year ago.
|
|
•
|
Net interest margin on a tax equivalent basis was 3.90%, compared to 4.25% in the preceding quarter and 4.44% in the second quarter a year ago.
|
|
•
|
Mortgage banking revenues increased 39% to $14.1 million, compared to $10.2 million in the preceding quarter, and increased 138% compared to $5.9
million in the second quarter a year ago, reflecting strong refinance demand and higher margins due to decreasing market interest rates.
|
|
•
|
Return on average assets was 0.68%, compared to 0.54% in the preceding quarter and 1.36% in the second quarter a year ago.
|
|
•
|
Net loans receivable increased to $10.13 billion at June 30, 2020, compared to $9.16 billion at March 31, 2020, and increased 17% when compared
to $8.65 billion at June 30, 2019.
|
|
•
|
Non-performing assets decreased to $39.9 million, or 0.28% of total assets, at June 30, 2020, compared to $46.1 million, or 0.36% of total assets
in the preceding quarter, and increased from $21.0 million, or 0.18% of total assets, at June 30, 2019.
|
|
•
|
Provision for credit losses - loans was $29.5 million, and the allowance for credit losses - loans was $156.4 million, or 1.52% of total loans
receivable, as of June 30, 2020, compared to $130.5 million, or 1.41% of total loans receivable as of March 31, 2020 and $98.3 million or 1.12% of total loans receivable as of June 30, 2019.
|
|
•
|
A $905,000 recapture of provision for credit losses - unfunded loan commitments was recorded and the allowance for credit losses - unfunded loan
commitments was $10.6 million as of June 30, 2020, compared to $11.5 million as of March 31, 2020.
|
|
•
|
Core deposits increased 18% to $10.97 billion at June 30, 2020, compared to $9.28 billion at March 31, 2020, and increased 34% compared to $8.22
billion a year ago. Core deposits represented 91% of total deposits at June 30, 2020.
|
|
•
|
Common shareholders’ equity per share increased 1% to $46.22 at June 30, 2020, compared to $45.63 at the preceding quarter end, and increased 5%
from $43.99 a year ago.
|
|
•
|
Tangible common shareholders' equity per share* increased 2% to $34.89 at June 30, 2020, compared to $34.23 at the preceding quarter end, and
increased 5% from $33.36 a year ago.
|
*Tangible common shareholders' equity per share and the ratio of tangible common equity to tangible assets (both of
which exclude goodwill and other intangible assets, net), and references to adjusted revenue (which excludes fair value adjustments and net gain (loss) on the sale of securities from the total of net interest income before provision for loan losses
and non-interest income) and the adjusted efficiency ratio (which excludes acquisition-related expenses, COVID-19 expenses, amortization of core deposit intangibles, real estate owned gain (loss), Federal Home Loan Bank (FHLB) prepayment penalties
and state/municipal taxes from non-interest expense divided by adjusted revenue) represent non-GAAP (Generally Accepted Accounting Principles) financial measures. Management has presented these non-GAAP financial measures in this earnings release
because it believes that they provide useful and comparative information to assess trends in Banner's core operations reflected in the current quarter's results and facilitate the comparison of our performance with the performance of our peers.
Where applicable, comparable earnings information using GAAP financial measures is also presented. See also Non-GAAP Financial Measures reconciliation tables on the last two pages of this press release.
Significant Recent Initiatives and Events
On June 30, 2020, Banner issued and sold in an underwritten offering the Notes, resulting in net proceeds, after underwriting discounts and estimated
offering expenses, of approximately $98.1 million. Banner intends to use the net proceeds of the offering for general corporate purposes, which may include providing capital to support its growth organically or through strategic acquisitions,
repayment or redemption of outstanding indebtedness, the payment of dividends, financing investments and capital expenditures, repurchasing shares of its common stock, and for investments in the Banks as regulatory capital.
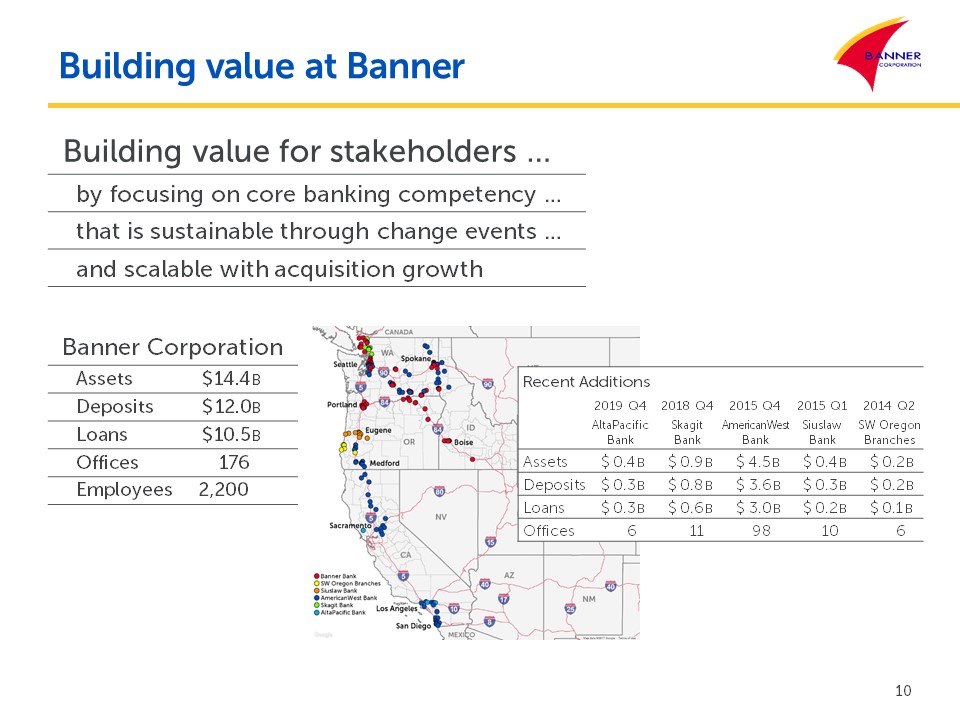
On November 1, 2019, Banner completed the acquisition of AltaPacific Bancorp (AltaPacific) and its wholly-owned subsidiary, AltaPacific
Bank, of Santa Rosa, California. At closing, AltaPacific Bank had six branch locations, including one in Northern California and five in Southern California. Pursuant to
BANR - Second Quarter 2020 Results
July 22, 2020
Page 3the previously announced terms, AltaPacific shareholders received 0.2712 shares of Banner common stock in exchange for each share of
AltaPacific common stock, plus cash in lieu of any fractional shares and cash to buyout AltaPacific stock options for a total consideration paid of $87.6 million.
The AltaPacific merger was accounted for using the acquisition method of accounting. Accordingly, the assets (including identifiable
intangible assets) and the liabilities of AltaPacific were measured at their respective estimated fair values as of the merger date. The excess of the purchase price over the fair value of the net assets acquired was attributed to goodwill. The
fair value on the merger date represents management's best estimates based on available information and facts and circumstances in existence on the merger date. The acquisition accounting is subject to adjustment within a measurement period of one
year from the acquisition date. The acquisition provided $425.7 million of assets, $332.4 million of loans, and $313.4 million of deposits to Banner. During the first quarter of 2020, Banner completed the integration of AltaPacific systems into
Banner's core systems and closure of overlapping branches.
Adoption of New Accounting Standard
In June 2016, Financial Accounting Standards Board issued Accounting Standard Update No. 2016-13, Measurement of Credit Losses on
Financial Instruments (ASU 2016-13). GAAP prior to ASU 2016-13 required an “incurred loss” methodology for recognizing credit losses that delays recognition until it is probable a loss has been incurred. The main objective of ASU 2016-13 is to
provide financial statement users with more decision-useful information about the expected credit losses on financial instruments and other commitments to extend credit held by a reporting entity at each reporting date. ASU 2016-13 became effective
for Banner on January 1, 2020. The adoption of ASU No. 2016-13 resulted in a $7.8 million increase to its allowance for credit losses - loans and a $7.0 million increase to its allowance for credit losses - unfunded loan commitments. The combined
increases were recorded net of tax as an $11.2 million reduction to retained earnings as of the adoption date.
Income Statement Review
Net interest income, before the provision for credit losses, was $119.5 million in the second quarter of 2020, compared to $119.3
million in the preceding quarter and $116.7 million in the second quarter a year ago.
Banner's net interest margin on a tax equivalent basis was 3.90% for the second quarter of 2020, a 35 basis-point decrease compared to
4.25% in the preceding quarter and a 54 basis-point decrease compared to 4.44% in the second quarter a year ago. “As expected, the 150 basis-point decrease in the fed funds target rate that occurred in March 2020, the full effect of the lower
interest rate environment combined with the impact of the low loan yields of the SBA PPP loan portfolio, and growth in core deposit liquidity impacted our net interest margin during the quarter,” added Grescovich. Acquisition accounting adjustments
added seven basis points to the net interest margin in the current quarter compared to ten basis points in the preceding quarter and seven basis points in the second quarter a year ago. The total purchase discount for acquired loans was $20.2
million at June 30, 2020, compared to $22.2 million at March 31, 2020, and $22.6 million at June 30, 2019. In the first six months of the year, Banner’s net interest margin on a tax equivalent basis was 4.07% compared to 4.43% in the first six
months of 2019.
Average interest-earning asset yields decreased 50 basis points to 4.19% in the second quarter compared to 4.69% for the preceding
quarter and decreased 78 basis points compared to 4.97% in the second quarter a year ago. Average loan yields decreased 51 basis points to 4.57% compared to 5.08% in the preceding quarter and decreased 82 basis points compared to 5.39% in the second
quarter a year ago. Loan discount accretion added eight basis points to loan yields in the second quarter of 2020, compared to 12 basis points in the preceding quarter and nine basis points in the second quarter a year ago. Deposit costs were 0.23%
in the second quarter of 2020, a 12 basis-point decrease compared to the preceding quarter and a 16 basis-point decrease compared to the second quarter a year ago. The decrease in deposit costs during the current quarter compared to the preceding
quarter was the result of recent decreases in market interest rates; however, changes in the average rate paid on interest-bearing deposits tend to lag changes in market interest rates. The total cost of funds was 0.31% during the second quarter of
2020, a 15 basis-point decrease compared to the preceding quarter and a 25 basis-point decrease compared to the second quarter a year ago.
Banner recorded a $29.5 million provision for credit losses in the current quarter, compared to $21.7 million in the prior quarter and
$2.0 million in the same quarter a year ago as calculated under the prior incurred loss methodology. The provisions for the current and preceding quarters reflect expected lifetime credit losses based upon the current conditions and the potential
effects from forecasted deterioration of economic metrics due to the COVID-19 pandemic based on the outlook as of June 30, 2020 and March 31, 2020, respectively.
Total non-interest income was $27.8 million in the second quarter of 2020, compared to $19.2 million in the preceding quarter and $22.7
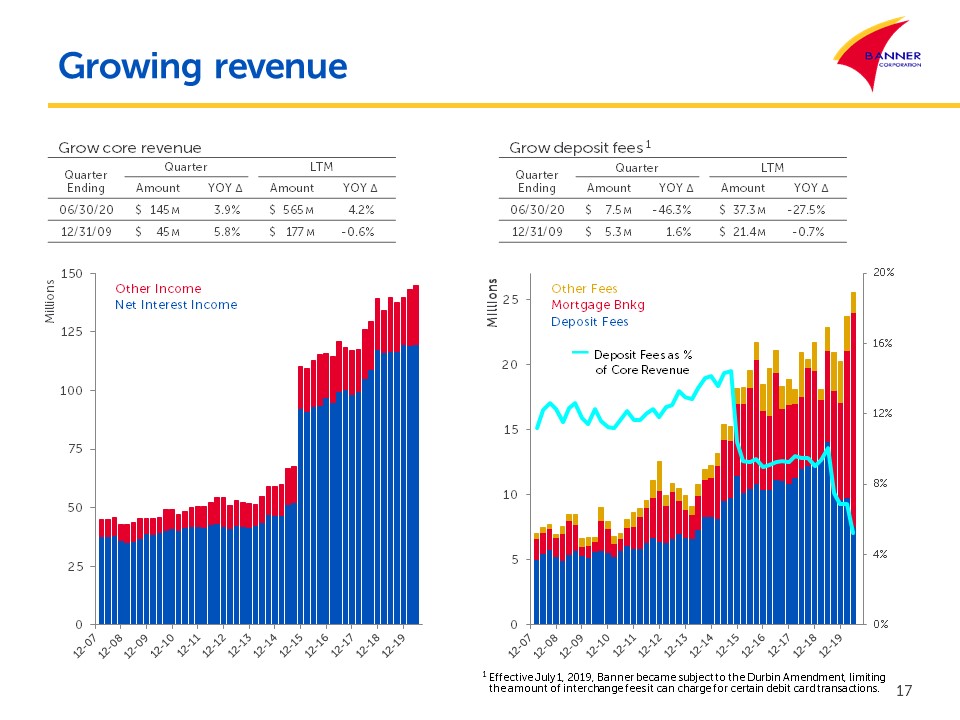
million in the second quarter a year ago. Deposit fees and other service charges were $7.5 million in the second quarter of 2020, compared to $9.8 million in the preceding quarter and $14.0 million in the second quarter a year ago. The decrease in
deposit fees and other service charges from the second quarter a year ago is primarily a result of Banner becoming subject to the Durbin Amendment on July 1, 2019, as well as pandemic related fee waivers and reduced transaction deposit account
activity since the start of the COVID-19 pandemic. Mortgage banking revenues, including gains on one- to four-family and multifamily loan sales and loan servicing fees, increased to $14.1 million in the second quarter, compared to $10.2 million in
the preceding quarter and $5.9 million in the second quarter of 2019. The higher mortgage banking revenue quarter-over-quarter primarily reflects an increase in the gain on sale spread on one- to four-family held for sale loans. The increases
compared to the second quarter of 2019 were primarily due to increased production of one- to four-family held-for-sale loans primarily due to increased refinance activity. Home purchase activity accounted for 42% of one- to four-family mortgage loan
originations in the second quarter of 2020, compared to 54% in the prior quarter and 77% in the second quarter of 2019. In the first six months of 2020, total non-interest income increased 15% to $47.0 million, compared to $40.8 million in the first
six months of 2019.
Banner’s second quarter 2020 results included a $2.2 million net gain for fair value adjustments as a result of changes in the
valuation of financial instruments carried at fair value, principally comprised of certain investment securities held for trading as a result of the tightening of market spreads during the quarter, and a $93,000 net gain on the sale of securities.
In the preceding quarter, results included a $4.6 million net loss for fair value adjustments and a $78,000 net gain on the sale of securities. In the second quarter a year ago, results included an $114,000 net loss for fair value adjustments and a
$28,000 net loss on the sale of securities.
Banner's total revenue increased 6% to $147.3 million for the second quarter of 2020, compared to $138.4 million in the preceding
quarter, and increased 6% compared to $139.4 million in the second quarter a year ago. Year-to-date, total revenues increased 4% to $285.7 million compared to $273.6 million
BANR - Second Quarter 2020 Results
July 22, 2020
Page 4for the same period one year earlier. Adjusted revenue* (the total of net interest income before provision for credit losses and total
non-interest income excluding the net gain and loss on the sale of securities and the net change in valuation of financial instruments) was $145.0 million in the second quarter of 2020, compared to $142.9 million in the preceding quarter and $139.5
million in the second quarter of 2019. In the first six months of the year, adjusted revenue* was $287.9 million, compared to $273.7 million in the first six months of 2019.
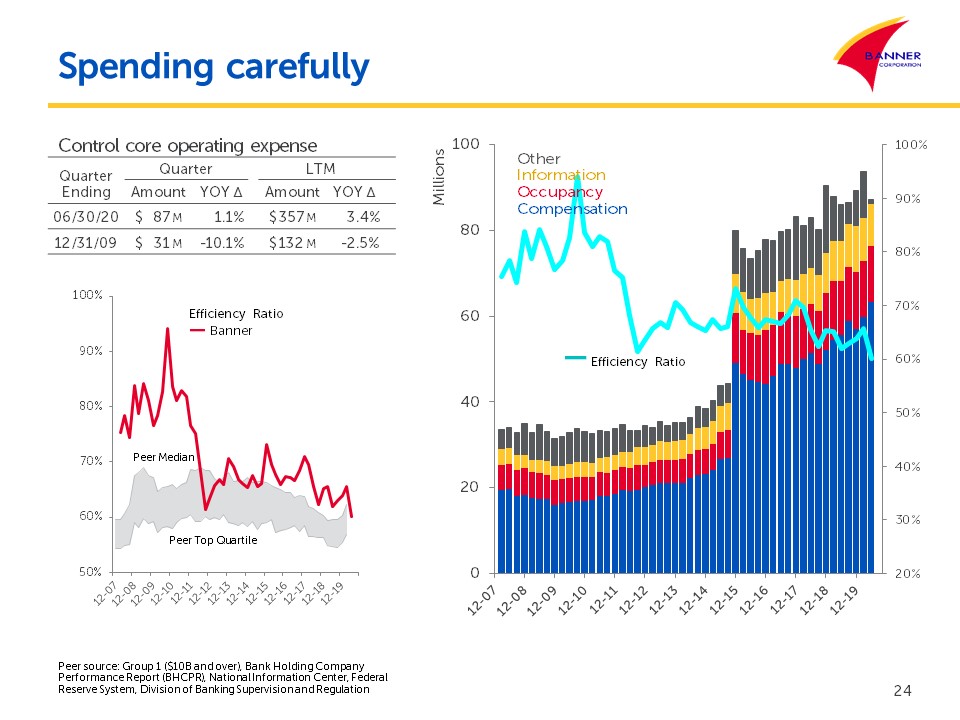
Total non-interest expense was $89.6 million in the second quarter of 2020, compared to $95.2 million in the preceding quarter and
$86.7 million in the second quarter of 2019. The decrease in non-interest expense during the second quarter of 2020 reflects an increase in capitalized loan origination costs, primarily related to the origination of PPP loans during the current
quarter. A reduction in acquisition-related expenses also contributed to the decrease compared to the prior quarter as acquisition-related expenses were $336,000 for the second quarter of 2020, compared to $1.1 million for the preceding quarter and
$301,000 in the second quarter a year ago. The current quarter includes a $905,000 recapture of provision for credit losses - unfunded loan commitments compared to a $1.7 million provision for the prior quarter and no provision for the year ago
quarter. The previously mentioned increase in COVID-19 expenses during the current quarter partially offset these decreases. Year-to-date, total non-interest expense was $184.8 million, compared to $176.7 million in the same period a year earlier.
Banner’s efficiency ratio was 60.85% for the current quarter, compared to 68.76% in the preceding quarter and 62.22% in the year ago quarter. Banner’s adjusted efficiency ratio* was 57.95% for the current quarter, compared to 63.47% in the preceding
quarter and 59.56% in the year ago quarter.
For the second quarter of 2020, Banner had $4.6 million in state and federal income tax expense for an effective tax rate of 16.3%, reflecting the benefits
from tax exempt income. Banner’s statutory income tax rate is 23.5%, representing a blend of the statutory federal income tax rate of 21.0% and apportioned effects of the state income tax rates.
Balance Sheet Review
Total assets increased 13% to $14.41 billion at June 30, 2020, compared to $12.78 billion at March 31, 2020, and increased 22% when
compared to $11.85 billion at June 30, 2019. The total of securities and interest-bearing deposits held at other banks was $2.30 billion at June 30, 2020, compared to $2.15 billion at March 31, 2020 and $1.85 billion at June 30, 2019. The average
effective duration of Banner's securities portfolio was approximately 4.0 years at June 30, 2020, compared to 2.6 years at June 30, 2019.
Net loans receivable increased 11% to $10.13 billion at June 30, 2020, compared to $9.16 billion at March 31, 2020, and increased 17%
when compared to $8.65 billion at June 30, 2019. The increase in net loans compared to the prior quarter primarily reflects the origination of SBA PPP loans during the current quarter, which totaled $1.12 billion outstanding as of June 30, 2020.
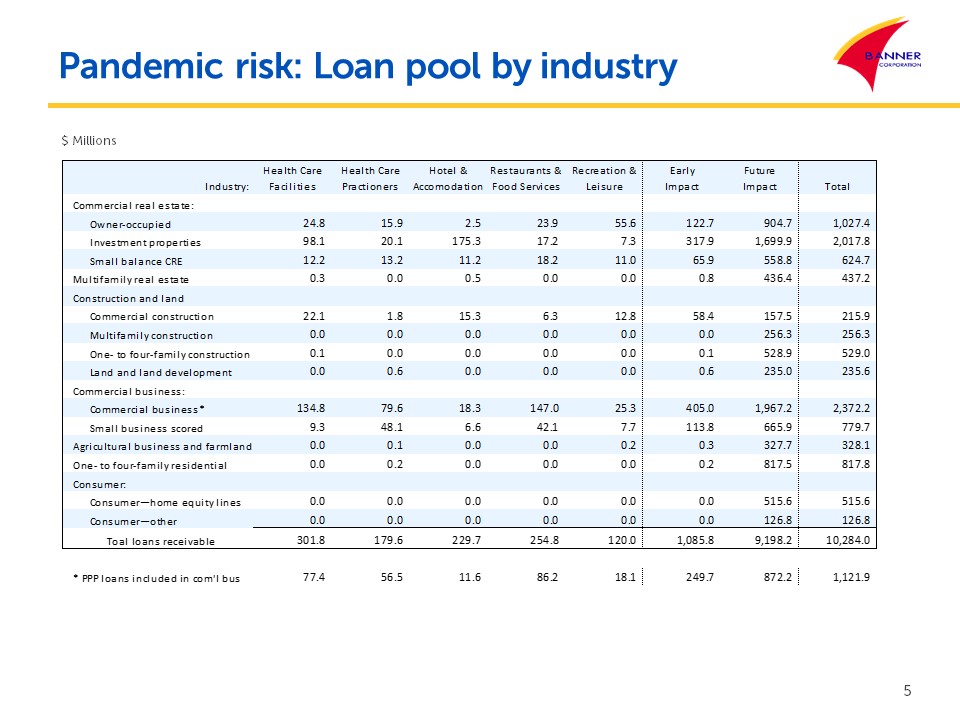
The year-over-year increase in net loans included $332.4 million of portfolio loans acquired in the AltaPacific acquisition during the fourth quarter of 2019. Commercial real estate and multifamily real estate loans increased to $4.11 billion at
June 30, 2020, compared to $4.02 billion at March 31, 2020, and increased 13% compared to $3.62 billion a year ago. Commercial business loans increased 46% to $3.15 billion at June 30, 2020, compared to $2.17 billion at March 31, 2020, and increased
56% compared to $2.02 billion a year ago. Agricultural business loans decreased to $328.1 million at June 30, 2020, compared to $330.3 million three months earlier and $345.8 million a year ago. Total construction, land and land development loans
were $1.24 billion at June 30, 2020, a small increase from $1.22 billion at March 31, 2020, and a 9% increase compared to $1.14 billion a year earlier. Consumer loans decreased to $642.4 million at June 30, 2020, compared to $661.8 million at
March 31, 2020, and $698.3 million a year ago. One- to four-family loans decreased to $817.8 million at June 30, 2020, compared to $881.4 million at March 31, 2020, and $918.2 million a year ago.
Loans held for sale were $258.7 million at June 30, 2020, compared to $182.4 million at March 31, 2020, and $170.7 million at June 30,
2019. The volume of one- to four- family residential mortgage loans sold was $292.4 million in the current quarter, compared to $204.0 million in the preceding quarter and $139.0 million in the second quarter a year ago. During the second quarter
of 2020, Banner sold $3.1 million in multifamily loans compared to $119.7 million in the preceding quarter and none in the second quarter a year ago. The current quarter reflects a temporary disruption in the secondary market for multifamily loans
as a results of the COVID-19 pandemic.
Total deposits increased 15% to $12.02 billion at June 30, 2020, compared to $10.45 billion at March 31, 2020, and increased 29% when
compared to $9.29 billion a year ago. The increase in total deposits from the preceding quarter was due primarily to SBA PPP loan funds deposited into customer accounts and an increase in customer deposits accounts due changes in spending habits
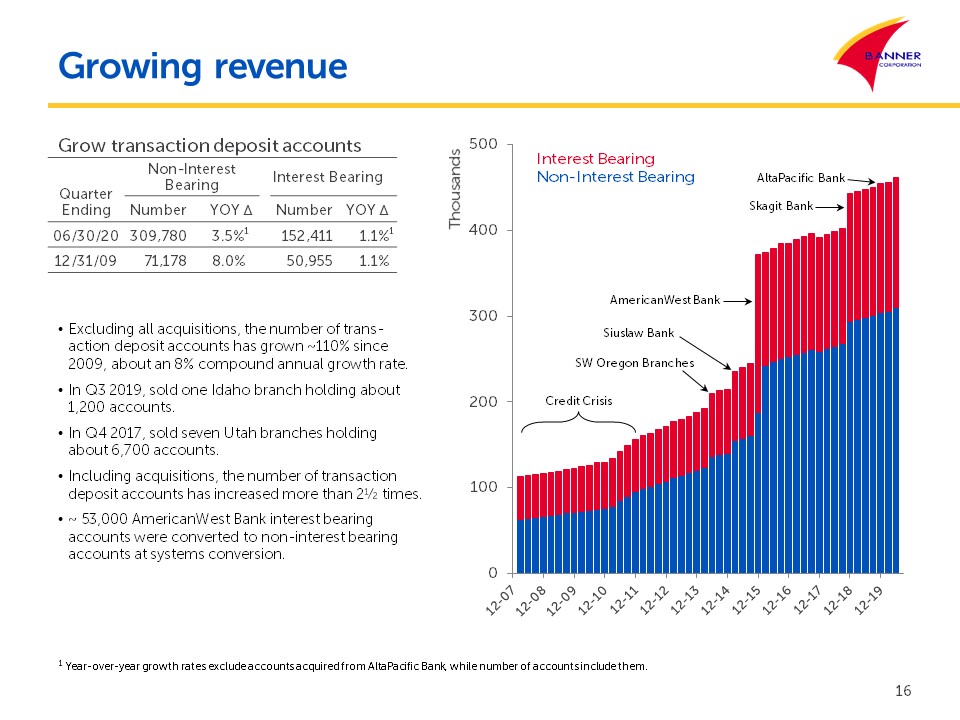
during the COVID-19 pandemic. The year-over-year increase in deposits included $313.4 million in deposits acquired in the AltaPacific acquisition during the fourth quarter of 2019. Non-interest-bearing account balances increased 29% to $5.28
billion at June 30, 2020, compared to $4.11 billion at March 31, 2020, and increased 44% compared to $3.67 billion a year ago. Core deposits (non-interest-bearing and interest-bearing transaction and savings accounts) increased 18% from the prior
quarter and increased 34% compared to a year ago and represented 91% of total deposits at June 30, 2020. Certificates of deposit decreased 11% to $1.04 billion at June 30, 2020, compared to $1.17 billion at March 31, 2020, and decreased slightly
compared to $1.07 billion a year earlier. The decrease in certificates of deposit during the second quarter of 2020 primarily reflects the decrease in brokered deposits to $119.4 million at June 30, 2020, compared to $251.0 million at March 31, 2020
and $138.4 million a year ago. FHLB borrowings totaled $150.0 million at June 30, 2020, compared to $247.0 million at March 31, 2020, and $606.0 million a year earlier.
At June 30, 2020, total common shareholders' equity was $1.63 billion, or 11.28% of assets, compared to $1.60 billion or 12.53% of
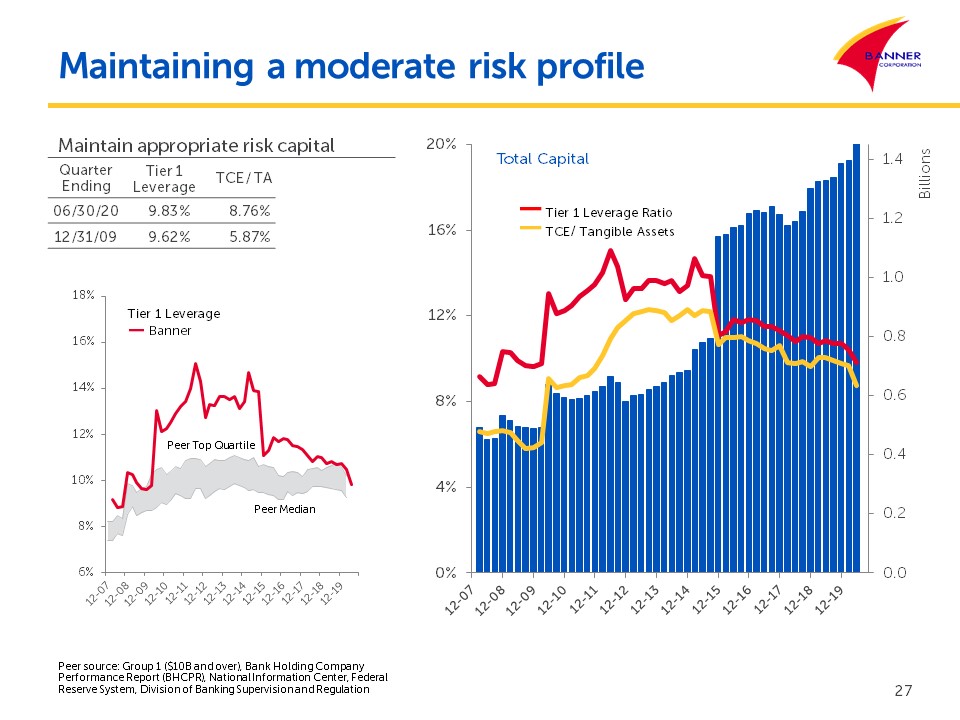
assets at March 31, 2020, and $1.52 billion or 12.84% of assets a year ago. At June 30, 2020, tangible common shareholders' equity*, which excludes goodwill and other intangible assets, net, was $1.23 billion, or 8.76% of tangible assets*, compared
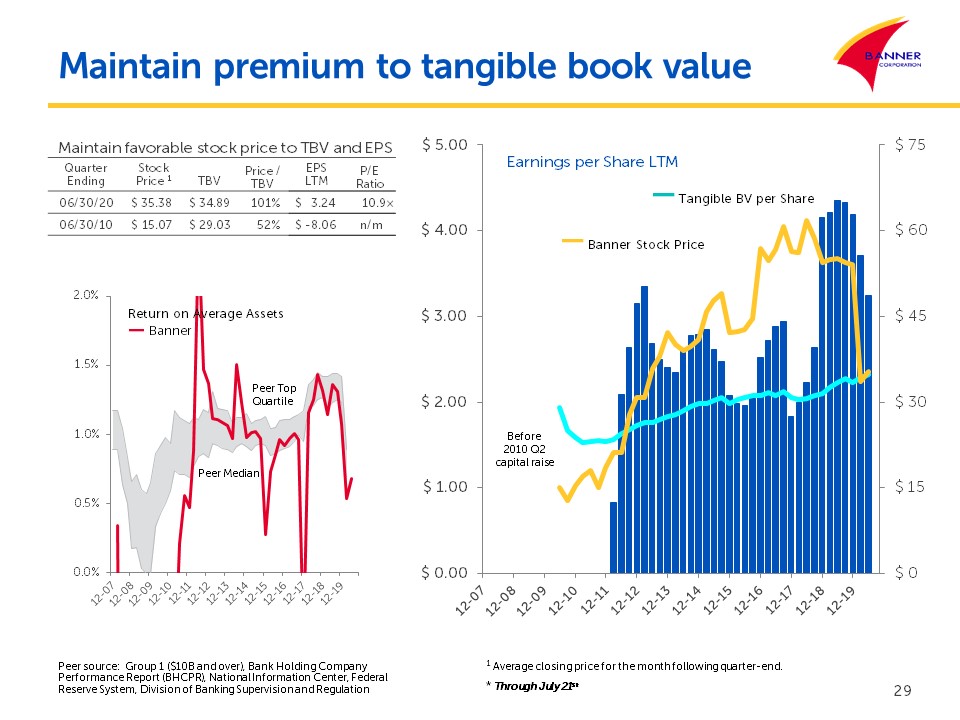
to $1.20 billion, or 9.70% of tangible assets, at March 31, 2020, and $1.15 billion, or 10.05% of tangible assets, a year ago. Banner's tangible book value per share* increased to $34.89 at June 30, 2020, compared to $33.36 per share a year ago.
Banner and its subsidiary banks continue to maintain capital levels in excess of the requirements to be categorized as
“well-capitalized.” At June 30, 2020, Banner's common equity Tier 1 capital ratio was 10.66%, its Tier 1 leverage capital to average assets ratio was 9.83%, and its total capital to risk-weighted assets ratio was 14.14%.
BANR - Second Quarter 2020 Results
July 22, 2020
Page 5Credit Quality
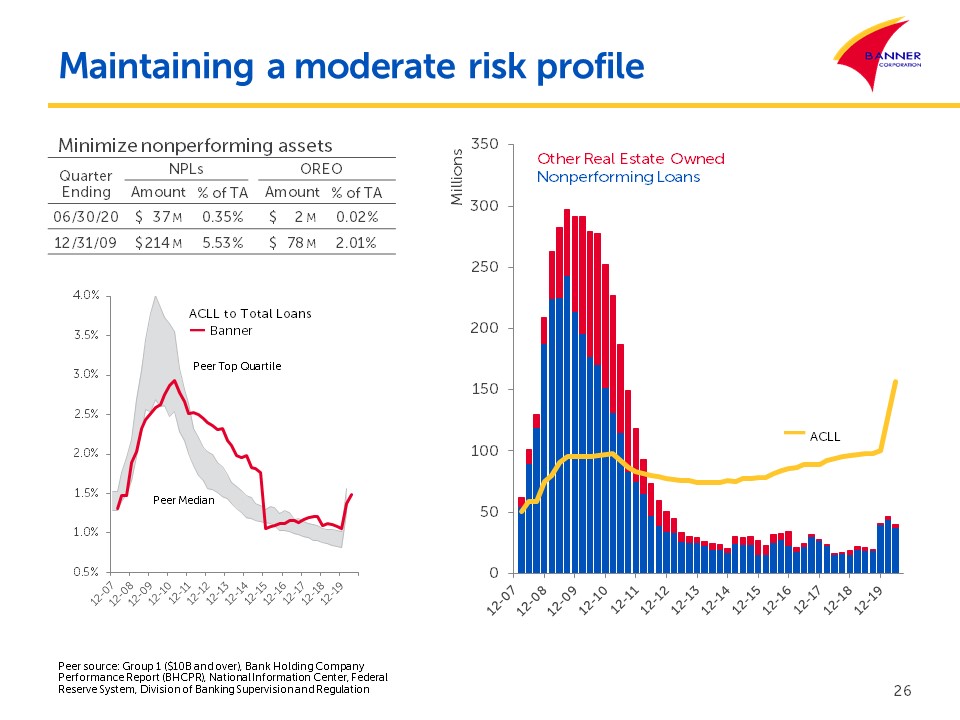
The allowance for credit losses - loans was $156.4 million at June 30, 2020, or 1.52% of total loans receivable outstanding and 418% of
non-performing loans, compared to $130.5 million at March 31, 2020, or 1.41% of total loans receivable outstanding and 299% of non-performing loans, and $98.3 million at June 30, 2019, or 1.12% of total loans receivable outstanding and 534% of
non-performing loans. In addition to the allowance for credit losses - loans, Banner maintains an allowance for credit losses - unfunded loan commitments which was $10.6 million at June 30, 2020, compared to $11.5 million at March 31, 2020 and $2.6
million at June 30, 2019. Net loan charge-offs totaled $3.7 million in the second quarter of 2020, compared to net loan recoveries of $404,000 in the preceding quarter and $1.1 million of net charge-offs in the second quarter a year ago. Banner
recorded a $29.5 million provision for credit losses in the current quarter, compared to $21.7 million in the prior quarter and $2.0 million in the year ago quarter primarily due to the further deterioration in economic variables, as a result of the
COVID-19 pandemic, utilized to forecast credit losses. Non-performing loans were $37.4 million at June 30, 2020, compared to $43.7 million at March 31, 2020, and $18.4 million a year ago. Real estate owned and other repossessed assets were $2.4
million at June 30, 2020, compared to $2.4 million at March 31, 2020, and $2.6 million a year ago.
In accordance with acquisition accounting, loans acquired from acquisitions were recorded at their estimated fair value, which resulted
in a net purchase discount to the loans’ contractual amounts, a portion of which reflects a discount for possible credit losses. Credit discounts are included in the determination of fair value, and as a result, no allowance for credit losses is
recorded for acquired loans at the acquisition date. At June 30, 2020, the total purchase discount for acquired loans was $20.2 million.
Banner's total non-performing assets were $39.9 million, or 0.28% of total assets, at June 30, 2020, compared to $46.1 million, or
0.36% of total assets, at March 31, 2020, and $21.0 million, or 0.18% of total assets, a year ago.
Conference Call
Banner will host a conference call on Thursday, July 23, 2020, at 8:00 a.m. PDT, to discuss its second quarter results. To listen to
the call on-line, go to www.bannerbank.com. Investment professionals are invited to dial (866) 235-9915 to participate in the call. A replay will be
available for one week at (877) 344-7529 using access code 10145372, or at www.bannerbank.com.
About the Company
Banner Corporation is a $14.41 billion bank holding company operating two commercial banks in four Western states through a network of
branches offering a full range of deposit services and business, commercial real estate, construction, residential, agricultural and consumer loans. Visit Banner Bank on the Web at www.bannerbank.com.
Forward-Looking Statements
When used in this press release and in other documents filed with or furnished to the Securities and Exchange
Commission (the “SEC”), in press releases or other public stockholder communications, or in oral statements made with the approval of an authorized executive officer, the words or phrases "may," “believe,” “will,” “will likely result,” “are expected
to,” “will continue,” “is anticipated,” “estimate,” “project,” “plans,” "potential," or similar expressions are intended to identify “forward-looking statements” within the meaning of the Private Securities Litigation Reform Act of 1995. You are
cautioned not to place undue reliance on any forward-looking statements, which speak only as of the date such statements are made and based only on information then actually known to Banner. Banner does not undertake and specifically disclaims any
obligation to revise any forward-looking statements to reflect the occurrence of anticipated or unanticipated events or circumstances after the date of such statements. These statements may relate to future financial performance, strategic plans or
objectives, revenues or earnings projections, or other financial information. By their nature, these statements are subject to numerous uncertainties that could cause actual results to differ materially from those anticipated in the statements and
could negatively affect Banner's operating and stock price performance.
The COVID-19, pandemic is adversely affecting us, our
customers, counterparties, employees, and third-party service providers, and the ultimate extent of the impacts on our business, financial position, results of operations, liquidity, and prospects is uncertain. Continued deterioration in general
business and economic conditions, including further increases in unemployment rates, or turbulence in domestic or global financial markets could adversely affect our revenues and the values of our assets and liabilities, reduce the availability of
funding, lead to a tightening of credit, and further increase stock price volatility. In addition, changes to statutes, regulations, or regulatory policies or practices as a result of, or in response to COVID-19, could affect us in substantial and
unpredictable ways. Other factors that could cause actual results to differ materially from the results anticipated or projected include, but are not limited to, the following: (1) the credit risks of lending activities, including changes in the level and direction of loan delinquencies and write-offs and
changes in estimates of the adequacy of the allowance for credit losses, which could necessitate additional provisions for credit losses, resulting both from loans originated and loans acquired from other financial institutions; (2) results of
examinations by regulatory authorities, including the possibility that any such regulatory authority may, among other things, require increases in the allowance for credit losses or writing down of assets or impose restrictions or penalties with
respect to Banner's activities; (3) competitive pressures among depository institutions; (4) interest rate movements and their impact on customer behavior and net interest margin; (5) the impact of repricing and competitors' pricing initiatives on
loan and deposit products; (6) fluctuations in real estate values; (7) the ability to adapt successfully to technological changes to meet customers' needs and developments in the market place; (8) the ability to access cost-effective funding; (9)
changes in financial markets; (10) changes in economic conditions in general and in Washington, Idaho, Oregon and California in particular; (11) the costs, effects and outcomes of litigation; (12) legislation or regulatory changes, including but
not limited to the impact of the Dodd-Frank Act and regulations adopted thereunder, changes in regulatory capital requirements pursuant to the implementation of the Basel III capital standards, other governmental initiatives affecting the financial
services industry and changes in federal and/or state tax laws or interpretations thereof by taxing authorities; (13) changes in accounting principles, policies or guidelines; (14) future acquisitions by Banner of other depository institutions or
lines of business; (15) future goodwill impairment due to changes in Banner's business, changes in market conditions, including as a result of the COVID-19 pandemic or other factors; and (16) other economic, competitive, governmental, regulatory,
and technological factors affecting our operations, pricing, products and services; and other risks detailed from time to time in our filings with the Securities and Exchange Commission including our Quarterly Reports on Form 10-Q and our Annual
Reports on Form 10-K.
BANR - Second Quarter 2020 Results
July 22, 2020
Page 6|
RESULTS OF OPERATIONS
|
Quarters Ended
|
Six Months Ended
|
||||||||||||||||||
|
(in thousands except shares and per share data)
|
Jun 30, 2020
|
Mar 31, 2020
|
Jun 30, 2019
|
Jun 30, 2020
|
Jun 30, 2019
|
|||||||||||||||
|
INTEREST INCOME:
|
||||||||||||||||||||
|
Loans receivable
|
$
|
115,173
|
$
|
118,926
|
$
|
117,007
|
$
|
234,099
|
$
|
232,462
|
||||||||||
|
Mortgage-backed securities
|
7,983
|
9,137
|
9,794
|
17,120
|
20,301
|
|||||||||||||||
|
Securities and cash equivalents
|
5,468
|
3,602
|
4,037
|
9,070
|
8,071
|
|||||||||||||||
|
128,624
|
131,665
|
130,838
|
260,289
|
260,834
|
||||||||||||||||
|
INTEREST EXPENSE:
|
||||||||||||||||||||
|
Deposits
|
6,694
|
8,750
|
9,023
|
15,444
|
17,666
|
|||||||||||||||
|
Federal Home Loan Bank advances
|
984
|
2,064
|
3,370
|
3,048
|
6,846
|
|||||||||||||||
|
Other borrowings
|
238
|
116
|
67
|
354
|
127
|
|||||||||||||||
|
Junior subordinated debentures and subordinated notes
|
1,251
|
1,477
|
1,683
|
2,728
|
3,396
|
|||||||||||||||
|
9,167
|
12,407
|
14,143
|
21,574
|
28,035
|
||||||||||||||||
|
Net interest income before provision for credit losses
|
119,457
|
119,258
|
116,695
|
238,715
|
232,799
|
|||||||||||||||
|
PROVISION FOR CREDIT LOSSES
|
29,528
|
21,748
|
2,000
|
51,276
|
4,000
|
|||||||||||||||
|
Net interest income
|
89,929
|
97,510
|
114,695
|
187,439
|
228,799
|
|||||||||||||||
|
NON-INTEREST INCOME:
|
||||||||||||||||||||
|
Deposit fees and other service charges
|
7,546
|
9,803
|
14,046
|
17,349
|
26,664
|
|||||||||||||||
|
Mortgage banking operations
|
14,138
|
10,191
|
5,936
|
24,329
|
9,351
|
|||||||||||||||
|
Bank-owned life insurance
|
2,317
|
1,050
|
1,123
|
3,367
|
2,399
|
|||||||||||||||
|
Miscellaneous
|
1,550
|
2,639
|
1,713
|
4,189
|
2,517
|
|||||||||||||||
|
25,551
|
23,683
|
22,818
|
49,234
|
40,931
|
||||||||||||||||
|
Net gain (loss) on sale of securities
|
93
|
78
|
(28
|
)
|
171
|
(27
|
)
|
|||||||||||||
|
Net change in valuation of financial instruments carried at fair value
|
2,199
|
(4,596
|
)
|
(114
|
)
|
(2,397
|
)
|
(103
|
)
|
|||||||||||
|
Total non-interest income
|
27,843
|
19,165
|
22,676
|
47,008
|
40,801
|
|||||||||||||||
|
NON-INTEREST EXPENSE:
|
||||||||||||||||||||
|
Salary and employee benefits
|
63,415
|
59,908
|
55,629
|
123,323
|
110,269
|
|||||||||||||||
|
Less capitalized loan origination costs
|
(11,110
|
)
|
(5,806
|
)
|
(7,399
|
)
|
(16,916
|
)
|
(12,248
|
)
|
||||||||||
|
Occupancy and equipment
|
12,985
|
13,107
|
12,681
|
26,092
|
26,447
|
|||||||||||||||
|
Information / computer data services
|
6,084
|
5,810
|
5,273
|
11,894
|
10,599
|
|||||||||||||||
|
Payment and card processing services
|
3,851
|
4,240
|
4,041
|
8,091
|
8,025
|
|||||||||||||||
|
Professional and legal expenses
|
2,163
|
1,919
|
2,336
|
4,082
|
4,770
|
|||||||||||||||
|
Advertising and marketing
|
652
|
1,827
|
2,065
|
2,479
|
3,594
|
|||||||||||||||
|
Deposit insurance expense
|
1,705
|
1,635
|
1,418
|
3,340
|
2,836
|
|||||||||||||||
|
State/municipal business and use taxes
|
1,104
|
984
|
1,007
|
2,088
|
1,952
|
|||||||||||||||
|
Real estate operations
|
4
|
100
|
260
|
104
|
137
|
|||||||||||||||
|
Amortization of core deposit intangibles
|
2,002
|
2,001
|
2,053
|
4,003
|
4,105
|
|||||||||||||||
|
(Recapture) / provision for credit losses - unfunded loan commitments
|
(905
|
)
|
1,722
|
—
|
817
|
—
|
||||||||||||||
|
Miscellaneous
|
5,199
|
6,357
|
7,051
|
11,556
|
13,795
|
|||||||||||||||
|
87,149
|
93,804
|
86,415
|
180,953
|
174,281
|
||||||||||||||||
|
COVID-19 expenses
|
2,152
|
239
|
—
|
2,391
|
—
|
|||||||||||||||
|
Acquisition-related expenses
|
336
|
1,142
|
301
|
1,478
|
2,449
|
|||||||||||||||
|
Total non-interest expense
|
89,637
|
95,185
|
86,716
|
184,822
|
176,730
|
|||||||||||||||
|
Income before provision for income taxes
|
28,135
|
21,490
|
50,655
|
49,625
|
92,870
|
|||||||||||||||
|
PROVISION FOR INCOME TAXES
|
4,594
|
4,608
|
10,955
|
9,202
|
19,824
|
|||||||||||||||
|
NET INCOME
|
$
|
23,541
|
$
|
16,882
|
$
|
39,700
|
$
|
40,423
|
$
|
73,046
|
||||||||||
|
Earnings per share available to common shareholders:
|
||||||||||||||||||||
|
Basic
|
$
|
0.67
|
$
|
0.48
|
$
|
1.14
|
$
|
1.14
|
$
|
2.09
|
||||||||||
|
Diluted
|
$
|
0.67
|
$
|
0.47
|
$
|
1.14
|
$
|
1.14
|
$
|
2.09
|
||||||||||
|
Cumulative dividends declared per common share
|
$
|
—
|
$
|
0.41
|
$
|
0.41
|
$
|
0.41
|
$
|
0.82
|
||||||||||
|
Weighted average common shares outstanding:
|
||||||||||||||||||||
|
Basic
|
35,189,260
|
35,463,541
|
34,831,047
|
35,326,401
|
34,940,106
|
|||||||||||||||
|
Diluted
|
35,283,690
|
35,640,463
|
34,882,359
|
35,545,086
|
35,028,881
|
|||||||||||||||
|
Increase (decrease) in common shares outstanding
|
55,440
|
(649,117
|
)
|
(579,103
|
)
|
(593,677
|
)
|
(609,129
|
)
|
|||||||||||
BANR - Second Quarter 2020 Results
July 22, 2020
Page 7|
FINANCIAL CONDITION
|
Percentage Change
|
||||||||||||||||||||||
|
(in thousands except shares and per share data)
|
Jun 30, 2020
|
Mar 31, 2020
|
Dec 31, 2019
|
Jun 30, 2019
|
Prior
Qtr
|
Prior
Yr Qtr
|
|||||||||||||||||
|
ASSETS
|
|||||||||||||||||||||||
|
Cash and due from banks
|
$
|
291,036
|
$
|
211,013
|
$
|
234,359
|
$
|
187,043
|
37.9
|
%
|
55.6
|
%
|
|||||||||||
|
Interest-bearing deposits
|
128,938
|
83,988
|
73,376
|
59,753
|
53.5
|
%
|
115.8
|
%
|
|||||||||||||||
|
Total cash and cash equivalents
|
419,974
|
295,001
|
307,735
|
246,796
|
42.4
|
%
|
70.2
|
%
|
|||||||||||||||
|
Securities - trading
|
23,239
|
21,040
|
25,636
|
25,741
|
10.5
|
%
|
(9.7
|
)%
|
|||||||||||||||
|
Securities - available for sale
|
1,706,781
|
1,608,224
|
1,551,557
|
1,561,009
|
6.1
|
%
|
9.3
|
%
|
|||||||||||||||
|
Securities - held to maturity
|
441,075
|
437,846
|
236,094
|
203,222
|
0.7
|
%
|
117.0
|
%
|
|||||||||||||||
|
Total securities
|
2,171,095
|
2,067,110
|
1,813,287
|
1,789,972
|
5.0
|
%
|
21.3
|
%
|
|||||||||||||||
|
Equity securities
|
|
340,052
|
—
|
—
|
—
|
nm
|
nm
|
||||||||||||||||
|
Federal Home Loan Bank stock
|
16,363
|
20,247
|
28,342
|
34,583
|
(19.2
|
)%
|
(52.7
|
)%
|
|||||||||||||||
|
Loans held for sale
|
258,700
|
182,428
|
210,447
|
170,744
|
41.8
|
%
|
51.5
|
%
|
|||||||||||||||
|
Loans receivable
|
10,283,999
|
9,285,744
|
9,305,357
|
8,746,550
|
10.8
|
%
|
17.6
|
%
|
|||||||||||||||
|
Allowance for credit losses - loans
|
(156,352
|
)
|
(130,488
|
)
|
(100,559
|
)
|
(98,254
|
)
|
19.8
|
%
|
59.1
|
%
|
|||||||||||
|
Net loans receivable
|
10,127,647
|
9,155,256
|
9,204,798
|
8,648,296
|
10.6
|
%
|
17.1
|
%
|
|||||||||||||||
|
Accrued interest receivable
|
48,806
|
40,732
|
37,962
|
40,238
|
19.8
|
%
|
21.3
|
%
|
|||||||||||||||
|
Real estate owned held for sale, net
|
2,400
|
2,402
|
814
|
2,513
|
(0.1
|
)%
|
(4.5
|
)%
|
|||||||||||||||
|
Property and equipment, net
|
173,360
|
175,235
|
178,008
|
171,233
|
(1.1
|
)%
|
1.2
|
%
|
|||||||||||||||
|
Goodwill
|
373,121
|
373,121
|
373,121
|
339,154
|
—
|
%
|
10.0
|
%
|
|||||||||||||||
|
Other intangibles, net
|
25,155
|
27,157
|
29,158
|
28,595
|
(7.4
|
)%
|
(12.0
|
)%
|
|||||||||||||||
|
Bank-owned life insurance
|
190,468
|
193,140
|
192,088
|
178,922
|
(1.4
|
)%
|
6.5
|
%
|
|||||||||||||||
|
Other assets
|
258,466
|
249,121
|
228,271
|
196,328
|
3.8
|
%
|
31.7
|
%
|
|||||||||||||||
|
Total assets
|
$
|
14,405,607
|
$
|
12,780,950
|
$
|
12,604,031
|
$
|
11,847,374
|
12.7
|
%
|
21.6
|
%
|
|||||||||||
|
LIABILITIES
|
|||||||||||||||||||||||
|
Deposits:
|
|||||||||||||||||||||||
|
Non-interest-bearing
|
$
|
5,281,559
|
$
|
4,107,262
|
$
|
3,945,000
|
$
|
3,671,995
|
28.6
|
%
|
43.8
|
%
|
|||||||||||
|
Interest-bearing transaction and savings accounts
|
5,692,715
|
5,175,969
|
4,983,238
|
4,546,202
|
10.0
|
%
|
25.2
|
%
|
|||||||||||||||
|
Interest-bearing certificates
|
1,042,006
|
1,166,306
|
1,120,403
|
1,070,770
|
(10.7
|
)%
|
(2.7
|
)%
|
|||||||||||||||
|
Total deposits
|
12,016,280
|
10,449,537
|
10,048,641
|
9,288,967
|
15.0
|
%
|
29.4
|
%
|
|||||||||||||||
|
Advances from Federal Home Loan Bank
|
150,000
|
247,000
|
450,000
|
606,000
|
(39.3
|
)%
|
(75.2
|
)%
|
|||||||||||||||
|
Customer repurchase agreements and other borrowings
|
166,084
|
128,764
|
118,474
|
118,370
|
29.0
|
%
|
40.3
|
%
|
|||||||||||||||
|
Subordinated notes, net
|
98,140
|
—
|
—
|
—
|
nm
|
nm
|
|||||||||||||||||
|
Junior subordinated debentures at fair value
|
109,613
|
99,795
|
119,304
|
113,621
|
9.8
|
%
|
(3.5
|
)%
|
|||||||||||||||
|
Accrued expenses and other liabilities
|
194,964
|
208,753
|
227,889
|
159,131
|
(6.6
|
)%
|
22.5
|
%
|
|||||||||||||||
|
Deferred compensation
|
45,423
|
45,401
|
45,689
|
40,230
|
—
|
%
|
12.9
|
%
|
|||||||||||||||
|
Total liabilities
|
12,780,504
|
11,179,250
|
11,009,997
|
10,326,319
|
14.3
|
%
|
23.8
|
%
|
|||||||||||||||
|
SHAREHOLDERS' EQUITY
|
|||||||||||||||||||||||
|
Common stock
|
1,345,096
|
1,343,699
|
1,373,940
|
1,306,888
|
0.1
|
%
|
2.9
|
%
|
|||||||||||||||
|
Retained earnings
|
201,448
|
177,922
|
186,838
|
178,257
|
13.2
|
%
|
13.0
|
%
|
|||||||||||||||
|
Other components of shareholders' equity
|
78,559
|
80,079
|
33,256
|
35,910
|
(1.9
|
)%
|
118.8
|
%
|
|||||||||||||||
|
Total shareholders' equity
|
1,625,103
|
1,601,700
|
1,594,034
|
1,521,055
|
1.5
|
%
|
6.8
|
%
|
|||||||||||||||
|
Total liabilities and shareholders' equity
|
$
|
14,405,607
|
$
|
12,780,950
|
$
|
12,604,031
|
$
|
11,847,374
|
12.7
|
%
|
21.6
|
%
|
|||||||||||
|
Common Shares Issued:
|
|||||||||||||||||||||||
|
Shares outstanding at end of period
|
35,157,899
|
35,102,459
|
35,751,576
|
34,573,643
|
|||||||||||||||||||
|
Common shareholders' equity per share (1)
|
$
|
46.22
|
$
|
45.63
|
$
|
44.59
|
$
|
43.99
|
|||||||||||||||
|
Common shareholders' tangible equity per share (1) (2)
|
$
|
34.89
|
$
|
34.23
|
$
|
33.33
|
$
|
33.36
|
|||||||||||||||
|
Common shareholders' tangible equity to tangible assets (2)
|
8.76
|
%
|
9.70
|
%
|
9.77
|
%
|
10.05
|
%
|
|||||||||||||||
|
Consolidated Tier 1 leverage capital ratio
|
9.83
|
%
|
10.45
|
%
|
10.71
|
%
|
10.83
|
%
|
|||||||||||||||
|
(1)
|
Calculation is based on number of common shares outstanding at the end of the period rather than weighted average shares outstanding.
|
|
(2)
|
Common shareholders' tangible equity excludes goodwill and other intangible assets. Tangible assets exclude goodwill and other intangible
assets. These ratios represent non-GAAP financial measures. See also Non-GAAP Financial Measures reconciliation tables on the final two pages of the press release tables.
|
BANR - Second Quarter 2020 Results
July 22, 2020
Page 8|
ADDITIONAL FINANCIAL INFORMATION
|
||||||||||||||||||||||
|
(dollars in thousands)
|
||||||||||||||||||||||
|
Percentage Change
|
||||||||||||||||||||||
|
LOANS
|
Jun 30, 2020
|
Mar 31, 2020
|
Dec 31, 2019
|
Jun 30, 2019
|
Prior
Qtr
|
Prior
Yr Qtr
|
||||||||||||||||
|
Commercial real estate:
|
||||||||||||||||||||||
|
Owner-occupied
|
$
|
1,027,399
|
$
|
1,024,089
|
$
|
980,021
|
$
|
854,812
|
0.3
|
%
|
20.2
|
%
|
||||||||||
|
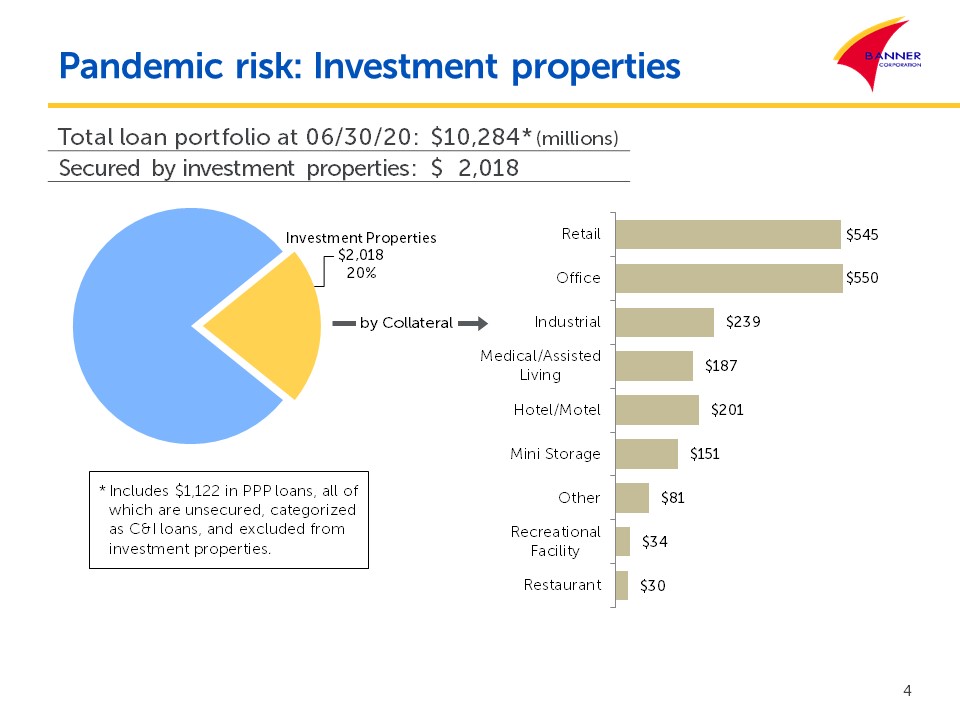
Investment properties
|
2,017,789
|
2,007,537
|
2,024,988
|
1,832,054
|
0.5
|
%
|
10.1
|
%
|
||||||||||||||
|
Small balance CRE
|
624,726
|
591,783
|
613,484
|
619,695
|
5.6
|
%
|
0.8
|
%
|
||||||||||||||
|
Multifamily real estate
|
437,201
|
400,206
|
388,388
|
316,274
|
9.2
|
%
|
38.2
|
%
|
||||||||||||||
|
Construction, land and land development:
|
||||||||||||||||||||||
|
Commercial construction
|
215,860
|
205,476
|
210,668
|
172,931
|
5.1
|
%
|
24.8
|
%
|
||||||||||||||
|
Multifamily construction
|
256,335
|
250,410
|
233,610
|
189,160
|
2.4
|
%
|
35.5
|
%
|
||||||||||||||
|
One- to four-family construction
|
528,966
|
534,956
|
544,308
|
502,897
|
(1.1
|
)%
|
5.2
|
%
|
||||||||||||||
|
Land and land development
|
235,602
|
232,506
|
245,530
|
273,546
|
1.3
|
%
|
(13.9
|
)%
|
||||||||||||||
|
Commercial business:
|
||||||||||||||||||||||
|
Commercial business
|
2,372,216
|
1,357,817
|
1,364,650
|
1,253,137
|
74.7
|
%
|
89.3
|
%
|
||||||||||||||
|
Small business scored
|
779,678
|
807,539
|
772,657
|
769,702
|
(3.5
|
)%
|
1.3
|
%
|
||||||||||||||
|
Agricultural business, including secured by farmland
|
328,077
|
330,257
|
337,271
|
345,817
|
(0.7
|
)%
|
(5.1
|
)%
|
||||||||||||||
|
One- to four-family residential
|
817,787
|
881,387
|
925,531
|
918,212
|
(7.2
|
)%
|
(10.9
|
)%
|
||||||||||||||
|
Consumer:
|
||||||||||||||||||||||
|
Consumer—home equity revolving lines of credit
|
515,603
|
521,618
|
519,336
|
542,968
|
(1.2
|
)%
|
(5.0
|
)%
|
||||||||||||||
|
Consumer—other
|
126,760
|
140,163
|
144,915
|
155,345
|
(9.6
|
)%
|
(18.4
|
)%
|
||||||||||||||
|
Total loans receivable
|
$
|
10,283,999
|
$
|
9,285,744
|
$
|
9,305,357
|
$
|
8,746,550
|
10.8
|
%
|
17.6
|
%
|
||||||||||
|
Restructured loans performing under their restructured terms
|
$
|
6,391
|
$
|
6,423
|
$
|
6,466
|
$
|
6,594
|
||||||||||||||
|
Loans 30 - 89 days past due and on accrual
|
$
|
20,807
|
$
|
39,974
|
$
|
20,178
|
$
|
17,923
|
||||||||||||||
|
Total delinquent loans (including loans on non-accrual), net
|
$
|
36,269
|
$
|
61,101
|
$
|
38,322
|
$
|
34,749
|
||||||||||||||
|
Total delinquent loans / Total loans receivable
|
0.35
|
%
|
0.66
|
%
|
0.41
|
%
|
0.40
|
%
|
||||||||||||||
|
LOANS BY GEOGRAPHIC LOCATION
|
Percentage Change
|
|||||||||||||||||||||||
|
Jun 30, 2020
|
Mar 31,
2020
|
Dec 31,
2019
|
Jun 30,
2019
|
Prior
Qtr
|
Prior
Yr Qtr
|
|||||||||||||||||||
|
Amount
|
Percentage
|
Amount
|
Amount
|
Amount
|
||||||||||||||||||||
|
Washington
|
$
|
4,787,550
|
46.5%
|
$
|
4,350,273
|
$
|
4,364,764
|
$
|
4,293,854
|
10.1
|
%
|
11.5
|
%
|
|||||||||||
|
California
|
2,359,703
|
22.9%
|
2,140,895
|
2,129,789
|
1,659,326
|
10.2
|
%
|
42.2
|
%
|
|||||||||||||||
|
Oregon
|
1,899,933
|
18.5%
|
1,664,652
|
1,650,704
|
1,628,102
|
14.1
|
%
|
16.7
|
%
|
|||||||||||||||
|
Idaho
|
592,515
|
5.8%
|
524,663
|
530,016
|
548,189
|
12.9
|
%
|
8.1
|
%
|
|||||||||||||||
|
Utah
|
67,929
|
0.7%
|
52,747
|
60,958
|
62,944
|
28.8
|
%
|
7.9
|
%
|
|||||||||||||||
|
Other
|
576,369
|
5.6%
|
552,514
|
569,126
|
554,135
|
4.3
|
%
|
4.0
|
%
|
|||||||||||||||
|
Total loans receivable
|
$
|
10,283,999
|
100.0%
|
$
|
9,285,744
|
$
|
9,305,357
|
$
|
8,746,550
|
10.8
|
%
|
17.6
|
%
|
|||||||||||
BANR - Second Quarter 2020 Results
July 22, 2020
Page 9ADDITIONAL FINANCIAL INFORMATION
(dollars in thousands)
The following table shows loan originations (excluding loans held for sale) activity for the quarters ending June 30, 2020, March 31, 2020,
and June 30, 2019.
|
LOAN ORIGINATIONS
|
Quarters Ended
|
||||||||||
|
Jun 30, 2020
|
Mar 31, 2020
|
Jun 30, 2019
|
|||||||||
|
Commercial real estate
|
$
|
111,765
|
$
|
76,359
|
$
|
64,999
|
|||||
|
Multifamily real estate
|
6,384
|
10,171
|
19,834
|
||||||||
|
Construction and land
|
290,955
|
369,613
|
368,224
|
||||||||
|
Commercial business
|
1,318,438
|
199,873
|
266,768
|
||||||||
|
Agricultural business
|
16,293
|
31,261
|
18,194
|
||||||||
|
One-to four-family residential
|
24,537
|
31,041
|
23,363
|
||||||||
|
Consumer
|
126,653
|
67,357
|
117,869
|
||||||||
|
Total loan originations (excluding loans held for sale)
|
$
|
1,895,025
|
$
|
785,675
|
$
|
879,251
|
|||||
BANR - Second Quarter 2020 Results
July 22, 2020
Page 10|
ADDITIONAL FINANCIAL INFORMATION
|
||||||||||||
|
(dollars in thousands)
|
||||||||||||
|
Quarters Ended
|
||||||||||||
|
CHANGE IN THE
|
Jun 30, 2020
|
Mar 31, 2020
|
Jun 30, 2019
|
|||||||||
|
ALLOWANCE FOR CREDIT LOSSES - LOANS
|
||||||||||||
|
Balance, beginning of period
|
$
|
130,488
|
$
|
100,559
|
$
|
97,308
|
||||||
|
Beginning balance adjustment for adoption of ASC 326
|
—
|
7,812
|
—
|
|||||||||
|
Provision for credit losses - loans
|
29,524
|
21,713
|
2,000
|
|||||||||
|
Recoveries of loans previously charged off:
|
||||||||||||
|
Commercial real estate
|
54
|
167
|
149
|
|||||||||
|
Construction and land
|
105
|
—
|
30
|
|||||||||
|
One- to four-family real estate
|
31
|
148
|
230
|
|||||||||
|
Commercial business
|
370
|
205
|
215
|
|||||||||
|
Agricultural business, including secured by farmland
|
22
|
1,750
|
35
|
|||||||||
|
Consumer
|
60
|
96
|
223
|
|||||||||
|
642
|
2,366
|
882
|
||||||||||
|
Loans charged off:
|
||||||||||||
|
Commercial real estate
|
—
|
(100
|
)
|
(393
|
)
|
|||||||
|
Multifamily real estate
|
—
|
(66
|
)
|
—
|
||||||||
|
Construction and land
|
(100
|
)
|
—
|
—
|
||||||||
|
One- to four-family real estate
|
—
|
(64
|
)
|
—
|
||||||||
|
Commercial business
|
(3,553
|
)
|
(1,384
|
)
|
(802
|
)
|
||||||
|
Agricultural business, including secured by farmland
|
(62
|
)
|
—
|
(162
|
)
|
|||||||
|
Consumer
|
(587
|
)
|
(348
|
)
|
(579
|
)
|
||||||
|
(4,302
|
)
|
(1,962
|
)
|
(1,936
|
)
|
|||||||
|
Net (charge-offs)/recoveries
|
(3,660
|
)
|
404
|
(1,054
|
)
|
|||||||
|
Balance, end of period
|
$
|
156,352
|
$
|
130,488
|
$
|
98,254
|
||||||
|
Net (charge-offs)/recoveries / Average loans receivable
|
(0.036
|
)%
|
0.004
|
%
|
(0.012
|
)%
|
||||||
|
ALLOCATION OF
|
||||||||||||
|
ALLOWANCE FOR CREDIT LOSSES - LOANS
|
Jun 30, 2020
|
Mar 31, 2020
|
Jun 30, 2019
|
|||||||||
|
Specific or allocated credit loss allowance:
|
||||||||||||
|
Commercial real estate
|
$
|
53,166
|
$
|
29,339
|
$
|
26,730
|
||||||
|
Multifamily real estate
|
3,504
|
2,805
|
4,344
|
|||||||||
|
Construction and land
|
36,916
|
34,217
|
23,554
|
|||||||||
|
One- to four-family real estate
|
12,746
|
11,884
|
4,701
|
|||||||||
|
Commercial business
|
33,870
|
31,648
|
19,557
|
|||||||||
|
Agricultural business, including secured by farmland
|
4,517
|
4,513
|
3,691
|
|||||||||
|
Consumer
|
11,633
|
16,082
|
8,452
|
|||||||||
|
Total allocated
|
156,352
|
130,488
|
91,029
|
|||||||||
|
Unallocated
|
—
|
—
|
7,225
|
|||||||||
|
Total allowance for credit losses - loans
|
$
|
156,352
|
$
|
130,488
|
$
|
98,254
|
||||||
|
Allowance for credit losses - loans / Total loans receivable
|
1.52
|
%
|
1.41
|
%
|
1.12
|
%
|
||||||
|
Allowance for credit losses - loans / Non-performing loans
|
418
|
%
|
299
|
%
|
534
|
%
|
||||||
|
Quarters Ended
|
||||||||||||
|
CHANGE IN THE
|
Jun 30, 2020
|
Mar 31, 2020
|
Jun 30, 2019
|
|||||||||
|
ALLOWANCE FOR CREDIT LOSSES - UNFUNDED LOAN COMMITMENTS
|
||||||||||||
|
Balance, beginning of period
|
$
|
11,460
|
$
|
2,716
|
$
|
2,599
|
||||||
|
Beginning balance adjustment for adoption of ASC 326
|
—
|
7,022
|
—
|
|||||||||
|
(Recapture) / provision for credit losses - unfunded loan commitments
|
(905
|
)
|
1,722
|
—
|
||||||||
|
Balance, end of period
|
$
|
10,555
|
$
|
11,460
|
$
|
2,599
|
||||||
BANR - Second Quarter 2020 Results
July 22, 2020
Page 11|
ADDITIONAL FINANCIAL INFORMATION
|
|||||||||||||||
|
(dollars in thousands)
|
|||||||||||||||
|
Jun 30, 2020
|
Mar 31, 2020
|
Dec 31, 2019
|
Jun 30, 2019
|
||||||||||||
|
NON-PERFORMING ASSETS
|
|||||||||||||||
|
Loans on non-accrual status:
|
|||||||||||||||
|
Secured by real estate:
|
|||||||||||||||
|
Commercial
|
$
|
10,845
|
$
|
8,512
|
$
|
5,952
|
$
|
4,603
|
|||||||
|
Multifamily
|
—
|
—
|
85
|
—
|
|||||||||||
|
Construction and land
|
732
|
1,393
|
1,905
|
2,214
|
|||||||||||
|
One- to four-family
|
2,942
|
3,045
|
3,410
|
2,665
|
|||||||||||
|
Commercial business
|
18,486
|
25,027
|
23,015
|
2,983
|
|||||||||||
|
Agricultural business, including secured by farmland
|
433
|
495
|
661
|
1,359
|
|||||||||||
|
Consumer
|
2,412
|
1,812
|
2,473
|
3,230
|
|||||||||||
|
35,850
|
40,284
|
37,501
|
17,054
|
||||||||||||
|
Loans more than 90 days delinquent, still on accrual:
|
|||||||||||||||
|
Secured by real estate:
|
|||||||||||||||
|
Commercial
|
—
|
24
|
89
|
—
|
|||||||||||
|
Construction and land
|
—
|
1,407
|
332
|
262
|
|||||||||||
|
One- to four-family
|
472
|
1,089
|
877
|
995
|
|||||||||||
|
Commercial business
|
1
|
77
|
401
|
1
|
|||||||||||
|
Agricultural business, including secured by farmland
|
1,061
|
461
|
—
|
—
|
|||||||||||
|
Consumer
|
36
|
320
|
398
|
97
|
|||||||||||
|
1,570
|
3,378
|
2,097
|
1,355
|
||||||||||||
|
Total non-performing loans
|
37,420
|
43,662
|
39,598
|
18,409
|
|||||||||||
|
Real estate owned (REO)
|
2,400
|
2,402
|
814
|
2,513
|
|||||||||||
|
Other repossessed assets
|
47
|
47
|
122
|
112
|
|||||||||||
|
Total non-performing assets
|
$
|
39,867
|
$
|
46,111
|
$
|
40,534
|
$
|
21,034
|
|||||||
|
Total non-performing assets to total assets
|
0.28
|
%
|
0.36
|
%
|
0.32
|
%
|
0.18
|
%
|
|||||||
|
Quarters Ended
|
Six Months Ended
|
||||||||||||||||||
|
REAL ESTATE OWNED
|
Jun 30, 2020
|
Mar 31, 2020
|
Jun 30, 2019
|
Jun 30, 2020
|
Jun 30, 2019
|
||||||||||||||
|
Balance, beginning of period
|
$
|
2,402
|
$
|
814
|
$
|
2,611
|
$
|
814
|
$
|
2,611
|
|||||||||
|
Additions from loan foreclosures
|
—
|
1,588
|
61
|
1,588
|
61
|
||||||||||||||
|
Proceeds from dispositions of REO
|
(98
|
)
|
—
|
(150
|
)
|
(98
|
)
|
(150
|
)
|
||||||||||
|
Gain (loss) on sale of REO
|
96
|
—
|
(9
|
)
|
96
|
(9
|
)
|
||||||||||||
|
Balance, end of period
|
$
|
2,400
|
$
|
2,402
|
$
|
2,513
|
$
|
2,400
|
$
|
2,513
|
|||||||||
BANR - Second Quarter 2020 Results
July 22, 2020
Page 12|
ADDITIONAL FINANCIAL INFORMATION
|
||||||||||||||||||||||
|
(dollars in thousands)
|
||||||||||||||||||||||
|
DEPOSIT COMPOSITION
|
Percentage Change
|
|||||||||||||||||||||
|
Jun 30, 2020
|
Mar 31, 2020
|
Dec 31, 2019
|
Jun 30, 2019
|
Prior Qtr
|
Prior Yr
Qtr
|
|||||||||||||||||
|
Non-interest-bearing
|
$
|
5,281,559
|
$
|
4,107,262
|
$
|
3,945,000
|
$
|
3,671,995
|
28.6
|
%
|
43.8
|
%
|
||||||||||
|
Interest-bearing checking
|
1,399,593
|
1,331,860
|
1,280,003
|
1,187,035
|
5.1
|
%
|
17.9
|
%
|
||||||||||||||
|
Regular savings accounts
|
2,197,790
|
1,997,265
|
1,934,041
|
1,848,048
|
10.0
|
%
|
18.9
|
%
|
||||||||||||||
|
Money market accounts
|
2,095,332
|
1,846,844
|
1,769,194
|
1,511,119
|
13.5
|
%
|
38.7
|
%
|
||||||||||||||
|
Total interest-bearing transaction and savings accounts
|
5,692,715
|
5,175,969
|
4,983,238
|
4,546,202
|
10.0
|
%
|
25.2
|
%
|
||||||||||||||
|
Total core deposits
|
10,974,274
|
9,283,231
|
8,928,238
|
8,218,197
|
18.2
|
%
|
33.5
|
%
|
||||||||||||||
|
Interest-bearing certificates
|
1,042,006
|
1,166,306
|
1,120,403
|
1,070,770
|
(10.7
|
)%
|
(2.7
|
)%
|
||||||||||||||
|
Total deposits
|
$
|
12,016,280
|
$
|
10,449,537
|
$
|
10,048,641
|
$
|
9,288,967
|
15.0
|
%
|
29.4
|
%
|
||||||||||
|
GEOGRAPHIC CONCENTRATION OF DEPOSITS
|
||||||||||||||||||||||||
|
Jun 30, 2020
|
Mar 31, 2020
|
Dec 31, 2019
|
Jun 30, 2019
|
Percentage Change
|
||||||||||||||||||||
|
Amount
|
Percentage
|
Amount
|
Amount
|
Amount
|
Prior Qtr
|
Prior Yr
Qtr
|
||||||||||||||||||
|
Washington
|
$
|
6,765,186
|
56.3%
|
$
|
6,037,864
|
$
|
5,861,809
|
$
|
5,503,280
|
12.0
|
%
|
22.9
|
%
|
|||||||||||
|
Oregon
|
2,440,617
|
20.3%
|
2,093,738
|
2,006,163
|
1,919,051
|
16.6
|
%
|
27.2
|
%
|
|||||||||||||||
|
California
|
2,224,477
|
18.5%
|
1,828,064
|
1,698,289
|
1,399,137
|
21.7
|
%
|
59.0
|
%
|
|||||||||||||||
|
Idaho
|
586,000
|
4.9%
|
489,871
|
482,380
|
467,499
|
19.6
|
%
|
25.3
|
%
|
|||||||||||||||
|
Total deposits
|
$
|
12,016,280
|
100.0%
|
$
|
10,449,537
|
$
|
10,048,641
|
$
|
9,288,967
|
15.0
|
%
|
29.4
|
%
|
|||||||||||
|
INCLUDED IN TOTAL DEPOSITS
|
Jun 30, 2020
|
Mar 31, 2020
|
Dec 31, 2019
|
Jun 30, 2019
|
||||||||||||
|
Public non-interest-bearing accounts
|
$
|
139,133
|
$
|
115,354
|
$
|
111,015
|
$
|
102,348
|
||||||||
|
Public interest-bearing transaction & savings accounts
|
136,039
|
130,958
|
133,403
|
121,262
|
||||||||||||
|
Public interest-bearing certificates
|
56,609
|
48,232
|
35,184
|
28,656
|
||||||||||||
|
Total public deposits
|
$
|
331,781
|
$
|
294,544
|
$
|
279,602
|
$
|
252,266
|
||||||||
|
Total brokered deposits
|
$
|
119,399
|
$
|
250,977
|
$
|
202,884
|
$
|
138,395
|
||||||||
BANR - Second Quarter 2020 Results
July 22, 2020
Page 13|
ADDITIONAL FINANCIAL INFORMATION
|
|||||||||||||||||||||
|
(dollars in thousands)
|
|||||||||||||||||||||
|
Actual
|
Minimum to be
categorized as
"Adequately Capitalized"
|
Minimum to be
categorized as
"Well Capitalized"
|
|||||||||||||||||||
|
REGULATORY CAPITAL RATIOS AS OF JUNE 30, 2020
|
Amount
|
Ratio
|
Amount
|
Ratio
|
Amount
|
Ratio
|
|||||||||||||||
|
Banner Corporation-consolidated:
|
|||||||||||||||||||||
|
Total capital to risk-weighted assets
|
$
|
1,544,473
|
14.14
|
%
|
$
|
873,623
|
8.00
|
%
|
$
|
1,092,028
|
10.00
|
%
|
|||||||||
|
Tier 1 capital to risk-weighted assets
|
1,307,925
|
11.98
|
%
|
655,217
|
6.00
|
%
|
655,217
|
6.00
|
%
|
||||||||||||
|
Tier 1 leverage capital to average assets
|
1,307,925
|
9.83
|
%
|
531,965
|
4.00
|
%
|
n/a
|
n/a
|
|||||||||||||
|
Common equity tier 1 capital to risk-weighted assets
|
1,164,425
|
10.66
|
%
|
491,413
|
4.50
|
%
|
n/a
|
n/a
|
|||||||||||||
|
Banner Bank:
|
|||||||||||||||||||||
|
Total capital to risk-weighted assets
|
1,366,305
|
12.73
|
%
|
858,690
|
8.00
|
%
|
1,073,363
|
10.00
|
%
|
||||||||||||
|
Tier 1 capital to risk-weighted assets
|
1,232,095
|
11.48
|
%
|
644,018
|
6.00
|
%
|
858,690
|
8.00
|
%
|
||||||||||||
|
Tier 1 leverage capital to average assets
|
1,232,095
|
9.47
|
%
|
520,183
|
4.00
|
%
|
650,229
|
5.00
|
%
|
||||||||||||
|
Common equity tier 1 capital to risk-weighted assets
|
1,232,095
|
11.48
|
%
|
483,013
|
4.50
|
%
|
697,686
|
6.50
|
%
|
||||||||||||
|
Islanders Bank:
|
|||||||||||||||||||||
|
Total capital to risk-weighted assets
|
28,579
|
15.08
|
%
|
15,164
|
8.00
|
%
|
18,955
|
10.00
|
%
|
||||||||||||
|
Tier 1 capital to risk-weighted assets
|
26,207
|
13.83
|
%
|
11,373
|
6.00
|
%
|
15,164
|
8.00
|
%
|
||||||||||||
|
Tier 1 leverage capital to average assets
|
26,207
|
8.62
|
%
|
12,160
|
4.00
|
%
|
15,200
|
5.00
|
%
|
||||||||||||
|
Common equity tier 1 capital to risk-weighted assets
|
26,207
|
13.83
|
%
|
8,530
|
4.50
|
%
|
12,321
|
6.50
|
%
|
||||||||||||
BANR - Second Quarter 2020 Results
July 22, 2020
Page 14
|
ADDITIONAL FINANCIAL INFORMATION
|
||||||||||||||||||||||||||
|
(dollars in thousands)
|
||||||||||||||||||||||||||
|
(rates / ratios annualized)
|
||||||||||||||||||||||||||
|
ANALYSIS OF NET INTEREST SPREAD
|
Quarters Ended
|
|||||||||||||||||||||||||
|
June 30, 2020
|
March 31, 2020
|
June 30, 2019
|
||||||||||||||||||||||||
|
Average
Balance
|
Interest and Dividends
|
Yield /
Cost(3)
|
Average
Balance
|
Interest and Dividends
|
Yield /
Cost(3)
|
Average
Balance
|
Interest and Dividends
|
Yield /
Cost(3)
|
||||||||||||||||||
|
Interest-earning assets:
|
||||||||||||||||||||||||||
|
Held for sale loans
|
$
|
152,636
|
$
|
1,451
|
3.82
|
%
|
$
|
152,627
|
$
|
1,520
|
4.01
|
%
|
$
|
47,663
|
$
|
567
|
4.77
|
%
|
||||||||
|
Mortgage loans
|
7,314,125
|
87,172
|
4.79
|
%
|
7,310,115
|
93,061
|
5.12
|
%
|
6,800,802
|
90,258
|
5.32
|
%
|
||||||||||||||
|
Commercial/agricultural loans
|
2,599,878
|
25,200
|
3.90
|
%
|
1,884,006
|
22,959
|
4.90
|
%
|
1,769,603
|
24,466
|
5.55
|
%
|
||||||||||||||
|
Consumer and other loans
|
152,438
|
2,361
|
6.23
|
%
|
163,098
|
2,595
|
6.40
|
%
|
179,693
|
2,834
|
6.33
|
%
|
||||||||||||||
|
Total loans(1)(3)
|
10,219,077
|
116,184
|
4.57
|
%
|
9,509,846
|
120,135
|
5.08
|
%
|
8,797,761
|
118,125
|
5.39
|
%
|
||||||||||||||
|
Mortgage-backed securities
|
1,286,223
|
8,083
|
2.53
|
%
|
1,354,585
|
9,236
|
2.74
|
%
|
1,354,048
|
9,794
|
2.90
|
%
|
||||||||||||||
|
Other securities
|
787,957
|
5,859
|
2.99
|
%
|
458,116
|
3,310
|
2.91
|
%
|
448,721
|
3,663
|
3.27
|
%
|
||||||||||||||
|
Interest-bearing deposits with banks
|
212,502
|
172
|
0.33
|
%
|
92,659
|
393
|
1.71
|
%
|
53,955
|
340
|
2.53
|
%
|
||||||||||||||
|
FHLB stock
|
16,620
|
300
|
7.26
|
%
|
26,522
|
322
|
4.88
|
%
|
30,902
|
387
|
5.02
|
%
|
||||||||||||||
|
Total investment securities (3)
|
2,303,302
|
14,414
|
2.52
|
%
|
1,931,882
|
13,261
|
2.76
|
%
|
1,887,626
|
14,184
|
3.01
|
%
|
||||||||||||||
|
Total interest-earning assets
|
12,522,379
|
130,598
|
4.19
|
%
|
11,441,728
|
133,396
|
4.69
|
%
|
10,685,387
|
132,309
|
4.97
|
%
|
||||||||||||||
|
Non-interest-earning assets
|
1,359,975
|
1,193,256
|
1,048,811
|
|||||||||||||||||||||||
|
Total assets
|
$
|
13,882,354
|
$
|
12,634,984
|
$
|
11,734,198
|
||||||||||||||||||||
|
Deposits:
|
||||||||||||||||||||||||||
|
Interest-bearing checking accounts
|
$
|
1,376,710
|
374
|
0.11
|
%
|
$
|
1,266,647
|
469
|
0.15
|
%
|
$
|
1,177,534
|
564
|
0.19
|
%
|
|||||||||||
|
Savings accounts
|
2,108,896
|
998
|
0.19
|
%
|
2,039,857
|
1,755
|
0.35
|
%
|
1,851,913
|
2,119
|
0.46
|
%
|
||||||||||||||
|
Money market accounts
|
1,979,419
|
1,565
|
0.32
|
%
|
1,743,118
|
2,439
|
0.56
|
%
|
1,497,717
|
2,656
|
0.71
|
%
|
||||||||||||||
|
Certificates of deposit
|
1,117,547
|
3,757
|
1.35
|
%
|
1,124,994
|
4,087
|
1.46
|
%
|
1,105,844
|
3,684
|
1.34
|
%
|
||||||||||||||
|
Total interest-bearing deposits
|
6,582,572
|
6,694
|
0.41
|
%
|
6,174,616
|
8,750
|
0.57
|
%
|
5,633,008
|
9,023
|
0.64
|
%
|
||||||||||||||
|
Non-interest-bearing deposits
|
4,902,992
|
—
|
—
|
%
|
3,965,380
|
—
|
—
|
%
|
3,652,096
|
—
|
—
|
%
|
||||||||||||||
|
Total deposits
|
11,485,564
|
6,694
|
0.23
|
%
|
10,139,996
|
8,750
|
0.35
|
%
|
9,285,104
|
9,023
|
0.39
|
%
|
||||||||||||||
|
Other interest-bearing liabilities:
|
||||||||||||||||||||||||||
|
FHLB advances
|
156,374
|
984
|
2.53
|
%
|
405,429
|
2,064
|
2.05
|
%
|
514,703
|
3,370
|
2.63
|
%
|
||||||||||||||
|
Other borrowings
|
285,735
|
238
|
0.34
|
%
|
124,771
|
116
|
0.37
|
%
|
122,455
|
67
|
0.22
|
%
|
||||||||||||||
|
Junior subordinated debentures and subordinated notes
|
149,043
|
1,251
|
3.38
|
%
|
147,944
|
1,477
|
4.02
|
%
|
140,212
|
1,683
|
4.81
|
%
|
||||||||||||||
|
Total borrowings
|
591,152
|
2,473
|
1.68
|
%
|
678,144
|
3,657
|
2.17
|
%
|
777,370
|
5,120
|
2.64
|
%
|
||||||||||||||
|
Total funding liabilities
|
12,076,716
|
9,167
|
0.31
|
%
|
10,818,140
|
12,407
|
0.46
|
%
|
10,062,474
|
14,143
|
0.56
|
%
|
||||||||||||||
|
Other non-interest-bearing liabilities(2)
|
188,369
|
212,162
|
151,436
|
|||||||||||||||||||||||
|
Total liabilities
|
12,265,085
|
11,030,302
|
10,213,910
|
|||||||||||||||||||||||
|
Shareholders' equity
|
1,617,269
|
1,604,682
|
1,520,288
|
|||||||||||||||||||||||
|
Total liabilities and shareholders' equity
|
$
|
13,882,354
|
$
|
12,634,984
|
$
|
11,734,198
|
||||||||||||||||||||
|
Net interest income/rate spread (tax equivalent)
|
$
|
121,431
|
3.88
|
%
|
$
|
120,989
|
4.23
|
%
|
$
|
118,166
|
4.41
|
%
|
||||||||||||||
|
Net interest margin (tax equivalent)
|
3.90
|
%
|
4.25
|
%
|
4.44
|
%
|
||||||||||||||||||||
|
Reconciliation to reported net interest income:
|
||||||||||||||||||||||||||
|
Adjustments for taxable equivalent basis
|
(1,974
|
)
|
(1,731
|
)
|
(1,471
|
)
|
||||||||||||||||||||
|
Net interest income and margin, as reported
|
$
|
119,457
|
3.84
|
%
|
$
|
119,258
|
4.19
|
%
|
$
|
116,695
|
4.38
|
%
|
||||||||||||||
|
Additional Key Financial Ratios:
|
||||||||||||||||||||||||||
|
Return on average assets
|
0.68
|
%
|
0.54
|
%
|
1.36
|
%
|
||||||||||||||||||||
|
Return on average equity
|
5.85
|
%
|
4.23
|
%
|
10.47
|
%
|
||||||||||||||||||||
|
Average equity/average assets
|
11.65
|
%
|
12.70
|
%
|
12.96
|
%
|
||||||||||||||||||||
|
Average interest-earning assets/average interest-bearing liabilities
|
174.56
|
%
|
166.97
|
%
|
166.69
|
%
|
||||||||||||||||||||
|
Average interest-earning assets/average funding liabilities
|
103.69
|
%
|
105.76
|
%
|
106.19
|
%
|
||||||||||||||||||||
|
Non-interest income/average assets
|
0.81
|
%
|
0.61
|
%
|
0.78
|
%
|
||||||||||||||||||||
|
Non-interest expense/average assets
|
2.60
|
%
|
3.03
|
%
|
2.96
|
%
|
||||||||||||||||||||
|
Efficiency ratio(4)
|
60.85
|
%
|
68.76
|
%
|
62.22
|
%
|
||||||||||||||||||||
|
Adjusted efficiency ratio(5)
|
57.95
|
%
|
63.47
|
%
|
59.56
|
%
|
||||||||||||||||||||
|
(1)
|
Average balances include loans accounted for on a nonaccrual basis and loans 90 days or more past due. Amortization of net
deferred loan fees/costs is included with interest on loans.
|
|
(2)
|
Average other non-interest-bearing liabilities include fair value adjustments related to junior subordinated debentures.
|
|
(3)
|
Tax-exempt income is calculated on a tax equivalent basis. The tax equivalent yield adjustment to interest earned on loans was $1.0 million, $1.2
million, and $1.1 million for the three months ended June 30, 2020, March 31, 2020, and June 30, 2019, respectively. The tax equivalent yield adjustment to interest earned on tax exempt securities was $963,000, $522,000, and $353,000 for
the three months ended June 30, 2020, March 31, 2020, and June 30, 2019, respectively.
|
|
(4)
|
Non-interest expense divided by the total of net interest income (before provision for loan losses) and non-interest income.
|
|
(5)
|
Adjusted non-interest expense divided by adjusted revenue. These represent non-GAAP financial measures. See the non-GAAP reconciliation tables
above under "Executive Overview—Non-GAAP Financial Measures."
|
BANR - Second Quarter 2020 Results
July 22, 2020
Page 15|
ADDITIONAL FINANCIAL INFORMATION
|
|||||||||||||||||
|
(dollars in thousands)
|
|||||||||||||||||
|
(rates / ratios annualized)
|
|||||||||||||||||
|
ANALYSIS OF NET INTEREST SPREAD
|
Six Months Ended
|
||||||||||||||||
|
June 30, 2020
|
June 30, 2019
|
||||||||||||||||
|
Average Balance
|
Interest and Dividends
|
Yield/Cost(3)
|
Average Balance
|
Interest and Dividends
|
Yield/Cost(3)
|
||||||||||||
|
Interest-earning assets:
|
|||||||||||||||||
|
Held for sale loans
|
$
|
152,631
|
$
|
2,971
|
3.91
|
%
|
$
|
72,694
|
$
|
1,688
|
4.68
|
%
|
|||||
|
Mortgage loans
|
7,312,120
|
180,233
|
4.96
|
%
|
6,817,276
|
179,320
|
5.30
|
%
|
|||||||||
|
Commercial/agricultural loans
|
2,241,942
|
48,159
|
4.32
|
%
|
1,736,735
|
47,767
|
5.55
|
%
|
|||||||||
|
Consumer and other loans
|
157,768
|
4,956
|
6.32
|
%
|
181,562
|
5,754
|
6.39
|
%
|
|||||||||
|
Total loans(1)(3)
|
9,864,461
|
236,319
|
4.82
|
%
|
8,808,267
|
234,529
|
5.37
|
%
|
|||||||||
|
Mortgage-backed securities
|
1,320,404
|
17,319
|
2.64
|
%
|
1,372,978
|
20,301
|
2.98
|
%
|
|||||||||
|
Other securities
|
623,036
|
9,169
|
2.96
|
%
|
466,330
|
7,516
|
3.25
|
%
|
|||||||||
|
Interest-bearing deposits with banks
|
152,581
|
565
|
0.74
|
%
|
49,382
|
629
|
2.57
|
%
|
|||||||||
|
FHLB stock
|
21,571
|
622
|
5.80
|
%
|
31,329
|
653
|
4.20
|
%
|
|||||||||
|
Total investment securities(3)
|
2,117,592
|
27,675
|
2.63
|
%
|
1,920,019
|
29,099
|
3.06
|
%
|
|||||||||
|
Total interest-earning assets
|
11,982,053
|
263,994
|
4.43
|
%
|
10,728,286
|
263,628
|
4.96
|
%
|
|||||||||
|
Non-interest-earning assets
|
1,276,615
|
1,040,248
|
|||||||||||||||
|
Total assets
|
$
|
13,258,668
|
$
|
11,768,534
|
|||||||||||||
|
Deposits:
|
|||||||||||||||||
|
Interest-bearing checking accounts
|
$
|
1,321,679
|
843
|
0.13
|
%
|
$
|
1,165,807
|
1,039
|
0.18
|
%
|
|||||||
|
Savings accounts
|
2,074,377
|
2,753
|
0.27
|
%
|
1,853,012
|
4,039
|
0.44
|
%
|
|||||||||
|
Money market accounts
|
1,861,268
|
4,004
|
0.43
|
%
|
1,494,042
|
4,907
|
0.66
|
%
|
|||||||||
|
Certificates of deposit
|
1,121,270
|
7,844
|
1.41
|
%
|
1,179,320
|
7,681
|
1.31
|
%
|
|||||||||
|
Total interest-bearing deposits
|
6,378,594
|
15,444
|
0.49
|
%
|
5,692,181
|
17,666
|
0.63
|
%
|
|||||||||
|
Non-interest-bearing deposits
|
4,434,186
|
—
|
—
|
%
|
3,629,136
|
—
|
—
|
%
|
|||||||||
|
Total deposits
|
10,812,780
|
15,444
|
0.29
|
%
|
9,321,317
|
17,666
|
0.38
|
%
|
|||||||||
|
Other interest-bearing liabilities:
|
|||||||||||||||||
|
FHLB advances
|
280,901
|
3,048
|
2.18
|
%
|
524,417
|
6,846
|
2.63
|
%
|
|||||||||
|
Other borrowings
|
205,253
|
354
|
0.35
|
%
|
120,243
|
127
|
0.21
|
%
|
|||||||||
|
Junior subordinated debentures and subordinated notes
|
148,494
|
2,728
|
3.69
|
%
|
140,212
|
3,396
|
4.88
|
%
|
|||||||||
|
Total borrowings
|
634,648
|
6,130
|
1.94
|
%
|
784,872
|
10,369
|
2.66
|
%
|
|||||||||
|
Total funding liabilities
|
11,447,428
|
21,574
|
0.38
|
%
|
10,106,189
|
28,035
|
0.56
|
%
|
|||||||||
|
Other non-interest-bearing liabilities(2)
|
200,265
|
151,685
|
|||||||||||||||
|
Total liabilities
|
11,647,693
|
10,257,874
|
|||||||||||||||
|
Shareholders' equity
|
1,610,975
|
1,510,660
|
|||||||||||||||
|
Total liabilities and shareholders' equity
|
$
|
13,258,668
|
$
|
11,768,534
|
|||||||||||||
|
Net interest income/rate spread (tax equivalent)
|
$
|
242,420
|
4.05
|
%
|
$
|
235,593
|
4.40
|
%
|
|||||||||
|
Net interest margin (tax equivalent)
|
4.07
|
%
|
4.43
|
%
|
|||||||||||||
|
Reconciliation to reported net interest income:
|
|||||||||||||||||
|
Adjustments for taxable equivalent basis
|
(3,705
|
)
|
(2,794
|
)
|
|||||||||||||
|
Net interest income and margin, as reported
|
$
|
238,715
|
4.01
|
%
|
$
|
232,799
|
4.38
|
%
|
|||||||||
|
Additional Key Financial Ratios:
|
|||||||||||||||||
|
Return on average assets
|
0.61
|
%
|
1.25
|
%
|
|||||||||||||
|
Return on average equity
|
5.05
|
%
|
9.75
|
%
|
|||||||||||||
|
Average equity/average assets
|
12.15
|
%
|
12.84
|
%
|
|||||||||||||
|
Average interest-earning assets/average interest-bearing liabilities
|
`
|
170.85
|
%
|
165.64
|
%
|
||||||||||||
|
Average interest-earning assets/average funding liabilities
|
104.67
|
%
|
106.16
|
%
|
|||||||||||||
|
Non-interest income/average assets
|
0.71
|
%
|
0.70
|
%
|
|||||||||||||
|
Non-interest expense/average assets
|
2.80
|
%
|
3.03
|
%
|
|||||||||||||
|
Efficiency ratio(4)
|
64.69
|
%
|
64.59
|
%
|
|||||||||||||
|
Adjusted efficiency ratio(5)
|
60.69
|
%
|
61.41
|
%
|
|||||||||||||
|
(1)
|
Average balances include loans accounted for on a nonaccrual basis and loans 90 days or more past due. Amortization of net
deferred loan fees/costs is included with interest on loans.
|
|
(2)
|
Average other non-interest-bearing liabilities include fair value adjustments related to junior subordinated debentures.
|
|
(3)
|
Tax-exempt income is calculated on a tax equivalent basis. The tax equivalent yield adjustment to interest earned on loans was $2.2 million and
$2.1 million for the six months ended June 30, 2020 and June 30, 2019, respectively. The tax equivalent yield adjustment to interest earned on tax exempt securities was $1.5 million and $727,000 for the six months ended June 30, 2020 and
June 30, 2019, respectively.
|
|
(4)
|
Non-interest expense divided by the total of net interest income (before provision for loan losses) and non-interest income.
|
|
(5)
|
Adjusted non-interest expense divided by adjusted revenue. These represent non-GAAP financial measures. See the non-GAAP reconciliation tables
above under "Executive Overview—Non-GAAP Financial Measures."
|
BANR - Second Quarter 2020 Results
July 22, 2020
Page 16|
ADDITIONAL FINANCIAL INFORMATION
|
|||||||||||||||||||
|
(dollars in thousands)
|
|||||||||||||||||||
|
* Non-GAAP Financial Measures
|
|||||||||||||||||||
|
In addition to results presented in accordance with generally accepted accounting principles in the United States of America
(GAAP), this press release contains certain non-GAAP financial measures. Management has presented these non-GAAP financial measures in this earnings release because it believes that they provide useful and comparative information to assess
trends in Banner's core operations reflected in the current quarter's results and facilitate the comparison of our performance with the performance of our peers. However, these non-GAAP financial measures are supplemental and are not a
substitute for any analysis based on GAAP. Where applicable, comparable earnings information using GAAP financial measures is also presented. Because not all companies use the same calculations, our presentation may not be comparable to
other similarly titled measures as calculated by other companies. For a reconciliation of these non-GAAP financial measures, see the tables below:
|
|||||||||||||||||||
|
ADJUSTED REVENUE
|
Quarters Ended
|
Six Months Ended
|
|||||||||||||||||
|
Jun 30, 2020
|
Mar 31, 2020
|
Jun 30, 2019
|
Jun 30, 2020
|
Jun 30, 2019
|
|||||||||||||||
|
Net interest income before provision for loan losses
|
$
|
119,457
|
$
|
119,258
|
$
|
116,695
|
$
|
238,715
|
$
|
232,799
|
|||||||||
|
Total non-interest income
|
27,843
|
19,165
|
22,676
|
47,008
|
40,801
|
||||||||||||||
|
Total GAAP revenue
|
147,300
|
138,423
|
139,371
|
285,723
|
273,600
|
||||||||||||||
|
Exclude net gain (loss) on sale of securities
|
(93
|
)
|
(78
|
)
|
28
|
(171
|
)
|
27
|
|||||||||||
|
Exclude net change in valuation of financial instruments carried at fair value
|
(2,199
|
)
|
4,596
|
114
|
2,397
|
103
|
|||||||||||||
|
Adjusted revenue (non-GAAP)
|
$
|
145,008
|
$
|
142,941
|
$
|
139,513
|
$
|
287,949
|
$
|
273,730
|
|||||||||
|
ADJUSTED EARNINGS
|
Quarters Ended
|
Six Months Ended
|
||||||||||||||||||
|
Jun 30, 2020
|
Mar 31, 2020
|
Jun 30, 2019
|
Jun 30, 2020
|
Jun 30, 2019
|
||||||||||||||||
|
Net income (GAAP)
|
$
|
23,541
|
$
|
16,882
|
$
|
39,700
|
$
|
40,423
|
$
|
73,046
|
||||||||||
|
Exclude net gain (loss) on sale of securities
|
(93
|
)
|
(78
|
)
|
28
|
(171
|
)
|
27
|
||||||||||||
|
Exclude net change in valuation of financial instruments carried at fair value
|
(2,199
|
)
|
4,596
|
114
|
2,397
|
103
|
||||||||||||||
|
Exclude acquisition-related expenses
|
336
|
1,142
|
301
|
1,478
|
2,449
|
|||||||||||||||
|
Exclude COVID-19 expenses
|
2,152
|
239
|
—
|
2,391
|
—
|
|||||||||||||||
|
Exclude related net tax benefit
|
(47
|
)
|
(1,405
|
)
|
(106
|
)
|
(1,452
|
)
|
(619
|
)
|
||||||||||
|
Total adjusted earnings (non-GAAP)
|
$
|
23,690
|
$
|
21,376
|
$
|
40,037
|
$
|
45,066
|
$
|
75,006
|
||||||||||
|
Diluted earnings per share (GAAP)
|
$
|
0.67
|
$
|
0.47
|
$
|
1.14
|
$
|
1.14
|
$
|
2.09
|
||||||||||
|
Diluted adjusted earnings per share (non-GAAP)
|
$
|
0.67
|
$
|
0.60
|
$
|
1.15
|
$
|
1.27
|
$
|
2.14
|
||||||||||
BANR - Second Quarter 2020 Results
July 22, 2020
Page 17|
ADDITIONAL FINANCIAL INFORMATION
|
||||||||||||||||||||
|
(dollars in thousands)
|
||||||||||||||||||||
|
ADJUSTED EFFICIENCY RATIO
|
Quarters Ended
|
Six Months Ended
|
||||||||||||||||||
|
Jun 30, 2020
|
Mar 31, 2020
|
Jun 30, 2019
|
Jun 30, 2020
|
Jun 30, 2019
|
||||||||||||||||
|
Non-interest expense (GAAP)
|
$
|
89,637
|
$
|
95,185
|
$
|
86,716
|
$
|
184,822
|
$
|
176,730
|
||||||||||
|
Exclude acquisition-related expenses
|
(336
|
)
|
(1,142
|
)
|
(301
|
)
|
(1,478
|
)
|
(2,449
|
)
|
||||||||||
|
Exclude COVID-19 expenses
|
(2,152
|
)
|
(239
|
)
|
—
|
(2,391
|
)
|
—
|
||||||||||||
|
Exclude CDI amortization
|
(2,002
|
)
|
(2,001
|
)
|
(2,053
|
)
|
(4,003
|
)
|
(4,105
|
)
|
||||||||||
|
Exclude state/municipal tax expense
|
(1,104
|
)
|
(984
|
)
|
(1,007
|
)
|
(2,088
|
)
|
(1,952
|
)
|
||||||||||
|
Exclude REO operations
|
(4
|
)
|
(100
|
)
|
(260
|
)
|
(104
|
)
|
(137
|
)
|
||||||||||
|
Adjusted non-interest expense (non-GAAP)
|
$
|
84,039
|
$
|
90,719
|
$
|
83,095
|
$
|
174,758
|
$
|
168,087
|
||||||||||
|
Net interest income before provision for loan losses (GAAP)
|
$
|
119,457
|
$
|
119,258
|
$
|
116,695
|
$
|
238,715
|
$
|
232,799
|
||||||||||
|
Non-interest income (GAAP)
|
27,843
|
19,165
|
22,676
|
47,008
|
40,801
|
|||||||||||||||
|
Total revenue
|
147,300
|
138,423
|
139,371
|
285,723
|
273,600
|
|||||||||||||||
|
Exclude net gain (loss) on sale of securities
|
(93
|
)
|
(78
|
)
|
28
|
(171
|
)
|
27
|
||||||||||||
|
Exclude net change in valuation of financial instruments carried at fair value
|
(2,199
|
)
|
4,596
|
114
|
2,397
|
103
|
||||||||||||||
|
Adjusted revenue (non-GAAP)
|
$
|
145,008
|
$
|
142,941
|
$
|
139,513
|
$
|
287,949
|
$
|
273,730
|
||||||||||
|
Efficiency ratio (GAAP)
|
60.85
|
%
|
68.76
|
%
|
62.22
|
%
|
64.69
|
%
|
64.59
|
%
|
||||||||||
|
Adjusted efficiency ratio (non-GAAP)
|
57.95
|
%
|
63.47
|
%
|
59.56
|
%
|
60.69
|
%
|
61.41
|
%
|
||||||||||
|
TANGIBLE COMMON SHAREHOLDERS' EQUITY TO TANGIBLE ASSETS
|
Jun 30, 2020
|
Mar 31, 2020
|
Dec 31, 2019
|
Jun 30, 2019
|
||||||||||||
|
Shareholders' equity (GAAP)
|
$
|
1,625,103
|
$
|
1,601,700
|
$
|
1,594,034
|
$
|
1,521,055
|
||||||||
|
Exclude goodwill and other intangible assets, net
|
398,276
|
400,278
|
402,279
|
367,749
|
||||||||||||
|
Tangible common shareholders' equity (non-GAAP)
|
$
|
1,226,827
|
$
|
1,201,422
|
$
|
1,191,755
|
$
|
1,153,306
|
||||||||
|
Total assets (GAAP)
|
$
|
14,405,607
|
$
|
12,780,950
|
$
|
12,604,031
|
$
|
11,847,374
|
||||||||
|
Exclude goodwill and other intangible assets, net
|
398,276
|
400,278
|
402,279
|
367,749
|
||||||||||||
|
Total tangible assets (non-GAAP)
|
$
|
14,007,331
|
$
|
12,380,672
|
$
|
12,201,752
|
$
|
11,479,625
|
||||||||
|
Common shareholders' equity to total assets (GAAP)
|
11.28
|
%
|
12.53
|
%
|
12.65
|
%
|
12.84
|
%
|
||||||||
|
Tangible common shareholders' equity to tangible assets (non-GAAP)
|
8.76
|
%
|
9.70
|
%
|
9.77
|
%
|
10.05
|
%
|
||||||||
|
TANGIBLE COMMON SHAREHOLDERS' EQUITY PER SHARE
|
||||||||||||||||
|
Tangible common shareholders' equity (non-GAAP)
|
$
|
1,226,827
|
$
|
1,201,422
|
$
|
1,191,755
|
$
|
1,153,306
|
||||||||
|
Common shares outstanding at end of period
|
35,157,899
|
35,102,459
|
35,751,576
|
34,573,643
|
||||||||||||
|
Common shareholders' equity (book value) per share (GAAP)
|
$
|
46.22
|
$
|
45.63
|
$
|
44.59
|
$
|
43.99
|
||||||||
|
Tangible common shareholders' equity (tangible book value) per share (non-GAAP)
|
$
|
34.89
|
$
|
34.23
|
$
|
33.33
|
$
|
33.36
|
||||||||