Exhibit 99.1
 |
 |
CONTACT:
|
MARK J. GRESCOVICH,
|
|
PRESIDENT & CEO
|
|||
|
PETER J. CONNER, CFO
|
|||
|
(509) 527-3636
|
|||
|
NEWS RELEASE
|
|||
Banner Corporation Reports Record 2019 Net Income
Highlights in Fourth Quarter of 2019 included
Strong Organic Loan and Core Deposit Growth and Completion of AltaPacific Bancorp Acquisition
Walla Walla, WA - January 23, 2020 - Banner Corporation (NASDAQ GSM: BANR) ("Banner"), the parent company of
Banner Bank and Islanders Bank, today reported record 2019 net income, which increased 7% to $146.3 million, or $4.18 per diluted share, compared to $136.5 million, or $4.15 per diluted share, in 2018. In the fourth quarter of 2019, net income
totaled $33.7 million, or $0.95 per diluted share, compared to $39.6 million, or $1.15 per diluted share, in the preceding quarter and $37.5 million, or $1.09 per diluted share, in the fourth quarter of 2018. Fourth quarter of 2019 results include
$4.4 million of acquisition-related expenses, compared to $676,000 of acquisition-related expenses in the preceding quarter and $4.6 million in the fourth quarter of 2018. The 2019 results include $7.5 million of acquisition-related expenses
compared to $5.6 million of acquisition-related expenses for 2018.
“Banner’s record 2019 operating results reflect the continued execution of our super community bank strategy. We
are generating new client relationships and adding to our core funding position by growing core deposits while maintaining a moderate risk profile,” stated Mark J. Grescovich, President and Chief Executive Officer. “During the fourth quarter, we
announced the completion of the merger with AltaPacific Bancorp. This combination is a complementary fit, both strategically and culturally, and provides scale to our California franchise with attractive core deposits and strong commercial banking
relationships.”
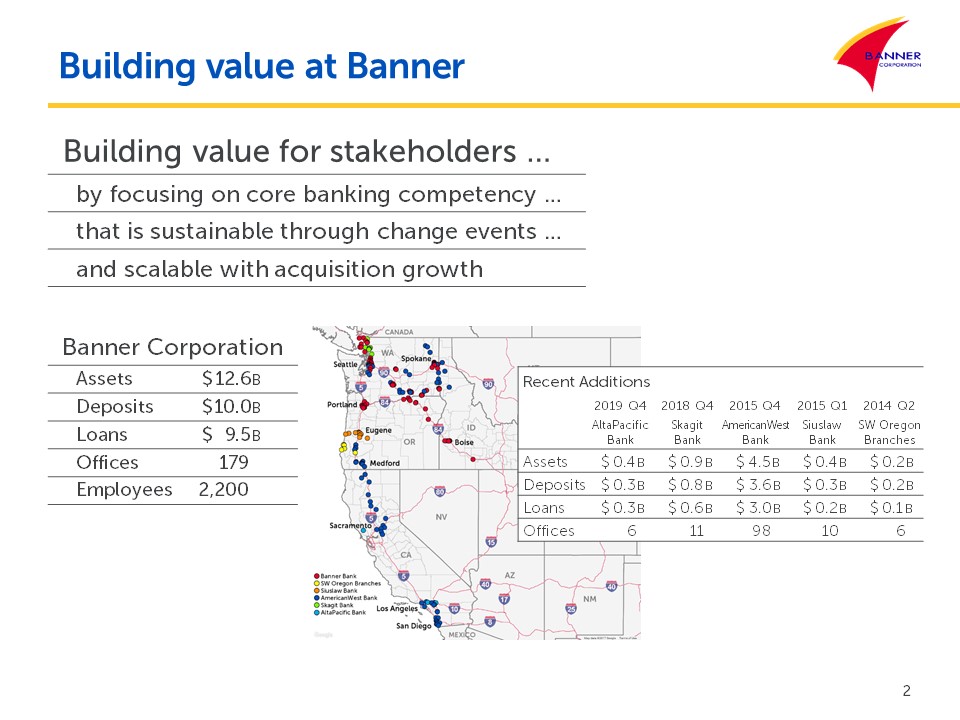
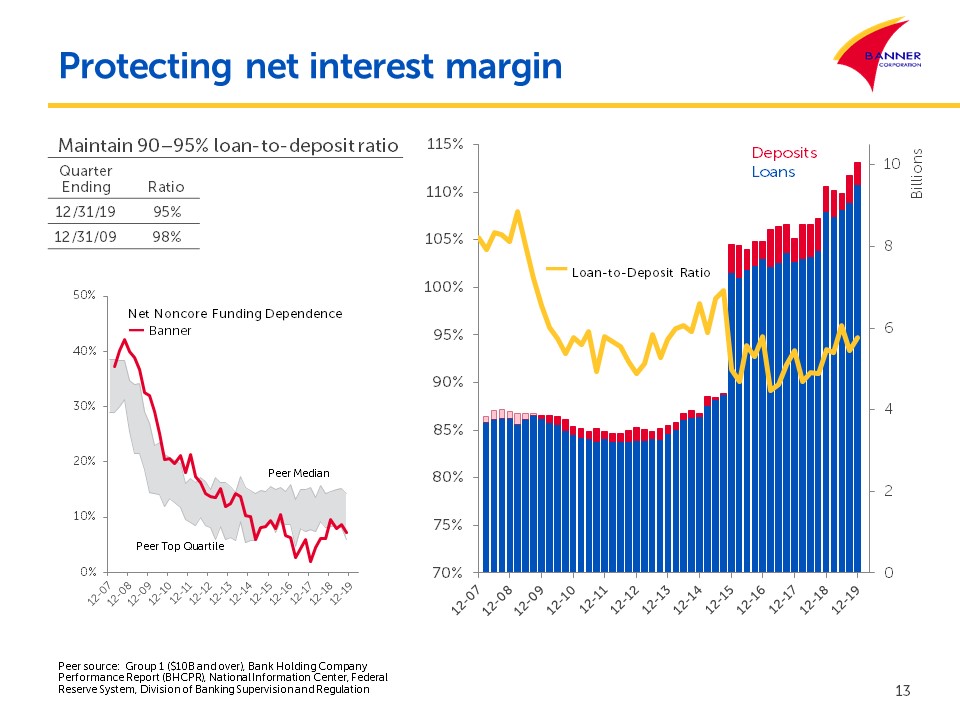
At December 31, 2019, Banner Corporation had $12.61 billion in assets, $9.21 billion in net loans and $10.05
billion in deposits. Banner operates 178 branch offices, including branches located in eight of the top 20 largest western Metropolitan Statistical Areas by population.
Fourth Quarter 2019 Highlights
|
•
|
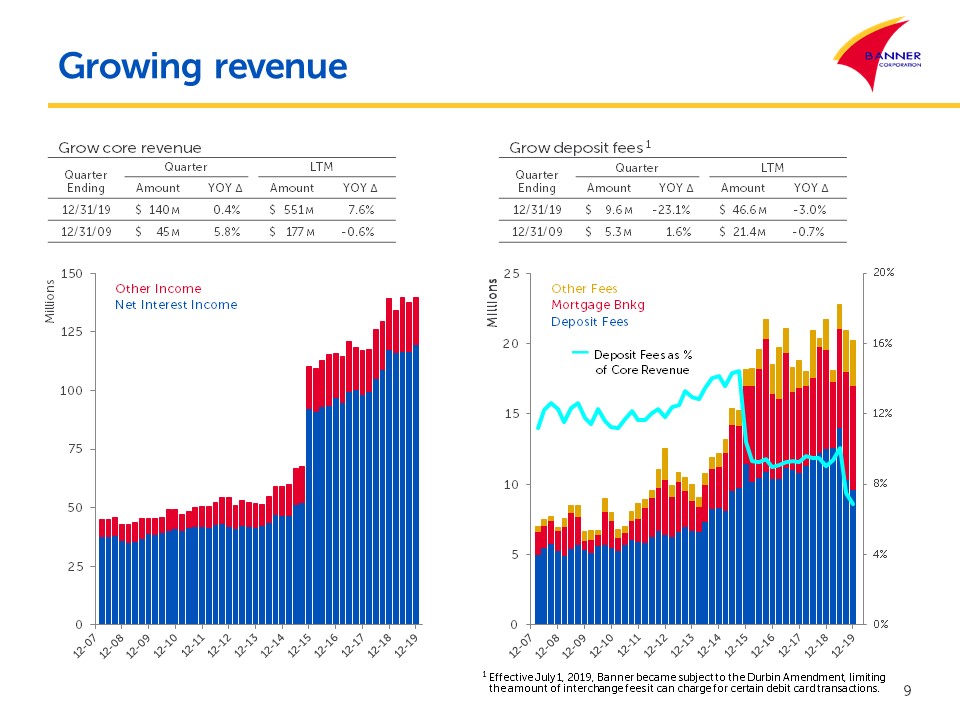
Revenues increased 2% to $139.8 million, compared to $137.5 million in the preceding quarter and increased nominally
compared to $138.5 million in the fourth quarter a year ago.
|
|
•
|
Net interest income, before the provision for loan losses, was $119.5 million, compared to $116.6 million in the preceding
quarter and $117.5 million in the fourth quarter a year ago.
|
|
•
|
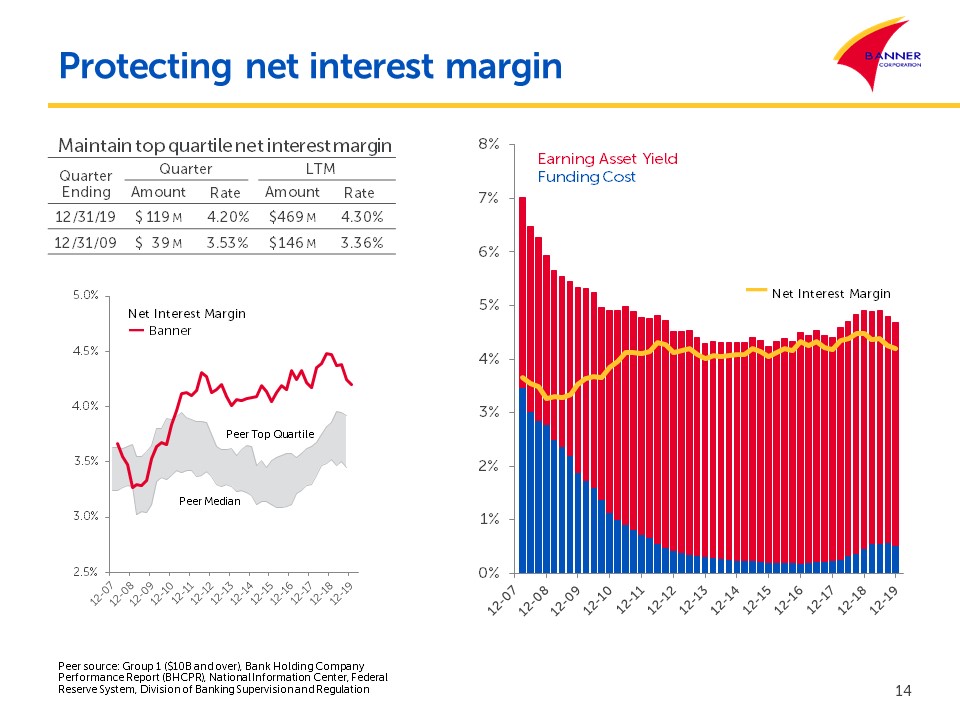
Net interest margin was 4.20%, compared to 4.25% in the preceding quarter and 4.47% in the fourth quarter a year ago.
|
|
•
|
Mortgage banking revenues were $6.2 million, compared to $6.6 million in the preceding quarter and increased 4% compared to
$6.0 million in the fourth quarter a year ago.
|
|
•
|
Return on average assets was 1.07% compared to 1.31% in the preceding quarter and 1.32% in the fourth quarter a year ago.
|
|
•
|
Net loans receivable increased 5% to $9.20 billion at December 31, 2019, compared to $8.74 billion at September 30, 2019,
and increased 7% when compared to $8.59 billion at December 31, 2018.
|
|
•
|
Non-performing assets increased to $40.5 million, or 0.32% of total assets, at December 31, 2019, compared to $18.6
million, or 0.15% of total assets in the preceding quarter, and $18.9 million, or 0.16% of total assets, at December 31, 2018.
|
|
•
|
Provision for loan losses was $4.0 million, and the allowance for loan losses was $100.6 million, or 1.08% of total loans
receivable, as of December 31, 2019.
|
|
•
|
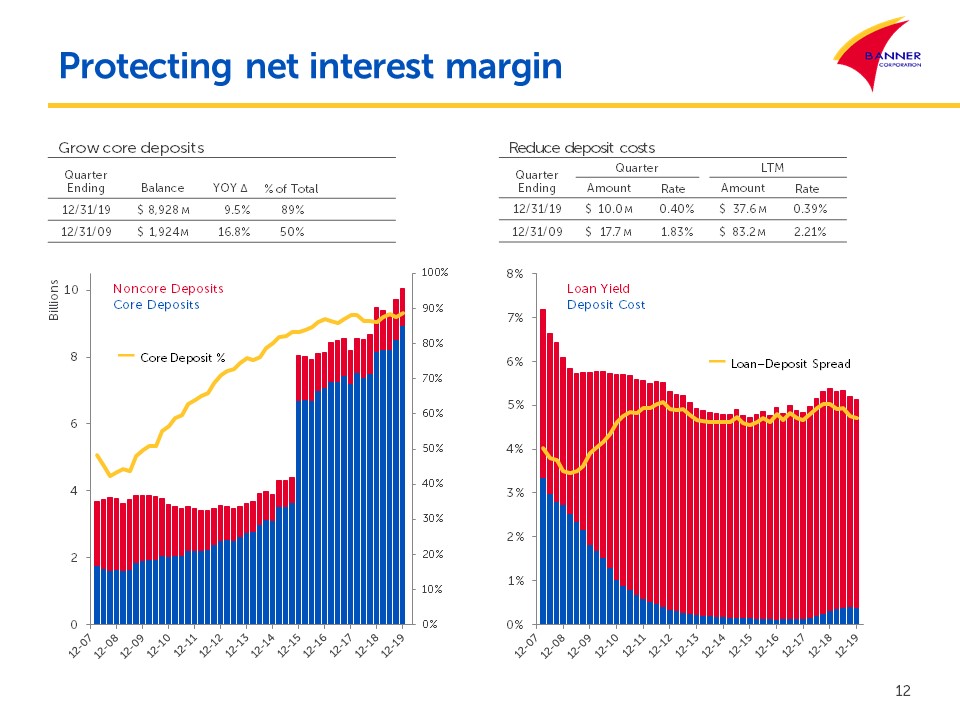
Core deposits increased 5% to $8.93 billion at December 31, 2019, compared to $8.51 billion at September 30, 2019 and
increased 10% compared to $8.16 billion a year ago. Core deposits represented 89% of total deposits at December 31, 2019.
|
|
•
|
Dividends to shareholders were $1.41 per share in the quarter ended December 31, 2019, including a $0.41 regular quarterly
dividend and a $1.00 special cash dividend.
|
|
•
|
Common shareholders’ equity per share decreased slightly to $44.59 at December 31, 2019, compared to $44.80 at the
preceding quarter end and increased 6% from $42.03 a year ago.
|
|
•
|
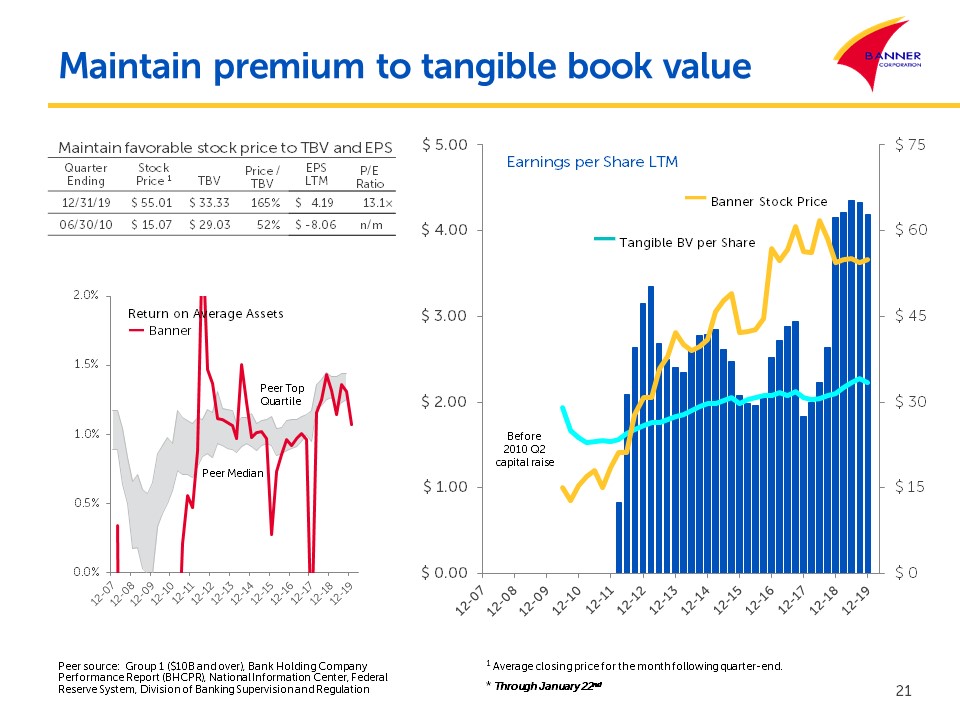
Tangible common shareholders' equity per share* decreased 2% to $33.33 at December 31, 2019, compared to $34.10 at the
preceding quarter end and increased 6% from $31.45 a year ago.
|
BANR Fourth Quarter 2019 Results
January 23, 2020
Page 2
*Tangible common shareholders' equity per share and the ratio of tangible common equity to
tangible assets (both of which exclude goodwill and other intangible assets, net), and references to adjusted revenue (which excludes fair value adjustments and net gain (loss) on the sale of securities from the total of net interest income before
provision for loan losses and non-interest income) and the adjusted efficiency ratio (which excludes acquisition-related expenses, amortization of core deposit intangibles, real estate owned gain (loss), FHLB prepayment penalties and state/municipal
taxes from non-interest expense divided by adjusted revenue) represent non-GAAP (Generally Accepted Accounting Principles) financial measures. Management has presented these non-GAAP financial measures in this earnings release because it believes
that they provide useful and comparative information to assess trends in Banner's core operations reflected in the current quarter's results and facilitate the comparison of our performance with the performance of our peers. Where applicable,
comparable earnings information using GAAP financial measures is also presented. See also Non-GAAP Financial Measures reconciliation tables on the last two pages of this press release.
Certain reclassifications have been made to the 2018 Consolidated Financial Statements and/or
schedules to conform to the 2019 presentation. These reclassifications have affected certain line items and ratios for the prior periods but have not changed net income or shareholders’ equity for those periods. The effect of these
reclassifications is considered immaterial.
Significant Recent Initiatives and Events
On November 1, 2019, Banner completed the acquisition of AltaPacific Bancorp (“AltaPacific”) and its wholly-owned
subsidiary, AltaPacific Bank, of Santa Rosa, California. At closing AltaPacific Bank had six branch locations, including one in Northern California, and five in Southern California. Pursuant to the previously announced terms, AltaPacific
shareholders received 0.2712 shares of Banner common stock in exchange for each share of AltaPacific common stock, plus cash in lieu of any fractional shares and cash to buyout AltaPacific stock options for a total consideration paid of $87.6
million.
The AltaPacific merger was accounted for using the acquisition method of accounting. Accordingly, the assets
(including identifiable intangible assets) and the liabilities of AltaPacific were measured at their respective estimated fair values as of the merger date. The excess of the purchase price over the fair value of the net assets acquired was
attributed to goodwill. The fair value on the merger date represents management's best estimates based on available information and facts and circumstances in existence on the merger date. The acquisition accounting is subject to adjustment within
a measurement period of one year from the acquisition date. The acquisition provided $426.6 million of assets, $332.4 million of loans, and $313.4 million of deposits to Banner.
Adoption of New Accounting Standard
In June 2016, Financial Accounting Standards Board issued Accounting Standard Update No. 2016-13, Measurement of
Credit Losses on Financial Instruments (ASU 2016-13). Currently GAAP requires an “incurred loss” methodology for recognizing credit losses that delays recognition until it is probable a loss has been incurred. The main objective of ASU 2016-13 is
to provide financial statement users with more decision-useful information about the expected credit losses on financial instruments and other commitments to extend credit held by a reporting entity at each reporting date. ASU 2016-13 became
effective for Banner on January 1, 2020. Banner is in the process of finalizing the adoption of ASU 2016-13.
Based on the initial December 31, 2019 model results Banner estimates the adoption of ASU No. 2016-13 will result in a combined
increase to its Allowance for Credit Loss and Reserve for Unfunded Commitments of 10% to 20%. The increase will be recorded as an adjustment to equity as of the adoption date.
Income Statement Review
Banner's net interest margin was 4.20% for the fourth quarter of 2019, a five basis-point decrease compared to
4.25% in the preceding quarter and a 27 basis-point decrease compared to 4.47% in the fourth quarter a year ago. The decrease in net interest margin during the quarter primarily reflects lower yields on average interest-earning assets largely as a
result of three 25 basis point decreases by the Federal Reserve in the targeted Fed Funds Rate in the third and fourth quarter coupled with a longer-term decline in the 10-year treasury yield. Acquisition accounting adjustments added eight basis
points to the net interest margin in the current quarter compared to six basis points in the preceding quarter and 12 basis points in the fourth quarter a year ago. The total purchase discount for acquired loans was $25.0 million at December 31,
2019, compared to $21.3 million at September 30, 2019, and $25.7 million at December 31, 2018. For the year ended December 31, 2019, Banner’s net interest margin was 4.30% compared to 4.43% in 2018.
Average interest-earning asset yields decreased ten basis points to 4.69% compared to 4.79% for the preceding
quarter and decreased 21 basis points compared to 4.90% in the fourth quarter a year ago. Average loan yields decreased seven basis points to 5.13% compared to 5.20% in the preceding quarter and decreased 24 basis points compared to 5.37% in the
fourth quarter a year ago. Loan discount accretion added 11 basis points to loan yields in the fourth quarter of 2019, compared to seven basis points in the preceding quarter, and 16 basis points in the fourth quarter a year ago. Deposit costs were
0.40% in the fourth quarter of 2019, a two basis-point decrease compared to the preceding quarter and an eight basis-point increase compared to the fourth quarter a year ago. The decrease in deposit costs during the current quarter compared to the
preceding quarter are the result of recent decreases in market interest rates; however, changes in the average rate paid on interest-bearing deposits tend to lag changes in market interest rates. The total cost of funds was 0.52% during the fourth
quarter of 2019, a five basis-point decrease compared to the preceding quarter and a six basis-point increase compared to the fourth quarter a year ago.
Banner recorded a $4.0 million provision for loan losses in the current quarter, compared to $2.0 million in the
prior quarter and $2.5 million in the same quarter a year ago. The provision is primarily a result of new loan originations, the increase in non-performing loans, the renewal of acquired loans out of the discounted acquired loan portfolio and net
charge-offs.
Total non-interest income was $20.3 million in the fourth quarter of 2019, compared to $20.9 million in the third
quarter of 2019 and $21.0 million in the fourth quarter a year ago. Deposit fees and other service charges were $9.6 million in the fourth quarter of 2019, compared to $10.3 million in the preceding quarter and $12.5 million in the fourth quarter a
year ago. The decrease in deposit fees and other service charges from the fourth quarter a year ago is primarily a result of Banner becoming subject to the Durbin Amendment on July 1, 2019, which reduced interchange fee income by approximately $7
million during the second half of 2019. Mortgage banking revenues, including gains on one- to four-family and multifamily loan sales and loan
BANR Fourth Quarter 2019 Results
January 23, 2020
Page 3
servicing fees, were $6.2 million in the fourth quarter, compared to $6.6 million in the preceding quarter and
$6.0 million in the fourth quarter of 2018. The higher mortgage banking revenue year-over-year reflected an increase in residential mortgage held-for-sale loan production. The increase in residential held-for-sale loan production was primarily due
to increased refinance activity. Home purchase activity accounted for 56% of one- to four-family mortgage loan originations in both the fourth quarter of 2019 and in the prior quarter, compared to 78% in the fourth quarter of 2018. For the year,
total non-interest income was $81.9 million, compared to $84.0 million in 2018.
Banner’s fourth quarter 2019 results included a $36,000 net loss for fair value adjustments as a result of
changes in the valuation of financial instruments carried at fair value, principally comprised of certain investment securities held for trading, and a $62,000 net gain on the sale of securities. In the preceding quarter, results included a $69,000
net loss for fair value adjustments and a $2,000 net loss on the sale of securities. In the fourth quarter a year ago, results included a $198,000 net gain for fair value adjustments and a $885,000 net loss on the sale of securities.
Total revenue increased 2% to $139.8 million for the fourth quarter of 2019, compared to $137.5 million in the
preceding quarter and increased nominally compared to $138.5 million in the fourth quarter a year ago. For the year, total revenue increased 7% to $550.9 million compared to $515.0 million in 2018. Adjusted revenue* (the total of net interest
income before provision for loan losses and total non-interest income excluding the net gain and loss on the sale of securities and the net change in valuation of financial instruments) was $139.7 million in the fourth quarter of 2019, compared to
$137.6 million in the preceding quarter and $139.2 million in the fourth quarter of 2018. For the year, adjusted revenue* was $551.0 million, compared to $512.0 million in 2018.
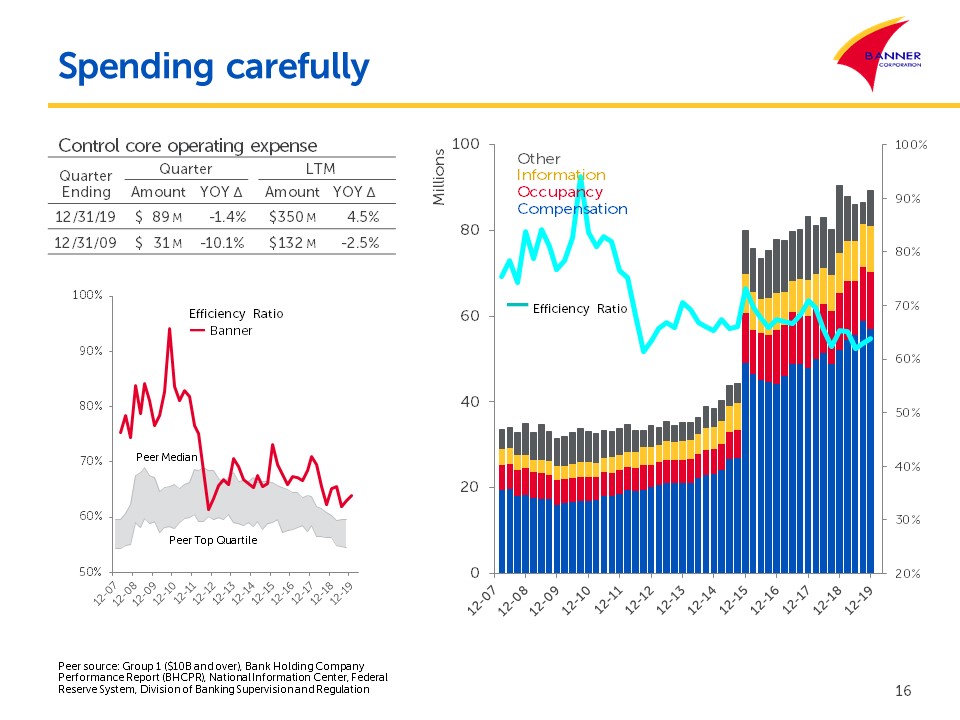
Banner’s total non-interest expense was $93.7 million in the fourth quarter of 2019, compared to $87.3 million in
the preceding quarter and $95.4 million in the fourth quarter of 2018. Acquisition-related expenses were $4.4 million for the fourth quarter of 2019, compared to $676,000 for the preceding quarter, and $4.6 million in the fourth quarter of 2018.
The fourth quarter of 2019 non-interest expenses include two months of expenses associated with the operations acquired in the AltaPacific acquisition. In addition, the fourth quarter of 2019 miscellaneous non-interest expense included $735,000 of
expense related to the prepayment of $150 million of FHLB advances. For the year, total non-interest expense was $357.7 million, compared to $341.4 million in 2018. Banner’s efficiency ratio was 67.03% for the current quarter, compared to 63.50% in
the preceding quarter and 68.89% in the year ago quarter. Banner’s adjusted efficiency ratio* was 61.19% for the current quarter, compared to 60.71% in the preceding quarter and 63.06% in the year ago quarter.
For the fourth quarter of 2019, Banner had $8.4 million in state and federal income tax expense for an effective tax rate of 20.0%,
reflecting the benefits from tax exempt income. Banner’s statutory income tax rate is 23.5%, representing a blend of the statutory federal income tax rate of 21.0% and apportioned effects of the state income tax rates.
Balance Sheet Review
Total assets increased 4% to $12.60 billion at December 31, 2019, compared to $12.10 billion at September 30,
2019, and increased 6% when compared to $11.87 billion at December 31, 2018. The total of securities and interest-bearing deposits held at other banks was $1.89 billion at December 31, 2019, compared to $1.87 billion at September 30, 2019 and $1.94
billion at December 31, 2018. The average effective duration of Banner's securities portfolio was approximately 3.5 years at both December 31, 2019 and December 31, 2018.
Net loans receivable increased 5% to $9.20 billion at December 31, 2019, compared to $8.74 billion at September
30, 2019, and increased 7% when compared to $8.59 billion at December 31, 2018. The year-over-year increase in net loans included $332.4 million of portfolio loans acquired in the AltaPacific acquisition during the fourth quarter of 2019.
Commercial real estate and multifamily real estate loans increased 9% to $4.36 billion at December 31, 2019, compared to $4.01 billion at September 30, 2019, and increased 11% compared to $3.93 billion a year ago. Commercial business loans increased
5% to $1.69 billion at December 31, 2019, compared to $1.62 billion at September 30, 2019, and increased 14% compared to $1.48 billion a year ago. Agricultural business loans decreased to $370.5 million at December 31, 2019, compared to $390.5
million three months earlier and $404.9 million a year ago. Total construction, land and land development loans were $1.17 billion at December 31, 2019, an 8% increase from $1.08 billion at September 30, 2019, and a 6% increase compared to $1.11
billion a year earlier. Consumer loans decreased to $762.8 million at December 31, 2019, compared to $779.6 million at September 30, 2019, and $785.0 million a year ago. One- to four-family loans decreased modestly to $945.6 million at December 31,
2019, compared to $947.5 million at September 30, 2019, and $973.6 million a year ago.
Loans held for sale were $210.4 million at December 31, 2019, compared to $244.9 million at September 30, 2019, and $171.0 million at
December 31, 2018. The volume of one- to four- family residential mortgage loans sold was $268.1 million in the current quarter, compared to $204.6 million in the preceding quarter and $130.1 million in the fourth quarter a year ago. During the
fourth quarter of 2019, Banner sold $103.4 million in multifamily loans. Banner sold $79.4 million in multifamily loans in the preceding quarter and sold $26.8 million in the fourth quarter a year ago.
Total deposits increased 3% to $10.05 billion at December 31, 2019, compared to $9.73 billion at September 30,
2019, and increased 6% when compared to $9.48 billion a year ago. The increase in deposits included $313.4 million in deposits acquired in the AltaPacific acquisition during the fourth quarter of 2019. Non-interest-bearing account balances
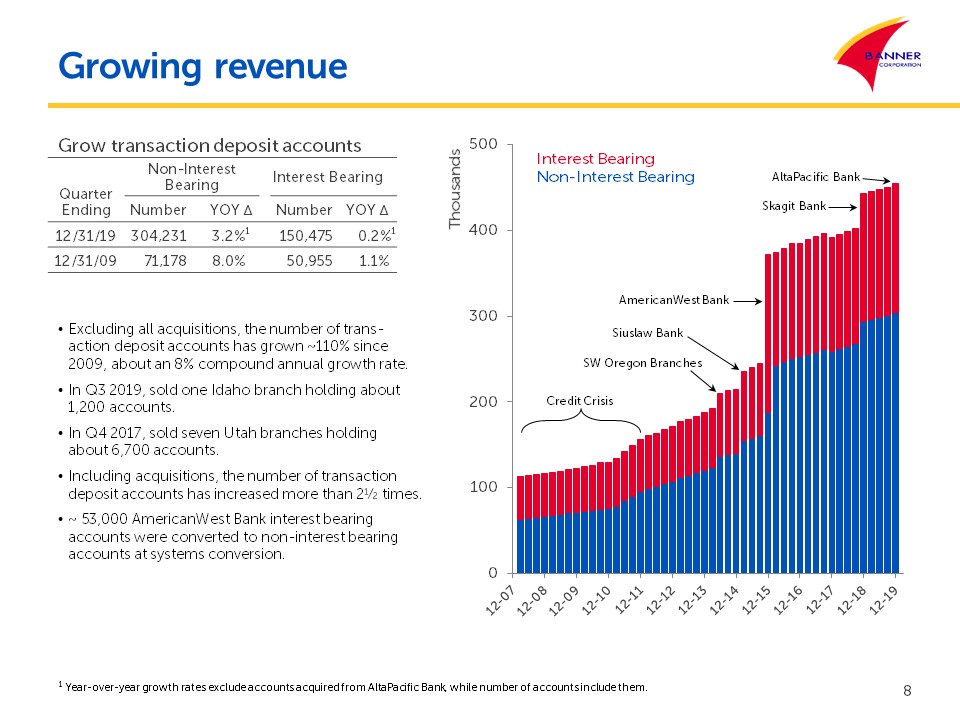
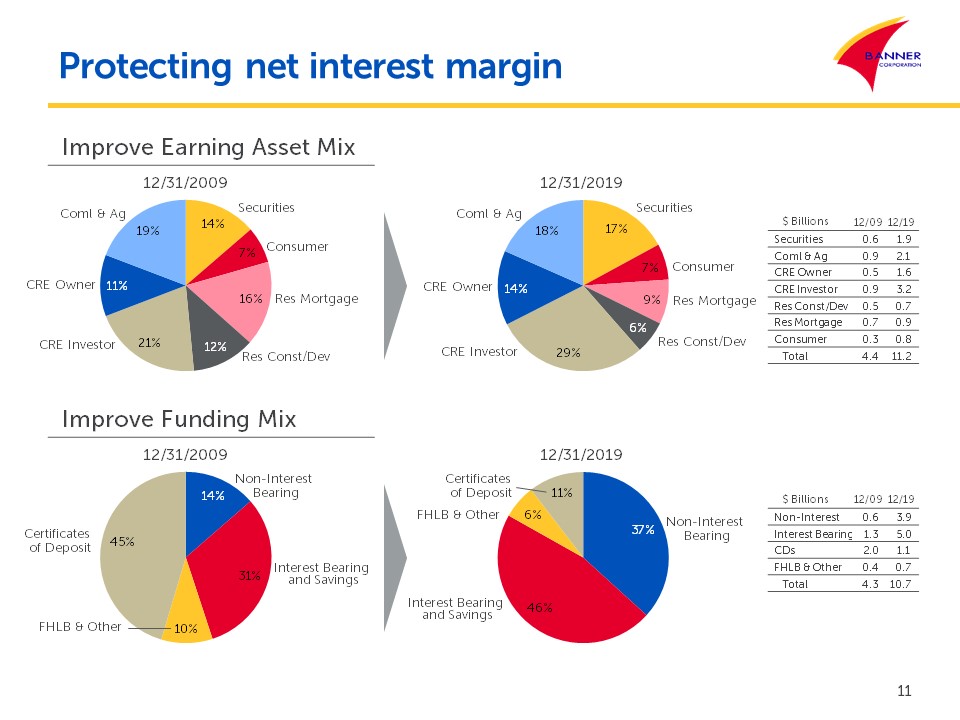
increased 2% to $3.95 billion at December 31, 2019, compared to $3.89 billion at September 30, 2019, and increased 8% compared to $3.66 billion a year ago. Core deposits (non-interest-bearing and interest-bearing transaction and savings accounts)
increased 5% from the prior quarter and increased 9% compared to a year ago. Core deposits represented 89% of total deposits at December 31, 2019, compared to 87% of total deposits at September 30, 2019, and 86% of total deposits a year earlier.
Certificates of deposit decreased 8% to $1.12 billion at December 31, 2019, compared to $1.22 billion at September 30, 2019, and decreased 15% compared to $1.32 billion a year earlier. The decrease in certificates of deposit primarily reflects the
decrease in brokered deposits to $202.9 million at December 31, 2019, compared to $299.5 million at September 30, 2019 and $377.3 million a year ago. FHLB borrowings totaled $450.0 million at December 31, 2019 compared to $382.0 million at September
30, 2019 and $540.2 million a year earlier.
At December 31, 2019, total common shareholders' equity was $1.59 billion, or 12.65% of assets, compared to $1.53
billion or 12.65% of assets at September 30, 2019, and $1.48 billion or 12.46% of assets a year ago. At December 31, 2019, tangible common shareholders' equity*, which excludes
BANR Fourth Quarter 2019 Results
January 23, 2020
Page 4
goodwill and other intangible assets, net, was $1.19 billion, or 9.77% of tangible assets*, compared to $1.17
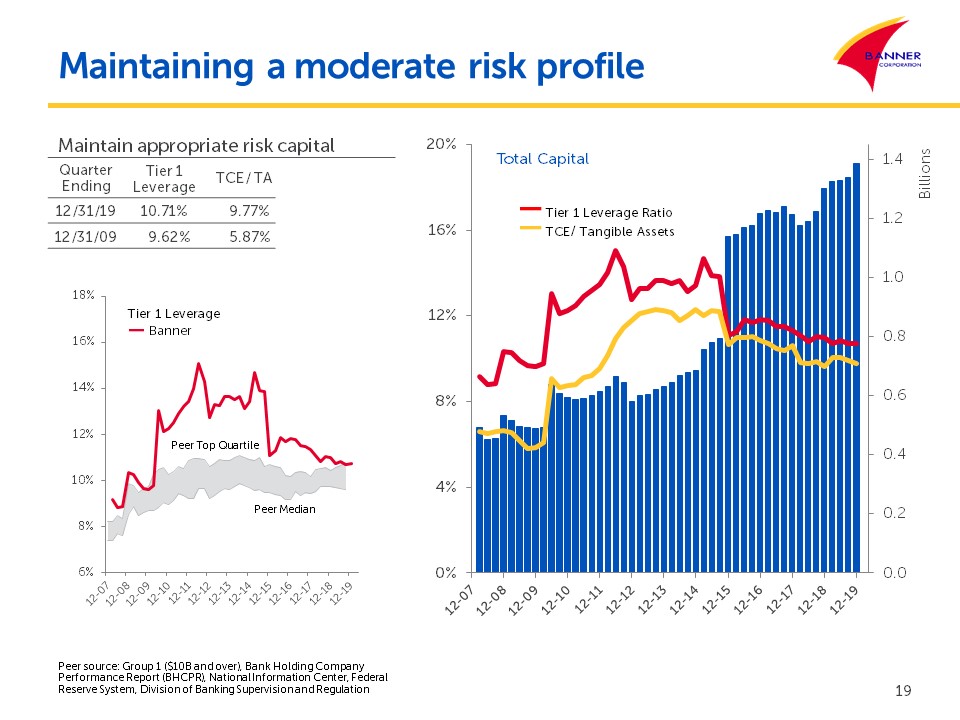
billion, or 9.93% of tangible assets, at September 30, 2019, and $1.11 billion, or 9.62% of tangible assets, a year ago. Banner's tangible book value per share* increased to $33.33 at December 31, 2019, compared to $31.45 per share a year ago.
Banner and its subsidiary banks continue to maintain capital levels in excess of the requirements to be
categorized as “well-capitalized.” At December 31, 2019, Banner's common equity Tier 1 capital ratio was 10.63%, its Tier 1 leverage capital to average assets ratio was 10.71%, and its total capital to risk-weighted assets ratio was 12.93%.
Credit Quality
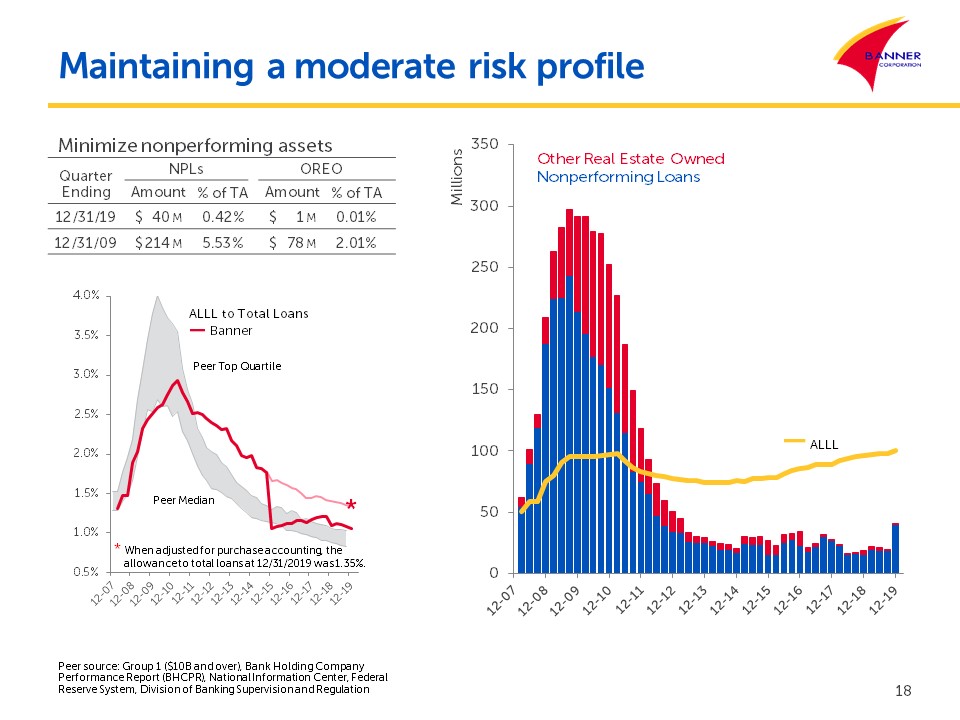
The allowance for loan losses was $100.6 million at December 31, 2019, or 1.08% of total loans receivable
outstanding and 254% of non-performing loans compared to $97.8 million at September 30, 2019, or 1.11% of total loans receivable outstanding and 536% of non-performing loans, and $96.5 million at December 31, 2018, or 1.11% of total loans receivable
outstanding and 616% of non-performing loans. Net loan charge-offs totaled $1.2 million in the fourth quarter, compared to net loan charge-offs of $2.5 million in the preceding quarter and net loan charge-offs of $1.3 million in the fourth quarter a
year ago. Banner recorded a $4.0 million provision for loan losses in the current quarter primarily as a result of the origination of new loans, the increase in non-performing loans, the renewal of acquired loans out of the discounted acquired loan
portfolio and net charge-offs, compared to $2.0 million in the prior quarter and $2.5 million in the year ago quarter. Non-performing loans were $39.6 million at December 31, 2019, compared to $18.3 million at September 30, 2019, and $15.7 million a
year ago. The increase in non-performing loans during the quarter was largely due to one commercial banking relationship moving to nonaccrual. Real estate owned and other repossessed assets were $936,000 at December 31, 2019, compared to $343,000
at September 30, 2019, and $3.2 million a year ago.
In accordance with acquisition accounting, loans acquired from acquisitions were recorded at their estimated fair
value, which resulted in a net discount to the loans’ contractual amounts, a portion of which reflects a discount for possible credit losses. Credit discounts are included in the determination of fair value, and as a result, no allowance for loan
losses is recorded for acquired loans at the acquisition date. At December 31, 2019, the total purchase discount for acquired loans was $25.0 million.
Banner's total non-performing assets were $40.5 million, or 0.32% of total assets, at December 31, 2019, compared
to $18.6 million, or 0.15% of total assets, at September 30, 2019, and $18.9 million, or 0.16% of total assets, a year ago. In addition to non-performing assets, there were $15.9 million of purchased credit-impaired loans at December 31, 2019,
compared to $12.6 million at September 30, 2019 and $14.4 million at December 31, 2018.
Conference Call
Banner will host a conference call on Friday, January 24, 2020, at 8:00 a.m. PST, to discuss its fourth quarter
results. To listen to the call on-line, go to www.bannerbank.com. Investment professionals are invited to dial (866) 235-9915 to participate in the call. A
replay will be available for one week at (877) 344-7529 using access code 10137616, or at www.bannerbank.com.
About the Company
Banner Corporation is a $12.61 billion bank holding company operating two commercial banks in four Western states
through a network of branches offering a full range of deposit services and business, commercial real estate, construction, residential, agricultural and consumer loans. Visit Banner Bank on the Web at www.bannerbank.com.
Forward-Looking Statements
When used in this press release and in other documents filed with or furnished to the
Securities and Exchange Commission (the “SEC”), in press releases or other public stockholder communications, or in oral statements made with the approval of an authorized executive officer, the words or phrases "may," “believe,” “will,” “will likely
result,” “are expected to,” “will continue,” “is anticipated,” “estimate,” “project,” “plans,” "potential," or similar expressions are intended to identify “forward-looking statements” within the meaning of the Private Securities Litigation Reform
Act of 1995. You are cautioned not to place undue reliance on any forward-looking statements, which speak only as of the date such statements are made and based only on information then actually known to Banner. Banner does not undertake and
specifically disclaims any obligation to revise any forward-looking statements to reflect the occurrence of anticipated or unanticipated events or circumstances after the date of such statements. These statements may relate to future financial
performance, strategic plans or objectives, revenues or earnings projections, or other financial information. By their nature, these statements are subject to numerous uncertainties that could cause actual results to differ materially from those
anticipated in the statements and could negatively affect Banner's operating and stock price performance.
Important factors that could cause actual results to differ materially from the results anticipated or projected
include, but are not limited to, the following: (1) expected revenues, cost savings, synergies and other benefits from the AltaPacific acquisition might not be realized within the expected time frames or at all and costs or difficulties relating to
integration matters, including but not limited to customer and employee retention, might be greater than expected; (2) the credit risks of lending activities, including changes in the level and direction of loan delinquencies and write-offs and
changes in estimates of the adequacy of the allowance for loan losses, which could necessitate additional provisions for loan losses, resulting both from loans originated and loans acquired from other financial institutions; (3) results of
examinations by regulatory authorities, including the possibility that any such regulatory authority may, among other things, require increases in the allowance for loan losses or writing down of assets or impose restrictions or penalties with
respect to Banner's activities; (4) competitive pressures among depository institutions; (5) interest rate movements and their impact on customer behavior and net interest margin; (6) the impact of repricing and competitors' pricing initiatives on
loan and deposit products; (7) fluctuations in real estate values; (8) the ability to adapt successfully to technological changes to meet customers' needs and developments in the market place; (9) the ability to access cost-effective funding; (10)
changes in financial markets; (11) changes in economic conditions in general and in Washington, Idaho, Oregon and California in particular; (12) the costs, effects and outcomes of litigation; (13) legislation or regulatory changes, including but not
limited to the impact of the Dodd-Frank Act and regulations adopted thereunder, changes in regulatory capital requirements pursuant to the implementation of the Basel III capital standards, other governmental initiatives affecting the financial
services industry and changes in federal and/or state tax laws or interpretations thereof by
BANR Fourth Quarter 2019 Results
January 23, 2020
Page 5
taxing authorities; (14) changes in accounting principles, policies or guidelines; (15) future acquisitions by
Banner of other depository institutions or lines of business; (16) future goodwill impairment due to changes in Banner's business, changes in market conditions, or other factors; and (17) other economic, competitive, governmental, regulatory, and
technological factors affecting our operations, pricing, products and services; and other risks detailed from time to time in our filings with the Securities and Exchange Commission including our Quarterly Reports on Form 10-Q and our Annual Reports
on Form 10-K.
BANR Fourth Quarter 2019 Results
January 23, 2020
Page 6
|
RESULTS OF OPERATIONS
|
Quarters Ended
|
Twelve Months Ended
|
||||||||||||||||||
|
(in thousands except shares and per share data)
|
Dec 31, 2019
|
Sep 30, 2019
|
Dec 31, 2018
|
Dec 31, 2019
|
Dec 31, 2018
|
|||||||||||||||
|
INTEREST INCOME:
|
||||||||||||||||||||
|
Loans receivable
|
$
|
120,915
|
$
|
118,096
|
$
|
114,627
|
$
|
471,473
|
$
|
413,370
|
||||||||||
|
Mortgage-backed securities
|
8,924
|
9,415
|
9,931
|
38,640
|
35,076
|
|||||||||||||||
|
Securities and cash equivalents
|
3,570
|
3,925
|
4,183
|
15,566
|
15,186
|
|||||||||||||||
|
133,409
|
131,436
|
128,741
|
525,679
|
463,632
|
||||||||||||||||
|
INTEREST EXPENSE:
|
||||||||||||||||||||
|
Deposits
|
9,950
|
10,014
|
7,503
|
37,630
|
20,642
|
|||||||||||||||
|
Federal Home Loan Bank advances
|
2,281
|
3,107
|
2,072
|
12,234
|
5,636
|
|||||||||||||||
|
Other borrowings
|
121
|
82
|
66
|
330
|
245
|
|||||||||||||||
|
Junior subordinated debentures
|
1,566
|
1,612
|
1,641
|
6,574
|
6,136
|
|||||||||||||||
|
13,918
|
14,815
|
11,282
|
56,768
|
32,659
|
||||||||||||||||
|
Net interest income before provision for loan losses
|
119,491
|
116,621
|
117,459
|
468,911
|
430,973
|
|||||||||||||||
|
PROVISION FOR LOAN LOSSES
|
4,000
|
2,000
|
2,500
|
10,000
|
8,500
|
|||||||||||||||
|
Net interest income
|
115,491
|
114,621
|
114,959
|
458,911
|
422,473
|
|||||||||||||||
|
NON-INTEREST INCOME:
|
||||||||||||||||||||
|
Deposit fees and other service charges
|
9,637
|
10,331
|
12,539
|
46,632
|
48,074
|
|||||||||||||||
|
Mortgage banking operations
|
6,248
|
6,616
|
6,019
|
22,215
|
21,343
|
|||||||||||||||
|
Bank-owned life insurance
|
1,170
|
1,076
|
994
|
4,645
|
4,505
|
|||||||||||||||
|
Miscellaneous
|
3,201
|
2,914
|
2,153
|
8,632
|
7,148
|
|||||||||||||||
|
20,256
|
20,937
|
21,705
|
82,124
|
81,070
|
||||||||||||||||
|
Net gain (loss) on sale of securities
|
62
|
(2
|
)
|
(885
|
)
|
33
|
(837
|
)
|
||||||||||||
|
Net change in valuation of financial instruments carried
at fair value
|
(36
|
)
|
(69
|
)
|
198
|
(208
|
)
|
3,775
|
||||||||||||
|
Total non-interest income
|
20,282
|
20,866
|
21,018
|
81,949
|
84,008
|
|||||||||||||||
|
NON-INTEREST EXPENSE:
|
||||||||||||||||||||
|
Salary and employee benefits
|
57,050
|
59,090
|
52,122
|
226,409
|
202,613
|
|||||||||||||||
|
Less capitalized loan origination costs
|
(8,797
|
)
|
(7,889
|
)
|
(4,863
|
)
|
(28,934
|
)
|
(17,925
|
)
|
||||||||||
|
Occupancy and equipment
|
13,377
|
12,566
|
13,490
|
52,390
|
49,215
|
|||||||||||||||
|
Information / computer data services
|
6,202
|
5,657
|
5,112
|
22,458
|
18,823
|
|||||||||||||||
|
Payment and card processing services
|
4,638
|
4,330
|
4,233
|
16,993
|
15,412
|
|||||||||||||||
|
Professional and legal expenses
|
2,262
|
2,704
|
6,669
|
9,736
|
17,945
|
|||||||||||||||
|
Advertising and marketing
|
2,021
|
2,221
|
2,588
|
7,836
|
8,346
|
|||||||||||||||
|
Deposit insurance expense (benefit)
|
1,608
|
(1,604
|
)
|
1,093
|
2,840
|
4,446
|
||||||||||||||
|
State/municipal business and use taxes
|
917
|
1,011
|
854
|
3,880
|
3,284
|
|||||||||||||||
|
Real estate operations
|
40
|
126
|
251
|
303
|
804
|
|||||||||||||||
|
Amortization of core deposit intangibles
|
2,061
|
1,985
|
1,935
|
8,151
|
6,047
|
|||||||||||||||
|
Miscellaneous
|
7,892
|
6,435
|
7,310
|
28,122
|
26,754
|
|||||||||||||||
| |
89,271
|
86,632
|
90,794
|
350,184
|
335,764
|
|||||||||||||||
|
Acquisition-related expenses
|
4,419
|
676
|
4,602
|
7,544
|
5,607
|
|||||||||||||||
|
Total non-interest expense
|
93,690
|
87,308
|
95,396
|
357,728
|
341,371
|
|||||||||||||||
|
Income before provision for income taxes
|
42,083
|
48,179
|
40,581
|
183,132
|
165,110
|
|||||||||||||||
|
PROVISION FOR INCOME TAXES
|
8,428
|
8,602
|
3,053
|
36,854
|
28,595
|
|||||||||||||||
|
NET INCOME
|
$
|
33,655
|
$
|
39,577
|
$
|
37,528
|
$
|
146,278
|
$
|
136,515
|
||||||||||
|
Earnings per share available to common shareholders:
|
||||||||||||||||||||
|
Basic
|
$
|
0.96
|
$
|
1.15
|
$
|
1.10
|
$
|
4.20
|
$
|
4.16
|
||||||||||
|
Diluted
|
$
|
0.95
|
$
|
1.15
|
$
|
1.09
|
$
|
4.18
|
$
|
4.15
|
||||||||||
|
Cumulative dividends declared per common share
|
$
|
1.41
|
$
|
0.41
|
$
|
0.38
|
$
|
2.64
|
$
|
1.96
|
||||||||||
|
Weighted average common shares outstanding:
|
||||||||||||||||||||
|
Basic
|
35,188,399
|
34,407,462
|
34,221,048
|
34,868,434
|
32,784,724
|
|||||||||||||||
|
Diluted
|
35,316,736
|
34,497,994
|
34,342,641
|
34,967,684
|
32,894,425
|
|||||||||||||||
|
Increase (decrease) in common shares outstanding
|
1,578,219
|
(400,286
|
)
|
2,780,015
|
568,804
|
2,456,287
|
|
|||||||||||||
BANR Fourth Quarter 2019 Results
January 23, 2020
Page 7
|
FINANCIAL CONDITION
|
Percentage Change
|
|||||||||||||||||||
|
(in thousands except shares and per share data)
|
Dec 31, 2019
|
Sep 30, 2019
|
Dec 31, 2018
|
Prior Qtr
|
Prior Yr Qtr
|
|||||||||||||||
|
ASSETS
|
||||||||||||||||||||
|
Cash and due from banks
|
$
|
234,359
|
$
|
250,671
|
$
|
231,029
|
(6.5
|
)%
|
1.4
|
%
|
||||||||||
|
Interest-bearing deposits
|
73,376
|
73,785
|
41,167
|
(0.6
|
)%
|
78.2
|
%
|
|||||||||||||
|
Total cash and cash equivalents
|
307,735
|
324,456
|
272,196
|
(5.2
|
)%
|
13.1
|
%
|
|||||||||||||
|
Securities - trading
|
25,636
|
25,672
|
25,896
|
(0.1
|
)%
|
(1.0
|
)%
|
|||||||||||||
|
Securities - available for sale
|
1,551,557
|
1,539,908
|
1,636,223
|
0.8
|
%
|
(5.2
|
)%
|
|||||||||||||
|
Securities - held to maturity
|
236,094
|
230,056
|
234,220
|
2.6
|
%
|
0.8
|
%
|
|||||||||||||
|
Total securities
|
1,813,287
|
1,795,636
|
1,896,339
|
1.0
|
%
|
(4.4
|
)%
|
|||||||||||||
|
Federal Home Loan Bank stock
|
28,342
|
25,623
|
31,955
|
10.6
|
%
|
(11.3
|
)%
|
|||||||||||||
|
Loans held for sale
|
210,447
|
244,889
|
171,031
|
(14.1
|
)%
|
23.0
|
%
|
|||||||||||||
|
Loans receivable
|
9,305,357
|
8,835,368
|
8,684,595
|
5.3
|
%
|
7.1
|
%
|
|||||||||||||
|
Allowance for loan losses
|
(100,559
|
)
|
(97,801
|
)
|
(96,485
|
)
|
2.8
|
%
|
4.2
|
%
|
||||||||||
|
Net loans receivable
|
9,204,798
|
8,737,567
|
8,588,110
|
5.3
|
%
|
7.2
|
%
|
|||||||||||||
|
Accrued interest receivable
|
37,962
|
40,033
|
38,593
|
(5.2
|
)%
|
(1.6
|
)%
|
|||||||||||||
|
Real estate owned held for sale, net
|
814
|
228
|
2,611
|
257.0
|
%
|
(68.8
|
)%
|
|||||||||||||
|
Property and equipment, net
|
178,008
|
171,279
|
171,809
|
3.9
|
%
|
3.6
|
%
|
|||||||||||||
|
Goodwill
|
373,121
|
339,154
|
339,154
|
10.0
|
%
|
10.0
|
%
|
|||||||||||||
|
Other intangibles, net
|
29,158
|
26,610
|
32,924
|
9.6
|
%
|
(11.4
|
)%
|
|||||||||||||
|
Bank-owned life insurance
|
192,088
|
179,076
|
177,467
|
7.3
|
%
|
8.2
|
%
|
|||||||||||||
|
Other assets
|
228,271
|
213,291
|
149,128
|
7.0
|
%
|
53.1
|
%
|
|||||||||||||
|
Total assets
|
$
|
12,604,031
|
$
|
12,097,842
|
$
|
11,871,317
|
4.2
|
%
|
6.2
|
%
|
||||||||||
|
LIABILITIES
|
||||||||||||||||||||
|
Deposits:
|
||||||||||||||||||||
|
Non-interest-bearing
|
$
|
3,945,000
|
$
|
3,885,210
|
$
|
3,657,817
|
1.5
|
%
|
7.9
|
%
|
||||||||||
|
Interest-bearing transaction and savings accounts
|
4,983,238
|
4,624,970
|
4,498,966
|
7.7
|
%
|
10.8
|
%
|
|||||||||||||
|
Interest-bearing certificates
|
1,120,403
|
1,218,591
|
1,320,265
|
(8.1
|
)%
|
(15.1
|
)%
|
|||||||||||||
|
Total deposits
|
10,048,641
|
9,728,771
|
9,477,048
|
3.3
|
%
|
6.0
|
%
|
|||||||||||||
|
Advances from Federal Home Loan Bank
|
450,000
|
382,000
|
540,189
|
17.8
|
%
|
(16.7
|
)%
|
|||||||||||||
|
Customer repurchase agreements and other borrowings
|
118,474
|
120,014
|
118,995
|
(1.3
|
)%
|
(0.4
|
)%
|
|||||||||||||
|
Junior subordinated debentures at fair value
|
119,304
|
113,417
|
114,091
|
5.2
|
%
|
4.6
|
%
|
|||||||||||||
|
Accrued expenses and other liabilities
|
227,889
|
181,351
|
102,061
|
25.7
|
%
|
123.3
|
%
|
|||||||||||||
|
Deferred compensation
|
45,689
|
41,354
|
40,338
|
10.5
|
%
|
13.3
|
%
|
|||||||||||||
|
Total liabilities
|
11,009,997
|
10,566,907
|
10,392,722
|
4.2
|
%
|
5.9
|
%
|
|||||||||||||
|
SHAREHOLDERS' EQUITY
|
||||||||||||||||||||
|
Common stock
|
1,373,940
|
1,286,711
|
1,337,436
|
6.8
|
%
|
2.7
|
%
|
|||||||||||||
|
Retained earnings
|
186,838
|
203,704
|
134,055
|
(8.3
|
)%
|
39.4
|
%
|
|||||||||||||
|
Other components of shareholders' equity
|
33,256
|
40,520
|
7,104
|
(17.9
|
)%
|
nm
|
||||||||||||||
|
Total shareholders' equity
|
1,594,034
|
1,530,935
|
1,478,595
|
4.1
|
%
|
7.8
|
%
|
|||||||||||||
|
Total liabilities and shareholders' equity
|
$
|
12,604,031
|
$
|
12,097,842
|
$
|
11,871,317
|
4.2
|
%
|
6.2
|
%
|
||||||||||
|
Common Shares Issued:
|
||||||||||||||||||||
|
Shares outstanding at end of period
|
35,751,576
|
34,173,357
|
35,182,772
|
|||||||||||||||||
|
Common shareholders' equity per share (1)
|
$
|
44.59
|
$
|
44.80
|
$
|
42.03
|
||||||||||||||
|
Common shareholders' tangible equity per share (1) (2)
|
$
|
33.33
|
$
|
34.10
|
$
|
31.45
|
||||||||||||||
|
Common shareholders' tangible equity to tangible assets (2)
|
9.77
|
%
|
9.93
|
%
|
9.62
|
%
|
||||||||||||||
|
Consolidated Tier 1 leverage capital ratio
|
10.71
|
%
|
10.70
|
%
|
10.98
|
%
|
||||||||||||||
|
(1)
|
Calculation is based on number of common shares outstanding at the end of the period rather than weighted average shares outstanding.
|
|
(2)
|
Common shareholders' tangible equity excludes goodwill and other intangible assets. Tangible assets exclude goodwill and other
intangible assets. These ratios represent non-GAAP financial measures. See also Non-GAAP Financial Measures reconciliation tables on the final two pages of the press release tables.
|
BANR Fourth Quarter 2019 Results
January 23, 2020
Page 8
|
ADDITIONAL FINANCIAL INFORMATION
|
||||||||||||||||||||
|
(dollars in thousands)
|
||||||||||||||||||||
|
Percentage Change
|
||||||||||||||||||||
|
LOANS
|
Dec 31,
2019
|
Sep 30,
2019
|
Dec 31,
2018
|
Prior
Qtr
|
Prior
Yr Qtr
|
|||||||||||||||
|
Commercial real estate:
|
||||||||||||||||||||
|
Owner occupied
|
$
|
1,580,650
|
$
|
1,463,303
|
$
|
1,430,097
|
8.0
|
%
|
10.5
|
%
|
||||||||||
|
Investment properties
|
2,309,221
|
2,150,938
|
2,131,059
|
7.4
|
%
|
8.4
|
%
|
|||||||||||||
|
Multifamily real estate
|
473,152
|
399,814
|
368,836
|
18.3
|
%
|
28.3
|
%
|
|||||||||||||
|
Commercial construction
|
210,668
|
190,532
|
172,410
|
10.6
|
%
|
22.2
|
%
|
|||||||||||||
|
Multifamily construction
|
233,610
|
214,878
|
184,630
|
8.7
|
%
|
26.5
|
%
|
|||||||||||||
|
One- to four-family construction
|
544,308
|
488,945
|
534,678
|
11.3
|
%
|
1.8
|
%
|
|||||||||||||
|
Land and land development:
|
||||||||||||||||||||
|
Residential
|
154,688
|
163,829
|
188,508
|
(5.6
|
)%
|
(17.9
|
)%
|
|||||||||||||
|
Commercial
|
26,290
|
26,119
|
27,278
|
0.7
|
%
|
(3.6
|
)%
|
|||||||||||||
|
Commercial business
|
1,693,824
|
1,619,391
|
1,483,614
|
4.6
|
%
|
14.2
|
%
|
|||||||||||||
|
Agricultural business including secured by farmland
|
370,549
|
390,505
|
404,873
|
(5.1
|
)%
|
(8.5
|
)%
|
|||||||||||||
|
One- to four-family real estate
|
945,622
|
947,475
|
973,616
|
(0.2
|
)%
|
(2.9
|
)%
|
|||||||||||||
|
Consumer:
|
||||||||||||||||||||
|
Consumer secured by one- to four-family real estate
|
550,960
|
566,792
|
568,979
|
(2.8
|
)%
|
(3.2
|
)%
|
|||||||||||||
|
Consumer-other
|
211,815
|
212,847
|
216,017
|
(0.5
|
)%
|
(1.9
|
)%
|
|||||||||||||
|
Total loans receivable
|
$
|
9,305,357
|
$
|
8,835,368
|
$
|
8,684,595
|
5.3
|
%
|
7.1
|
%
|
||||||||||
|
Restructured loans performing under their restructured terms
|
$
|
6,466
|
$
|
6,721
|
$
|
13,422
|
||||||||||||||
|
Loans 30 - 89 days past due and on accrual (1)
|
$
|
20,178
|
$
|
11,496
|
$
|
25,108
|
||||||||||||||
|
Total delinquent loans (including loans on non-accrual), net (2)
|
$
|
38,322
|
$
|
26,830
|
$
|
38,721
|
||||||||||||||
|
Total delinquent loans / Total loans receivable
|
0.41
|
%
|
0.30
|
%
|
0.45
|
%
|
||||||||||||||
(1) Includes
$2.5 million of purchased credit-impaired loans at December 31, 2019 compared to $112,000 at September 30, 2019 and $3,000 at December 31, 2018.
(2)
Delinquent loans include $2.8 million of delinquent purchased credit-impaired loans at December 31, 2019 compared to $412,000 at September 30, 2019 and $519,000 at December 31, 2018.
|
LOANS BY GEOGRAPHIC LOCATION
|
Percentage Change
|
|||||||||||||||||||||||
|
Dec 31, 2019
|
Sep 30,
2019
|
Dec 31,
2018
|
Prior
Qtr
|
Prior
Yr Qtr
|
||||||||||||||||||||
|
Amount
|
Percentage
|
Amount
|
Amount
|
|||||||||||||||||||||
|
Washington
|
$
|
4,364,764
|
46.9
|
%
|
$
|
4,313,972
|
$
|
4,324,588
|
1.2
|
%
|
0.9
|
%
|
||||||||||||
|
Oregon
|
1,650,704
|
17.7
|
%
|
1,615,192
|
1,636,152
|
2.2
|
%
|
0.9
|
%
|
|||||||||||||||
|
California
|
2,129,789
|
22.9
|
%
|
1,729,208
|
1,596,604
|
23.2
|
%
|
33.4
|
%
|
|||||||||||||||
|
Idaho
|
530,016
|
5.7
|
%
|
552,523
|
521,026
|
(4.1
|
)%
|
1.7
|
%
|
|||||||||||||||
|
Utah
|
60,958
|
0.7
|
%
|
62,197
|
57,318
|
(2.0
|
)%
|
6.4
|
%
|
|||||||||||||||
|
Other
|
569,126
|
6.1
|
%
|
562,276
|
548,907
|
1.2
|
%
|
3.7
|
%
|
|||||||||||||||
|
Total loans receivable
|
$
|
9,305,357
|
100.0
|
%
|
$
|
8,835,368
|
$
|
8,684,595
|
5.3
|
%
|
7.1
|
%
|
||||||||||||
BANR Fourth Quarter 2019 Results
January 23, 2020
Page 9
ADDITIONAL FINANCIAL INFORMATION
(dollars in thousands)
The following table shows loan originations (excluding loans held for sale) activity for the quarters ending December
31, 2019, September 30, 2019, and December 31, 2018 and the twelve months ending December 31, 2019 and December 31, 2018 (in thousands):
|
LOAN ORIGINATIONS
|
Quarters Ended
|
Twelve Months Ended
|
||||||||||||||||||
|
Dec 31, 2019
|
Sep 30, 2019
|
Dec 31, 2018
|
Dec 31, 2019
|
Dec 31, 2018
|
||||||||||||||||
|
Commercial real estate
|
$
|
190,584
|
$
|
114,528
|
$
|
172,885
|
$
|
480,669
|
$
|
536,784
|
||||||||||
|
Multifamily real estate
|
21,848
|
29,645
|
16,731
|
80,761
|
25,771
|
|||||||||||||||
|
Construction and land
|
530,632
|
303,151
|
397,702
|
1,435,501
|
1,460,536
|
|||||||||||||||
|
Commercial business
|
196,069
|
194,606
|
206,922
|
757,721
|
839,290
|
|||||||||||||||
|
Agricultural business
|
27,926
|
12,363
|
18,901
|
93,050
|
123,702
|
|||||||||||||||
|
One-to four-family residential
|
31,564
|
27,734
|
81,522
|
117,297
|
177,332
|
|||||||||||||||
|
Consumer
|
71,683
|
101,613
|
72,500
|
357,040
|
331,661
|
|||||||||||||||
|
Total loan originations (excluding loans held for sale)
|
$
|
1,070,306
|
$
|
783,640
|
$
|
967,163
|
$
|
3,322,039
|
$
|
3,495,076
|
||||||||||
BANR Fourth Quarter 2019 Results
January 23, 2020
Page 10
|
ADDITIONAL FINANCIAL INFORMATION
|
||||||||||||||||||||
|
(dollars in thousands)
|
||||||||||||||||||||
|
Quarters Ended
|
Twelve Months Ended
|
|||||||||||||||||||
|
CHANGE IN THE
|
Dec 31, 2019
|
Sep 30, 2019
|
Dec 31, 2018
|
Dec 31, 2019
|
Dec 31, 2018
|
|||||||||||||||
|
ALLOWANCE FOR LOAN LOSSES
|
||||||||||||||||||||
|
Balance, beginning of period
|
$
|
97,801
|
$
|
98,254
|
$
|
95,263
|
$
|
96,485
|
$
|
89,028
|
||||||||||
|
Provision for loan losses
|
4,000
|
2,000
|
2,500
|
10,000
|
8,500
|
|||||||||||||||
|
Recoveries of loans previously charged off:
|
||||||||||||||||||||
|
Commercial real estate
|
199
|
107
|
66
|
476
|
1,646
|
|||||||||||||||
|
Construction and land
|
—
|
156
|
23
|
208
|
213
|
|||||||||||||||
|
One- to four-family real estate
|
159
|
129
|
18
|
561
|
750
|
|||||||||||||||
|
Commercial business
|
225
|
162
|
193
|
625
|
1,049
|
|||||||||||||||
|
Agricultural business, including secured by farmland
|
10
|
2
|
23
|
47
|
64
|
|||||||||||||||
|
Consumer
|
61
|
154
|
102
|
548
|
366
|
|||||||||||||||
|
654
|
710
|
425
|
2,465
|
4,088
|
||||||||||||||||
|
Loans charged off:
|
||||||||||||||||||||
|
Commercial real estate
|
—
|
(314
|
)
|
—
|
(1,138
|
)
|
(401
|
)
|
||||||||||||
|
Construction and land
|
(45
|
)
|
—
|
—
|
(45
|
)
|
(479
|
)
|
||||||||||||
|
One- to four-family real estate
|
—
|
(86
|
)
|
—
|
(86
|
)
|
(43
|
)
|
||||||||||||
|
Commercial business
|
(1,180
|
)
|
(1,599
|
)
|
(684
|
)
|
(4,171
|
)
|
(2,051
|
)
|
||||||||||
|
Agricultural business, including secured by farmland
|
(4
|
)
|
(741
|
)
|
(415
|
)
|
(911
|
)
|
(756
|
)
|
||||||||||
|
Consumer
|
(667
|
)
|
(423
|
)
|
(604
|
)
|
(2,040
|
)
|
(1,401
|
)
|
||||||||||
|
(1,896
|
)
|
(3,163
|
)
|
(1,703
|
)
|
(8,391
|
)
|
(5,131
|
)
|
|||||||||||
|
Net charge-offs
|
(1,242
|
)
|
(2,453
|
)
|
(1,278
|
)
|
(5,926
|
)
|
(1,043
|
)
|
||||||||||
|
Balance, end of period
|
$
|
100,559
|
$
|
97,801
|
$
|
96,485
|
$
|
100,559
|
$
|
96,485
|
||||||||||
|
Net charge-offs / Average loans receivable
|
(0.013
|
)%
|
(0.027
|
)%
|
(0.015
|
)%
|
(0.066
|
)%
|
(0.013
|
)%
|
||||||||||
|
ALLOCATION OF
|
||||||||||||
|
ALLOWANCE FOR LOAN LOSSES
|
Dec 31, 2019
|
Sep 30, 2019
|
Dec 31, 2018
|
|||||||||
|
Specific or allocated loss allowance:
|
||||||||||||
|
Commercial real estate
|
$
|
30,591
|
$
|
28,515
|
$
|
27,132
|
||||||
|
Multifamily real estate
|
4,754
|
4,283
|
3,818
|
|||||||||
|
Construction and land
|
22,994
|
22,569
|
24,442
|
|||||||||
|
One- to four-family real estate
|
4,136
|
4,569
|
4,714
|
|||||||||
|
Commercial business
|
23,370
|
21,147
|
19,438
|
|||||||||
|
Agricultural business, including secured by farmland
|
4,120
|
3,895
|
3,778
|
|||||||||
|
Consumer
|
8,202
|
8,441
|
7,972
|
|||||||||
|
Total allocated
|
98,167
|
93,419
|
91,294
|
|||||||||
|
Unallocated
|
2,392
|
4,382
|
5,191
|
|||||||||
|
Total allowance for loan losses
|
$
|
100,559
|
$
|
97,801
|
$
|
96,485
|
||||||
|
Allowance for loan losses / Total loans receivable
|
1.08
|
%
|
1.11
|
%
|
1.11
|
%
|
||||||
|
Allowance for loan losses / Non-performing loans
|
254
|
%
|
536
|
%
|
616
|
%
|
||||||
BANR Fourth Quarter 2019 Results
January 23, 2020
Page 11
|
ADDITIONAL FINANCIAL INFORMATION
|
||||||||||||
|
(dollars in thousands)
|
||||||||||||
|
Dec 31, 2019
|
Sep 30, 2019
|
Dec 31, 2018
|
||||||||||
|
NON-PERFORMING ASSETS
|
||||||||||||
|
Loans on non-accrual status:
|
||||||||||||
|
Secured by real estate:
|
||||||||||||
|
Commercial
|
$
|
5,952
|
$
|
5,092
|
$
|
4,088
|
||||||
|
Multifamily
|
85
|
87
|
—
|
|||||||||
|
Construction and land
|
1,905
|
1,318
|
3,188
|
|||||||||
|
One- to four-family
|
3,410
|
3,007
|
1,544
|
|||||||||
|
Commercial business
|
23,015
|
3,035
|
2,936
|
|||||||||
|
Agricultural business, including secured by farmland
|
661
|
757
|
1,751
|
|||||||||
|
Consumer
|
2,473
|
2,473
|
1,241
|
|||||||||
|
37,501
|
15,769
|
14,748
|
||||||||||
|
Loans more than 90 days delinquent, still on accrual:
|
||||||||||||
|
Secured by real estate:
|
||||||||||||
|
Commercial
|
89
|
89
|
—
|
|||||||||
|
Construction and land
|
332
|
1,141
|
—
|
|||||||||
|
One- to four-family
|
877
|
652
|
658
|
|||||||||
|
Commercial business
|
401
|
358
|
1
|
|||||||||
|
Consumer
|
398
|
247
|
247
|
|||||||||
|
2,097
|
2,487
|
906
|
||||||||||
|
Total non-performing loans
|
39,598
|
18,256
|
15,654
|
|||||||||
|
Real estate owned (REO)
|
814
|
228
|
2,611
|
|||||||||
|
Other repossessed assets
|
122
|
115
|
592
|
|||||||||
|
Total non-performing assets
|
$
|
40,534
|
$
|
18,599
|
$
|
18,857
|
||||||
|
Total non-performing assets to total assets
|
0.32
|
%
|
0.15
|
%
|
0.16
|
%
|
||||||
|
Purchased credit-impaired loans, net
|
$
|
15,938
|
$
|
12,575
|
$
|
14,413
|
||||||
|
Quarters Ended
|
Twelve Months Ended
|
|||||||||||||||||||
|
REAL ESTATE OWNED
|
Dec 31, 2019
|
Sep 30, 2019
|
Dec 31, 2018
|
Dec 31, 2019
|
Dec 31, 2018
|
|||||||||||||||
|
Balance, beginning of period
|
$
|
228
|
$
|
2,513
|
$
|
364
|
$
|
2,611
|
$
|
360
|
||||||||||
|
Additions from loan foreclosures
|
—
|
48
|
139
|
109
|
641
|
|||||||||||||||
|
Additions from acquisitions
|
650
|
—
|
2,593
|
650
|
2,593
|
|||||||||||||||
|
Proceeds from dispositions of REO
|
(105
|
)
|
(2,333
|
)
|
(453
|
)
|
(2,588
|
)
|
(838
|
)
|
||||||||||
|
Gain on sale of REO
|
41
|
—
|
168
|
32
|
242
|
|||||||||||||||
|
Valuation adjustments in the period
|
—
|
—
|
(200
|
)
|
—
|
(387
|
)
|
|||||||||||||
|
Balance, end of period
|
$
|
814
|
$
|
228
|
$
|
2,611
|
$
|
814
|
$
|
2,611
|
||||||||||
BANR Fourth Quarter 2019 Results
January 23, 2020
Page 12
|
ADDITIONAL FINANCIAL INFORMATION
|
||||||||||||||||||||
|
(dollars in thousands)
|
||||||||||||||||||||
|
DEPOSIT COMPOSITION
|
Percentage Change
|
|||||||||||||||||||
|
Dec 31, 2019
|
Sep 30, 2019
|
Dec 31, 2018
|
Prior Qtr
|
Prior Yr
Qtr
|
||||||||||||||||
|
Non-interest-bearing
|
$
|
3,945,000
|
$
|
3,885,210
|
$
|
3,657,817
|
1.5
|
%
|
7.9
|
%
|
||||||||||
|
Interest-bearing checking
|
1,280,003
|
1,209,826
|
1,191,016
|
5.8
|
%
|
7.5
|
%
|
|||||||||||||
|
Regular savings accounts
|
1,934,041
|
1,863,839
|
1,842,581
|
3.8
|
%
|
5.0
|
%
|
|||||||||||||
|
Money market accounts
|
1,769,194
|
1,551,305
|
1,465,369
|
14.0
|
%
|
20.7
|
%
|
|||||||||||||
|
Total interest-bearing transaction and savings accounts
|
4,983,238
|
4,624,970
|
4,498,966
|
7.7
|
%
|
10.8
|
%
|
|||||||||||||
|
Total core deposits
|
8,928,238
|
8,510,180
|
8,156,783
|
4.9
|
%
|
9.5
|
%
|
|||||||||||||
|
Interest-bearing certificates
|
1,120,403
|
1,218,591
|
1,320,265
|
(8.1
|
)%
|
(15.1
|
)%
|
|||||||||||||
|
Total deposits
|
$
|
10,048,641
|
$
|
9,728,771
|
$
|
9,477,048
|
3.3
|
%
|
6.0
|
%
|
||||||||||
| GEOGRAPHIC CONCENTRATION OF DEPOSITS | Percentage |
Change |
||||||||||||||||||||||
|
Dec 31, 2019
|
Sep 30, 2019
|
Dec 31, 2018
|
Prior Qtr
|
Prior Yr
Qtr
|
||||||||||||||||||||
|
Amount
|
Percentage
|
Amount
|
Amount
|
|||||||||||||||||||||
|
Washington
|
$
|
5,861,809
|
58.3
|
%
|
$
|
5,833,547
|
$
|
5,674,328
|
0.5
|
%
|
3.3
|
%
|
||||||||||||
|
Oregon
|
2,006,163
|
20.0
|
%
|
1,990,155
|
1,891,145
|
0.8
|
%
|
6.1
|
%
|
|||||||||||||||
|
California
|
1,698,289
|
16.9
|
%
|
1,429,939
|
1,434,033
|
18.8
|
%
|
18.4
|
%
|
|||||||||||||||
|
Idaho
|
482,380
|
4.8
|
%
|
475,130
|
477,542
|
1.5
|
%
|
1.0
|
%
|
|||||||||||||||
|
Total deposits
|
$
|
10,048,641
|
100.0
|
%
|
$
|
9,728,771
|
$
|
9,477,048
|
3.3
|
%
|
6.0
|
%
|
||||||||||||
|
INCLUDED IN TOTAL DEPOSITS
|
Dec 31, 2019
|
Sep 30, 2019
|
Dec 31, 2018
|
|||||||||
|
Public non-interest-bearing accounts
|
$
|
111,015
|
$
|
114,879
|
$
|
96,009
|
||||||
|
Public interest-bearing transaction & savings accounts
|
133,403
|
119,729
|
121,392
|
|||||||||
|
Public interest-bearing certificates
|
35,184
|
26,609
|
30,089
|
|||||||||
|
Total public deposits
|
$
|
279,602
|
$
|
261,217
|
$
|
247,490
|
||||||
|
Total brokered deposits
|
$
|
202,884
|
$
|
299,496
|
$
|
377,347
|
||||||
BANR Fourth Quarter 2019 Results
January 23, 2020
Page 13
|
ADDITIONAL FINANCIAL INFORMATION
|
||||||||
|
(in thousands)
|
||||||||
|
ACQUISITION OF ALTAPACIFIC BANCORP
|
||||||||
|
The following table* provides the estimated fair value of the assets acquired and liabilities assumed in the AltaPacific acquisition
at November 1, 2019 (in thousands):
|
||||||||
|
November 1, 2019
|
||||||||
|
Cash paid
|
$
|
2,360
|
||||||
|
Fair value of common shares issued
|
85,200
|
|||||||
|
Total consideration
|
87,560
|
|||||||
|
Fair value of assets acquired:
|
||||||||
|
Cash and cash equivalents
|
39,686
|
|||||||
|
Securities
|
20,348
|
|||||||
|
Federal Home Loan Bank stock
|
2,005
|
|||||||
|
Loans receivable
|
332,355
|
|||||||
|
Real estate owned held for sale
|
650
|
|||||||
|
Property and equipment
|
3,809
|
|||||||
|
Core deposit intangible
|
4,610
|
|||||||
|
Bank-owned life insurance
|
11,890
|
|||||||
|
Deferred tax asset
|
166
|
|||||||
|
Other assets
|
11,090
|
|||||||
|
Total assets acquired
|
426,609
|
|||||||
|
Fair value of liabilities assumed:
|
||||||||
|
Deposits
|
313,374
|
|||||||
|
Advances from FHLB
|
40,226
|
|||||||
|
Junior subordinated debentures
|
5,814
|
|||||||
|
Deferred compensation
|
4,508
|
|||||||
|
Other liabilities
|
9,094
|
|||||||
|
Total liabilities assumed
|
373,016
|
|||||||
|
Net assets acquired
|
53,593
|
|||||||
|
Goodwill
|
$
|
33,967
|
||||||
|
* Amounts recorded in this table are preliminary estimates of fair value. Additional adjustments to the acquisition accounting may be
required with a measurement period of one-year from the acquisition date.
|
||||||||
BANR Fourth Quarter 2019 Results
January 23, 2020
Page 14
|
ADDITIONAL FINANCIAL INFORMATION
|
||||||||||||||||||||||||
|
(dollars in thousands)
|
||||||||||||||||||||||||
|
Actual
|
Minimum to be
categorized as
"Adequately Capitalized"
|
Minimum to be
categorized as
"Well Capitalized"
|
||||||||||||||||||||||
|
REGULATORY CAPITAL RATIOS AS OF DECEMBER 31, 2019
|
Amount
|
Ratio
|
Amount
|
Ratio
|
Amount
|
Ratio
|
||||||||||||||||||
|
Banner Corporation-consolidated:
|
||||||||||||||||||||||||
|
Total capital to risk-weighted assets
|
$
|
1,386,483
|
12.93
|
%
|
$
|
857,555
|
8.00
|
%
|
$
|
1,071,943
|
10.00
|
%
|
||||||||||||
|
Tier 1 capital to risk-weighted assets
|
1,283,208
|
11.97
|
%
|
643,166
|
6.00
|
%
|
643,166
|
6.00
|
%
|
|||||||||||||||
|
Tier 1 leverage capital to average assets
|
1,283,208
|
10.71
|
%
|
479,458
|
4.00
|
%
|
n/a
|
n/a
|
||||||||||||||||
|
Common equity tier 1 capital to risk-weighted assets
|
1,139,708
|
10.63
|
%
|
482,375
|
4.50
|
%
|
n/a
|
n/a
|
||||||||||||||||
|
Banner Bank:
|
||||||||||||||||||||||||
|
Total capital to risk-weighted assets
|
1,321,580
|
12.55
|
%
|
842,227
|
8.00
|
%
|
1,052,784
|
10.00
|
%
|
|||||||||||||||
|
Tier 1 capital to risk-weighted assets
|
1,220,811
|
11.60
|
%
|
631,670
|
6.00
|
%
|
842,227
|
8.00
|
%
|
|||||||||||||||
|
Tier 1 leverage capital to average assets
|
1,220,811
|
10.45
|
%
|
467,330
|
4.00
|
%
|
584,163
|
5.00
|
%
|
|||||||||||||||
|
Common equity tier 1 capital to risk-weighted assets
|
1,220,811
|
11.60
|
%
|
473,753
|
4.50
|
%
|
684,310
|
6.50
|
%
|
|||||||||||||||
|
Islanders Bank:
|
||||||||||||||||||||||||
|
Total capital to risk-weighted assets
|
37,044
|
19.42
|
%
|
15,258
|
8.00
|
%
|
19,073
|
10.00
|
%
|
|||||||||||||||
|
Tier 1 capital to risk-weighted assets
|
34,658
|
18.17
|
%
|
11,444
|
6.00
|
%
|
15,258
|
8.00
|
%
|
|||||||||||||||
|
Tier 1 leverage capital to average assets
|
34,658
|
11.66
|
%
|
11,887
|
4.00
|
%
|
14,859
|
5.00
|
%
|
|||||||||||||||
|
Common equity tier 1 capital to risk-weighted assets
|
34,658
|
18.17
|
%
|
8,583
|
4.50
|
%
|
12,397
|
6.50
|
%
|
|||||||||||||||
BANR Fourth Quarter 2019 Results
January 23, 2020
Page 15
ADDITIONAL FINANCIAL INFORMATION
(dollars in thousands)
(rates / ratios annualized)
|
ANALYSIS OF NET INTEREST SPREAD
|
Quarters Ended
|
||||||||||||||||||||||||||||||||||
|
December 31, 2019
|
September 30, 2019
|
December 31, 2018
|
|||||||||||||||||||||||||||||||||
|
Average
Balance
|
Interest
and
Dividends
|
Yield /
Cost(3)
|
Average
Balance
|
Interest
and
Dividends
|
Yield /
Cost(3)
|
Average
Balance
|
Interest
and
Dividends
|
Yield /
Cost(3)
|
|||||||||||||||||||||||||||
|
Interest-earning assets:
|
|||||||||||||||||||||||||||||||||||
|
Held for sale loans
|
$
|
202,686
|
$
|
2,048
|
4.01
|
%
|
$
|
154,529
|
$
|
1,607
|
4.13
|
%
|
$
|
83,741
|
$
|
1,055
|
5.00
|
%
|
|||||||||||||||||
|
Mortgage loans
|
7,134,231
|
92,926
|
5.17
|
%
|
6,872,426
|
89,948
|
5.19
|
%
|
6,573,278
|
88,561
|
5.35
|
%
|
|||||||||||||||||||||||
|
Commercial/agricultural loans
|
1,853,447
|
23,256
|
4.98
|
%
|
1,809,397
|
23,750
|
5.21
|
%
|
1,631,133
|
22,257
|
5.41
|
%
|
|||||||||||||||||||||||
|
Consumer and other loans
|
169,197
|
2,685
|
6.30
|
%
|
173,342
|
2,791
|
6.39
|
%
|
172,934
|
2,754
|
6.32
|
%
|
|||||||||||||||||||||||
|
Total loans(1)
|
9,359,561
|
120,915
|
5.13
|
%
|
9,009,694
|
118,096
|
5.20
|
%
|
8,461,086
|
114,627
|
5.37
|
%
|
|||||||||||||||||||||||
|
Mortgage-backed securities
|
1,371,438
|
8,924
|
2.58
|
%
|
1,358,448
|
9,415
|
2.75
|
%
|
1,400,508
|
9,931
|
2.81
|
%
|
|||||||||||||||||||||||
|
Other securities
|
418,767
|
2,663
|
2.52
|
%
|
414,994
|
3,058
|
2.92
|
%
|
474,659
|
3,633
|
3.04
|
%
|
|||||||||||||||||||||||
|
Interest-bearing deposits with banks
|
107,959
|
531
|
1.95
|
%
|
82,836
|
489
|
2.34
|
%
|
54,577
|
305
|
2.22
|
%
|
|||||||||||||||||||||||
|
FHLB stock
|
26,036
|
376
|
5.73
|
%
|
29,400
|
378
|
5.10
|
%
|
22,791
|
245
|
4.26
|
%
|
|||||||||||||||||||||||
|
Total investment securities
|
1,924,200
|
12,494
|
2.58
|
%
|
1,885,678
|
13,340
|
2.81
|
%
|
1,952,535
|
14,114
|
2.87
|
%
|
|||||||||||||||||||||||
|
Total interest-earning assets
|
11,283,761
|
133,409
|
4.69
|
%
|
10,895,372
|
131,436
|
4.79
|
%
|
10,413,621
|
128,741
|
4.90
|
%
|
|||||||||||||||||||||||
|
Non-interest-earning assets
|
1,152,751
|
1,078,277
|
903,165
|
||||||||||||||||||||||||||||||||
|
Total assets
|
$
|
12,436,512
|
$
|
11,973,649
|
$
|
11,316,786
|
|||||||||||||||||||||||||||||
|
Deposits:
|
|||||||||||||||||||||||||||||||||||
|
Interest-bearing checking accounts
|
$
|
1,228,936
|
564
|
0.18
|
%
|
$
|
1,194,633
|
621
|
0.21
|
%
|
$
|
1,131,030
|
403
|
0.14
|
%
|
||||||||||||||||||||
|
Savings accounts
|
1,999,656
|
2,027
|
0.40
|
%
|
1,854,967
|
2,244
|
0.48
|
%
|
1,779,288
|
1,505
|
0.34
|
%
|
|||||||||||||||||||||||
|
Money market accounts
|
1,607,954
|
2,842
|
0.70
|
%
|
1,542,264
|
2,944
|
0.76
|
%
|
1,440,889
|
1,638
|
0.45
|
%
|
|||||||||||||||||||||||
|
Certificates of deposit
|
1,189,530
|
4,517
|
1.51
|
%
|
1,155,710
|
4,205
|
1.44
|
%
|
1,287,114
|
3,957
|
1.22
|
%
|
|||||||||||||||||||||||
|
Total interest-bearing deposits
|
6,026,076
|
9,950
|
0.66
|
%
|
5,747,574
|
10,014
|
0.69
|
%
|
5,638,321
|
7,503
|
0.53
|
%
|
|||||||||||||||||||||||
|
Non-interest-bearing deposits
|
3,959,097
|
—
|
—
|
%
|
3,786,143
|
—
|
—
|
%
|
3,608,930
|
—
|
—
|
%
|
|||||||||||||||||||||||
|
Total deposits
|
9,985,173
|
9,950
|
0.40
|
%
|
9,533,717
|
10,014
|
0.42
|
%
|
9,247,251
|
7,503
|
0.32
|
%
|
|||||||||||||||||||||||
|
Other interest-bearing liabilities:
|
|||||||||||||||||||||||||||||||||||
|
FHLB advances
|
387,435
|
2,281
|
2.34
|
%
|
476,435
|
3,107
|
2.59
|
%
|
311,046
|
2,072
|
2.64
|
%
|
|||||||||||||||||||||||
|
Other borrowings
|
126,782
|
121
|
0.38
|
%
|
122,035
|
82
|
0.27
|
%
|
117,724
|
66
|
0.22
|
%
|
|||||||||||||||||||||||
|
Junior subordinated debentures
|
145,339
|
1,566
|
4.27
|
%
|
140,212
|
1,612
|
4.56
|
%
|
140,212
|
1,641
|
4.64
|
%
|
|||||||||||||||||||||||
|
Total borrowings
|
659,556
|
3,968
|
2.39
|
%
|
738,682
|
4,801
|
2.58
|
%
|
568,982
|
3,779
|
2.64
|
%
|
|||||||||||||||||||||||
|
Total funding liabilities
|
10,644,729
|
13,918
|
0.52
|
%
|
10,272,399
|
14,815
|
0.57
|
%
|
9,816,233
|
11,282
|
0.46
|
%
|
|||||||||||||||||||||||
|
Other non-interest-bearing liabilities(2)
|
189,682
|
163,809
|
92,003
|
||||||||||||||||||||||||||||||||
|
Total liabilities
|
10,834,411
|
10,436,208
|
9,908,236
|
||||||||||||||||||||||||||||||||
|
Shareholders' equity
|
1,602,101
|
1,537,785
|
1,408,550
|
||||||||||||||||||||||||||||||||
|
Total liabilities and shareholders' equity
|
$
|
12,436,512
|
$
|
11,973,993
|
$
|
11,316,786
|
|||||||||||||||||||||||||||||
|
Net interest income/rate spread
|
$
|
119,491
|
4.17
|
%
|
$
|
116,621
|
4.22
|
%
|
$
|
117,459
|
4.44
|
%
|
|||||||||||||||||||||||
|
Net interest margin
|
4.20
|
%
|
4.25
|
%
|
4.47
|
%
|
|||||||||||||||||||||||||||||
|
Additional Key Financial Ratios:
|
|||||||||||||||||||||||||||||||||||
|
Return on average assets
|
1.07
|
%
|
1.31
|
%
|
1.32
|
%
|
|||||||||||||||||||||||||||||
|
Return on average equity
|
8.33
|
%
|
10.21
|
%
|
10.57
|
%
|
|||||||||||||||||||||||||||||
|
Average equity/average assets
|
12.88
|
%
|
12.84
|
%
|
12.45
|
%
|
|||||||||||||||||||||||||||||
|
Average interest-earning assets/average interest-bearing
liabilities
|
168.78
|
%
|
167.98
|
%
|
167.76
|
%
|
|||||||||||||||||||||||||||||
|
Average interest-earning assets/average funding liabilities
|
106.00
|
%
|
106.06
|
%
|
106.09
|
%
|
|||||||||||||||||||||||||||||
|
Non-interest income/average assets
|
0.65
|
%
|
0.69
|
%
|
0.74
|
%
|
|||||||||||||||||||||||||||||
|
Non-interest expense/average assets
|
2.99
|
%
|
2.89
|
%
|
3.34
|
%
|
|||||||||||||||||||||||||||||
|
Efficiency ratio(4)
|
67.03
|
%
|
63.50
|
%
|
68.89
|
%
|
|||||||||||||||||||||||||||||
|
Adjusted efficiency ratio(5)
|
61.19
|
%
|
60.71
|
%
|
63.06
|
%
|
|||||||||||||||||||||||||||||
|
(1)
|
Average balances include loans accounted for on a nonaccrual basis and loans 90 days or more past due. Amortization of net deferred
loan fees/costs is included with interest on loans.
|
|
(2)
|
Average other non-interest-bearing liabilities include fair value adjustments related to junior subordinated debentures.
|
|
(3)
|
Yields and costs have not been adjusted for the effect of tax-exempt interest.
|
|
(4)
|
Non-interest expense divided by the total of net interest income (before provision for loan losses) and non-interest income.
|
|
(5)
|
Adjusted non-interest expense divided by adjusted revenue. Adjusted revenue excludes net gain (loss) on sale of securities and fair
value adjustments. Adjusted non-interest expense excludes acquisition-related expenses, amortization of core deposit intangibles (CDI), REO gain (loss), FHLB prepayment penalties and state/municipal business and use taxes. These represent
non-GAAP financial measures. See also Non-GAAP Financial Measures reconciliation tables on the last two pages of this press release.
|
BANR Fourth Quarter 2019 Results
January 23, 2020
Page 16
|
ADDITIONAL FINANCIAL INFORMATION
|
|||||||
|
(dollars in thousands)
|
|||||||
|
(rates / ratios annualized)
|
|
ANALYSIS OF NET INTEREST SPREAD
|
Twelve Months Ended
|
|||||||||||||||||||||||
|
December 31, 2019
|
December 31, 2018
|
|||||||||||||||||||||||
|
Average
Balance
|
Interest and Dividends
|
Yield/Cost(3)
|
Average
Balance
|
Interest and Dividends
|
Yield/Cost(3)
|
|||||||||||||||||||
|
Interest-earning assets:
|
||||||||||||||||||||||||
|
Held for sale loans
|
$
|
126,086
|
$
|
5,343
|
4.24
|
%
|
$
|
81,873
|
$
|
3,926
|
4.80
|
%
|
||||||||||||
|
Mortgage loans
|
6,911,067
|
361,158
|
5.23
|
%
|
6,188,279
|
320,264
|
5.18
|
%
|
||||||||||||||||
|
Commercial/agricultural loans
|
1,784,468
|
93,742
|
5.25
|
%
|
1,519,871
|
79,605
|
5.24
|
%
|
||||||||||||||||
|
Consumer and other loans
|
176,373
|
11,230
|
6.37
|
%
|
149,184
|
9,575
|
6.42
|
%
|
||||||||||||||||
|
Total loans(1)
|
8,997,994
|
471,473
|
5.24
|
%
|
7,939,207
|
413,370
|
5.21
|
%
|
||||||||||||||||
|
Mortgage-backed securities
|
1,368,927
|
38,640
|
2.82
|
%
|
1,247,758
|
35,076
|
2.81
|
%
|
||||||||||||||||
|
Other securities
|
441,402
|
12,510
|
2.83
|
%
|
468,416
|
13,332
|
2.85
|
%
|
||||||||||||||||
|
Interest-bearing deposits with banks
|
72,579
|
1,649
|
2.27
|
%
|
59,031
|
1,080
|
1.83
|
%
|
||||||||||||||||
|
FHLB stock
|
29,509
|
1,407
|
4.77
|
%
|
20,496
|
774
|
3.78
|
%
|
||||||||||||||||
|
Total investment securities
|
1,912,417
|
54,206
|
2.83
|
%
|
1,795,701
|
50,262
|
2.80
|
%
|
||||||||||||||||
|
Total interest-earning assets
|
10,910,411
|
525,679
|
4.82
|
%
|
9,734,908
|
463,632
|
4.76
|
%
|
||||||||||||||||
|
Non-interest-earning assets
|
1,078,277
|
828,184
|
||||||||||||||||||||||
|
Total assets
|
$
|
11,988,688
|
$
|
10,563,092
|
||||||||||||||||||||
|
Deposits:
|
||||||||||||||||||||||||
|
Interest-bearing checking accounts
|
$
|
1,188,985
|
2,224
|
0.19
|
%
|
$
|
1,048,327
|
1,200
|
0.11
|
%
|
||||||||||||||
|
Savings accounts
|
1,890,467
|
8,310
|
0.44
|
%
|
1,665,608
|
3,944
|
0.24
|
%
|
||||||||||||||||
|
Money market accounts
|
1,534,909
|
10,693
|
0.70
|
%
|
1,421,161
|
4,107
|
0.29
|
%
|
||||||||||||||||
|
Certificates of deposit
|
1,175,942
|
16,403
|
1.39
|
%
|
1,127,612
|
11,391
|
1.01
|
%
|
||||||||||||||||
|
Total interest-bearing deposits
|
5,790,303
|
37,630
|
0.65
|
%
|
5,262,708
|
20,642
|
0.39
|
%
|
||||||||||||||||
|
Non-interest-bearing deposits
|
3,751,878
|
—
|
—
|
%
|
3,411,010
|
—
|
—
|
%
|
||||||||||||||||
|
Total deposits
|
9,542,181
|
37,630
|
0.39
|
%
|
8,673,718
|
20,642
|
0.24
|
%
|
||||||||||||||||
|
Other interest-bearing liabilities:
|
||||||||||||||||||||||||
|
FHLB advances
|
477,796
|
12,234
|
2.56
|
%
|
253,661
|
5,636
|
2.22
|
%
|
||||||||||||||||
|
Other borrowings
|
122,343
|
330
|
0.27
|
%
|
108,730
|
245
|
0.23
|
%
|
||||||||||||||||
|
Junior subordinated debentures
|
141,504
|
6,574
|
4.65
|
%
|
140,212
|
6,136
|
4.38
|
%
|
||||||||||||||||
|
Total borrowings
|
741,643
|
19,138
|
2.58
|
%
|
502,603
|
12,017
|
2.39
|
%
|
||||||||||||||||
|
Total funding liabilities
|
10,283,824
|
56,768
|
0.55
|
%
|
9,176,321
|
32,659
|
0.36
|
%
|
||||||||||||||||
|
Other non-interest-bearing liabilities(2)
|
164,318
|
79,901
|
||||||||||||||||||||||
|
Total liabilities
|
10,448,142
|
9,256,222
|
||||||||||||||||||||||
|
Shareholders' equity
|
1,540,546
|
1,306,870
|
||||||||||||||||||||||
|
Total liabilities and shareholders' equity
|
$
|
11,988,688
|
$
|
10,563,092
|
||||||||||||||||||||
|
Net interest income/rate spread
|
$
|
468,911
|
4.27
|
%
|
$
|
430,973
|
4.40
|
%
|
||||||||||||||||
|
Net interest margin
|
4.30
|
%
|
4.43
|
%
|
||||||||||||||||||||
|
Additional Key Financial Ratios:
|
||||||||||||||||||||||||
|
Return on average assets
|
1.22
|
%
|
1.29
|
%
|
||||||||||||||||||||
|
Return on average equity
|
9.50
|
%
|
10.45
|
%
|
||||||||||||||||||||
|
Average equity/average assets
|
12.85
|
%
|
12.37
|
%
|
||||||||||||||||||||
|
Average interest-earning assets/average interest-bearing liabilities
|
167.03
|
%
|
168.85
|
%
|
||||||||||||||||||||
|
Average interest-earning assets/average funding liabilities
|
106.09
|
%
|
106.09
|
%
|
||||||||||||||||||||
|
Non-interest income/average assets
|
0.68
|
%
|
0.80
|
%
|
||||||||||||||||||||
|
Non-interest expense/average assets
|
2.98
|
%
|
3.23
|
%
|
||||||||||||||||||||
|
Efficiency ratio(4)
|
64.94
|
%
|
66.29
|
%
|
||||||||||||||||||||
|
Adjusted efficiency ratio(5)
|
61.18
|
%
|
63.59
|
%
|
||||||||||||||||||||
|
(1)
|
Average balances include loans accounted for on a nonaccrual basis and loans 90 days or more past due. Amortization of net deferred
loan fees/costs is included with interest on loans.
|
|
(2)
|
Average other non-interest-bearing liabilities include fair value adjustments related to junior subordinated debentures.
|
|
(3)
|
Yields and costs have not been adjusted for the effect of tax-exempt interest.
|
|
(4)
|
Non-interest expense divided by the total of net interest income (before provision for loan losses) and non-interest income.
|
|
(5)
|
Adjusted non-interest expense divided by adjusted revenue. Adjusted revenue excludes net gain (loss) on sale of securities and fair
value adjustments. Adjusted non-interest expense excludes acquisition-related expenses, amortization of CDI, REO gain (loss), FHLB prepayment penalties and state/municipal business and use taxes. These represent non-GAAP financial
measures. See also Non-GAAP Financial Measures reconciliation tables on the last two pages of this press release.
|
BANR Fourth Quarter 2019 Results
January 23, 2020
Page 17
|
ADDITIONAL FINANCIAL INFORMATION
|
|||||||||
|
(dollars in thousands)
|
|||||||||
|
|
|||||||||
|
* Non-GAAP Financial Measures
|
|||||||||
|
In addition to results presented in accordance with generally accepted accounting principles in the United
States of America (GAAP), this press release contains certain non-GAAP financial measures. Management has presented these non-GAAP financial measures in this earnings release because it believes that they provide useful and comparative
information to assess trends in Banner's core operations reflected in the current quarter's results and facilitate the comparison of our performance with the performance of our peers. However, these non-GAAP financial measures are
supplemental and are not a substitute for any analysis based on GAAP. Where applicable, comparable earnings information using GAAP financial measures is also presented. Because not all companies use the same calculations, our presentation
may not be comparable to other similarly titled measures as calculated by other companies. For a reconciliation of these non-GAAP financial measures, see the tables below:
|
|||||||||
|
ADJUSTED REVENUE
|
Quarters Ended
|
Twelve Months Ended
|
||||||||||||||||||
|
Dec 31, 2019
|
Sep 30, 2019
|
Dec 31, 2018
|
Dec 31, 2019
|
Dec 31, 2018
|
||||||||||||||||
|
Net interest income before provision for loan losses
|
$
|
119,491
|
$
|
116,621
|
$
|
117,459
|
$
|
468,911
|
$
|
430,973
|
||||||||||
|
Total non-interest income
|
20,282
|
20,866
|
21,018
|
81,949
|
84,008
|
|||||||||||||||
|
Total GAAP revenue
|
139,773
|
137,487
|
138,477
|
550,860
|
514,981
|
|||||||||||||||
|
Exclude net (gain) loss on sale of securities
|
(62
|
)
|
2
|
885
|
(33
|
)
|
837
|
|||||||||||||
|
Exclude net change in valuation of financial instruments
carried at fair value
|
36
|
69
|
(198
|
)
|
208
|
(3,775
|
)
|
|||||||||||||
|
Adjusted revenue (non-GAAP)
|
$
|
139,747
|
$
|
137,558
|
$
|
139,164
|
$
|
551,035
|
$
|
512,043
|
||||||||||
|
ADJUSTED EARNINGS
|
Quarters Ended
|
Twelve Months Ended
|
||||||||||||||||||
|
Dec 31, 2019
|
Sep 30, 2019
|
Dec 31, 2018
|
Dec 31, 2019
|
Dec 31, 2018
|
||||||||||||||||
|
Net income (GAAP)
|
$
|
33,655
|
$
|
39,577
|
$
|
37,528
|
$
|
146,278
|
$
|
136,515
|
||||||||||
|
Exclude net (gain) loss on sale of securities
|
(62
|
)
|
2
|
885
|
(33
|
)
|
837
|
|||||||||||||
|
Exclude net change in valuation of financial instruments carried at fair value
|
36
|
69
|
(198
|
)
|
208
|
(3,775
|
)
|
|||||||||||||
|
Exclude acquisition-related expenses
|
4,419
|
676
|
4,602
|
7,544
|
5,607
|
|||||||||||||||
|
Exclude related tax (benefit) expense
|
(1,074
|
)
|
(49
|
)
|
(1,159
|
)
|
(1,741
|
)
|
(426
|
)
|
||||||||||
|
Exclude FHLB prepayment penalties
|
735
|
—
|
—
|
735
|
—
|
|||||||||||||||
|
Exclude tax adjustments related to tax reform and valuation reserves
|
—
|
—
|
(4,207
|
)
|
—
|
(4,207
|
)
|
|||||||||||||
|
Total adjusted earnings (non-GAAP)
|
$
|
37,709
|
$
|
40,275
|
$
|
37,451
|
$
|
152,991
|
$
|
134,551
|
||||||||||
|
Diluted earnings per share (GAAP)
|
$
|
0.95
|
$
|
1.15
|
$
|
1.09
|
$
|
4.18
|
$
|
4.15
|
||||||||||
|
Diluted adjusted earnings per share (non-GAAP)
|
$
|
1.07
|
$
|
1.17
|
$
|
1.09
|
$
|
4.38
|
$
|
4.09
|
||||||||||
BANR Fourth Quarter 2019 Results
January 23, 2020
Page 18
|
ADDITIONAL FINANCIAL INFORMATION
|
||||||||||||||||||||
|
(dollars in thousands)
|
||||||||||||||||||||
|
ADJUSTED EFFICIENCY RATIO
|
Quarters Ended
|
Twelve Months Ended
|
||||||||||||||||||
|
Dec 31, 2019
|
Sep 30, 2019
|
Dec 31, 2018
|
Dec 31, 2019
|
Dec 31, 2018
|
||||||||||||||||
|
Non-interest expense (GAAP)
|
$
|
93,690
|
$
|
87,308
|
$
|
95,396
|
$
|
357,728
|
$
|
341,371
|
||||||||||
|
Exclude acquisition-related expenses
|
(4,419
|
)
|
(676
|
)
|
(4,602
|
)
|
(7,544
|
)
|
(5,607
|
)
|
||||||||||
|
Exclude CDI amortization
|
(2,061
|
)
|
(1,985
|
)
|
(1,935
|
)
|
(8,151
|
)
|
(6,047
|
)
|
||||||||||
|
Exclude state/municipal tax expense
|
(917
|
)
|
(1,011
|
)
|
(854
|
)
|
(3,880
|
)
|
(3,284
|
)
|
||||||||||
|
Exclude REO loss
|
(40
|
)
|
(126
|
)
|
(251
|
)
|
(303
|
)
|
(804
|
)
|
||||||||||
|
Exclude FHLB prepayment penalties
|
(735
|
)
|
—
|
—
|
(735
|
)
|
$
|
—
|
||||||||||||
|
Adjusted non-interest expense (non-GAAP)
|
$
|
85,518
|
$
|
83,510
|
$
|
87,754
|
$
|
337,115
|
$
|
325,629
|
||||||||||
|
Net interest income before provision for loan losses (GAAP)
|
$
|
119,491
|
$
|
116,621
|
$
|
117,459
|
$
|
468,911
|
$
|
430,973
|
||||||||||
|
Non-interest income (GAAP)
|
20,282
|
20,866
|
21,018
|
81,949
|
84,008
|
|||||||||||||||
|
Total revenue
|
139,773
|
137,487
|
138,477
|
550,860
|
514,981
|
|||||||||||||||
|
Exclude net (gain) loss on sale of securities
|
(62
|
)
|
2
|
885
|
(33
|
)
|
837
|
|||||||||||||
|
Exclude net change in valuation of financial instruments carried at fair value
|
36
|
69
|
(198
|
)
|
208
|
(3,775
|
)
|
|||||||||||||
|
Adjusted revenue (non-GAAP)
|
$
|
139,747
|
$
|
137,558
|
$
|
139,164
|
$
|
551,035
|
$
|
512,043
|
||||||||||
|
Efficiency ratio (GAAP)
|
67.03
|
%
|
63.50
|
%
|
68.89
|
%
|
64.94
|
%
|
66.29
|
%
|
||||||||||
|
Adjusted efficiency ratio (non-GAAP)
|
61.19
|
%
|
60.71
|
%
|
63.06
|
%
|
61.18
|
%
|
63.59
|
%
|
||||||||||
|
TANGIBLE COMMON SHAREHOLDERS' EQUITY TO TANGIBLE ASSETS
|
Dec 31, 2019
|
Sep 30, 2019
|
Dec 31, 2018
|
|||||||||
|
Shareholders' equity (GAAP)
|
$
|
1,594,034
|
$
|
1,530,935
|
$
|
1,478,595
|
||||||
|
Exclude goodwill and other intangible assets, net
|
402,279
|
365,764
|
372,078
|
|||||||||
|
Tangible common shareholders' equity (non-GAAP)
|
$
|
1,191,755
|
$
|
1,165,171
|
$
|
1,106,517
|
||||||
|
Total assets (GAAP)
|
$
|
12,604,031
|
$
|
12,097,842
|
$
|
11,871,317
|
||||||
|
Exclude goodwill and other intangible assets, net
|
402,279
|
365,764
|
372,078
|
|||||||||
|
Total tangible assets (non-GAAP)
|
$
|
12,201,752
|
$
|
11,732,078
|
$
|
11,499,239
|
||||||
|
Common shareholders' equity to total assets (GAAP)
|
12.65
|
%
|
12.65
|
%
|
12.46
|
%
|
||||||
|
Tangible common shareholders' equity to tangible assets (non-GAAP)
|
9.77
|
%
|
9.93
|
%
|
9.62
|
%
|
||||||
|
TANGIBLE COMMON SHAREHOLDERS' EQUITY PER SHARE
|
||||||||||||
|
Tangible common shareholders' equity (non-GAAP)
|
$
|
1,191,755
|
$
|
1,165,171
|
$
|
1,106,517
|
||||||
|
Common shares outstanding at end of period
|
35,751,576
|
34,173,357
|
35,182,772
|
|||||||||
|
Common shareholders' equity (book value) per share (GAAP)
|
$
|
44.59
|
$
|
44.80
|
$
|
42.03
|
||||||
|
Tangible common shareholders' equity (tangible book value) per share (non-GAAP)
|
$
|
33.33
|
$
|
34.10
|
$
|
31.45
|
||||||