Exhibit 99.1

FOR IMMEDIATE RELEASE
Portman Ridge Finance Corporation Announces Second Quarter 2025 Financial Results
August 7, 2025
Completed Merger with Logan Ridge Finance Corporation
Reports Net Investment Income of $4.6 Million, or $0.50 Per Share for the Second Quarter
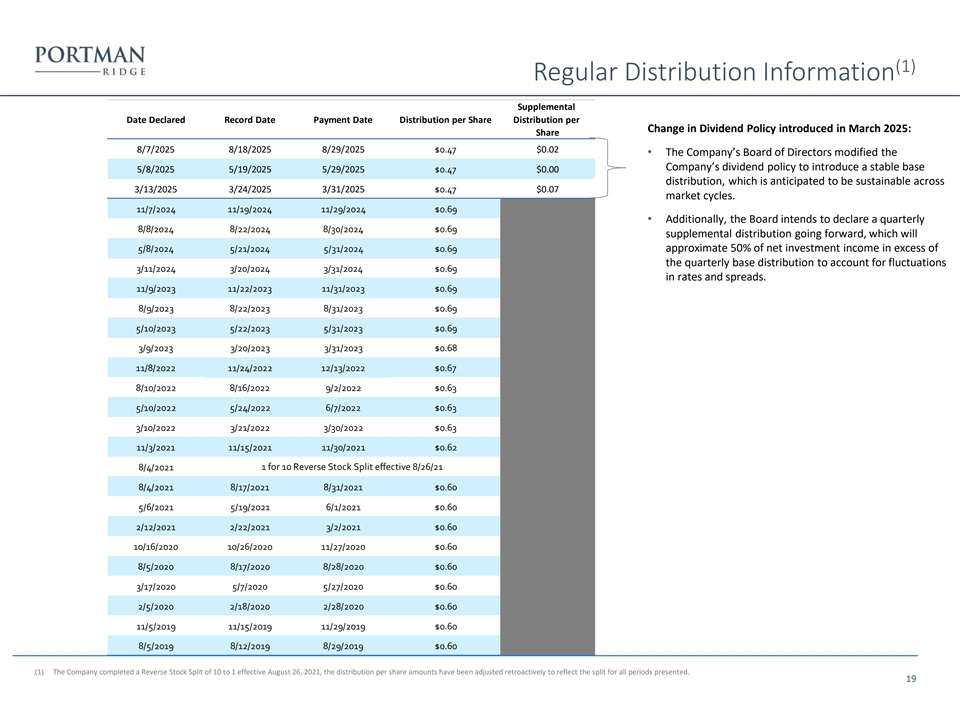
Announces Third Quarter 2025 Quarterly Base Distribution of $0.47 Per Share and Supplemental Distribution of $0.02 per share
NEW YORK, August 7, 2025 (GLOBE NEWSWIRE) – Portman Ridge Finance Corporation (Nasdaq: PTMN) (the “Company” or “Portman Ridge”) announced today its financial results for the second quarter ended June 30, 2025.
Transformational Milestone
| • | On July 15, 2025, Portman Ridge closed the previously announced merger of Logan Ridge Finance Corporation (“Logan Ridge”) with and into Portman Ridge, with Portman Ridge remaining as the surviving company. |
| • | We believe the combined company’s enhanced scale with total assets in excess of $600 million (as of July 11, 2025), its further diversified portfolio, cost savings due to lower overall operating expenses, and improved stock trading liquidity will deliver compelling risk-adjusted returns for our shareholders. |
| • | In the following weeks, Portman Ridge will rebrand and begin operating under the name BCP Investment Corporation. In connection with the rebranding, the Company will continue to trade on the Nasdaq under the new ticker symbol “BCIC”. |
Second Quarter 2025 Highlights
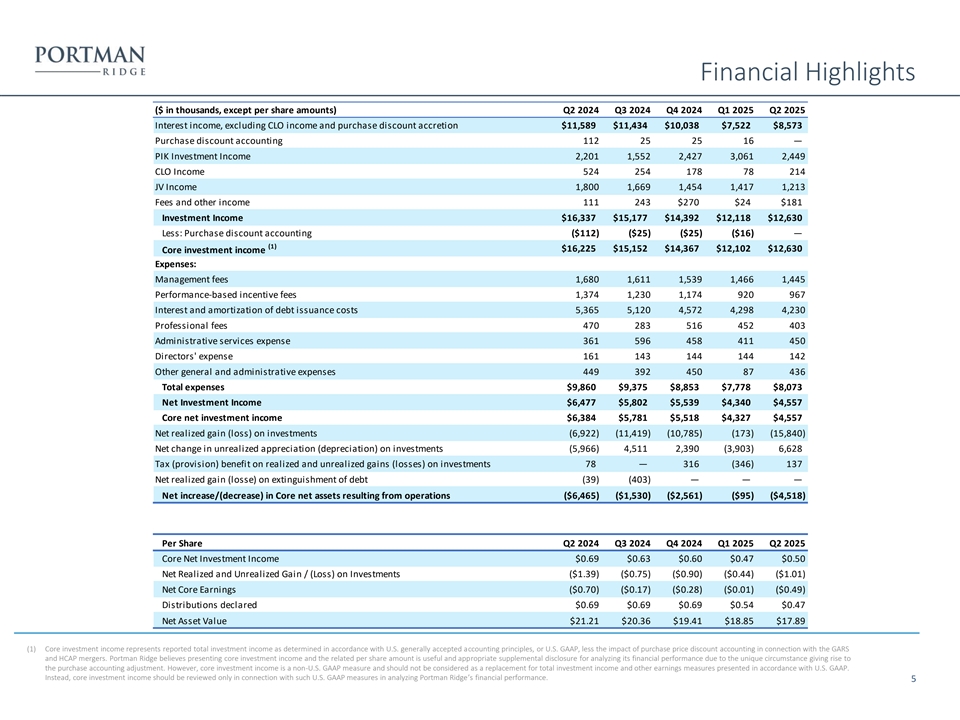
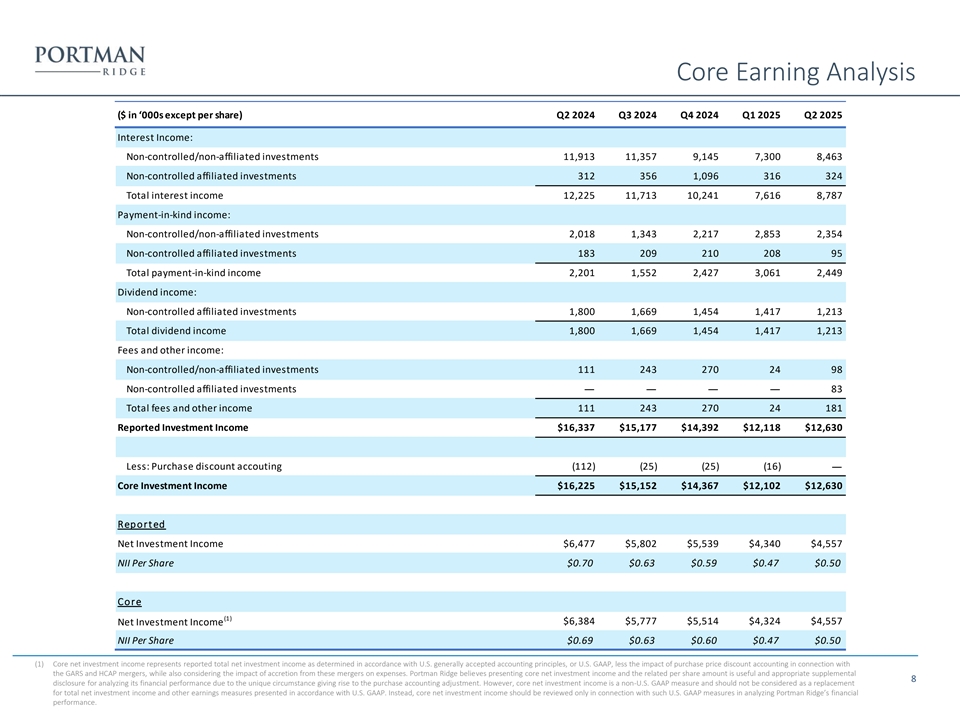
| • | Total investment income for the second quarter of 2025 was $12.6 million, up from $12.1 million in the first quarter of 2025. |
| • | Core investment income1, excluding the impact of purchase price accounting, for the second quarter of 2025 was $12.6 million, as compared to $12.1 million for the first quarter of 2025. |
| • | Net investment income (“NII”) for the second quarter of 2025 was $4.6 million ($0.50 per share), as compared to $4.3 million ($0.47 per share) in the first quarter of 2025. |
| 1 | Core investment income represents reported total investment income as determined in accordance with U.S. generally accepted accounting principles, or U.S. GAAP, less the impact of purchase discount accretion in connection with the Garrison Capital Inc. (“GARS”) and Harvest Capital Credit Corporation (“HCAP”) mergers. Portman Ridge believes presenting core investment income and the related per share amount is useful and appropriate supplemental disclosure for analyzing its financial performance due to the unique circumstance giving rise to the purchase accounting adjustment. However, core investment income is a non-U.S. GAAP measure and should not be considered as a replacement for total investment income and other earnings measures presented in accordance with U.S. GAAP. Instead, core investment income should be reviewed only in connection with such U.S. GAAP measures in analyzing Portman Ridge’s financial performance. |
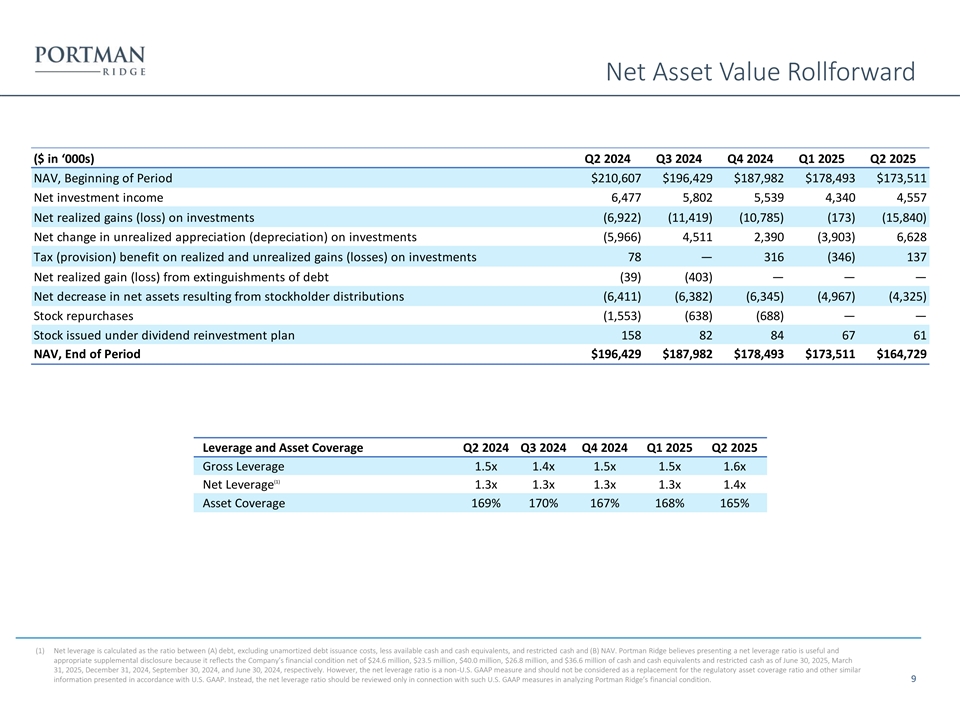
| • | Net asset value (“NAV”), as of June 30, 2025, was $164.7 million ($17.89 per share), as compared to NAV of $173.5 million ($18.85 per share) as of March 31, 2025. |
| • | Deployments of approximately $10.9 million and sales and repayments of approximately $17.0 million, resulting in net repayments and sales of approximately $6.1 million. |
Subsequent Events
| • | On August 7, 2025, the Company declared a regular quarterly base distribution of $0.47 per share of common stock and a supplemental cash distribution of $0.02 per share of common stock. The distribution is payable on August 29, 2025 to stockholders of record at the close of business on August 18, 2025. |
| • | On July 15, 2025, the Company announced the completion of its acquisition of Logan Ridge Finance Corporation, a Maryland corporation (“LRFC”, and such transaction, the “LRFC Acquisition”), pursuant to the terms of the merger agreement, dated January 29, 2025 (the “LRFC Merger Agreement”). To effect the acquisition, a wholly owned merger subsidiary of the Company merged with and into LRFC, with LRFC surviving the merger as the Company’s wholly owned subsidiary. Immediately thereafter and as a single integrated transaction, LRFC consummated a second merger, whereby LRFC merged with and into the Company, with the Company surviving the merger. Based on July 11, 2025 financial data, the combined company had total assets in excess of $600 million. Under the terms of the LRFC Merger Agreement, each share of LRFC common stock issued and outstanding was converted into the right to receive 1.500 newly-issued shares of common stock of the Company with cash to be paid (without interest) in lieu of fractional shares. As additional consideration funded by LRFC’s investment adviser, LRFC shareholders of record as of May 6, 2025 received a cash payment of $0.47 per share. In addition, LRFC shareholders of record as of July 14, 2025 received a tax distribution of $0.38 per share from LRFC. The Company will seek to leverage the combined company’s enhanced scale, further diversified portfolio, cost savings due to lower overall operating expenses, and improved stock trading liquidity to deliver compelling risk-adjusted returns for its shareholders. Please see the Company’s Current Report on Form 8-K filed on July 16, 2025 for more information. |
Management Commentary
Ted Goldthorpe, Chief Executive Officer of Portman Ridge, stated, “We continued to advance our strategic priorities in the second quarter, generating net investment income of $4.6 million, or $0.50 per share, compared to $4.3 million, or $0.47 per share, in the prior quarter. Our focus remains on maintaining a high-quality portfolio and delivering long-term value to our shareholders.
The recent completion of our merger with Logan Ridge marks a transformational milestone for the Company. We’re proud to have successfully closed this transaction and expect it to provide increased scale, broader portfolio diversification, enhanced financial flexibility, and earnings accretion generated by cost synergies under the Company’s new name and ticker. We believe the combined platform will support stronger operating efficiency and improved shareholder outcomes over time.
To reflect this next chapter and the strength of our adviser, we will be changing our corporate name to BCP Investment Corporation (Nasdaq: BCIC) in the following weeks. The new name highlights our alignment with BC Partners, a global alternative investment platform with deep credit expertise, and reinforces our commitment to building a leading Business Development Company.
As we move forward, we remain committed to disciplined investment execution, active portfolio management, and thoughtful capital allocation, all with the goal of generating attractive, long-term returns for our shareholders.”
Selected Financial Highlights
| • | Total investment income for the quarter ended June 30, 2025, was $12.6 million, of which $10.9 million was attributable to interest income, inclusive of payment-in-kind income, from the Debt Securities Portfolio. This compares to total investment income of $16.3 million for the quarter ended June 30, 2024, of which $13.9 million was attributable to interest income, inclusive of payment-in-kind income, from the Debt Securities Portfolio. |
| • | Core investment income for the quarter ended June 30, 2025, excluding the impact of purchase discount accretion, was $12.6 million, as compared to core investment income of $16.2 million for the quarter ended June 30, 2024. |
| • | Net investment income (“NII”) for the quarter ended June 30, 2025, was $4.6 million ($0.50 per share) as compared to $6.5 million ($0.70 per share) for the quarter ended June 30, 2024. |
| • | Net asset value (“NAV”) as of June 30, 2025, was $164.7 million ($17.89 per share), as compared to $173.5 million ($18.85 per share) for the first quarter of 2025. |
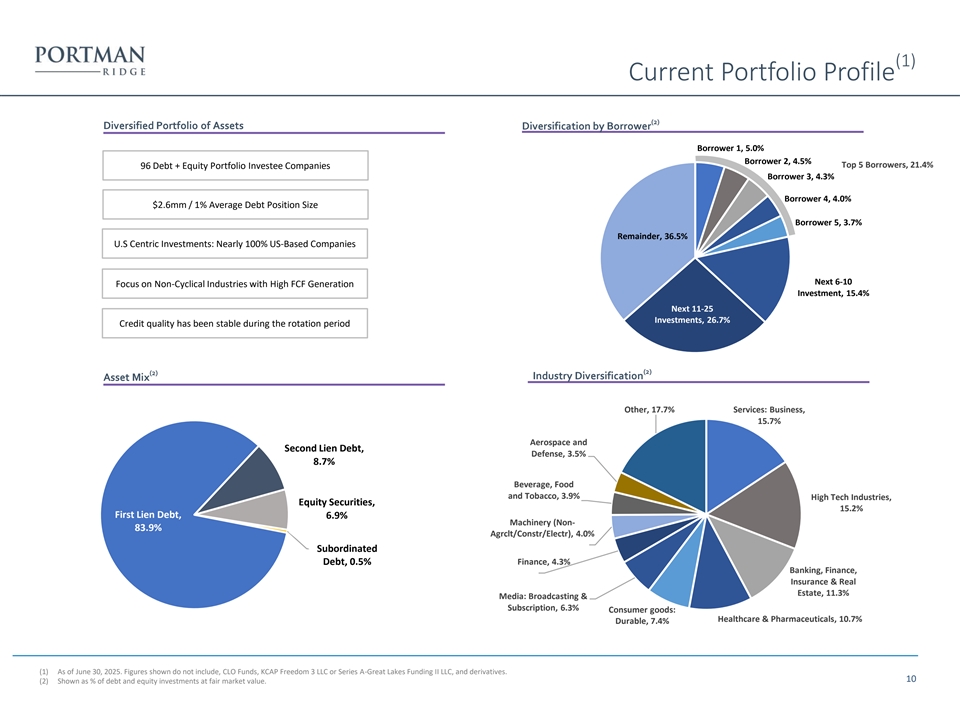
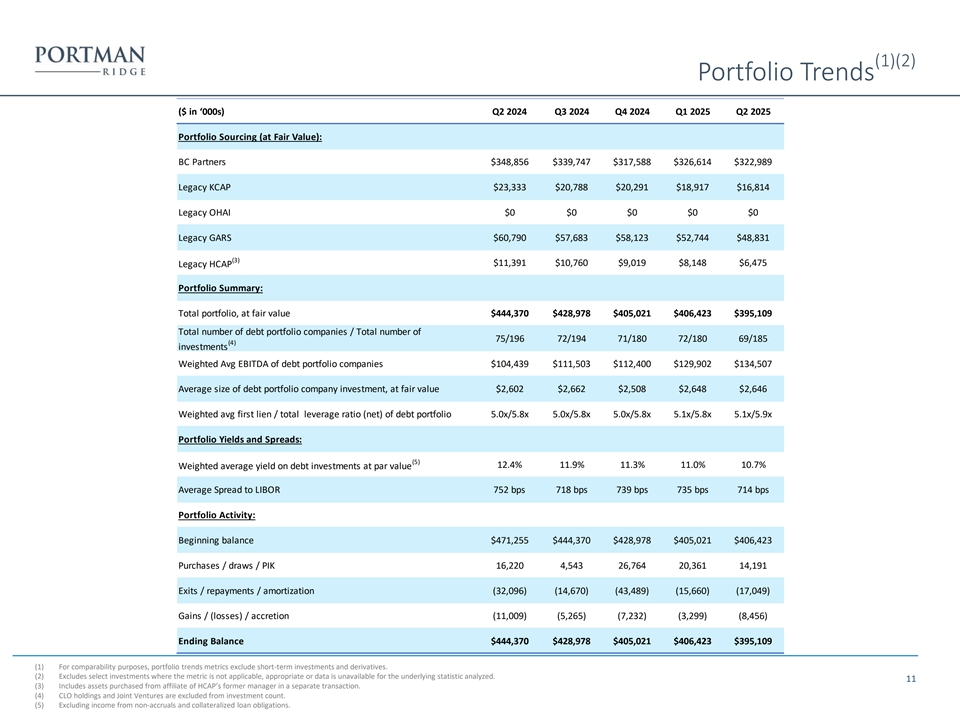
| • | Investment portfolio at fair value as of June 30, 2025, was $395.1 million, comprised of 96 different portfolio companies. Our debt investment portfolio, excluding our investments in the CLO Funds, equities and Joint Ventures, totaled $323.1 million at fair value as of June 30, 2025, and was spread across 25 different industries comprised of 69 different portfolio companies with an average par balance per entity of approximately $2.6 million. This compares to a total investment portfolio at fair value as of March 31, 2025, of $406.4 million, comprised of 93 different portfolio companies. Our debt investment portfolio, excluding our investments in the CLO Funds, equities and Joint Ventures, totaled $324.8 million at fair value as of March 31, 2025, spread across 24 different industries and comprised of 72 different portfolio companies, with an average par balance per entity of approximately $2.6 million. |
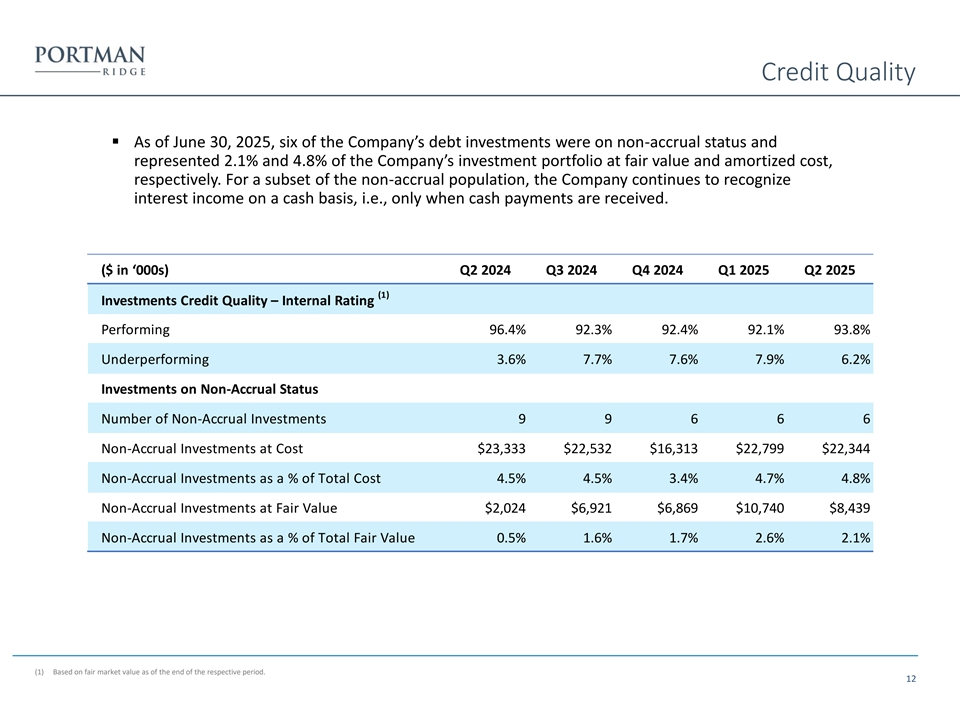
| • | Debt investments on non-accrual, as of June 30, 2025, were six, representing 2.1% and 4.8% of the Company’s investment portfolio at fair value and amortized cost, respectively. This compares to six debt investments representing 2.6% and 4.7% of the Company’s investment portfolio at fair value and amortized cost, respectively, as of March 31, 2025. |
| • | Weighted average annualized yield was approximately 10.7% (excluding income from non-accruals and collateralized loan obligations) as of June 30, 2025. |
| • | Par value of outstanding borrowings, as of June 30, 2025, was $255.4 million, which remained unchanged from March 31, 2025, with an asset coverage ratio of total assets to total borrowings of 165% as compared to 168% as of March 31, 2025. On a net basis, leverage as of June 30, 2025, was 1.4x2 compared to 1.3x2 as of March 31, 2025. |
| 2 | Net leverage is calculated as the ratio between (A) debt, excluding unamortized debt issuance costs, less available cash and cash equivalents, and restricted cash and (B) NAV. Portman Ridge believes presenting a net leverage ratio is useful and appropriate supplemental disclosure because it reflects the Company’s financial condition net of $24.6 million and $23.5 million of cash and cash equivalents and restricted cash as of June 30, 2025, and March 31, 2025, respectively. However, the net leverage ratio is a non-U.S. GAAP measure and should not be considered as a replacement for the regulatory asset coverage ratio and other similar information presented in accordance with U.S. GAAP. Instead, the net leverage ratio should be reviewed only in connection with such U.S. GAAP measures in analyzing Portman Ridge’s financial condition. |
Results of Operations
Operating results for the three and six months ended June 30, 2025, and June 30, 2024, were as follows:
| For the Three Months Ended June 30, | For the Six Months Ended June 30, | |||||||||||||||
| ($ in thousands, except share and per share amounts) | 2025 | 2024 | 2025 | 2024 | ||||||||||||
| Total investment income |
$ | 12,630 | $ | 16,337 | $ | 24,748 | $ | 32,863 | ||||||||
|
|
|
|
|
|
|
|
|
|||||||||
| Total expenses |
8,073 | 9,860 | 15,851 | 20,161 | ||||||||||||
|
|
|
|
|
|
|
|
|
|||||||||
| Net Investment Income |
4,557 | 6,477 | 8,897 | 12,702 | ||||||||||||
|
|
|
|
|
|
|
|
|
|||||||||
| Net realized gain (loss) on investments |
(15,840 | ) | (6,922 | ) | (16,013 | ) | (8,979 | ) | ||||||||
|
|
|
|
|
|
|
|
|
|||||||||
| Net change in unrealized gain (loss) on investments |
6,628 | (5,966 | ) | 2,725 | (5,895 | ) | ||||||||||
|
|
|
|
|
|
|
|
|
|||||||||
| Tax (provision) benefit on realized and unrealized gains (losses) on investments |
137 | 78 | (209 | ) | 537 | |||||||||||
|
|
|
|
|
|
|
|
|
|||||||||
| Net realized and unrealized appreciation (depreciation) on investments, net of taxes |
(9,075 | ) | (12,810 | ) | (13,497 | ) | (14,337 | ) | ||||||||
|
|
|
|
|
|
|
|
|
|||||||||
| Net realized gain (loss) on extinguishment of debt |
— | (39 | ) | — | (252 | ) | ||||||||||
|
|
|
|
|
|
|
|
|
|||||||||
| Net Increase (Decrease) in Net Assets Resulting from Operations |
(4,518 | ) | (6,372 | ) | (4,600 | ) | (1,887 | ) | ||||||||
|
|
|
|
|
|
|
|
|
|||||||||
| Net Increase (Decrease) In Net Assets Resulting from Operations per Common Share: |
||||||||||||||||
| Basic and Diluted: |
$ | (0.49 | ) | $ | (0.69 | ) | $ | (0.50 | ) | $ | (0.20 | ) | ||||
| Net Investment Income Per Common Share: |
||||||||||||||||
| Basic and Diluted: |
$ | 0.50 | $ | 0.70 | $ | 0.97 | $ | 1.36 | ||||||||
| Weighted Average Shares of Common Stock Outstanding — Basic and Diluted |
9,204,657 | 9,293,687 | 9,201,451 | 9,319,272 | ||||||||||||
Investment Income
The composition of our investment income for the three and six months ended June 30, 2025, and June 30, 2024, was as follows:
| For the Three Months Ended June 30, | For the Six Months Ended June 30, | |||||||||||||||
| ($ in thousands) | 2025 | 2024 | 2025 | 2024 | ||||||||||||
| Interest income, excluding CLO income and purchase discount accretion |
$ | 8,573 | $ | 11,589 | $ | 16,095 | $ | 23,675 | ||||||||
| Purchase discount accretion |
— | 112 | 16 | 185 | ||||||||||||
| PIK income |
2,449 | 2,201 | 5,510 | 4,207 | ||||||||||||
| CLO income |
214 | 524 | 292 | 1,081 | ||||||||||||
| JV income |
1,213 | 1,800 | 2,630 | 3,453 | ||||||||||||
| Fees and other income |
181 | 111 | 205 | 262 | ||||||||||||
|
|
|
|
|
|
|
|
|
|||||||||
| Investment Income |
$ | 12,630 | $ | 16,337 | $ | 24,748 | $ | 32,863 | ||||||||
|
|
|
|
|
|
|
|
|
|||||||||
| Less: Purchase discount accretion |
$ | — | $ | (112 | ) | $ | (16 | ) | $ | (185 | ) | |||||
|
|
|
|
|
|
|
|
|
|||||||||
| Core Investment Income |
$ | 12,630 | $ | 16,225 | $ | 24,732 | $ | 32,678 | ||||||||
|
|
|
|
|
|
|
|
|
|||||||||
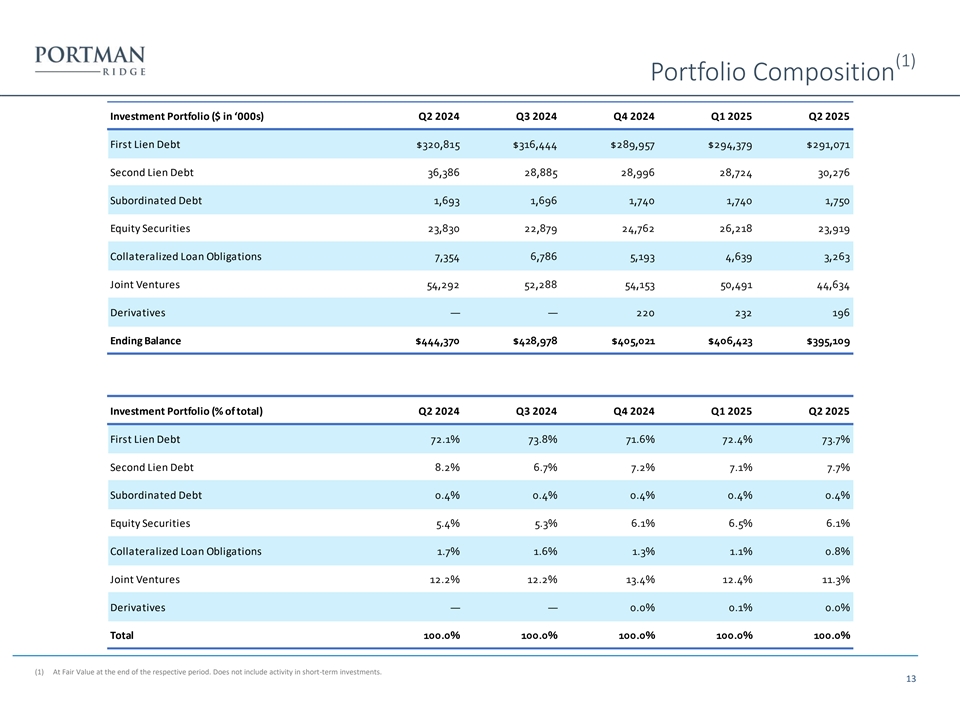
Fair Value of Investments
The composition of our investment portfolio as of June 30, 2025, and December 31, 2024, at cost and fair value was as follows:
| ($ in thousands) | June 30, 2025 | December 31, 2024 | ||||||||||||||||||||||
| Security Type | Cost/Amortized Cost |
Fair Value | Fair Value Percentage of Total Portfolio |
Cost/Amortized Cost |
Fair Value | Fair Value Percentage of Total Portfolio |
||||||||||||||||||
| First Lien Debt |
$ | 312,114 | $ | 291,071 | 73.7 | % | $ | 311,673 | $ | 289,957 | 71.6 | % | ||||||||||||
| Second Lien Debt |
35,576 | 30,276 | 7.7 | % | 34,892 | 28,996 | 7.2 | % | ||||||||||||||||
| Subordinated Debt |
6,103 | 1,750 | 0.4 | % | 8,059 | 1,740 | 0.4 | % | ||||||||||||||||
| Collateralized Loan Obligations |
2,527 | 3,263 | 0.8 | % | 5,318 | 5,193 | 1.3 | % | ||||||||||||||||
| Joint Ventures |
60,709 | 44,634 | 11.3 | % | 66,747 | 54,153 | 13.4 | % | ||||||||||||||||
| Equity |
28,944 | 23,919 | 6.1 | % | 31,921 | 24,762 | 6.1 | % | ||||||||||||||||
| Asset Manager Affiliates(1) |
17,791 | — | — | 17,791 | — | — | ||||||||||||||||||
| Derivatives |
31 | 196 | 0.0 | % | 31 | 220 | — | |||||||||||||||||
|
|
|
|
|
|
|
|
|
|
|
|
|
|||||||||||||
| Total |
$ | 463,795 | $ | 395,109 | 100.0 | % | $ | 476,432 | $ | 405,021 | 100.0 | % | ||||||||||||
|
|
|
|
|
|
|
|
|
|
|
|
|
|||||||||||||
| (1) | Represents the equity investment in the Asset Manager Affiliates. |
Liquidity and Capital Resources
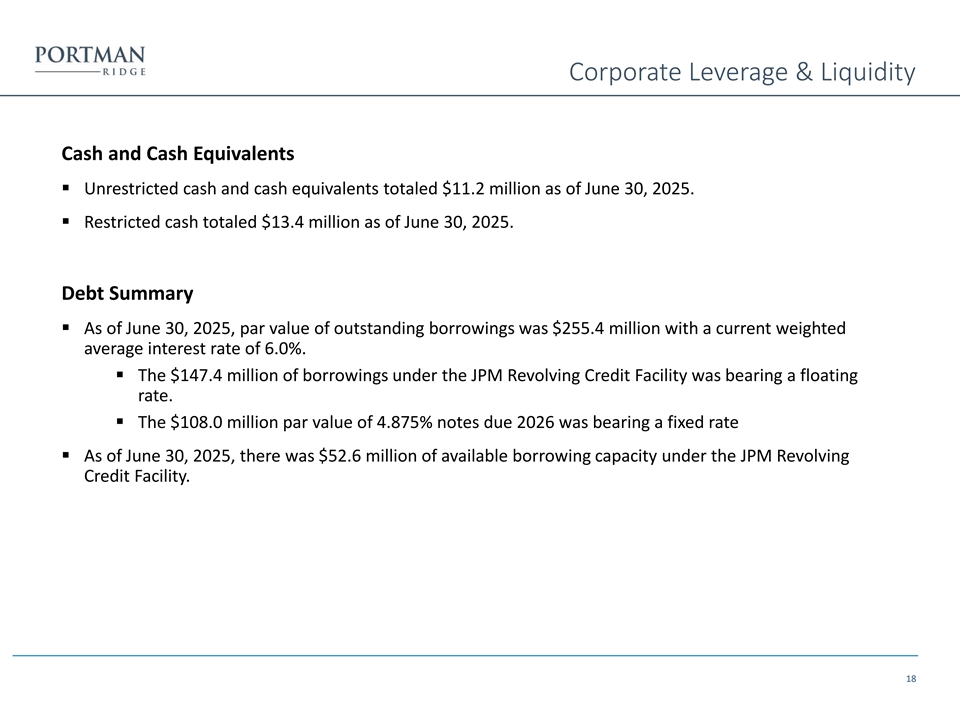
As of June 30, 2025, the Company had approximately $255.4 million (par value) of outstanding borrowings at a current weighted average interest rate of 6.0%, of which $108.0 million par value had a fixed rate of 4.875% (Notes due 2026), and $147.4 million par value had a floating rate under the JPM Credit Facility.
As of June 30, 2025, and December 31, 2024, the fair value of investments and cash were as follows:
| ($ in thousands) | ||||||||
| Security Type | June 30, 2025 | December 31, 2024 | ||||||
| Cash and Cash Equivalents |
$ | 11,222 | $ | 17,532 | ||||
| Restricted Cash |
13,357 | 22,421 | ||||||
| First Lien Debt |
291,071 | 289,957 | ||||||
| Second Lien Debt |
30,276 | 28,996 | ||||||
| Subordinated Debt |
1,750 | 1,740 | ||||||
| Equity |
23,919 | 24,762 | ||||||
| Collateralized Loan Obligations |
3,263 | 5,193 | ||||||
| Asset Manager Affiliates |
— | — | ||||||
| Joint Ventures |
44,634 | 54,153 | ||||||
| Derivatives |
196 | 220 | ||||||
|
|
|
|
|
|||||
| Total |
$ | 419,688 | $ | 444,974 | ||||
|
|
|
|
|
|||||
As of June 30, 2025, the Company had unrestricted cash of $11.2 million and restricted cash of $13.4 million. This compares to unrestricted cash of $9.2 million and restricted cash of $14.3 million as of March 31, 2025. As of June 30, 2025, the Company had $52.6 million of available borrowing capacity under the JPM Credit Facility.
Interest Rate Risk
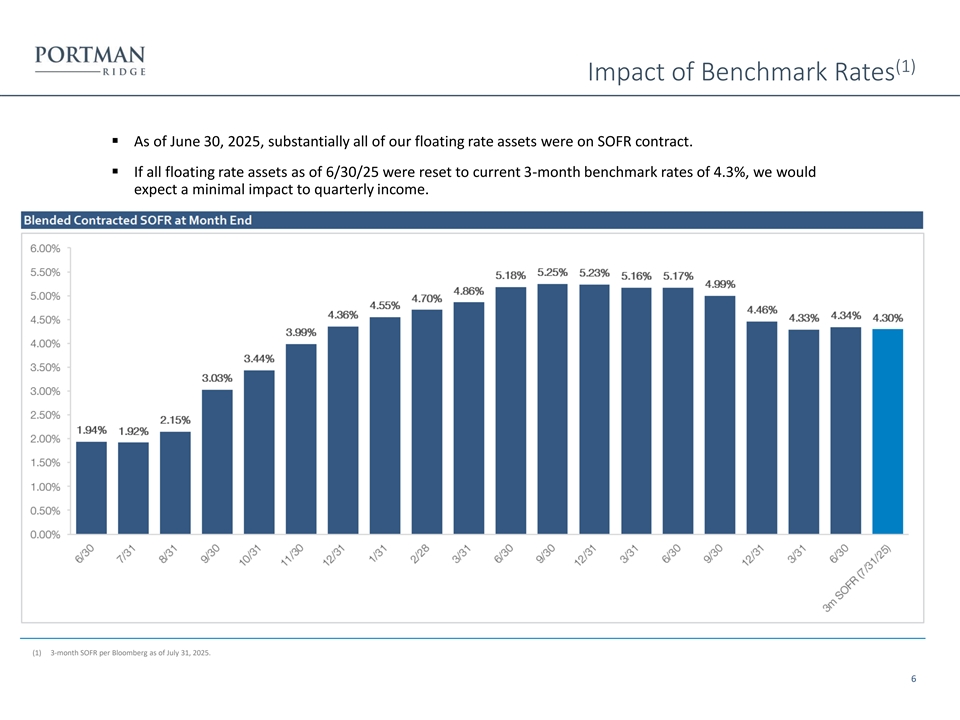
The Company’s investment income is affected by fluctuations in various interest rates, including SOFR and prime rates.
As of June 30, 2025, approximately 86.9% of our Debt Securities Portfolio at par value were either floating rate with a spread to an interest rate index such as SOFR or the PRIME rate. 86.5% of these floating rate loans contain floors ranging between 0.50% and 5.25%. We generally expect that future portfolio investments will predominately be floating rate investments.
In periods of rising or lowering interest rates, the cost of the portion of debt associated with the 4.875% Notes Due 2026 would remain the same, given that this debt is at a fixed rate, while the interest rate on borrowings under the JPM Credit Facility would fluctuate with changes in interest rates.
Generally, the Company would expect that an increase in the base rate index for floating rate investment assets would increase gross investment income and a decrease in the base rate index for such assets would decrease gross investment income (in either case, such increase/decrease may be limited by interest rate floors/minimums for certain investment assets).
| Impact on net investment income from a change in interest rates at: |
||||||||||||
| ($ in thousands) | 1% | 2% | 3% | |||||||||
| Increase in interest rate |
$ | 1,477 | $ | 2,955 | $ | 4,432 | ||||||
| Decrease in interest rate |
$ | (1,477 | ) | $ | (2,912 | ) | $ | (4,105 | ) | |||
Conference Call and Webcast
We will hold a conference call on Friday, August 8, 2025, at 10:00 am Eastern Time to discuss our second quarter 2025 financial results. To access the call, stockholders, prospective stockholders and analysts should dial (646) 307-1963 approximately 10 minutes prior to the start of the conference call and use the conference ID 1430967.
A replay of this conference call will be available shortly after the live call through August 15, 2025.
A live audio webcast of the conference call can be accessed via the Internet, on a listen-only basis on the Company’s website www.portmanridge.com in the Investor Relations section under Events and Presentations. The webcast can also be accessed by clicking the following link: https://edge.media-server.com/mmc/p/aty7k6qp. The online archive of the webcast will be available on the Company’s website shortly after the call.
About Portman Ridge Finance Corporation
Portman Ridge Finance Corporation (Nasdaq: PTMN) is a publicly traded, externally managed investment company that has elected to be regulated as a business development company under the Investment Company Act of 1940. Portman Ridge’s middle market investment business originates, structures, finances and manages a portfolio of term loans, mezzanine investments and selected equity securities in middle market companies. Portman Ridge’s investment activities are managed by its investment adviser, Sierra Crest Investment Management LLC, an affiliate of BC Partners Advisors L.P.
Portman Ridge’s filings with the Securities and Exchange Commission (the “SEC”), earnings releases, press releases and other financial, operational and governance information are available on the Company’s website at www.portmanridge.com.
About BC Partners Advisors L.P. and BC Partners Credit
BC Partners is a leading international investment firm in private equity, private credit and real estate strategies. Established in 1986, BC Partners has played an active role in developing the European buyout market for three decades.
Today, BC Partners executives operate across markets as an integrated team through the firm’s offices in North America and Europe. For more information, please visit https://www.bcpartners.com/.
BC Partners Credit was launched in February 2017 and has pursued a strategy focused on identifying attractive credit opportunities in any market environment and across sectors, leveraging the deal sourcing and infrastructure made available from BC Partners.
Cautionary Statement Regarding Forward-Looking Statements
This press release contains forward-looking statements. The matters discussed in this press release, as well as in future oral and written statements by management of Portman Ridge Finance Corporation, that are forward-looking statements are based on current management expectations that involve substantial risks and uncertainties which could cause actual results to differ materially from the results expressed in, or implied by, these forward-looking statements. Forward-looking statements relate to future events or our future financial performance and include, but are not limited to, projected financial performance, expected development of the business, plans and expectations about future investments and the future liquidity of the Company. We generally identify forward-looking statements by terminology such as “may,” “will,” “should,” “expects,” “plans,” “anticipates,” “could,” “intends,” “target,” “projects,” “outlook”, “contemplates,” “believes,” “estimates,” “predicts,” “potential” or “continue” or the negative of these terms or other similar words. Forward-looking statements are based upon current plans, estimates and expectations that are subject to risks, uncertainties, and assumptions. Should one or more of these risks or uncertainties materialize, or should the underlying assumptions prove to be incorrect, actual results may vary materially from those indicated or anticipated by such forward-looking statements.
Important assumptions include our ability to originate new investments, and achieve certain margins and levels of profitability, the availability of additional capital, and the ability to maintain certain debt to asset ratios. In light of these and other uncertainties, the inclusion of a projection or forward-looking statement in this press release should not be regarded as a representation that such plans, estimates, expectations or objectives will be achieved. Important factors that could cause actual results to differ materially from such plans, estimates or expectations include, among others, (1) uncertainty of the expected financial performance of the Company; (2) expected synergies and savings associated with merger transactions effectuated by the Company; (3) the ability of the Company and/or its adviser to implement its business strategy; (4) evolving legal, regulatory and tax regimes; (5) changes in general economic and/or industry specific
conditions, including but not limited to the impact of inflation; (6) the impact of increased competition; (7) business prospects and the prospects of the Company’s portfolio companies; (8) contractual arrangements with third parties; (9) any future financings by the Company; (10) the ability of Sierra Crest Investment Management LLC to attract and retain highly talented professionals; (11) the Company’s ability to fund any unfunded commitments; (12) any future distributions by the Company; (13) changes in regional or national economic conditions and their impact on the industries in which we invest; and (14) other changes in the conditions of the industries in which we invest and other factors enumerated in our filings with the SEC. The forward-looking statements should be read in conjunction with the risks and uncertainties discussed in the Company’s filings with the SEC, including the Company’s most recent Form 10-K and other SEC filings. We do not undertake to publicly update or revise any forward-looking statements, whether as a result of new information, future events or otherwise, except as required to be reported under the rules and regulations of the SEC. Although the Company undertakes no obligation to revise or update any forward-looking statements, whether as a result of new information, future events or otherwise, you are advised to consult any additional disclosures that they may make directly to you or through reports that the Company in the future may file with the SEC, including annual reports on Form 10-K, quarterly reports on Form 10-Q and current reports on Form 8-K.
Contacts:
Portman Ridge Finance Corporation
650 Madison Avenue, 3rd floor
New York, NY 10022
Brandon Satoren
Chief Financial Officer
(212) 891-2880
The Equity Group Inc.
Lena Cati
(212) 836-9611
Val Ferraro
(212) 836-9633
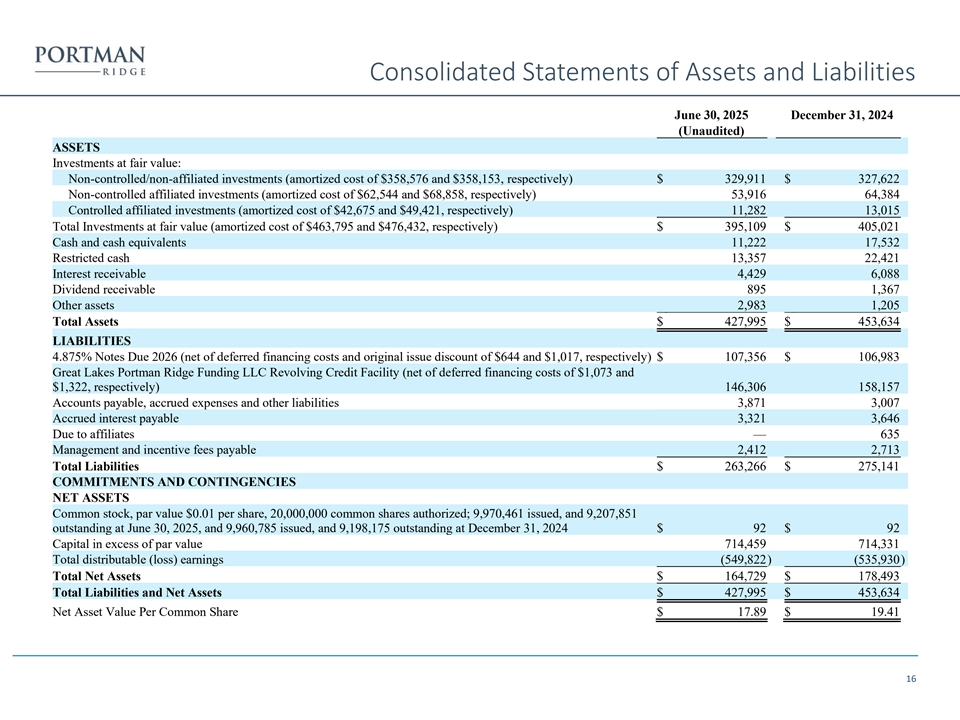
PORTMAN RIDGE FINANCE CORPORATION
CONSOLIDATED STATEMENTS OF ASSETS AND LIABILITIES
(in thousands, except share and per share amounts)
| June 30, 2025 (Unaudited) |
December 31, 2024 | |||||||
| ASSETS | ||||||||
| Investments at fair value: |
||||||||
|
Non-controlled/non-affiliated investments (amortized cost of $358,576 and $358,153, respectively) |
$ | 329,911 | $ | 327,622 | ||||
| Non-controlled affiliated investments (amortized cost of $62,544 and $68,858, respectively) |
53,916 | 64,384 | ||||||
| Controlled affiliated investments (amortized cost of $42,675 and $49,421, respectively) |
11,282 | 13,015 | ||||||
|
|
|
|
|
|||||
| Total Investments at fair value (amortized cost of $463,795 and $476,432, respectively) |
$ | 395,109 | $ | 405,021 | ||||
| Cash and cash equivalents |
11,222 | 17,532 | ||||||
| Restricted cash |
13,357 | 22,421 | ||||||
| Interest receivable |
4,429 | 6,088 | ||||||
| Dividend receivable |
895 | 1,367 | ||||||
| Other assets |
2,983 | 1,205 | ||||||
|
|
|
|
|
|||||
| Total Assets |
$ | 427,995 | $ | 453,634 | ||||
|
|
|
|
|
|||||
| LIABILITIES |
||||||||
| 4.875% Notes Due 2026 (net of deferred financing costs and original issue discount of $644 and $1,017, respectively) |
$ | 107,356 | $ | 106,983 | ||||
| Great Lakes Portman Ridge Funding LLC Revolving Credit Facility (net of deferred financing costs of $1,073 and $1,322, respectively) |
146,306 | 158,157 | ||||||
| Accounts payable, accrued expenses and other liabilities |
3,871 | 3,007 | ||||||
| Accrued interest payable |
3,321 | 3,646 | ||||||
| Due to affiliates |
— | 635 | ||||||
| Management and incentive fees payable |
2,412 | 2,713 | ||||||
|
|
|
|
|
|||||
| Total Liabilities |
$ | 263,266 | $ | 275,141 | ||||
| COMMITMENTS AND CONTINGENCIES |
||||||||
| NET ASSETS |
||||||||
| Common stock, par value $0.01 per share, 20,000,000 common shares authorized; 9,970,461 issued, and 9,207,851 outstanding at June 30, 2025, and 9,960,785 issued, and 9,198,175 outstanding at December 31, 2024 |
$ | 92 | $ | 92 | ||||
| Capital in excess of par value |
714,459 | 714,331 | ||||||
| Total distributable (loss) earnings |
(549,822 | ) | (535,930 | ) | ||||
|
|
|
|
|
|||||
| Total Net Assets |
$ | 164,729 | $ | 178,493 | ||||
|
|
|
|
|
|||||
| Total Liabilities and Net Assets |
$ | 427,995 | $ | 453,634 | ||||
|
|
|
|
|
|||||
| Net Asset Value Per Common Share |
$ | 17.89 | $ | 19.41 | ||||
|
|
|
|
|
|||||
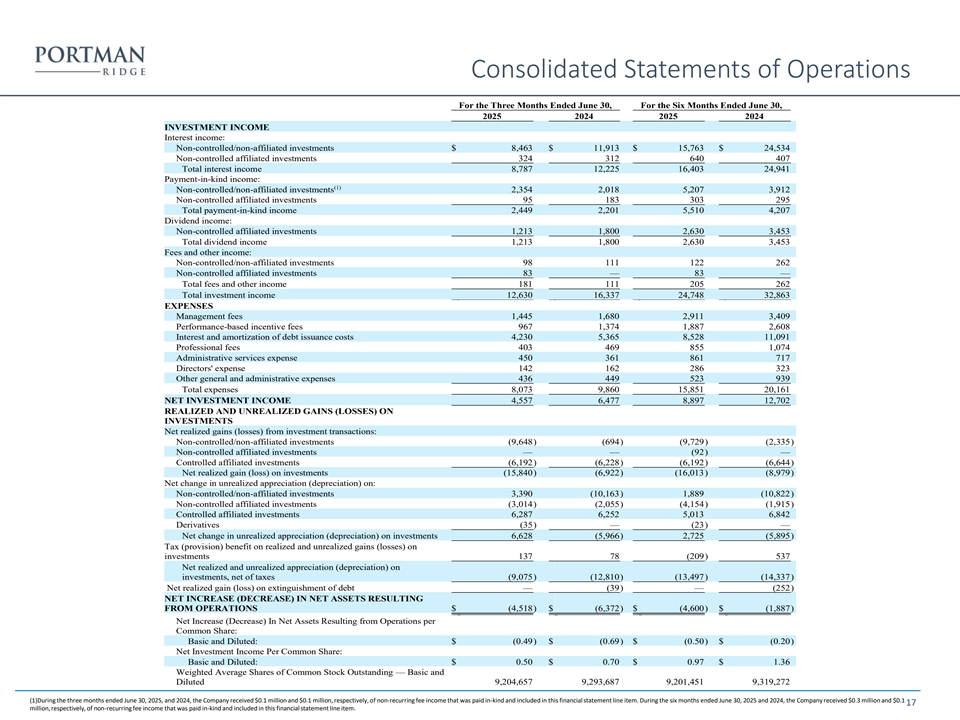
PORTMAN RIDGE FINANCE CORPORATION
CONSOLIDATED STATEMENTS OF OPERATIONS
(in thousands, except share and per share amounts)
| For the Three Months Ended June 30, | For the Six Months Ended June 30, | |||||||||||||||
| 2025 | 2024 | 2025 | 2024 | |||||||||||||
| INVESTMENT INCOME |
||||||||||||||||
| Interest income: |
||||||||||||||||
|
Non-controlled/non-affiliated investments |
$ | 8,463 | $ | 11,913 | $ | 15,763 | $ | 24,534 | ||||||||
| Non-controlled affiliated investments |
324 | 312 | 640 | 407 | ||||||||||||
|
|
|
|
|
|
|
|
|
|||||||||
| Total interest income |
8,787 | 12,225 | 16,403 | 24,941 | ||||||||||||
| Payment-in-kind income: | ||||||||||||||||
|
Non-controlled/non-affiliated investments(1) |
2,354 | 2,018 | 5,207 | 3,912 | ||||||||||||
| Non-controlled affiliated investments |
95 | 183 | 303 | 295 | ||||||||||||
|
|
|
|
|
|
|
|
|
|||||||||
| Total payment-in-kind income |
2,449 | 2,201 | 5,510 | 4,207 | ||||||||||||
| Dividend income: | ||||||||||||||||
| Non-controlled affiliated investments |
1,213 | 1,800 | 2,630 | 3,453 | ||||||||||||
|
|
|
|
|
|
|
|
|
|||||||||
| Total dividend income |
1,213 | 1,800 | 2,630 | 3,453 | ||||||||||||
| Fees and other income: | ||||||||||||||||
|
Non-controlled/non-affiliated investments |
98 | 111 | 122 | 262 | ||||||||||||
| Non-controlled affiliated investments |
83 | — | 83 | — | ||||||||||||
|
|
|
|
|
|
|
|
|
|||||||||
| Total fees and other income |
181 | 111 | 205 | 262 | ||||||||||||
|
|
|
|
|
|
|
|
|
|||||||||
| Total investment income |
12,630 | 16,337 | 24,748 | 32,863 | ||||||||||||
|
|
|
|
|
|
|
|
|
|||||||||
| EXPENSES |
||||||||||||||||
| Management fees |
1,445 | 1,680 | 2,911 | 3,409 | ||||||||||||
| Performance-based incentive fees |
967 | 1,374 | 1,887 | 2,608 | ||||||||||||
| Interest and amortization of debt issuance costs |
4,230 | 5,365 | 8,528 | 11,091 | ||||||||||||
| Professional fees |
403 | 469 | 855 | 1,074 | ||||||||||||
| Administrative services expense |
450 | 361 | 861 | 717 | ||||||||||||
| Directors’ expense |
142 | 162 | 286 | 323 | ||||||||||||
| Other general and administrative expenses |
436 | 449 | 523 | 939 | ||||||||||||
|
|
|
|
|
|
|
|
|
|||||||||
| Total expenses |
8,073 | 9,860 | 15,851 | 20,161 | ||||||||||||
|
|
|
|
|
|
|
|
|
|||||||||
| NET INVESTMENT INCOME |
4,557 | 6,477 | 8,897 | 12,702 | ||||||||||||
|
|
|
|
|
|
|
|
|
|||||||||
| REALIZED AND UNREALIZED GAINS (LOSSES) ON INVESTMENTS |
||||||||||||||||
| Net realized gains (losses) from investment transactions: |
||||||||||||||||
|
Non-controlled/non-affiliated investments |
(9,648 | ) | (694 | ) | (9,729 | ) | (2,335 | ) | ||||||||
| Non-controlled affiliated investments |
— | — | (92 | ) | — | |||||||||||
| Controlled affiliated investments |
(6,192 | ) | (6,228 | ) | (6,192 | ) | (6,644 | ) | ||||||||
|
|
|
|
|
|
|
|
|
|||||||||
| Net realized gain (loss) on investments |
(15,840 | ) | (6,922 | ) | (16,013 | ) | (8,979 | ) | ||||||||
| Net change in unrealized appreciation (depreciation) on: | ||||||||||||||||
|
Non-controlled/non-affiliated investments |
3,390 | (10,163 | ) | 1,889 | (10,822 | ) | ||||||||||
| Non-controlled affiliated investments |
(3,014 | ) | (2,055 | ) | (4,154 | ) | (1,915 | ) | ||||||||
| Controlled affiliated investments |
6,287 | 6,252 | 5,013 | 6,842 | ||||||||||||
| Derivatives |
(35 | ) | — | (23 | ) | — | ||||||||||
|
|
|
|
|
|
|
|
|
|||||||||
| Net change in unrealized appreciation (depreciation) on investments |
6,628 | (5,966 | ) | 2,725 | (5,895 | ) | ||||||||||
|
|
|
|
|
|
|
|
|
|||||||||
| Tax (provision) benefit on realized and unrealized gains (losses) on investments |
137 | 78 | (209 | ) | 537 | |||||||||||
|
|
|
|
|
|
|
|
|
|||||||||
| Net realized and unrealized appreciation (depreciation) on investments, net of taxes |
(9,075 | ) | (12,810 | ) | (13,497 | ) | (14,337 | ) | ||||||||
|
|
|
|
|
|
|
|
|
|||||||||
| Net realized gain (loss) on extinguishment of debt |
— | (39 | ) | — | (252 | ) | ||||||||||
|
|
|
|
|
|
|
|
|
|||||||||
| NET INCREASE (DECREASE) IN NET ASSETS RESULTING FROM OPERATIONS |
$ | (4,518 | ) | $ | (6,372 | ) | $ | (4,600 | ) | $ | (1,887 | ) | ||||
|
|
|
|
|
|
|
|
|
|||||||||
| Net Increase (Decrease) In Net Assets Resulting from Operations per Common Share: |
||||||||||||||||
| Basic and Diluted: |
$ | (0.49 | ) | $ | (0.69 | ) | $ | (0.50 | ) | $ | (0.20 | ) | ||||
| Net Investment Income Per Common Share: |
||||||||||||||||
| Basic and Diluted: |
$ | 0.50 | $ | 0.70 | $ | 0.97 | $ | 1.36 | ||||||||
| Weighted Average Shares of Common Stock Outstanding — Basic and Diluted |
9,204,657 | 9,293,687 | 9,201,451 | 9,319,272 | ||||||||||||
| (1) | During the three months ended June 30, 2025 and 2024, the Company received $0.1 million and $0.1 million, respectively, of non-recurring fee income that was paid in-kind and included in this financial statement line item. During the six months ended June 30, 2025 and 2024, the Company received $0.3 million and $0.1 million, respectively, of non-recurring fee income that was paid in-kind and included in this financial statement line item. |