Second quarter 2025 results © 2 0 2 2 B r e a d F i n a n c i a l | C o n f i d e n t i a l & P r o p r i e t a r y 1 July 24, 2025 Exhibit 99.2
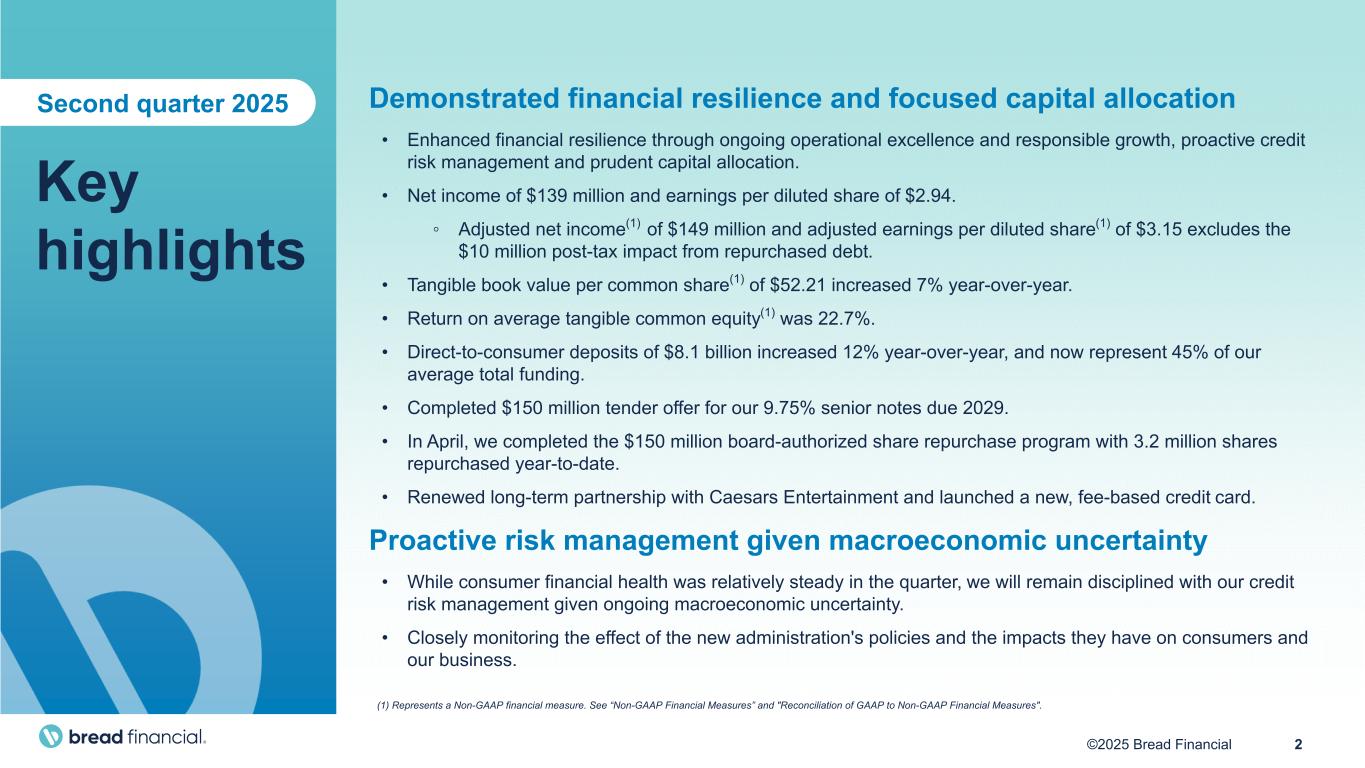
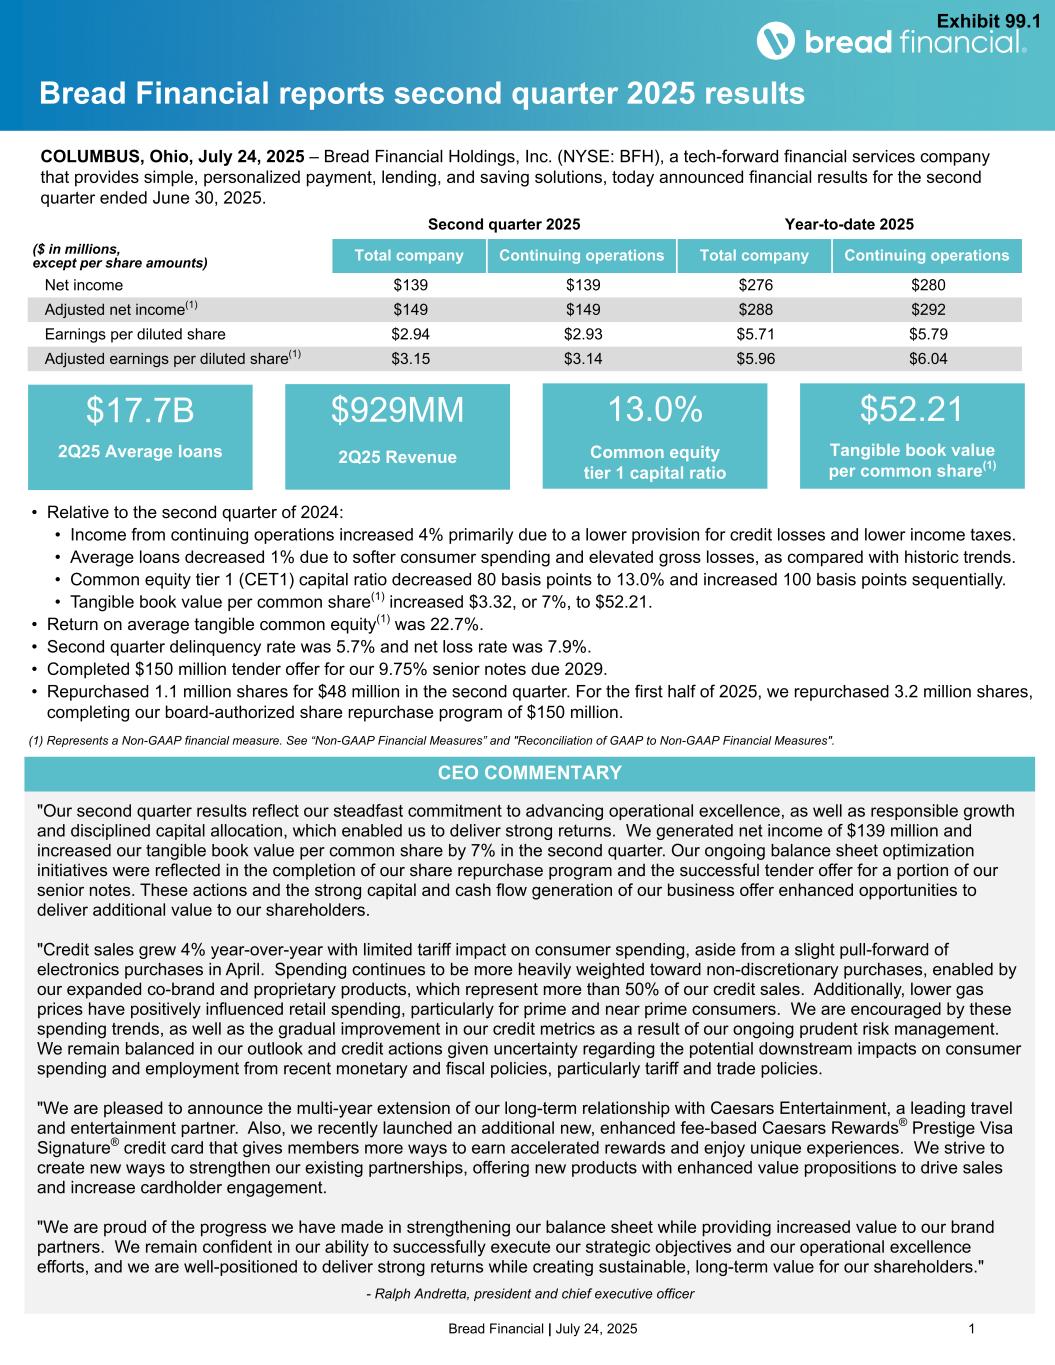
2©2025 Bread Financial Key highlights Second quarter 2025 Demonstrated financial resilience and focused capital allocation • Enhanced financial resilience through ongoing operational excellence and responsible growth, proactive credit risk management and prudent capital allocation. • Net income of $139 million and earnings per diluted share of $2.94. ◦ Adjusted net income(1) of $149 million and adjusted earnings per diluted share(1) of $3.15 excludes the $10 million post-tax impact from repurchased debt. • Tangible book value per common share(1) of $52.21 increased 7% year-over-year. • Return on average tangible common equity(1) was 22.7%. • Direct-to-consumer deposits of $8.1 billion increased 12% year-over-year, and now represent 45% of our average total funding. • Completed $150 million tender offer for our 9.75% senior notes due 2029. • In April, we completed the $150 million board-authorized share repurchase program with 3.2 million shares repurchased year-to-date. • Renewed long-term partnership with Caesars Entertainment and launched a new, fee-based credit card. Proactive risk management given macroeconomic uncertainty • While consumer financial health was relatively steady in the quarter, we will remain disciplined with our credit risk management given ongoing macroeconomic uncertainty. • Closely monitoring the effect of the new administration's policies and the impacts they have on consumers and our business. (1) Represents a Non-GAAP financial measure. See “Non-GAAP Financial Measures” and "Reconciliation of GAAP to Non-GAAP Financial Measures".
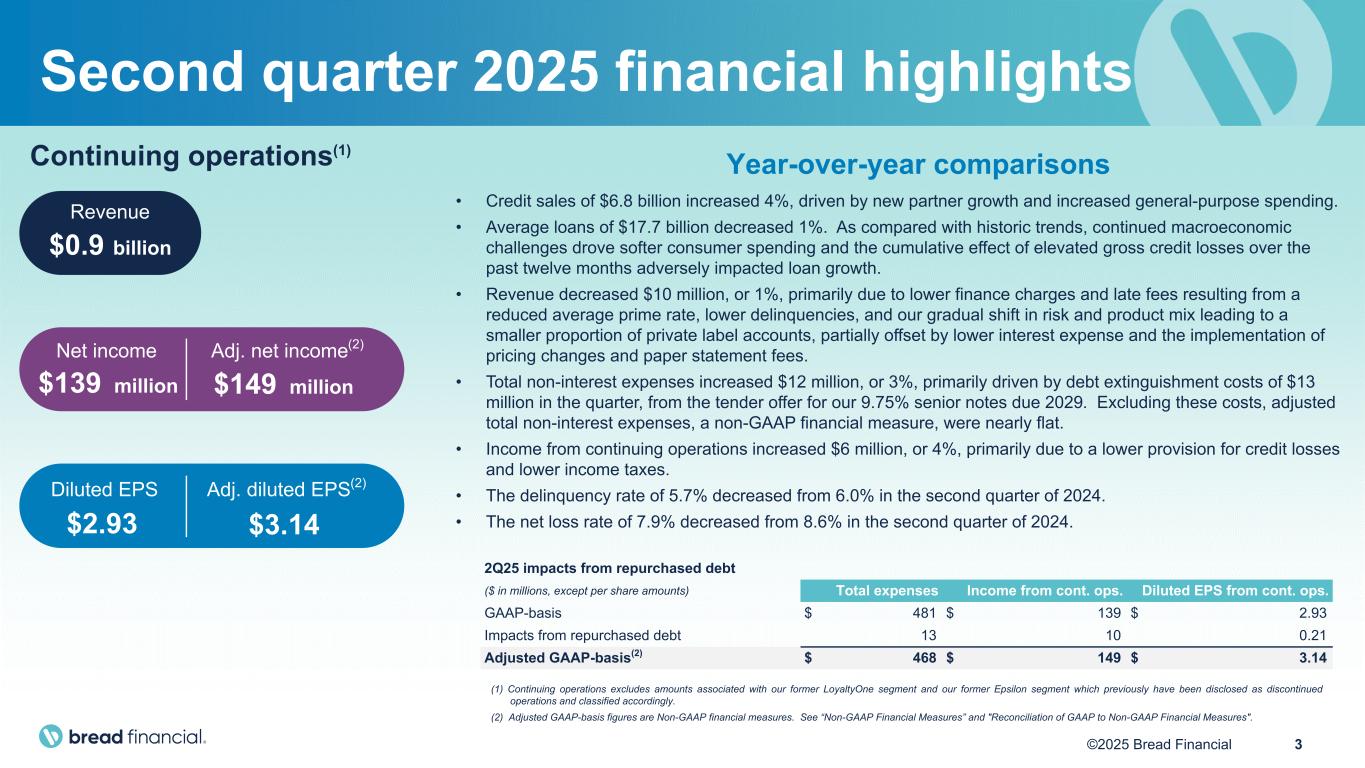
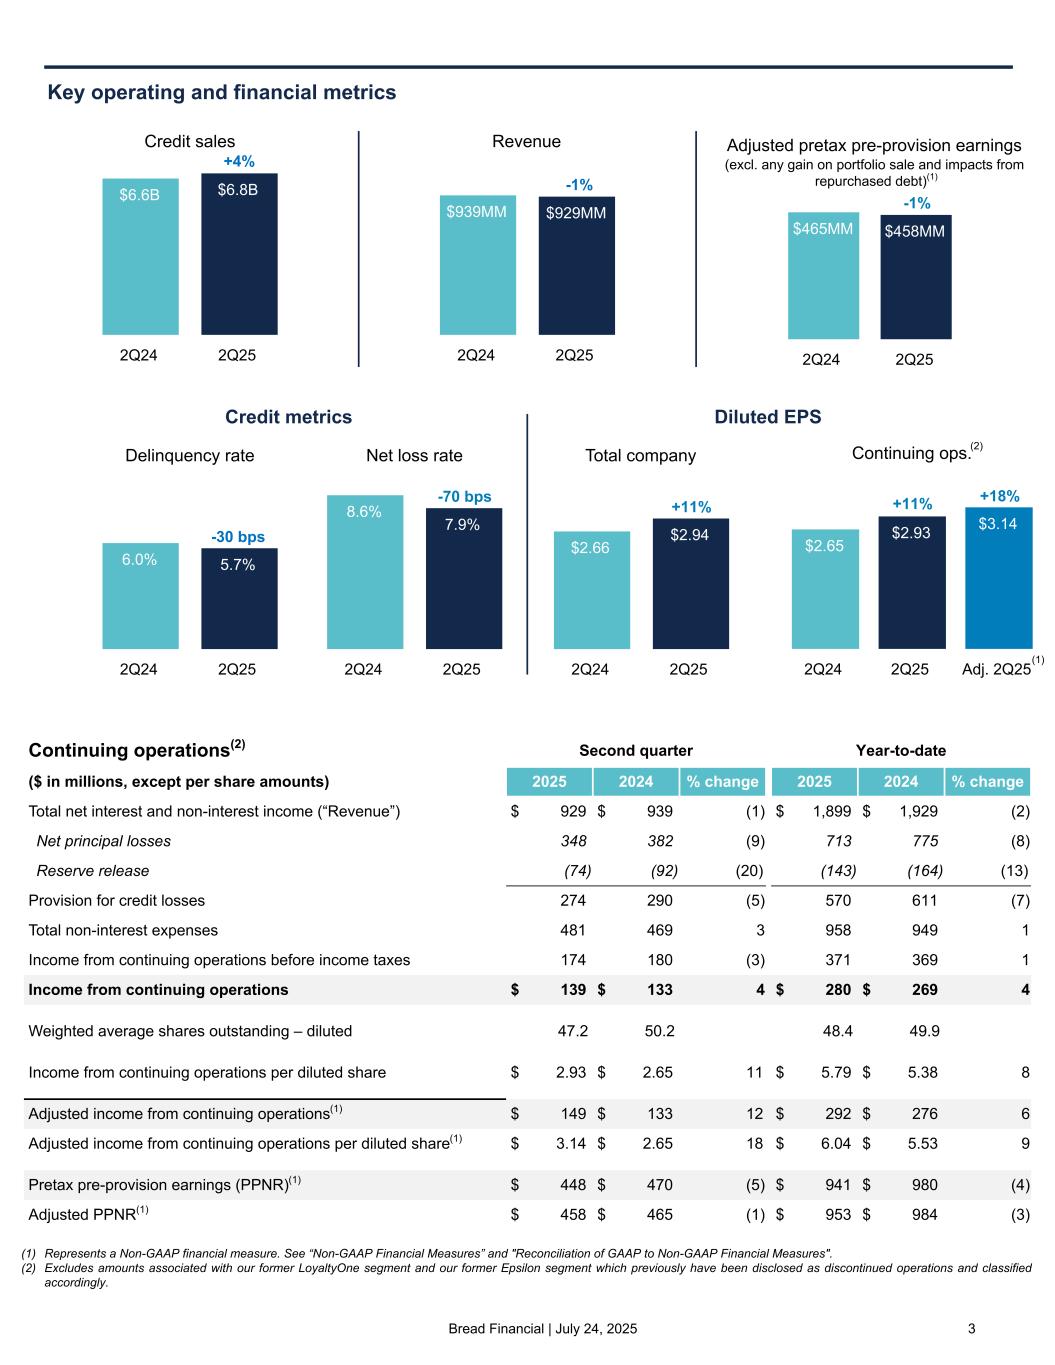
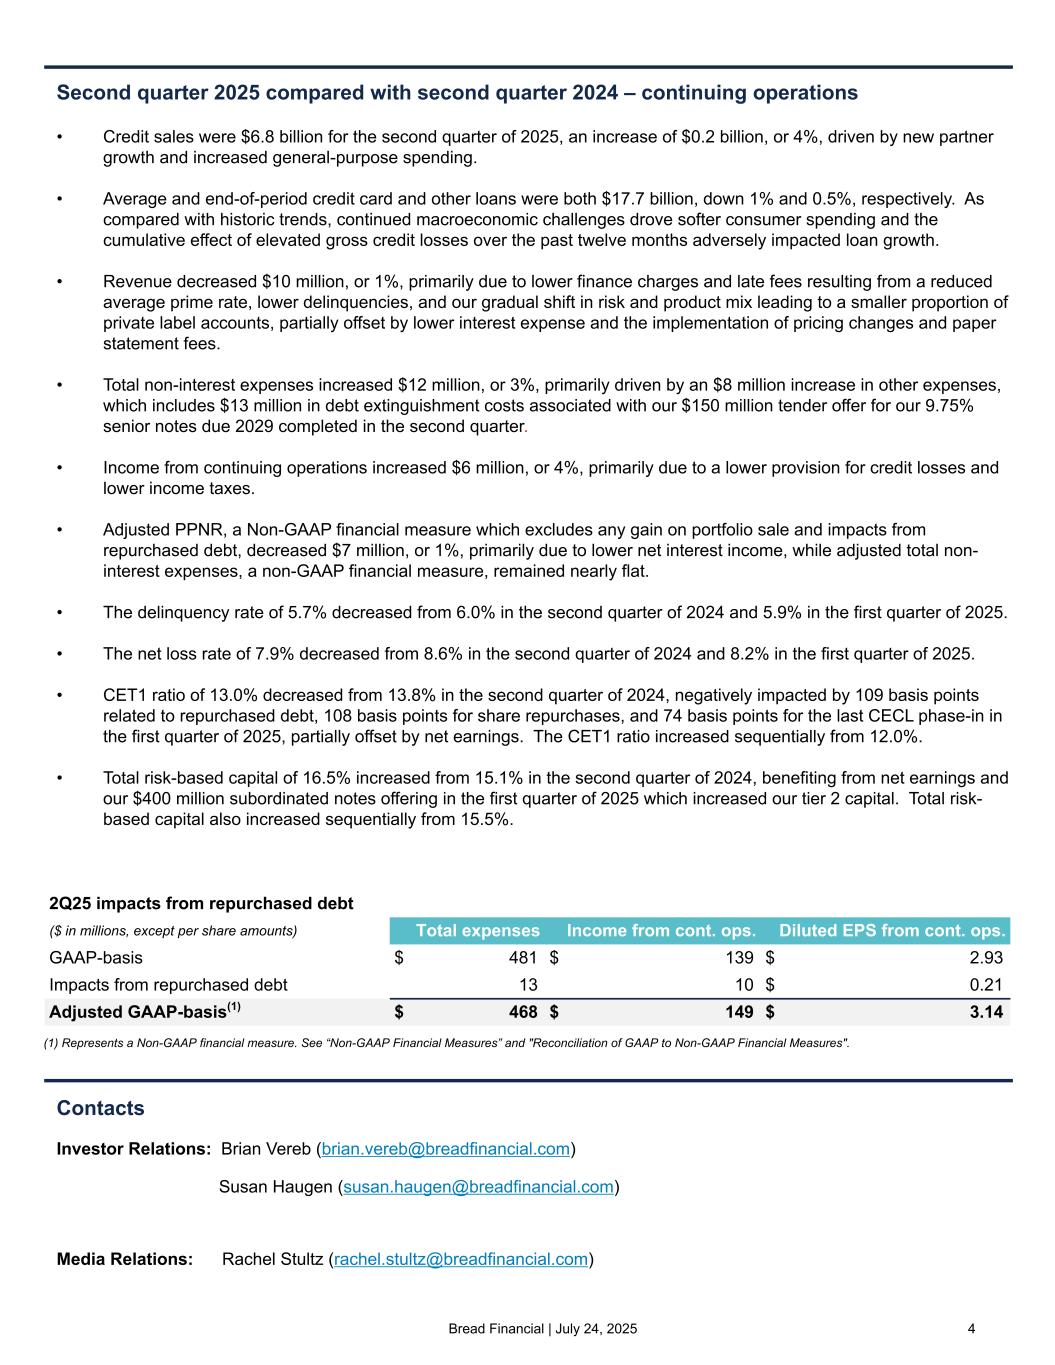
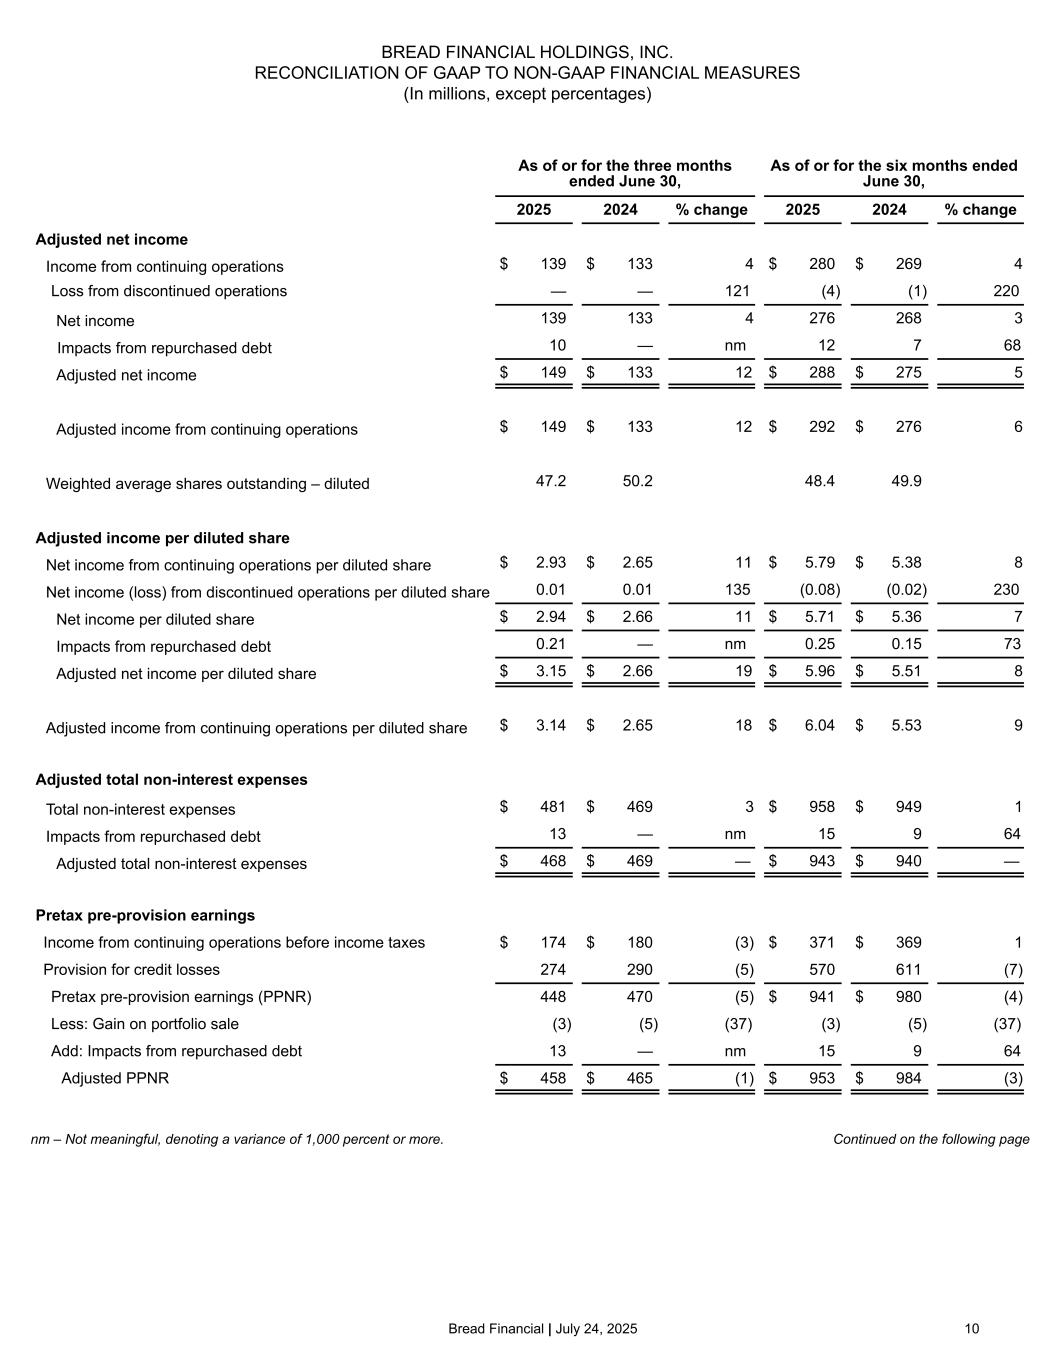
3©2025 Bread Financial $0.9 billion (1) Continuing operations excludes amounts associated with our former LoyaltyOne segment and our former Epsilon segment which previously have been disclosed as discontinued operations and classified accordingly. (2) Adjusted GAAP-basis figures are Non-GAAP financial measures. See “Non-GAAP Financial Measures” and "Reconciliation of GAAP to Non-GAAP Financial Measures". Continuing operations(1) Revenue 2Q25 impacts from repurchased debt ($ in millions, except per share amounts) Total expenses Income from cont. ops. Diluted EPS from cont. ops. GAAP-basis $ 481 $ 139 $ 2.93 Impacts from repurchased debt 13 10 0.21 Adjusted GAAP-basis(2) $ 468 $ 149 $ 3.14 Year-over-year comparisons • Credit sales of $6.8 billion increased 4%, driven by new partner growth and increased general-purpose spending. • Average loans of $17.7 billion decreased 1%. As compared with historic trends, continued macroeconomic challenges drove softer consumer spending and the cumulative effect of elevated gross credit losses over the past twelve months adversely impacted loan growth. • Revenue decreased $10 million, or 1%, primarily due to lower finance charges and late fees resulting from a reduced average prime rate, lower delinquencies, and our gradual shift in risk and product mix leading to a smaller proportion of private label accounts, partially offset by lower interest expense and the implementation of pricing changes and paper statement fees. • Total non-interest expenses increased $12 million, or 3%, primarily driven by debt extinguishment costs of $13 million in the quarter, from the tender offer for our 9.75% senior notes due 2029. Excluding these costs, adjusted total non-interest expenses, a non-GAAP financial measure, were nearly flat. • Income from continuing operations increased $6 million, or 4%, primarily due to a lower provision for credit losses and lower income taxes. • The delinquency rate of 5.7% decreased from 6.0% in the second quarter of 2024. • The net loss rate of 7.9% decreased from 8.6% in the second quarter of 2024. Diluted EPS Adj. diluted EPS(2) Net income Adj. net income(2) $139 million $149 million $3.14$2.93 Second quarter 2025 financial highlights
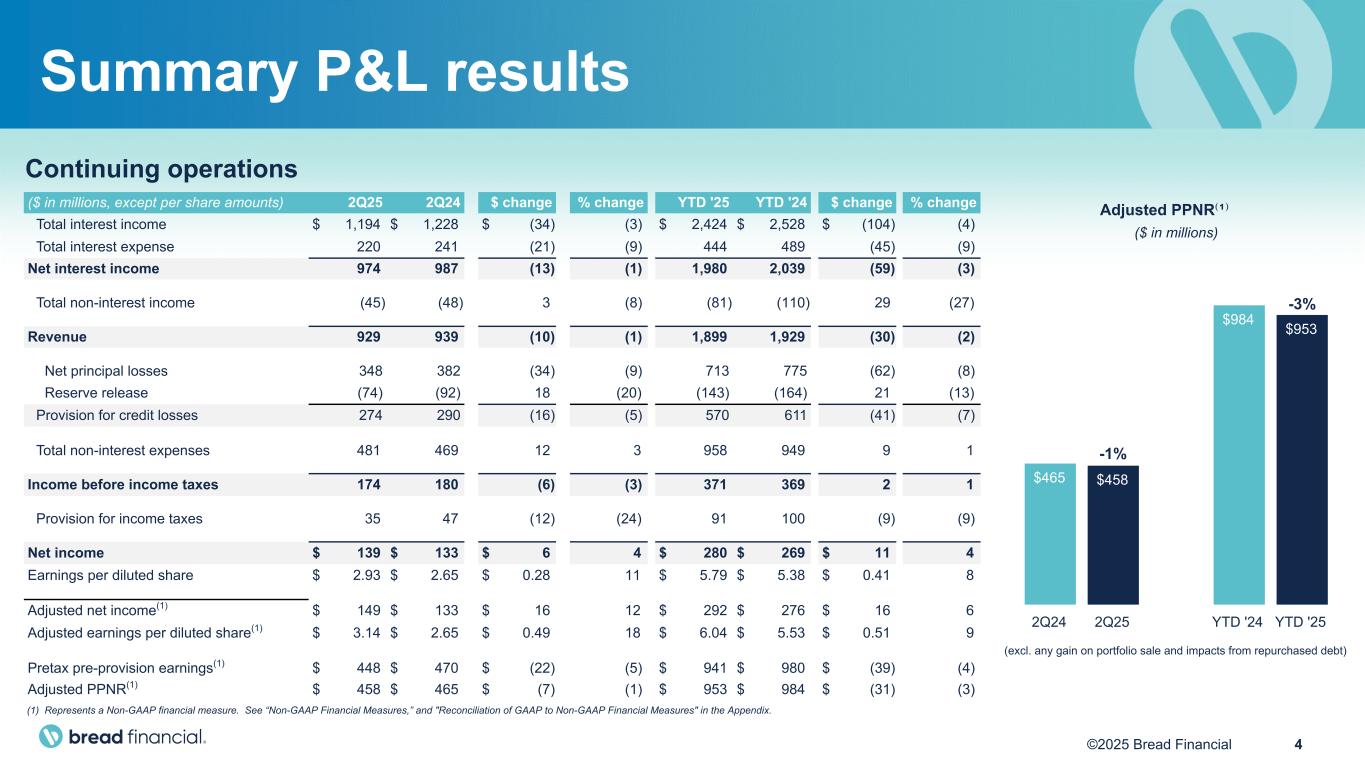
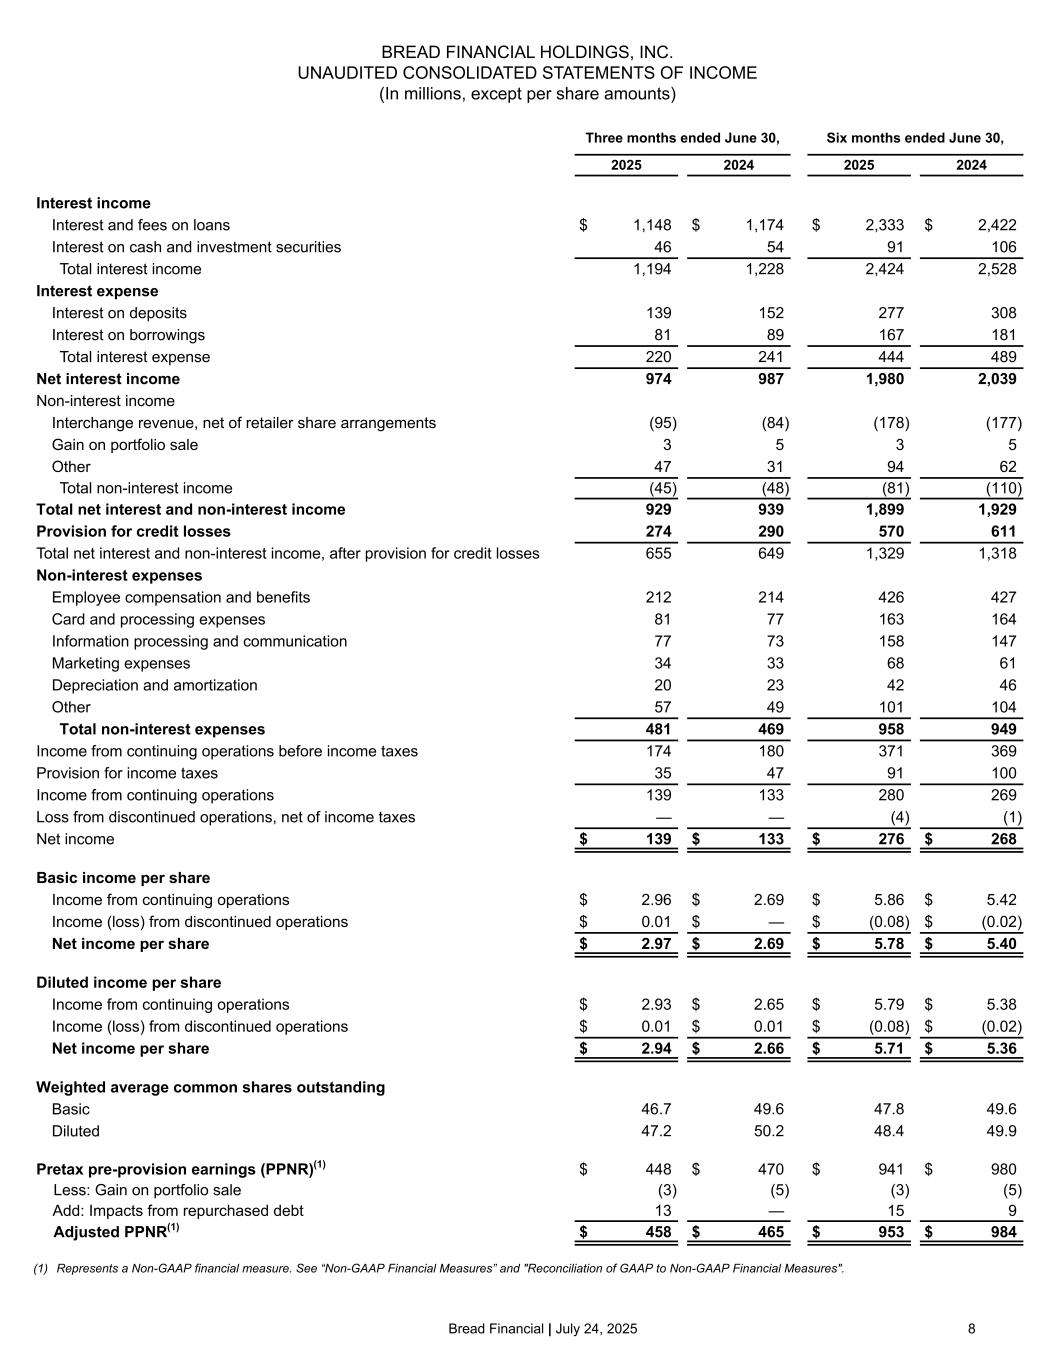
4©2025 Bread Financial ($ in millions, except per share amounts) 2Q25 2Q24 $ change % change YTD '25 YTD '24 $ change % change Total interest income $ 1,194 $ 1,228 $ (34) (3) $ 2,424 $ 2,528 $ (104) (4) Total interest expense 220 241 (21) (9) 444 489 (45) (9) Net interest income 974 987 (13) (1) 1,980 2,039 (59) (3) Total non-interest income (45) (48) 3 (8) (81) (110) 29 (27) Revenue 929 939 (10) (1) 1,899 1,929 (30) (2) Net principal losses 348 382 (34) (9) 713 775 (62) (8) Reserve release (74) (92) 18 (20) (143) (164) 21 (13) Provision for credit losses 274 290 (16) (5) 570 611 (41) (7) Total non-interest expenses 481 469 12 3 958 949 9 1 Income before income taxes 174 180 (6) (3) 371 369 2 1 Provision for income taxes 35 47 (12) (24) 91 100 (9) (9) Net income $ 139 $ 133 $ 6 4 $ 280 $ 269 $ 11 4 Earnings per diluted share $ 2.93 $ 2.65 $ 0.28 11 $ 5.79 $ 5.38 $ 0.41 8 Adjusted net income(1) $ 149 $ 133 $ 16 12 $ 292 $ 276 $ 16 6 Adjusted earnings per diluted share(1) $ 3.14 $ 2.65 $ 0.49 18 $ 6.04 $ 5.53 $ 0.51 9 Pretax pre-provision earnings(1) $ 448 $ 470 $ (22) (5) $ 941 $ 980 $ (39) (4) Adjusted PPNR(1) $ 458 $ 465 $ (7) (1) $ 953 $ 984 $ (31) (3) Adjusted PPNR⁽¹⁾ $465 $458 $984 $953 2Q24 2Q25 YTD '24 YTD '25 -1% ($ in millions) Summary P&L results Continuing operations (1) Represents a Non-GAAP financial measure. See “Non-GAAP Financial Measures,” and "Reconciliation of GAAP to Non-GAAP Financial Measures" in the Appendix. -3% (excl. any gain on portfolio sale and impacts from repurchased debt)
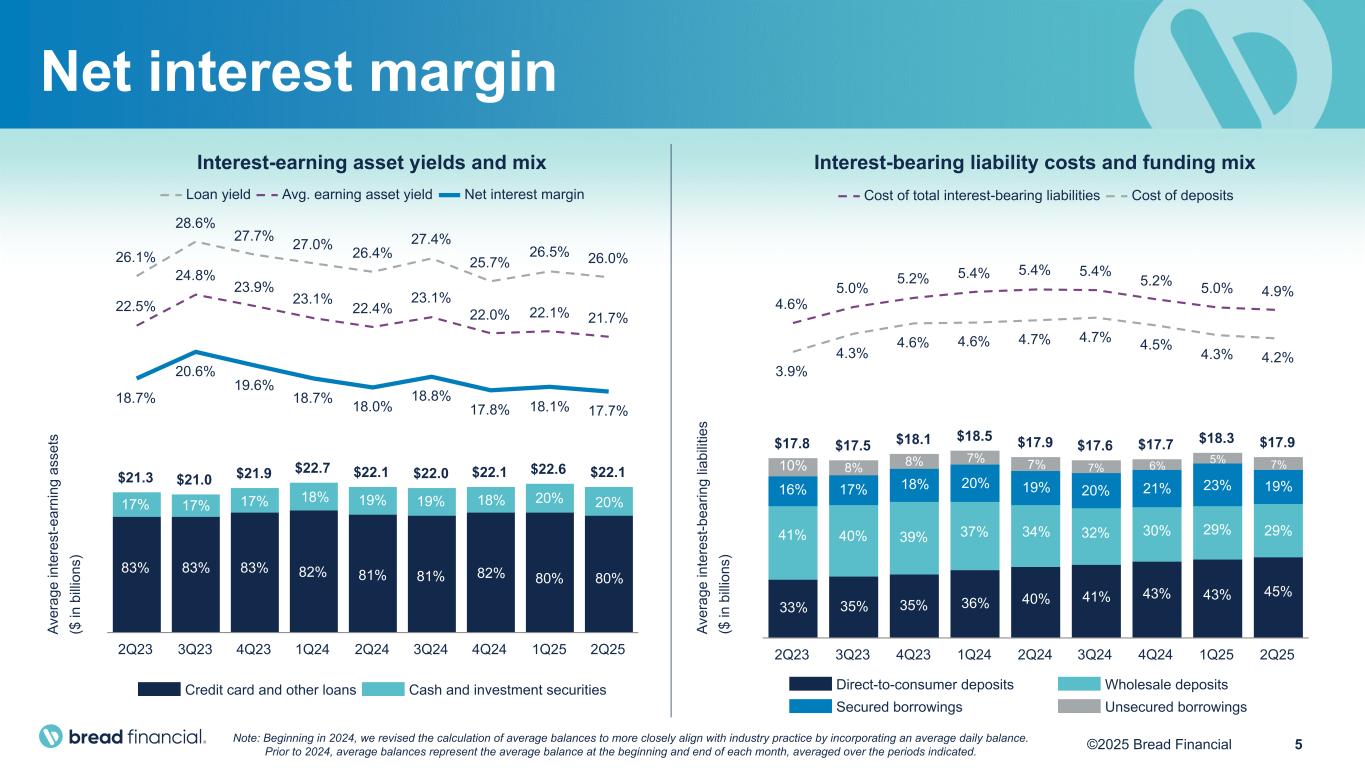
5©2025 Bread Financial $17.8 $17.5 $18.1 $18.5 $17.9 $17.6 $17.7 $18.3 $17.9 Direct-to-consumer deposits Wholesale deposits Secured borrowings Unsecured borrowings 2Q23 3Q23 4Q23 1Q24 2Q24 3Q24 4Q24 1Q25 2Q25 $21.3 $21.0 $21.9 $22.7 $22.1 $22.0 $22.1 $22.6 $22.1 Credit card and other loans Cash and investment securities 2Q23 3Q23 4Q23 1Q24 2Q24 3Q24 4Q24 1Q25 2Q25 Av er ag e in te re st -b ea rin g lia bi lit ie s ($ in b ill io ns ) Av er ag e in te re st -e ar ni ng a ss et s ($ in b ill io ns ) Interest-earning asset yields and mix 26.1% 28.6% 27.7% 27.0% 26.4% 27.4% 25.7% 26.5% 26.0% 22.5% 24.8% 23.9% 23.1% 22.4% 23.1% 22.0% 22.1% 21.7% 18.7% 20.6% 19.6% 18.7% 18.0% 18.8% 17.8% 18.1% 17.7% Loan yield Avg. earning asset yield Net interest margin Interest-bearing liability costs and funding mix 4.6% 5.0% 5.2% 5.4% 5.4% 5.4% 5.2% 5.0% 4.9% 3.9% 4.3% 4.6% 4.6% 4.7% 4.7% 4.5% 4.3% 4.2% Cost of total interest-bearing liabilities Cost of deposits Net interest margin 83% 83% 83% 82% 81% 81% 82% 80% 80% 17% 17% 17% 18% 19% 19% 18% 20% 20% 16% 17% 18% 20% 19% 20% 21% 23% 19% 10% 8% 8% 7% 7% 7% 6% 5% 7% 33% 35% 35% 36% 40% 41% 43% 43% 45% 41% 40% 39% 37% 34% 32% 30% 29% 29% Note: Beginning in 2024, we revised the calculation of average balances to more closely align with industry practice by incorporating an average daily balance. Prior to 2024, average balances represent the average balance at the beginning and end of each month, averaged over the periods indicated.
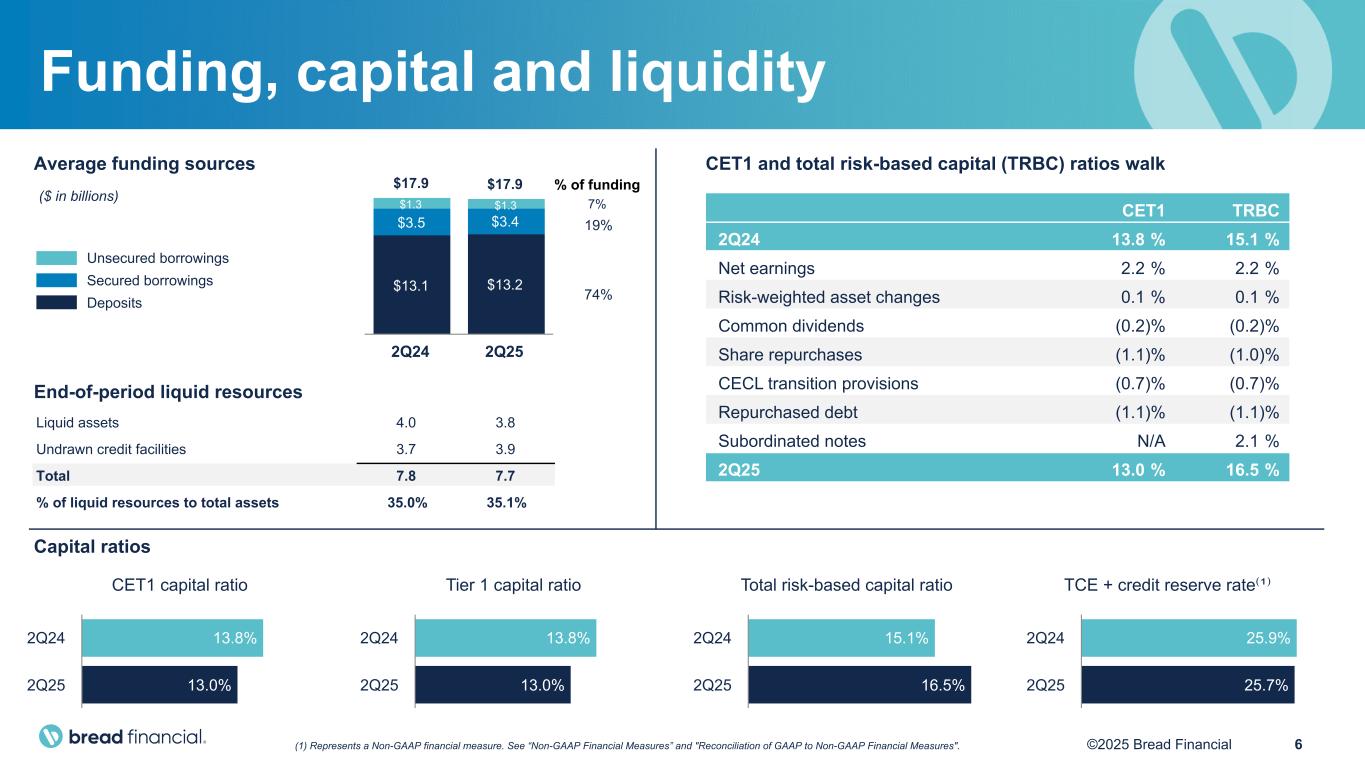
6©2025 Bread Financial Funding, capital and liquidity $17.9 $17.9 $13.1 $13.2 $3.5 $3.4 $1.3 $1.3 2Q24 2Q25 % of funding 7% 19% 74% CET1 TRBC 2Q24 13.8 % 15.1 % Net earnings 2.2 % 2.2 % Risk-weighted asset changes 0.1 % 0.1 % Common dividends (0.2) % (0.2) % Share repurchases (1.1) % (1.0) % CECL transition provisions (0.7) % (0.7) % Repurchased debt (1.1) % (1.1) % Subordinated notes N/A 2.1 % 2Q25 13.0 % 16.5 % CET1 capital ratio 13.8% 13.0% 2Q24 2Q25 Tier 1 capital ratio 13.8% 13.0% 2Q24 2Q25 TCE + credit reserve rate⁽¹⁾ 25.9% 25.7% 2Q24 2Q25 Total risk-based capital ratio 15.1% 16.5% 2Q24 2Q25 CET1 and total risk-based capital (TRBC) ratios walk Capital ratios Average funding sources Liquid assets 4.0 3.8 Undrawn credit facilities 3.7 3.9 Total 7.8 7.7 % of liquid resources to total assets 35.0% 35.1% (1) Represents a Non-GAAP financial measure. See “Non-GAAP Financial Measures” and "Reconciliation of GAAP to Non-GAAP Financial Measures". ($ in billions) Unsecured borrowings Secured borrowings Deposits End-of-period liquid resources
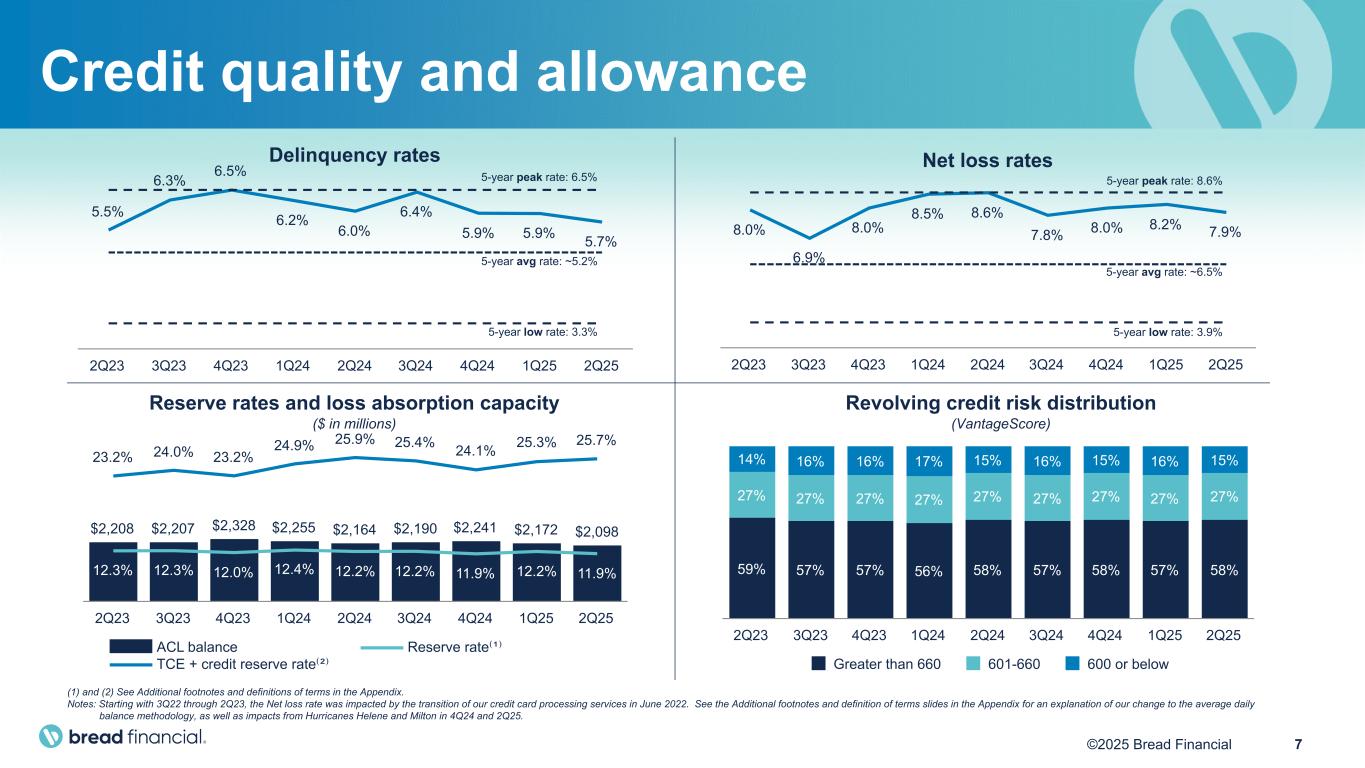
7©2025 Bread Financial $2,208 $2,207 $2,328 $2,255 $2,164 $2,190 $2,241 $2,172 $2,098 12.3% 12.3% 12.0% 12.4% 12.2% 12.2% 11.9% 12.2% 11.9% 23.2% 24.0% 23.2% 24.9% 25.9% 25.4% 24.1% 25.3% 25.7% ACL balance Reserve rate⁽¹⁾ TCE + credit reserve rate⁽²⁾ 2Q23 3Q23 4Q23 1Q24 2Q24 3Q24 4Q24 1Q25 2Q25 Net loss rates 8.0% 6.9% 8.0% 8.5% 8.6% 7.8% 8.0% 8.2% 7.9% 2Q23 3Q23 4Q23 1Q24 2Q24 3Q24 4Q24 1Q25 2Q25 Delinquency rates 5.5% 6.3% 6.5% 6.2% 6.0% 6.4% 5.9% 5.9% 5.7% 2Q23 3Q23 4Q23 1Q24 2Q24 3Q24 4Q24 1Q25 2Q25 5-year peak rate: 8.6% 5-year low rate: 3.9% 5-year avg rate: ~6.5% 5-year peak rate: 6.5% 5-year avg rate: ~5.2% 5-year low rate: 3.3% 59% 57% 57% 56% 58% 57% 58% 57% 58% 27% 27% 27% 27% 27% 27% 27% 27% 27% 14% 16% 16% 17% 15% 16% 15% 16% 15% Greater than 660 601-660 600 or below 2Q23 3Q23 4Q23 1Q24 2Q24 3Q24 4Q24 1Q25 2Q25 Reserve rates and loss absorption capacity ($ in millions) Revolving credit risk distribution (VantageScore) Credit quality and allowance (1) and (2) See Additional footnotes and definitions of terms in the Appendix. Notes: Starting with 3Q22 through 2Q23, the Net loss rate was impacted by the transition of our credit card processing services in June 2022. See the Additional footnotes and definition of terms slides in the Appendix for an explanation of our change to the average daily balance methodology, as well as impacts from Hurricanes Helene and Milton in 4Q24 and 2Q25.
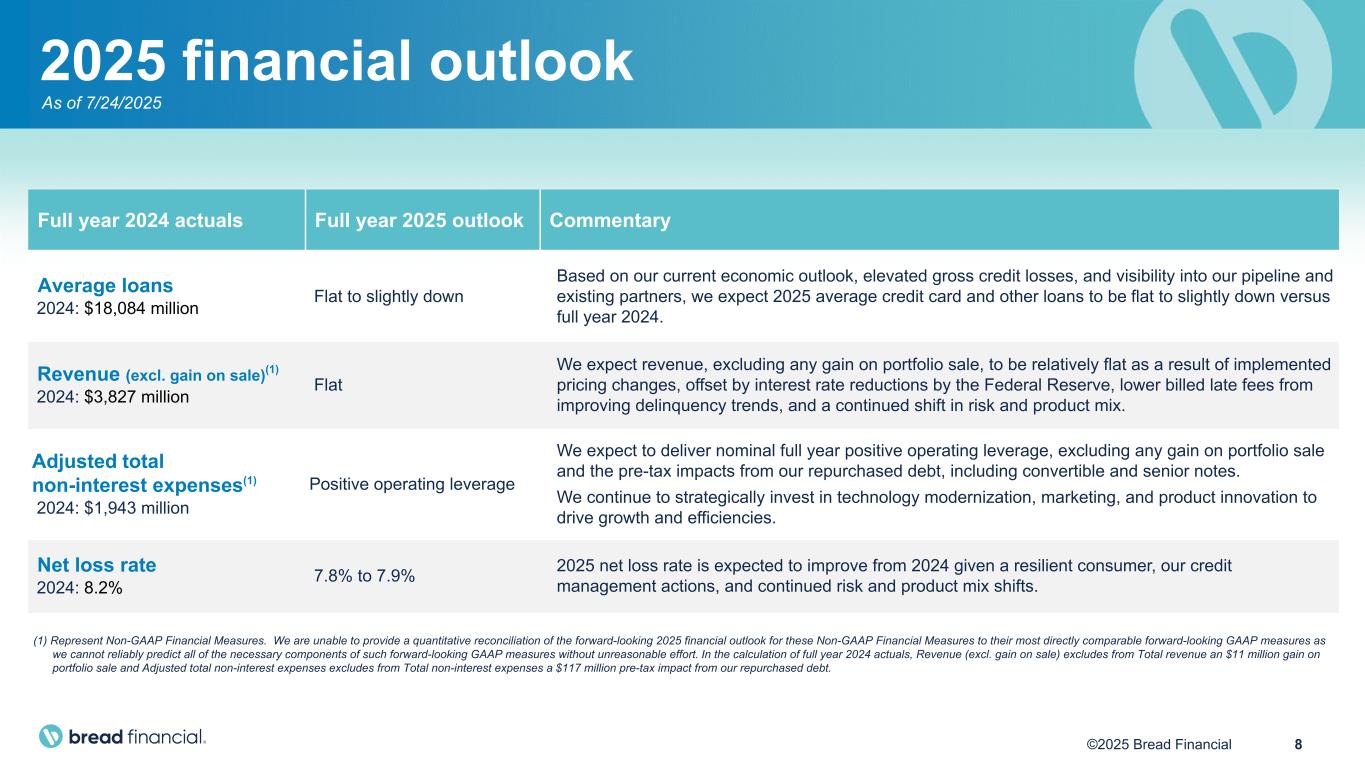
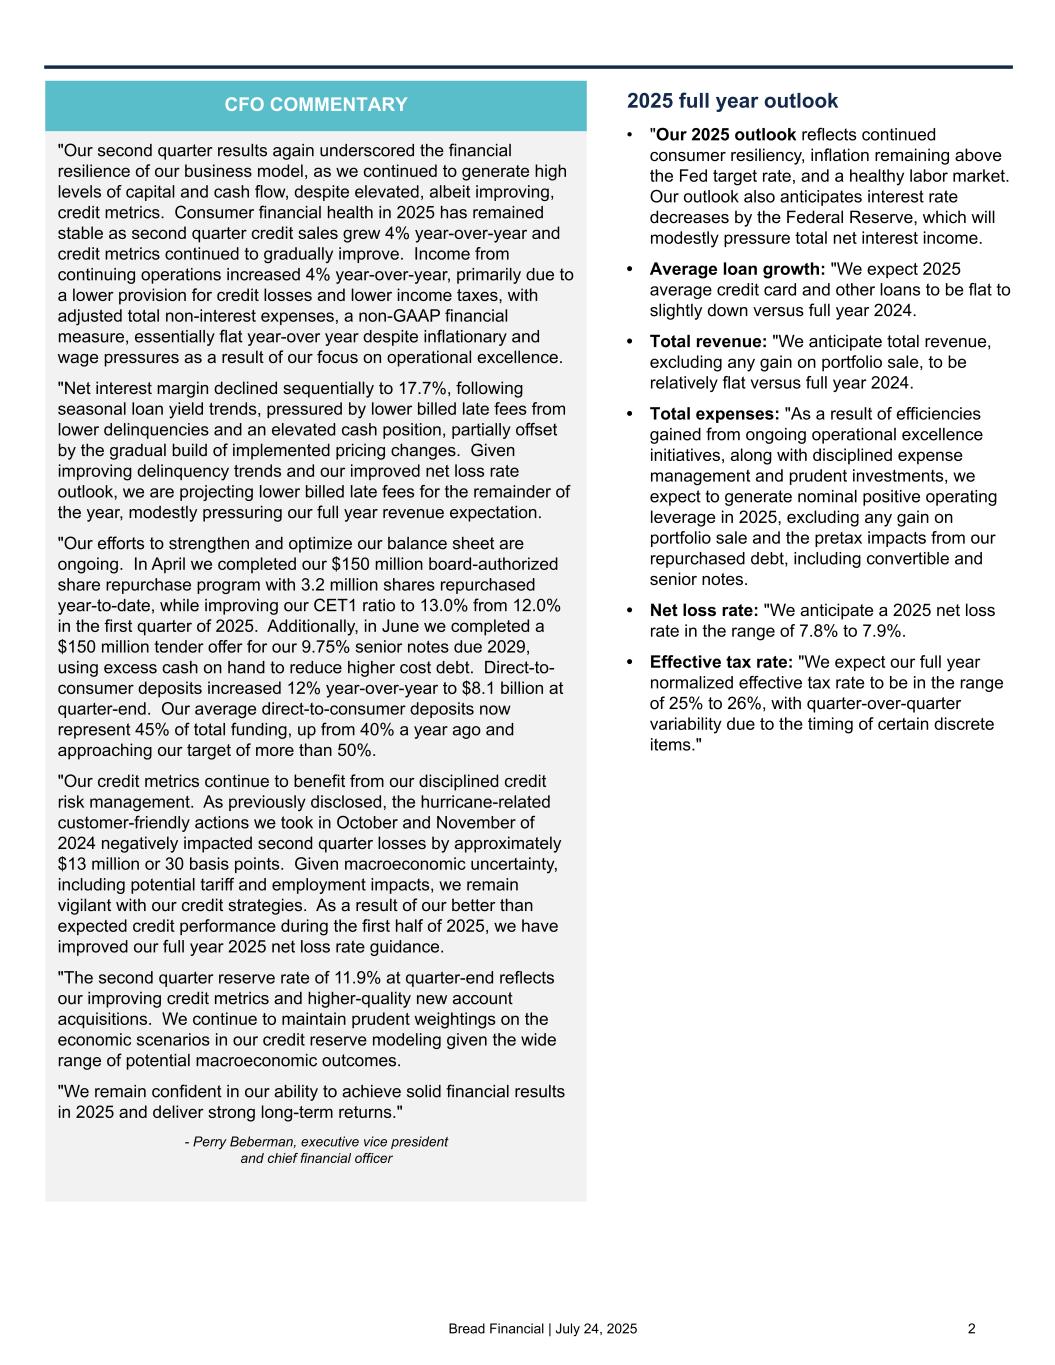
8©2025 Bread Financial 2025 financial outlook Full year 2024 actuals Full year 2025 outlook Commentary Average loans 2024: $18,084 million Flat to slightly down Based on our current economic outlook, elevated gross credit losses, and visibility into our pipeline and existing partners, we expect 2025 average credit card and other loans to be flat to slightly down versus full year 2024. Revenue (excl. gain on sale)(1) 2024: $3,827 million Flat We expect revenue, excluding any gain on portfolio sale, to be relatively flat as a result of implemented pricing changes, offset by interest rate reductions by the Federal Reserve, lower billed late fees from improving delinquency trends, and a continued shift in risk and product mix. Adjusted total non-interest expenses(1) 2024: $1,943 million Positive operating leverage We expect to deliver nominal full year positive operating leverage, excluding any gain on portfolio sale and the pre-tax impacts from our repurchased debt, including convertible and senior notes. We continue to strategically invest in technology modernization, marketing, and product innovation to drive growth and efficiencies. Net loss rate 2024: 8.2% 7.8% to 7.9% 2025 net loss rate is expected to improve from 2024 given a resilient consumer, our credit management actions, and continued risk and product mix shifts. (1) Represent Non-GAAP Financial Measures. We are unable to provide a quantitative reconciliation of the forward-looking 2025 financial outlook for these Non-GAAP Financial Measures to their most directly comparable forward-looking GAAP measures as we cannot reliably predict all of the necessary components of such forward-looking GAAP measures without unreasonable effort. In the calculation of full year 2024 actuals, Revenue (excl. gain on sale) excludes from Total revenue an $11 million gain on portfolio sale and Adjusted total non-interest expenses excludes from Total non-interest expenses a $117 million pre-tax impact from our repurchased debt. As of 7/24/2025
9©2025 Bread Financial Appendix © 2 0 2 2 B r e a d F i n a n c i a l | C o n f i d e n t i a l & P r o p r i e t a r y 9
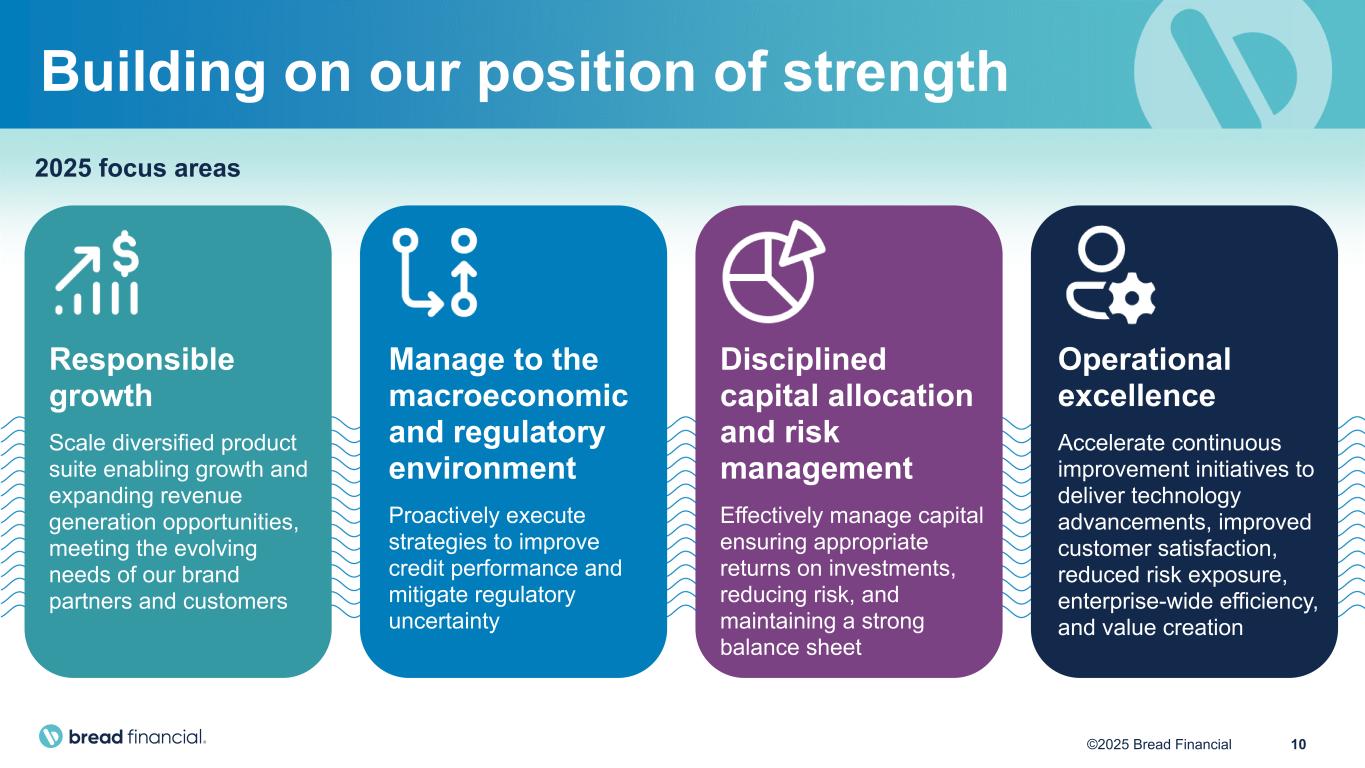
10©2025 Bread Financial Building on our position of strength Manage to the macroeconomic and regulatory environment Proactively execute strategies to improve credit performance and mitigate regulatory uncertainty Operational excellence Accelerate continuous improvement initiatives to deliver technology advancements, improved customer satisfaction, reduced risk exposure, enterprise-wide efficiency, and value creation Disciplined capital allocation and risk management Effectively manage capital ensuring appropriate returns on investments, reducing risk, and maintaining a strong balance sheet Responsible growth Scale diversified product suite enabling growth and expanding revenue generation opportunities, meeting the evolving needs of our brand partners and customers 2025 focus areas
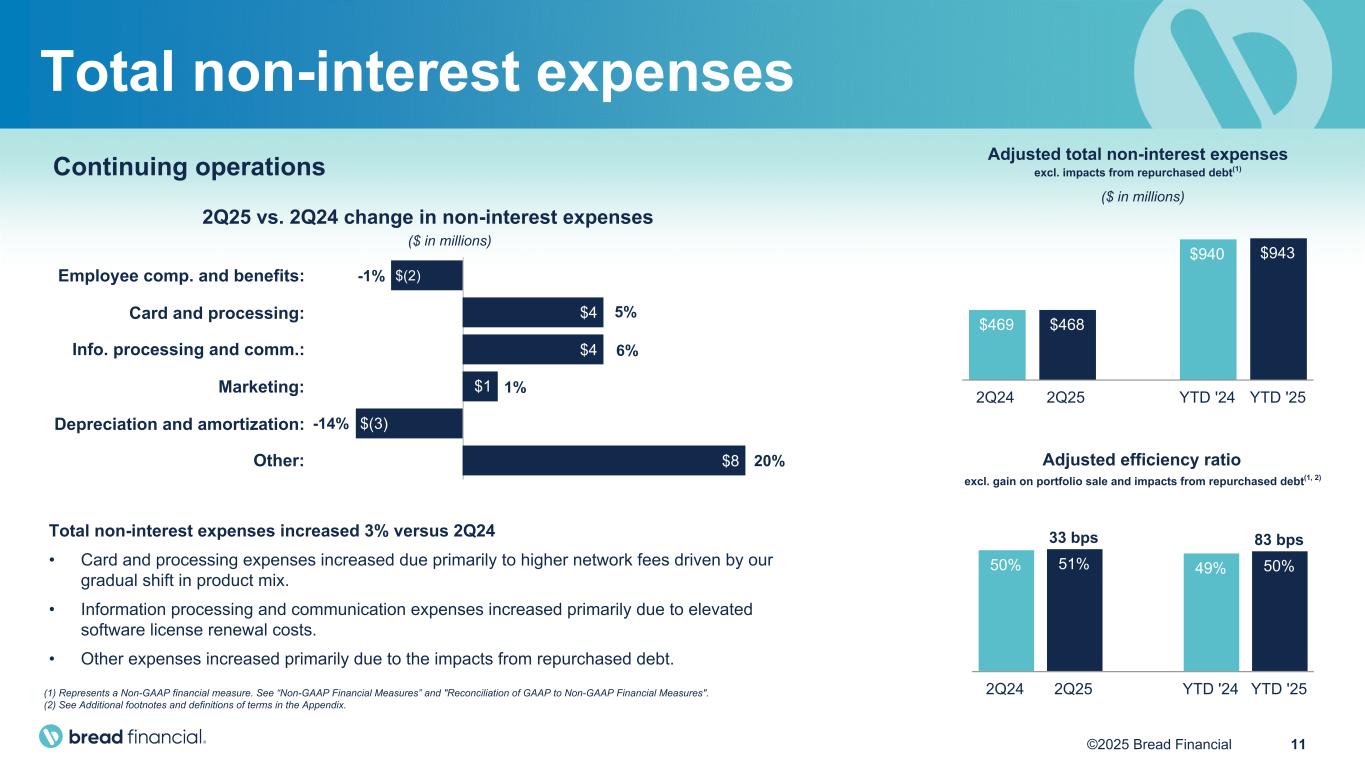
11©2025 Bread Financial Continuing operations Total non-interest expenses increased 3% versus 2Q24 • Card and processing expenses increased due primarily to higher network fees driven by our gradual shift in product mix. • Information processing and communication expenses increased primarily due to elevated software license renewal costs. • Other expenses increased primarily due to the impacts from repurchased debt. Adjusted efficiency ratio 50% 51% 49% 50% 2Q24 2Q25 YTD '24 YTD '25 Adjusted total non-interest expenses $469 $468 $940 $943 2Q24 2Q25 YTD '24 YTD '25 Total non-interest expenses $(2) $4 $4 $1 $(3) $8 Employee comp. and benefits: Card and processing: Info. processing and comm.: Marketing: Depreciation and amortization: Other: -1% 5% 6% 1% -14% 20% 2Q25 vs. 2Q24 change in non-interest expenses (1) Represents a Non-GAAP financial measure. See “Non-GAAP Financial Measures” and "Reconciliation of GAAP to Non-GAAP Financial Measures". (2) See Additional footnotes and definitions of terms in the Appendix. ($ in millions) 33 bps ($ in millions) 83 bps excl. impacts from repurchased debt(1) excl. gain on portfolio sale and impacts from repurchased debt(1, 2)
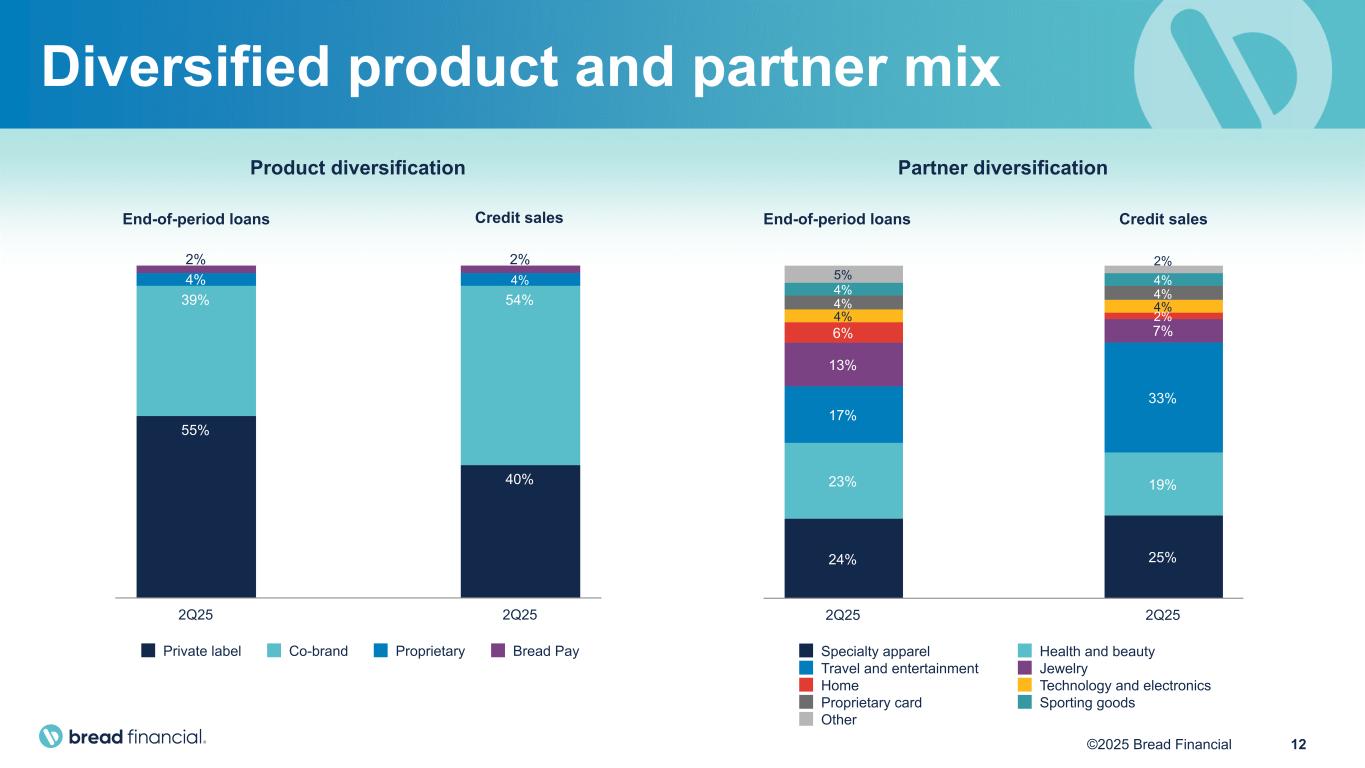
12©2025 Bread Financial Diversified product and partner mix Product diversification 55% 40% 39% 54% 4% 4% 2% 2% Private label Co-brand Proprietary Bread Pay 2Q25 2Q25 Credit salesEnd-of-period loans Partner diversification 24% 25% 23% 19% 17% 33% 13% 7%6% 2%4% 4%4% 4%4% 4%5% 2% Specialty apparel Health and beauty Travel and entertainment Jewelry Home Technology and electronics Proprietary card Sporting goods Other 2Q25 2Q25 Credit salesEnd-of-period loans
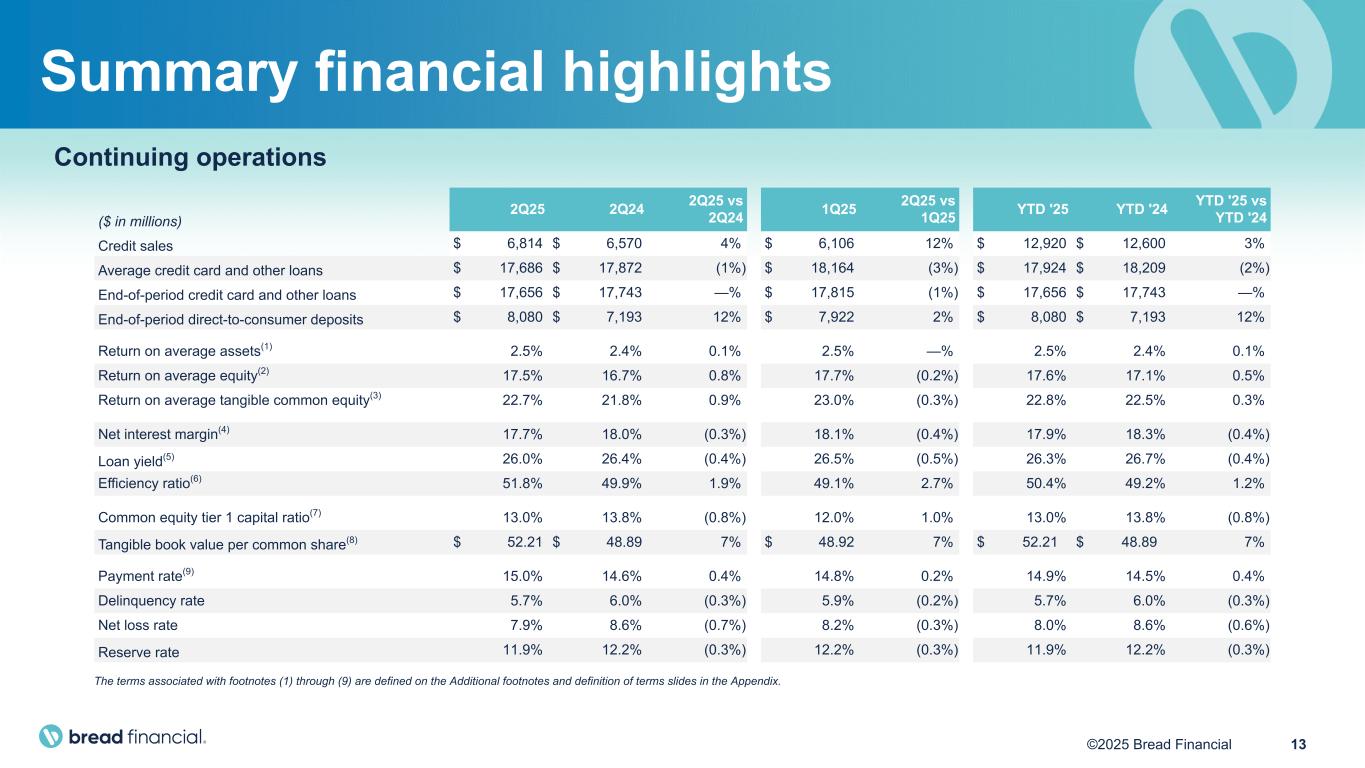
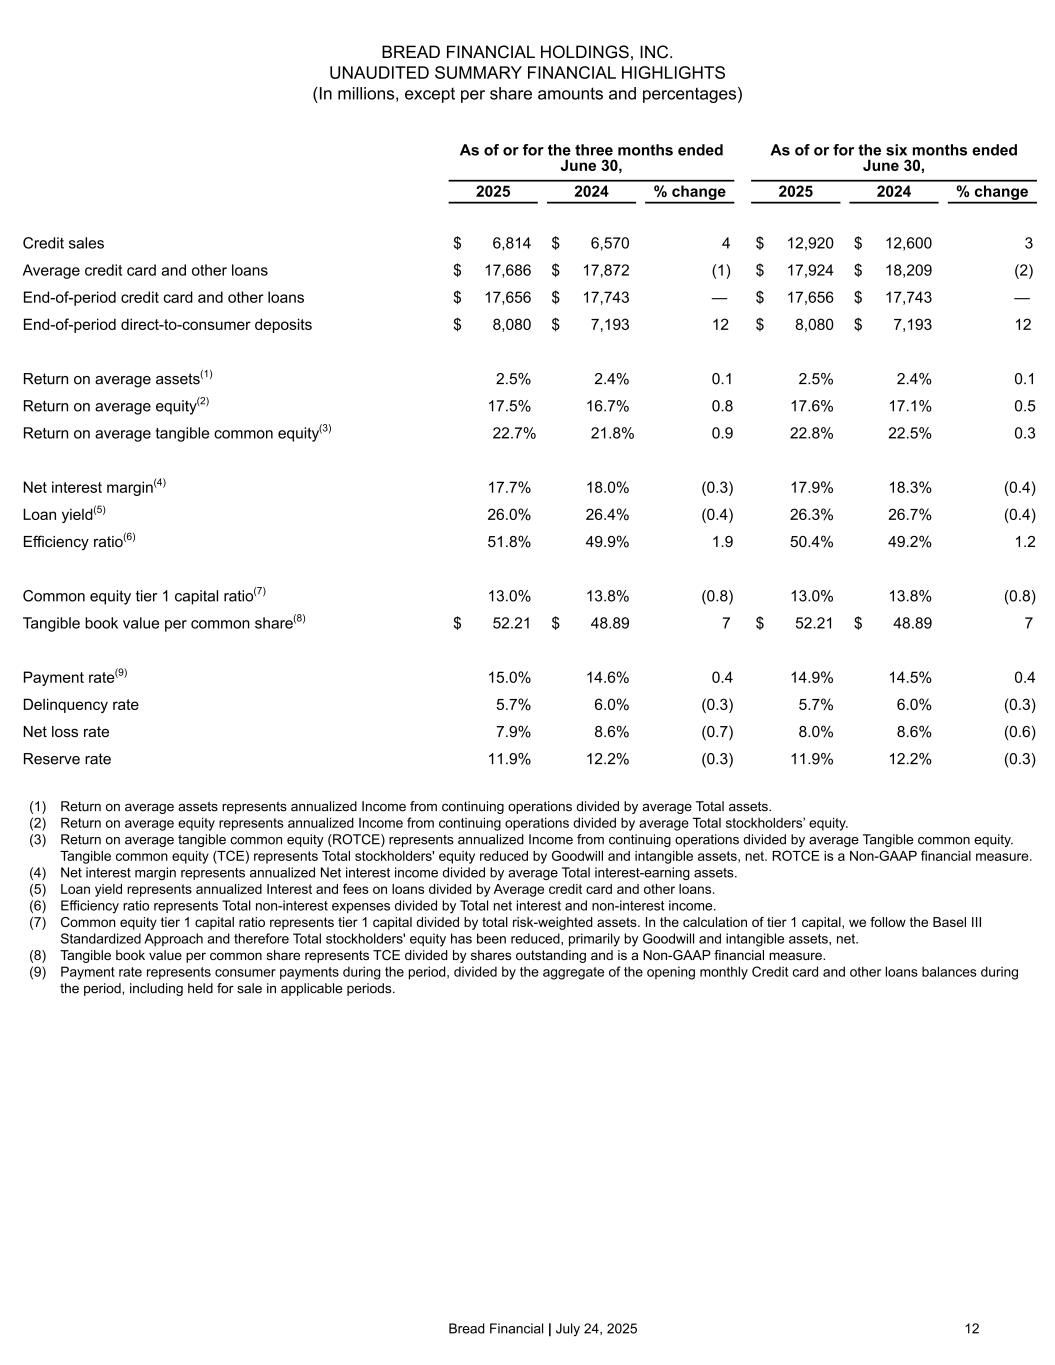
13©2025 Bread Financial Continuing operations ($ in millions) 2Q25 2Q24 2Q25 vs 2Q24 1Q25 2Q25 vs 1Q25 YTD '25 YTD '24 YTD '25 vs YTD '24 Credit sales $ 6,814 $ 6,570 4% $ 6,106 12% $ 12,920 $ 12,600 3% Average credit card and other loans $ 17,686 $ 17,872 (1%) $ 18,164 (3%) $ 17,924 $ 18,209 (2%) End-of-period credit card and other loans $ 17,656 $ 17,743 —% $ 17,815 (1%) $ 17,656 $ 17,743 —% End-of-period direct-to-consumer deposits $ 8,080 $ 7,193 12% $ 7,922 2% $ 8,080 $ 7,193 12% Return on average assets(1) 2.5% 2.4% 0.1% 2.5% —% 2.5% 2.4% 0.1% Return on average equity(2) 17.5% 16.7% 0.8% 17.7% (0.2%) 17.6% 17.1% 0.5% Return on average tangible common equity(3) 22.7% 21.8% 0.9% 23.0% (0.3%) 22.8% 22.5% 0.3% Net interest margin(4) 17.7% 18.0% (0.3%) 18.1% (0.4%) 17.9% 18.3% (0.4%) Loan yield(5) 26.0% 26.4% (0.4%) 26.5% (0.5%) 26.3% 26.7% (0.4%) Efficiency ratio(6) 51.8% 49.9% 1.9% 49.1% 2.7% 50.4% 49.2% 1.2% Common equity tier 1 capital ratio(7) 13.0% 13.8% (0.8%) 12.0% 1.0% 13.0% 13.8% (0.8%) Tangible book value per common share(8) $ 52.21 $ 48.89 7% $ 48.92 7% $ 52.21 $ 48.89 7% Payment rate(9) 15.0% 14.6% 0.4% 14.8% 0.2% 14.9% 14.5% 0.4% Delinquency rate 5.7% 6.0% (0.3%) 5.9% (0.2%) 5.7% 6.0% (0.3%) Net loss rate 7.9% 8.6% (0.7%) 8.2% (0.3%) 8.0% 8.6% (0.6%) Reserve rate 11.9% 12.2% (0.3%) 12.2% (0.3%) 11.9% 12.2% (0.3%) The terms associated with footnotes (1) through (9) are defined on the Additional footnotes and definition of terms slides in the Appendix. Summary financial highlights
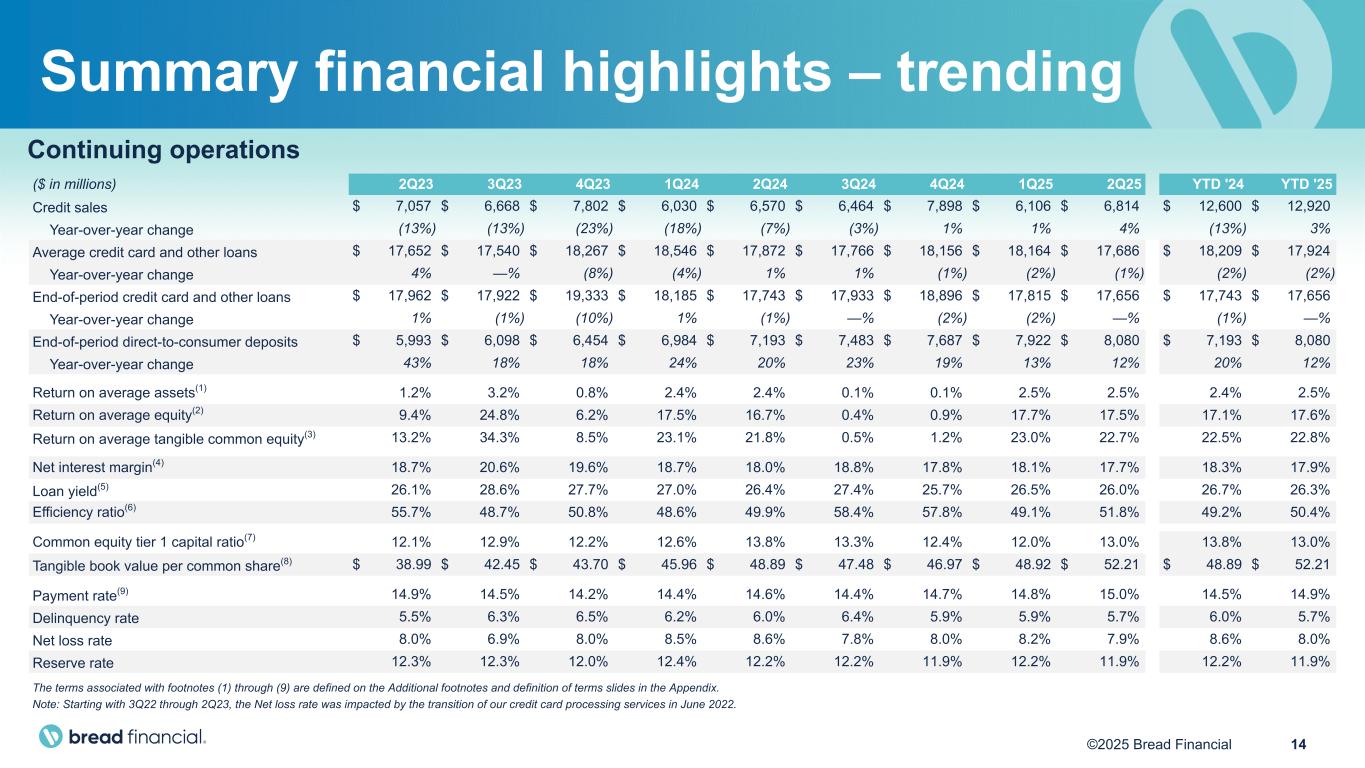
14©2025 Bread Financial Continuing operations ($ in millions) 2Q23 3Q23 4Q23 1Q24 2Q24 3Q24 4Q24 1Q25 2Q25 YTD '24 YTD '25 Credit sales $ 7,057 $ 6,668 $ 7,802 $ 6,030 $ 6,570 $ 6,464 $ 7,898 $ 6,106 $ 6,814 $ 12,600 $ 12,920 Year-over-year change (13%) (13%) (23%) (18%) (7%) (3%) 1% 1% 4% (13%) 3% Average credit card and other loans $ 17,652 $ 17,540 $ 18,267 $ 18,546 $ 17,872 $ 17,766 $ 18,156 $ 18,164 $ 17,686 $ 18,209 $ 17,924 Year-over-year change 4% —% (8%) (4%) 1% 1% (1%) (2%) (1%) (2%) (2%) End-of-period credit card and other loans $ 17,962 $ 17,922 $ 19,333 $ 18,185 $ 17,743 $ 17,933 $ 18,896 $ 17,815 $ 17,656 $ 17,743 $ 17,656 Year-over-year change 1% (1%) (10%) 1% (1%) —% (2%) (2%) —% (1%) —% End-of-period direct-to-consumer deposits $ 5,993 $ 6,098 $ 6,454 $ 6,984 $ 7,193 $ 7,483 $ 7,687 $ 7,922 $ 8,080 $ 7,193 $ 8,080 Year-over-year change 43% 18% 18% 24% 20% 23% 19% 13% 12% 20% 12% Return on average assets(1) 1.2% 3.2% 0.8% 2.4% 2.4% 0.1% 0.1% 2.5% 2.5% 2.4% 2.5% Return on average equity(2) 9.4% 24.8% 6.2% 17.5% 16.7% 0.4% 0.9% 17.7% 17.5% 17.1% 17.6% Return on average tangible common equity(3) 13.2% 34.3% 8.5% 23.1% 21.8% 0.5% 1.2% 23.0% 22.7% 22.5% 22.8% Net interest margin(4) 18.7% 20.6% 19.6% 18.7% 18.0% 18.8% 17.8% 18.1% 17.7% 18.3% 17.9% Loan yield(5) 26.1% 28.6% 27.7% 27.0% 26.4% 27.4% 25.7% 26.5% 26.0% 26.7% 26.3% Efficiency ratio(6) 55.7% 48.7% 50.8% 48.6% 49.9% 58.4% 57.8% 49.1% 51.8% 49.2% 50.4% Common equity tier 1 capital ratio(7) 12.1% 12.9% 12.2% 12.6% 13.8% 13.3% 12.4% 12.0% 13.0% 13.8% 13.0% Tangible book value per common share(8) $ 38.99 $ 42.45 $ 43.70 $ 45.96 $ 48.89 $ 47.48 $ 46.97 $ 48.92 $ 52.21 $ 48.89 $ 52.21 Payment rate(9) 14.9% 14.5% 14.2% 14.4% 14.6% 14.4% 14.7% 14.8% 15.0% 14.5% 14.9% Delinquency rate 5.5% 6.3% 6.5% 6.2% 6.0% 6.4% 5.9% 5.9% 5.7% 6.0% 5.7% Net loss rate 8.0% 6.9% 8.0% 8.5% 8.6% 7.8% 8.0% 8.2% 7.9% 8.6% 8.0% Reserve rate 12.3% 12.3% 12.0% 12.4% 12.2% 12.2% 11.9% 12.2% 11.9% 12.2% 11.9% The terms associated with footnotes (1) through (9) are defined on the Additional footnotes and definition of terms slides in the Appendix. Note: Starting with 3Q22 through 2Q23, the Net loss rate was impacted by the transition of our credit card processing services in June 2022. Summary financial highlights – trending
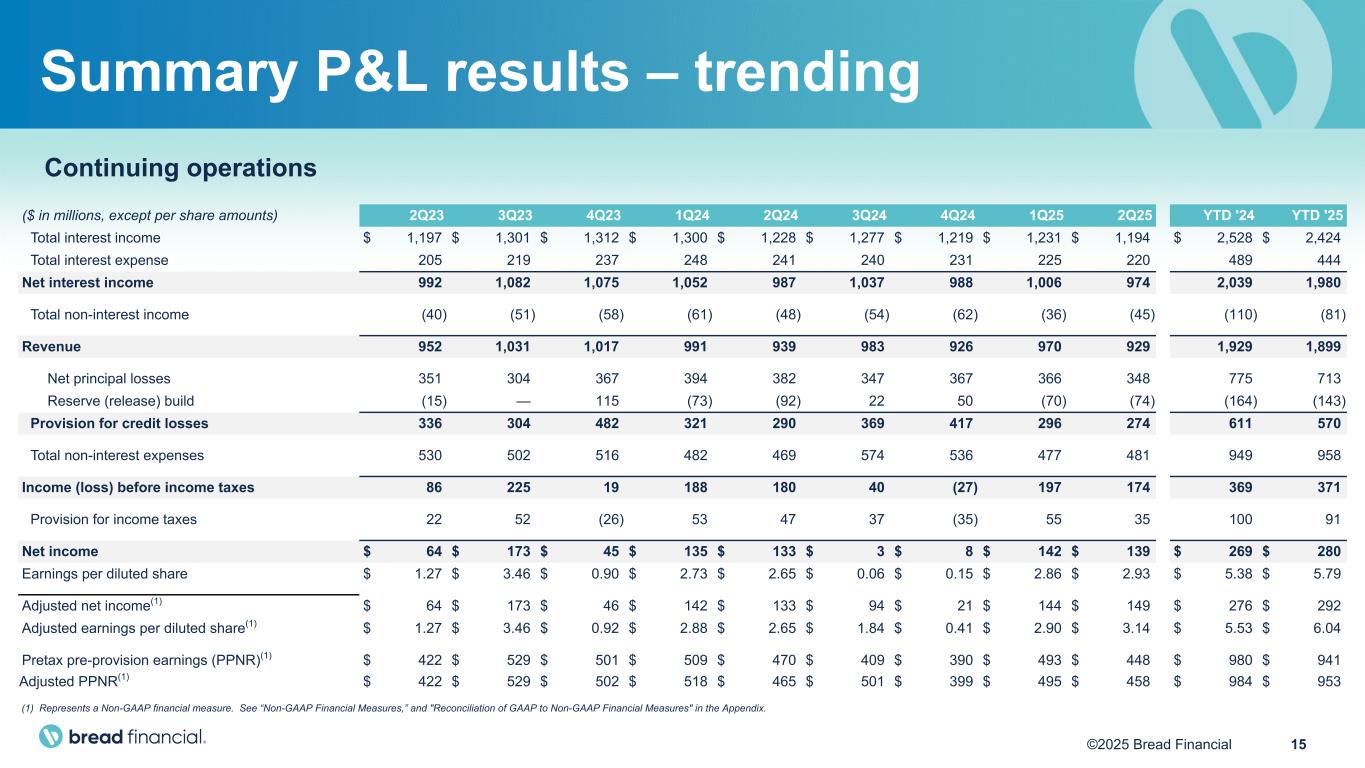
15©2025 Bread Financial Continuing operations ($ in millions, except per share amounts) 2Q23 3Q23 4Q23 1Q24 2Q24 3Q24 4Q24 1Q25 2Q25 YTD '24 YTD '25 Total interest income $ 1,197 $ 1,301 $ 1,312 $ 1,300 $ 1,228 $ 1,277 $ 1,219 $ 1,231 $ 1,194 $ 2,528 $ 2,424 Total interest expense 205 219 237 248 241 240 231 225 220 489 444 Net interest income 992 1,082 1,075 1,052 987 1,037 988 1,006 974 2,039 1,980 Total non-interest income (40) (51) (58) (61) (48) (54) (62) (36) (45) (110) (81) Revenue 952 1,031 1,017 991 939 983 926 970 929 1,929 1,899 Net principal losses 351 304 367 394 382 347 367 366 348 775 713 Reserve (release) build (15) — 115 (73) (92) 22 50 (70) (74) (164) (143) Provision for credit losses 336 304 482 321 290 369 417 296 274 611 570 Total non-interest expenses 530 502 516 482 469 574 536 477 481 949 958 Income (loss) before income taxes 86 225 19 188 180 40 (27) 197 174 369 371 Provision for income taxes 22 52 (26) 53 47 37 (35) 55 35 100 91 Net income $ 64 $ 173 $ 45 $ 135 $ 133 $ 3 $ 8 $ 142 $ 139 $ 269 $ 280 Earnings per diluted share $ 1.27 $ 3.46 $ 0.90 $ 2.73 $ 2.65 $ 0.06 $ 0.15 $ 2.86 $ 2.93 $ 5.38 $ 5.79 Adjusted net income(1) $ 64 $ 173 $ 46 $ 142 $ 133 $ 94 $ 21 $ 144 $ 149 $ 276 $ 292 Adjusted earnings per diluted share(1) $ 1.27 $ 3.46 $ 0.92 $ 2.88 $ 2.65 $ 1.84 $ 0.41 $ 2.90 $ 3.14 $ 5.53 $ 6.04 Pretax pre-provision earnings (PPNR)(1) $ 422 $ 529 $ 501 $ 509 $ 470 $ 409 $ 390 $ 493 $ 448 $ 980 $ 941 Adjusted PPNR(1) $ 422 $ 529 $ 502 $ 518 $ 465 $ 501 $ 399 $ 495 $ 458 $ 984 $ 953 Summary P&L results – trending (1) Represents a Non-GAAP financial measure. See “Non-GAAP Financial Measures,” and "Reconciliation of GAAP to Non-GAAP Financial Measures" in the Appendix.
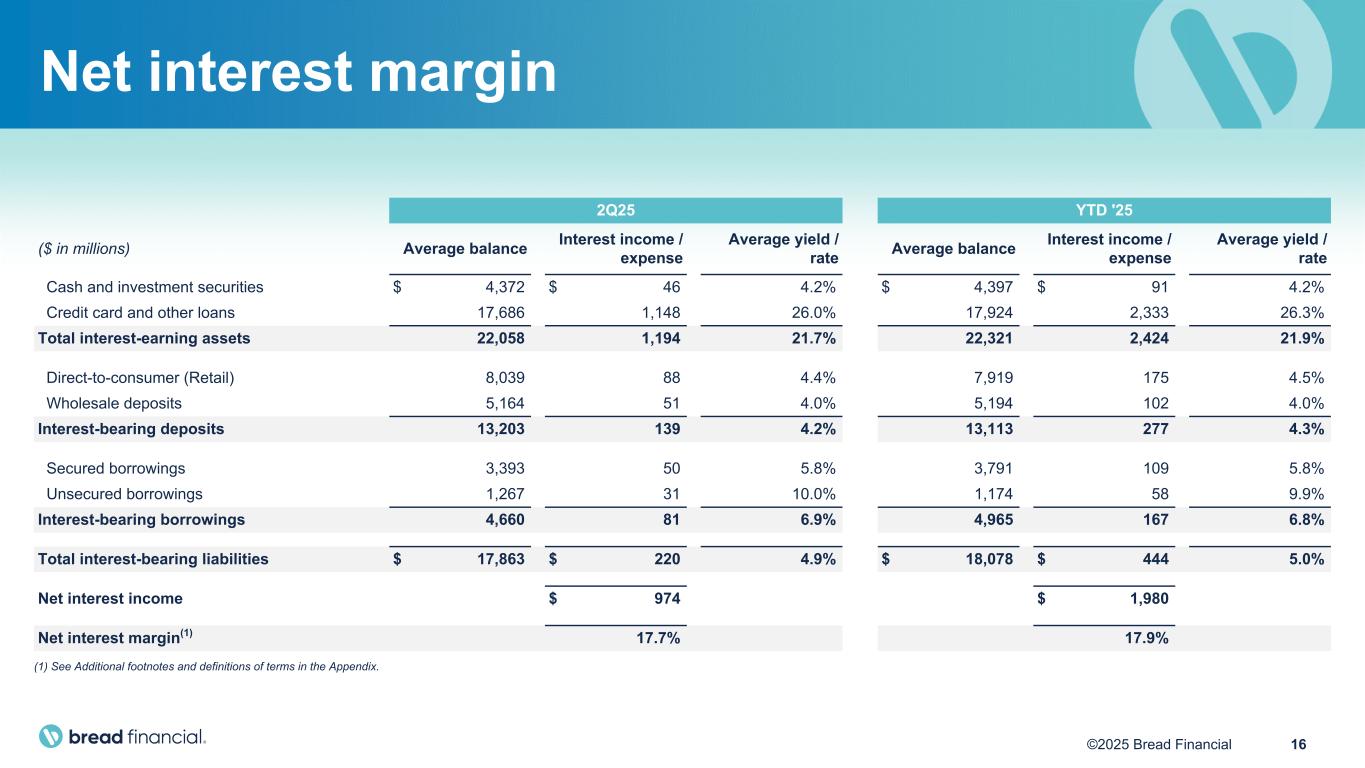
16©2025 Bread Financial 2Q25 YTD '25 ($ in millions) Average balance Interest income / expense Average yield / rate Average balance Interest income / expense Average yield / rate Cash and investment securities $ 4,372 $ 46 4.2% $ 4,397 $ 91 4.2% Credit card and other loans 17,686 1,148 26.0% 17,924 2,333 26.3% Total interest-earning assets 22,058 1,194 21.7% 22,321 2,424 21.9% Direct-to-consumer (Retail) 8,039 88 4.4% 7,919 175 4.5% Wholesale deposits 5,164 51 4.0% 5,194 102 4.0% Interest-bearing deposits 13,203 139 4.2% 13,113 277 4.3% Secured borrowings 3,393 50 5.8% 3,791 109 5.8% Unsecured borrowings 1,267 31 10.0% 1,174 58 9.9% Interest-bearing borrowings 4,660 81 6.9% 4,965 167 6.8% Total interest-bearing liabilities $ 17,863 $ 220 4.9% $ 18,078 $ 444 5.0% Net interest income $ 974 $ 1,980 Net interest margin(1) 17.7% 17.9% (1) See Additional footnotes and definitions of terms in the Appendix. Net interest margin
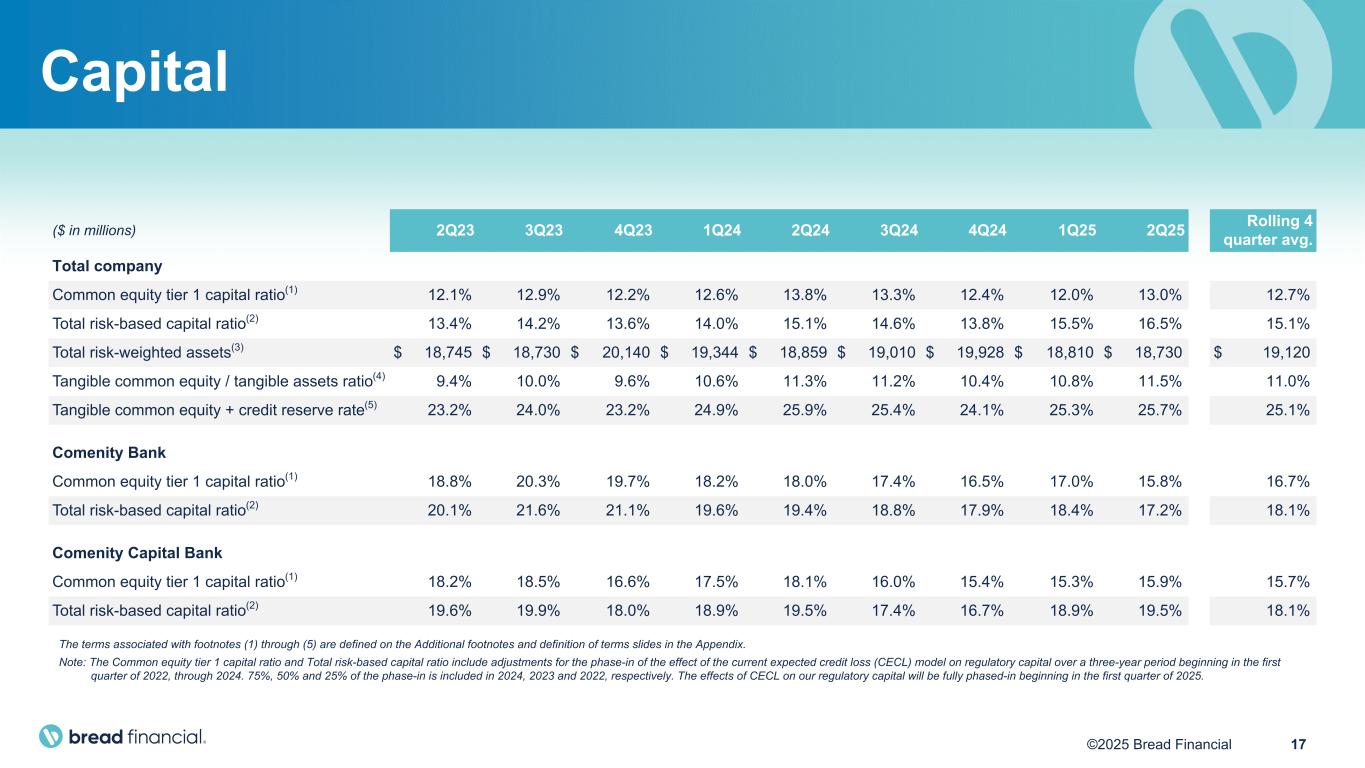
17©2025 Bread Financial ($ in millions) 2Q23 3Q23 4Q23 1Q24 2Q24 3Q24 4Q24 1Q25 2Q25 Rolling 4 quarter avg. Total company Common equity tier 1 capital ratio(1) 12.1% 12.9% 12.2% 12.6% 13.8% 13.3% 12.4% 12.0% 13.0% 12.7% Total risk-based capital ratio(2) 13.4% 14.2% 13.6% 14.0% 15.1% 14.6% 13.8% 15.5% 16.5% 15.1% Total risk-weighted assets(3) $ 18,745 $ 18,730 $ 20,140 $ 19,344 $ 18,859 $ 19,010 $ 19,928 $ 18,810 $ 18,730 $ 19,120 Tangible common equity / tangible assets ratio(4) 9.4% 10.0% 9.6% 10.6% 11.3% 11.2% 10.4% 10.8% 11.5% 11.0% Tangible common equity + credit reserve rate(5) 23.2% 24.0% 23.2% 24.9% 25.9% 25.4% 24.1% 25.3% 25.7% 25.1% Comenity Bank Common equity tier 1 capital ratio(1) 18.8% 20.3% 19.7% 18.2% 18.0% 17.4% 16.5% 17.0% 15.8% 16.7% Total risk-based capital ratio(2) 20.1% 21.6% 21.1% 19.6% 19.4% 18.8% 17.9% 18.4% 17.2% 18.1% Comenity Capital Bank Common equity tier 1 capital ratio(1) 18.2% 18.5% 16.6% 17.5% 18.1% 16.0% 15.4% 15.3% 15.9% 15.7% Total risk-based capital ratio(2) 19.6% 19.9% 18.0% 18.9% 19.5% 17.4% 16.7% 18.9% 19.5% 18.1% Capital The terms associated with footnotes (1) through (5) are defined on the Additional footnotes and definition of terms slides in the Appendix. Note: The Common equity tier 1 capital ratio and Total risk-based capital ratio include adjustments for the phase-in of the effect of the current expected credit loss (CECL) model on regulatory capital over a three-year period beginning in the first quarter of 2022, through 2024. 75%, 50% and 25% of the phase-in is included in 2024, 2023 and 2022, respectively. The effects of CECL on our regulatory capital will be fully phased-in beginning in the first quarter of 2025.
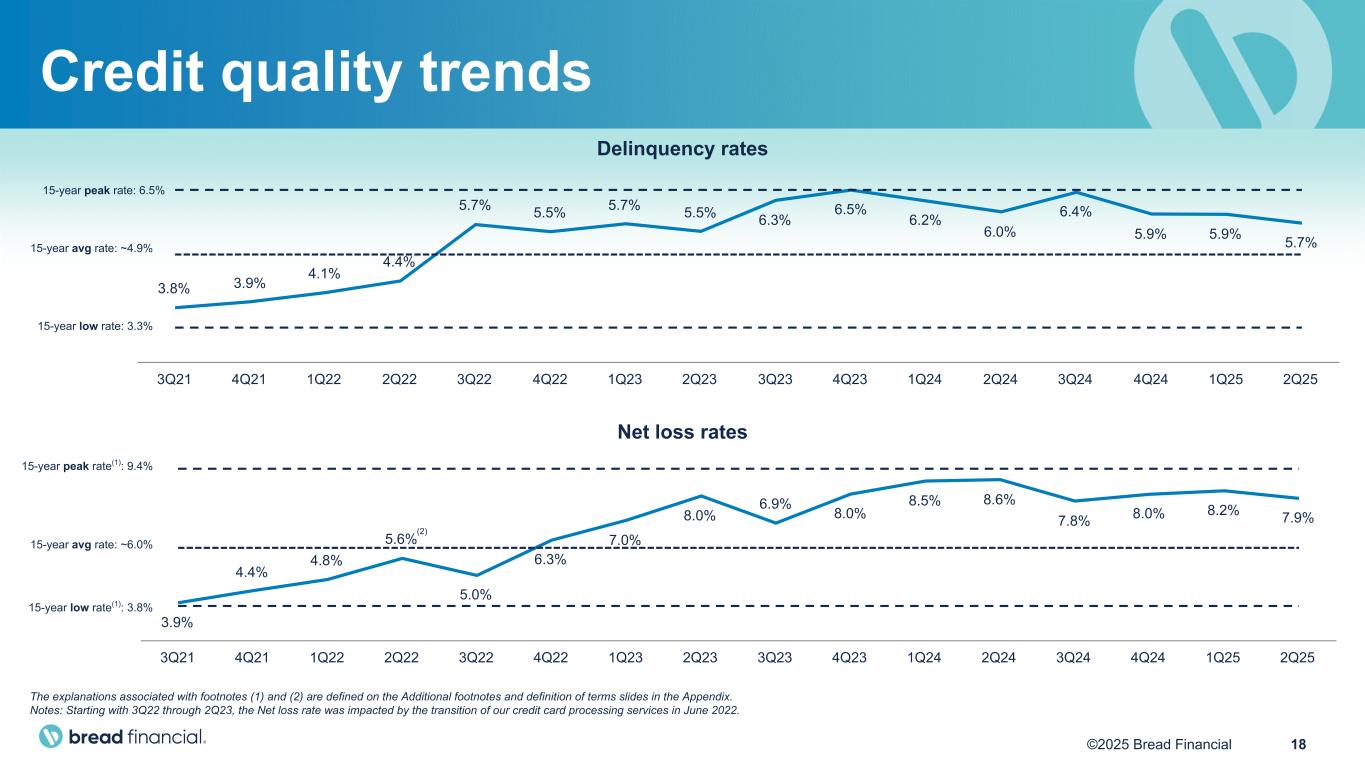
18©2025 Bread Financial 3.9% 4.4% 4.8% 5.6% 5.0% 6.3% 7.0% 8.0% 6.9% 8.0% 8.5% 8.6% 7.8% 8.0% 8.2% 7.9% 3Q21 4Q21 1Q22 2Q22 3Q22 4Q22 1Q23 2Q23 3Q23 4Q23 1Q24 2Q24 3Q24 4Q24 1Q25 2Q25 3.8% 3.9% 4.1% 4.4% 5.7% 5.5% 5.7% 5.5% 6.3% 6.5% 6.2% 6.0% 6.4% 5.9% 5.9% 5.7% 3Q21 4Q21 1Q22 2Q22 3Q22 4Q22 1Q23 2Q23 3Q23 4Q23 1Q24 2Q24 3Q24 4Q24 1Q25 2Q25 15-year low rate(1): 3.8% 15-year avg rate: ~6.0% 15-year avg rate: ~4.9% 15-year low rate: 3.3% Credit quality trends (2) Delinquency rates Net loss rates 15-year peak rate(1): 9.4% 15-year peak rate: 6.5% The explanations associated with footnotes (1) and (2) are defined on the Additional footnotes and definition of terms slides in the Appendix. Notes: Starting with 3Q22 through 2Q23, the Net loss rate was impacted by the transition of our credit card processing services in June 2022.
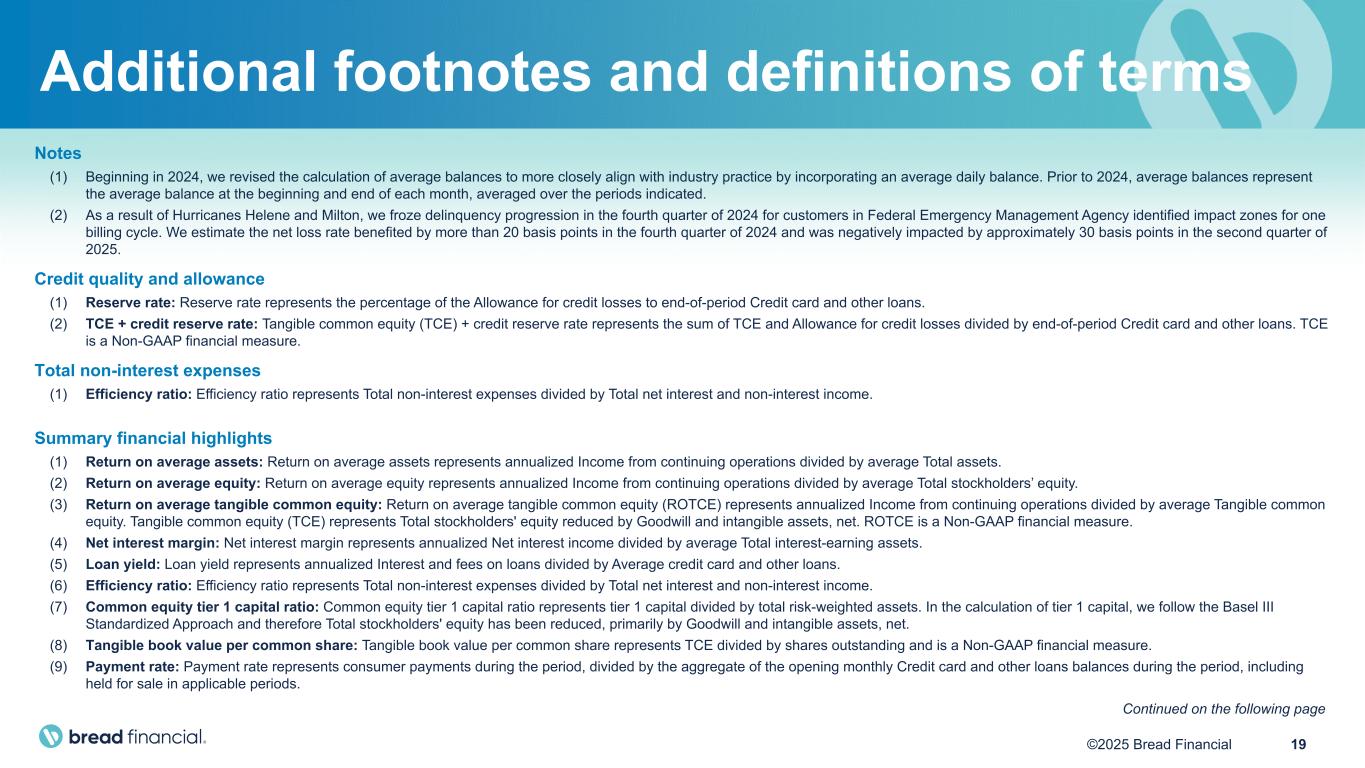
19©2025 Bread Financial Additional footnotes and definitions of terms Notes (1) Beginning in 2024, we revised the calculation of average balances to more closely align with industry practice by incorporating an average daily balance. Prior to 2024, average balances represent the average balance at the beginning and end of each month, averaged over the periods indicated. (2) As a result of Hurricanes Helene and Milton, we froze delinquency progression in the fourth quarter of 2024 for customers in Federal Emergency Management Agency identified impact zones for one billing cycle. We estimate the net loss rate benefited by more than 20 basis points in the fourth quarter of 2024 and was negatively impacted by approximately 30 basis points in the second quarter of 2025. Credit quality and allowance (1) Reserve rate: Reserve rate represents the percentage of the Allowance for credit losses to end-of-period Credit card and other loans. (2) TCE + credit reserve rate: Tangible common equity (TCE) + credit reserve rate represents the sum of TCE and Allowance for credit losses divided by end-of-period Credit card and other loans. TCE is a Non-GAAP financial measure. Total non-interest expenses (1) Efficiency ratio: Efficiency ratio represents Total non-interest expenses divided by Total net interest and non-interest income. Summary financial highlights (1) Return on average assets: Return on average assets represents annualized Income from continuing operations divided by average Total assets. (2) Return on average equity: Return on average equity represents annualized Income from continuing operations divided by average Total stockholders’ equity. (3) Return on average tangible common equity: Return on average tangible common equity (ROTCE) represents annualized Income from continuing operations divided by average Tangible common equity. Tangible common equity (TCE) represents Total stockholders' equity reduced by Goodwill and intangible assets, net. ROTCE is a Non-GAAP financial measure. (4) Net interest margin: Net interest margin represents annualized Net interest income divided by average Total interest-earning assets. (5) Loan yield: Loan yield represents annualized Interest and fees on loans divided by Average credit card and other loans. (6) Efficiency ratio: Efficiency ratio represents Total non-interest expenses divided by Total net interest and non-interest income. (7) Common equity tier 1 capital ratio: Common equity tier 1 capital ratio represents tier 1 capital divided by total risk-weighted assets. In the calculation of tier 1 capital, we follow the Basel III Standardized Approach and therefore Total stockholders' equity has been reduced, primarily by Goodwill and intangible assets, net. (8) Tangible book value per common share: Tangible book value per common share represents TCE divided by shares outstanding and is a Non-GAAP financial measure. (9) Payment rate: Payment rate represents consumer payments during the period, divided by the aggregate of the opening monthly Credit card and other loans balances during the period, including held for sale in applicable periods. Continued on the following page
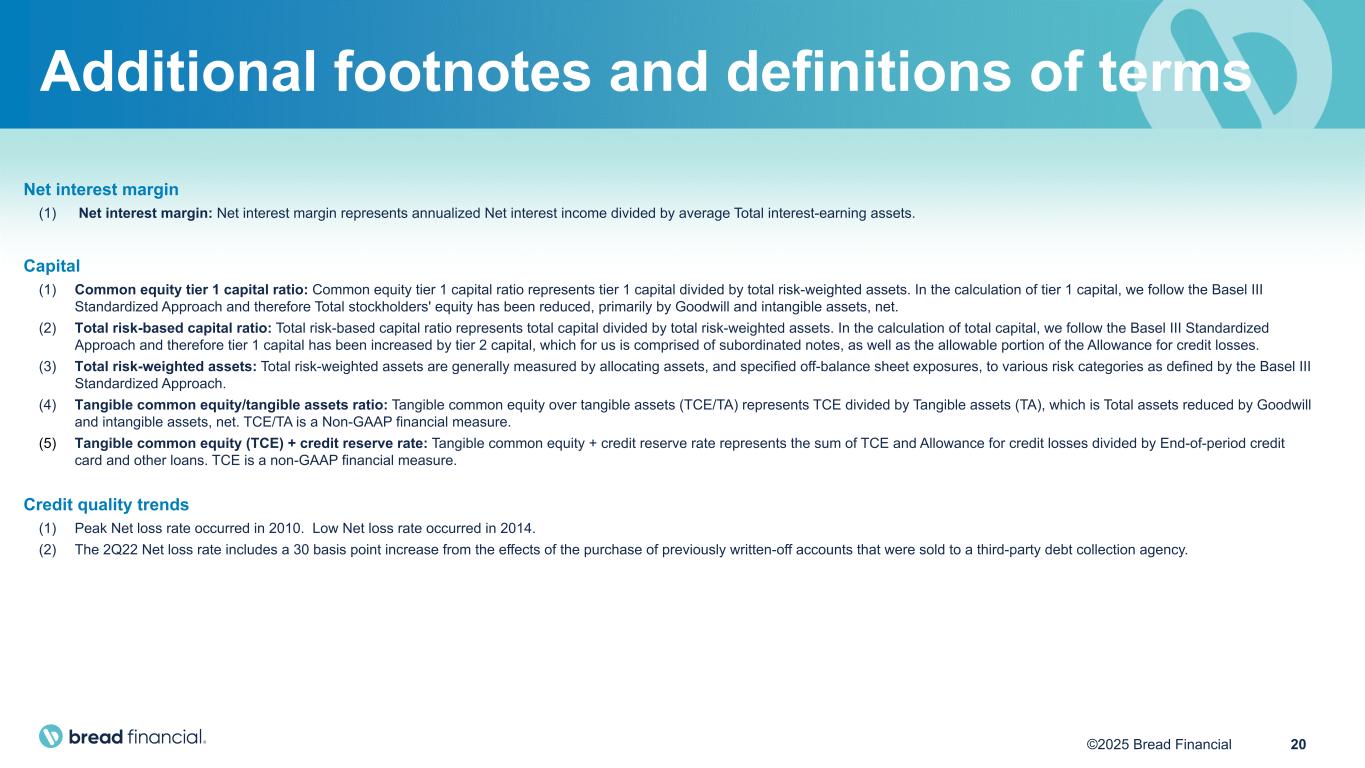
20©2025 Bread Financial Additional footnotes and definitions of terms Net interest margin (1) Net interest margin: Net interest margin represents annualized Net interest income divided by average Total interest-earning assets. Capital (1) Common equity tier 1 capital ratio: Common equity tier 1 capital ratio represents tier 1 capital divided by total risk-weighted assets. In the calculation of tier 1 capital, we follow the Basel III Standardized Approach and therefore Total stockholders' equity has been reduced, primarily by Goodwill and intangible assets, net. (2) Total risk-based capital ratio: Total risk-based capital ratio represents total capital divided by total risk-weighted assets. In the calculation of total capital, we follow the Basel III Standardized Approach and therefore tier 1 capital has been increased by tier 2 capital, which for us is comprised of subordinated notes, as well as the allowable portion of the Allowance for credit losses. (3) Total risk-weighted assets: Total risk-weighted assets are generally measured by allocating assets, and specified off-balance sheet exposures, to various risk categories as defined by the Basel III Standardized Approach. (4) Tangible common equity/tangible assets ratio: Tangible common equity over tangible assets (TCE/TA) represents TCE divided by Tangible assets (TA), which is Total assets reduced by Goodwill and intangible assets, net. TCE/TA is a Non-GAAP financial measure. (5) Tangible common equity (TCE) + credit reserve rate: Tangible common equity + credit reserve rate represents the sum of TCE and Allowance for credit losses divided by End-of-period credit card and other loans. TCE is a non-GAAP financial measure. Credit quality trends (1) Peak Net loss rate occurred in 2010. Low Net loss rate occurred in 2014. (2) The 2Q22 Net loss rate includes a 30 basis point increase from the effects of the purchase of previously written-off accounts that were sold to a third-party debt collection agency.
21©2025 Bread Financial Forward-looking statements This release contains forward-looking statements within the meaning of Section 27A of the Securities Act of 1933 and Section 21E of the Securities Exchange Act of 1934. Forward-looking statements give our expectations or forecasts of future events and can generally be identified by the use of words such as “believe,” “expect,” “anticipate,” “estimate,” “intend,” “project,” “plan,” “likely,” “may,” “should” or other words or phrases of similar import. Similarly, statements that describe our business strategy, outlook, objectives, plans, intentions or goals also are forward-looking statements. Examples of forward-looking statements include, but are not limited to, statements we make regarding, and the guidance we give with respect to, our anticipated operating or financial results, future financial performance and outlook, future dividend declarations, and future economic conditions. We believe that our expectations are based on reasonable assumptions. Forward-looking statements, however, are subject to a number of risks and uncertainties that are difficult to predict and, in many cases, beyond our control. Accordingly, our actual results could differ materially from the projections, anticipated results or other expectations expressed in this release, and no assurances can be given that our expectations will prove to have been correct. Factors that could cause the outcomes to differ materially include, but are not limited to, the following: macroeconomic conditions, including market conditions, inflation, interest rates, labor market conditions, recessionary pressures or concerns over a prolonged economic slowdown, and the related impact on consumer spending behavior, payments, debt levels, savings rates and other behaviors; global political and public health events and conditions, including significant shifts in trade policy, such as changes to, or the imposition of, tariffs and/or trade barriers and any economic impacts, volatility, uncertainty and geopolitical instability resulting therefrom, as well as ongoing wars and military conflicts and natural disasters; future credit performance, including the level of future delinquency and write-off rates; the loss of, or reduction in demand from, significant brand partners or customers in the highly competitive markets in which we compete; the concentration of our business in U.S. consumer credit; inaccuracies in the models and estimates on which we rely, including the amount of our Allowance for credit losses and our credit risk management models; the inability to realize the intended benefits of acquisitions, dispositions and other strategic initiatives; our level of indebtedness and ability to access financial or capital markets; pending and future federal and state legislation, regulation, supervisory guidance, and regulatory and legal actions, including, but not limited to, those related to financial regulatory reform and consumer financial services practices, as well as any such actions with respect to late fees, interchange fees or other charges; impacts arising from or relating to the transition of our credit card processing services to third party service providers that we completed in 2022; failures or breaches in our operational or security systems, including as a result of cyberattacks, unanticipated impacts from technology modernization projects or otherwise; and any tax or other liability or adverse impacts arising out of or related to the spinoff of our former LoyaltyOne segment or the bankruptcy filings of Loyalty Ventures Inc. (LVI) and certain of its subsidiaries and subsequent litigation or other disputes. The foregoing factors, along with other risks and uncertainties that could cause actual results to differ materially from those expressed or implied in forward-looking statements, are described in greater detail under the headings “Risk Factors” and “Management’s Discussion and Analysis of Financial Condition and Results of Operations” in our Annual Report on Form 10-K for the most recently ended fiscal year, which may be updated in Item 1A of, or elsewhere in, our Quarterly Reports on Form 10-Q filed for periods subsequent to such Form 10-K. Our forward-looking statements speak only as of the date made, and we undertake no obligation, other than as required by applicable law, to update or revise any forward-looking statements, whether as a result of new information, subsequent events, anticipated or unanticipated circumstances or otherwise.
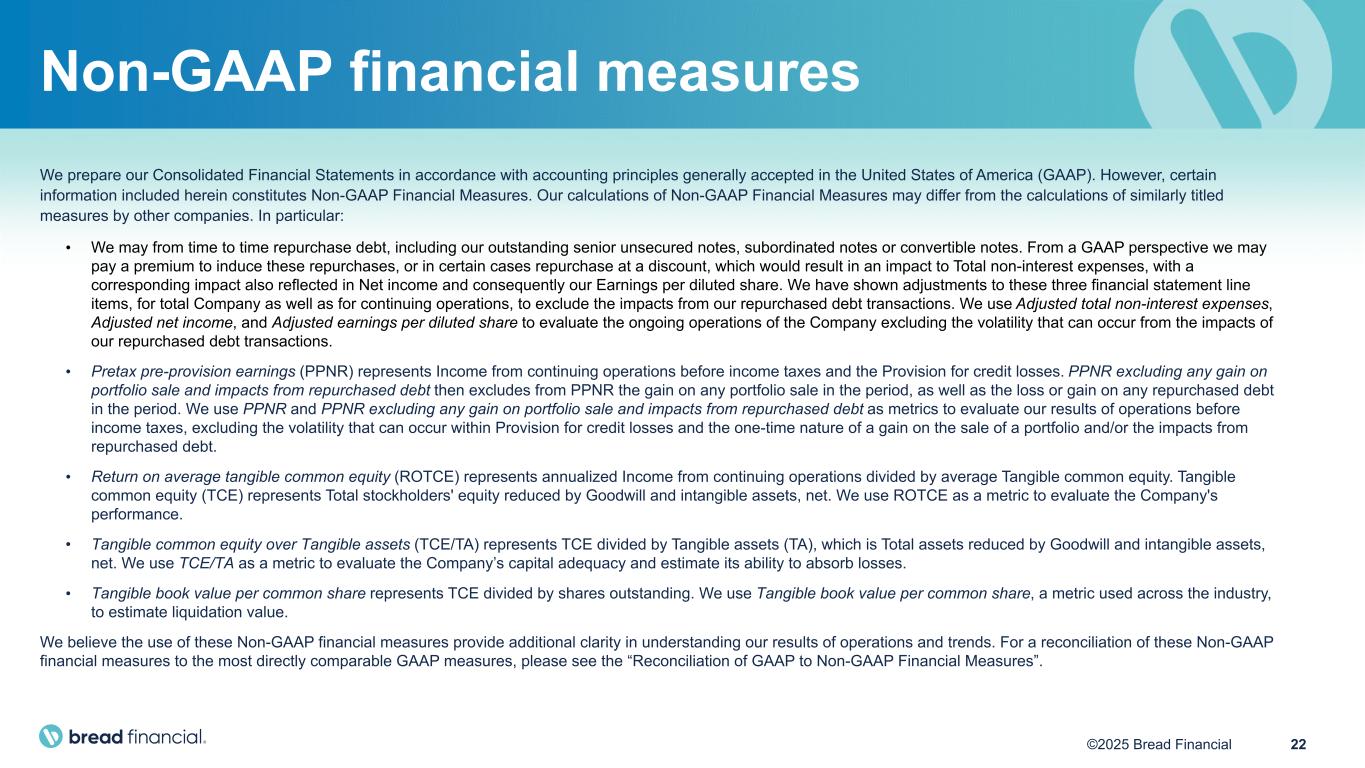
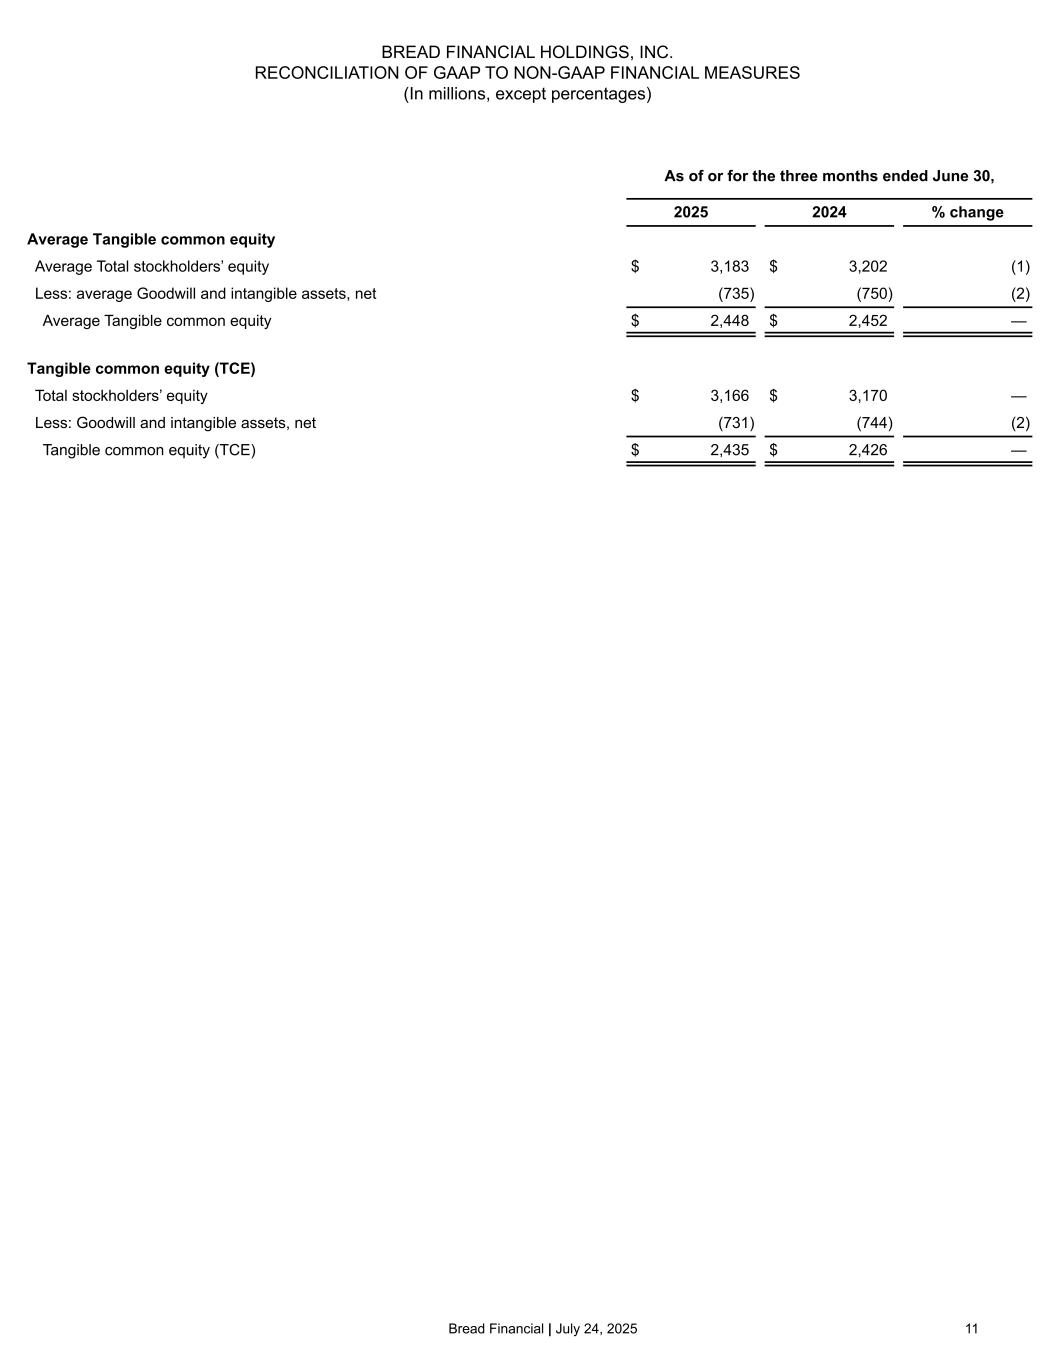
22©2025 Bread Financial We prepare our Consolidated Financial Statements in accordance with accounting principles generally accepted in the United States of America (GAAP). However, certain information included herein constitutes Non-GAAP Financial Measures. Our calculations of Non-GAAP Financial Measures may differ from the calculations of similarly titled measures by other companies. In particular: • We may from time to time repurchase debt, including our outstanding senior unsecured notes, subordinated notes or convertible notes. From a GAAP perspective we may pay a premium to induce these repurchases, or in certain cases repurchase at a discount, which would result in an impact to Total non-interest expenses, with a corresponding impact also reflected in Net income and consequently our Earnings per diluted share. We have shown adjustments to these three financial statement line items, for total Company as well as for continuing operations, to exclude the impacts from our repurchased debt transactions. We use Adjusted total non-interest expenses, Adjusted net income, and Adjusted earnings per diluted share to evaluate the ongoing operations of the Company excluding the volatility that can occur from the impacts of our repurchased debt transactions. • Pretax pre-provision earnings (PPNR) represents Income from continuing operations before income taxes and the Provision for credit losses. PPNR excluding any gain on portfolio sale and impacts from repurchased debt then excludes from PPNR the gain on any portfolio sale in the period, as well as the loss or gain on any repurchased debt in the period. We use PPNR and PPNR excluding any gain on portfolio sale and impacts from repurchased debt as metrics to evaluate our results of operations before income taxes, excluding the volatility that can occur within Provision for credit losses and the one-time nature of a gain on the sale of a portfolio and/or the impacts from repurchased debt. • Return on average tangible common equity (ROTCE) represents annualized Income from continuing operations divided by average Tangible common equity. Tangible common equity (TCE) represents Total stockholders' equity reduced by Goodwill and intangible assets, net. We use ROTCE as a metric to evaluate the Company's performance. • Tangible common equity over Tangible assets (TCE/TA) represents TCE divided by Tangible assets (TA), which is Total assets reduced by Goodwill and intangible assets, net. We use TCE/TA as a metric to evaluate the Company’s capital adequacy and estimate its ability to absorb losses. • Tangible book value per common share represents TCE divided by shares outstanding. We use Tangible book value per common share, a metric used across the industry, to estimate liquidation value. We believe the use of these Non-GAAP financial measures provide additional clarity in understanding our results of operations and trends. For a reconciliation of these Non-GAAP financial measures to the most directly comparable GAAP measures, please see the “Reconciliation of GAAP to Non-GAAP Financial Measures”. Non-GAAP financial measures
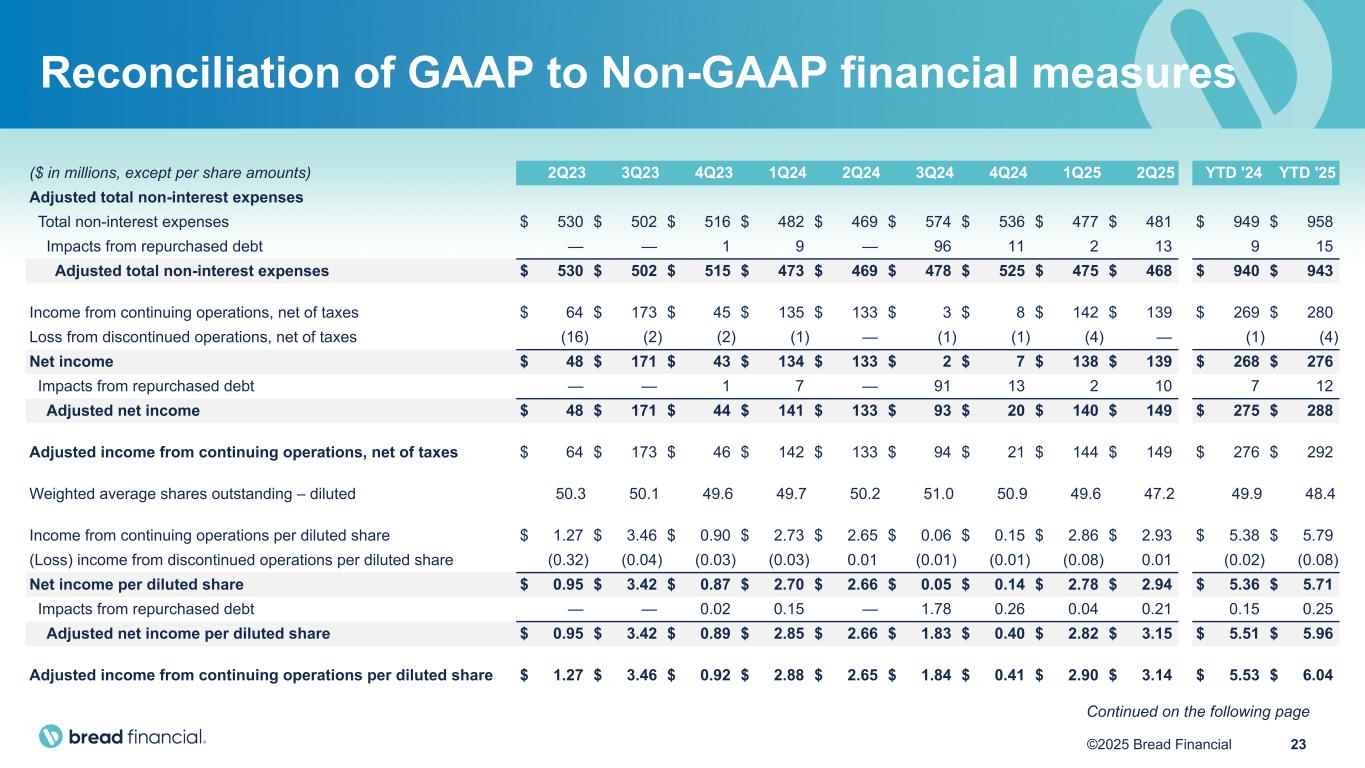
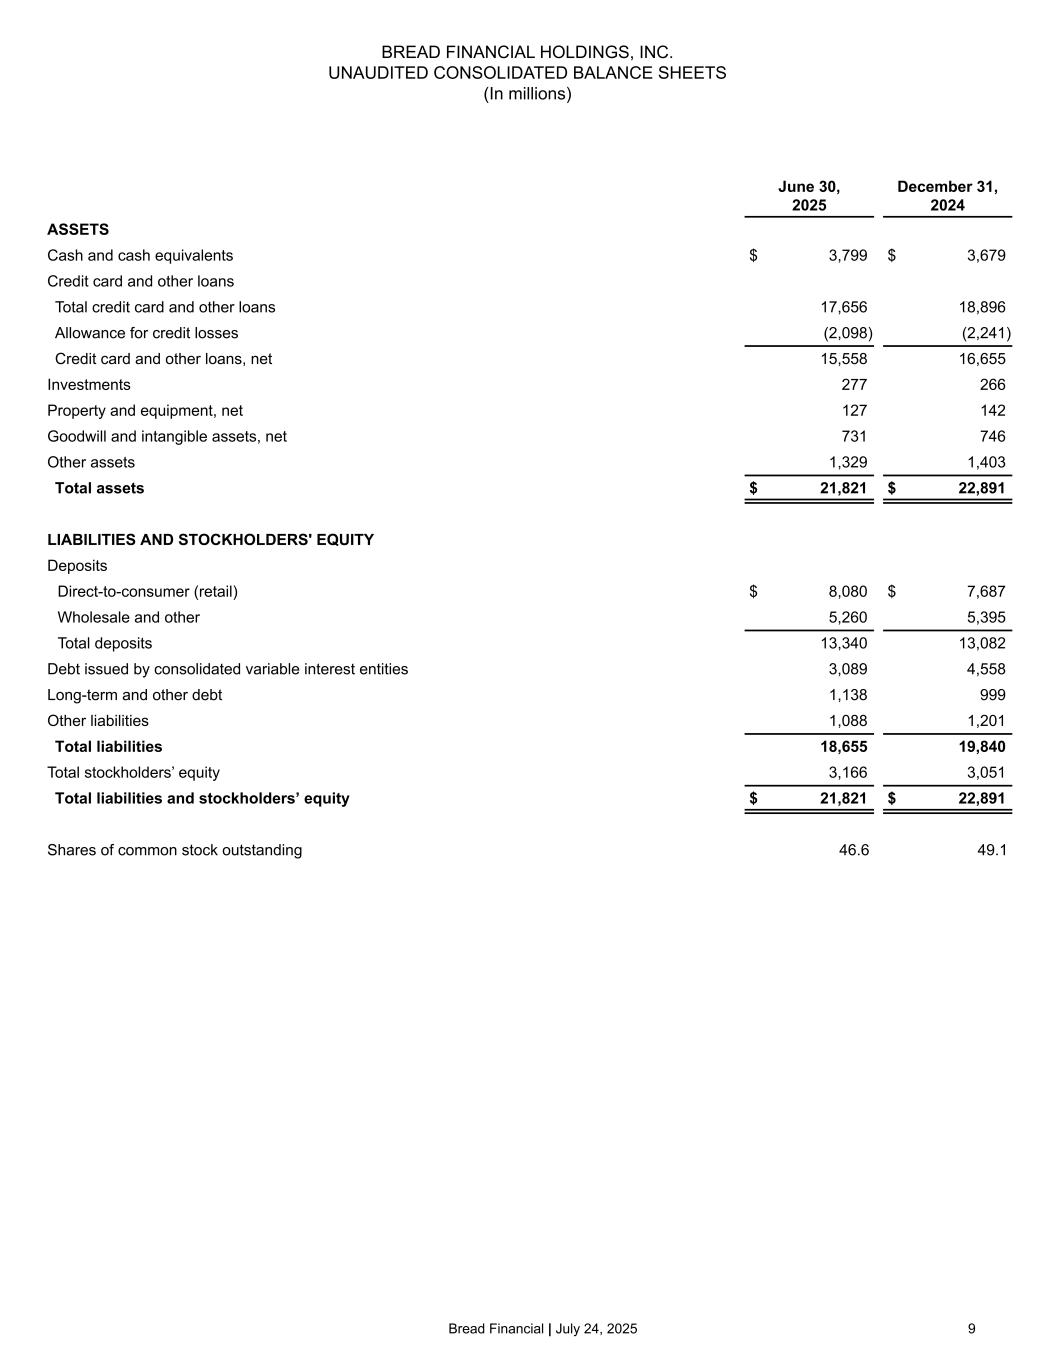
23©2025 Bread Financial Reconciliation of GAAP to Non-GAAP financial measures ($ in millions, except per share amounts) 2Q23 3Q23 4Q23 1Q24 2Q24 3Q24 4Q24 1Q25 2Q25 YTD '24 YTD '25 Adjusted total non-interest expenses Total non-interest expenses $ 530 $ 502 $ 516 $ 482 $ 469 $ 574 $ 536 $ 477 $ 481 $ 949 $ 958 Impacts from repurchased debt — — 1 9 — 96 11 2 13 9 15 Adjusted total non-interest expenses $ 530 $ 502 $ 515 $ 473 $ 469 $ 478 $ 525 $ 475 $ 468 $ 940 $ 943 Income from continuing operations, net of taxes $ 64 $ 173 $ 45 $ 135 $ 133 $ 3 $ 8 $ 142 $ 139 $ 269 $ 280 Loss from discontinued operations, net of taxes (16) (2) (2) (1) — (1) (1) (4) — (1) (4) Net income $ 48 $ 171 $ 43 $ 134 $ 133 $ 2 $ 7 $ 138 $ 139 $ 268 $ 276 Impacts from repurchased debt — — 1 7 — 91 13 2 10 7 12 Adjusted net income $ 48 $ 171 $ 44 $ 141 $ 133 $ 93 $ 20 $ 140 $ 149 $ 275 $ 288 Adjusted income from continuing operations, net of taxes $ 64 $ 173 $ 46 $ 142 $ 133 $ 94 $ 21 $ 144 $ 149 $ 276 $ 292 Weighted average shares outstanding – diluted 50.3 50.1 49.6 49.7 50.2 51.0 50.9 49.6 47.2 49.9 48.4 Income from continuing operations per diluted share $ 1.27 $ 3.46 $ 0.90 $ 2.73 $ 2.65 $ 0.06 $ 0.15 $ 2.86 $ 2.93 $ 5.38 $ 5.79 (Loss) income from discontinued operations per diluted share (0.32) (0.04) (0.03) (0.03) 0.01 (0.01) (0.01) (0.08) 0.01 (0.02) (0.08) Net income per diluted share $ 0.95 $ 3.42 $ 0.87 $ 2.70 $ 2.66 $ 0.05 $ 0.14 $ 2.78 $ 2.94 $ 5.36 $ 5.71 Impacts from repurchased debt — — 0.02 0.15 — 1.78 0.26 0.04 0.21 0.15 0.25 Adjusted net income per diluted share $ 0.95 $ 3.42 $ 0.89 $ 2.85 $ 2.66 $ 1.83 $ 0.40 $ 2.82 $ 3.15 $ 5.51 $ 5.96 Adjusted income from continuing operations per diluted share $ 1.27 $ 3.46 $ 0.92 $ 2.88 $ 2.65 $ 1.84 $ 0.41 $ 2.90 $ 3.14 $ 5.53 $ 6.04 Continued on the following page
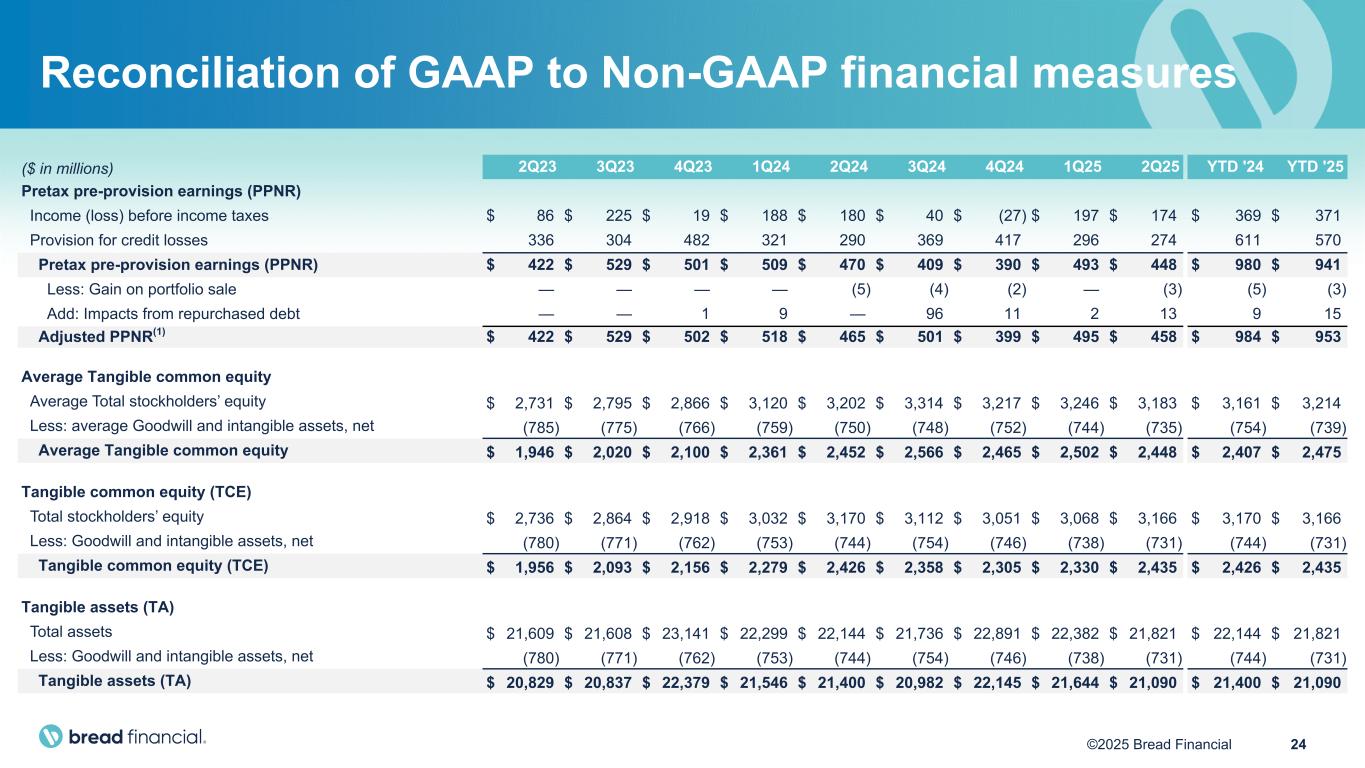
24©2025 Bread Financial ($ in millions) 2Q23 3Q23 4Q23 1Q24 2Q24 3Q24 4Q24 1Q25 2Q25 YTD '24 YTD '25 Pretax pre-provision earnings (PPNR) Income (loss) before income taxes $ 86 $ 225 $ 19 $ 188 $ 180 $ 40 $ (27) $ 197 $ 174 $ 369 $ 371 Provision for credit losses 336 304 482 321 290 369 417 296 274 611 570 Pretax pre-provision earnings (PPNR) $ 422 $ 529 $ 501 $ 509 $ 470 $ 409 $ 390 $ 493 $ 448 $ 980 $ 941 Less: Gain on portfolio sale — — — — (5) (4) (2) — (3) (5) (3) Add: Impacts from repurchased debt — — 1 9 — 96 11 2 13 9 15 Adjusted PPNR(1) $ 422 $ 529 $ 502 $ 518 $ 465 $ 501 $ 399 $ 495 $ 458 $ 984 $ 953 Average Tangible common equity Average Total stockholders’ equity $ 2,731 $ 2,795 $ 2,866 $ 3,120 $ 3,202 $ 3,314 $ 3,217 $ 3,246 $ 3,183 $ 3,161 $ 3,214 Less: average Goodwill and intangible assets, net (785) (775) (766) (759) (750) (748) (752) (744) (735) (754) (739) Average Tangible common equity $ 1,946 $ 2,020 $ 2,100 $ 2,361 $ 2,452 $ 2,566 $ 2,465 $ 2,502 $ 2,448 $ 2,407 $ 2,475 Tangible common equity (TCE) Total stockholders’ equity $ 2,736 $ 2,864 $ 2,918 $ 3,032 $ 3,170 $ 3,112 $ 3,051 $ 3,068 $ 3,166 $ 3,170 $ 3,166 Less: Goodwill and intangible assets, net (780) (771) (762) (753) (744) (754) (746) (738) (731) (744) (731) Tangible common equity (TCE) $ 1,956 $ 2,093 $ 2,156 $ 2,279 $ 2,426 $ 2,358 $ 2,305 $ 2,330 $ 2,435 $ 2,426 $ 2,435 Tangible assets (TA) Total assets $ 21,609 $ 21,608 $ 23,141 $ 22,299 $ 22,144 $ 21,736 $ 22,891 $ 22,382 $ 21,821 $ 22,144 $ 21,821 Less: Goodwill and intangible assets, net (780) (771) (762) (753) (744) (754) (746) (738) (731) (744) (731) Tangible assets (TA) $ 20,829 $ 20,837 $ 22,379 $ 21,546 $ 21,400 $ 20,982 $ 22,145 $ 21,644 $ 21,090 $ 21,400 $ 21,090 Reconciliation of GAAP to Non-GAAP financial measures