UNITED STATES
SECURITIES AND EXCHANGE COMMISSION
Washington, D.C. 20549
|
|
|
FORM
|
|
|
CURRENT REPORT
Pursuant to Section 13 or 15(d)
of the Securities Exchange Act of 1934
Date of Report (Date of earliest event reported):
|
|
|
(Exact name of registrant as specified in its charter)
|
|
|
(State or other jurisdiction of incorporation) | (Commission File Number) | (I.R.S. Employer Identification No.) |
(Address of Principal Executive Offices) (Zip Code)
Registrant’s telephone number, including area code: (
Not Applicable
(Former name or former address, if changed since last report)
|
|
|
Check the appropriate box below if the Form 8-K filing is intended to simultaneously satisfy the filing obligation of the registrant under any of the following provisions (see General Instruction A.2. below):
Written communications pursuant to Rule 425 under the Securities Act (17 CFR 230.425)
Soliciting material pursuant to Rule 14a-12 under the Exchange Act (17 CFR 240.14a-12)
Pre-commencement communications pursuant to Rule 14d-2(b) under the Exchange Act (17 CFR 240.14d-2(b))
Pre-commencement communications pursuant to Rule 13e-4(c) under the Exchange Act (17 CFR 240.13e-4(c))
Securities registered pursuant to Section 12(b) of the Act:
Title of each class | Trading Symbol | Name of each exchange on which registered |
Indicate by check mark whether the registrant is an emerging growth company as defined in Rule 405 of the Securities Act of 1933 (§230.405 of this chapter) or Rule 12b-2 of the Securities Exchange Act of 1934 (§240.12b-2 of this chapter).
Emerging growth company
If an emerging growth company, indicate by check mark if the registrant has elected not to use the extended transition period for complying with any new or revised financial accounting standards provided pursuant to Section 13(a) of the Exchange Act. ☐
Item 2.02. Results of Operations and Financial Condition.
On July 29, 2020, Benchmark Electronics, Inc. (the “Company”) issued a press release announcing its results of operations for the quarter ended June 30, 2020. A copy of the press release and accompanying investor presentation are attached hereto as Exhibits 99.1 and 99.2, respectively, and incorporated by reference herein. The information disclosed under this Item 2.02, including Exhibits 99.1 and 99.2 hereto, shall not be deemed “filed” for purposes of Section 18 of the Securities Exchange Act of 1934, as amended (the “Exchange Act”), or deemed incorporated by reference in any filing under the Securities Act of 1933, as amended, or the Exchange Act, except as shall be expressly set forth by specific reference in such a filing.
Item 9.01. Financial Statements and Exhibits.
(d) Exhibits
Exhibit No. |
Description |
99.1 | Press release, dated July 29, 2020
|
|
|
99.2 | Investor presentation, dated July 29, 2020
|
|
|
104 | Cover Page Interactive Data File (embedded within the Inline XBRL document) |
-1-
| SIGNATURES |
|
Pursuant to the requirements of the Securities Exchange Act of 1934, the registrant has duly caused this report to be signed on its behalf by the undersigned hereunto duly authorized.
| BENCHMARK ELECTRONICS, INC. |
Date: July 30, 2020 | By: /s/ Stephen J. Beaver |
| Stephen J. Beaver, Esq. |
| Vice President General Counsel |
|
|
-2-
· Quarterly revenue of $491 million
· Semi-Cap revenue growth of 39% year-over-year
· Medical revenue growth of 18% year-over-year
· Quarterly GAAP diluted loss per share of $(0.09) and non-GAAP diluted EPS of $0.07
· Operating cash flow of $23 million
TEMPE, AZ, July 29, 2020 – Benchmark Electronics, Inc. (NYSE: BHE) today announced financial results for the second quarter ended June 30, 2020.
|
|
|
Three Months Ended |
|||||
|
|
|
Jun 30, |
|
|
Mar 31, |
|
Jun 30, |
|
In millions, except EPS |
2020 |
|
|
2020 |
|
2019 |
|
|
Sales |
$491 |
|
|
$515 |
|
$602 |
|
|
Net income (loss)(2) |
$(3) |
|
|
$4 |
|
$9 |
|
|
Net income – non-GAAP(1)(2) |
$3 |
|
|
$8 |
|
$14 |
|
|
Diluted earnings (loss) per share(2) |
$(0.09) |
|
|
$0.10 |
|
$0.24 |
|
|
Diluted EPS – non-GAAP(1)(2) |
$0.07 |
|
|
$0.22 |
|
$0.36 |
|
|
Operating margin(2) |
(0.4)% |
|
|
1.3% |
|
2.0% |
|
|
Operating margin – non-GAAP(1)(2) |
1.2% |
|
|
2.3% |
|
3.1% |
|
(1) A reconciliation of GAAP and non-GAAP results is included below.
(2) Results for the second quarter ended June 30, 2020 include the impact of approximately $4.1 million of COVID-19 related costs.
“Thanks to the commitment and tireless work of our global Benchmark team, we continue to successfully navigate this challenging pandemic environment. Protecting our people remains our highest priority and we will continue our vigilance to keep people safe and our locations operational,” said Jeff Benck, Benchmark President and CEO.
“Despite the current macro conditions, our team has focused on delivering products to meet the needs of our customers. Our diversified portfolio remains a strength at this time as we saw strong second quarter growth in our Medical and Semi-cap sectors. Moving into the third quarter, we expect sequential improvements in revenue, profit and utilization underpinned by stronger demand from our Semi-Cap and Defense customers where we have industry leading positions.”
1
Cash Conversion Cycle
|
|
|
Jun 30, |
|
|
|
Mar 31, |
|
|
|
Jun 30, |
|
|
|
|
2020 |
|
|
|
2020 |
|
|
|
2019 |
|
|
|
|
|
|
|
|
|
|
|
|||
|
Accounts receivable days |
|
55 |
|
|
|
56 |
|
|
|
54 |
|
|
Contract asset days |
|
28 |
|
|
|
28 |
|
|
|
23 |
|
|
Inventory days |
|
72 |
|
|
|
65 |
|
|
|
52 |
|
|
Accounts payable days |
|
(61) |
|
|
|
(61) |
|
|
|
(60) |
|
|
Customer deposits |
|
(10) |
|
|
|
(7) |
|
|
|
(3) |
|
|
Cash Conversion Cycle days |
|
84 |
|
|
|
81 |
|
|
|
66 |
|
Second Quarter 2020 Industry Sector Update
Revenue and percentage of sales by industry sector (in millions) was as follows.
|
|
|
|
Jun 30, |
|
|
|
Mar 31, |
|
|
|
Jun 30, |
|
||||||
|
|
Higher-Value Markets |
|
2020 |
|
|
|
2020 |
|
|
2019 |
||||||||
|
Medical |
$ |
135 |
|
27 |
% |
|
$ |
118 |
|
23 |
% |
|
$ |
114 |
|
19 |
% |
|
|
Semi-Cap |
|
87 |
|
18 |
|
|
|
83 |
|
16 |
|
|
|
63 |
|
10 |
|
|
|
A&D |
|
88 |
|
18 |
|
|
|
119 |
|
23 |
|
|
|
107 |
|
18 |
|
|
|
Industrials |
|
87 |
|
18 |
|
|
|
103 |
|
20 |
|
|
|
115 |
|
19 |
|
|
|
|
|
$ |
397 |
|
81 |
% |
|
$ |
423 |
|
82 |
% |
|
$ |
399 |
|
66 |
% |
|
|
|
|
|
|
|
|
|
|
|
|
|
|
|
|
|
|
|
|
|
|
|
|
|
|
|
|
|
|
|
|
|
|
|
|
|
|
|
|
|
|
|
|
Jun 30, |
|
|
|
Mar 31, |
|
|
|
Jun 30, |
|
||||||
|
|
Traditional Markets |
|
2020 |
|
|
|
2020 |
|
|
2019 |
||||||||
|
Computing |
$ |
44 |
|
9 |
% |
|
$ |
36 |
|
7 |
% |
|
$ |
133 |
|
22 |
% |
|
|
Telecommunications |
|
50 |
|
10 |
|
|
|
56 |
|
11 |
|
|
|
70 |
|
12 |
|
|
|
|
|
$ |
94 |
|
19 |
% |
|
$ |
92 |
|
18 |
% |
|
$ |
203 |
|
34 |
% |
|
|
Total |
$ |
491 |
|
100 |
% |
|
$ |
515 |
|
100 |
% |
|
$ |
602 |
|
100 |
% |
Overall, higher-value market revenues during the second quarter were down 6% quarter-over-quarter and flat year-over-year. Demand strength in Medical supporting COVID-19 solutions and new product ramps, as well as the continued Semi-cap recovery, were offset by weakness in commercial Aerospace and Industrial markets. Traditional market revenues were up 2% quarter-over-quarter due to stronger demand for high performance computing products and down 54% year-over-year primarily from the Company’s conscious exit of a legacy computing contract in 2019.
Third Quarter 2020 Outlook
· Revenue between $490 - $530 million
· Diluted GAAP earnings per share between $0.21 - $0.26
· Diluted non-GAAP earnings per share between $0.26 - $0.30 (excluding restructuring charges and other costs and amortization of intangibles)
2
· Our guidance includes known constraints due to COVID-19 and assumes no further significant interruptions occur to our supply base, operations, or customers. Guidance also assumes no material changes to market conditions due to COVID-19.
Restructuring charges are expected to range between $0.8 million to $1.2 million in the third quarter and the amortization of intangibles is expected to be $2.4 million in the third quarter.
Second Quarter 2020 Earnings Conference Call
The Company will host a conference call to discuss the results today at 5:00 p.m. Eastern Time. The live webcast of the call and accompanying reference materials will be accessible by logging on to the Company's website at www.bench.com. A replay of the broadcast will also be available until Wednesday, August 5, 2020 on the Company's website.
About Benchmark Electronics, Inc.
Benchmark provides comprehensive solutions across the entire product life cycle by leading through its innovative technology and engineering design services, leveraging its optimized global supply chain and delivering world-class manufacturing services in the following industries: commercial aerospace, defense, advanced computing, next generation telecommunications, complex industrials, medical, and semiconductor capital equipment. Benchmark's global operations include facilities in seven countries and its common shares trade on the New York Stock Exchange under the symbol BHE.
For More Information, Please Contact:
Lisa K. Weeks, VP of Strategy & Investor Relations
623-300-7052 or [email protected]
Forward-Looking Statements
This press release contains forward-looking statements within the meaning of Section 27A of the Securities Act of 1933 and Section 21E of the Securities Exchange Act of 1934. The words "expect," "estimate," "anticipate," "could", "predict" and similar expressions, and the negatives thereof, often identify forward-looking statements, which are not limited to historical facts. Forward-looking statements include, among other things, the estimated financial impact of the COVID-19 pandemic, our outlook and guidance for third quarter 2020 results, the company’s anticipated plans and responses to the COVID-19 pandemic, statements (express or implied) concerning future operating results or margins, the ability to generate sales and income or cash flow, and expected revenue mix, and Benchmark’s business and growth strategies. Although the company believes these statements are based on and derived from reasonable assumptions, they involve risks and uncertainties relating to operations, markets and the business environment generally. These statements also depend on the duration and severity of the COVID-19 pandemic and related risks, including government and other third-party responses to the crisis and the consequences for the global economy, our business and the businesses of our suppliers and customers. Events relating to or resulting from the COVID-19 pandemic, including the possibility of customer demand fluctuations, supply chain constraints, or the ability to utilize
3
our manufacturing facilities at sufficient levels to cover our fixed operating costs, may have resulting impacts on the company’s business, financial condition, results of operations, and the company’s ability (or inability) to execute on its plans to respond to the COVID-19 pandemic. If one or more of these risks or uncertainties materializes, or underlying assumptions prove incorrect, actual outcomes may vary materially from those indicated. Readers are advised to consult further disclosures on these risks and uncertainties, particularly in Part 1, Item 1A, "Risk Factors" of the company's Annual Report on Form 10-K for the year ended December 31, 2019 and in its subsequent filings with the Securities and Exchange Commission. All forward-looking statements included in this document are based upon information available to the company as of the date of this document, and it assumes no obligation to update them.
Non-GAAP Financial Measures
Management discloses non‐GAAP information to provide investors with additional information to analyze the Company’s performance and underlying trends. Management uses non‐GAAP measures that exclude certain items in order to better assess operating performance and help investors compare results with our previous guidance. This document also references “free cash flow”, which the Company defines as cash flow from operations less additions to property, plant and equipment and purchased software. The Company’s non‐GAAP information is not necessarily comparable to the non‐GAAP information used by other companies. Non‐GAAP information should not be viewed as a substitute for, or superior to, net income or other data prepared in accordance with GAAP as a measure of the Company’s profitability or liquidity. Readers should consider the types of events and transactions for which adjustments have been made.
###
4
|
|
|
|
|
|
|
|
|
|
|
|
|
Benchmark Electronics, Inc. and Subsidiaries |
||||||||||
|
|
|
|
|
|
|
|
|
|
|
|
|
Condensed Consolidated Statements of Income |
||||||||||
|
(Amounts in Thousands, Except Per Share Data) |
||||||||||
|
(UNAUDITED) |
||||||||||
|
|
||||||||||
|
|
|
|
Three Months Ended |
|
|
Six Months Ended |
||||
|
|
|
|
June 30, |
|
|
June 30, |
||||
|
|
|
2020 |
|
2019 |
|
|
2020 |
|
2019 |
|
|
|
|
|
|
|
|
|
|
|
||
|
Sales |
$ |
490,966 |
$ |
601,602 |
|
$ |
1,005,930 |
$ |
1,204,422 |
|
|
Cost of sales |
|
456,294 |
|
552,379 |
|
|
927,897 |
|
1,105,162 |
|
|
|
Gross profit |
|
34,672 |
|
49,223 |
|
|
78,033 |
|
99,260 |
|
Selling, general and administrative expenses |
|
28,516 |
|
31,507 |
|
|
60,091 |
|
61,514 |
|
|
Amortization of intangible assets |
|
2,371 |
|
2,361 |
|
|
4,752 |
|
4,728 |
|
|
Restructuring charges and other costs |
|
5,657 |
|
3,414 |
|
|
8,572 |
|
4,990 |
|
|
|
Income (loss) from operations |
|
(1,872) |
|
11,941 |
|
|
4,618 |
|
28,028 |
|
Interest expense |
|
(2,351) |
|
(1,718) |
|
|
(4,053) |
|
(3,327) |
|
|
Interest income |
|
287 |
|
1,053 |
|
|
886 |
|
2,350 |
|
|
Other income (expense), net |
|
32 |
|
808 |
|
|
(630) |
|
2,412 |
|
|
|
Income (loss) before income taxes |
|
(3,904) |
|
12,084 |
|
|
821 |
|
29,463 |
|
Income tax expense (benefit) |
|
(497) |
|
2,637 |
|
|
376 |
|
6,243 |
|
|
|
Net income (loss) |
$ |
(3,407) |
$ |
9,447 |
|
$ |
445 |
$ |
23,220 |
|
|
|
|
|
|
|
|
|
|
|
|
|
Earnings (loss) per share: |
|
|
|
|
|
|
|
|
|
|
|
|
Basic |
$ |
(0.09) |
$ |
0.25 |
|
$ |
0.01 |
$ |
0.59 |
|
|
Diluted |
$ |
(0.09) |
$ |
0.24 |
|
$ |
0.01 |
$ |
0.58 |
|
|
|
|
|
|
|
|
|
|
|
|
|
Weighted-average number of shares used in calculating |
|
|
|
|
|
|
|
|
||
|
earnings (loss) per share: |
|
|
|
|
|
|
|
|
||
|
|
Basic |
|
36,439 |
|
38,426 |
|
|
36,614 |
|
39,522 |
|
|
Diluted |
|
36,439 |
|
38,583 |
|
|
36,863 |
|
39,843 |
For comparative purposes, certain prior year amounts have been reclassified to conform to the current year presentation.
5
|
|
|
|
|
|
|
|
|
|
|
|
Benchmark Electronics, Inc. and Subsidiaries |
|||||||||
|
|
|
|
|
|
|
|
|
|
|
|
Condensed Consolidated Balance Sheets |
|||||||||
|
(UNAUDITED) |
|||||||||
|
(in thousands) |
|||||||||
|
|
|
|
|
|
|
June 30, |
|
|
December 31, |
|
|
|
|
|
|
|
2020 |
|
|
2019 |
|
|
|
|
|
|
|
|
|
|
|
|
Assets |
|
|
|
|
|
||||
|
|
Current assets: |
|
|
|
|
|
|||
|
|
|
Cash and cash equivalents |
$ |
356,419 |
|
$ |
363,956 |
||
|
|
|
Accounts receivable, net |
|
302,068 |
|
|
324,424 |
||
|
|
|
Contract assets |
|
153,641 |
|
|
161,061 |
||
|
|
|
Inventories |
|
363,665 |
|
|
314,956 |
||
|
|
|
Other current assets |
|
32,326 |
|
|
30,685 |
||
|
|
|
|
|
Total current assets |
|
1,208,119 |
|
|
1,195,082 |
|
|
Property, plant and equipment, net |
|
198,001 |
|
|
205,819 |
|||
|
|
Operating lease right-of-use assets |
|
74,170 |
|
|
76,859 |
|||
|
|
Goodwill and other, net |
|
277,745 |
|
|
282,114 |
|||
|
|
|
|
|
Total assets |
$ |
1,758,035 |
|
$ |
1,759,874 |
|
|
|
|
|
|
|
|
|
|
|
|
Liabilities and Shareholders’ Equity |
|
|
|
|
|
||||
|
|
Current liabilities: |
|
|
|
|
|
|||
|
|
|
Current installments of long-term debt and finance lease obligations |
$ |
8,912 |
|
$ |
8,825 |
||
|
|
|
Accounts payable |
|
304,601 |
|
|
302,994 |
||
|
|
|
Accrued liabilities |
|
151,107 |
|
|
147,426 |
||
|
|
|
|
|
Total current liabilities |
|
464,620 |
|
|
459,245 |
|
|
Long-term debt and finance lease obligations, less current installments |
|
164,664 |
|
|
138,912 |
|||
|
|
Operating lease liabilities |
|
64,768 |
|
|
67,898 |
|||
|
|
Other long-term liabilities |
|
79,623 |
|
|
78,987 |
|||
|
|
Shareholders’ equity |
|
984,360 |
|
|
1,014,832 |
|||
|
|
|
|
|
Total liabilities and shareholders’ equity |
$ |
1,758,035 |
|
$ |
1,759,874 |
6
|
|
|
|
|
|
|
|
|
|
|
|
Benchmark Electronics, Inc. and Subsidiaries |
|||||||||
|
|
|
|
|
|
|
|
|
|
|
|
Condensed Consolidated Statement of Cash Flows |
|||||||||
|
(in thousands) |
|||||||||
|
(UNAUDITED) |
|||||||||
|
|
|
|
|
|
|
|
|
|
|
|
|
|
|
|
|
|
Six Months Ended |
|||
|
|
|
|
|
|
|
June 30, |
|||
|
|
|
|
|
|
|
2020 |
|
|
2019 |
|
|
|
|
|
|
|
|
|
|
|
|
Cash flows from operating activities: |
|
|
|
|
|
||||
|
|
Net income |
$ |
445 |
|
$ |
23,220 |
|||
|
|
Depreciation and amortization |
|
24,531 |
|
|
24,125 |
|||
|
|
Stock-based compensation expense |
|
6,044 |
|
|
5,720 |
|||
|
|
Accounts receivable, net |
|
20,356 |
|
|
106,749 |
|||
|
|
Contract assets |
|
7,420 |
|
|
(15,464) |
|||
|
|
Inventories |
|
(48,668) |
|
|
(6,327) |
|||
|
|
Accounts payable |
|
6,980 |
|
|
(49,428) |
|||
|
|
Other changes in working capital and other, net |
|
2,810 |
|
|
(19,823) |
|||
|
|
|
Net cash provided by operations |
|
19,918 |
|
|
68,772 |
||
|
|
|
|
|
|
|
|
|||
|
Cash flows from investing activities: |
|
|
|
|
|
||||
|
|
Additions to property, plant and equipment and software |
|
(23,290) |
|
|
(15,495) |
|||
|
|
Other investing activities, net |
|
2,576 |
|
|
49 |
|||
|
|
|
Net cash used in investing activities |
|
(20,714) |
|
|
(15,446) |
||
|
|
|
|
|
|
|
|
|
|
|
|
Cash flows from financing activities: |
|
|
|
|
|
||||
|
|
Share repurchases |
|
(19,329) |
|
|
(100,039) |
|||
|
|
Net debt activity |
|
25,608 |
|
|
(2,441) |
|||
|
|
Other financing activities, net |
|
(12,802) |
|
|
(12,628) |
|||
|
|
|
Net cash used in financing activities |
|
(6,523) |
|
|
(115,108) |
||
|
|
|
|
|
|
|
|
|
|
|
|
Effect of exchange rate changes |
|
(218) |
|
|
293 |
||||
|
Net decrease in cash and cash equivalents |
|
(7,537) |
|
|
(61,489) |
||||
|
|
Cash and cash equivalents at beginning of year |
|
363,956 |
|
|
458,102 |
|||
|
|
Cash and cash equivalents at end of period |
$ |
356,419 |
|
$ |
396,613 |
|||
|
|
|
|
|
|
|
|
|
|
|
7
|
|
|
|
|
|
|
|
|
|
|
|
|
|
|
|
Benchmark Electronics, Inc. and Subsidiaries |
|
||||||||||||
|
|
|
|
|
|
|
|
|
|
|
|
|
|
|
|
Reconciliation of GAAP to Non-GAAP Financial Results |
|
||||||||||||
|
(Amounts in Thousands, Except Per Share Data) |
|
||||||||||||
|
(UNAUDITED) |
|
||||||||||||
|
|
|
|
|
|
|
|
|
|
|
|
|
|
|
|
|
|
|
Three Months Ended |
|
|
Six Months Ended |
|
||||||
|
|
|
|
Jun 30, |
|
Mar 31, |
|
Jun 30, |
|
|
Jun 30, |
|
||
|
|
|
|
2020 |
|
2020 |
|
2019 |
|
|
2020 |
|
2019 |
|
|
|
|
|
|
|
|
|
|
|
|
||||
|
Income (loss) from operations (GAAP) |
$ |
(1,872) |
$ |
6,490 |
$ |
11,941 |
|
$ |
4,618 |
$ |
28,028 |
|
|
|
Restructuring charges and other costs |
|
5,657 |
|
1,908 |
|
3,414 |
|
|
7,565 |
|
4,990 |
|
|
|
Settlement |
|
— |
|
— |
|
773 |
|
|
— |
|
773 |
|
|
|
Impairment |
|
— |
|
1,007 |
|
— |
|
|
1,007 |
|
— |
|
|
|
Customer insolvency (recovery) |
|
(353) |
|
— |
|
(16) |
|
|
(353) |
|
(2,758) |
|
|
|
Amortization of intangible assets |
|
2,371 |
|
2,381 |
|
2,361 |
|
|
4,752 |
|
4,728 |
|
|
|
Non-GAAP income from operations |
$ |
5,803 |
$ |
11,786 |
$ |
18,473 |
|
$ |
17,589 |
$ |
35,761 |
|
|
|
|
|
|
|
|
|
|
|
|
|
|
|
|
|
|
Gross Profit (GAAP) |
$ |
34,672 |
$ |
43,361 |
$ |
49,223 |
|
$ |
78,033 |
$ |
99,260 |
|
|
|
Settlement |
|
— |
|
— |
|
773 |
|
|
— |
|
773 |
|
|
|
Customer insolvency (recovery) |
|
(353) |
|
— |
|
(16) |
|
|
(353) |
|
(1,040) |
|
|
|
Non-GAAP gross profit |
$ |
34,319 |
$ |
43,361 |
$ |
49,980 |
|
$ |
77,680 |
$ |
98,993 |
|
|
|
|
|
|
|
|
|
|
|
|
|
|
|
|
|
|
Net income (loss) (GAAP) |
$ |
(3,407) |
$ |
3,852 |
$ |
9,447 |
|
$ |
445 |
$ |
23,220 |
|
|
|
Restructuring charges and other costs |
|
5,657 |
|
1,908 |
|
3,414 |
|
|
7,565 |
|
4,990 |
|
|
|
Customer insolvency (recovery) |
|
(353) |
|
— |
|
(16) |
|
|
(353) |
|
(2,758) |
|
|
|
Amortization of intangible assets |
|
2,371 |
|
2,381 |
|
2,361 |
|
|
4,752 |
|
4,728 |
|
|
|
Settlements |
|
— |
|
— |
|
(330) |
|
|
— |
|
(2,166) |
|
|
|
Impairment |
|
— |
|
1,007 |
|
— |
|
|
1,007 |
|
— |
|
|
|
Income tax adjustments(1) |
|
(1,584) |
|
(1,078) |
|
(1,039) |
|
|
(2,623) |
|
(833) |
|
|
|
Non-GAAP net income |
$ |
2,684 |
$ |
8,070 |
$ |
13,837 |
|
$ |
10,793 |
$ |
27,181 |
|
|
|
|
|
|
|
|
|
|
|
|
|
|
|
|
|
|
Diluted earnings (loss) per share: |
|
|
|
|
|
|
|
|
|
|
|
|
|
|
|
Diluted (GAAP) |
$ |
(0.09) |
$ |
0.10 |
$ |
0.24 |
|
$ |
0.01 |
$ |
0.58 |
|
|
|
Diluted (Non-GAAP) |
$ |
0.07 |
$ |
0.22 |
$ |
0.36 |
|
$ |
0.29 |
$ |
0.68 |
|
|
|
|
|
|
|
|
|
|
|
|
|
|
|
|
|
Weighted-average number of shares used in |
|
|
|
|
|
|
|
|
|
|
|
||
|
calculating diluted earnings (loss) per share: |
|
|
|
|
|
|
|
|
|
|
|
||
|
|
Diluted (GAAP) |
|
36,439 |
|
37,071 |
|
38,583 |
|
|
36,863 |
|
39,843 |
|
|
|
Diluted (Non-GAAP) |
|
36,689 |
|
37,071 |
|
38,583 |
|
|
36,863 |
|
39,843 |
|
(1) This amount represents the tax impact of the non-GAAP adjustments using the applicable effective tax rates.
8

| 1 Q2 - 20 Earnings Call July 29, 2020
| 2 | 2 This press release contains forward - looking statements within the meaning of Section 27A of the Securities Act of 1933 and Section 21E of the Securities Exchange Act of 1934. The words "expect," "estimate," "anticipate," "could" "predict" and similar expressions, and the negatives thereof, often identify forward - looking statements, which are not limited to historical facts. Forward - looking statements include, among other things, the estimated financial impact of the COVID - 19 pandemic, the outlook and guidance for second quarter 2020 results, the company’s anticipated plans and responses to the COVID - 19 pandemic, statements (express or implied) concerning future operating results or margins, the ability to generate sales and income or cash flow, and expected revenue mix; and Benchmark’s business and growth strategies. Although the company believes these statements are based upon reasonable assumptions, they involve risks and uncertainties relating to operations, markets and the business environment generally. These statements also depend on the duration and severity of the COVID - 19 pandemic and related risks, including government and other third - party responses to it and the consequences for the global economy, our business and the businesses of our suppliers and customers. Events relating to or resulting from the COVID - 19 pandemic, including the possibility of customer demand fluctuations, supply chain constraints, or the ability to utilize our manufacturing facilities at sufficient levels to cover our fixed operating costs, may have resulting impacts on the company’s business, financial condition, results of operations, and the company’s ability (or inability) to execute on its plans to respond to the COVID - 19 pandemic. If one or more of these risks or uncertainties materializes, or underlying assumptions prove incorrect, actual outcomes may vary materially from those indicated. Readers are advised to consult further disclosures on these risks and uncertainties, particularly in Part 1, Item 1A, "Risk Factors" of the company's Annual Report on Form 10 - K for the year ended December 31, 2019 and in its subsequent filings with the Securities and Exchange Commission. All forward - looking statements included in this document are based upon information available to the company as of the date of this document, and it assumes no obligation to update them. This document includes certain financial measures that exclude items and therefore are not in accordance with U.S. generally accepted accounting principles (“GAAP”). A detailed reconciliation between GAAP results and results excluding special items (“non - GAAP”) is included in the Appendix of this document. In situations where a non - GAAP reconciliation has not been provided, the company was unable to provide such a reconciliation without unreasonable effort due to the uncertainty and inherent difficulty predicting the occurrence, the financial impact and the periods in which the non - GAAP adjustments may be recognized. Management discloses non-GAAP information to provide investors with additional information to analyze the Company’s performance and underlying trends. Management uses non-GAAP measures that exclude certain items in order to better assess operating performance and help investors compare results with our previous guidance. This document also references “free cash flow”, which the Company defines as cash flow from operations less additions to property, plant and equipment and purchased software. The Company’s non-GAAP information is not necessarily comparable to the non-GAAP information used by other companies. Non-GAAP information should not be viewed as a substitute for, or superior to, net income or other data prepared in accordance with GAAP as a measure of the Company’s profitability or liquidity. Readers should consider the types of events and transactions for which adjustments have been made. Forward - Looking Statements Non - GAAP Financial Information
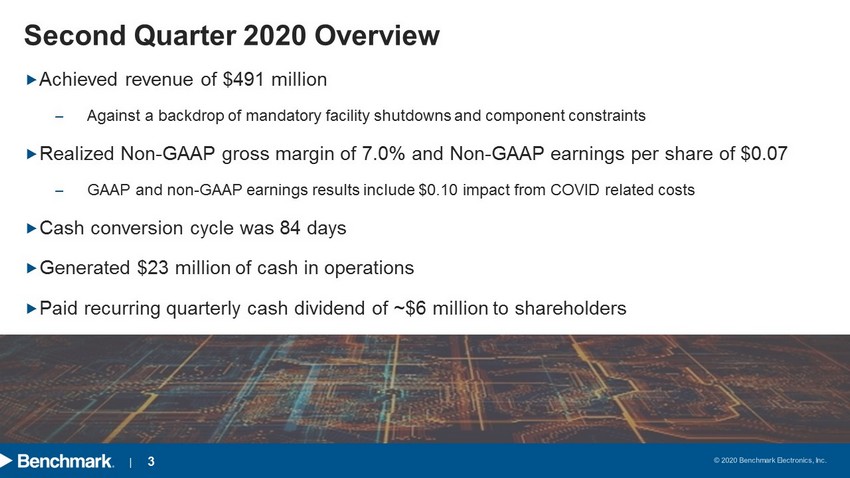
| 3 Second Quarter 2020 Overview Achieved revenue of $491 million ‒ Against a backdrop of mandatory facility shutdowns and component constraints Realized Non - GAAP gross margin of 7.0% and Non - GAAP earnings per share of $0.07 ‒ GAAP and non - GAAP earnings results include $0.10 impact from COVID related costs Cash conversion cycle was 84 days Generated $23 million of cash in operations Paid recurring quarterly cash dividend of ~$6 million to shareholders
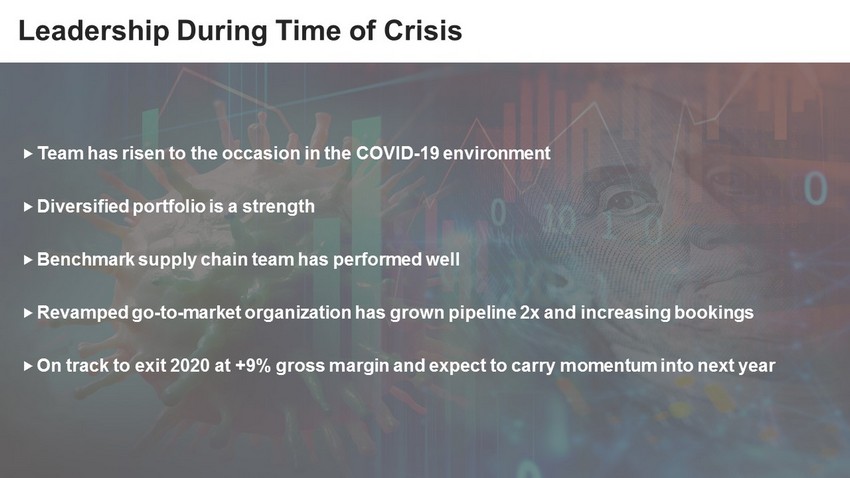
| 4 Leadership During Time of Crisis Team has risen to the occasion in the COVID - 19 environment Diversified portfolio is a strength Benchmark supply chain team has performed well Revamped go - to - market organization has grown pipeline 2x and increasing bookings On track to exit 2020 at +9% gross margin and e xpect to carry momentum into next year

| 5 Benchmark Continued Response to COVID - 19 Global Pandemic Priority is sustaining a safe work environment for our employees ‒ Utilizing a closed loop feedback employee survey program to ensure our employees feel safe ‒ Maintaining protective gear for employees and evolving testing solutions ‒ Enhancing deep cleaning and decontamination protocols ‒ Progressing proximity distancing, contract tracing, and occupancy monitoring ‒ Pivot to virtual customer engagements via video conferencing ‒ Work from home and quarantine protocols remain ‒ Adding additional facility safety enhancements: air cleaning/quality and touchless equipment
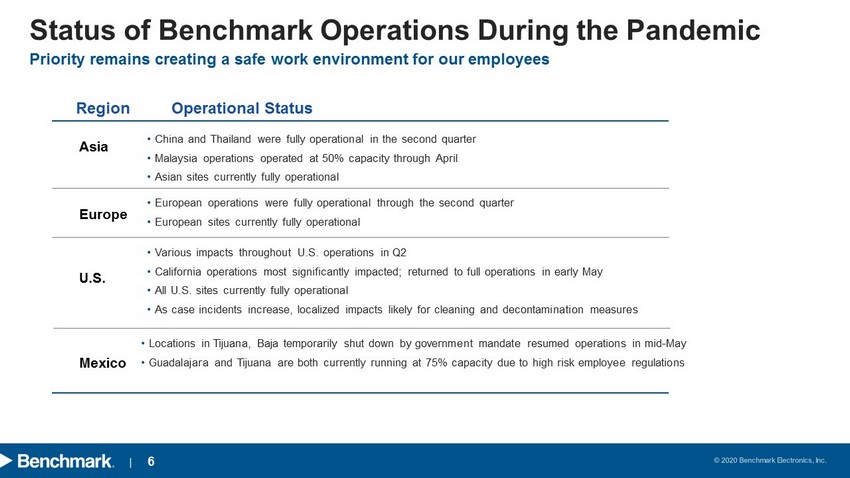
| 6 Status of Benchmark Operations During the Pandemic Priority remains creating a safe work environment for our employees Asia Europe U.S. Mexico • Various impacts throughout U.S. operations in Q2 • California operations most significantly impacted; returned to full operations in early May • All U.S. sites currently fully operational • As case incidents increase, localized impacts likely for cleaning and decontamination measures • China and Thailand were fully operational in the second quarter • Malaysia operations operated at 50% capacity through April • Asian sites currently fully operational • Locations in Tijuana, Baja temporarily shut down by government mandate resumed operations in mid - May • Guadalajara and Tijuana are both currently running at 75% capacity due to high risk employee regulations Region Operational Status • European operations were fully operational through the second quarter • European sites currently fully operational

| 7 Roop Lakkaraju Chief Financial Officer
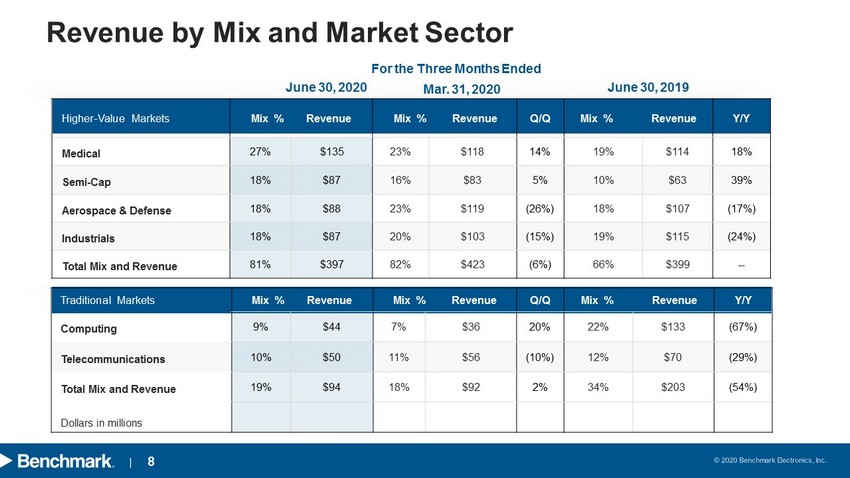
| 8 Revenue by Mix and Market Sector For the Three Months Ended Higher - Value Markets Mix % Revenue Mix % Revenue Q/Q Mix % Revenue Y/Y Medical 27% $135 23% $118 14% 19% $114 18% Semi - Cap 18% $87 16% $83 5% 10% $63 39% Aerospace & Defense 18% $88 23% $119 (26%) 18% $107 (17%) Industrials 18% $87 20% $103 (15%) 19% $115 (24%) Total Mix and Revenue 81% $397 82% $423 (6%) 66% $399 -- Dollars in millions Traditional Markets Mix % Revenue Mix % Revenue Q/Q Mix % Revenue Y/Y Computing 9% $44 7% $36 20% 22% $133 (67%) Telecommunications 10% $50 11% $56 (10%) 12% $70 (29%) Total Mix and Revenue 19% $94 18% $92 2% 34% $203 (54%) June 30, 2020 Mar. 31, 2020 June 30, 2019
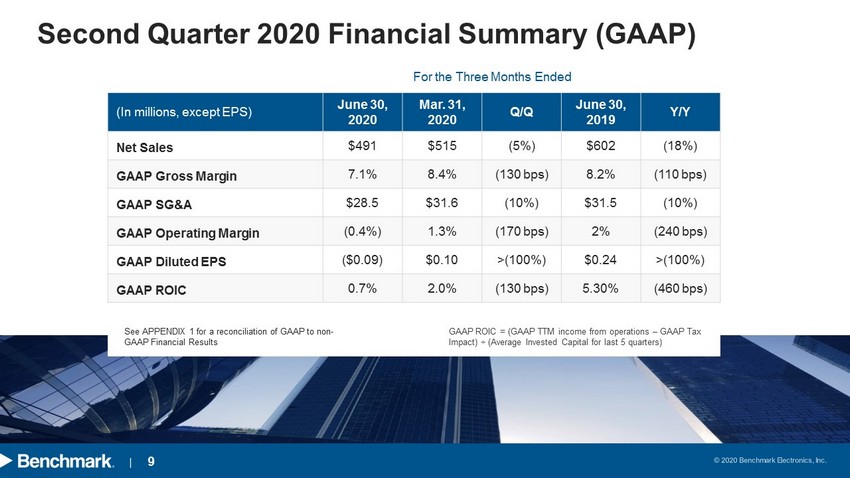
| 9 Second Quarter 2020 Financial Summary (GAAP) See APPENDIX 1 for a reconciliation of GAAP to non - GAAP Financial Results For the Three Months Ended (In millions, except EPS) June 30 , 2020 Mar. 31 , 2020 Q/Q June 30 , 2019 Y/Y Net Sales $491 $515 (5%) $602 (18%) GAAP Gross Margin 7.1% 8.4% (130 bps) 8.2% (110 bps) GAAP SG&A $28.5 $31.6 ( 10%) $31.5 (10%) GAAP Operating Margin (0.4%) 1.3% (170 bps) 2% (240 bps) GAAP Diluted EPS ($0.09) $0.10 >(100%) $0.24 >(100%) GAAP ROIC 0.7% 2.0% (130 bps) 5.30% (460 bps) GAAP ROIC = (GAAP TTM income from operations – GAAP Tax Impact) ÷ (Average Invested Capital for last 5 quarters)
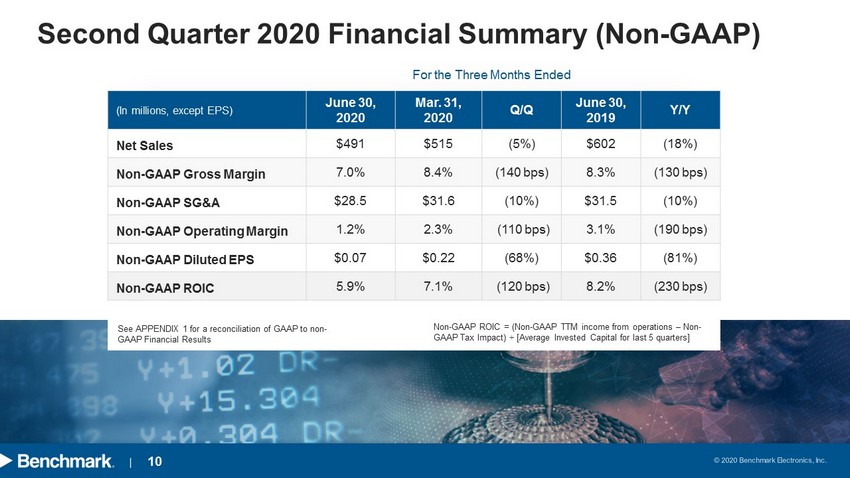
| 10 Second Quarter 2020 Financial Summary (Non - GAAP) For the Three Months Ended (In millions, except EPS) June 30 , 2020 Mar. 31 , 2020 Q/Q June 30 , 2019 Y/Y Net Sales $491 $515 (5%) $602 (18%) Non - GAAP Gross Margin 7.0% 8.4% (140 bps) 8.3% (130 bps) Non - GAAP SG&A $28.5 $31.6 (10%) $31.5 (10%) Non - GAAP Operating Margin 1.2% 2.3% (110 bps) 3.1% (190 bps) Non - GAAP Diluted EPS $0.07 $0.22 (68%) $0.36 (81%) Non - GAAP ROIC 5.9% 7.1% (120 bps) 8.2% (230 bps) See APPENDIX 1 for a reconciliation of GAAP to non - GAAP Financial Results Non - GAAP ROIC = (Non - GAAP TTM income from operations – Non - GAAP Tax Impact) ÷ [Average Invested Capital for last 5 quarters]
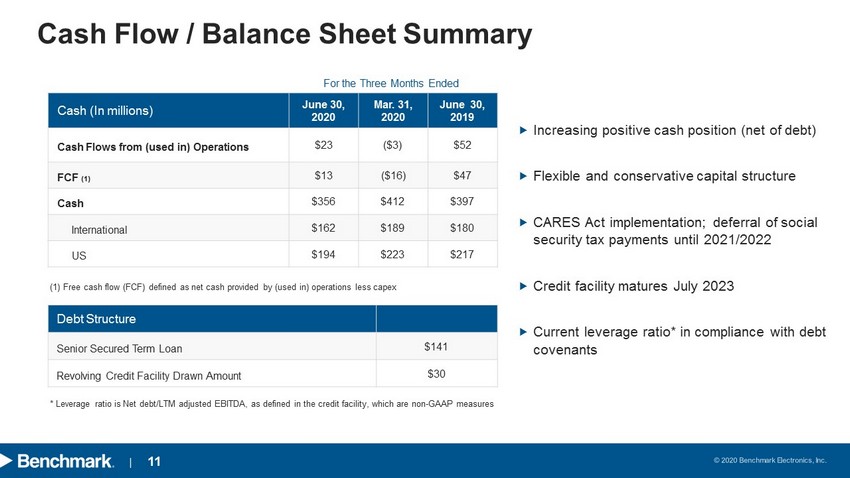
| 11 Cash (In millions) June 30 , 2020 Mar. 31 , 2020 June 30, 2019 Cash Flows from (used in) Operations $23 ($3) $52 FCF (1) $13 ($16) $47 Cash $356 $412 $397 International $162 $189 $180 US $194 $223 $217 Cash Flow / Balance Sheet Summary For the Three Months Ended (1) Free cash flow (FCF) defined as net cash provided by (used in) operations less capex Increasing positive cash position (net of debt) Flexible and conservative capital structure CARES Act implementation; deferral of social security tax payments until 2021/2022 Credit facility matures July 2023 Current leverage ratio* in compliance with debt covenants Debt Structure Senior Secured Term Loan $141 Revolving Credit Facility Drawn Amount $30 * Leverage ratio is Net debt/LTM adjusted EBITDA, as defined in the credit facility, which are non - GAAP measures
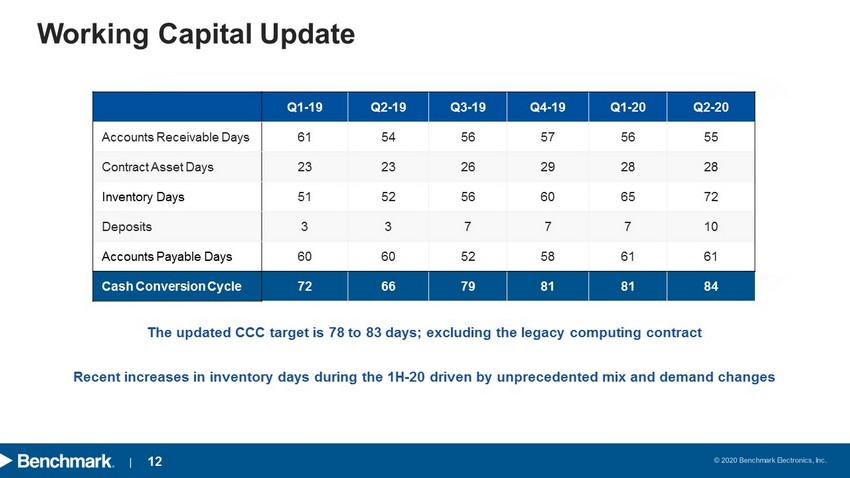
| 12 Working Capital Update Q1 - 19 Q2 - 19 Q3 - 19 Q4 - 19 Q1 - 20 Q2 - 20 Accounts Receivable Days 61 54 56 57 56 55 Contract Asset Days 23 23 26 29 28 28 Inventory Days 51 52 56 60 65 72 Deposits 3 3 7 7 7 10 Accounts Payable Days 60 60 52 58 61 61 Cash Conversion Cycle 72 66 79 81 81 84 The updated CCC target is 78 to 83 days; excluding the legacy computing contract Recent increases in inventory days during the 1H - 20 driven by unprecedented mix and demand changes
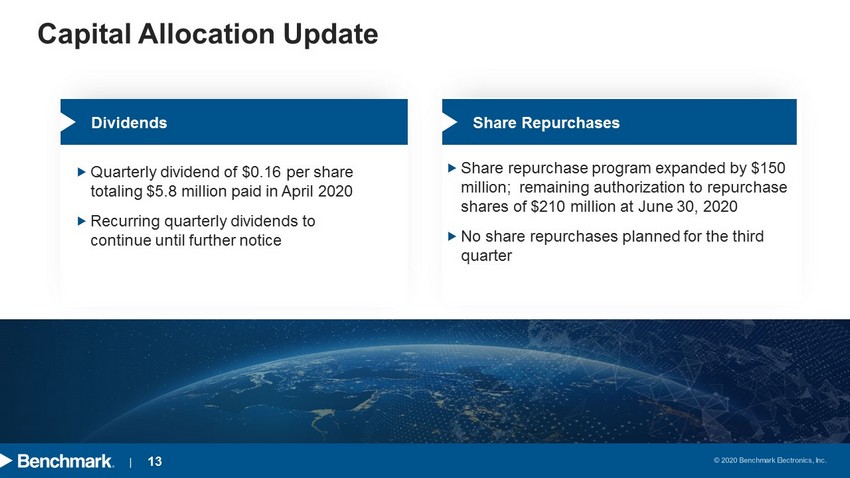
| 13 Capital Allocation Update Dividends Quarterly dividend of $0.16 per share totaling $5.8 million paid in April 2020 Recurring quarterly dividends to continue until further notice Share Repurchases Share repurchase program expanded by $150 million; remaining authorization to repurchase shares of $210 million at June 30, 2020 No share repurchases planned for the third quarter
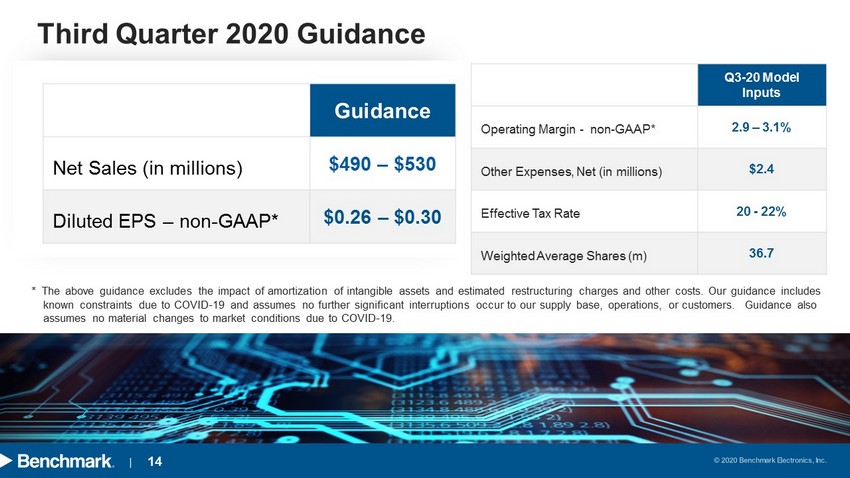
| 14 Third Quarter 2020 Guidance * The above guidance excludes the impact of amortization of intangible assets and estimated restructuring charges and other costs. Our guidance includes known constraints due to COVID - 19 and assumes no further significant interruptions occur to our supply base, operations, or cust omers. Guidance also assumes no material changes to market conditions due to COVID - 19 . Guidance Net Sales (in millions) $490 – $530 Diluted EPS – non - GAAP* $0.26 – $ 0.30 Q3 - 20 Model Inputs Operating Margin - non - GAAP* 2.9 – 3.1% Other Expenses, Net (in millions) $2.4 Effective Tax Rate 20 - 22% Weighted Average Shares (m) 36.7
| 15 Jeff Benck President & Chief Executive Officer
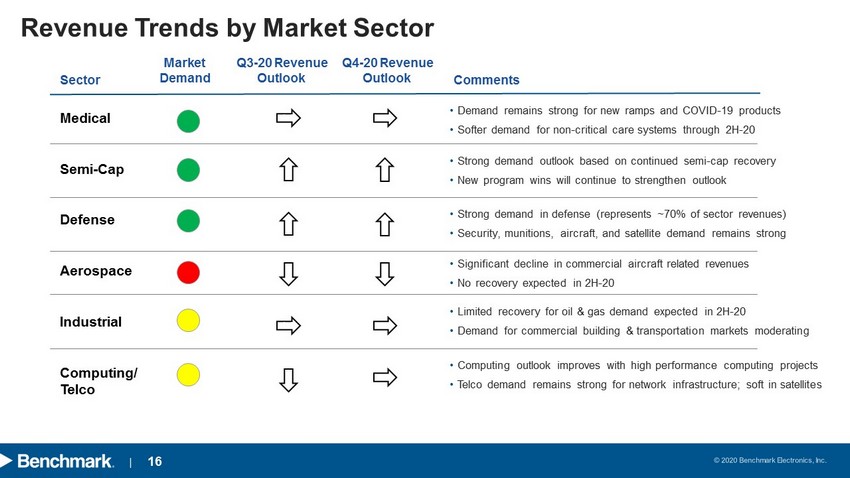
| 16 Revenue Trends by Market Sector Medical Semi - Cap Defense Aerospace Industrial Computing/ Telco • Demand remains strong for new ramps and COVID - 19 products • Softer demand for non - critical care systems through 2H - 20 • Strong demand in defense (represents ~70% of sector revenues) • S ecurity , munitions, aircraft , and satellite demand remains strong • Strong demand outlook based on continued semi - cap recovery • New program wins will continue to strengthen outlook • Limited recovery for oil & gas demand expected in 2H - 20 • Demand for commercial building & transportation markets moderating • Computing outlook improves with high performance computing projects • Telco demand remains strong for network infrastructure; soft in satellites Market Demand Sector Comments • Significant decline in commercial aircraft related revenues • No recovery expected in 2H - 20 Q3 - 20 Revenue Outlook Q4 - 20 Revenue Outlook z z
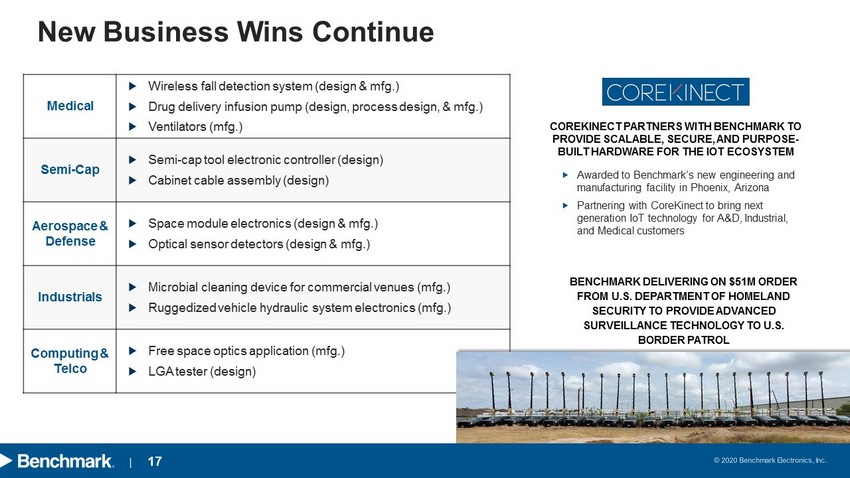
| 17 New Business Wins Continue Medical Wireless fall detection system (design & mfg.) Drug delivery i nfusion pump (design, process design, & mfg. ) Ventilators ( mfg.) Semi - Cap Semi - cap tool electronic controller (design) Cabinet cable assembly (design) Aerospace & Defense Space module electronics (design & mfg.) Optical sensor detectors (design & mfg.) Industrials Microbial cleaning device for commercial venues (mfg.) Ruggedized vehicle hydraulic system electronics (mfg.) Computing & Telco Free space optics application (mfg.) LGA tester (design) Awarded to Benchmark’s new engineering and manufacturing facility in Phoenix, Arizona Partnering with CoreKinect to bring next generation IoT technology for A&D, Industrial, and Medical customers COREKINECT PARTNERS WITH BENCHMARK TO PROVIDE SCALABLE, SECURE, AND PURPOSE - BUILT HARDWARE FOR THE IOT ECOSYSTEM BENCHMARK DELIVERING ON $51M ORDER FROM U.S. DEPARTMENT OF HOMELAND SECURITY TO PROVIDE ADVANCED SURVEILLANCE TECHNOLOGY TO U.S. BORDER PATROL
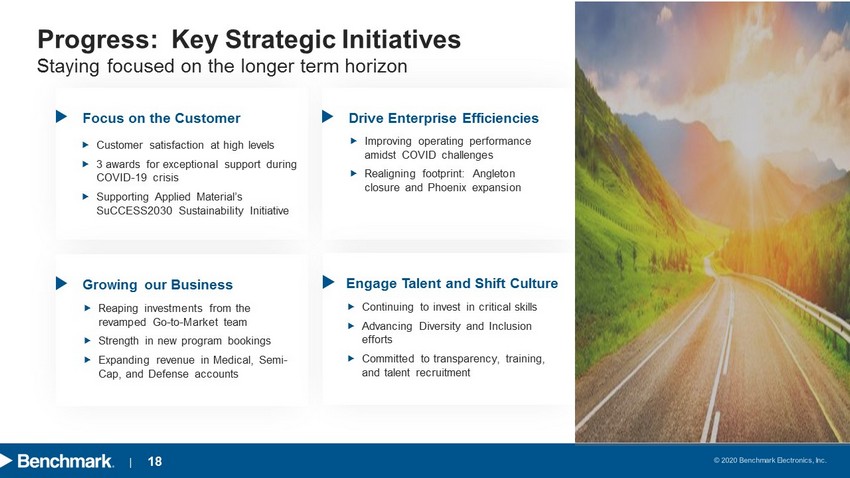
| 18 Progress: Key Strategic Initiatives Staying focused on the longer term horizon Customer satisfaction at high levels 3 awards for exceptional support during COVID - 19 crisis Supporting Applied Material’s SuCCESS2030 Sustainability Initiative Focus on the Customer Improving operating performance amidst COVID challenges Realigning footprint: Angleton closure and Phoenix expansion Drive Enterprise Efficiencies Reaping investments from the revamped Go - to - Market team Strength in new program bookings Expanding revenue in Medical, Semi - Cap, and Defense accounts Growing our Business Continuing to invest in critical skills Advancing Diversity and Inclusion efforts Committed to transparency, training, and talent recruitment Engage Talent and Shift Culture
| 19 Appendix
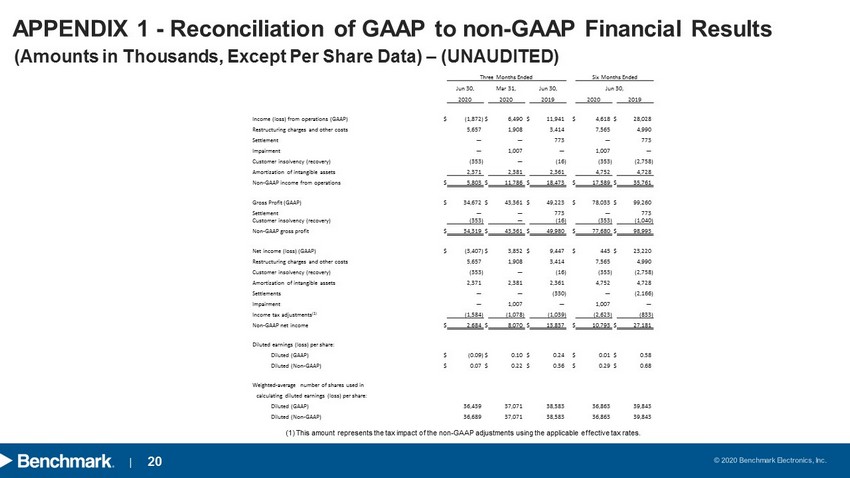
| 20 (Amounts in Thousands, Except Per Share Data) – (UNAUDITED) APPENDIX 1 - Reconciliation of GAAP to non - GAAP Financial Results (1) This amount represents the tax impact of the non - GAAP adjustments using the applicable effective tax rates. Three Months Ended Six Months Ended Jun 30, Mar 31, Jun 30, Jun 30, 2020 2020 2019 2020 2019 Income (loss) from operations (GAAP) $ (1,872) $ 6,490 $ 11,941 $ 4,618 $ 28,028 Restructuring charges and other costs 5,657 1,908 3,414 7,565 4,990 Settlement — — 773 — 773 Impairment — 1,007 — 1,007 — Customer insolvency (recovery) (353) — (16) (353) (2,758) Amortization of intangible assets 2,371 2,381 2,361 4,752 4,728 Non - GAAP income from operations $ 5,803 $ 11,786 $ 18,473 $ 17,589 $ 35,761 Gross Profit (GAAP) $ 34,672 $ 43,361 $ 49,223 $ 78,033 $ 99,260 Settlement — — 773 — 773 Customer insolvency (recovery) (353) — (16) (353) (1,040) Non - GAAP gross profit $ 34,319 $ 43,361 $ 49,980 $ 77,680 $ 98,993 Net income (loss) (GAAP) $ (3,407) $ 3,852 $ 9,447 $ 445 $ 23,220 Restructuring charges and other costs 5,657 1,908 3,414 7,565 4,990 Customer insolvency (recovery) (353) — (16) (353) (2,758) Amortization of intangible assets 2,371 2,381 2,361 4,752 4,728 Settlements — — (330) — (2,166) Impairment — 1,007 — 1,007 — Income tax adjustments (1) (1,584) (1,078) (1,039) (2,623) (833) Non - GAAP net income $ 2,684 $ 8,070 $ 13,837 $ 10,793 $ 27,181 Diluted earnings (loss) per share: Diluted (GAAP) $ (0.09) $ 0.10 $ 0.24 $ 0.01 $ 0.58 Diluted (Non - GAAP) $ 0.07 $ 0.22 $ 0.36 $ 0.29 $ 0.68 Weighted - average number of shares used in calculating diluted earnings (loss) per share: Diluted (GAAP) 36,439 37,071 38,583 36,863 39,843 Diluted (Non - GAAP) 36,689 37,071 38,583 36,863 39,843
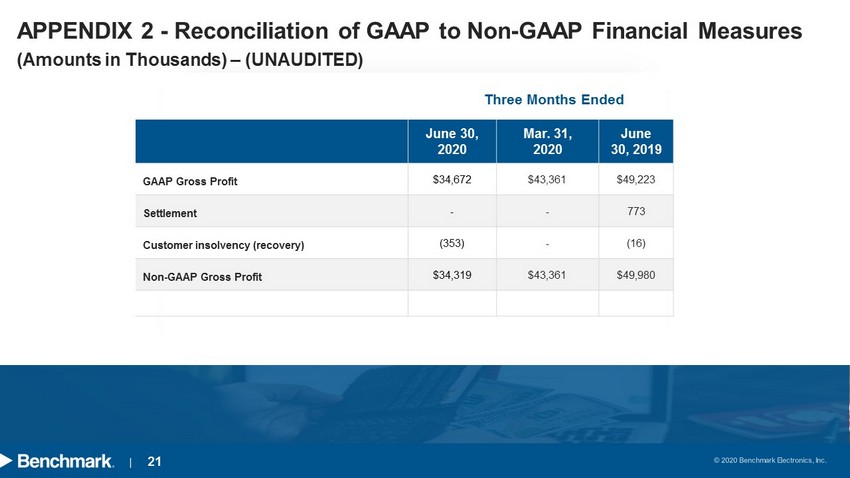
| 21 (Amounts in Thousands) – (UNAUDITED) APPENDIX 2 - Reconciliation of GAAP to Non - GAAP Financial Measures Three Months Ended June 30 , 2020 Mar. 31 , 2020 June 30, 2019 GAAP Gross Profit $34,672 $43,361 $49,223 Settlement - - 773 Customer insolvency (recovery) (353) - (16) Non - GAAP Gross Profit $34,319 $43,361 $49,980
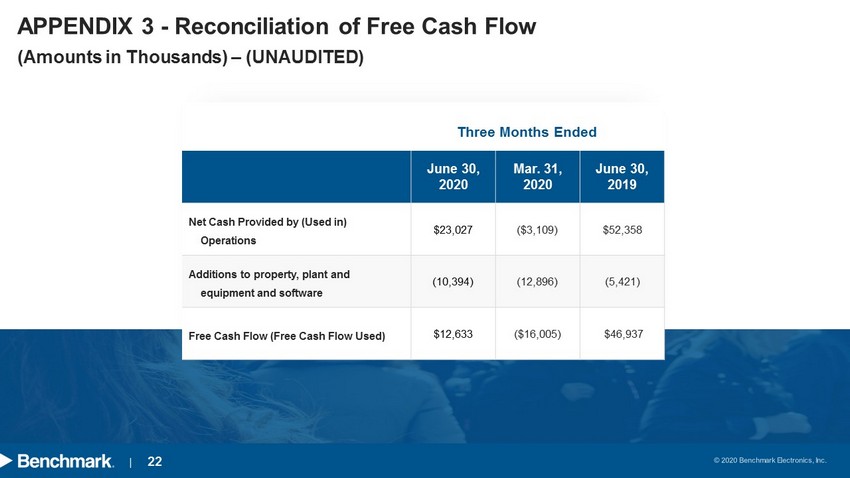
| 22 (Amounts in Thousands) – (UNAUDITED) APPENDIX 3 - Reconciliation of Free Cash Flow Three Months Ended June 30 , 2020 Mar. 31 , 2020 June 30 , 2019 Net Cash Provided by (Used in) Operations $23,027 ($3,109) $52,358 Additions to property, plant and equipment and software (10,394) (12,896) (5,421) Free Cash Flow (Free Cash Flow Used) $12,633 ($16,005) $46,937