bheForm8k20201028
0000863436 false 0000863436 2020-10-28 2020-10-28


UNITED STATES
SECURITIES AND EXCHANGE COMMISSION
Washington, D.C. 20549
 
FORM
8-K
 
CURRENT REPORT
Pursuant to Section 13 or 15(d)
of the Securities Exchange Act of 1934
 
Date of Report (Date of earliest event reported):
 
October 28, 2020
 
BENCHMARK ELECTRONICS, INC.
(Exact name of registrant as specified
 
in its charter)
 
Texas
(State or other jurisdiction
of incorporation)
1-10560
(Commission
File Number)
74-2211011
(I.R.S. Employer
Identification No.)
 
56 South Rockford Drive
,
Tempe
,
Arizona
 
85281
(Address of Principal Executive
 
Offices)
 
(Zip Code)
 
Registrant’s telephone number,
 
including area code:
 
(
623
)
300-7000
 
Not Applicable
(Former
 
name or
 
former
 
address,
 
if changed
 
since
 
last report)
 
Check the appropriate box below
 
if the Form 8-K filing is intended
 
to simultaneously satisfy
 
the filing obligation of the
registrant under any of the following
 
provisions (see General Instruction
 
A.2. below):
 
 
Written communications pursuant to Rule 425
 
under the Securities Act
 
(17 CFR 230.425)
 
 
Soliciting material pursuant to Rule 14a-12
 
under the Exchange Act (17 CFR
 
240.14a-12)
 
 
Pre-commencement communications pursuant
 
to Rule 14d-2(b) under the
 
Exchange Act (17 CFR
 
240.14d-2(b))
 
 
Pre-commencement
 
communications pursuant to
 
Rule 13e-4(c) under the Exchange
 
Act (17 CFR 240.13e-4(c))
 
 
Securities
 
registered
 
pursuant
 
to Section
 
12(b) of the
 
Act:
 
Title of each class
Trading Symbol
Name of each exchange
 
on which registered
Common Stock, par value $0.10 per share
BHE
New York Stock Exchange
, Inc.
 
 
Indicate by check mark whether
 
the registrant is an emerging
 
growth company as defined in Rule
 
405 of the Securities
Act of 1933 (§230.405 of this
 
chapter) or Rule 12b-2 of the Securities
 
Exchange Act of 1934 (§240.12b-2
 
of this chapter).
 
 
Emerging growth company


If an emerging growth company, indicate by check
 
mark if the registrant has
 
elected not to use the extended
 
transition
period for complying with any new
 
or revised financial accounting
 
standards provided pursuant to
 
Section 13(a) of the
Exchange Act.


-1-
 
Item 2.02.
 
Results of Operations and
 
Financial Condition.
 
On October 28, 2020, Benchmark Electronics,
 
Inc. (the “Company”) issued a press
 
release announcing its
 
results of
operations for the quarter ended September
 
30, 2020.
 
A copy of the press release and
 
accompanying investor
presentation are attached hereto as
 
Exhibits 99.1 and 99.2, respectively, and incorporated
 
by reference herein.
 
The
information disclosed under this
 
Item 2.02, including Exhibits
 
99.1 and 99.2 hereto, shall not be deemed
 
“filed” for
purposes of Section 18 of the Securities
 
Exchange Act of 1934,
 
as amended (the “Exchange Act”),
 
or deemed
incorporated by reference in any filing
 
under the Securities Act of 1933,
 
as amended, or the Exchange Act,
 
except as
shall be expressly set forth by specific
 
reference in such a filing.
 
Item 9.01.
 
Financial Statements and Exhibits.
 
 
(d)
 
Exhibits
 
Exhibit
No.
Description
99.1
 
 
99.2
 
 
104
Cover Page Interactive Data File
 
(embedded within the Inline XBRL
 
document)
 
 
-2-
 
SIGNATURES
 
Pursuant to the requirements of
 
the Securities Exchange Act of 1934,
 
the registrant has duly caused this
 
report to be
signed on its behalf by the undersigned
 
hereunto duly authorized.
 
 
BENCHMARK ELECTRONICS, INC.
 
Date: October 28, 2020
By: /s/ Stephen J. Beaver
 
Stephen J. Beaver, Esq.
 
Vice President General Counsel


1
Exhibit 99.1
FOR IMMEDIATE RELEASE
 
BENCHMARK REPORTS THIRD QUARTER 2020 RESULTS
 
 
Quarterly revenue of $526 million
 
Semi-Cap revenue growth of 45% year-over-year
 
Medical revenue growth of 5% year-over-year
 
Quarterly GAAP diluted EPS of $0.16 and non-GAAP diluted EPS of $0.32
 
TEMPE, AZ, October 28, 2020 – Benchmark Electronics, Inc. (NYSE: BHE) today announced financial
results for the third quarter ended September 30, 2020.


Three Months Ended
Sep 30,
Jun 30,
Sep 30,
In millions, except EPS
2020
2020
2019
Sales
 
$526
$491
$555
Net income (loss)
(2)
$6
$(3)
$7
Net income – non-GAAP
(1)(2)
$12
$3
$14
Diluted earnings (loss) per share
(2)
$0.16
$(0.09)
$0.19
Diluted EPS – non-GAAP
(1)(2)
$0.32
$0.07
$0.36
Operating margin
(2)
1.6%
(0.4)%
1.8%
Operating margin – non-GAAP
(1)(2)
3.0%
1.2%
3.2%
 
(1)
 
A reconciliation of GAAP and non
 
-GAAP results is included below.
(2)
 
Results for the third
 
quarter ended September 30, 2020 and second
 
quarter ended June 30, 2020 include the
impact of approximately $1.3 million
 
and $3.4 million of COVID-19 related
 
costs,
 
respectively.
 
 
“We delivered sequential revenue and earnings growth in the third quarter as our business started to
recover from second quarter disruptions, enabling earnings to come in above our guidance for the
quarter,”
 
said CEO and President Jeff Benck. “The results were driven by a 45% year-over-year
improvement in Semi-cap and an 18% sequential improvement in the Aerospace and Defense sector,
where demand for defense related products remains strong.
 
In addition, third quarter non-GAAP gross
and operating margins improved significantly from the second quarter,
 
reaching 8.7% and 3.0%
respectively, as our global network returned to normal operating capacity.”
 
“Entering the fourth quarter,
 
we expect stronger demand and new programs in Defense, Industrials, and
Telecommunications to
 
offset declines in Medical as we are completing some of the incremental upside
builds for COVID-19 related therapeutic equipment.
 
We continue to make progress on improving gross
margins as we expect to achieve our 9% target in the fourth quarter,
 
which will enable us to also
improve earnings sequentially.”


2
Cash Conversion Cycle
Sep 30,
Jun 30,
Sep 30,
2020
2020
2019
Accounts receivable days
52
55
56
Contract asset days
28
28
26
Inventory days
66
72
56
Accounts payable days
(54)
(61)
(52)
Customer deposits
(11)
(10)
(7)
Cash Conversion Cycle days
81
84
79
 
 
Third Quarter 2020 Industry Sector Update
Revenue and percentage of sales by industry sector (in millions) was as follows.
Sep 30,
Jun 30,
Sep 30,
Higher-Value Markets
2020
2020
2019
Medical
$
134
26
%
$
135
27
%
$
128
23
%
Semi-Cap
99
19
87
18
68
12
A&D
105
20
88
18
115
21
Industrials
86
16
87
18
115
21
$
424
81
%
$
397
81
%
$
426
77
%
Sep 30,
Jun 30,
Sep 30,
Traditional Markets
2020
2020
2019
Computing
$
44
8
%
$
44
9
%
$
59
11
%
Telecommunications
58
11
50
10
70
12
$
102
19
%
$
94
19
%
$
129
23
%
Total
$
526
100
%
$
491
100
%
$
555
100
%
 
Overall, higher-value market revenues during the third quarter were up 7% quarter-over-quarter and
down 1% year-over-year.
 
Traditional market
 
revenues were up 9% quarter-over-quarter due to stronger
demand for high performance computing and telecommunications products and down 21% year-over-
year primarily from the Company’s exit of a legacy Computing contract
 
in 2019, which it decided not to
renew.
 
Fourth Quarter 2020 Outlook
 
Revenue between $500 - $540 million
 
Diluted GAAP earnings per share between $0.20
 
- $0.24
 
Diluted non-GAAP earnings per share between $0.32 - $0.36 (excluding restructuring charges
and other costs and amortization of intangibles)
 
Our guidance includes known constraints due to COVID-19 and assumes no further significant
interruptions occur to our supply base, operations, or customers.
 
Guidance also assumes no
material changes to market conditions due to COVID-19.
 
Restructuring charges are expected to range between $2.8 million to $3.2 million in the fourth quarter
and the amortization of intangibles is expected to be $2.4 million in the fourth quarter.
 
3
 
Third Quarter 2020 Earnings Conference Call
 
The Company will host a conference call to discuss the results today at 5:00 p.m. Eastern Time.
 
The live
webcast of the call and accompanying reference materials will be accessible by logging on to the
Company's website at
www.bench.com
. A replay of the broadcast will
 
also be available until Wednesday,
November 4, 2020 on the Company's website.
 
About Benchmark Electronics, Inc.
Benchmark provides comprehensive solutions across the entire product life cycle by leading through its
innovative technology and engineering design services, leveraging its optimized global supply chain and
delivering world-class manufacturing services in the following industries: commercial aerospace,
defense, advanced computing, next generation telecommunications, complex industrials, medical, and
semiconductor capital equipment. Benchmark's global operations include facilities in seven countries
and its common shares trade on the New York Stock Exchange under the symbol BHE.
 
For More Information, Please Contact:
Lisa K. Weeks, VP of Strategy & Investor
 
Relations
 
623-300-7052 or [email protected]
 
Forward-Looking Statements
 
This press release contains forward-looking statements within the meaning of Section 27A of the
Securities Act of 1933 and Section 21E of the Securities Exchange Act of 1934. The words "expect,"
"estimate," "anticipate," "could",
 
"predict" and similar expressions, and the negatives thereof, often
identify forward-looking statements, which are not limited to historical facts. Forward
 
-looking
statements include, among other things, the estimated financial impact of the COVID-19 pandemic, our
outlook and guidance for fourth quarter 2020 results, the company’s anticipated plans and responses to
the COVID-19 pandemic, statements (express or implied) concerning future operating results or margins,
the ability to generate sales and income or cash flow,
 
and expected revenue mix, and Benchmark’s
business and growth strategies. Although the company believes these statements are based on and
derived from reasonable assumptions, they involve risks and uncertainties relating to operations,
markets and the business environment generally.
 
These statements also depend on the duration and
severity of the COVID-19 pandemic and related risks, including government and other third-party
responses to the crisis and the consequences for the global economy,
 
our business and the businesses
of our suppliers and customers.
 
Events relating to or resulting from the COVID-19 pandemic,
 
including
the possibility of customer demand fluctuations, supply chain constraints, or the ability to utilize our
manufacturing facilities at sufficient levels to cover our fixed operating costs, may
 
have resulting impacts
on the company’s business, financial condition, results of operations, and the company’s ability (or
inability) to execute on its plans to respond to the COVID-19 pandemic.
 
If one or more of these risks or
uncertainties materializes, or underlying assumptions prove incorrect, actual outcomes may vary
materially from those indicated. Readers are advised to consult further disclosures on these risks and
uncertainties, particularly in Part 1, Item 1A, "Risk Factors" of the Company's Annual Report on Form 10-
K for the year ended December 31, 2019 and in its subsequent filings with the Securities and Exchange
Commission. All forward-looking statements included in this document are based upon information
available to the company as of the date of this document, and it assumes no obligation to update them.
 
 
4
 
Non-GAAP Financial Measures
Management discloses non‐GAAP information to provide investors with additional information to
analyze the Company
s performance and underlying trends. A detailed reconciliation between GAAP
results and results excluding special items (
non-GAAP
) is included in the following tables attached to
this document. In situations where a non-GAAP reconciliation has not been provided, the Company was
unable to provide such a reconciliation without unreasonable effort due to the uncertainty and inherent
difficulty predicting the occurrence, the financial impact and the periods in which the non-GAAP
adjustments may be recognized. Management uses non‐GAAP measures that exclude certain items in
order to better assess operating performance and help investors
 
compare results with our previous
guidance.
 
 
This document also references
free cash flow
, which the Company defines as cash flow from
operations less additions to property, plant and equipment and purchased software.
 
 
The Company
s
non‐GAAP information is not necessarily comparable to the non‐GAAP information used by other
companies.
 
 
Non‐GAAP information should not be viewed as a substitute for, or superior to, net
 
income
or other data prepared in accordance with GAAP as a measure of the Company
s profitability or
liquidity.
 
 
Readers should consider the types of events and transactions for which adjustments have
been made.
 
###


5
Benchmark Electronics, Inc. and Subsidiaries
Condensed Consolidated Statements of Income
(Amounts in Thousands, Except Per Share Data)
(UNAUDITED)
Three Months Ended
Nine Months Ended
September 30,
September 30,
2020
2019
2020
2019
Sales
$
525,951
$
555,229
$
1,531,881
$
1,759,651
Cost of sales
479,597
506,274
1,407,494
1,611,436
Gross profit
46,354
48,955
124,387
148,215
Selling, general and administrative expenses
29,724
30,947
89,815
92,461
Amortization of intangible assets
2,368
2,367
7,120
7,095
Restructuring charges and other costs
7,161
5,843
15,480
10,833
Ransomware incident related costs (recovery), net
(1,558)
(1,305)
Income from operations
8,659
9,798
13,277
37,826
Interest expense
(2,136)
(1,687)
(6,189)
(5,014)
Interest income
154
734
1,040
3,084
Other income (expense), net
439
(136)
(191)
2,276
Income before income taxes
7,116
8,709
7,937
38,172
Income tax expense
1,201
1,573
1,577
7,816
Net income
$
5,915
$
7,136
$
6,360
$
30,356
Earnings per share:
Basic
$
0.16
$
0.19
$
0.17
$
0.78
Diluted
$
0.16
$
0.19
$
0.17
$
0.77
Weighted-average number of shares used in calculating
 
 
earnings per share:
Basic
36,467
37,419
36,565
38,813
Diluted
36,544
37,645
36,821
39,184
 
For comparative purposes, certain prior year amounts have been reclassified to conform to the current
year presentation.


6
Benchmark Electronics, Inc. and Subsidiaries
Condensed Consolidated Balance Sheets
(UNAUDITED)
(in thousands)
September 30,
December 31,
2020
2019
Assets
Current assets:
Cash and cash equivalents
$
334,810
$
363,956
Accounts receivable, net
306,242
324,424
Contract assets
161,396
161,061
Inventories
352,851
314,956
Other current assets
29,928
30,685
Total
 
current assets
1,185,227
1,195,082
Property, plant and equipment, net
190,610
205,819
Operating lease right-of-use assets
82,849
76,859
Goodwill and other, net
275,821
282,114
Total
 
assets
$
1,734,507
$
1,759,874
Liabilities and Shareholders’ Equity
Current liabilities:
 
Current installments of long-term debt and finance lease obligations
$
8,956
$
8,825
Accounts payable
282,591
302,994
Accrued liabilities
157,938
147,426
Total
 
current liabilities
449,485
459,245
Long-term debt and finance lease obligations, less current installments
147,522
138,912
Operating lease liabilities
74,407
67,898
Other long-term liabilities
72,766
78,987
Shareholders’ equity
990,327
1,014,832
Total
 
liabilities and shareholders’ equity
$
1,734,507
$
1,759,874


7
Benchmark Electronics, Inc. and Subsidiaries
Condensed Consolidated Statement of Cash Flows
(in thousands)
(UNAUDITED)
Nine Months Ended
September 30,
2020
2019
Cash flows from operating activities:
Net income
$
6,360
$
30,356
Depreciation and amortization
36,939
36,389
Stock-based compensation expense
9,464
8,461
Accounts receivable, net
16,410
121,171
Contract assets
(335)
(20,986)
Inventories
(37,131)
(6,557)
Accounts payable
(18,260)
(122,156)
Other changes in working capital and other, net
12,168
10,636
Net cash provided by operations
25,615
57,314
Cash flows from investing activities:
Additions to property, plant and equipment and software
(29,102)
(25,942)
Other investing activities, net
2,586
252
Net cash used in investing activities
(26,516)
(25,690)
Cash flows from financing activities:
Share repurchases
(19,329)
(118,350)
Net debt activity
8,395
(4,614)
Other financing activities, net
(18,747)
(17,699)
Net cash used in financing activities
(29,681)
(140,663)
Effect of exchange rate
 
changes
1,436
(1,021)
Net decrease in cash and cash equivalents
(29,146)
(110,060)
Cash and cash equivalents at beginning of year
363,956
458,102
Cash and cash equivalents at end of period
$
334,810
$
348,042


8
Benchmark Electronics, Inc. and Subsidiaries
Reconciliation of GAAP to Non-GAAP Financial Results
(Amounts in Thousands, Except Per Share Data)
(UNAUDITED)
Three Months Ended
Nine Months Ended
Sep 30,
Jun 30,
Sep 30,
Sep 30,
2020
2020
2019
2020
2019
Income (loss) from operations (GAAP)
$
8,659
$
(1,872)
$
9,798
$
13,277
$
37,826
Restructuring charges and other costs
1,425
5,574
5,843
8,737
10,833
Ransomware incident related costs (recovery), net
(1,558)
83
(1,305)
Settlement
773
Impairment
5,736
6,743
Customer insolvency (recovery)
(796)
(353)
(1,149)
(2,758)
Amortization of intangible assets
2,368
2,371
2,367
7,120
7,095
Non-GAAP income from operations
$
15,834
$
5,803
$
18,008
$
33,423
$
53,769
Gross Profit (GAAP)
$
46,354
$
34,672
$
48,955
$
124,387
$
148,215
Settlement
773
Customer insolvency (recovery)
(796)
(353)
(1,149)
(1,040)
Non-GAAP gross profit
$
45,558
$
34,319
$
48,955
$
123,238
$
147,948
Net income (loss) (GAAP)
$
5,915
$
(3,407)
$
7,136
$
6,360
$
30,356
Restructuring charges and other costs
1,425
5,574
6,168
8,737
11,158
Ransomware incident related costs (recovery), net
(1,558)
83
(1,305)
Customer insolvency (recovery)
(796)
(353)
(1,149)
(2,758)
Amortization of intangible assets
2,368
2,371
2,367
7,120
7,095
Settlements
(83)
(2,248)
Impairment
5,736
6,743
Income tax adjustments
(1)
(1,458)
(1,584)
(1,879)
(4,123)
(2,711)
Non-GAAP net income
$
11,632
$
2,684
$
13,709
$
22,383
$
40,892
Diluted earnings (loss) per share:
Diluted (GAAP)
$
0.16
$
(0.09)
$
0.19
$
0.17
$
0.77
Diluted (Non-GAAP)
$
0.32
$
0.07
$
0.36
$
0.61
$
1.04
Weighted-average number of shares used in
 
calculating diluted earnings (loss) per share:
Diluted (GAAP)
36,544
36,439
37,645
36,821
39,184
Diluted (Non-GAAP)
36,544
36,689
37,645
36,821
39,184
(1)
 
This amount represents the tax impact of the non-GAAP adjustments using the applicable effective
 
tax rates.
ex992p1i0.jpg
Exhibit 99.2


Benchmark Q3-20 Earnings Call October 28, 2020 Benchmark 1 2020 Benchmark
 
Electronics, Inc. 1
 
ex992p2i0.jpg
 
 
Forward-Looking Statements This press release contains forward-looking
 
statements within the meaning of Section 27A of the Securities Act
 
of 1933 and Section 21E of the Securities Exchange Act of 1934. The
 
words "expect," "estimate," "anticipate," "could" "predict" and
 
similar expressions, and the negatives thereof, often identify forward
 
-looking statements, which are not limited to historical facts. Forward
 
-looking statements include, among other things, the estimated
 
financial impact of the COVID-19 pandemic, the outlook and guidance
 
for fourth quarter 2020 results, the company’s anticipated plans
 
and responses to the COVID-19 pandemic, statements (express or implied)
 
concerning future operating results or margins, the ability to
 
generate sales and income or cash flow, and expected revenue
 
mix; and Benchmark’s business and growth strategies. Although the
 
company believes these statements are based upon reasonable assumptions,
 
they involve risks and uncertainties relating to operations, markets
 
and the business environment generally. These statements
 
also depend on the duration and severity of the COVID-19 pandemic
 
and related risks, including government and other third-party responses
 
to it and the consequences for the global economy, our business
 
and the businesses of our suppliers and customers. Events relating
 
to or resulting from the COVID-19 pandemic, including the possibility
 
of customer demand fluctuations, supply chain constraints, or
 
the ability to utilize our manufacturing facilities at sufficient levels
 
to cover our fixed operating costs, may have resulting impacts on
 
the company’s business, financial condition, results of operations,
 
and the company’s ability (or inability) to execute on its plans
 
to respond to the COVID-19 pandemic. If one
or more of these risks or uncertainties materializes, or underlying assumptions
 
prove incorrect, actual outcomes may vary materially from those
 
indicated. Readers are advised to consult further disclosures on these
 
risks and uncertainties, particularly in Part 1, Item 1A, "Risk Factors"
 
of the company's Annual Report on Form 10-K for the year
 
ended December 31, 2019 and in its subsequent filings with the Securities
 
and Exchange Commission. All forward-looking statements included
 
in this document are based upon information available to the company
 
as of the date of this document, and it assumes no obligation
 
to update them. Non-GAAP Financial Information This document
 
includes certain financial measures that exclude items and therefore
 
are not in accordance with U.S. generally accepted accounting principles
 
(“GAAP”). A detailed reconciliation between GAAP results and
 
results excluding special items (“non-GAAP”) is included in the
 
Appendix of this document. In situations where a non-GAAP reconciliation
 
has not been provided, the company was unable to provide such
 
a reconciliation without unreasonable effort due to the uncertainty
 
and inherent difficulty predicting the occurrence,
 
the financial impact and the periods in which the non-GAAP adjustments
 
may be recognized. Management discloses non‐GAAP information to
 
provide investors with additional information to analyze the Company’s
 
performance and underlying trends. Management uses non‐GAAP measures
 
that exclude certain items in order to better assess operating performance
 
and help investors compare results with our previous guidance. This document
 
also references “free cash flow”, which the Company defines as
 
cash flow from operations less additions to property, plant and
equipment and purchased software. The Company’s non‐GAAP
 
information is not necessarily comparable to the non‐GAAP information
 
used by other companies. Non‐GAAP information should not be
 
viewed as a substitute for, or superior to, net income or other
 
data prepared in accordance with GAAP as a measure
 
of the Company’s profitability or liquidity. Readers should consider
 
the types of events and transactions for which adjustments have been
 
made. Benchmark 2 2020 Benchmark Electronics, Inc. 2
 
ex992p3i0.jpg
 
 
Third Quarter 2020 Overview Achieved revenue of $526 million Realized
 
Non-GAAP gross margin of 8.7% and Non-GAAP operating margin
 
of 3.0% Global facilities returned to normal operating capacity; employee
 
safety remains a priority Non-GAAP earnings per share of $0.32
 
Cash conversion cycle of 81 days Benchmark 3 2020 Benchmark
 
Electronics, Inc. 3
 
ex992p4i0.jpg
 
 
New Business Wins Continue Medical Rapid COVID-19 diagnostic
 
device manufacturing (mfg) Pulmonary pharmaceutical device
 
(process design, & mfg) Optical diagnostic product for renal applications
 
(design) Semi-Cap Control box for Semi-Cap tools (design)
 
Lithography device (manufacturing) Aerospace & Defense
 
Secure communication radio modules (design solutions & mfg) Fighter
 
aircraft electronics (mfg) Industrials Lidar electronics and full system
 
build (mfg) Oscilloscopes (design and mfg) Computing & Telco
 
Hyper Scale Computing (mfg prototyping) Network control
 
and monitoring electronics (mfg) dnanudge DNANUDGE selects
 
benchmark for volume manufacturing of rapid, lab-free
 
covid-19 testing system Awarded to Benchmark’s engineering and
 
manufacturing facility in The Netherlands Partnering with DnaNudge
 
to provide design for excellence and high reliability manufacturing
 
for rapid launch in the European market ZOLL Benchmark helpED
 
zoll meet heightened demand for ventilator production created
 
by covid-19 pandemic Awarded to Benchmark’s engineering
 
and manufacturing facility in New Hampshire Benchmark established
 
production Line for the ZOLL EMV+ Ventilators and
 
ramped to full capacity in nearly six weeks Benchmark 4 2020 Benchmark
 
Electronics, Inc. 4
 
ex992p5i0.jpg
 
 
Roop Lakkaraju Chief Financial Officer Benchmark 5 2020 Benchmark
 
Electronics, Inc. 5
 
ex992p6i0.jpg
 
 
Revenue by Mix and Market Sector For the Three Months Ended Sept.
 
30, 2020 June 30, 2020 Sept. 30, 2019 Higher-Value Markets
 
Mix % Revenue Mix % Revenue Q/Q Mix % Revenue Y/Y
 
Medical 26% $134 27% $135 0% 23% $128 5% Semi-Cap 19%
 
$99 18% $87 14% 12% $68 45% Aerospace & Defense 20%
 
$105 18% $88 18% 21% $115 (9%) Industrials 16% $86 18% $87 (1%)
 
21% $115 (25%) Total Mix and Revenue 81% $424 81% $397
 
7% 77% $426 (1%) Traditional Markets Mix % Revenue Mix
 
% Revenue Q/Q Mix % Revenue Y/Y Computing 8% $44 9%
 
$44 1% 11% $59 (26%) Telecommunications 11% $58 10%
 
$50 16% 12% $70 (17%) Total Mix and Revenue 19% $102 19%
 
$94 9% 23% $129 (21%) Dollars in millions Benchmark 6 2020
 
Benchmark Electronics, Inc. 6
 
ex992p7i0.jpg
 
 
Third Quarter 2020 Financial Summary (GAAP) For the Three Months
 
Ended (In millions, except EPS) Sept. 30, 2020 June 30, 2020 Q/Q
 
Sept. 30, 2019 Y/Y Net Sales $526 $491 7% $555 (5%) GAAP Gross
 
Margin 8.8% 7.1% 170 bps 8.8% -- GAAP SG&A $29.7 $28.5 4%
 
$30.9 (4%) GAAP Operating Margin 1.6% (0.4%) 200 bps 1.8%
 
(20 bps) GAAP Diluted EPS $0.16 ($0.09) 278% $0.19 (16%) GAAP
 
ROIC 0.6% 0.7% (10 bps) 5.2% (460 bps) See APPENDIX 1 for a reconciliation
 
of GAAP to non-GAAP Financial Results GAAP ROIC = (GAAP
 
TTM income from operations – GAAP Tax Impact)
 
÷ (Average Invested Capital for last 5 quarters)
 
Benchmark 7 2020 Benchmark Electronics, Inc. 7
 
ex992p8i0.jpg
 
 
Third Quarter 2020 Financial Summary (Non-GAAP) For the Three
 
Months Ended (In millions, except EPS) Sept. 30, 2020 June 30,
 
2020 Q/Q Sept. 30, 2019 Y/Y Net Sales $526 $491 7% $555 (5%)
 
Non-GAAP Gross Margin 8.7% 7.0% 170 bps 8.8% (10 bps) Non-GAAP
 
SG&A $29.7 $28.5 4% $30.9 (4%) Non-GAAP Operating Margin
 
3.0% 1.2% 180 bps 3.2% (20 bps) Non-GAAP Diluted EPS
 
$0.32 $0.07 357% $0.36 (11%) Non-GAAP ROIC 5.8% 5.9% (10 bps)
 
8.2% (240 bps) See APPENDIX 1 for a reconciliation of GAAP
 
to non-GAAP Financial Results Non-GAAP ROIC = (Non-GAAP
 
TTM income from operations + Stock-based compensation –
 
Non-GAAP Tax Impact) ÷ [Average Invested Capital for
 
last 5 quarters] Benchmark 8 2020 Benchmark Electronics, Inc.
 
8
 
ex992p9i0.jpg
 
 
Cash Flow / Balance Sheet Summary For the Three Months Ended Cash
 
(In millions) Sept. 30, 2020 June 30, 2020 Sept. 30, 2019 Cash Flows
 
from (used in) Operations $6 $23 ($11) FCF (1) $0 $13 ($22) Cash
 
$335 $356 $348 International $174 $162 $180 US $161 $194 $168
 
(1) Free cash flow (FCF) defined as net cash provided by (used
 
in) operations less capex Debt Structure (In millions) Senior Secured
 
Term Loan $139 Revolving Credit Facility Drawn Amount $15
 
* Leverage ratio is Net debt/LTM adjusted EBITDA, as defined
 
in the credit facility, which are non-GAAP measures Flexible
 
and conservative capital structure CARES Act implementation;
 
deferral of social security tax payments until 2021/2022 Credit
 
facility matures July 2023
 
Current leverage ratio* in compliance with debt covenants Benchmark
 
9 2020 Benchmark Electronics, Inc. 9
 
ex992p10i0.jpg
 
 
Working Capital Update Q2-19 Q3-19 Q4-19 Q1-20 Q2-20 Q3-20
 
Accounts Receivable Days 54 56 57 56 55 52 Contract Asset
 
Days 23 26 29 28 28 28 Inventory Days 52 56 60 65 72 66 Deposits
 
3 7 7 7 10 11 Accounts Payable Days 60 52 58 61 61 54 Cash
 
Conversion Cycle 66 79 81 81 84 81 The updated CCC target is 78 to
 
83 days; excluding the legacy computing contract Continued Focused
 
Efforts on Demand Management Benchmark 10 2020 Benchmark
 
Electronics, Inc. 10
 
ex992p11i0.jpg
 
 
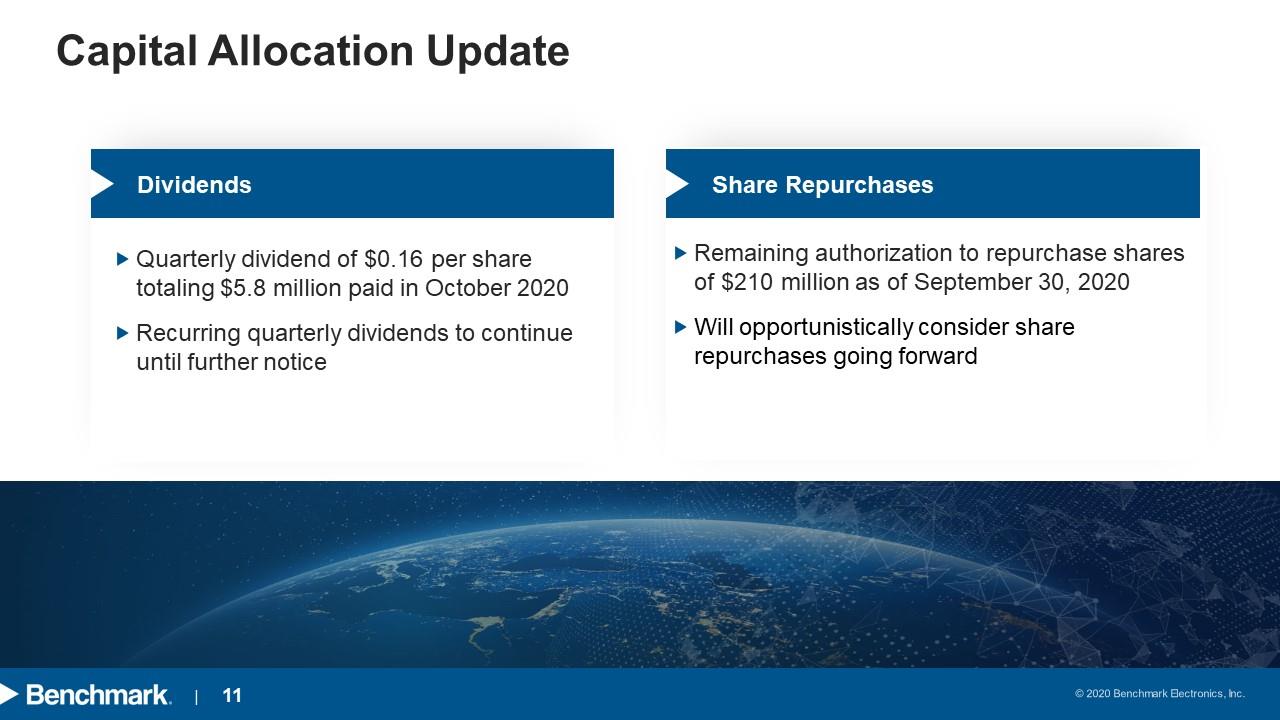
Capital Allocation Update Dividends Quarterly dividend of $0.16 per
 
share totaling $5.8 million paid in October 2020 Recurring quarterly
 
dividends to continue until further notice Share Repurchases
 
Remaining authorization to repurchase shares of $210 million as
 
of September 30, 2020 Will opportunistically consider share
 
repurchases going forward Benchmark 11 2020 Benchmark Electronics,
 
Inc. 11
 
ex992p12i0.jpg
 
 
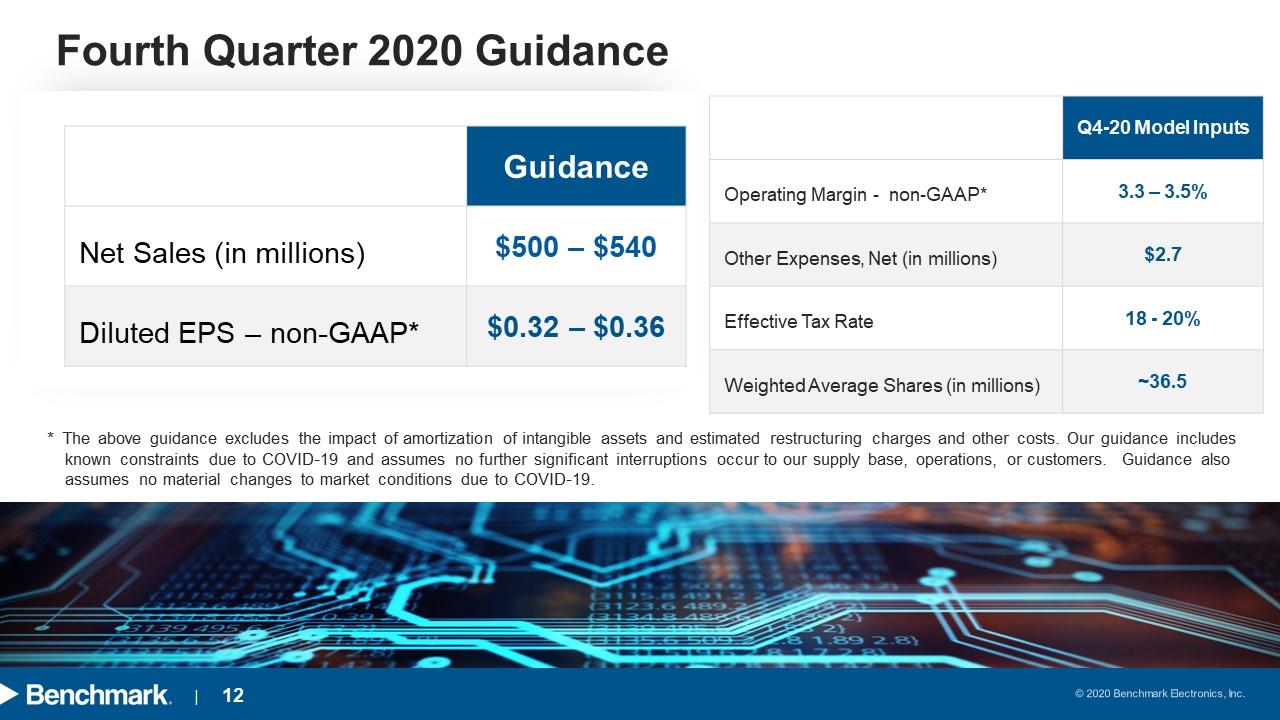
Fourth Quarter 2020 Guidance Guidance Net Sales (in millions) $500
 
– $540 Diluted EPS – non-GAAP* $0.32 – $0.36 Q4-20 Model
 
Inputs Operating Margin - non-GAAP* 3.3 – 3.5% Other
 
Expenses, Net (in millions) $2.7 Effective Tax Rate 18 - 20%
 
Weighted Average Shares (in millions) ~36.5* The
 
above guidance excludes the impact of amortization of intangible assets
 
and estimated restructuring charges and other costs. Our guidance
 
includes known constraints due to COVID-19 and assumes no further
 
significant interruptions occur to our supply base, operations, or customers.
 
Guidance also assumes no material changes to market conditions due
 
to COVID-19. Benchmark 12 2020 Benchmark Electronics, Inc.
 
12
 
ex992p13i0.jpg
 
 
Jeff Benck President & Chief Executive Officer Benchmark 13 2020 Benchmark
 
Electronics, Inc. 13
 
ex992p14i0.jpg
 
 
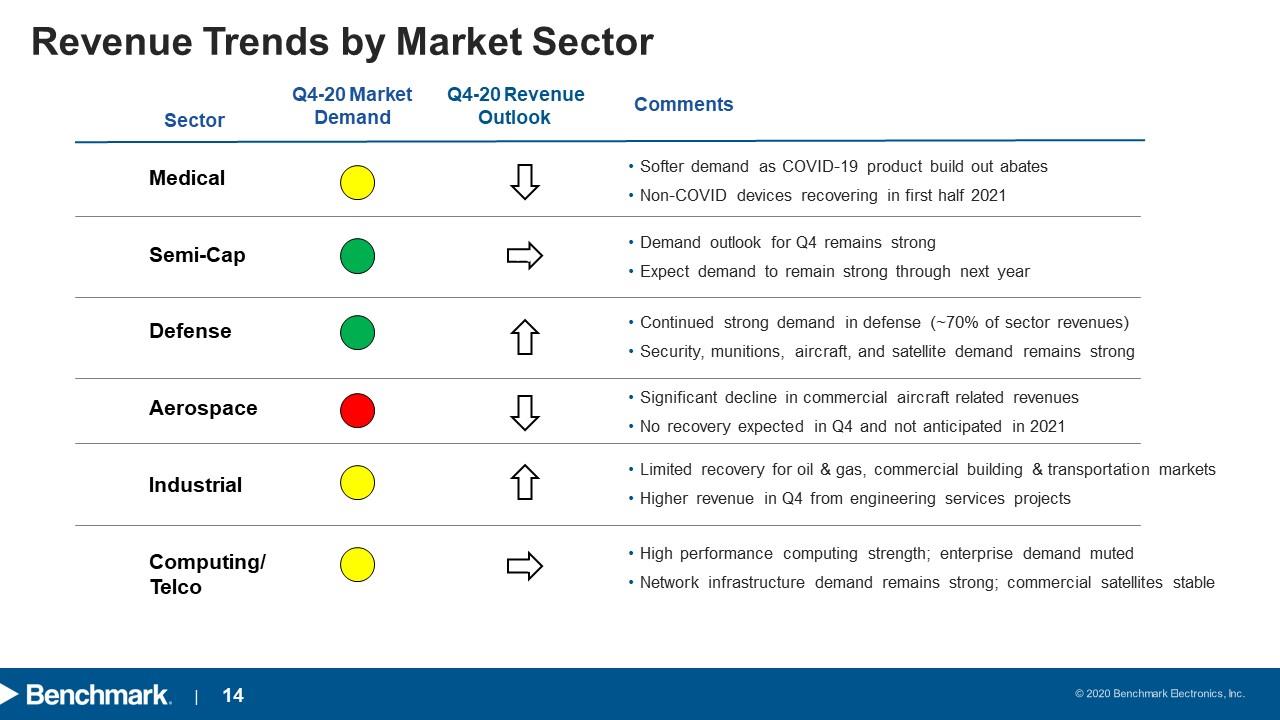
Revenue Trends by Market Sector Sector Q4-20 Market Demand
 
Q4-20 Revenue Outlook Comments Medical Softer demand as COVID-19
 
product build out abates Non-COVID devices recovering in first
 
half 2021 Semi-Cap Demand outlook for Q4 remains strong Expect
 
demand to remain strong through next year Defense Continued strong demand
 
in defense (~70% of sector revenues) Security, munitions, aircraft,
 
and satellite demand remains strong Aerospace Significant decline
 
in commercial aircraft related revenues No recovery expected
 
in Q4 and not anticipated in 2021 Industrial Limited recovery for
 
oil & gas, commercial building & transportation markets Higher revenue
 
in Q4 from engineering services projects Computing/ Telco High
 
performance computing strength; enterprise demand muted Network
 
infrastructure demand remains strong; commercial satellites stable
 
Benchmark 14 2020 Benchmark Electronics, Inc. 14
 
ex992p15i0.jpg
 
 
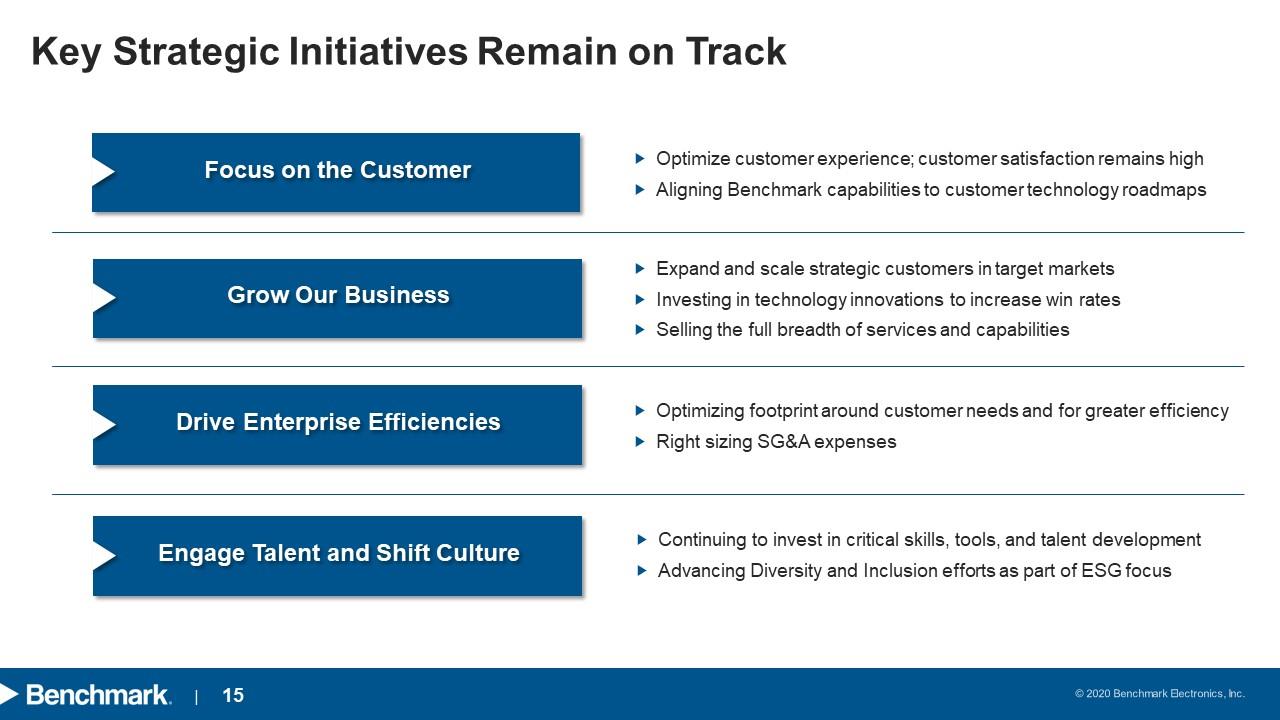
Key Strategic Initiatives Remain on Track Focus on the Customer
 
Optimize customer experience; customer satisfaction remains high Aligning
 
Benchmark capabilities to customer technology roadmaps Grow Our
 
Business Expand and scale strategic customers in target markets
 
Investing in technology innovations to increase win rates
 
Selling the full breadth of services and capabilities Drive Enterprise
 
Efficiencies Optimizing footprint around customer needs and for
 
greater efficiency Right sizing SG&A expenses Engage Talent
 
and Shift Culture Continuing to invest in critical skills, tools, and talent
 
development Advancing Diversity and Inclusion efforts as part
 
of ESG focus Benchmark 15 2020 Benchmark Electronics, Inc. 15
 
ex992p16i0.jpg
 
 
Mid-Term Target Model (through 2022) ~5% Annual Revenue
 
Growth 9.3 – 9.7% Expand Non-GAAP Gross Margins < 6% Manage
 
SG&A Expenses 3.4 – 3.8% Increase Non-GAAP Operating Margins
 
Highly selective and targeted customer base for strategic account
 
growth Effective management of SG&A expenses Expect to
 
grow earnings faster than revenue Resulting improvements to ROIC
 
Benchmark 16 2020 Benchmark Electronics, Inc. 16
 
ex992p17i0.jpg
 
 
Appendix Benchmark 17 2020 Benchmark Electronics, Inc. 17
 
ex992p18i0.jpg
 
 
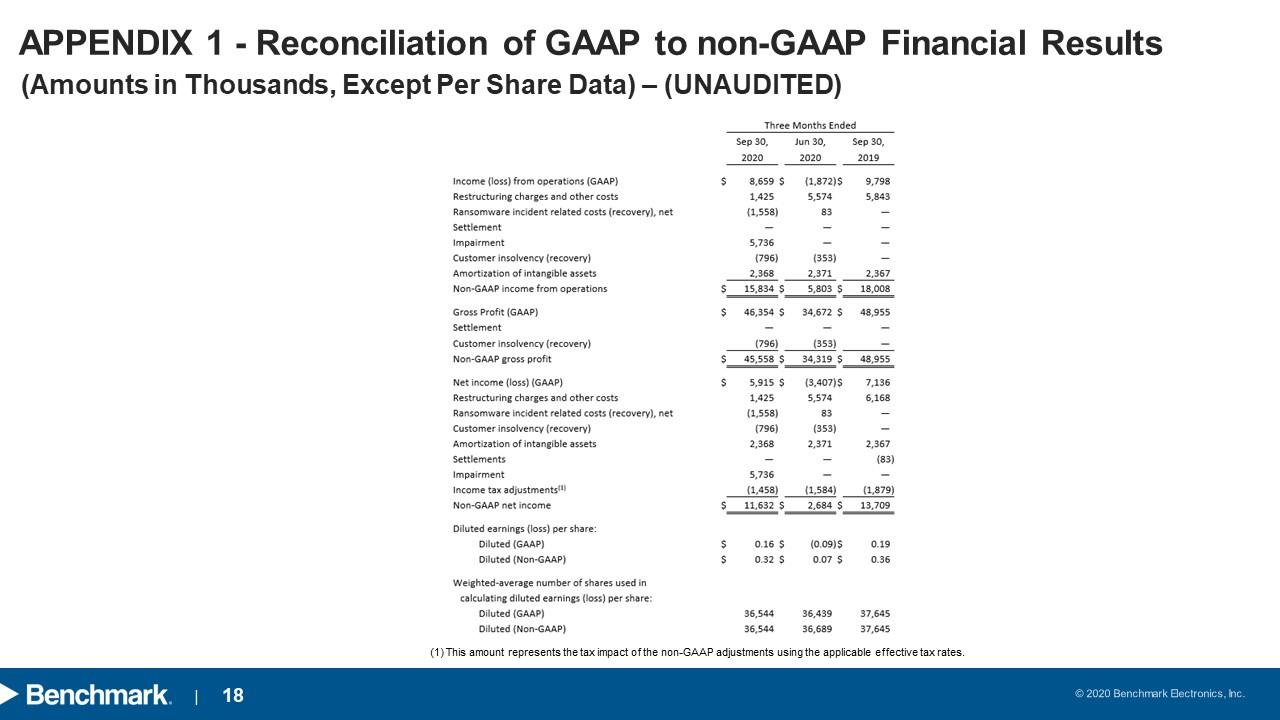
APPENDIX 1 - Reconciliation of GAAP to non-GAAP Financial
 
Results (Amounts in Thousands, Except Per Share Data)
 
– (UNAUDITED) Three Months Ended Sep 30, Jun 30, Sep 30, 2020 2020
 
2019 Income (loss) from operations (GAAP) $ 8,659 $ (1,872)$
 
9,798 Restructuring charges and other costs 1,425 5,574 5,843 Ransomware
 
incident related costs (recovery), net (1,558) 83 — Settlement — —
 
— Impairment 5,736 — — Customer insolvency (recovery)
 
(796) (353) — Amortization of intangible assets 2,368 2,371 2,367 Non-GAAP
 
income from operations $ 15,834 $ 5,803 $ 18,008 Gross Profit
 
(GAAP) $ 46,354 $ 34,672 $ 48,955 Settlement — — — Customer
 
insolvency (recovery) (796) (353) — Non-GAAP gross profit
 
$ 45,558 $ 34,319 $ 48,955 Net income (loss) (GAAP) $ 5,915 $
 
(3,407)$ 7,136 Restructuring charges and other costs 1,425 5,574
 
6,168 Ransomware incident related costs (recovery),
 
net (1,558) 83 — Customer insolvency (recovery) (796) (353) — Amortization
 
of intangible assets 2,368 2,371 2,367 Settlements — — (83) Impairment
 
5,736 — — Income tax adjustments(1) (1,458) (1,584) (1,879)
 
Non-GAAP net income $ 11,632 $ 2,684 $ 13,709 Diluted earnings
 
(loss) per share: Diluted (GAAP) $ 0.16 $ (0.09)$ 0.19 Diluted
 
(Non-GAAP) $ 0.32 $ 0.07 $ 0.36 Weighted-average
 
number of shares used in calculating diluted earnings (loss) per share:
 
Diluted (GAAP) 36,544 36,439 37,645 Diluted (Non-GAAP)
 
36,544 36,689 37,645 (1) This amount represents the tax impact
 
of the non-GAAP adjustments using the applicable effective
 
tax rates. Benchmark 18 2020 Benchmark Electronics, Inc. 18
 
ex992p19i0.jpg
 
 
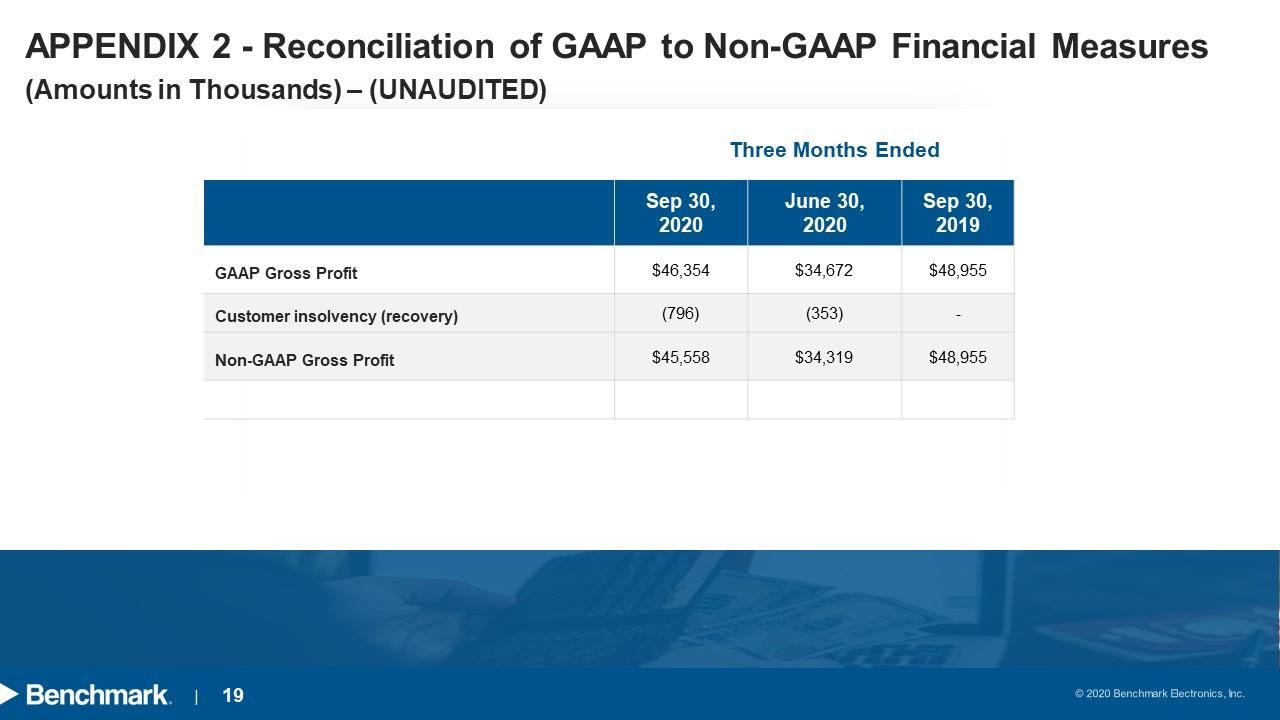
APPENDIX 2 - Reconciliation of GAAP to Non-GAAP Financial Measures
 
(Amounts in Thousands) – (UNAUDITED) Three Months Ended
 
Sep 30, 2020 June 30, 2020 Sep 30, 2019 GAAP Gross Profit $46,354
 
$34,672 $48,955 Customer insolvency (recovery) (796)
 
(353) - Non-GAAP Gross Profit $45,558 $34,319 $48,955 Benchmark 19 2020
 
Benchmark Electronics, Inc. 19
 
ex992p20i0.jpg
 
 
APPENDIX 3 - Reconciliation of Free Cash Flow (Amounts in Thousands)
 
– (UNAUDITED) Three Months Ended Sep 30, 2020 June
 
30, 2020 Sep 30, 2019 Net Cash Provided by (Used in) Operations
 
$5,697 $23,027 ($11,458) Additions to property, plant
 
and equipment and software (5,812) (10,394) (10,447) Free
 
Cash Flow (Free Cash Flow Used) ($115) $12,633 ($21,905) Benchmark
 
20 2020 Benchmark Electronics, Inc. 20