bhe-8k_20210204.htm
0000863436
false
0000863436
2021-02-04
2021-02-04
UNITED STATES
SECURITIES AND EXCHANGE COMMISSION
Washington, D.C. 20549
FORM 8-K
CURRENT REPORT
Pursuant to Section 13 or 15(d)
of the Securities Exchange Act of 1934
Date of Report (Date of earliest event reported): February 4, 2021
BENCHMARK ELECTRONICS, INC.
(Exact name of registrant as specified in its charter)
|
Texas |
1-10560 |
74-2211011 |
|
(State or other jurisdiction
of incorporation) |
(Commission
File Number) |
(I.R.S. Employer
Identification No.) |
56 South Rockford Drive, Tempe, Arizona 85281
(Address of Principal Executive Offices) (Zip Code)
Registrant’s telephone number, including area code: (623) 300-7000
Not Applicable
(Former name or former address, if changed since last report)
Check the appropriate box below if the Form 8-K filing is intended to simultaneously satisfy the filing obligation of the registrant under any of the following provisions (see General Instruction A.2. below):
☐ Written communications pursuant to Rule 425 under the Securities Act (17 CFR 230.425)
☐ Soliciting material pursuant to Rule 14a-12 under the Exchange Act (17 CFR 240.14a-12)
☐ Pre-commencement communications pursuant to Rule 14d-2(b) under the Exchange Act (17 CFR 240.14d-2(b))
☐ Pre-commencement communications pursuant to Rule 13e-4(c) under the Exchange Act (17 CFR 240.13e-4(c))
Securities registered pursuant to Section 12(b) of the Act:
|
Title of each class |
Trading Symbol |
Name of each exchange on which registered |
|
Common Stock, par value $0.10 per share |
BHE |
New York Stock Exchange, Inc. |
Indicate by check mark whether the registrant is an emerging growth company as defined in Rule 405 of the Securities Act of 1933 (§230.405 of this chapter) or Rule 12b-2 of the Securities Exchange Act of 1934 (§240.12b-2 of this chapter).
Emerging growth company ☐
If an emerging growth company, indicate by check mark if the registrant has elected not to use the extended transition period for complying with any new or revised financial accounting standards provided pursuant to Section 13(a) of the Exchange Act. ☐
Item 2.02. Results of Operations and Financial Condition.
On February 4, 2021, Benchmark Electronics, Inc. (the “Company”) issued a press release announcing its results of operations for the quarter and year ended December 31, 2020. A copy of the press release and accompanying investor presentation are attached hereto as Exhibits 99.1 and 99.2, respectively, and incorporated by reference herein. The information disclosed under this Item 2.02, including Exhibits 99.1 and 99.2 hereto, shall not be deemed “filed” for purposes of Section 18 of the Securities Exchange Act of 1934, as amended (the “Exchange Act”), or deemed incorporated by reference in any filing under the Securities Act of 1933, as amended, or the Exchange Act, except as shall be expressly set forth by specific reference in such a filing.
Item 9.01. Financial Statements and Exhibits.
(d) Exhibits
1
SIGNATURES
Pursuant to the requirements of the Securities Exchange Act of 1934, the registrant has duly caused this report to be signed on its behalf by the undersigned hereunto duly authorized.
|
|
BENCHMARK ELECTRONICS, INC. |
|
|
|
|
|
|
Date: February 4, 2021 |
By: |
|
/s/ Stephen J. Beaver |
|
|
|
|
Stephen J. Beaver, Esq. |
|
|
|
|
Senior Vice President, General Counsel and Chief Legal Officer |
2
Exhibit 99.1
FOR IMMEDIATE RELEASE
BENCHMARK REPORTS FOURTH QUARTER AND FULL YEAR 2020 RESULTS
Fourth quarter 2020 results:
|
|
• |
Revenue of $521 million |
|
|
• |
GAAP gross margin of 9.7% and non-GAAP gross margin of 9.6% |
|
|
• |
Cash flow generated from operations of $95 million |
|
|
• |
GAAP diluted EPS of $0.21 and non-GAAP diluted EPS of $0.34 |
Full year 2020 results:
|
|
• |
Revenue of $2.1 billion |
|
|
• |
Semi-Cap revenue growth of 33% year-over-year |
|
|
• |
Medical revenue growth of 11% year-over-year |
|
|
• |
Higher-value markets revenue mix greater than 80% |
|
|
• |
Cash flow generated from operations of $120 million and free cash flow of $81 million |
|
|
• |
Annual GAAP diluted EPS of $0.38 and non-GAAP diluted EPS of $0.95 |
TEMPE, AZ, February 4, 2021 – Benchmark Electronics, Inc. (NYSE: BHE) today announced financial results for the fourth quarter and year ended December 31, 2020.
|
|
|
Three Months Ended |
|
|
|
|
Dec 31, |
|
|
Sep 30, |
|
|
Dec 31, |
|
|
In millions, except EPS |
|
2020 |
|
|
2020 |
|
|
2019 |
|
|
Sales |
|
$ |
521 |
|
|
$ |
526 |
|
|
$ |
508 |
|
|
Net income (loss)(2) |
|
$ |
8 |
|
|
$ |
6 |
|
|
$ |
(7 |
) |
|
Net income – non-GAAP(1)(2) |
|
$ |
13 |
|
|
$ |
12 |
|
|
$ |
10 |
|
|
Diluted earnings (loss) per share(2) |
|
$ |
0.21 |
|
|
$ |
0.16 |
|
|
$ |
(0.19 |
) |
|
Diluted EPS – non-GAAP(1)(2) |
|
$ |
0.34 |
|
|
$ |
0.32 |
|
|
$ |
0.27 |
|
|
Operating margin(2) |
|
|
2.3 |
% |
|
|
1.6 |
% |
|
|
(1.8 |
)% |
|
Operating margin – non-GAAP(1)(2) |
|
|
3.4 |
% |
|
|
3.0 |
% |
|
|
2.6 |
% |
|
|
|
Twelve Months Ended |
|
|
|
|
Dec 31, |
|
|
Dec 31, |
|
|
In millions, except EPS |
|
2020 |
|
|
2019 |
|
|
Net sales |
|
$ |
2,053 |
|
|
$ |
2,268 |
|
|
Net income(3) |
|
$ |
14 |
|
|
$ |
23 |
|
|
Net income – non-GAAP(1)(3) |
|
$ |
35 |
|
|
$ |
51 |
|
|
Diluted EPS(3) |
|
$ |
0.38 |
|
|
$ |
0.60 |
|
|
Diluted EPS – non-GAAP(1)(3) |
|
$ |
0.95 |
|
|
$ |
1.32 |
|
|
Operating margin(3) |
|
|
1.2 |
% |
|
|
1.3 |
% |
|
Operating margin – non-GAAP(1)(3) |
|
|
2.5 |
% |
|
|
3.0 |
% |
|
(1) |
A reconciliation of GAAP and non-GAAP results is included below. |
|
(2) |
Results for the fourth quarter ended December 31, 2020 and third quarter ended September 30, 2020 include the impact of approximately $1.6 million and $1.3 million of net COVID-19 related costs, respectively. |
|
(3) |
Results for the year ended December 31, 2020 include the impact of approximately $7.1 million of net COVID-19 related costs. |
1
Jeff Benck, Benchmark’s President and CEO stated, “We closed out a very challenging year, delivering fourth quarter results that not only met our expectations, but demonstrated sequential improvement in both non-GAAP gross margins at 9.6% and higher non-GAAP earnings at $0.34 enabled by higher-value sector mix and improved utilization across the company. I am very proud of our team, which has proven to be very resourceful and resilient in the face of this pandemic and continues to deliver for our customers.”
Benck continued, “Our focused efforts on improving working capital management are also bearing fruit as we generated $95 million of operating cash flow in the quarter and over $120 million for the year, which exceeded our forecast. I look forward to 2021 with optimism knowing that our strategic investments in the business to drive differentiated value and sustainability have solidified a path to achieve revenue, margin, and earnings growth in 2021 aligned with our mid-term financial goals.”
Cash Conversion Cycle
|
|
|
Dec 31, |
|
|
Sep 30, |
|
|
Dec 31, |
|
|
|
|
2020 |
|
|
2020 |
|
|
2019 |
|
|
Accounts receivable days |
|
|
53 |
|
|
|
52 |
|
|
|
57 |
|
|
Contract asset days |
|
|
25 |
|
|
|
28 |
|
|
|
29 |
|
|
Inventory days |
|
|
63 |
|
|
|
66 |
|
|
|
60 |
|
|
Accounts payable days |
|
|
(54 |
) |
|
|
(54 |
) |
|
|
(58 |
) |
|
Advance payments from customers days |
|
|
(16 |
) |
|
|
(11 |
) |
|
|
(7 |
) |
|
Cash Conversion Cycle days |
|
|
71 |
|
|
|
81 |
|
|
|
81 |
|
Fourth Quarter 2020 Industry Sector Update
Revenue and percentage of sales by industry sector (in millions) was as follows.
|
|
|
Dec 31, |
|
|
Sep 30, |
|
|
Dec 31, |
|
|
Higher-Value Markets |
|
2020 |
|
|
2020 |
|
|
2019 |
|
|
Medical |
|
$ |
111 |
|
|
|
21 |
% |
|
$ |
134 |
|
|
|
26 |
% |
|
$ |
103 |
|
|
|
20 |
% |
|
Semi-Cap |
|
|
101 |
|
|
|
20 |
|
|
|
99 |
|
|
|
19 |
|
|
|
81 |
|
|
|
16 |
|
|
A&D |
|
|
111 |
|
|
|
21 |
|
|
|
105 |
|
|
|
20 |
|
|
|
106 |
|
|
|
21 |
|
|
Industrials |
|
|
97 |
|
|
|
19 |
|
|
|
86 |
|
|
|
16 |
|
|
|
107 |
|
|
|
21 |
|
|
|
|
$ |
420 |
|
|
|
81 |
% |
|
$ |
424 |
|
|
|
81 |
% |
|
$ |
397 |
|
|
|
78 |
% |
|
|
|
|
|
|
|
|
|
|
|
|
|
|
|
|
|
|
|
|
|
|
|
|
|
|
|
|
|
Dec 31, |
|
|
Sep 30, |
|
|
Dec 31, |
|
|
Traditional Markets |
|
2020 |
|
|
2020 |
|
|
2019 |
|
|
Computing |
|
$ |
46 |
|
|
|
9 |
% |
|
$ |
44 |
|
|
|
8 |
% |
|
$ |
45 |
|
|
|
9 |
% |
|
Telecommunications |
|
|
55 |
|
|
|
10 |
|
|
|
58 |
|
|
|
11 |
|
|
|
66 |
|
|
|
13 |
|
|
|
|
$ |
101 |
|
|
|
19 |
% |
|
$ |
102 |
|
|
|
19 |
% |
|
$ |
111 |
|
|
|
22 |
% |
|
Total |
|
$ |
521 |
|
|
|
100 |
% |
|
$ |
526 |
|
|
|
100 |
% |
|
$ |
508 |
|
|
|
100 |
% |
Overall, higher-value market revenues were up 6% year-over-year from strength in the Semi-Cap, Medical, and A&D sectors. Traditional market revenues were down from program transitions.
2
First Quarter 2021 Outlook
|
|
• |
Revenue between $480 - $520 million |
|
|
• |
Diluted GAAP earnings per share between $0.11 - $0.14 |
|
|
• |
Diluted non-GAAP earnings per share between $0.18 - $0.22 (excluding restructuring charges and other costs and amortization of intangibles) |
|
|
• |
This guidance takes into consideration all known constraints for the quarter and assumes no further significant interruptions to our supply base, operations or customers. Guidance also assumes no material changes to end market conditions due to COVID-19. |
Restructuring charges are expected to range between $1.0 million and $2.0 million in the first quarter and the amortization of intangibles is expected to be $2.0 million in the first quarter.
Fourth Quarter 2020 and CY2020 Earnings Conference Call
The Company will host a conference call to discuss the results today at 5:00 p.m. Eastern Time. The live webcast of the call and accompanying reference materials will be accessible by logging on to the Company's website at www.bench.com. A replay of the broadcast will also be available until Thursday, February 11, 2021 on the Company's website.
About Benchmark Electronics, Inc.
Benchmark provides comprehensive solutions across the entire product life cycle by leading through its innovative technology and engineering design services, leveraging its optimized global supply chain and delivering world-class manufacturing services in the following industries: commercial aerospace, defense, advanced computing, next generation telecommunications, complex industrials, medical, and semiconductor capital equipment. Benchmark's global operations include facilities in seven countries and its common shares trade on the New York Stock Exchange under the symbol BHE.
For More Information, Please Contact:
Lisa K. Weeks, VP of Strategy & Investor Relations
623-300-7052 or [email protected]
Forward-Looking Statements
This press release contains forward-looking statements within the meaning of Section 27A of the Securities Act of 1933 and Section 21E of the Securities Exchange Act of 1934. The words "expect," "estimate," "anticipate," "could", "predict" and similar expressions, and the negatives thereof, often identify forward-looking statements, which are not limited to historical facts. Forward-looking statements include, among other things, the estimated financial impact of the COVID-19 pandemic, our outlook and guidance for first quarter 2021 results, the company’s anticipated plans and responses to the COVID-19 pandemic, statements (express or implied) concerning future operating results or margins, the ability to generate sales and income or cash flow, and expected revenue mix, and Benchmark’s business and growth strategies. Although the company believes these statements are based on and derived from reasonable assumptions, they involve risks and uncertainties relating to operations, markets and the business environment generally. These statements also depend on the duration and severity of the COVID-19 pandemic and related risks, including government and other fourth-party responses to the crisis and the consequences for the global economy, our business and the businesses of our suppliers and customers. Events relating to or resulting from the COVID-19 pandemic, including the possibility of customer demand fluctuations, supply chain constraints, or the ability to utilize our manufacturing facilities at sufficient levels to cover our fixed operating costs, may have resulting impacts on the company’s business, financial condition, results of operations, and the company’s ability (or inability) to execute on its plans to respond to the COVID-19 pandemic. If one or more of these risks or uncertainties materializes, or underlying assumptions prove incorrect, actual outcomes may vary materially from those indicated. Readers are advised to consult further disclosures on these risks and
3
uncertainties, particularly in Part 1, Item 1A, "Risk Factors" of the Company's Annual Report on Form 10-K for the year ended December 31, 2019 and in Part II, Item 1A, “Risk Factors” in the Company’s Quarterly Report on Form 10-Q for the quarter ended September 30, 2020 and in its subsequent filings with the Securities and Exchange Commission. All forward-looking statements included in this document are based upon information available to the company as of the date of this document, and it assumes no obligation to update them.
Non-GAAP Financial Measures
Management discloses non‐GAAP information to provide investors with additional information to analyze the Company’s performance and underlying trends. A detailed reconciliation between GAAP results and results excluding special items (“non-GAAP”) is included in the following tables attached to this document. In situations where a non-GAAP reconciliation has not been provided, the Company was unable to provide such a reconciliation without unreasonable effort due to the uncertainty and inherent difficulty predicting the occurrence, the financial impact and the periods in which the non-GAAP adjustments may be recognized. Management uses non‐GAAP measures that exclude certain items in order to better assess operating performance and help investors compare results with our previous guidance. This document also references “free cash flow”, which the Company defines as cash flow from operations less additions to property, plant and equipment and purchased software. The Company’s non‐GAAP information is not necessarily comparable to the non‐GAAP information used by other companies. Non‐GAAP information should not be viewed as a substitute for, or superior to, net income or other data prepared in accordance with GAAP as a measure of the Company’s profitability or liquidity. Readers should consider the types of events and transactions for which adjustments have been made.
###
4
Benchmark Electronics, Inc. and Subsidiaries
Condensed Consolidated Statements of Income
(Amounts in Thousands, Except Per Share Data)
(UNAUDITED)
|
|
|
Three Months Ended |
|
|
Year Ended |
|
|
|
|
December 31, |
|
|
December 31, |
|
|
|
|
2020 |
|
|
2019 |
|
|
2020 |
|
|
2019 |
|
|
Sales |
|
$ |
521,250 |
|
|
$ |
508,444 |
|
|
$ |
2,053,131 |
|
|
$ |
2,268,095 |
|
|
Cost of sales |
|
|
470,589 |
|
|
|
471,131 |
|
|
|
1,878,083 |
|
|
|
2,082,567 |
|
|
Gross profit |
|
|
50,661 |
|
|
|
37,313 |
|
|
|
175,048 |
|
|
|
185,528 |
|
|
Selling, general and administrative expenses |
|
|
32,380 |
|
|
|
34,279 |
|
|
|
122,195 |
|
|
|
126,740 |
|
|
Amortization of intangible assets |
|
|
1,979 |
|
|
|
2,366 |
|
|
|
9,099 |
|
|
|
9,461 |
|
|
Restructuring charges and other costs |
|
|
4,490 |
|
|
|
2,268 |
|
|
|
19,970 |
|
|
|
13,101 |
|
|
Ransomware incident related costs (recovery), net |
|
|
(45 |
) |
|
|
7,681 |
|
|
|
(1,350 |
) |
|
|
7,681 |
|
|
Income (loss) from operations |
|
|
11,857 |
|
|
|
(9,281 |
) |
|
|
25,134 |
|
|
|
28,545 |
|
|
Interest expense |
|
|
(2,175 |
) |
|
|
(1,650 |
) |
|
|
(8,364 |
) |
|
|
(6,664 |
) |
|
Interest income |
|
|
156 |
|
|
|
745 |
|
|
|
1,196 |
|
|
|
3,829 |
|
|
Other income (expense), net |
|
|
(482 |
) |
|
|
(717 |
) |
|
|
(673 |
) |
|
|
1,559 |
|
|
Income (loss) before income taxes |
|
|
9,356 |
|
|
|
(10,903 |
) |
|
|
17,293 |
|
|
|
27,269 |
|
|
Income tax expense |
|
|
1,661 |
|
|
|
(3,972 |
) |
|
|
3,238 |
|
|
|
3,844 |
|
|
Net income (loss) |
|
$ |
7,695 |
|
|
$ |
(6,931 |
) |
|
$ |
14,055 |
|
|
$ |
23,425 |
|
|
Earnings (loss) per share: |
|
|
|
|
|
|
|
|
|
|
|
|
|
|
|
|
|
Basic |
|
$ |
0.21 |
|
|
$ |
(0.19 |
) |
|
$ |
0.38 |
|
|
$ |
0.61 |
|
|
Diluted |
|
$ |
0.21 |
|
|
$ |
(0.19 |
) |
|
$ |
0.38 |
|
|
$ |
0.60 |
|
|
Weighted-average number of shares used in calculating
earnings per share: |
|
|
|
|
|
|
|
|
|
|
|
|
|
|
|
|
|
Basic |
|
|
36,402 |
|
|
|
36,928 |
|
|
|
36,524 |
|
|
|
38,338 |
|
|
Diluted |
|
|
36,596 |
|
|
|
36,928 |
|
|
|
36,817 |
|
|
|
38,763 |
|
For comparative purposes, certain prior year amounts have been reclassified to conform to the current year presentation.
5
Benchmark Electronics, Inc. and Subsidiaries
Condensed Consolidated Balance Sheets
(UNAUDITED)
(in thousands)
|
|
|
December 31, |
|
|
December 31, |
|
|
|
|
2020 |
|
|
2019 |
|
|
Assets |
|
|
|
|
|
|
|
|
|
Current assets: |
|
|
|
|
|
|
|
|
|
Cash and cash equivalents |
|
$ |
390,808 |
|
|
$ |
347,558 |
|
|
Restricted cash |
|
|
5,182 |
|
|
|
16,398 |
|
|
Accounts receivable, net |
|
|
309,331 |
|
|
|
324,424 |
|
|
Contract assets |
|
|
142,779 |
|
|
|
161,061 |
|
|
Inventories |
|
|
327,377 |
|
|
|
314,956 |
|
|
Other current assets |
|
|
26,874 |
|
|
|
30,685 |
|
|
Total current assets |
|
|
1,202,351 |
|
|
|
1,195,082 |
|
|
Property, plant and equipment, net |
|
|
185,272 |
|
|
|
205,819 |
|
|
Operating lease right-of-use assets |
|
|
79,966 |
|
|
|
76,859 |
|
|
Goodwill and other, net |
|
|
276,646 |
|
|
|
282,114 |
|
|
Total assets |
|
$ |
1,744,235 |
|
|
$ |
1,759,874 |
|
|
|
|
|
|
|
|
|
|
|
|
Liabilities and Shareholders’ Equity |
|
|
|
|
|
|
|
|
|
Current liabilities: |
|
|
|
|
|
|
|
|
|
Current installments of long-term debt and finance lease obligations |
|
$ |
9,161 |
|
|
$ |
8,825 |
|
|
Accounts payable |
|
|
282,208 |
|
|
|
302,994 |
|
|
Advance payments from customers |
|
|
84,122 |
|
|
|
37,511 |
|
|
Accrued liabilities |
|
|
105,645 |
|
|
|
109,915 |
|
|
Total current liabilities |
|
|
481,136 |
|
|
|
459,245 |
|
|
Long-term debt and finance lease obligations, less current installments |
|
|
131,051 |
|
|
|
138,912 |
|
|
Operating lease liabilities |
|
|
72,120 |
|
|
|
67,898 |
|
|
Other long-term liabilities |
|
|
70,340 |
|
|
|
78,987 |
|
|
Shareholders’ equity |
|
|
989,588 |
|
|
|
1,014,832 |
|
|
Total liabilities and shareholders’ equity |
|
$ |
1,744,235 |
|
|
$ |
1,759,874 |
|
6
Benchmark Electronics, Inc. and Subsidiaries
Condensed Consolidated Statement of Cash Flows
(in thousands)
(UNAUDITED)
|
|
|
Year Ended |
|
|
|
|
December 31, |
|
|
|
|
2020 |
|
|
2019 |
|
|
Cash flows from operating activities: |
|
|
|
|
|
|
|
|
|
Net income |
|
$ |
14,055 |
|
|
$ |
23,425 |
|
|
Depreciation and amortization |
|
|
48,792 |
|
|
|
48,427 |
|
|
Stock-based compensation expense |
|
|
10,398 |
|
|
|
10,194 |
|
|
Accounts receivable, net |
|
|
13,586 |
|
|
|
134,926 |
|
|
Contract assets |
|
|
18,282 |
|
|
|
(20,979 |
) |
|
Inventories |
|
|
(10,799 |
) |
|
|
(5,238 |
) |
|
Accounts payable |
|
|
(15,553 |
) |
|
|
(121,860 |
) |
|
Advance payments from customers |
|
|
46,612 |
|
|
|
9,254 |
|
|
Other changes in working capital and other, net |
|
|
(4,935 |
) |
|
|
14,987 |
|
|
Net cash provided by operations |
|
|
120,438 |
|
|
|
93,136 |
|
|
|
|
|
|
|
|
|
|
|
|
Cash flows from investing activities: |
|
|
|
|
|
|
|
|
|
Additions to property, plant and equipment and software |
|
|
(39,519 |
) |
|
|
(35,118 |
) |
|
Other investing activities, net |
|
|
5,136 |
|
|
|
255 |
|
|
Net cash used in investing activities |
|
|
(34,383 |
) |
|
|
(34,863 |
) |
|
|
|
|
|
|
|
|
|
|
|
Cash flows from financing activities: |
|
|
|
|
|
|
|
|
|
Share repurchases |
|
|
(25,220 |
) |
|
|
(122,110 |
) |
|
Net debt activity |
|
|
(7,987 |
) |
|
|
(6,794 |
) |
|
Other financing activities, net |
|
|
(24,319 |
) |
|
|
(23,933 |
) |
|
Net cash used in financing activities |
|
|
(57,526 |
) |
|
|
(152,837 |
) |
|
|
|
|
|
|
|
|
|
|
|
Effect of exchange rate changes |
|
|
3,505 |
|
|
|
418 |
|
|
Net increase (decrease) in cash and cash equivalents and restricted cash |
|
|
32,034 |
|
|
|
(94,146 |
) |
|
Cash and cash equivalents and restricted cash at beginning of year |
|
|
363,956 |
|
|
|
458,102 |
|
|
Cash and cash equivalents and restricted cash at end of year |
|
$ |
395,990 |
|
|
$ |
363,956 |
|
7
Benchmark Electronics, Inc. and Subsidiaries
Reconciliation of GAAP to Non-GAAP Financial Results
(Amounts in Thousands, Except Per Share Data)
(UNAUDITED)
|
|
|
Three Months Ended |
|
|
Year Ended |
|
|
|
|
Dec 31, |
|
|
Sep 30, |
|
|
Dec 31, |
|
|
Dec 31, |
|
|
|
|
2020 |
|
|
2020 |
|
|
2019 |
|
|
2020 |
|
|
2019 |
|
|
Income (loss) from operations (GAAP) |
|
$ |
11,857 |
|
|
$ |
8,659 |
|
|
$ |
(9,281 |
) |
|
$ |
25,134 |
|
|
$ |
28,545 |
|
|
Restructuring charges and other costs |
|
|
4,490 |
|
|
|
1,425 |
|
|
|
2,268 |
|
|
|
13,227 |
|
|
|
13,101 |
|
|
Ransomware incident related costs (recovery), net |
|
|
(45 |
) |
|
|
(1,558 |
) |
|
|
7,681 |
|
|
|
(1,350 |
) |
|
|
7,681 |
|
|
Settlement |
|
|
— |
|
|
|
— |
|
|
|
(773 |
) |
|
|
— |
|
|
|
— |
|
|
Impairment |
|
|
— |
|
|
|
5,736 |
|
|
|
— |
|
|
|
6,743 |
|
|
|
— |
|
|
Customer insolvency (recovery) |
|
|
(553 |
) |
|
|
(796 |
) |
|
|
11,036 |
|
|
|
(1,702 |
) |
|
|
8,278 |
|
|
Amortization of intangible assets |
|
|
1,979 |
|
|
|
2,368 |
|
|
|
2,366 |
|
|
|
9,099 |
|
|
|
9,461 |
|
|
Non-GAAP income from operations |
|
$ |
17,728 |
|
|
$ |
15,834 |
|
|
$ |
13,297 |
|
|
$ |
51,151 |
|
|
$ |
67,066 |
|
|
|
|
|
|
|
|
|
|
|
|
|
|
|
|
|
|
|
|
|
|
|
|
Gross Profit (GAAP) |
|
$ |
50,661 |
|
|
$ |
46,354 |
|
|
$ |
37,313 |
|
|
$ |
175,048 |
|
|
$ |
185,528 |
|
|
Settlement |
|
|
— |
|
|
|
— |
|
|
|
(773 |
) |
|
|
— |
|
|
|
— |
|
|
Customer insolvency (recovery) |
|
|
(553 |
) |
|
|
(796 |
) |
|
|
967 |
|
|
|
(1,702 |
) |
|
|
(73 |
) |
|
Non-GAAP gross profit |
|
$ |
50,108 |
|
|
$ |
45,558 |
|
|
$ |
37,507 |
|
|
$ |
173,346 |
|
|
$ |
185,455 |
|
|
|
|
|
|
|
|
|
|
|
|
|
|
|
|
|
|
|
|
|
|
|
|
Net income (loss) (GAAP) |
|
$ |
7,695 |
|
|
$ |
5,915 |
|
|
$ |
(6,931 |
) |
|
$ |
14,055 |
|
|
$ |
23,425 |
|
|
Restructuring charges and other costs |
|
|
4,490 |
|
|
|
1,425 |
|
|
|
2,268 |
|
|
|
13,227 |
|
|
|
13,426 |
|
|
Ransomware incident related costs (recovery), net |
|
|
(45 |
) |
|
|
(1,558 |
) |
|
|
7,681 |
|
|
|
(1,350 |
) |
|
|
7,681 |
|
|
Customer insolvency (recovery) |
|
|
(553 |
) |
|
|
(796 |
) |
|
|
11,036 |
|
|
|
(1,702 |
) |
|
|
8,278 |
|
|
Amortization of intangible assets |
|
|
1,979 |
|
|
|
2,368 |
|
|
|
2,366 |
|
|
|
9,099 |
|
|
|
9,461 |
|
|
Settlements |
|
|
— |
|
|
|
— |
|
|
|
(773 |
) |
|
|
— |
|
|
|
(3,021 |
) |
|
Impairment |
|
|
— |
|
|
|
5,736 |
|
|
|
— |
|
|
|
6,743 |
|
|
|
— |
|
|
Income tax adjustments(1) |
|
|
(1,006 |
) |
|
|
(1,458 |
) |
|
|
(5,385 |
) |
|
|
(5,157 |
) |
|
|
(8,095 |
) |
|
Non-GAAP net income |
|
$ |
12,560 |
|
|
$ |
11,632 |
|
|
$ |
10,262 |
|
|
$ |
34,915 |
|
|
$ |
51,155 |
|
|
|
|
|
|
|
|
|
|
|
|
|
|
|
|
|
|
|
|
|
|
|
|
Diluted earnings (loss) per share: |
|
|
|
|
|
|
|
|
|
|
|
|
|
|
|
|
|
|
|
|
|
Diluted (GAAP) |
|
$ |
0.21 |
|
|
$ |
0.16 |
|
|
$ |
(0.19 |
) |
|
$ |
0.38 |
|
|
$ |
0.60 |
|
|
Diluted (Non-GAAP) |
|
$ |
0.34 |
|
|
$ |
0.32 |
|
|
$ |
0.27 |
|
|
$ |
0.95 |
|
|
$ |
1.32 |
|
|
|
|
|
|
|
|
|
|
|
|
|
|
|
|
|
|
|
|
|
|
|
|
Weighted-average number of shares used in |
|
|
|
|
|
|
|
|
|
|
|
|
|
|
|
|
|
|
|
|
|
calculating diluted earnings (loss) per share: |
|
|
|
|
|
|
|
|
|
|
|
|
|
|
|
|
|
|
|
|
|
Diluted (GAAP) |
|
|
36,596 |
|
|
|
36,544 |
|
|
|
36,928 |
|
|
|
36,817 |
|
|
|
38,763 |
|
|
Diluted (Non-GAAP) |
|
|
36,596 |
|
|
|
36,544 |
|
|
|
37,374 |
|
|
|
36,817 |
|
|
|
38,763 |
|
|
(1) |
This amount represents the tax impact of the non-GAAP adjustments using the applicable effective tax rates. |
8
Benchmark Electronics
Q4-20 and CY2020 Earnings Results February 4, 2021 Exhibit 99.2
Forward-Looking Statements This document contains forward-looking statements within the meaning of Section 27A of the Securities Act of 1933 and Section 21E of the Securities Exchange Act of 1934. The words "expect," "estimate," "anticipate," "could" "predict" and similar expressions, and the negatives thereof, often identify forward-looking statements, which are not limited to historical facts. Forward-looking statements include, among other things, the estimated financial impact of the COVID-19 pandemic, the outlook and guidance for first quarter 2021 results, the company’s anticipated plans and responses to the COVID-19 pandemic, statements (express or implied) concerning future operating results or margins, the ability to generate sales and income or cash flow, and expected revenue mix; and Benchmark’s business and growth strategies. Although the company believes these statements are based upon reasonable assumptions, they involve risks and uncertainties relating to operations, markets and the business environment generally. These statements also depend on the duration and severity of the COVID-19 pandemic and related risks, including government and other third-party responses to it and the consequences for the global economy, our business and the businesses of our suppliers and customers. Events relating to or resulting from the COVID-19 pandemic, including the possibility of customer demand fluctuations, supply chain constraints, or the ability to utilize our manufacturing facilities at sufficient levels to cover our fixed operating costs, may have resulting impacts on the company’s business, financial condition, results of operations, and the company’s ability (or inability) to execute on its plans to respond to the COVID-19 pandemic. If one or more of these risks or uncertainties materializes, or underlying assumptions prove incorrect, actual outcomes may vary materially from those indicated. Readers are advised to consult further disclosures on these risks and uncertainties, particularly in Part 1, Item 1A, "Risk Factors" of the company's Annual Report on Form 10-K for the year ended December 31, 2019 and in Part II, Item 1A, “Risk Factors” in the Company’s Quarterly Report on Form 10-Q for the quarter ended September 30, 2020 and in its subsequent filings with the Securities and Exchange Commission. All forward-looking statements included in this document are based upon information available to the company as of the date of this document, and it assumes no obligation to update them. Non-GAAP Financial Information This document includes certain financial measures that exclude items and therefore are not in accordance with U.S. generally accepted accounting principles (“GAAP”). A detailed reconciliation between GAAP results and results excluding special items (“non-GAAP”) is included in the Appendix of this document. In situations where a non-GAAP reconciliation has not been provided, the company was unable to provide such a reconciliation without unreasonable effort due to the uncertainty and inherent difficulty predicting the occurrence, the financial impact and the periods in which the non-GAAP adjustments may be recognized. Management discloses non‐GAAP information to provide investors with additional information to analyze the Company’s performance and underlying trends. Management uses non‐GAAP measures that exclude certain items in order to better assess operating performance and help investors compare results with our previous guidance. This document also references “free cash flow”, which the Company defines as cash flow from operations less additions to property, plant and equipment and purchased software. The Company’s non‐GAAP information is not necessarily comparable to the non‐GAAP information used by other companies. Non‐GAAP information should not be viewed as a substitute for, or superior to, net income or other data prepared in accordance with GAAP as a measure of the Company’s profitability or liquidity. Readers should consider the types of events and transactions for which adjustments have been made.
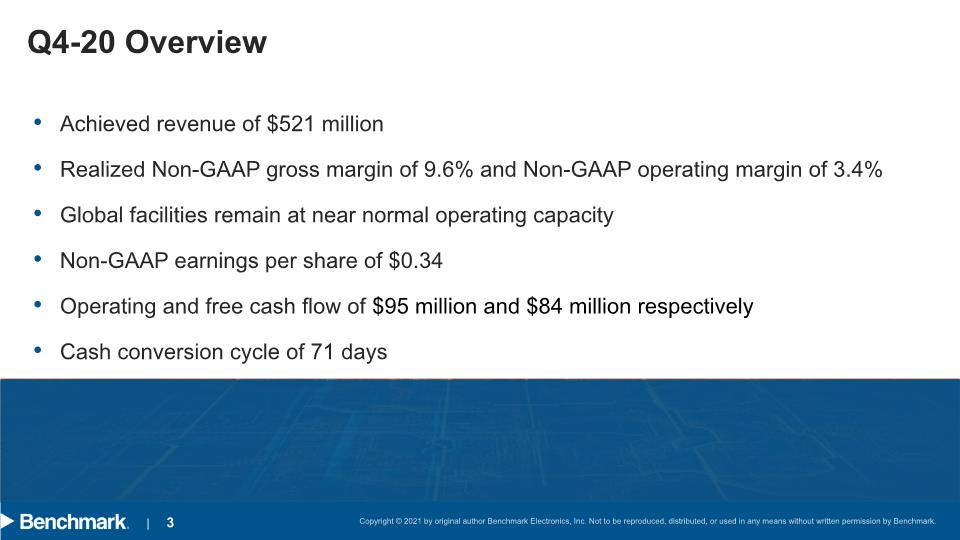
Q4-20 Overview Achieved revenue of $521 million
Realized Non-GAAP gross margin of 9.6% and Non-GAAP operating margin of 3.4%
Global facilities remain at near normal operating capacity
Non-GAAP earnings per share of $0.34
Operating and free cash flow of $95 million and $84 million respectively
Cash conversion cycle of 71 days
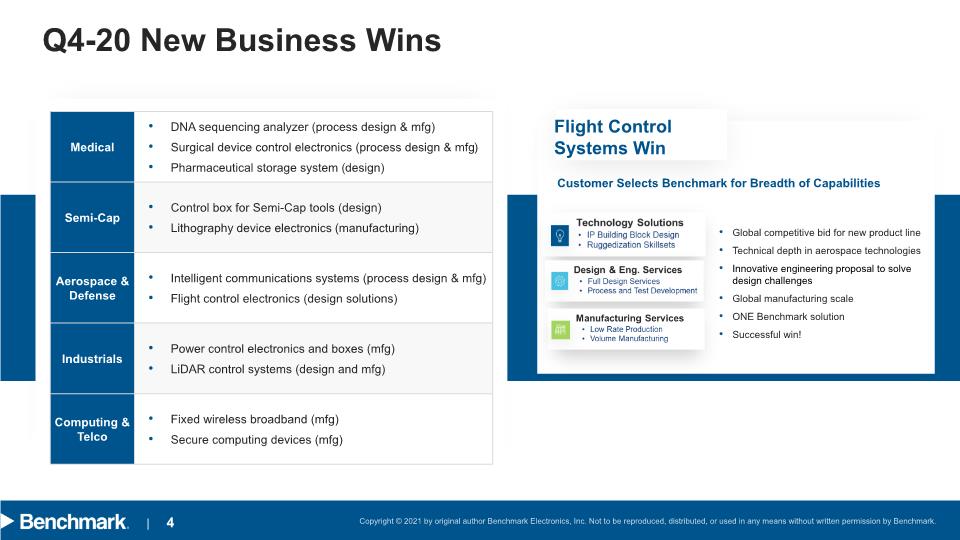
Q4-20 New Business Wins Flight Control Systems Win
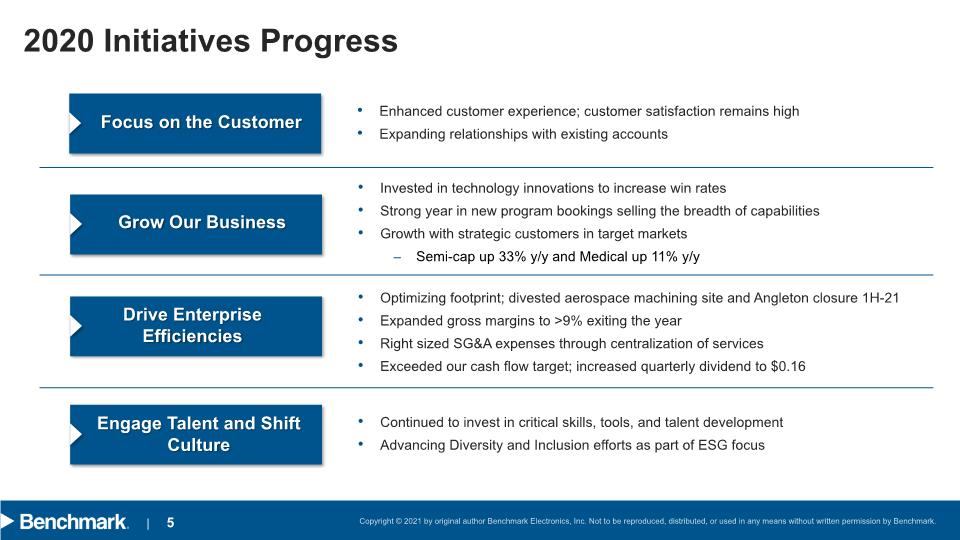
2020 Initiatives Progress Focus on the Customer Grow Our Business Drive Enterprise Efficiencies Engage Talent and Shift Culture Enhanced customer experience; customer satisfaction remains high
Expanding relationships with existing accounts Invested in technology innovations to increase win rates
Strong year in new program bookings selling the breadth of capabilities
Growth with strategic customers in target markets
Semi-cap up 33% y/y and Medical up 11% y/y Optimizing footprint; divested aerospace machining site and Angleton closure 1H-21
Expanded gross margins to >9% exiting the year
Right sized SG&A expenses through centralization of services
Exceeded our cash flow target; increased quarterly dividend to $0.16 Continued to invest in critical skills, tools, and talent development
Advancing Diversity and Inclusion efforts as part of ESG focus
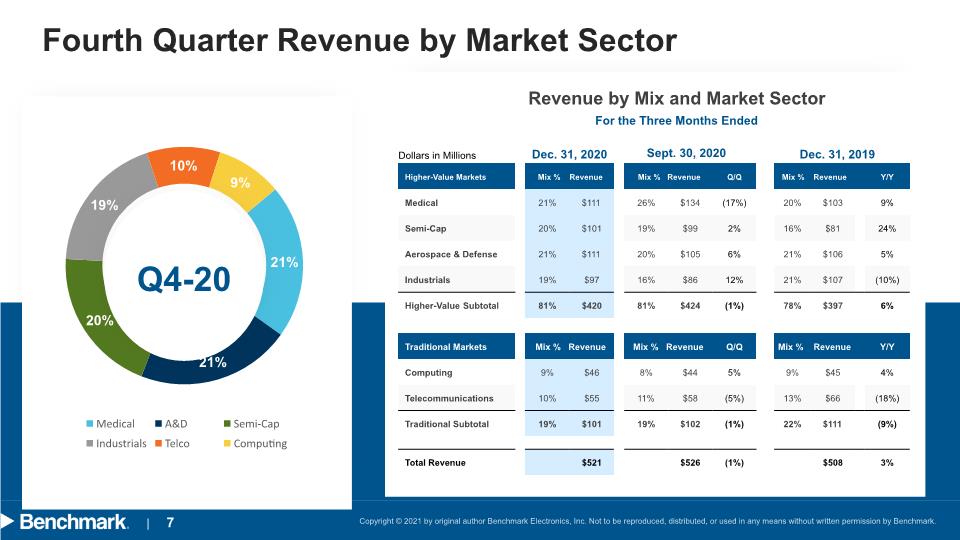
Fourth Quarter Revenue by Market Sector Q4-20 Dec. 31, 2020 Revenue by Mix and Market Sector Sept. 30, 2020 Dec. 31, 2019 For the Three Months Ended Dollars in Millions
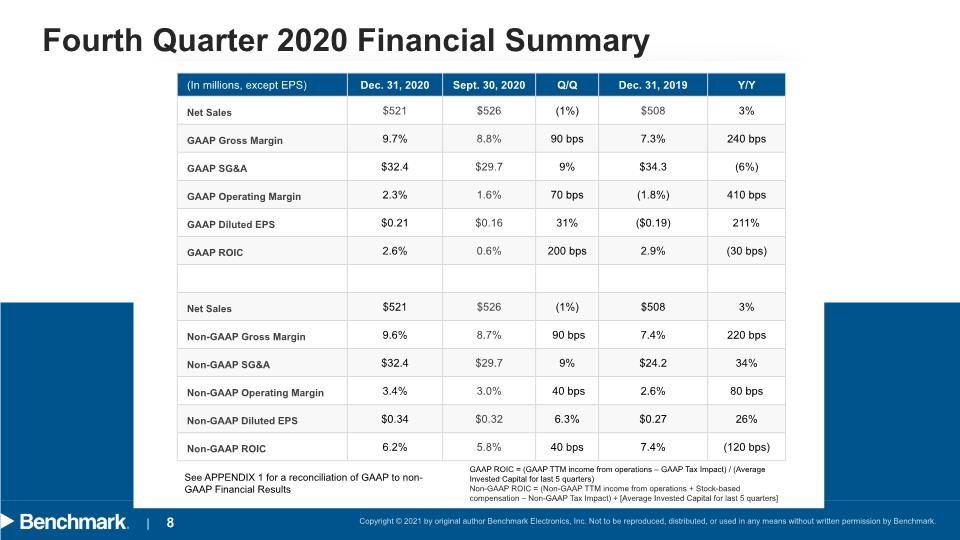
Fourth Quarter 2020 Financial Summary See APPENDIX 1 for a reconciliation of GAAP to non-GAAP Financial Results GAAP ROIC = (GAAP TTM income from operations – GAAP Tax Impact) / (Average Invested Capital for last 5 quarters)
Non-GAAP ROIC = (Non-GAAP TTM income from operations + Stock-based compensation – Non-GAAP Tax Impact) ÷ [Average Invested Capital for last 5 quarters]
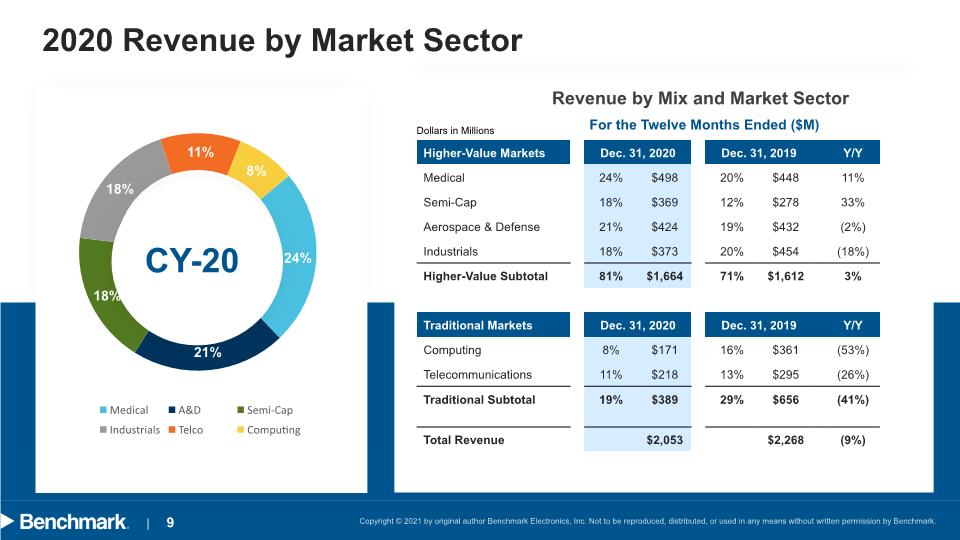
2020 Revenue by Market Sector CY-20 Revenue by Mix and Market Sector For the Twelve Months Ended ($M) Dollars in Millions
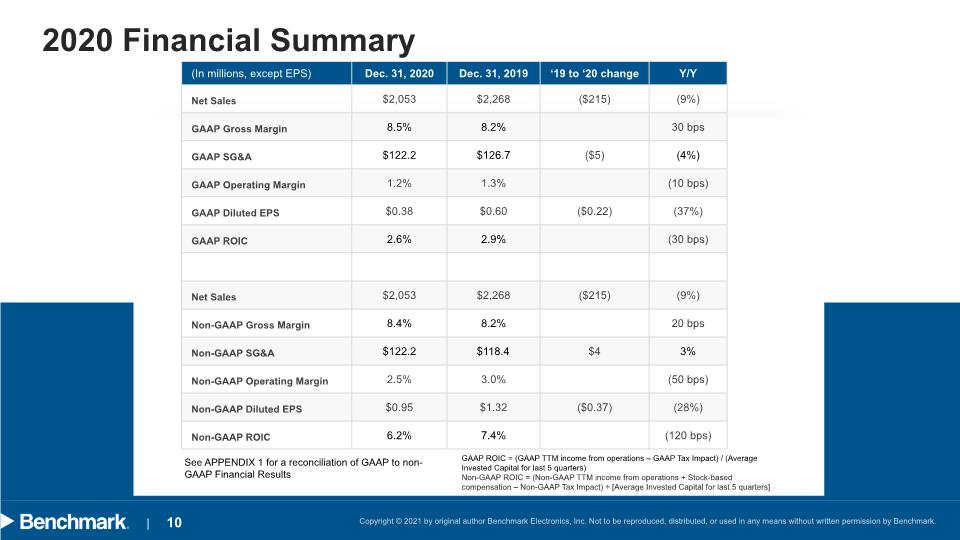
2020 Financial Summary See APPENDIX 1 for a reconciliation of GAAP to non-GAAP Financial Results GAAP ROIC = (GAAP TTM income from operations – GAAP Tax Impact) / (Average Invested Capital for last 5 quarters)
Non-GAAP ROIC = (Non-GAAP TTM income from operations + Stock-based compensation – Non-GAAP Tax Impact) ÷ [Average Invested Capital for last 5 quarters]
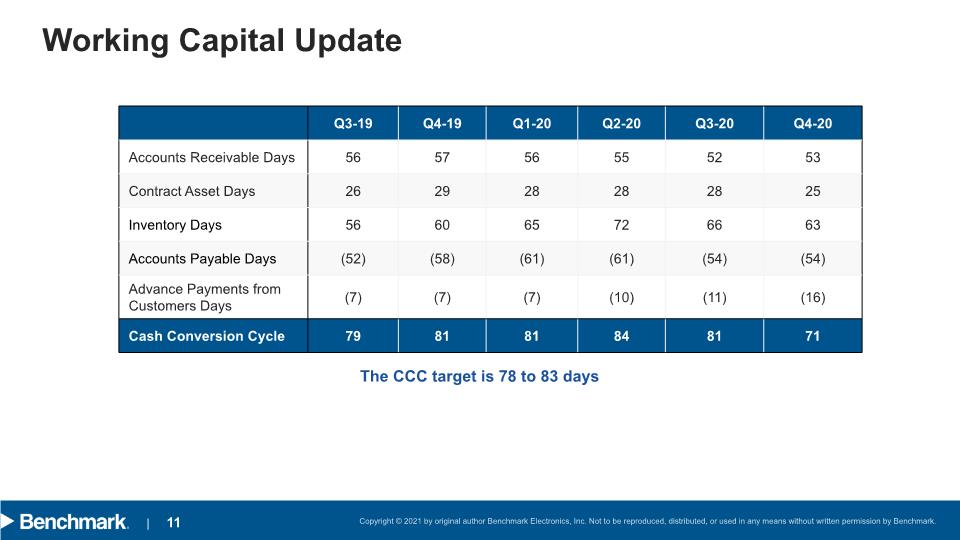
Working Capital Update The CCC target is 78 to 83 days
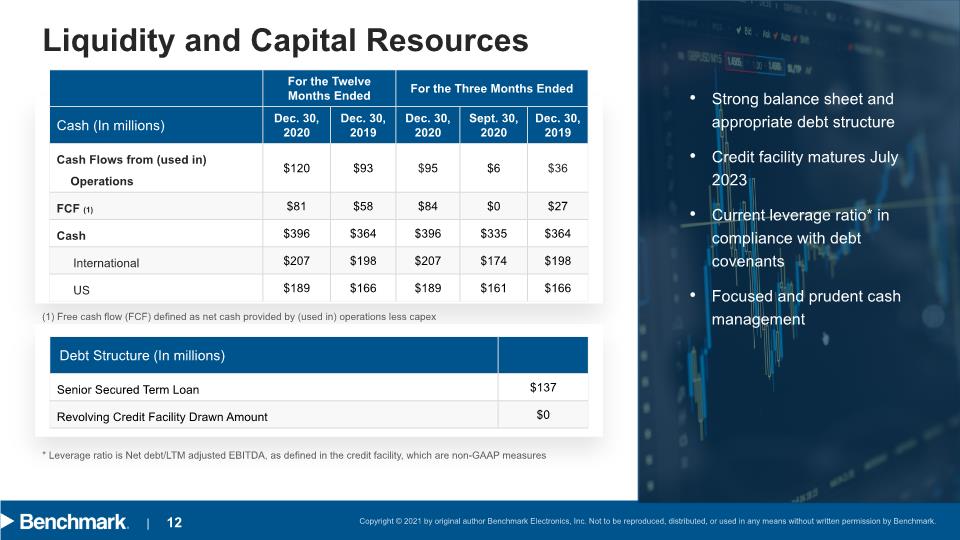
Liquidity and Capital Resources (1) Free cash flow (FCF) defined as net cash provided by (used in) operations less capex * Leverage ratio is Net debt/LTM adjusted EBITDA, as defined in the credit facility, which are non-GAAP measures Strong balance sheet and appropriate debt structure
Credit facility matures July 2023
Current leverage ratio* in compliance with debt covenants
Focused and prudent cash management
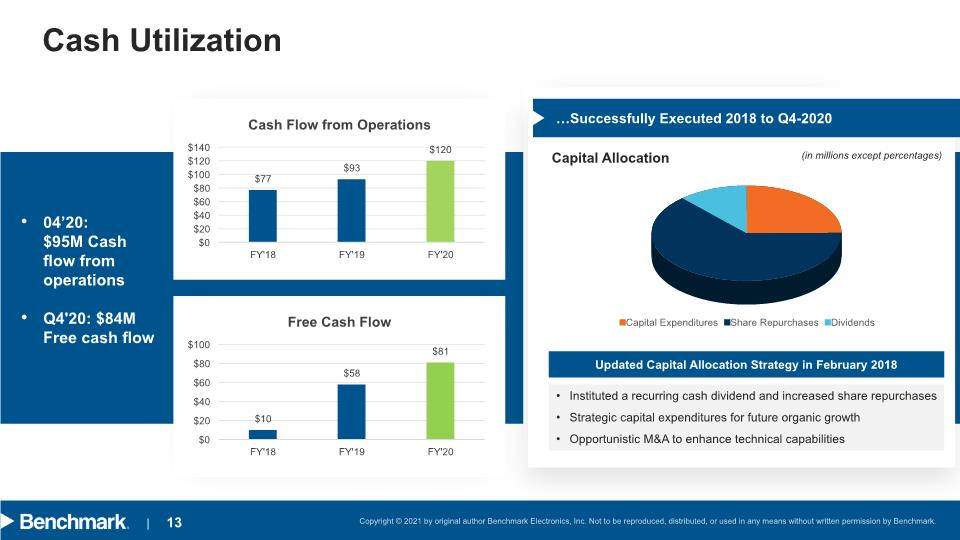
Cash Utilization Cash Flow from Operations Free Cash Flow Instituted a recurring cash dividend and increased share repurchases
Strategic capital expenditures for future organic growth
Opportunistic M&A to enhance technical capabilities Updated Capital Allocation Strategy in February 2018 (in millions except percentages) Capital Allocation

Capital Allocation Update Cash Dividends Share Repurchases Cash Dividends Paid (in millions) Shares Repurchased (in millions, shares)

First Quarter 2021 Guidance * This guidance takes into consideration all known constraints for the quarter and assumes no further significant interruptions to our supply base, operations or customers. Guidance also assumes no material changes to end market conditions due to COVID-19.
2021 Goals and Initiatives Jeff Benck - CEO
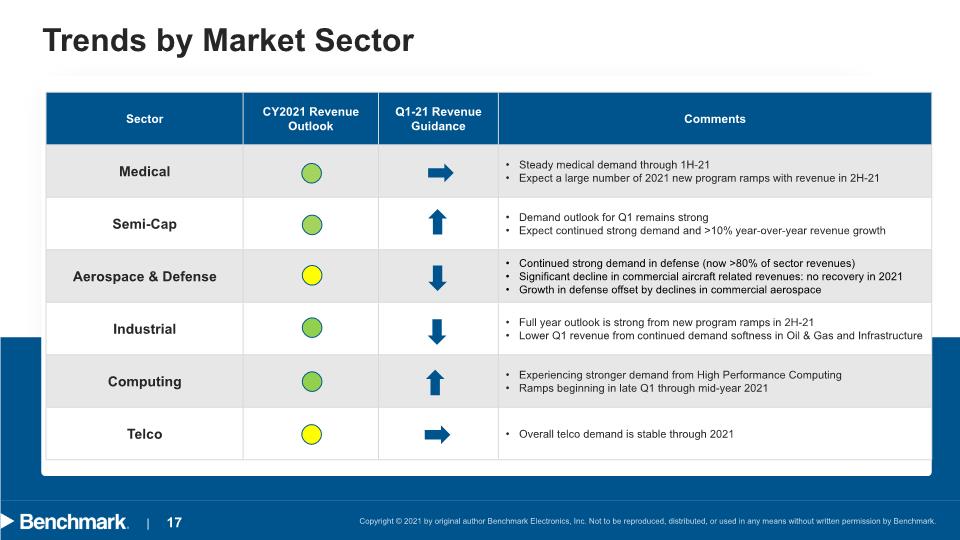
Trends by Market Sector
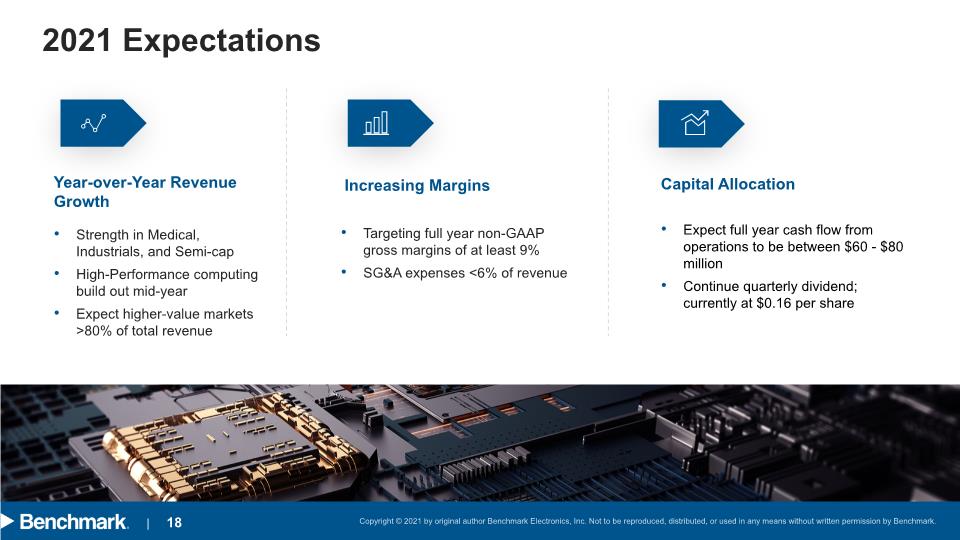
2021 Expectations Strength in Medical, Industrials, and Semi-cap
High-Performance computing build out mid-year
Expect higher-value markets >80% of total revenue Year-over-Year Revenue Growth
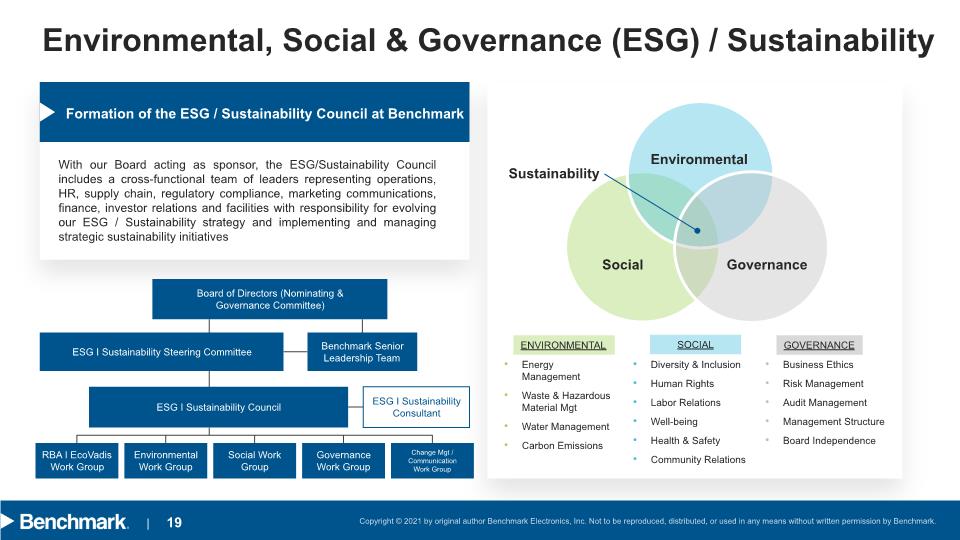
Environmental, Social & Governance (ESG) / Sustainability Formation of the ESG / Sustainability Council at Benchmark With our Board acting as sponsor, the ESG/Sustainability Council includes a cross-functional team of leaders representing operations, HR, supply chain, regulatory compliance, marketing communications, finance, investor relations and facilities with responsibility for evolving our ESG / Sustainability strategy and implementing and managing strategic sustainability initiatives Energy Management
Waste & Hazardous Material Mgt
Water Management
Carbon Emissions Diversity & Inclusion
Human Rights
Labor Relations
Well-being
Health & Safety
Community Relations Business Ethics
Risk Management
Audit Management
Management Structure
Board Independence Environmental Social Governance Sustainability Board of Directors (Nominating & Governance Committee) ESG I Sustainability Steering Committee Benchmark Senior Leadership Team ESG I Sustainability Council ESG I Sustainability Consultant RBA I EcoVadis Work Group EnvironmentalWork Group Social Work Group GovernanceWork Group Change Mgt / Communication Work Group ENVIRONMENTAL SOCIAL GOVERNANCE
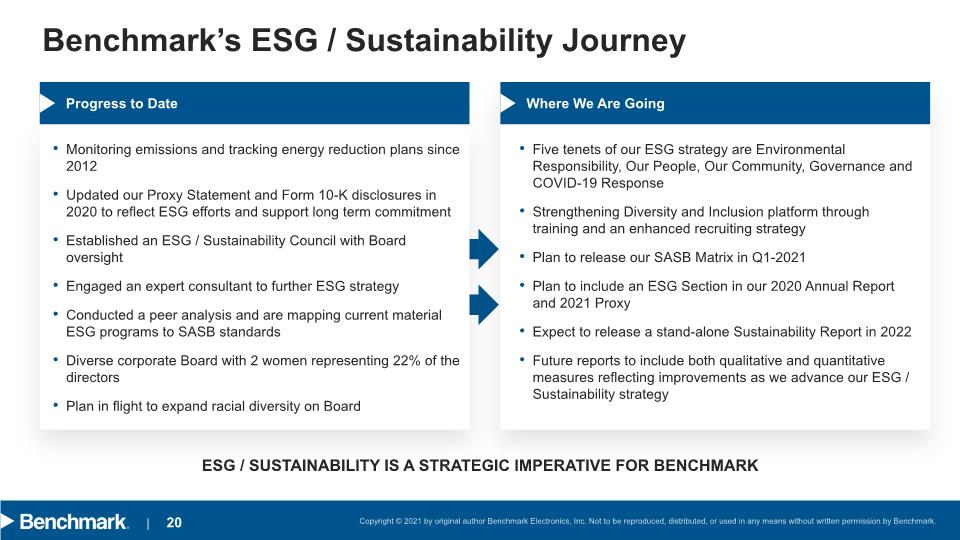
Benchmark’s ESG / Sustainability Journey Progress to Date Monitoring emissions and tracking energy reduction plans since 2012
Updated our Proxy Statement and Form 10-K disclosures in 2020 to reflect ESG efforts and support long term commitment
Established an ESG / Sustainability Council with Board oversight
Engaged an expert consultant to further ESG strategy
Conducted a peer analysis and are mapping current material ESG programs to SASB standards
Diverse corporate Board with 2 women representing 22% of the directors
Plan in flight to expand racial diversity on Board Where We Are Going Five tenets of our ESG strategy are Environmental Responsibility, Our People, Our Community, Governance and COVID-19 Response
Strengthening Diversity and Inclusion platform through training and an enhanced recruiting strategy
Plan to release our SASB Matrix in Q1-2021
Plan to include an ESG Section in our 2020 Annual Report and 2021 Proxy
Expect to release a stand-alone Sustainability Report in 2022
Future reports to include both qualitative and quantitative measures reflecting improvements as we advance our ESG / Sustainability strategy ESG / SUSTAINABILITY IS A STRATEGIC IMPERATIVE FOR BENCHMARK
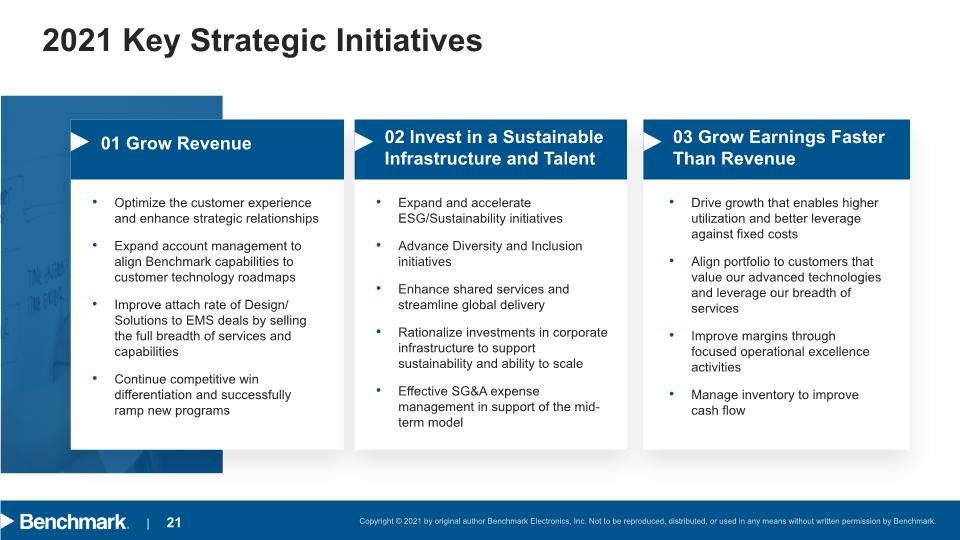
2021 Key Strategic Initiatives
Appendix

(Amounts in Thousands, Except Per Share Data) – (UNAUDITED) APPENDIX 1 - Reconciliation of GAAP to non-GAAP Financial Results
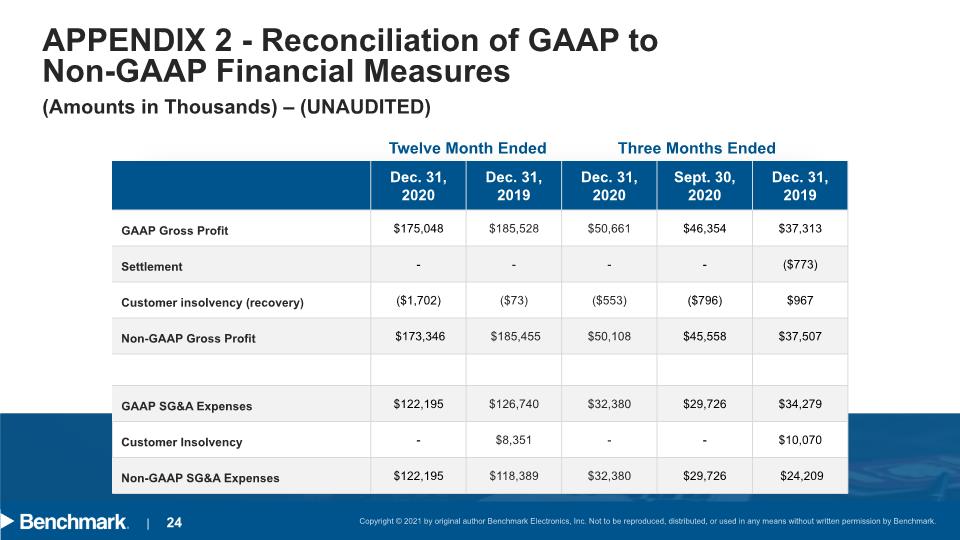
(Amounts in Thousands) – (UNAUDITED) APPENDIX 2 - Reconciliation of GAAP to Non-GAAP Financial Measures Twelve Month Ended Three Months Ended
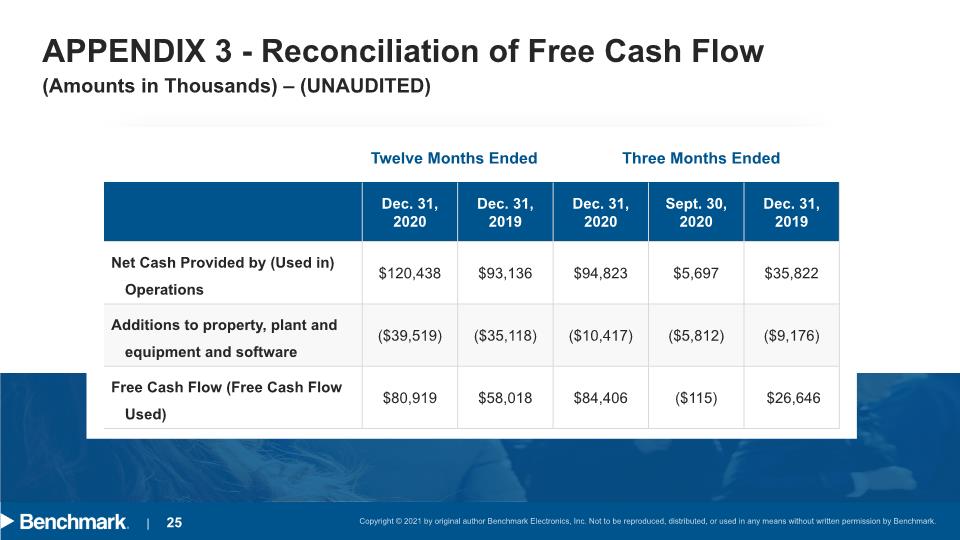
(Amounts in Thousands) – (UNAUDITED)
APPENDIX 3 - Reconciliation of Free Cash Flow Twelve Months Ended Three Months Ended