bhe-8k_20210428.htm
0000863436
false
0000863436
2021-04-28
2021-04-28
UNITED STATES
SECURITIES AND EXCHANGE COMMISSION
Washington, D.C. 20549
FORM 8-K
CURRENT REPORT
Pursuant to Section 13 or 15(d)
of the Securities Exchange Act of 1934
Date of Report (Date of earliest event reported): April 28, 2021
BENCHMARK ELECTRONICS, INC.
(Exact name of registrant as specified in its charter)
|
Texas |
1-10560 |
74-2211011 |
|
(State or other jurisdiction
of incorporation) |
(Commission
File Number) |
(I.R.S. Employer
Identification No.) |
56 South Rockford Drive, Tempe, Arizona 85281
(Address of Principal Executive Offices) (Zip Code)
Registrant’s telephone number, including area code: (623) 300-7000
Not Applicable
(Former name or former address, if changed since last report)
Check the appropriate box below if the Form 8-K filing is intended to simultaneously satisfy the filing obligation of the registrant under any of the following provisions (see General Instruction A.2. below):
☐ Written communications pursuant to Rule 425 under the Securities Act (17 CFR 230.425)
☐ Soliciting material pursuant to Rule 14a-12 under the Exchange Act (17 CFR 240.14a-12)
☐ Pre-commencement communications pursuant to Rule 14d-2(b) under the Exchange Act (17 CFR 240.14d-2(b))
☐ Pre-commencement communications pursuant to Rule 13e-4(c) under the Exchange Act (17 CFR 240.13e-4(c))
Securities registered pursuant to Section 12(b) of the Act:
|
Title of each class |
Trading Symbol |
Name of each exchange on which registered |
|
Common Stock, par value $0.10 per share |
BHE |
New York Stock Exchange, Inc. |
Indicate by check mark whether the registrant is an emerging growth company as defined in Rule 405 of the Securities Act of 1933 (§230.405 of this chapter) or Rule 12b-2 of the Securities Exchange Act of 1934 (§240.12b-2 of this chapter).
Emerging growth company ☐
If an emerging growth company, indicate by check mark if the registrant has elected not to use the extended transition period for complying with any new or revised financial accounting standards provided pursuant to Section 13(a) of the Exchange Act. ☐
Item 2.02. Results of Operations and Financial Condition.
On April 28, 2021, Benchmark Electronics, Inc. (the “Company”) issued a press release announcing its results of operations for the quarter ended March 31, 2021. A copy of the press release and accompanying investor presentation are attached hereto as Exhibits 99.1 and 99.2, respectively, and incorporated by reference herein. The information disclosed under this Item 2.02, including Exhibits 99.1 and 99.2 hereto, shall not be deemed “filed” for purposes of Section 18 of the Securities Exchange Act of 1934, as amended (the “Exchange Act”), or deemed incorporated by reference in any filing under the Securities Act of 1933, as amended, or the Exchange Act, except as shall be expressly set forth by specific reference in such a filing.
Item 9.01. Financial Statements and Exhibits.
(d) Exhibits
1
SIGNATURES
Pursuant to the requirements of the Securities Exchange Act of 1934, the registrant has duly caused this report to be signed on its behalf by the undersigned hereunto duly authorized.
|
|
BENCHMARK ELECTRONICS, INC. |
|
|
|
|
|
|
Date: April 28, 2021 |
By: |
|
/s/ Stephen J. Beaver |
|
|
|
|
Stephen J. Beaver, Esq. |
|
|
|
|
Senior Vice President, General Counsel and Chief Legal Officer |
2
Exhibit 99.1
FOR IMMEDIATE RELEASE
BENCHMARK REPORTS FIRST QUARTER 2021 RESULTS
First quarter 2021 results:
|
|
• |
Quarterly revenue of $506 million |
|
|
• |
Semi-Cap revenue growth of 37% year-over-year |
|
|
• |
Computing revenue growth of 19% year-over-year |
|
|
• |
Higher-value markets revenue mix of 80% |
|
|
• |
GAAP diluted EPS of $0.22 and non-GAAP diluted EPS of $0.21 |
|
|
• |
Cash from operations of $37 million and free cash flow of $30 million |
TEMPE, AZ, April 28, 2021 – Benchmark Electronics, Inc. (NYSE: BHE) today announced financial results for the first quarter ended March 31, 2021.
|
|
|
Three Months Ended |
|
|
|
|
Mar 31, |
|
|
Dec 31, |
|
|
Mar 31, |
|
|
In millions, except EPS |
|
2021 |
|
|
2020 |
|
|
2020 |
|
|
Sales |
|
$ |
506 |
|
|
$ |
521 |
|
|
$ |
515 |
|
|
Net income(2) |
|
$ |
8 |
|
|
$ |
8 |
|
|
$ |
4 |
|
|
Net income – non-GAAP(1)(2) |
|
$ |
8 |
|
|
$ |
13 |
|
|
$ |
8 |
|
|
Diluted earnings per share(2) |
|
$ |
0.22 |
|
|
$ |
0.21 |
|
|
$ |
0.10 |
|
|
Diluted EPS – non-GAAP(1)(2) |
|
$ |
0.21 |
|
|
$ |
0.34 |
|
|
$ |
0.22 |
|
|
Operating margin(2) |
|
|
2.4 |
% |
|
|
2.3 |
% |
|
|
1.3 |
% |
|
Operating margin – non-GAAP(1)(2) |
|
|
2.3 |
% |
|
|
3.4 |
% |
|
|
2.3 |
% |
|
(1) |
A reconciliation of GAAP and non-GAAP results is included below. |
|
(2) |
Results for the first quarter ended March 31, 2021, fourth quarter ended December 31, 2020 and first quarter ended March 31, 2020 include the impact of approximately $1.4 million, $1.6 million and $0.7 million of net COVID-19 related costs, respectively. |
“We delivered another solid quarter of revenue, earnings, and cash generation in line with our expectations,” said Jeff Benck, Benchmark's President and CEO. “We are particularly pleased with continued strength in the Semi-Cap market where revenues were up 37% year-over-year in the first quarter and are now forecasted to be up greater than 20% for the full year 2021.”
Benck continued, “Overall demand across many of our market sectors is strengthening and we expect this to continue through the year. In the near-term, we are proactively working with our customers and suppliers to manage supply chain constraints. We remain focused on our strategic objectives which gives us confidence that we will grow revenue, margins, and earnings in 2021.”
1
Cash Conversion Cycle
|
|
|
Mar 31, |
|
|
Dec 31, |
|
|
Mar 31, |
|
|
|
|
2021 |
|
|
2020 |
|
|
2020 |
|
|
Accounts receivable days |
|
|
49 |
|
|
|
53 |
|
|
|
56 |
|
|
Contract asset days |
|
|
26 |
|
|
|
25 |
|
|
|
28 |
|
|
Inventory days |
|
|
69 |
|
|
|
63 |
|
|
|
65 |
|
|
Accounts payable days |
|
|
(64 |
) |
|
|
(54 |
) |
|
|
(61 |
) |
|
Advance payments from customers days |
|
|
(15 |
) |
|
|
(16 |
) |
|
|
(7 |
) |
|
Cash Conversion Cycle days |
|
|
65 |
|
|
|
71 |
|
|
|
81 |
|
First Quarter 2021 Industry Sector Update
Revenue and percentage of sales by industry sector (in millions) was as follows.
|
|
|
Mar 31, |
|
|
Dec 31, |
|
|
Mar 31, |
|
|
Higher-Value Markets |
|
2021 |
|
|
2020 |
|
|
2020 |
|
|
Medical |
|
$ |
109 |
|
|
|
21 |
% |
|
$ |
111 |
|
|
|
21 |
% |
|
$ |
118 |
|
|
|
23 |
% |
|
Semi-Cap |
|
|
113 |
|
|
|
22 |
|
|
|
101 |
|
|
|
20 |
|
|
|
83 |
|
|
|
16 |
|
|
A&D |
|
|
89 |
|
|
|
18 |
|
|
|
111 |
|
|
|
21 |
|
|
|
119 |
|
|
|
23 |
|
|
Industrials |
|
|
95 |
|
|
|
19 |
|
|
|
97 |
|
|
|
19 |
|
|
|
103 |
|
|
|
20 |
|
|
|
|
$ |
406 |
|
|
|
80 |
% |
|
$ |
420 |
|
|
|
81 |
% |
|
$ |
423 |
|
|
|
82 |
% |
|
|
|
|
|
|
|
|
|
|
|
|
|
|
|
|
|
|
|
|
|
|
|
|
|
|
|
|
|
Mar 31, |
|
|
Dec 31, |
|
|
Mar 31, |
|
|
Traditional Markets |
|
2021 |
|
|
2020 |
|
|
2020 |
|
|
Computing |
|
$ |
44 |
|
|
|
9 |
% |
|
$ |
46 |
|
|
|
9 |
% |
|
$ |
36 |
|
|
|
7 |
% |
|
Telecommunications |
|
|
56 |
|
|
|
11 |
|
|
|
55 |
|
|
|
10 |
|
|
|
56 |
|
|
|
11 |
|
|
|
|
$ |
100 |
|
|
|
20 |
% |
|
$ |
101 |
|
|
|
19 |
% |
|
$ |
92 |
|
|
|
18 |
% |
|
Total |
|
$ |
506 |
|
|
|
100 |
% |
|
$ |
521 |
|
|
|
100 |
% |
|
$ |
515 |
|
|
|
100 |
% |
Overall, higher-value market revenues were down 4% year-over-year from softness in commercial aerospace (in A&D), industrials and medical elective surgeries. Traditional market revenues were up 8% year-over-year primarily from strength in the computing sector.
Second Quarter 2021 Outlook
|
|
• |
Revenue between $515 - $555 million |
|
|
• |
Diluted GAAP earnings per share between $0.18 - $0.24 |
|
|
• |
Diluted non-GAAP earnings per share between $0.23 - $0.29 (excluding restructuring charges and other costs and amortization of intangibles) |
|
|
• |
This guidance takes into consideration all known constraints for the quarter and assumes no further significant interruptions to our supply base, operations or customers. Guidance also assumes no material changes to end market conditions due to COVID-19. |
Restructuring charges are expected to range between $0.8 million and $1.2 million in the second quarter and the amortization of intangibles is expected to be $1.7 million in the second quarter.
First Quarter 2021 Earnings Conference Call
The Company will host a conference call to discuss the results today at 5:00 p.m. Eastern Time. The live webcast of the call and accompanying reference materials will be accessible by logging on to the Company's website at www.bench.com. A replay of the broadcast will also be available until Wednesday, May 5, 2021 on the Company's website.
2
About Benchmark Electronics, Inc.
Benchmark provides comprehensive solutions across the entire product life cycle by leading through its innovative technology and engineering design services, leveraging its optimized global supply chain and delivering world-class manufacturing services in the following industries: commercial aerospace, defense, advanced computing, next generation telecommunications, complex industrials, medical, and semiconductor capital equipment. Benchmark's global operations include facilities in seven countries and its common shares trade on the New York Stock Exchange under the symbol BHE.
For More Information, Please Contact:
Lisa K. Weeks, Senior Vice President, Chief Strategy Officer
623-300-7052 or [email protected]
Forward-Looking Statements
This press release contains forward-looking statements within the meaning of Section 27A of the Securities Act of 1933, as amended and Section 21E of the Securities Exchange Act of 1934, as amended (Exchange Act). These forward-looking statements are identified as any statement that does not relate strictly to historical or current facts and may include words such as “anticipate,” “believe,” “intend,” “plan,” “project,” “forecast,” “strategy,” “position,” “continue,” “estimate,” “expect,” “may,” “will,” “could,” “predict,” and similar expressions or the negative or other variations thereof. In particular, statements, express or implied, concerning future operating results, our ability to generate sales, income or cash flow, the anticipated impact of the COVID-19 pandemic, the outlook and guidance for second quarter 2021 results, our anticipated plans and responses to the COVID-19 pandemic, our expected revenue mix, our business strategy and strategic initiatives, our repurchases of shares of our common stock and our intentions concerning the payment of dividends, among others, are forward-looking statements. Although we believe these statements are based upon reasonable assumptions, they involve risks, uncertainties and assumptions that are beyond our ability to control or predict, relating to operations, markets and the business environment generally, including those discussed under Part I, Item 1A of the company's Annual Report on Form 10-K for the year ended December 31, 2020 and in any of our subsequent reports filed with the Securities and Exchange Commission (SEC). In particular, these statements also depend on the duration, severity and evolution of the COVID-19 pandemic and related risks, including government and other third-party responses to it and the consequences for the global economy, our business and the businesses of our suppliers and customers, as well as our ability (or inability) to execute on our plans to respond to the COVID-19 pandemic. Should one or more of these risks or uncertainties materialize, or should underlying assumptions prove incorrect, actual outcomes, including the future results of our operations, may vary materially from those indicated. Undue reliance should not be placed on any forward-looking statements. Forward-looking statements are not guarantees of performance. All forward-looking statements included in this document are based upon information available to us as of the date of this document, and we assume no obligation to update.
3
Non-GAAP Financial Measures
Management discloses non‐GAAP information to provide investors with additional information to analyze the Company’s performance and underlying trends. A detailed reconciliation between GAAP results and results excluding special items (“non-GAAP”) is included in the following tables attached to this document. In situations where a non-GAAP reconciliation has not been provided, the Company was unable to provide such a reconciliation without unreasonable effort due to the uncertainty and inherent difficulty predicting the occurrence, the financial impact and the periods in which the non-GAAP adjustments may be recognized. Management uses non‐GAAP measures that exclude certain items in order to better assess operating performance and help investors compare results with our previous guidance. This document also references “free cash flow”, which the Company defines as cash flow from operations less additions to property, plant and equipment and purchased software. The Company’s non‐GAAP information is not necessarily comparable to the non‐GAAP information used by other companies. Non‐GAAP information should not be viewed as a substitute for, or superior to, net income or other data prepared in accordance with GAAP as a measure of the Company’s profitability or liquidity. Readers should consider the types of events and transactions for which adjustments have been made.
###
4
Benchmark Electronics, Inc. and Subsidiaries
Condensed Consolidated Statements of Income
(Amounts in Thousands, Except Per Share Data)
(UNAUDITED)
|
|
|
Three Months Ended |
|
|
|
|
March 31, |
|
|
|
|
2021 |
|
|
2020 |
|
|
Sales |
|
$ |
505,721 |
|
|
$ |
514,964 |
|
|
Cost of sales |
|
|
463,494 |
|
|
|
471,603 |
|
|
Gross profit |
|
|
42,227 |
|
|
|
43,361 |
|
|
Selling, general and administrative expenses |
|
|
30,548 |
|
|
|
31,575 |
|
|
Amortization of intangible assets |
|
|
1,598 |
|
|
|
2,381 |
|
|
Restructuring charges and other costs |
|
|
1,591 |
|
|
|
2,915 |
|
|
Ransomware incident related costs (recovery), net |
|
|
(3,444 |
) |
|
|
— |
|
|
Income from operations |
|
|
11,934 |
|
|
|
6,490 |
|
|
Interest expense |
|
|
(2,149 |
) |
|
|
(1,702 |
) |
|
Interest income |
|
|
165 |
|
|
|
599 |
|
|
Other income (expense), net |
|
|
(276 |
) |
|
|
(662 |
) |
|
Income before income taxes |
|
|
9,674 |
|
|
|
4,725 |
|
|
Income tax expense |
|
|
1,757 |
|
|
|
873 |
|
|
Net income |
|
$ |
7,917 |
|
|
$ |
3,852 |
|
|
Earnings per share: |
|
|
|
|
|
|
|
|
|
Basic |
|
$ |
0.22 |
|
|
$ |
0.10 |
|
|
Diluted |
|
$ |
0.22 |
|
|
$ |
0.10 |
|
|
Weighted-average number of shares used in calculating
earnings per share: |
|
|
|
|
|
|
|
|
|
Basic |
|
|
36,250 |
|
|
|
36,790 |
|
|
Diluted |
|
|
36,711 |
|
|
|
37,071 |
|
5
Benchmark Electronics, Inc. and Subsidiaries
Condensed Consolidated Balance Sheets
(UNAUDITED)
(in thousands)
|
|
|
March 31, |
|
|
December 31, |
|
|
|
|
2021 |
|
|
2020 |
|
|
Assets |
|
|
|
|
|
|
|
|
|
Current assets: |
|
|
|
|
|
|
|
|
|
Cash and cash equivalents |
|
$ |
400,428 |
|
|
$ |
390,808 |
|
|
Restricted cash |
|
|
— |
|
|
|
5,182 |
|
|
Accounts receivable, net |
|
|
276,287 |
|
|
|
309,331 |
|
|
Contract assets |
|
|
148,205 |
|
|
|
142,779 |
|
|
Inventories |
|
|
355,164 |
|
|
|
327,377 |
|
|
Other current assets |
|
|
33,356 |
|
|
|
26,874 |
|
|
Total current assets |
|
|
1,213,440 |
|
|
|
1,202,351 |
|
|
Property, plant and equipment, net |
|
|
183,294 |
|
|
|
185,272 |
|
|
Operating lease right-of-use assets |
|
|
88,915 |
|
|
|
79,966 |
|
|
Goodwill and other, net |
|
|
275,104 |
|
|
|
276,646 |
|
|
Total assets |
|
$ |
1,760,753 |
|
|
$ |
1,744,235 |
|
|
|
|
|
|
|
|
|
|
|
|
Liabilities and Shareholders’ Equity |
|
|
|
|
|
|
|
|
|
Current liabilities: |
|
|
|
|
|
|
|
|
|
Current installments of long-term debt and finance lease obligations |
|
$ |
9,209 |
|
|
$ |
9,161 |
|
|
Accounts payable |
|
|
325,226 |
|
|
|
282,208 |
|
|
Advance payments from customers |
|
|
76,833 |
|
|
|
84,122 |
|
|
Accrued liabilities |
|
|
93,842 |
|
|
|
105,645 |
|
|
Total current liabilities |
|
|
505,110 |
|
|
|
481,136 |
|
|
Long-term debt and finance lease obligations, less current installments |
|
|
128,862 |
|
|
|
131,051 |
|
|
Operating lease liabilities |
|
|
79,659 |
|
|
|
72,120 |
|
|
Other long-term liabilities |
|
|
69,575 |
|
|
|
70,340 |
|
|
Shareholders’ equity |
|
|
977,547 |
|
|
|
989,588 |
|
|
Total liabilities and shareholders’ equity |
|
$ |
1,760,753 |
|
|
$ |
1,744,235 |
|
6
Benchmark Electronics, Inc. and Subsidiaries
Condensed Consolidated Statement of Cash Flows
(in thousands)
(UNAUDITED)
|
|
|
Three Months Ended |
|
|
|
|
March 31, |
|
|
|
|
2021 |
|
|
2020 |
|
|
Cash flows from operating activities: |
|
|
|
|
|
|
|
|
|
Net income |
|
$ |
7,917 |
|
|
$ |
3,852 |
|
|
Depreciation and amortization |
|
|
11,055 |
|
|
|
12,192 |
|
|
Stock-based compensation expense |
|
|
2,850 |
|
|
|
2,739 |
|
|
Accounts receivable, net |
|
|
32,561 |
|
|
|
6,414 |
|
|
Contract assets |
|
|
(5,426 |
) |
|
|
1,099 |
|
|
Inventories |
|
|
(28,700 |
) |
|
|
(23,769 |
) |
|
Accounts payable |
|
|
42,439 |
|
|
|
14,882 |
|
|
Advance payments from customers |
|
|
(7,289 |
) |
|
|
1,785 |
|
|
Other changes in working capital and other, net |
|
|
(18,794 |
) |
|
|
(22,303 |
) |
|
Net cash provided by (used in) operations |
|
|
36,613 |
|
|
|
(3,109 |
) |
|
|
|
|
|
|
|
|
|
|
|
Cash flows from investing activities: |
|
|
|
|
|
|
|
|
|
Additions to property, plant and equipment and software |
|
|
(6,422 |
) |
|
|
(12,896 |
) |
|
Other investing activities, net |
|
|
13 |
|
|
|
1,405 |
|
|
Net cash used in investing activities |
|
|
(6,409 |
) |
|
|
(11,491 |
) |
|
|
|
|
|
|
|
|
|
|
|
Cash flows from financing activities: |
|
|
|
|
|
|
|
|
|
Share repurchases |
|
|
(13,052 |
) |
|
|
(19,329 |
) |
|
Net debt activity |
|
|
(2,255 |
) |
|
|
92,813 |
|
|
Other financing activities, net |
|
|
(8,453 |
) |
|
|
(6,946 |
) |
|
Net cash provided by (used in) financing activities |
|
|
(23,760 |
) |
|
|
66,538 |
|
|
|
|
|
|
|
|
|
|
|
|
Effect of exchange rate changes |
|
|
(2,006 |
) |
|
|
(4,108 |
) |
|
Net increase in cash and cash equivalents and restricted cash |
|
|
4,438 |
|
|
|
47,830 |
|
|
Cash and cash equivalents and restricted cash at beginning of year |
|
|
395,990 |
|
|
|
363,956 |
|
|
Cash and cash equivalents and restricted cash at end of year |
|
$ |
400,428 |
|
|
$ |
411,786 |
|
7
Benchmark Electronics, Inc. and Subsidiaries
Reconciliation of GAAP to Non-GAAP Financial Results
(Amounts in Thousands, Except Per Share Data)
(UNAUDITED)
|
|
|
Three Months Ended |
|
|
|
|
March 31, |
|
|
December 31, |
|
|
March 31, |
|
|
|
|
2021 |
|
|
2020 |
|
|
2020 |
|
|
Income from operations (GAAP) |
|
$ |
11,934 |
|
|
$ |
11,857 |
|
|
$ |
6,490 |
|
|
Restructuring charges and other costs |
|
|
1,591 |
|
|
|
4,490 |
|
|
|
1,908 |
|
|
Ransomware incident related costs (recovery), net |
|
|
(3,444 |
) |
|
|
(45 |
) |
|
|
— |
|
|
Impairment |
|
|
— |
|
|
|
— |
|
|
|
1,007 |
|
|
Customer insolvency (recovery) |
|
|
(32 |
) |
|
|
(553 |
) |
|
|
— |
|
|
Amortization of intangible assets |
|
|
1,598 |
|
|
|
1,979 |
|
|
|
2,381 |
|
|
Non-GAAP income from operations |
|
$ |
11,647 |
|
|
$ |
17,728 |
|
|
$ |
11,786 |
|
|
|
|
|
|
|
|
|
|
|
|
|
|
|
|
Gross Profit (GAAP) |
|
$ |
42,227 |
|
|
$ |
50,661 |
|
|
$ |
43,361 |
|
|
Customer insolvency (recovery) |
|
|
(32 |
) |
|
|
(553 |
) |
|
|
— |
|
|
Non-GAAP gross profit |
|
$ |
42,195 |
|
|
$ |
50,108 |
|
|
$ |
43,361 |
|
|
|
|
|
|
|
|
|
|
|
|
|
|
|
|
Net income (GAAP) |
|
$ |
7,917 |
|
|
$ |
7,695 |
|
|
$ |
3,852 |
|
|
Restructuring charges and other costs |
|
|
1,591 |
|
|
|
4,490 |
|
|
|
1,908 |
|
|
Ransomware incident related costs (recovery), net |
|
|
(3,444 |
) |
|
|
(45 |
) |
|
|
— |
|
|
Customer insolvency (recovery) |
|
|
(32 |
) |
|
|
(553 |
) |
|
|
— |
|
|
Amortization of intangible assets |
|
|
1,598 |
|
|
|
1,979 |
|
|
|
2,381 |
|
|
Impairment |
|
|
— |
|
|
|
— |
|
|
|
1,007 |
|
|
Income tax adjustments(1) |
|
|
169 |
|
|
|
(1,006 |
) |
|
|
(1,078 |
) |
|
Non-GAAP net income |
|
$ |
7,799 |
|
|
$ |
12,560 |
|
|
$ |
8,070 |
|
|
|
|
|
|
|
|
|
|
|
|
|
|
|
|
Diluted earnings per share: |
|
|
|
|
|
|
|
|
|
|
|
|
|
Diluted (GAAP) |
|
$ |
0.22 |
|
|
$ |
0.21 |
|
|
$ |
0.10 |
|
|
Diluted (Non-GAAP) |
|
$ |
0.21 |
|
|
$ |
0.34 |
|
|
$ |
0.22 |
|
|
|
|
|
|
|
|
|
|
|
|
|
|
|
|
Weighted-average number of shares used in |
|
|
|
|
|
|
|
|
|
|
|
|
|
calculating diluted earnings per share: |
|
|
|
|
|
|
|
|
|
|
|
|
|
Diluted (GAAP) |
|
|
36,711 |
|
|
|
36,596 |
|
|
|
37,071 |
|
|
Diluted (Non-GAAP) |
|
|
36,711 |
|
|
|
36,596 |
|
|
|
37,071 |
|
|
|
|
|
|
|
|
|
|
|
|
|
|
|
|
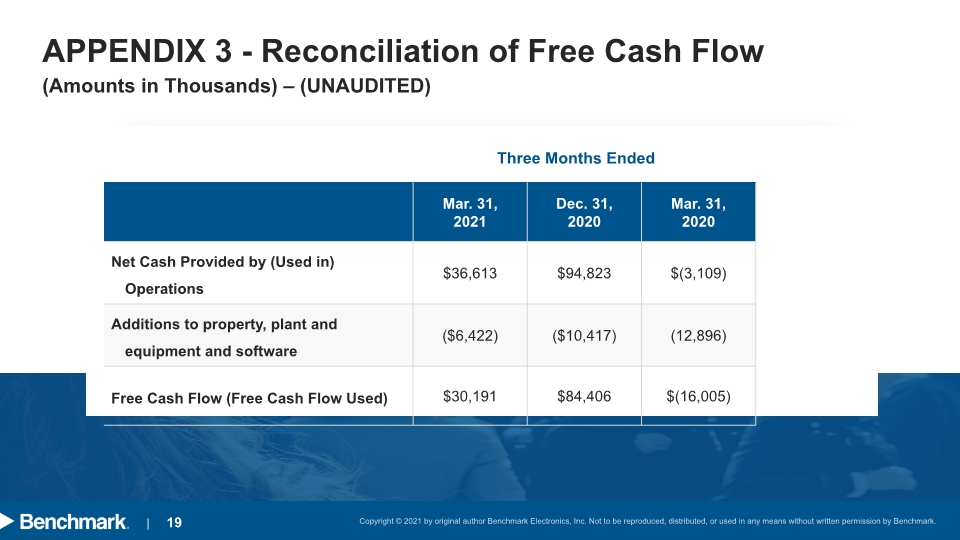
Net cash provided by (used in) operations |
|
$ |
36,613 |
|
|
$ |
94,823 |
|
|
$ |
(3,109 |
) |
|
Additions to property, plant and equipment and software |
|
|
(6,422 |
) |
|
|
(10,417 |
) |
|
|
(12,896 |
) |
|
Free cash flow (free cash flow used) |
|
$ |
30,191 |
|
|
$ |
84,406 |
|
|
$ |
(16,005 |
) |
|
(1) |
This amount represents the tax impact of the non-GAAP adjustments using the applicable effective tax rates. |
8
Benchmark Electronics
Q1-21 Earnings Results April 28, 2021
Forward-Looking Statements This document contains forward-looking statements within the meaning of Section 27A of the Securities Act of 1933, as amended and Section 21E of the Securities Exchange Act of 1934, as amended (Exchange Act). These forward-looking statements are identified as any statement that does not relate strictly to historical or current facts and may include words such as “anticipate,” “believe,” “intend,” “plan,” “project,” “forecast,” “strategy,” “position,” “continue,” “estimate,” “expect,” “may,” “will,” “could,” “predict,” and similar expressions or the negative or other variations thereof. In particular, statements, express or implied, concerning future operating results, our ability to generate sales, income or cash flow, the anticipated impact of the COVID-19 pandemic, the outlook and guidance for second quarter 2021 results, our anticipated plans and responses to the COVID-19 pandemic, our expected revenue mix, our business strategy and strategic initiatives, our repurchases of shares of our common stock and our intentions concerning the payment of dividends, among others, are forward-looking statements. Although we believe these statements are based upon reasonable assumptions, they involve risks, uncertainties and assumptions that are beyond our ability to control or predict, relating to operations, markets and the business environment generally, including those discussed under Part I, Item 1A of the company's Annual Report on Form 10-K for the year ended December 31, 2020 and in any of our subsequent reports filed with the Securities and Exchange Commission (SEC). In particular, these statements also depend on the duration, severity and evolution of the COVID-19 pandemic and related risks, including government and other third-party responses to it and the consequences for the global economy, our business and the businesses of our suppliers and customers, as well as our ability (or inability) to execute on our plans to respond to the COVID-19 pandemic. Should one or more of these risks or uncertainties materialize, or should underlying assumptions prove incorrect, actual outcomes, including the future results of our operations, may vary materially from those indicated. Undue reliance should not be placed on any forward-looking statements. Forward-looking statements are not guarantees of performance. All forward-looking statements included in this document are based upon information available to us as of the date of this document, and we assume no obligation to update.
Non-GAAP Financial Information This document includes certain financial measures that exclude items and therefore are not in accordance with U.S. generally accepted accounting principles (“GAAP”). A detailed reconciliation between GAAP results and results excluding special items (“non-GAAP”) is included in the Appendix of this document. In situations where a non-GAAP reconciliation has not been provided, the company was unable to provide such a reconciliation without unreasonable effort due to the uncertainty and inherent difficulty predicting the occurrence, the financial impact and the periods in which the non-GAAP adjustments may be recognized. Management discloses non‐GAAP information to provide investors with additional information to analyze the Company’s performance and underlying trends. Management uses non‐GAAP measures that exclude certain items in order to better assess operating performance and help investors compare results with our previous guidance. This document also references “free cash flow”, which the Company defines as cash flow from operations less additions to property, plant and equipment and purchased software. The Company’s non‐GAAP information is not necessarily comparable to the non‐GAAP information used by other companies. Non‐GAAP information should not be viewed as a substitute for, or superior to, net income or other data prepared in accordance with GAAP as a measure of the Company’s profitability or liquidity. Readers should consider the types of events and transactions for which adjustments have been made.
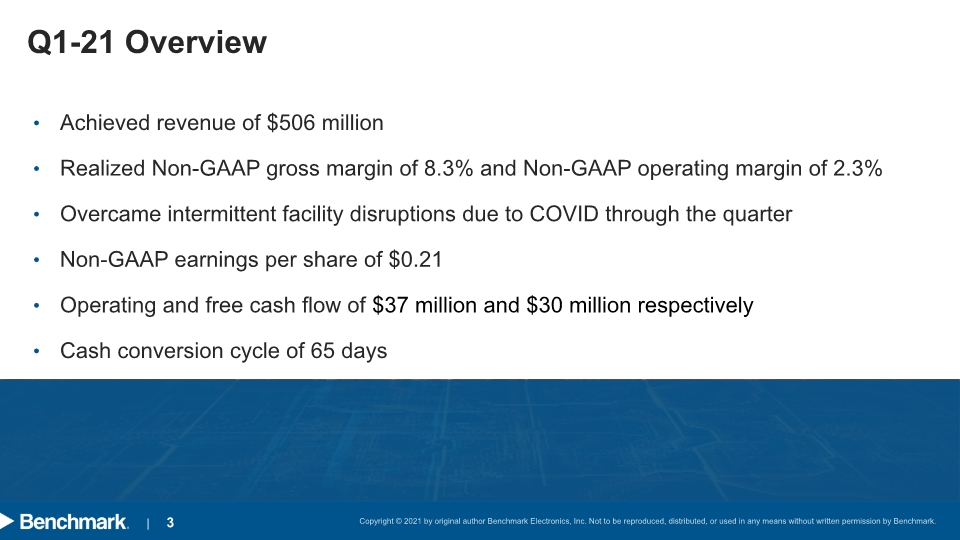
Q1-21 Overview Achieved revenue of $506 million
Realized Non-GAAP gross margin of 8.3% and Non-GAAP operating margin of 2.3%
Overcame intermittent facility disruptions due to COVID through the quarter
Non-GAAP earnings per share of $0.21
Operating and free cash flow of $37 million and $30 million respectively
Cash conversion cycle of 65 days
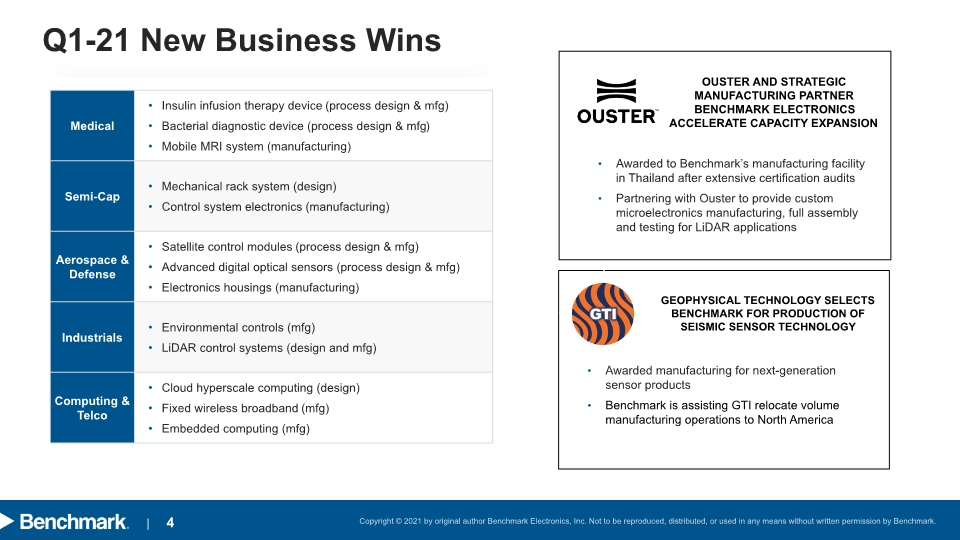
Q1-21 New Business Wins Awarded to Benchmark’s manufacturing facility in Thailand after extensive certification audits
Partnering with Ouster to provide custom microelectronics manufacturing, full assembly and testing for LiDAR applications Awarded manufacturing for next-generation sensor products
Benchmark is assisting GTI relocate volume manufacturing operations to North America Ouster and strategic manufacturing partner Benchmark Electronics accelerate capacity expansion GEOPHYSICAL TECHNOLOGY SELECTS benchmark FOR PRODUCTION OF SEISMIC SENSOR TECHNOLOGY
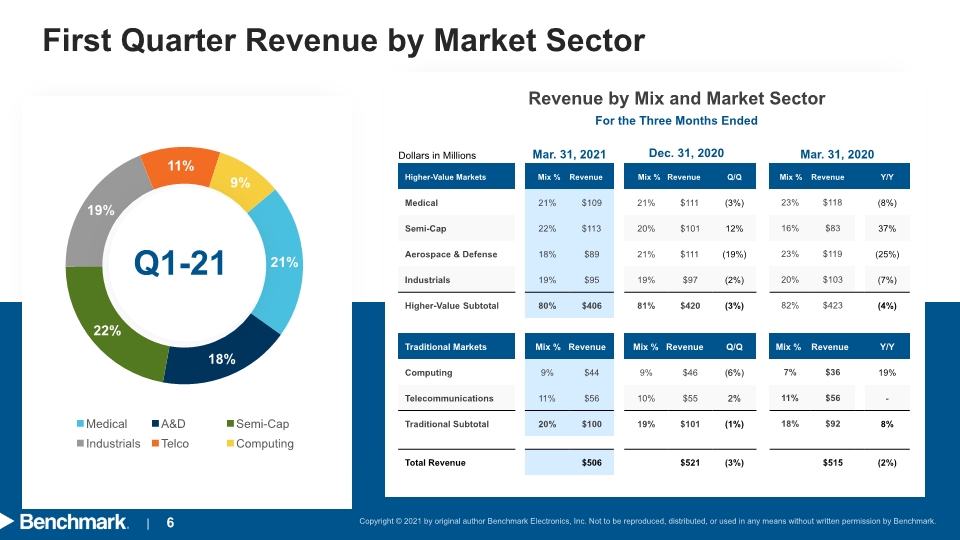
First Quarter Revenue by Market Sector Q1-21 Mar. 31, 2021 Revenue by Mix and Market Sector Dec. 31, 2020 Mar. 31, 2020 For the Three Months Ended Dollars in Millions
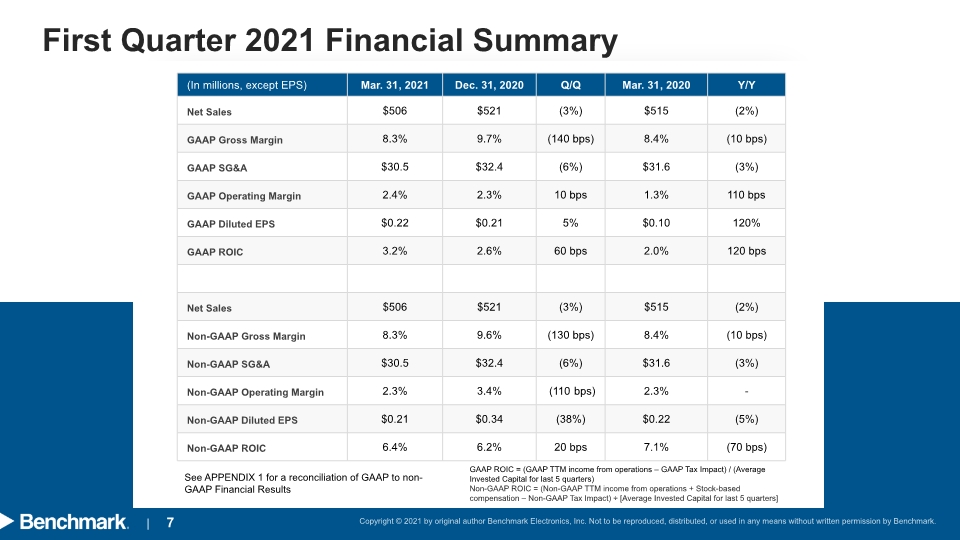
First Quarter 2021 Financial Summary See APPENDIX 1 for a reconciliation of GAAP to non-GAAP Financial Results GAAP ROIC = (GAAP TTM income from operations – GAAP Tax Impact) / (Average Invested Capital for last 5 quarters)
Non-GAAP ROIC = (Non-GAAP TTM income from operations + Stock-based compensation – Non-GAAP Tax Impact) ÷ [Average Invested Capital for last 5 quarters]
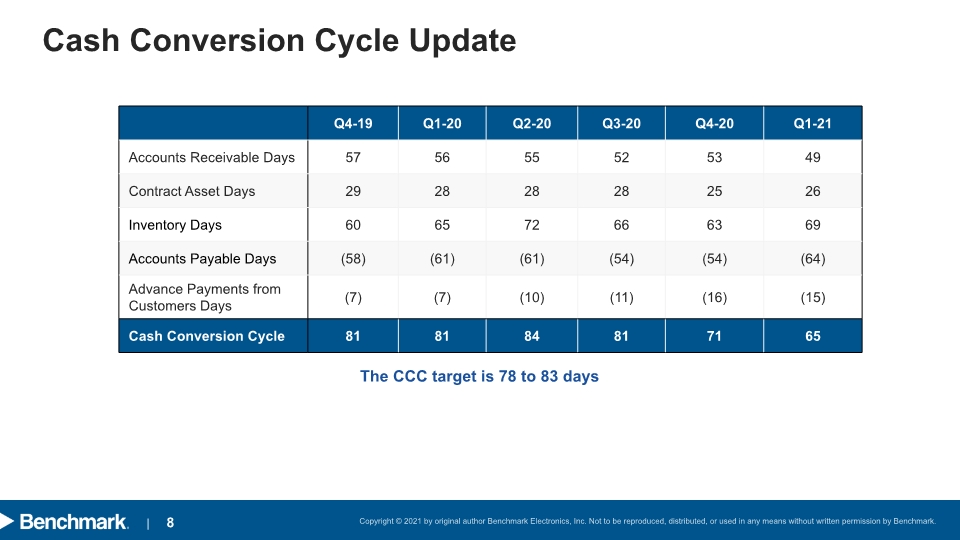
Cash Conversion Cycle Update The CCC target is 78 to 83 days
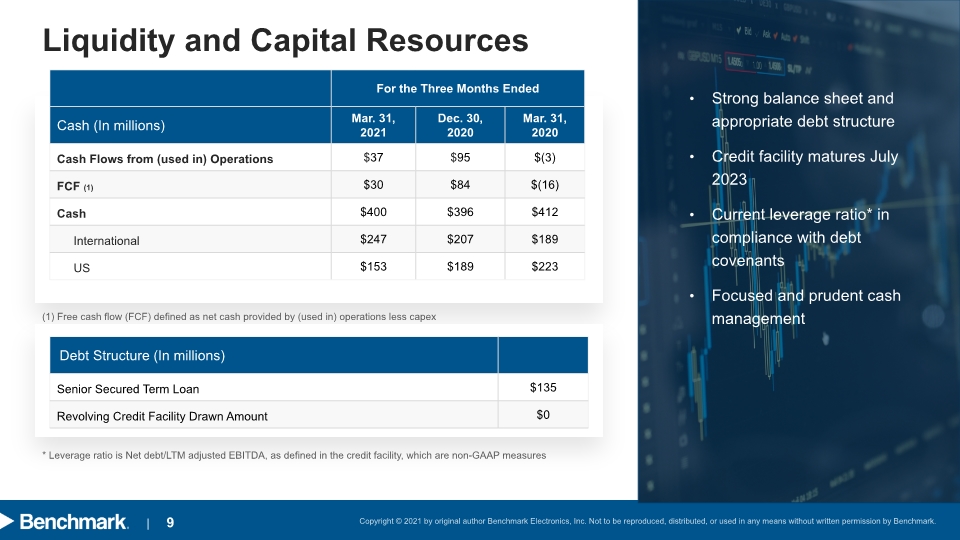
Liquidity and Capital Resources (1) Free cash flow (FCF) defined as net cash provided by (used in) operations less capex * Leverage ratio is Net debt/LTM adjusted EBITDA, as defined in the credit facility, which are non-GAAP measures Strong balance sheet and appropriate debt structure
Credit facility matures July 2023
Current leverage ratio* in compliance with debt covenants
Focused and prudent cash management
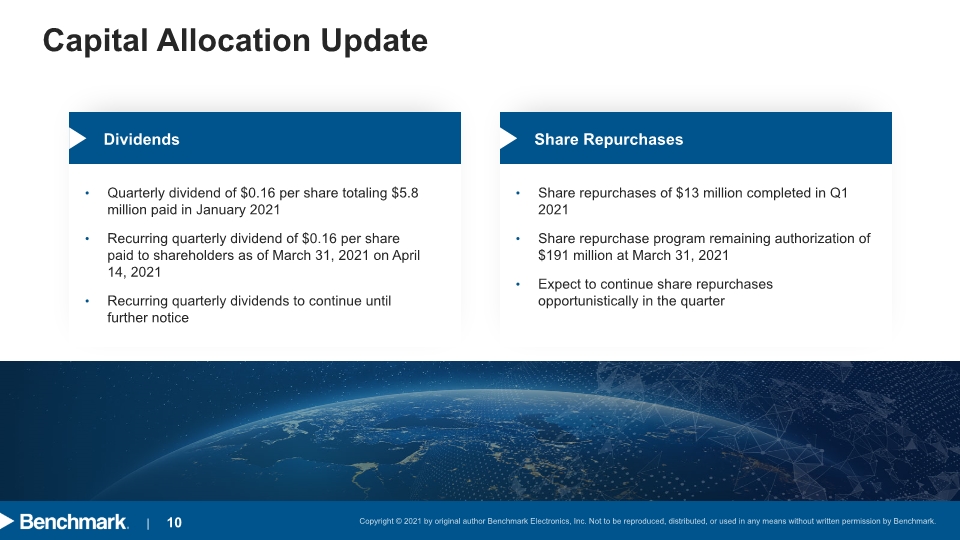
Capital Allocation Update Dividends Quarterly dividend of $0.16 per share totaling $5.8 million paid in January 2021
Recurring quarterly dividend of $0.16 per share paid to shareholders as of March 31, 2021 on April 14, 2021
Recurring quarterly dividends to continue until further notice Share Repurchases Share repurchases of $13 million completed in Q1 2021
Share repurchase program remaining authorization of $191 million at March 31, 2021
Expect to continue share repurchases opportunistically in the quarter
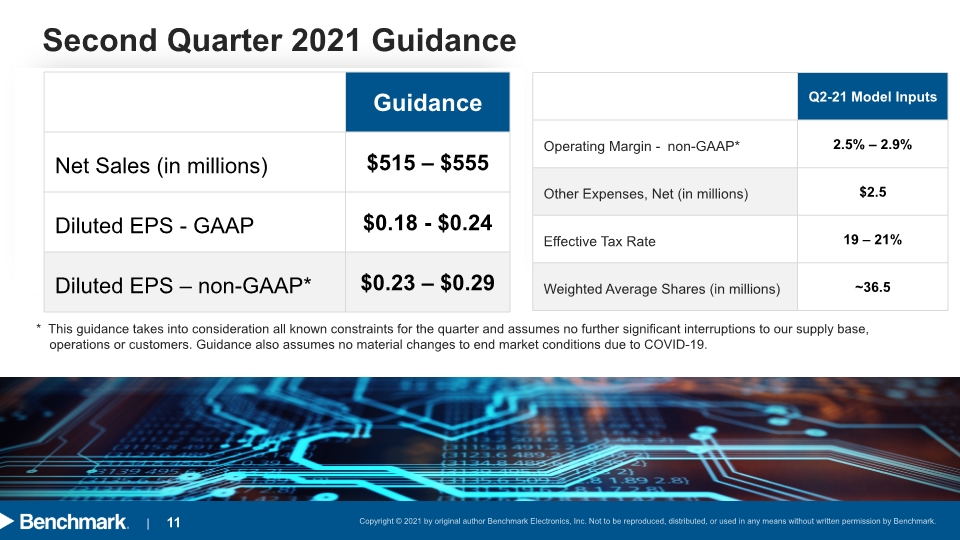
Second Quarter 2021 Guidance * This guidance takes into consideration all known constraints for the quarter and assumes no further significant interruptions to our supply base, operations or customers. Guidance also assumes no material changes to end market conditions due to COVID-19.
2021 Revenue Trends and Key Initiatives Jeff Benck - CEO
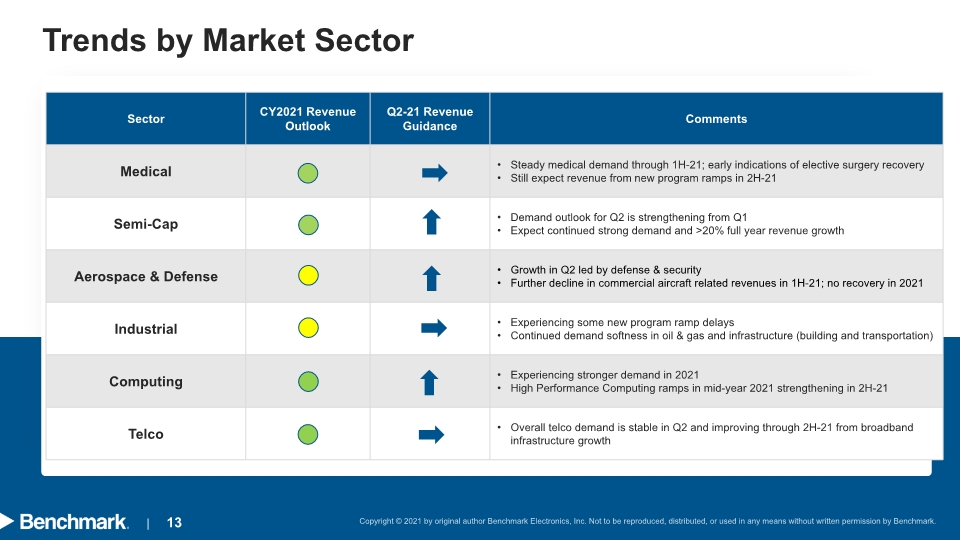
Trends by Market Sector
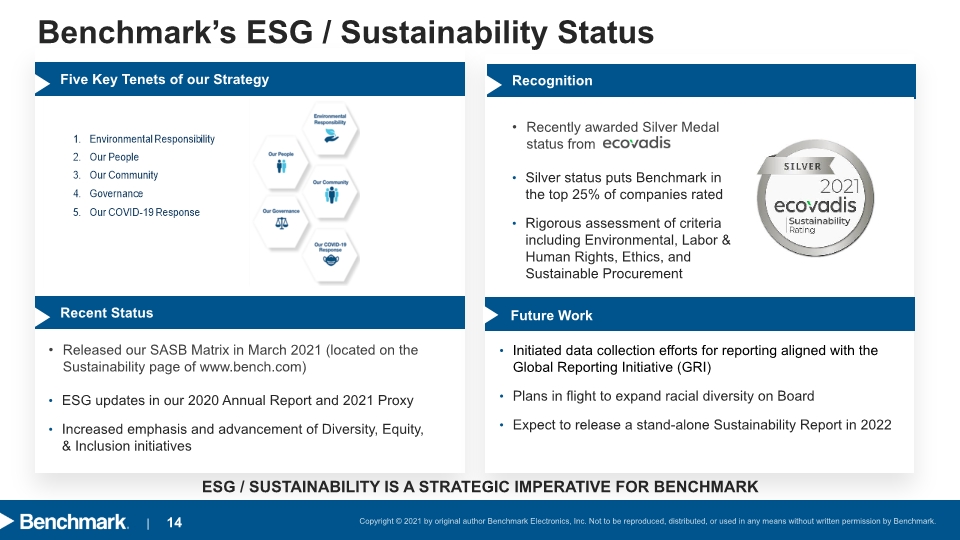
Benchmark’s ESG / Sustainability Status Released our SASB Matrix in March 2021 (located on the Sustainability page of www.bench.com)
ESG updates in our 2020 Annual Report and 2021 Proxy
Increased emphasis and advancement of Diversity, Equity, & Inclusion initiatives ESG / SUSTAINABILITY IS A STRATEGIC IMPERATIVE FOR BENCHMARK Five Key Tenets of our Strategy Recent Status Next Steps Initiated data collection efforts for reporting aligned with the Global Reporting Initiative (GRI)
Plans in flight to expand racial diversity on Board
Expect to release a stand-alone Sustainability Report in 2022 Recognition Recently awarded Silver Medal status from
Silver status puts Benchmark in the top 25% of companies rated
Rigorous assessment of criteria including Environmental, Labor & Human Rights, Ethics, and Sustainable Procurement Future Work
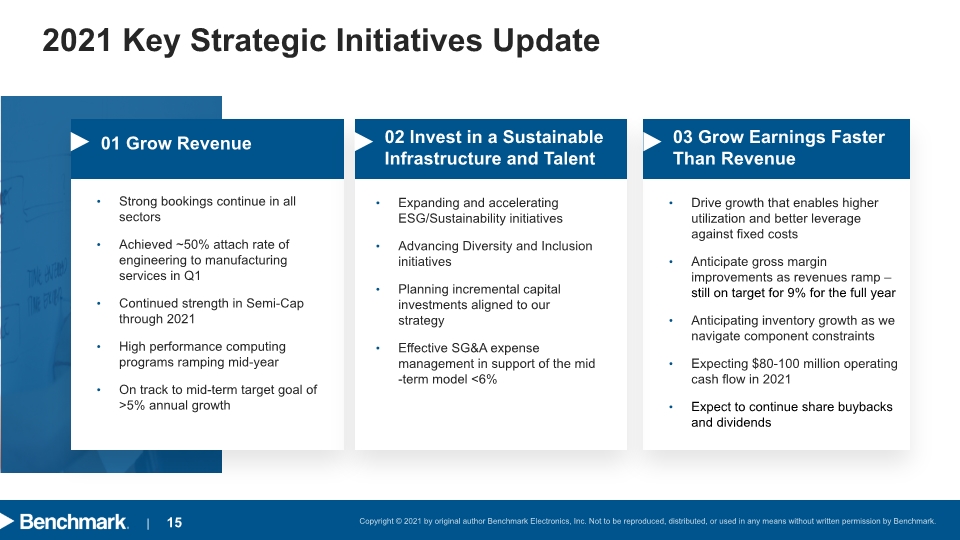
2021 Key Strategic Initiatives Update
Appendix

(Amounts in Thousands, Except Per Share Data) – (UNAUDITED) APPENDIX 1 - Reconciliation of GAAP to non-GAAP Financial Results
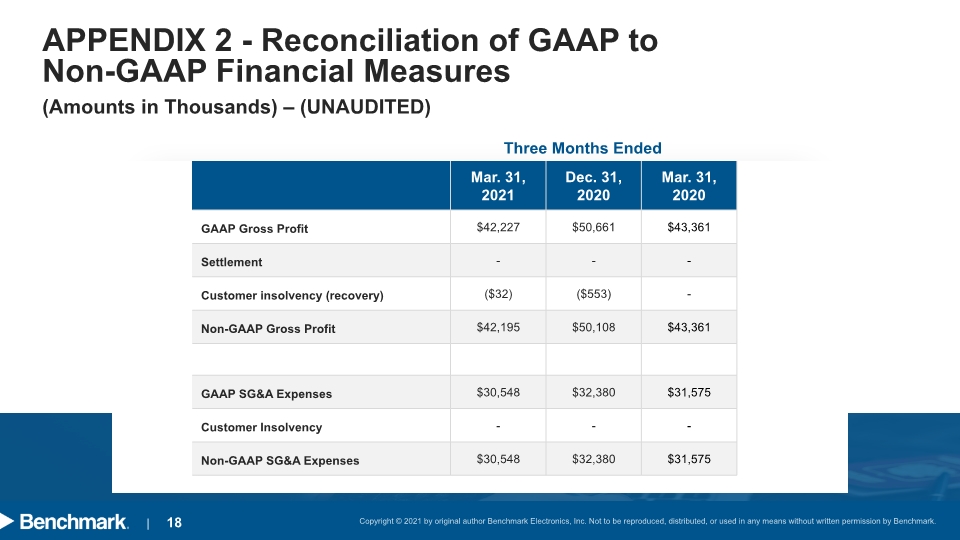
(Amounts in Thousands) – (UNAUDITED) APPENDIX 2 - Reconciliation of GAAP to Non-GAAP Financial Measures Three Months Ended
(Amounts in Thousands) – (UNAUDITED)
APPENDIX 3 - Reconciliation of Free Cash Flow Three Months Ended