Document
false0001332349Brookdale Senior Living Inc. 0001332349 2020-02-18 2020-02-18


UNITED STATES
SECURITIES AND EXCHANGE COMMISSION
Washington, D.C. 20549
 
 
FORM
8-K
 
 
CURRENT REPORT
Pursuant to Section 13 OR 15(d) of the Securities Exchange Act of 1934
 
 
Date of Report (Date of earliest event reported)
February 18, 2020
(February 18, 2020)
Brookdale Senior Living Inc.
(Exact name of registrant as specified in its charter)

Delaware
001-32641
20-3068069
(State or other jurisdiction of incorporation)
(Commission File Number)
(IRS Employer Identification No.)
111 Westwood Place,
Suite 400,
Brentwood,
Tennessee
37027
(Address of principal executive offices)
(Zip Code)

Registrant's telephone number, including area code
 
(615)
221-2250
 
 
(Former name or former address, if changed since last report.)
 
Check the appropriate box below if the Form 8-K filing is intended to simultaneously satisfy the filing obligation of the registrant under any of the following provisions (see General Instruction A.2. below):
 
Written communications pursuant to Rule 425 under the Securities Act (17 CFR 230.425)
 
 
Soliciting material pursuant to Rule 14a-12 under the Exchange Act (17 CFR 240.14a-12)
 
 
Pre-commencement communications pursuant to Rule 14d-2(b) under the Exchange Act (17 CFR 240.14d-2(b))
 
 
Pre-commencement communications pursuant to Rule 13e-4(c) under the Exchange Act (17 CFR 240.13e-4(c))

Securities registered pursuant to Section 12(b) of the Act:
Title of each class
Trading Symbol(s)
Name of each exchange on which registered
Common Stock, $0.01 Par Value Per Share
BKD
New York Stock Exchange

Indicate by check mark whether the registrant is an emerging growth company as defined in Rule 405 of the Securities Act of 1933 (§230.405 of this chapter) or Rule 12b-2 of the Securities Exchange Act of 1934 (§240.12b-2 of this chapter).

Emerging growth company

If an emerging growth company, indicate by check mark if the registrant has elected not to use the extended transition period for complying with any new or revised financial accounting standards provided pursuant to Section 13(a) of the Exchange Act. ☐


Section 2 - Financial Information

Item 2.02     Results of Operations and Financial Condition.

On February 18, 2020, Brookdale Senior Living Inc. (the "Company") issued a press release announcing its fourth quarter and full year 2019 financial results and announcing a conference call to review these results. A copy of the press release is furnished herewith as Exhibit 99.1.

Supplemental information related to the Company's fourth quarter and full year 2019 results is furnished herewith as Exhibit 99.2.

The information furnished pursuant to this Current Report on Form 8-K (including the exhibits hereto) shall not be considered "filed" for purposes of Section 18 of the Securities Exchange Act of 1934, as amended, or otherwise subject to the liabilities of that section, nor shall it be incorporated by reference into any filing by the Company under the Securities Act of 1933, as amended, or under the Securities Exchange Act of 1934, as amended, unless the Company expressly sets forth by specific reference in such filing that such information is to be considered "filed" or incorporated by reference therein.

Section 7 - Regulation FD

Item 7.01     Regulation FD Disclosure.

The information set forth in Item 2.02 of this report is incorporated herein by reference.

Section 9 - Financial Statements and Exhibits

Item 9.01     Financial Statements and Exhibits.

(d)
 
Exhibits


99.1


99.2


104
 
Cover Page interactive Data File (embedded within the Inline XBRL document)


SIGNATURE

Pursuant to the requirements of the Securities Exchange Act of 1934, the registrant has duly caused this report to be signed on its behalf by the undersigned hereunto duly authorized.


BROOKDALE SENIOR LIVING INC.


Date:
February 18, 2020
 
By:
 
/s/ Chad C. White
 
 
Name:
Chad C. White
 
 
Title:
Executive Vice President, General Counsel and Secretary


Exhibit 99.1
logo2a10.jpg

Brookdale Announces Fourth Quarter and Full Year 2019 Results


Nashville, Tenn., Feb 18, 2020 - Brookdale Senior Living Inc. (NYSE: BKD) ("Brookdale" or the "Company") announced results for the quarter and year ended December 31, 2019.

FOURTH QUARTER AND FULL YEAR HIGHLIGHTS

Achieved full year 2019 financial results within or better than original 2019 guidance ranges.
Same community fourth quarter revenue increased 2.1% year-over-year.
Same community fourth quarter weighted average occupancy improved 30 basis points on a sequential basis, better than the industry.
In January 2020, acquired 26 previously leased communities, increasing the size of the Company's owned real estate portfolio.

Lucinda (“Cindy”) Baier, Brookdale’s President and CEO, said, "I am pleased that we delivered financial results within or better than our 2019 guidance ranges. We are making great progress on the strategic plan we introduced in 2018. We achieved our goal of selling assets to generate $250 million of net proceeds. In addition, we recently completed significant transactions with Healthpeak to unlock the value of the unconsolidated CCRC venture. With another quarter of positive leading indicators and industry leading sequential occupancy growth, we are building momentum and are well positioned to achieve our five-year financial goal and create long-term shareholder value."

FULL YEAR RESULTS

The Company reported net loss of $268.5 million and net cash provided by operating activities of $216.4 million for the year ended December 31, 2019. The Company's full year 2019 results compared to the Company's 2019 guidance were:
($ in millions)
 
Full Year 2019 Guidance
Actual 2019 Results
Adjusted EBITDA(1)
 
$400 - $425
$401
Adjusted Free Cash Flow(1)
 
($100) - ($80)
($76)
Non-development capital expenditures
 
Approx. $250
$236
The Company's proportionate share of Adjusted EBITDA of unconsolidated ventures
 
$30 - $40
$43
The Company's proportionate share of Adjusted Free Cash Flow of unconsolidated ventures
 
$10 - $20
$18

(1)
Adjusted EBITDA and Adjusted Free Cash Flow are financial measures that are not calculated in accordance with GAAP. See “Reconciliations of Non-GAAP Financial Measures” for the Company’s definition of such measures, reconciliations to the most comparable GAAP financial measures, and other important information regarding the use of the Company’s non-GAAP financial measures. During the first quarter of 2019, the Company modified its definition of Adjusted EBITDA to exclude transaction and organizational restructuring costs and its definition of Adjusted Free Cash Flow to no longer adjust net cash provided by (used in) operating activities for changes in working capital items other than changes in prepaid insurance premiums financed with notes payable and lease liability for lease termination and modification. Amounts for all periods herein reflect application of the modified definitions.

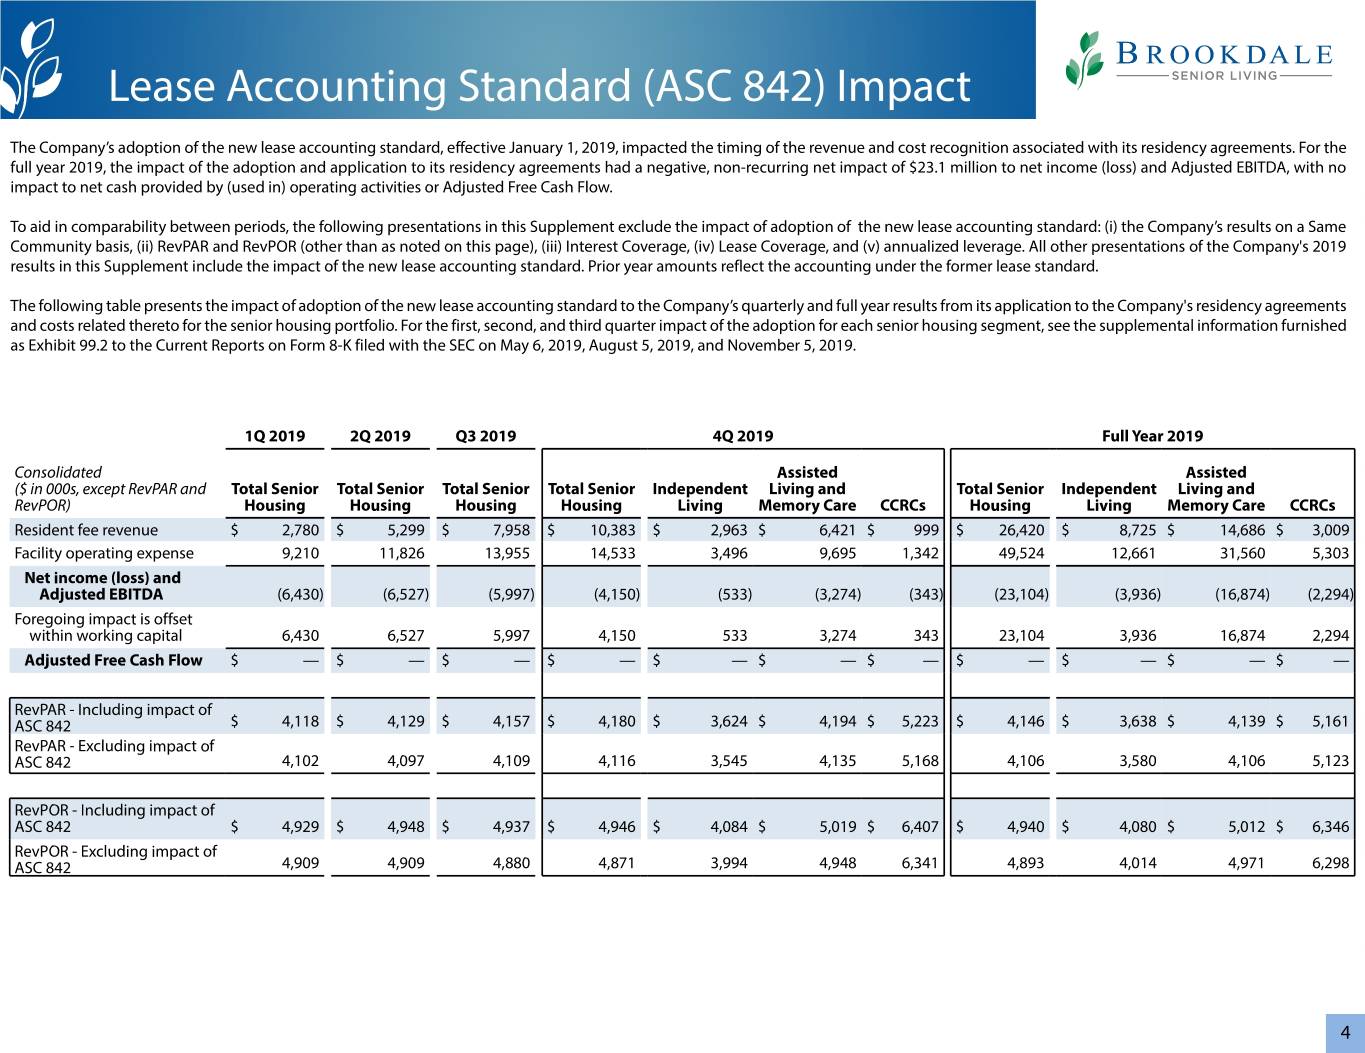
The Company adopted the new lease accounting standard (ASC 842) effective January 1, 2019. Adoption of the new lease standard and its application to residency agreements and costs related thereto resulted in the recognition of additional resident fees and facility operating expense for the full year 2019, which were non-cash and non-recurring in future years. The result was a non-cash net impact to net loss and Adjusted EBITDA of negative $23.1 million, with no impact to the 2019 amounts of net cash provided by operating activities and Adjusted Free Cash Flow.


Page 1


SUMMARY OF FOURTH QUARTER RESULTS

Same Community Senior Housing (Independent Living (IL), Assisted Living and Memory Care (AL/MC), and CCRCs)

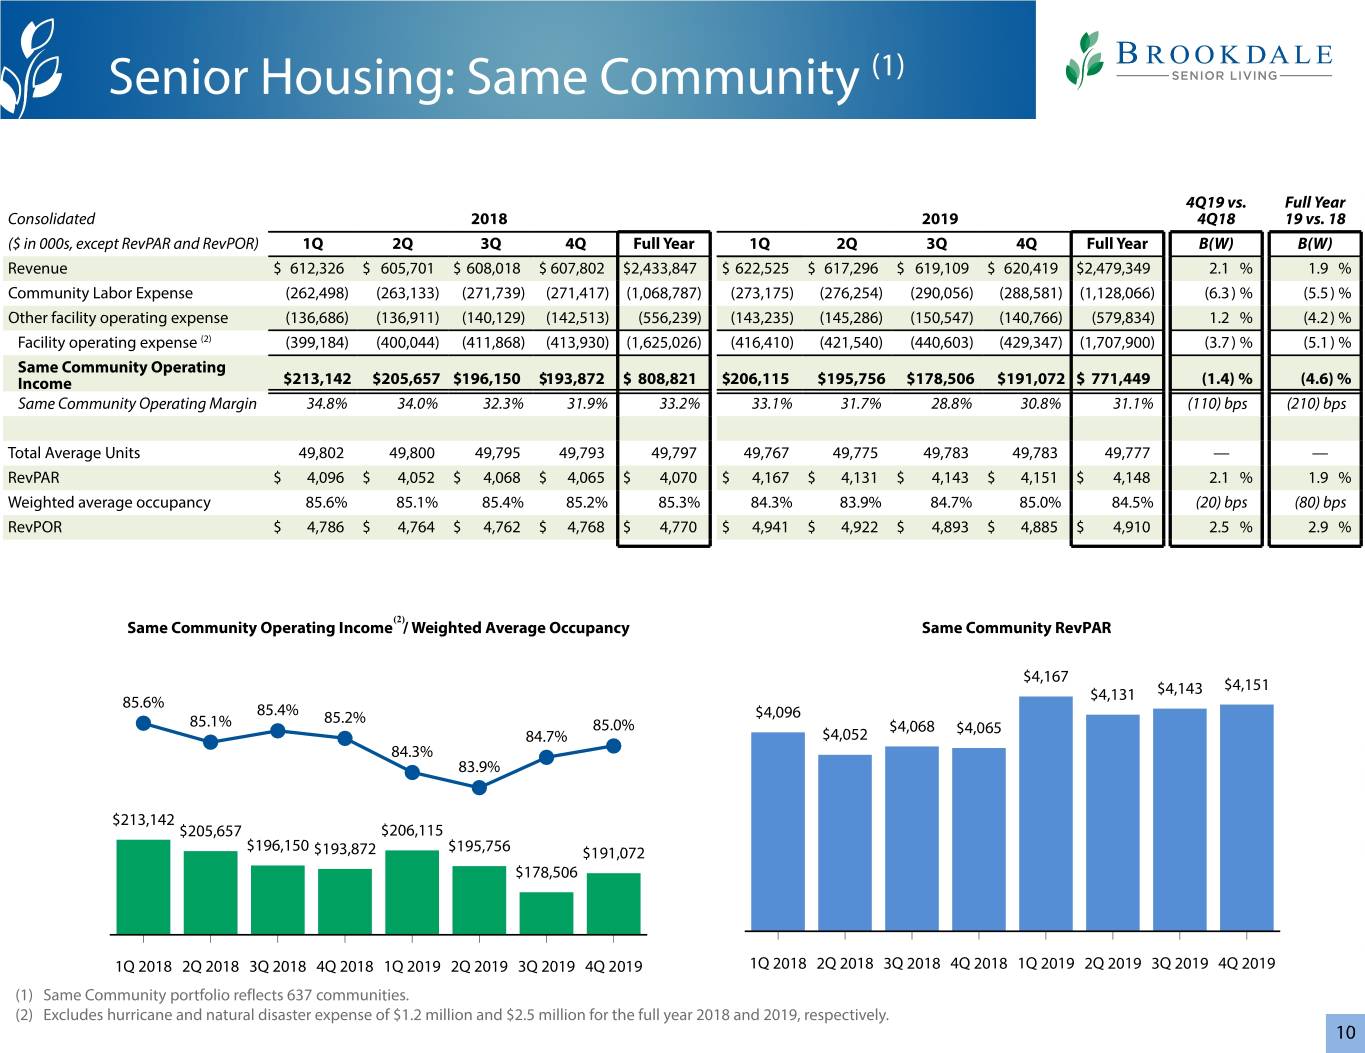
The table below presents a summary of same community operating results and metrics of the Company's consolidated senior housing portfolio and excludes the impact of transactions and the new lease accounting standard.(2) 
($ in millions, except RevPAR and RevPOR)
 
Year-Over-Year
Increase / (Decrease)
 
Sequential
Increase / (Decrease)
4Q 2019
4Q 2018
Amount
Percent
3Q 2019
Amount
Percent
Resident fees
$
620.4

$
607.8

$
12.6

2.1%
$
619.1

$
1.3

0.2%
Facility operating expense
$
429.3

$
413.9

$
15.4

3.7%
$
440.6

$
(11.3
)
(2.6)%
RevPAR
$
4,151

$
4,065

$
86

2.1%
$
4,143

$
8

0.2%
Weighted average occupancy
85.0
%
85.2
%
(20
) bps
n/a
84.7
%
30
 bps
n/a
RevPOR
$
4,885

$
4,768

$
117

2.5%
$
4,893

$
(8
)
(0.2)%


(2)  
The same community portfolio includes 637 communities utilizing the Company's methodology for determining same store communities which generally excludes assets held for sale, communities acquired or disposed since the beginning of the prior year, and certain communities that have undergone or are undergoing expansion, redevelopment, and repositioning projects. Operating results and data presented on a same community basis reflect results and data of the same store communities and, for the 2019 periods, exclude the additional resident fee revenue and facility operating expense recognized as a result of application of the new lease accounting standard under ASC 842 of approximately $7.2 million and $12.7 million, respectively, for the third quarter and approximately $9.5 million and $13.4 million, respectively, for the fourth quarter.

Resident fees:
The year-over-year increase was primarily attributable to the increase in RevPAR, comprised of the increase in RevPOR, primarily the result of in-place rent increases compared to the prior year quarter, partially offset by the 20 basis point decrease in same community weighted average occupancy.
Weighted average occupancy improved 30 basis points on a sequential basis, 10 basis points better than the industry.

Facility operating expense: The year-over-year increase was primarily due to a 6.3% increase in labor expense arising from increases in wage rates and in employee benefits expense.

Consolidated

The table below presents a summary of consolidated operating results.
 
 
Year-Over-Year
Increase / (Decrease)
 
Change Attributable To:
($ in millions)
4Q 2019
4Q 2018
Amount
Percent
 
Transactions
New Lease Standard
Resident fee and management fee revenue
$
809.7

$
824.5

$
(14.8
)
(1.8
)%
 
$
(41.2
)
$
10.4

 
Facility operating expense
598.4

586.9

11.5

2.0
 %
 
(27.8
)
14.5

 
Net income (loss)
(91.3
)
131.5

(222.8
)
NM

 
See note (3)

(4.1
)
(3)
Adjusted EBITDA 
100.1

115.2

(15.1
)
(13.1
)%
 
(10.1
)
(4.1
)
 

(3)
The change in net income (loss) attributable to transactions is not presented as certain impacts are not available without unreasonable effort. The change attributable to the new lease standard represents the impact of the timing of the revenue and cost recognition associated with residency agreements related to the adoption of the new lease standard.

Transactions and lease standard impact:
Since October 1, 2018, the Company completed dispositions, through sales and lease terminations, of 66 communities (5,932 units).
The Company transitioned management arrangements on 132 net communities since October 1, 2018, generally for interim management arrangements on formerly leased or owned communities and management arrangements on certain former unconsolidated ventures in which it sold its interest.
Adoption of the new lease standard and its application to residency agreements and costs related thereto resulted in the recognition of additional non-cash resident fees and facility operating expense for the fourth quarter 2019, for a non-cash net impact of negative $4.1 million to net income (loss) and Adjusted EBITDA.
To aid in comparability between periods, presentations in this press release of the Company’s results on a same community basis and RevPAR and RevPOR exclude the impact of the adoption of the new lease accounting standard and its application to the Company's residency agreements and costs related thereto.

Page 2


Resident fee and management fee revenue:
Excluding the impact of transactions and the new lease accounting standard, resident fee and management fee revenue increased 2.1% over the prior year quarter primarily due to a 2.5% increase in same community RevPOR, partially offset by a 20 basis point decrease in same community weighted average occupancy.
Fourth quarter 2019 consolidated RevPAR increased $132, or 3.3%, to $4,116 compared to the fourth quarter of the prior year as a result of an increase in consolidated RevPOR of $150, or 3.2%, to $4,871. Benefits from dispositions, same community in-place rate increases, and an increase in consolidated occupancy of 10 basis points contributed to the increases in consolidated RevPAR and RevPOR.

Facility operating expense: Excluding the impact of transactions and the new lease accounting standard, facility operating expense increased $24.8 million, or 4.5%, primarily due to an increase in community labor expense attributable to planned wage rate increases and an increase in employee benefits expense.

Net income (loss):
The change in net income (loss) compared to the prior year quarter was primarily attributable to the revenue and facility operating expense factors noted above, a $30.0 million decrease in benefit for income taxes, and a $212.1 million decrease in net gain on sale of assets. The prior year period includes a $216.7 million net gain on sale of assets.
General and administrative expense of $49.0 million for the fourth quarter of 2019 represents a $7.3 million, or 13.0%, decrease from the prior year quarter, primarily due to lower compensation and professional fees, offset by a $2.3 million increase in transaction and organizational restructuring costs incurred in the current quarter.

Adjusted EBITDA: The decrease compared to the prior year quarter was primarily attributable to the impact of transactions completed since the beginning of the prior year period and application of the new lease standard effective January 1, 2019.

Health Care Services
 
 
Increase / (Decrease)
($ in millions)
4Q 2019
4Q 2018
Amount
Percent
Resident fee revenue


Home health
$
77.4

$
81.0

$
(3.6
)
(4.4
)%
Hospice
26.1

21.3

4.8

22.5
 %
Outpatient therapy
6.0

6.0


Total resident fee revenue
109.5

108.3

1.2

1.1
 %
Facility operating expense
106.6

102.3

4.3

4.2
 %


Resident fee revenue: Health Care Services revenue improved due to an increase in volume for hospice services, partially offset by a decrease in revenue for home health services primarily attributable to sales force turnover, customer relations issues related to the centralized intake initiative, unfavorable case-mix, and community dispositions.

Facility operating expense: The year-over-year increase in facility operating expense was primarily attributable to an increase in labor costs arising from wage rate increases, the expansion of the Company's hospice services, and an increase in employee benefits expense.

Management Services
 
 
Increase / (Decrease)
($ in millions)
4Q 2019
4Q 2018
Amount
Percent
Management fees
$
12.4

$
17.7

$
(5.3
)
(29.9
)%


Management fees: The year-over-year decrease in management fees was primarily attributable to the transition of management arrangements on 132 net communities since October 1, 2018, generally for interim management arrangements on formerly leased or owned communities and management arrangements on certain former unconsolidated ventures in which the Company sold its interest.


Page 3


LIQUIDITY

The table below presents a summary of the Company’s net cash provided by (used in) operating activities and Adjusted Free Cash Flow.
 
 
Increase / (Decrease)
($ in millions)
4Q 2019
4Q 2018
Amount
Percent
Net cash provided by (used in) operating activities
$
88.1

$
33.5

$
54.6

163.0
%
Adjusted Free Cash Flow 
0.5

(33.0
)
33.5

NM


Net cash provided by (used in) operating activities: The year-over-year increase in net cash provided by operating activities was primarily attributable to $8.0 million of cash paid to terminate community operating leases during the prior year period, an $8.9 million increase in capital expenditure reimbursements from lessors for operating leases during the fourth quarter of 2019, an increase in accounts receivable collections during the fourth quarter of 2019, and higher accrued insurance liabilities during the fourth quarter of 2019.

Adjusted Free Cash Flow:
The increase in Adjusted Free Cash Flow compared to the prior year fourth quarter was attributable to the Adjusted EBITDA factors noted previously, as well as:
A $49.1 million increase in cash provided by operating activities for changes in operating assets and liabilities, including the impacts of an increase in accounts receivable collections and higher accrued insurance liabilities during the fourth quarter of 2019.
The change was offset by a $4.1 million year-over-year increase in non-development capital expenditures, net. Fourth quarter 2019 non-development capital expenditures, net were $55.6 million.

Total Liquidity:
Total liquidity for the Company was $481.3 million as of December 31, 2019, an increase from total liquidity of $455.4 million as of September 30, 2019. The $25.9 million increase was primarily attributable to net cash proceeds from asset sales.
Total liquidity as of December 31, 2019 included $240.2 million of unrestricted cash and cash equivalents, $68.6 million of marketable securities, and $172.5 million of availability on the Company's secured credit facility.

Share Repurchases: In the fourth quarter of 2019, the Company repurchased $5.6 million of shares of common stock in open market transactions pursuant to the repurchase program publicly announced on November 1, 2016 (approximately 0.8 million shares at an average purchase price of $6.99 per share). As of December 31, 2019, approximately $62.1 million remained available under the repurchase program.

TRANSACTION UPDATE

The closings of the various pending and expected transactions described below are, or will be, subject to the satisfaction of various closing conditions, including (where applicable) the receipt of regulatory approvals. However, there can be no assurance that the transactions will close or, if they do, when the actual closings will occur.

Community Dispositions: During the fourth quarter of 2019, the Company completed the sale of six owned communities (914 units) for cash proceeds of $41.3 million, net of transaction costs, and terminated the lease on two communities (52 units). The Company completed its real estate strategy announced in 2018, and has received more than $250 million of net proceeds from the sale of owned communities.

Management Transitions: The Company transitioned management on 23 communities to new operators during the fourth quarter of 2019, most of which were managed under management arrangements on certain former unconsolidated ventures in which the Company sold its interest. Management fees for the fourth quarter of 2019 include approximately $7.5 million of management fees attributable to communities for which the Company’s management agreements were terminated since October 1, 2019 or are expected to terminate in 2020, including management agreements on communities owned by the CCRC venture, management arrangements on certain former unconsolidated ventures in which the Company sold its interest, and interim management arrangements on formerly leased communities.

Leased Community Acquisitions: On January 22, 2020, the Company acquired eight leased communities (336 units) from National Health Investors, Inc. (“NHI”) pursuant to the exercise of a purchase option for a purchase price of $39.3 million. The Company funded the community acquisitions with cash on hand and expects to obtain approximately $28 million of non-recourse mortgage financing on the communities.


Page 4


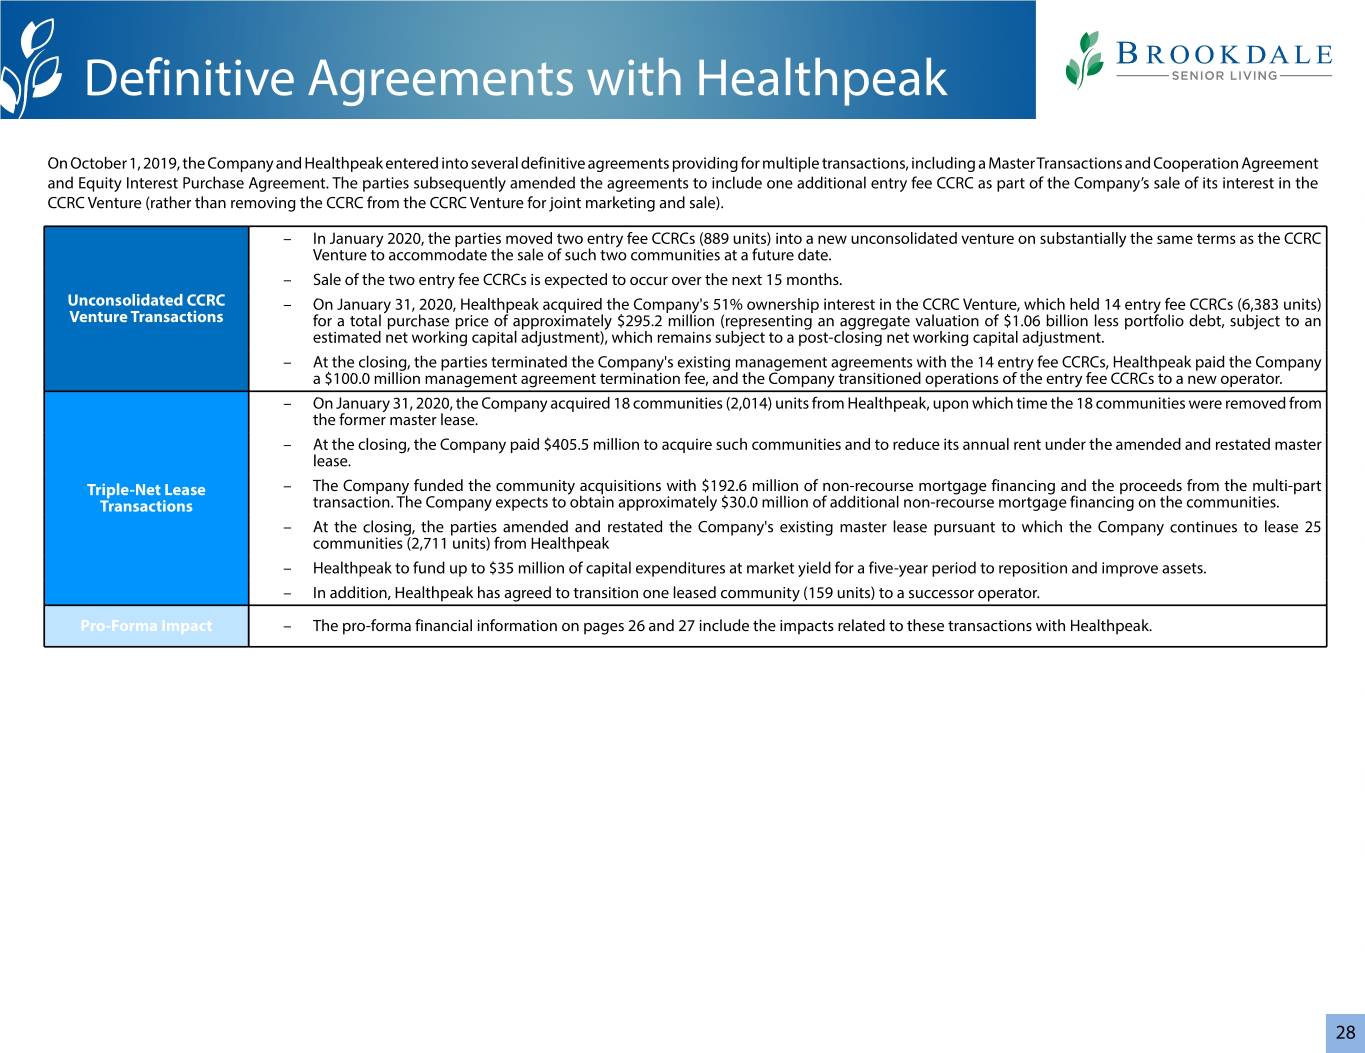
CCRC Venture and Healthpeak Properties Inc. ("Healthpeak") (f/k/a HCP, Inc.) Master Lease Transactions: On January 31, 2020, the Company completed three previously announced transactions with Healthpeak, including: (i) the Company’s sale of its 51% equity interest in 14 unconsolidated entry fee CCRC communities for cash proceeds of $295.2 million, Healthpeak’s payment of a $100.0 million management termination fee to the Company, and transition of operations for the communities to a new operator; (ii) the Company’s acquisition of 18 communities formerly-leased from Healthpeak for a total purchase price of $405.5 million, which the Company financed with $192.6 million of non-recourse mortgage financings; and (iii) the parties’ amendment and restatement of the master lease for 25 communities (one of which Healthpeak has agreed to transition to a successor operator). The Company expects to obtain approximately $30.0 million of additional non-recourse mortgage financing on the communities. The parties are jointly marketing for sale the remaining two unconsolidated entry fee CCRC communities. Subsequent to these transactions, the Company will have exited substantially all of its entry fee CCRC operations. The net proceeds from the foregoing transactions improve the Company’s capital structure flexibility and may be used, among other uses, for opportunistic share repurchases, to pursue potential lease restructuring opportunities that it identifies, and to fund investments to support its strategy.

Assets Held for Sale: As of December 31, 2019, three communities were classified as held for sale, resulting in $42.7 million being recorded as assets held for sale and $28.9 million of mortgage debt being included in the current portion of long-term debt within the condensed consolidated balance sheet with respect to such communities. This debt is expected to be repaid with the proceeds from the sales.

2020 OUTLOOK

For the full year 2020, the Company is providing the following guidance, including and excluding the $100.0 million management termination fee received from Healthpeak on January 31, 2020:
($ in millions)
 
Including $100.0M Management Termination Fee
Excluding $100.0M Management Termination Fee
Adjusted EBITDA
 
$510 - $540
$410 - $440
Adjusted Free Cash Flow
 
$70 - $90
($30) - ($10)

Key Guidance Assumptions:
Includes the impact of transactions closed prior to the date hereof and the expected impact of the Company’s planned financing activity and plans to dispose of three communities classified as assets held for sale as of December 31, 2019, termination of lease obligations on three communities for which the Company has provided notice of non-renewal, and anticipated terminations of certain management agreements with third parties as the Company transitions to new operators its management on certain former unconsolidated ventures in which the Company sold its interest and interim management on formerly leased communities.
Except for the foregoing transactions, the Company’s guidance excludes the impact of any future acquisition, disposition, financing, or other transaction activity.

Reconciliations of the non-GAAP financial measures included in the foregoing guidance to the most comparable GAAP financial measures are not available without unreasonable effort due to the inherent difficulty in forecasting the timing or amounts of items required to reconcile Adjusted EBITDA and Adjusted Free Cash Flow from the Company's net income (loss) and the Company's net cash provided by (used in) operating activities, as applicable. Variability in the timing or amounts of items required to reconcile each measure may have a significant impact on the Company's future GAAP results.

SUPPLEMENTAL INFORMATION

The Company will post on its website at www.brookdale.com/investor supplemental information relating to the Company's fourth quarter and full year 2019 results, an updated investor presentation, and a copy of this earnings release. The supplemental information and a copy of this earnings release will also be furnished in a Form 8-K to be filed with the SEC.

EARNINGS CONFERENCE CALL

Brookdale's management will conduct a conference call to review the financial results of its fourth quarter and full year ended December 31, 2019 on February 19, 2020 at 9:00 AM ET. The conference call can be accessed by dialing (866) 900-2996 (from within the U.S.) or (706) 643-2685 (from outside of the U.S.) ten minutes prior to the scheduled start and referencing "Brookdale".

A webcast of the conference call will be available to the public on a listen-only basis at www.brookdale.com/investor. Please allow extra time prior to the call to visit the site and download the necessary software required to listen to the internet broadcast. A replay of the webcast will be available through the website following the call.

For those who cannot listen to the live call, a replay will be available until 11:59 PM ET on March 4, 2020 by dialing (855) 859-2056 (from within the U.S.) or (404) 537-3406 (from outside of the U.S.) and referencing access code "3488808".


Page 5


ABOUT BROOKDALE SENIOR LIVING

Brookdale Senior Living Inc. is the leading operator of senior living communities throughout the United States. The Company is committed to providing senior living solutions primarily within properties that are designed, purpose-built, and operated to provide the highest-quality service, care, and living accommodations for residents. Brookdale operates and manages independent living, assisted living, memory care, and continuing care retirement communities, with 743 communities in 45 states and the ability to serve approximately 65,000 residents as of February 1, 2020. The Company also offers a range of home health, hospice, and outpatient therapy services to over 20,000 patients as of that date. Brookdale's stock is traded on the New York Stock Exchange under the ticker symbol BKD.

DEFINITIONS OF RevPAR AND RevPOR

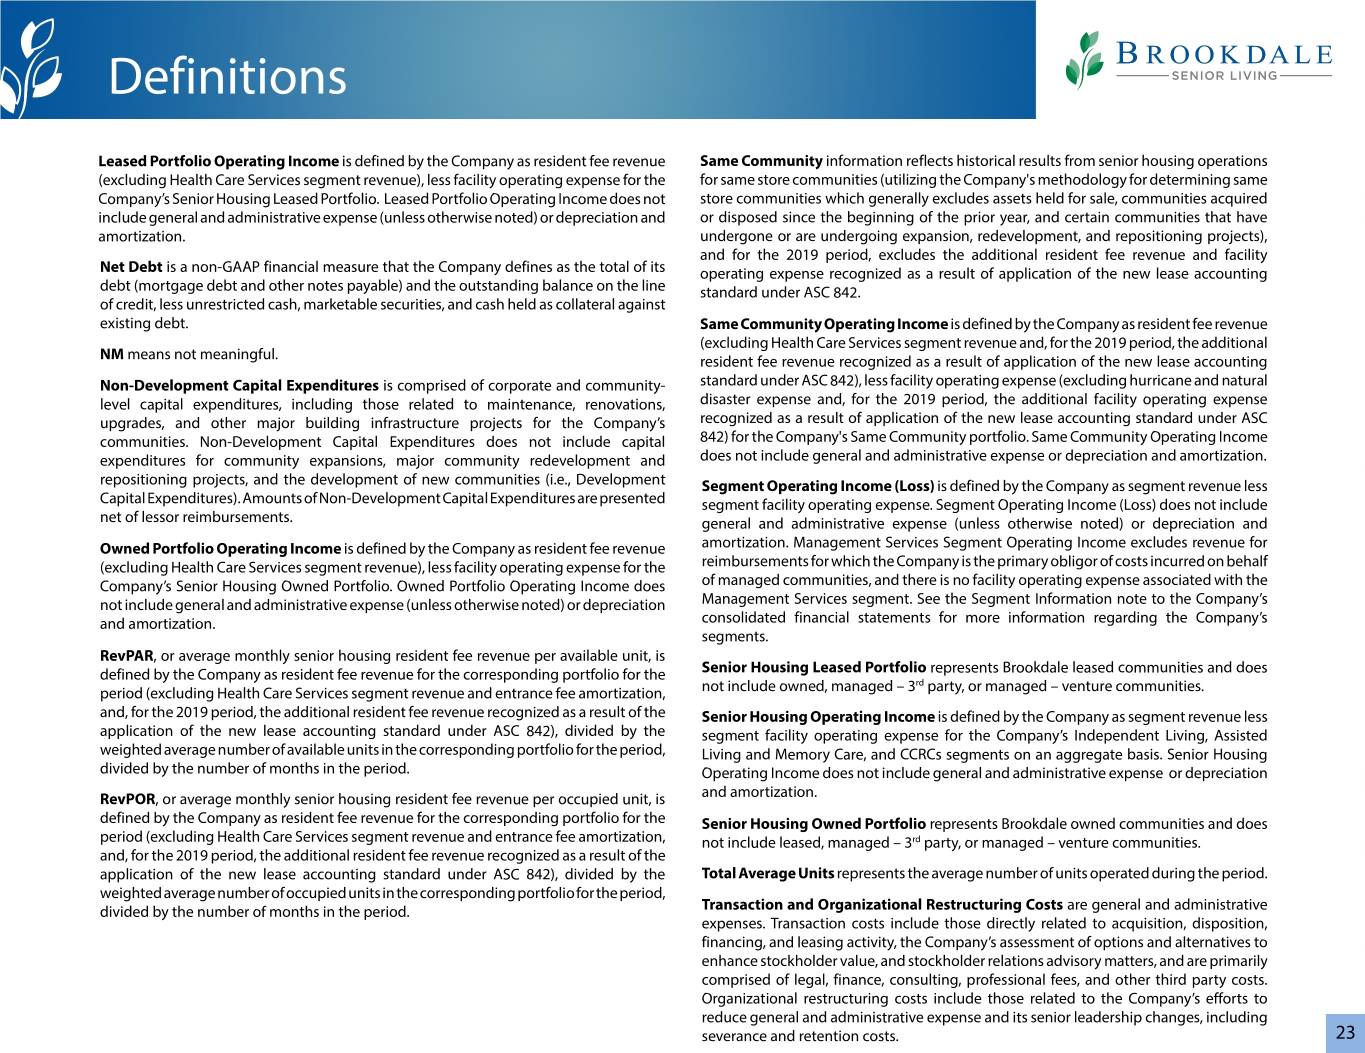
RevPAR, or average monthly senior housing resident fee revenue per available unit, is defined by the Company as resident fee revenue for the corresponding portfolio for the period (excluding Health Care Services segment revenue and entrance fee amortization, and, for the 2019 periods, the additional resident fee revenue recognized as a result of the application of the new lease accounting standard under ASC 842), divided by the weighted average number of available units in the corresponding portfolio for the period, divided by the number of months in the period.

RevPOR, or average monthly senior housing resident fee revenue per occupied unit, is defined by the Company as resident fee revenue for the corresponding portfolio for the period (excluding Health Care Services segment revenue and entrance fee amortization, and, for the 2019 periods, the additional resident fee revenue recognized as a result of the application of the new lease accounting standard under ASC 842), divided by the weighted average number of occupied units in the corresponding portfolio for the period, divided by the number of months in the period.

SAFE HARBOR

Certain statements in this press release and the associated earnings conference call may constitute forward-looking statements within the meaning of the Private Securities Litigation Reform Act of 1995. These forward-looking statements are subject to various risks and uncertainties and include all statements regarding the Company’s guidance and any other statements that are not historical statements of fact and those regarding the Company’s intent, belief or expectations. Forward-looking statements are generally identifiable by use of forward-looking terminology such as "may," "will," "should," "could," "would," "potential," "intend," "expect," "endeavor," "seek," "anticipate," "estimate," "believe," "project," "predict," "continue," "plan," "target," or other similar words or expressions. These forward-looking statements are based on certain assumptions and expectations, and the Company's ability to predict results or the actual effect of future plans or strategies is inherently uncertain. Although the Company believes that expectations reflected in any forward-looking statements are based on reasonable assumptions, the Company can give no assurance that its assumptions or expectations will be attained and actual results and performance could differ materially from those projected. Factors which could have a material adverse effect on the Company’s operations and future prospects or which could cause events or circumstances to differ from the forward-looking statements include, but are not limited to, events which adversely affect the ability of seniors to afford resident fees, including downturns in the economy, housing market, consumer confidence or the equity markets and unemployment among family members; changes in reimbursement rates, methods or timing under governmental reimbursement programs including the Medicare and Medicaid programs; the impact of ongoing healthcare reform efforts; the effects of senior housing construction and development, oversupply and increased competition; disruptions in the financial markets that affect the Company’s ability to obtain financing or extend or refinance debt as it matures and the Company’s financing costs; the risks associated with current global economic conditions and general economic factors such as inflation, the consumer price index, commodity costs, fuel and other energy costs, costs of salaries, wages, benefits, and insurance, interest rates and tax rates; the impact of seasonal contagious illness or an outbreak of other contagious disease in the markets in which the Company operates; the Company’s ability to generate sufficient cash flow to cover required interest and long-term lease payments and to fund its planned capital projects; the effect of the Company’s indebtedness and long-term leases on its liquidity; the effect of the Company’s non-compliance with any of its debt or lease agreements (including the financial covenants contained therein), including the risk of lenders or lessors declaring a cross default in the event of the Company’s non-compliance with any such agreements and the risk of loss of the Company’s property securing leases and indebtedness due to any resulting lease terminations and foreclosure actions; the effect of the Company's borrowing base calculations and the Company's consolidated fixed charge coverage ratio on availability under its revolving credit facility; the potential phasing out of LIBOR which may increase the costs of our debt obligations; increased competition for or a shortage of personnel, wage pressures resulting from increased competition, low unemployment levels, minimum wage increases and changes in overtime laws, and union activity; failure to maintain the security and functionality of the Company’s information systems, to prevent a cybersecurity attack or breach, or to comply with applicable privacy and consumer protection laws, including HIPAA; the Company's inability to achieve or maintain profitability; the Company’s ability to complete pending or expected disposition, acquisition or other transactions on agreed upon terms or at all, including in respect of the satisfaction of closing conditions, the risk that regulatory approvals are not obtained or are subject to unanticipated conditions, and uncertainties as to the timing of closing, and the Company’s ability to identify and pursue any such opportunities in the future; the Company’s ability to obtain additional capital on terms acceptable to it; the Company’s ability to complete its capital expenditures in accordance with its plans; the Company’s ability to identify and pursue development, investment and acquisition opportunities and its ability to successfully integrate acquisitions; competition for the acquisition of assets; delays in obtaining regulatory approvals; terminations, early or otherwise, or non-renewal of management agreements; conditions of housing markets, regulatory changes, acts of nature, and the effects of climate change in geographic areas where the Company is concentrated; terminations of the Company’s resident

Page 6


agreements and vacancies in the living spaces it leases; departures of key officers and potential disruption caused by changes in management; risks related to the implementation of the Company’s strategy, including initiatives undertaken to execute on its strategic priorities and their effect on the Company’s results; actions of activist stockholders, including a proxy contest; market conditions and capital allocation decisions that may influence the Company’s determination from time to time whether to purchase any shares under its existing share repurchase program and the Company’s ability to fund any repurchases; the Company’s ability to maintain consistent quality control; a decrease in the overall demand for senior housing; environmental contamination at any of the Company’s communities; failure to comply with existing environmental laws; an adverse determination or resolution of complaints filed against the Company; the cost and difficulty of complying with increasing and evolving regulation; costs to respond to, and adverse determinations resulting from, government reviews, audits and investigations; unanticipated costs to comply with legislative or regulatory developments; as well as other risks detailed from time to time in the Company’s filings with the Securities and Exchange Commission, including those contained in the Company’s Annual Report on Form 10-K and Quarterly Reports on Form 10-Q. When considering forward-looking statements, you should keep in mind the risk factors and other cautionary statements in such SEC filings. Readers are cautioned not to place undue reliance on any of these forward-looking statements, which reflect management's views as of the date of this press release and/or associated earnings call. The Company cannot guarantee future results, levels of activity, performance or achievements, and, except as required by law, it expressly disclaims any obligation to release publicly any updates or revisions to any forward-looking statements to reflect any change in its expectations with regard thereto or change in events, conditions or circumstances on which any statement is based.


Page 7


Condensed Consolidated Statements of Operations
 
Three Months Ended
December 31,
 
Years Ended
December 31,
(in thousands, except per share data)
2019
 
2018
 
2019
 
2018
Revenue


Resident fees
$
797,352

 
$
806,797

 
$
3,209,931

 
$
3,449,211

Management fees
12,352

 
17,706

 
57,108

 
71,986

Reimbursed costs incurred on behalf of managed communities
176,934

 
244,427

 
790,049

 
1,010,229

Total revenue
986,638

 
1,068,930

 
4,057,088

 
4,531,426


Expense


Facility operating expense (excluding facility depreciation and amortization of $88,105, $97,416, $349,215, and $407,427, respectively)
598,438

 
586,851

 
2,390,495

 
2,453,328

General and administrative expense (including non-cash stock-based compensation expense of $4,711, $5,357, $23,026, and $26,067, respectively)
48,993

 
56,337

 
219,289

 
259,475

Facility operating lease expense
66,056

 
70,542

 
269,666

 
303,294

Depreciation and amortization
94,971

 
106,104

 
379,433

 
447,455

Goodwill and asset impairment
43,012

 
37,927

 
49,266

 
489,893

Loss (gain) on facility lease termination and modification, net
1,382

 
13,197

 
3,388

 
162,001

Costs incurred on behalf of managed communities
176,934

 
244,427

 
790,049

 
1,010,229

Total operating expense
1,029,786

 
1,115,385

 
4,101,586

 
5,125,675

Income (loss) from operations
(43,148
)
 
(46,455
)
 
(44,498
)
 
(594,249
)


Interest income
1,800

 
2,268

 
9,859

 
9,846

Interest expense:


Debt
(42,538
)
 
(46,920
)
 
(177,718
)
 
(188,505
)
Financing lease obligations
(16,394
)
 
(17,388
)
 
(66,353
)
 
(83,604
)
Amortization of deferred financing costs and debt discount
(1,137
)
 
(644
)
 
(4,057
)
 
(7,757
)
Change in fair value of derivatives
(1
)
 
(250
)
 
(213
)
 
(403
)
Debt modification and extinguishment costs
(53
)
 
(11,600
)
 
(5,247
)
 
(11,677
)
Equity in earnings (loss) of unconsolidated ventures
(970
)
 
(1,897
)
 
(4,544
)
 
(8,804
)
Gain (loss) on sale of assets, net
4,522

 
216,660

 
7,245

 
293,246

Other non-operating income (loss)
4,815

 
6,025

 
14,765

 
14,099

Income (loss) before income taxes
(93,104
)
 
99,799

 
(270,761
)
 
(577,808
)
Benefit (provision) for income taxes
1,781

 
31,732

 
2,269

 
49,456

Net income (loss)
(91,323
)
 
131,531

 
(268,492
)
 
(528,352
)
Net (income) loss attributable to noncontrolling interest
(85
)
 
8

 
561

 
94

Net income (loss) attributable to Brookdale Senior Living Inc. common stockholders
$
(91,408
)
 
$
131,539

 
$
(267,931
)
 
$
(528,258
)


Basic and diluted net income (loss) per share attributable to Brookdale Senior Living Inc. common stockholders
$
(0.49
)
 
$
0.70

 
$
(1.44
)
 
$
(2.82
)


Weighted average shares used in computing basic and diluted net income (loss) per share
185,245

 
187,721

 
185,907

 
187,468


Page 8


Condensed Consolidated Balance Sheets
(in thousands)
December 31, 2019
 
December 31, 2018
Cash and cash equivalents
$
240,227

 
$
398,267

Marketable securities
68,567

 
14,855

Restricted cash
26,856

 
27,683

Accounts receivable, net
133,613

 
133,905

Assets held for sale
42,671

 
93,117

Prepaid expenses and other current assets, net
84,241

 
106,189

Total current assets
596,175

 
774,016

Property, plant and equipment and leasehold intangibles, net
5,109,834

 
5,275,427

Operating lease right-of-use assets
1,159,738


Other assets, net
328,686

 
417,817

Total assets
$
7,194,433

 
$
6,467,260


Current liabilities
$
1,046,972

 
$
773,331

Long-term debt, less current portion
3,215,710

 
3,345,754

Financing lease obligations, less current portion
771,434

 
851,341

Operating lease obligations, less current portion
1,277,178


Other liabilities
184,414

 
478,421

Total liabilities
6,495,708

 
5,448,847

Total Brookdale Senior Living Inc. stockholders' equity
696,356

 
1,018,903

Noncontrolling interest
2,369

 
(490
)
Total equity
698,725

 
1,018,413

Total liabilities and equity
$
7,194,433

 
$
6,467,260


Page 9


Condensed Consolidated Statements of Cash Flows
 
Years Ended
December 31,
(in thousands)
2019
 
2018
Cash Flows from Operating Activities


Net income (loss)
$
(268,492
)
 
$
(528,352
)
Adjustments to reconcile net income (loss) to net cash provided by (used in) operating activities:


Debt modification and extinguishment costs
5,247

 
11,677

Depreciation and amortization, net
383,490

 
455,212

Goodwill and asset impairment
49,266

 
489,893

Equity in (earnings) loss of unconsolidated ventures
4,544

 
8,804

Distributions from unconsolidated ventures from cumulative share of net earnings
3,472

 
2,896

Amortization of deferred gain

 
(4,358
)
Amortization of entrance fees
(1,634
)
 
(1,670
)
Proceeds from deferred entrance fee revenue
3,544

 
3,218

Deferred income tax (benefit) provision
(2,654
)
 
(52,367
)
Operating lease expense adjustment
(19,453
)
 
(17,218
)
Change in fair value of derivatives
213

 
403

Loss (gain) on sale of assets, net
(7,245
)
 
(293,246
)
Loss (gain) on facility lease termination and modification, net
3,388

 
140,957

Non-cash stock-based compensation expense
23,026

 
26,067

Non-cash interest expense on financing lease obligations

 
10,894

Non-cash management contract termination gain
(969
)
 
(8,724
)
Other
(8,700
)
 
(1,292
)
Changes in operating assets and liabilities:


Accounts receivable, net
292

 
(4,964
)
Prepaid expenses and other assets, net
55,873

 
26,762

Trade accounts payable and accrued expenses
(12,984
)
 
(37,307
)
Refundable fees and deferred revenue
(25,117
)
 
(128
)
Operating lease assets and liabilities for lessor capital expenditure reimbursements
31,305

 
10,400

Operating lease assets and liabilities for lease termination

 
(33,596
)
Net cash provided by (used in) operating activities
216,412

 
203,961

Cash Flows from Investing Activities


Change in lease security deposits and lease acquisition deposits, net
(859
)
 
1,163

Purchase of marketable securities
(186,224
)
 
(14,823
)
Sale and maturities of marketable securities
134,000

 
293,273

Capital expenditures, net of related payables
(304,092
)
 
(225,473
)
Acquisition of assets, net of related payables and cash received
(497
)
 
(271,771
)
Investment in unconsolidated ventures
(4,346
)
 
(9,124
)
Distributions received from unconsolidated ventures
9,635

 
12,850

Proceeds from sale of assets, net
92,735

 
499,807

Proceeds from notes receivable
34,109

 
1,580

Property insurance proceeds

 
1,292

Net cash provided by (used in) investing activities
(225,539
)
 
288,774

Cash Flows from Financing Activities


Proceeds from debt
321,996

 
606,921

Repayment of debt and financing lease obligations
(427,923
)
 
(896,744
)
Proceeds from line of credit

 
200,000

Repayment of line of credit

 
(200,000
)

Page 10


Purchase of treasury stock, net of related payables
(23,955
)
 
(4,256
)
Payment of financing costs, net of related payables
(7,309
)
 
(16,317
)
Proceeds from refundable entrance fees, net of refunds

 
(422
)
Payments for lease termination

 
(12,548
)
Payments of employee taxes for withheld shares
(3,313
)
 
(3,061
)
Other
1,110

 
1,364

Net cash provided by (used in) financing activities
(139,394
)
 
(325,063
)
Net increase (decrease) in cash, cash equivalents, and restricted cash
(148,521
)
 
167,672

Cash, cash equivalents, and restricted cash at beginning of period
450,218

 
282,546

Cash, cash equivalents, and restricted cash at end of period
$
301,697

 
$
450,218


Page 11


Reconciliations of Non-GAAP Financial Measures

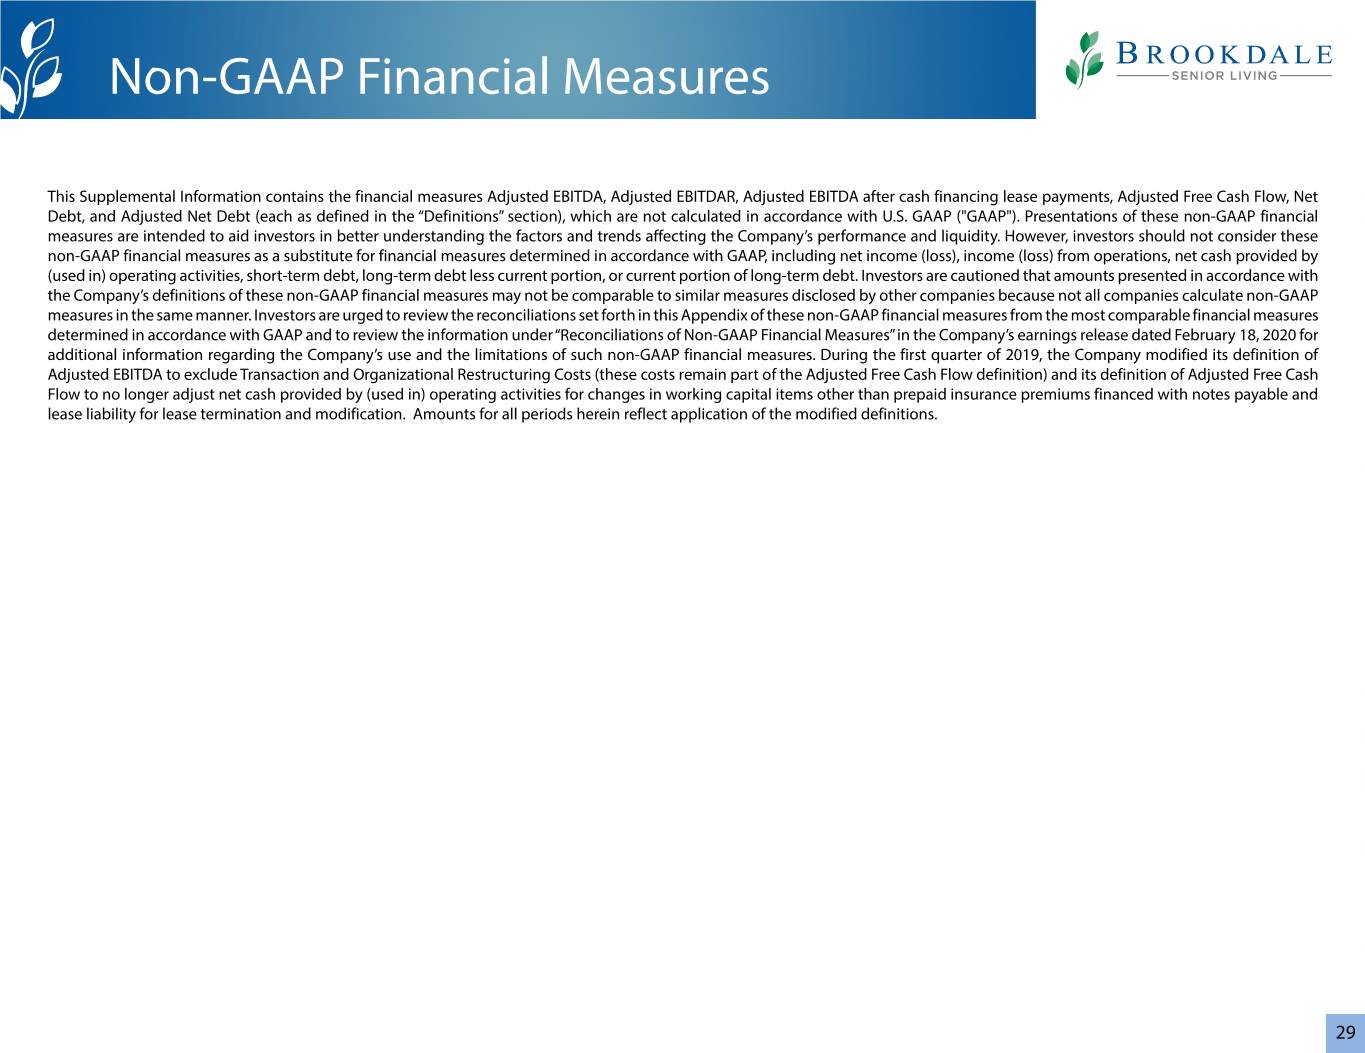
This earnings release contains the financial measures Adjusted EBITDA and Adjusted Free Cash Flow, which are not calculated in accordance with U.S. generally accepted accounting principles ("GAAP"). Presentations of these non-GAAP financial measures are intended to aid investors in better understanding the factors and trends affecting the Company’s performance and liquidity. However, investors should not consider these non-GAAP financial measures as a substitute for financial measures determined in accordance with GAAP, including net income (loss), income (loss) from operations, or net cash provided by (used in) operating activities. Investors are cautioned that amounts presented in accordance with the Company’s definitions of these non-GAAP financial measures may not be comparable to similar measures disclosed by other companies because not all companies calculate non-GAAP measures in the same manner. Investors are urged to review the reconciliations included below of these non-GAAP financial measures from the most comparable financial measures determined in accordance with GAAP.

Adjusted EBITDA

Adjusted EBITDA is a non-GAAP performance measure that the Company defines as net income (loss) excluding: benefit/provision for income taxes, non-operating income/expense items, and depreciation and amortization; and further adjusted to exclude income/expense associated with non-cash, non-operational, transactional, cost reduction, or organizational restructuring items that management does not consider as part of the Company’s underlying core operating performance and that management believes impact the comparability of performance between periods. For the periods presented herein, such other items include non-cash impairment charges, gain/loss on facility lease termination and modification, operating lease expense adjustment, amortization of deferred gain, change in future service obligation, non-cash stock-based compensation expense, and transaction and organizational restructuring costs. Transaction costs include those directly related to acquisition, disposition, financing, and leasing activity, the Company’s assessment of options and alternatives to enhance stockholder value, and stockholder relations advisory matters, and are primarily comprised of legal, finance, consulting, professional fees, and other third party costs. Organizational restructuring costs include those related to the Company’s efforts to reduce general and administrative expense and its senior leadership changes, including severance and retention costs. During the first quarter of 2019, the Company modified its definition of Adjusted EBITDA to exclude transaction and organizational restructuring costs, and amounts for all periods herein reflect application of the modified definition.

The Company’s proportionate share of Adjusted EBITDA of unconsolidated ventures is calculated based on its equity ownership percentage and in a manner consistent with the Company’s definition of Adjusted EBITDA for its consolidated entities. The Company’s investments in unconsolidated ventures are accounted for under the equity method of accounting and, therefore, the Company’s proportionate share of Adjusted EBITDA of unconsolidated ventures does not represent the Company’s equity in earnings or loss of unconsolidated ventures on its consolidated statement of operations.

The Company believes that presentation of Adjusted EBITDA as a performance measure is useful to investors because (i) it is one of the metrics used by the Company’s management for budgeting and other planning purposes, to review the Company’s historic and prospective core operating performance, and to make day-to-day operating decisions; (ii) it provides an assessment of operational factors that management can impact in the short-term, namely revenues and the controllable cost structure of the organization, by eliminating items related to the Company’s financing and capital structure and other items that management does not consider as part of the Company’s underlying core operating performance and that management believes impact the comparability of performance between periods; and (iii) the Company believes that this measure is used by research analysts and investors to evaluate the Company’s operating results and to value companies in its industry. The Company believes that presentation of its proportionate share of Adjusted EBITDA of unconsolidated ventures is useful to investors for similar reasons with respect to the unconsolidated ventures.

Adjusted EBITDA has material limitations as a performance measure, including: (i) excluded interest and income tax are necessary to operate the Company’s business under its current financing and capital structure; (ii) excluded depreciation, amortization and impairment charges may represent the wear and tear and/or reduction in value of the Company’s communities, goodwill and other assets and may be indicative of future needs for capital expenditures; and (iii) the Company may incur income/expense similar to those for which adjustments are made, such as gain/loss on sale of assets or facility lease termination and modification, debt modification and extinguishment costs, non-cash stock-based compensation expense, and transaction and other costs, and such income/expense may significantly affect the Company’s operating results.


Page 12


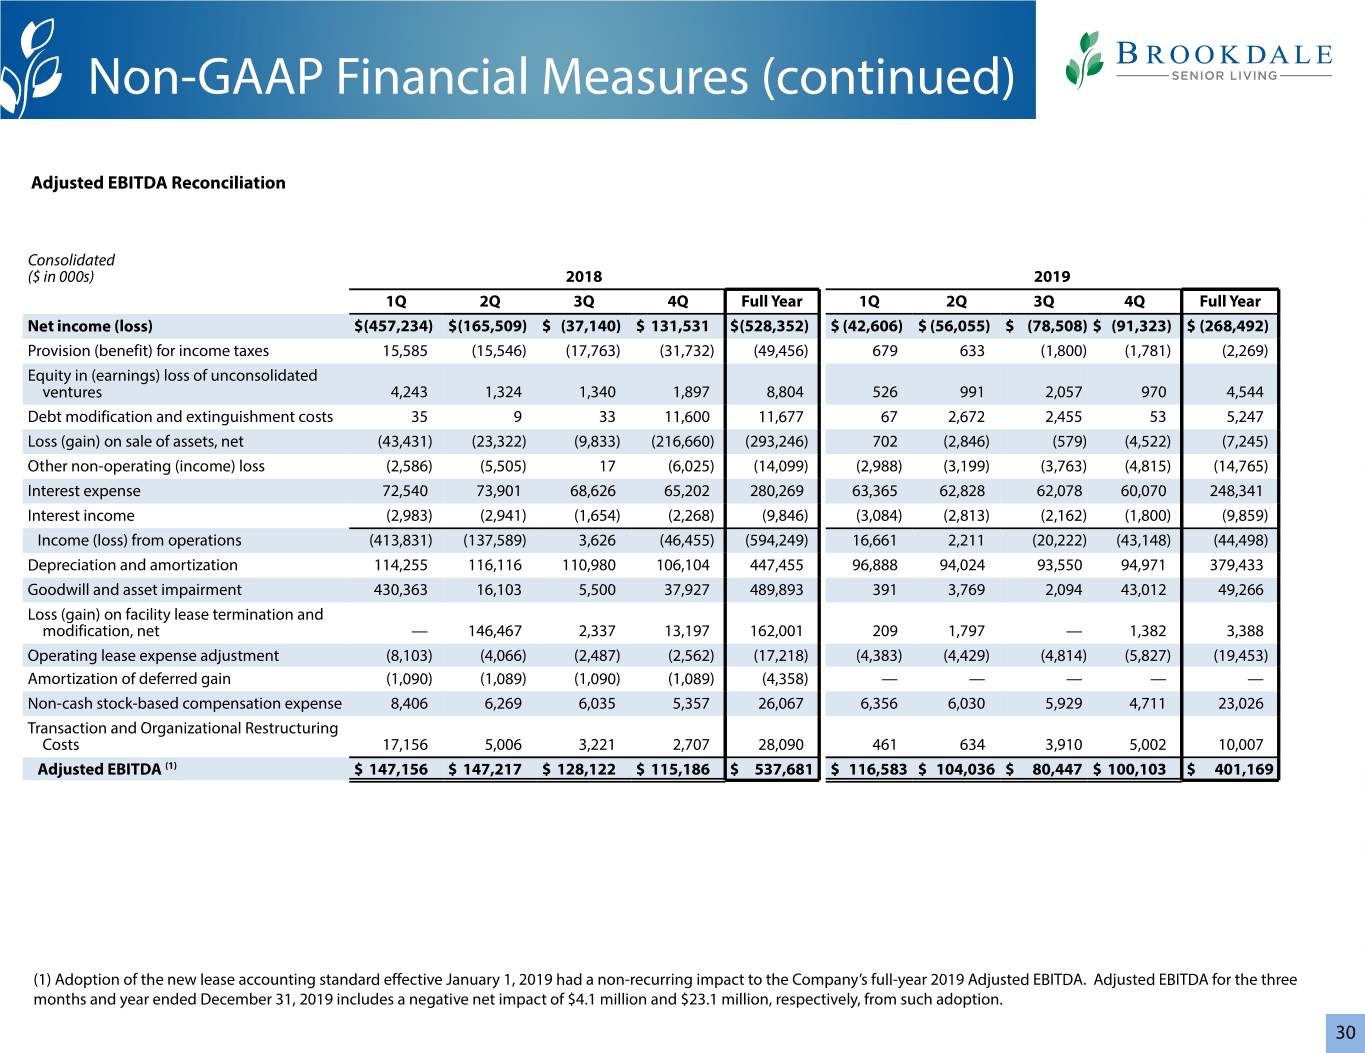
The table below reconciles the Company's Adjusted EBITDA from its net income (loss).
 
Three Months Ended
December 31,
 
Years Ended
December 31,
(in thousands)
2019
 
2018
 
2019
 
2018
Net income (loss)
$
(91,323
)
 
$
131,531

 
$
(268,492
)
 
$
(528,352
)
Provision (benefit) for income taxes
(1,781
)
 
(31,732
)
 
(2,269
)
 
(49,456
)
Equity in (earnings) loss of unconsolidated ventures
970

 
1,897

 
4,544

 
8,804

Debt modification and extinguishment costs
53

 
11,600

 
5,247

 
11,677

Loss (gain) on sale of assets, net
(4,522
)
 
(216,660
)
 
(7,245
)
 
(293,246
)
Other non-operating (income) loss
(4,815
)
 
(6,025
)
 
(14,765
)
 
(14,099
)
Interest expense
60,070

 
65,202

 
248,341

 
280,269

Interest income
(1,800
)
 
(2,268
)
 
(9,859
)
 
(9,846
)
Income (loss) from operations
(43,148
)
 
(46,455
)
 
(44,498
)
 
(594,249
)
Depreciation and amortization
94,971

 
106,104

 
379,433

 
447,455

Goodwill and asset impairment
43,012

 
37,927

 
49,266

 
489,893

Loss (gain) on facility lease termination and modification, net
1,382

 
13,197

 
3,388

 
162,001

Operating lease expense adjustment
(5,827
)
 
(2,562
)
 
(19,453
)
 
(17,218
)
Amortization of deferred gain

 
(1,089
)


(4,358
)
Non-cash stock-based compensation expense
4,711

 
5,357

 
23,026

 
26,067

Transaction and organizational restructuring costs
5,002

 
2,707

 
10,007

 
28,090

Adjusted EBITDA(1)
$
100,103

 
$
115,186

 
$
401,169

 
$
537,681


(1) Adoption of the new lease accounting standard effective January 1, 2019 had a non-recurring impact on the Company’s full-year 2019 Adjusted EBITDA. Adjusted EBITDA for the three and twelve months ended December 31, 2019 includes a negative net impact of $4.1 million and $23.1 million, respectively, from such adoption.

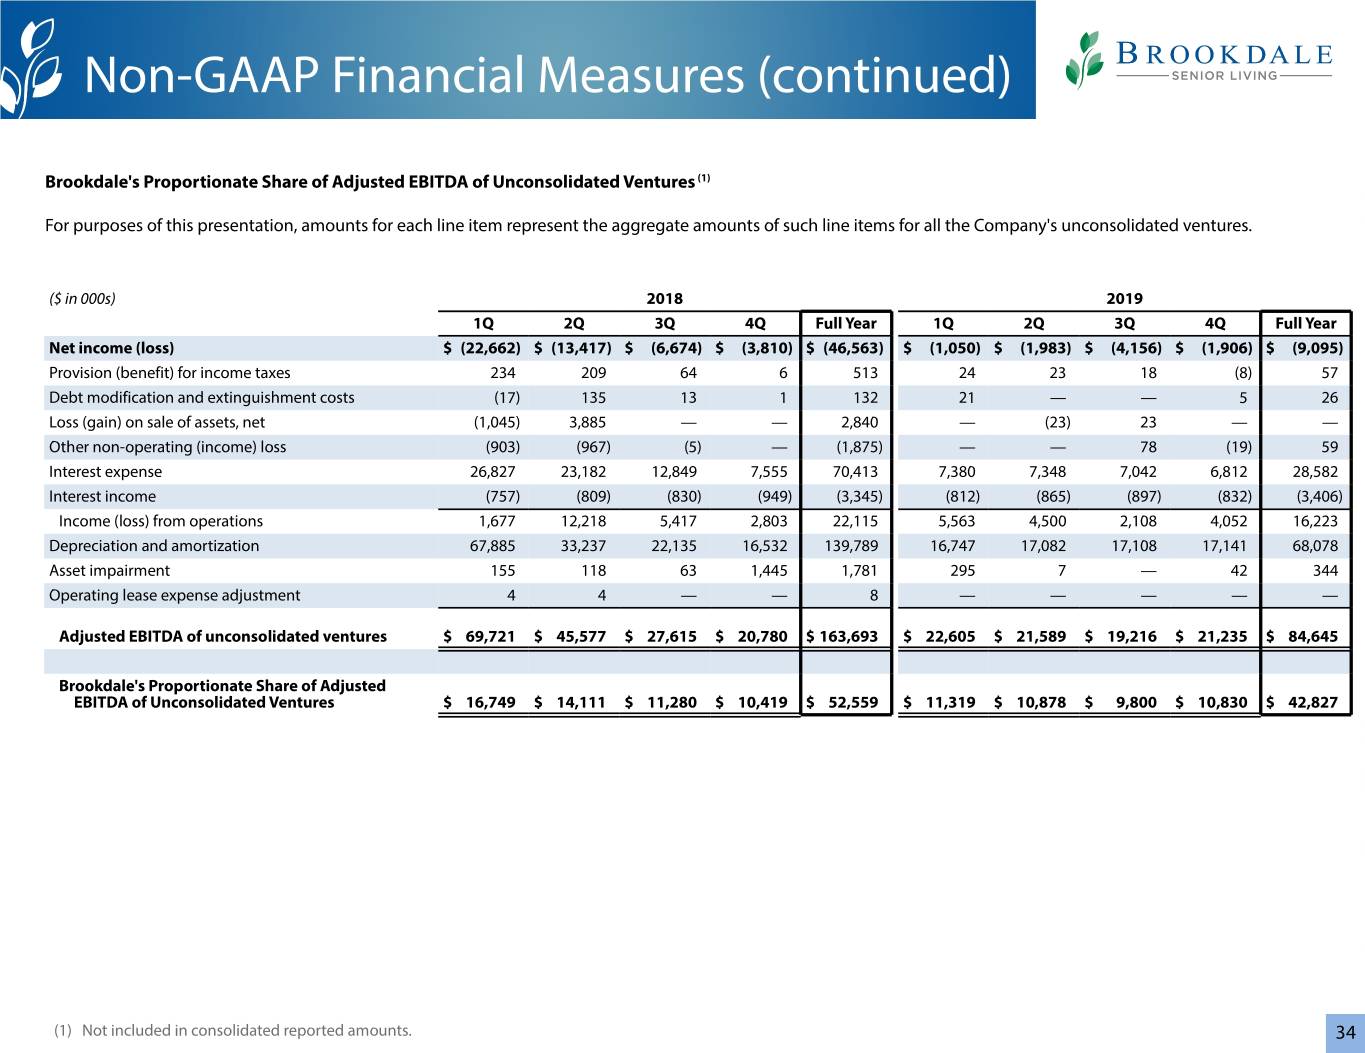
The table below reconciles the Company's proportionate share of Adjusted EBITDA of unconsolidated ventures from net income (loss) of such unconsolidated ventures. For purposes of this presentation, amounts for each line item represent the aggregate amounts of such line items for all of the Company's unconsolidated ventures.
 
Three Months Ended
December 31,
 
Years Ended
December 31,
(in thousands)
2019
 
2018
 
2019
 
2018
Net income (loss)
$
(1,906
)
 
$
(3,810
)
 
$
(9,095
)
 
$
(46,563
)
Provision (benefit) for income taxes
(8
)
 
6

 
57

 
513

Debt modification and extinguishment costs
5

 
1

 
26

 
132

Loss (gain) on sale of assets, net


2,840

Other non-operating (income) loss
(19
)


59

 
(1,875
)
Interest expense
6,812

 
7,555

 
28,582

 
70,413

Interest income
(832
)
 
(949
)
 
(3,406
)
 
(3,345
)
Income (loss) from operations
4,052

 
2,803

 
16,223

 
22,115

Depreciation and amortization
17,141

 
16,532

 
68,078

 
139,789

Asset impairment
42

 
1,445

 
344

 
1,781

Operating lease expense adjustment


8

Adjusted EBITDA of unconsolidated ventures
$
21,235

 
$
20,780

 
$
84,645

 
$
163,693


Brookdale's proportionate share of Adjusted EBITDA of unconsolidated ventures
$
10,830

 
$
10,419

 
$
42,827

 
$
52,559


Page 13


Adjusted Free Cash Flow

Adjusted Free Cash Flow is a non-GAAP liquidity measure that the Company defines as net cash provided by (used in) operating activities before: distributions from unconsolidated ventures from cumulative share of net earnings, changes in prepaid insurance premiums financed with notes payable, changes in operating lease liability for lease termination and modification, cash paid/received for gain/loss on facility lease termination and modification, and lessor capital expenditure reimbursements under operating leases; plus: property insurance proceeds and proceeds from refundable entrance fees, net of refunds; less: non-development capital expenditures and payment of financing lease obligations. Non-development capital expenditures are comprised of corporate and community-level capital expenditures, including those related to maintenance, renovations, upgrades, and other major building infrastructure projects for the Company’s communities and is presented net of lessor reimbursements. Non-development capital expenditures do not include capital expenditures for community expansions, major community redevelopment and repositioning projects, and the development of new communities. During the first quarter of 2019, the Company modified its definition of Adjusted Free Cash Flow to no longer adjust net cash provided by (used in) operating activities for changes in working capital items other than prepaid insurance premiums financed with notes payable and lease liability for lease termination and modification, and amounts for all periods herein reflect application of the modified definition.

The Company’s proportionate share of Adjusted Free Cash Flow of unconsolidated ventures is calculated based on the Company’s equity ownership percentage and in a manner consistent with the Company’s definition of Adjusted Free Cash Flow for its consolidated entities. The Company’s investments in its unconsolidated ventures are accounted for under the equity method of accounting and, therefore, the Company’s proportionate share of Adjusted Free Cash Flow of unconsolidated ventures does not represent cash available to the Company’s consolidated business except to the extent it is distributed to the Company.

The Company believes that presentation of Adjusted Free Cash flow as a liquidity measure is useful to investors because (i) it is one of the metrics used by the Company’s management for budgeting and other planning purposes, to review the Company’s historic and prospective sources of operating liquidity, and to review the Company’s ability to service its outstanding indebtedness, pay dividends to stockholders, engage in share repurchases, and make capital expenditures, including development capital expenditures; (ii) it is used as a metric in the Company’s performance-based compensation programs; and (iii) it provides an indicator to management to determine if adjustments to current spending decisions are needed. The Company believes that presentation of its proportionate share of Adjusted Free Cash Flow of unconsolidated ventures is useful to investors for similar reasons with respect to the unconsolidated ventures and, to the extent such cash is not distributed to the Company, it generally represents cash used or to be used by the ventures for the repayment of debt, investing in expansions or acquisitions, reserve requirements, or other corporate uses by such ventures, and such uses reduce the Company’s potential need to make capital contributions to the ventures of the Company’s proportionate share of cash needed for such items.

Adjusted Free Cash Flow has material limitations as a liquidity measure, including: (i) it does not represent cash available for dividends, share repurchases, or discretionary expenditures since certain non-discretionary expenditures, including mandatory debt principal payments, are not reflected in this measure; (ii) the cash portion of non-recurring charges related to gain/loss on facility lease termination and modification generally represent charges/gains that may significantly affect the Company’s liquidity; and (iii) the impact of timing of cash expenditures, including the timing of non-development capital expenditures, limits the usefulness of the measure for short-term comparisons. In addition, the Company’s proportionate share of Adjusted Free Cash Flow of unconsolidated ventures has material limitations as a liquidity measure because it does not represent cash available directly for use by the Company’s consolidated business except to the extent actually distributed to the Company, and the Company does not have control, or the Company shares control in determining, the timing and amount of distributions from the Company’s unconsolidated ventures and, therefore, the Company may never receive such cash.


Page 14


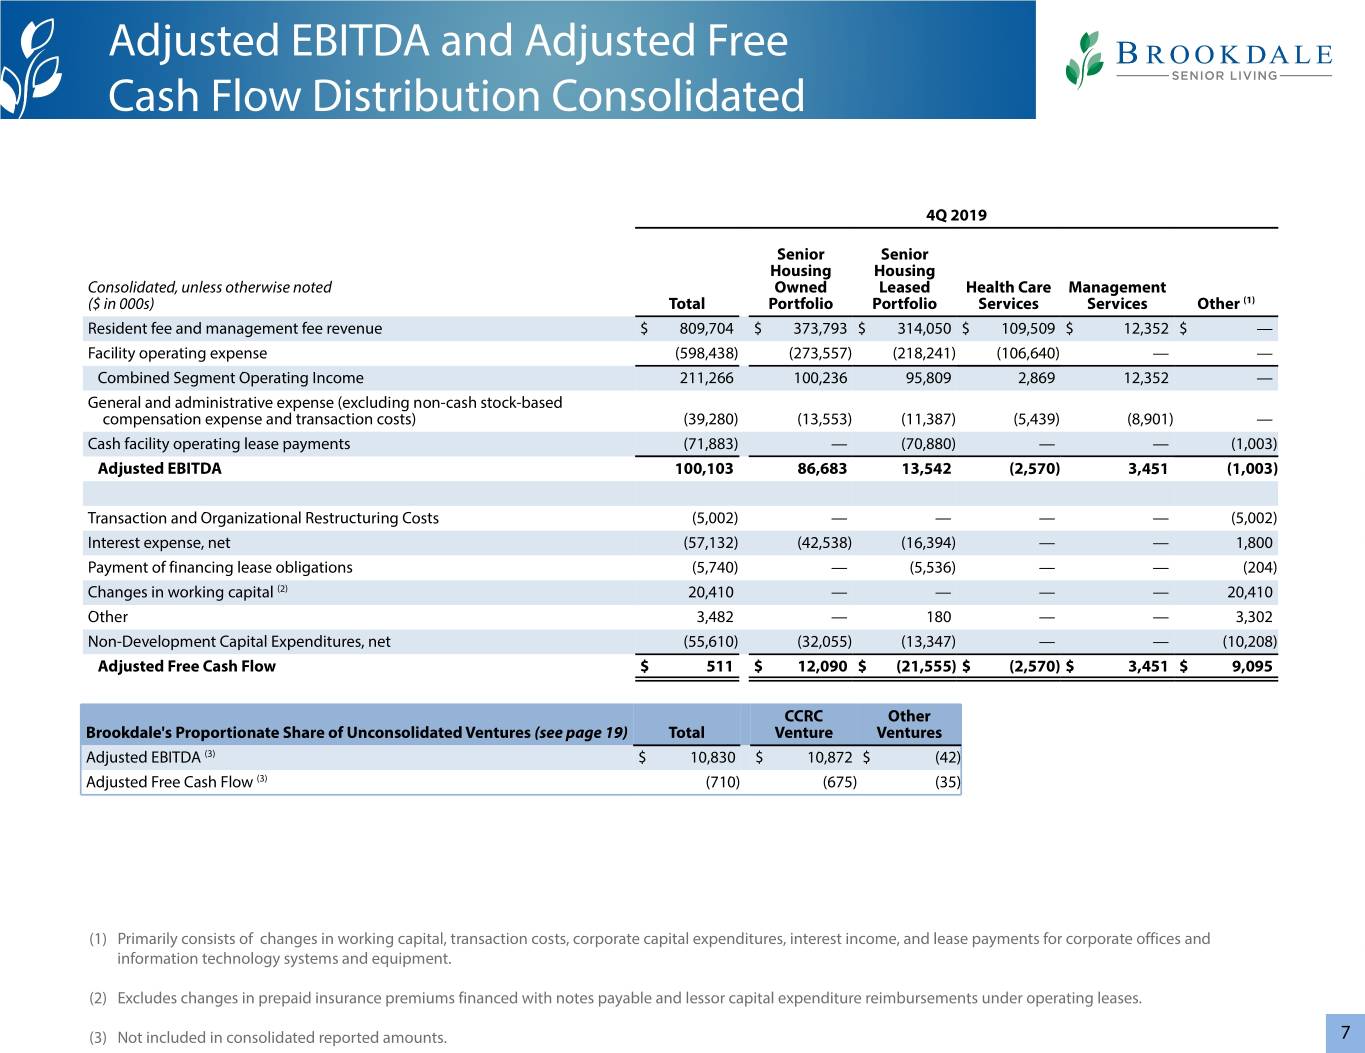
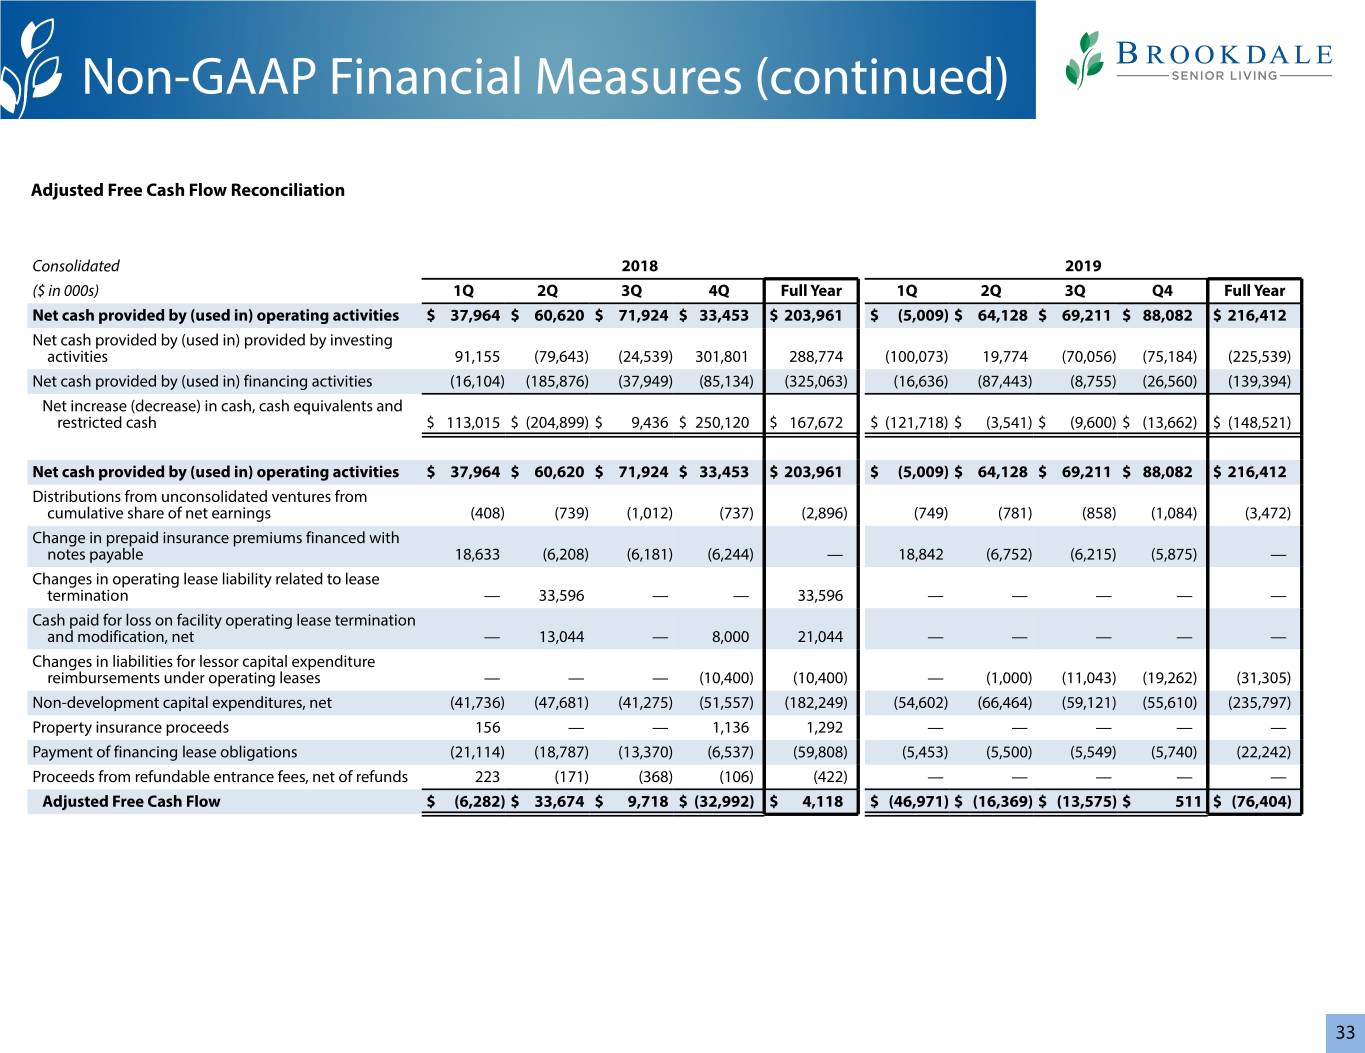
The table below reconciles the Company's Adjusted Free Cash Flow from its net cash provided by (used in) operating activities.

Three Months Ended
December 31,

Years Ended
December 31,
(in thousands)
2019

2018

2019

2018
Net cash provided by (used in) operating activities
$
88,082

 
$
33,453

 
$
216,412

 
$
203,961

Net cash provided by (used in) investing activities
(75,184
)
 
301,801

 
(225,539
)
 
288,774

Net cash provided by (used in) financing activities
(26,560
)
 
(85,134
)
 
(139,394
)
 
(325,063
)
Net increase (decrease) in cash, cash equivalents, and restricted cash
$
(13,662
)
 
$
250,120

 
$
(148,521
)
 
$
167,672


Net cash provided by (used in) operating activities
$
88,082

 
$
33,453

 
$
216,412

 
$
203,961

Distributions from unconsolidated ventures from cumulative share of net earnings
(1,084
)
 
(737
)
 
(3,472
)
 
(2,896
)
Changes in prepaid insurance premiums financed with notes payable
(5,875
)
 
(6,244
)


Changes in operating lease liability related to lease termination


33,596

Cash paid for loss on facility operating lease termination and modification, net

 
8,000


21,044

Changes in assets and liabilities for lessor capital expenditure reimbursements under operating leases
(19,262
)
 
(10,400
)
 
(31,305
)
 
(10,400
)
Non-development capital expenditures, net
(55,610
)
 
(51,557
)
 
(235,797
)
 
(182,249
)
Property insurance proceeds

 
1,136


1,292

Payment of financing lease obligations
(5,740
)
 
(6,537
)
 
(22,242
)
 
(59,808
)
Proceeds from refundable entrance fees, net of refunds

 
(106
)


(422
)
Adjusted Free Cash Flow (1)
$
511

 
$
(32,992
)
 
$
(76,404
)
 
$
4,118


(1) The calculation of Adjusted Free Cash Flow includes transaction and organizational restructuring costs of $5.0 million and $10.0 million for the three and twelve months ended December 31, 2019, respectively, and transaction and organizational restructuring costs of $2.7 million and $28.1 million for the three and twelve months ended December 31, 2018, respectively.

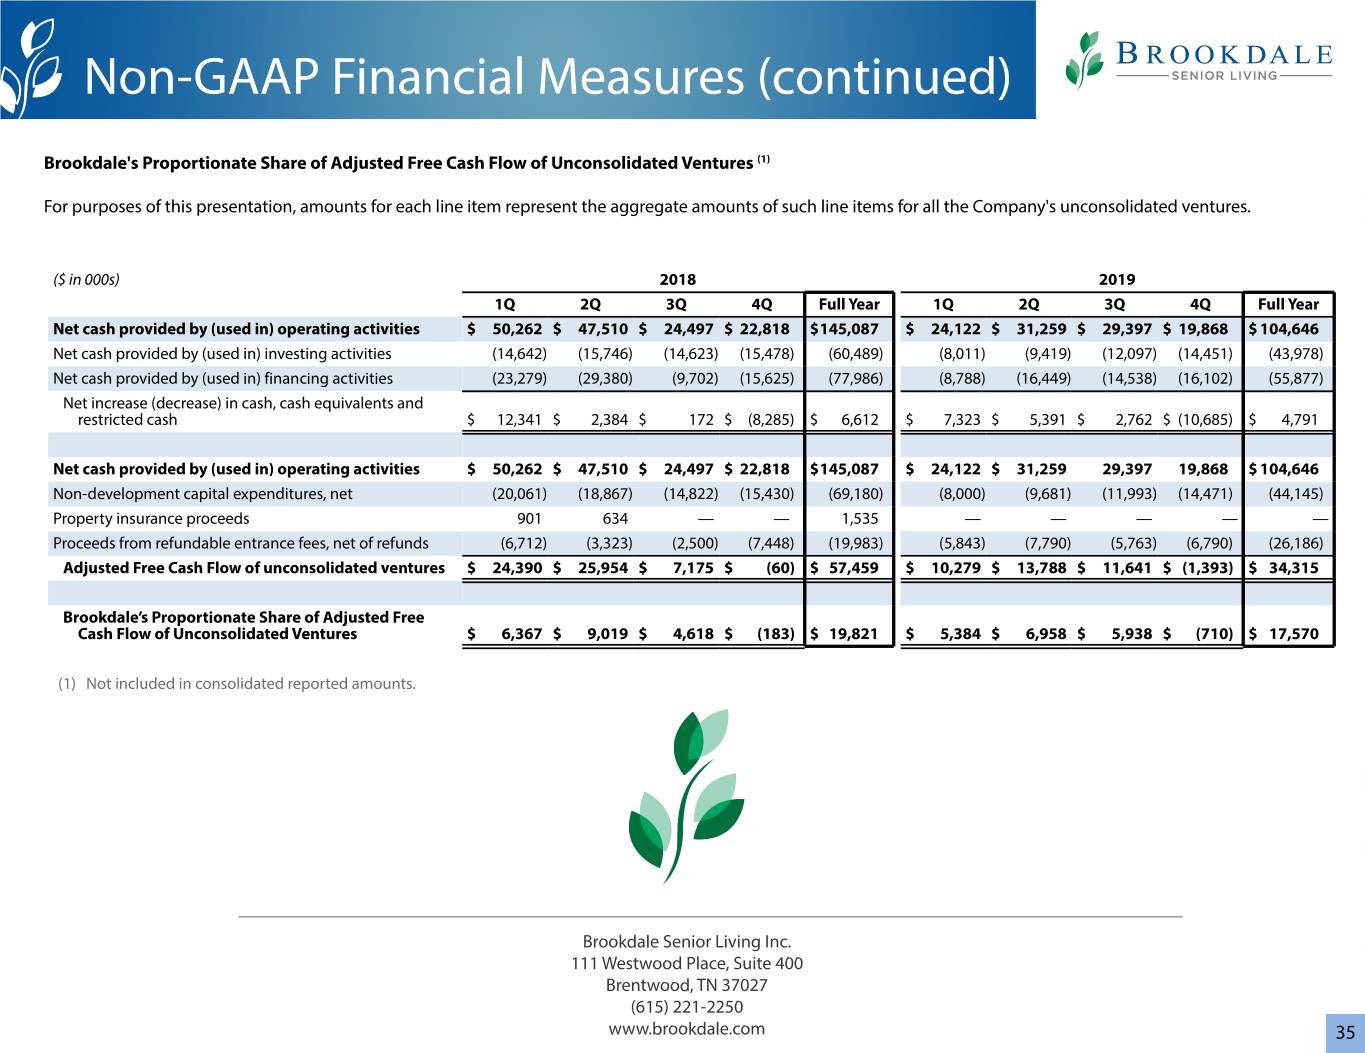
The table below reconciles the Company's proportionate share of Adjusted Free Cash Flow of unconsolidated ventures from net cash provided by (used in) operating activities of such unconsolidated ventures. For purposes of this presentation, amounts for each line item represent the aggregate amounts of such line items for all of the Company's unconsolidated ventures.
 
Three Months Ended
December 31,
 
Years Ended
December 31,
(in thousands)
2019
 
2018
 
2019
 
2018
Net cash provided by (used in) operating activities
$
19,868

 
$
22,818

 
$
104,646

 
$
145,087

Net cash provided by (used in) investing activities
(14,451
)
 
(15,478
)
 
(43,978
)
 
(60,489
)
Net cash provided by (used in) financing activities
(16,102
)
 
(15,625
)
 
(55,877
)
 
(77,986
)
Net increase (decrease) in cash, cash equivalents, and restricted cash
$
(10,685
)
 
$
(8,285
)
 
$
4,791

 
$
6,612


Net cash provided by (used in) operating activities
$
19,868

 
$
22,818

 
$
104,646

 
$
145,087

Non-development capital expenditures, net
(14,471
)
 
(15,430
)
 
(44,145
)
 
(69,180
)
Property insurance proceeds


1,535

Proceeds from refundable entrance fees, net of refunds
(6,790
)
 
(7,448
)
 
(26,186
)
 
(19,983
)
Adjusted Free Cash Flow of unconsolidated ventures
$
(1,393
)
 
$
(60
)
 
$
34,315

 
$
57,459


Brookdale's proportionate share of Adjusted Free Cash Flow of unconsolidated ventures
$
(710
)
 
$
(183
)
 
$
17,570

 
$
19,821


CONTACT: Kathy MacDonald, SVP Investor Relations ● 615-505-1968 ● email: [email protected]

Page 15

Exhibit 99.2 Supplemental Information 4th Quarter 2019


Table of Contents Lease Accounting Standard (ASC 842) Impact 4 Overview 5 Segment Overview 8 Senior Housing 9 Health Care Services 15 G&A Expense 16 Capital Expenditures 17 Cash Facility Lease Payments 18 Unconsolidated Ventures 19 Capital Structure 20 Pro-Forma Net Asset Value Elements 21 Definitions 22 Appendices: Pro-Forma Financial Information 25 Definitive Agreements with Healthpeak Properties Inc. ("Healthpeak") 28 (f/k/a HCP, Inc.) Non-GAAP Financial Measures 29 2


SAFE HARBOR Certain statements in this Supplemental Information may constitute forward-looking statements within the meaning of the Private Securities Litigation Reform Act of 1995. These forward-looking statements are subject to various risks and uncertainties and include all statements regarding the Company’s intent, expectations and assumptions related to the various pending and expected transactions outlined herein and any other statements that are not historical statements of fact. Forward- looking statements are generally identifiable by use of forward-looking terminology such as "may," "will," "should," "could," "would," "potential," "intend," "expect," "endeavor," "seek," "anticipate," "estimate," "believe," "project," "predict," "continue," "plan," "target," or other similar words or expressions. These forward-looking statements are based on certain assumptions and expectations, and the Company's ability to predict results or the actual effect of future plans or strategies is inherently uncertain. Although the Company believes that expectations reflected in any forward-looking statements are based on reasonable assumptions, the Company can give no assurance that its assumptions or expectations will be attained and actual results and performance could differ materially from those projected. Factors which could cause events or circumstances to differ from the forward-looking statements include, but are not limited to, the Company’s ability to complete pending or expected disposition, acquisition or other transactions on agreed upon terms or at all, including in respect of the satisfaction of closing conditions, the risk that regulatory approvals are not obtained or are subject to unanticipated conditions, and uncertainties as to the timing of closing, and the Company’s ability to identify and pursue any such opportunities in the future; delays in obtaining regulatory approvals; terminations, early or otherwise, or non-renewal of management agreements; regulatory changes in geographic areas where the Company is concentrated; disruptions in the financial markets that affect the Company’s ability to obtain financing or extend or refinance debt as it matures and the Company’s financing costs; a decrease in the overall demand for senior housing; environmental contamination at any of the Company’s communities; failure to comply with existing environmental laws; unanticipated costs to comply with legislative or regulatory developments; as well as other risks detailed from time to time in the Company’s filings with the Securities and Exchange Commission, including those contained in the Company’s Annual Report on Form 10-K and Quarterly Reports on Form 10-Q. When considering forward-looking statements, you should keep in mind the risk factors and other cautionary statements in such SEC filings. Readers are cautioned not to place undue reliance on any of these forward-looking statements, which reflect management's views as of the date of this Supplemental Information. The Company cannot guarantee future results, levels of activity, performance or achievements, and, except as required by law, it expressly disclaims any obligation to release publicly any updates or revisions to any of these forward-looking statements to reflect any change in its expectations with regard thereto or change in events, conditions or circumstances on which any statement is based. 3


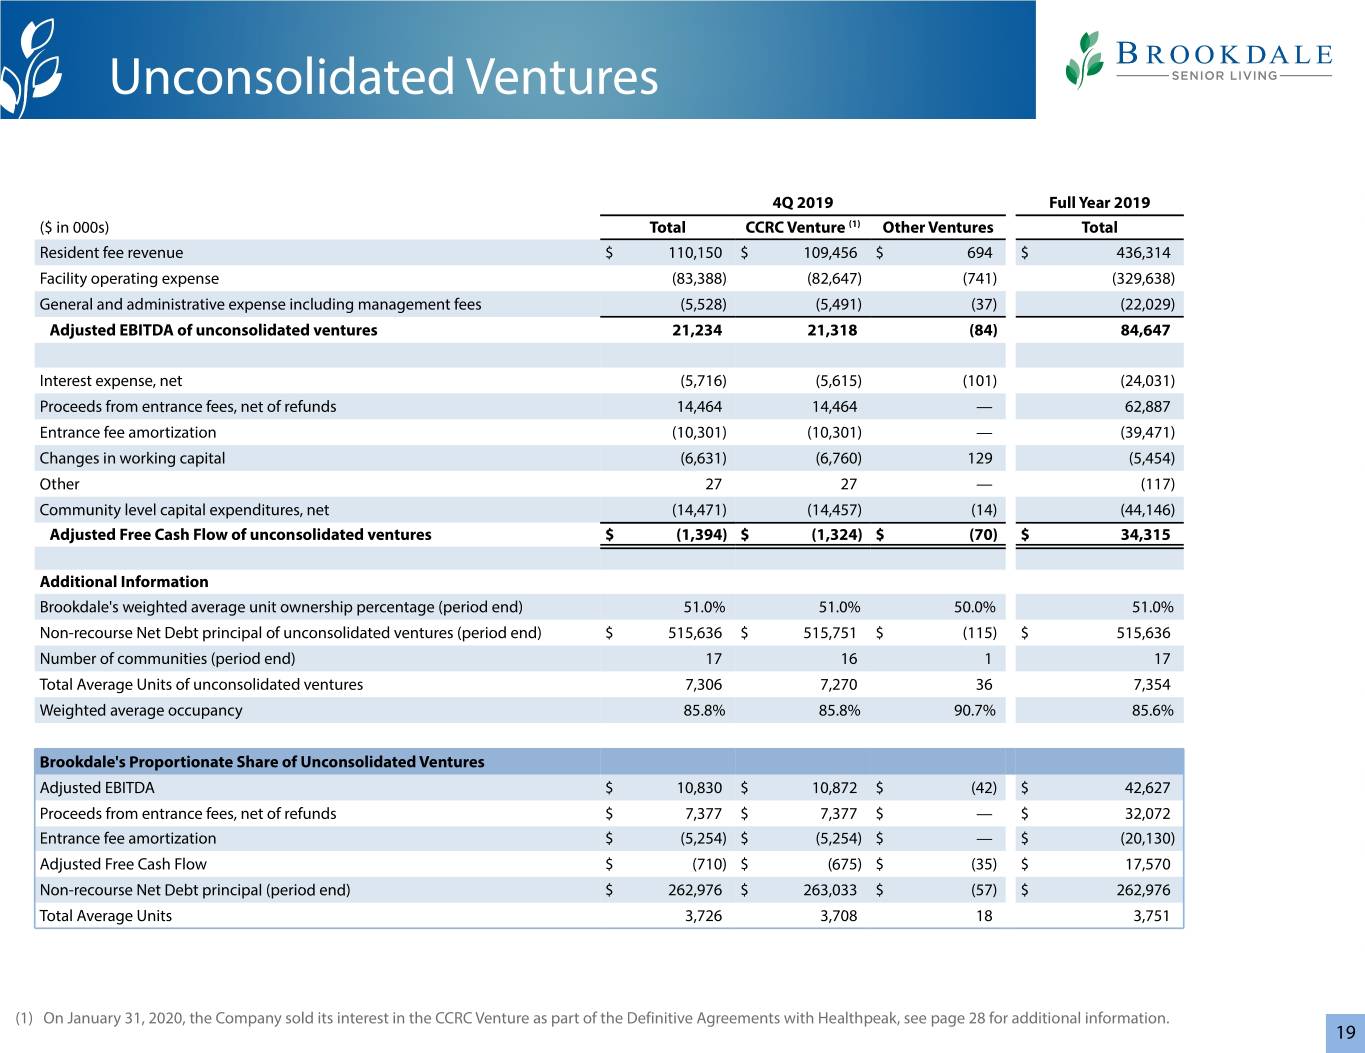
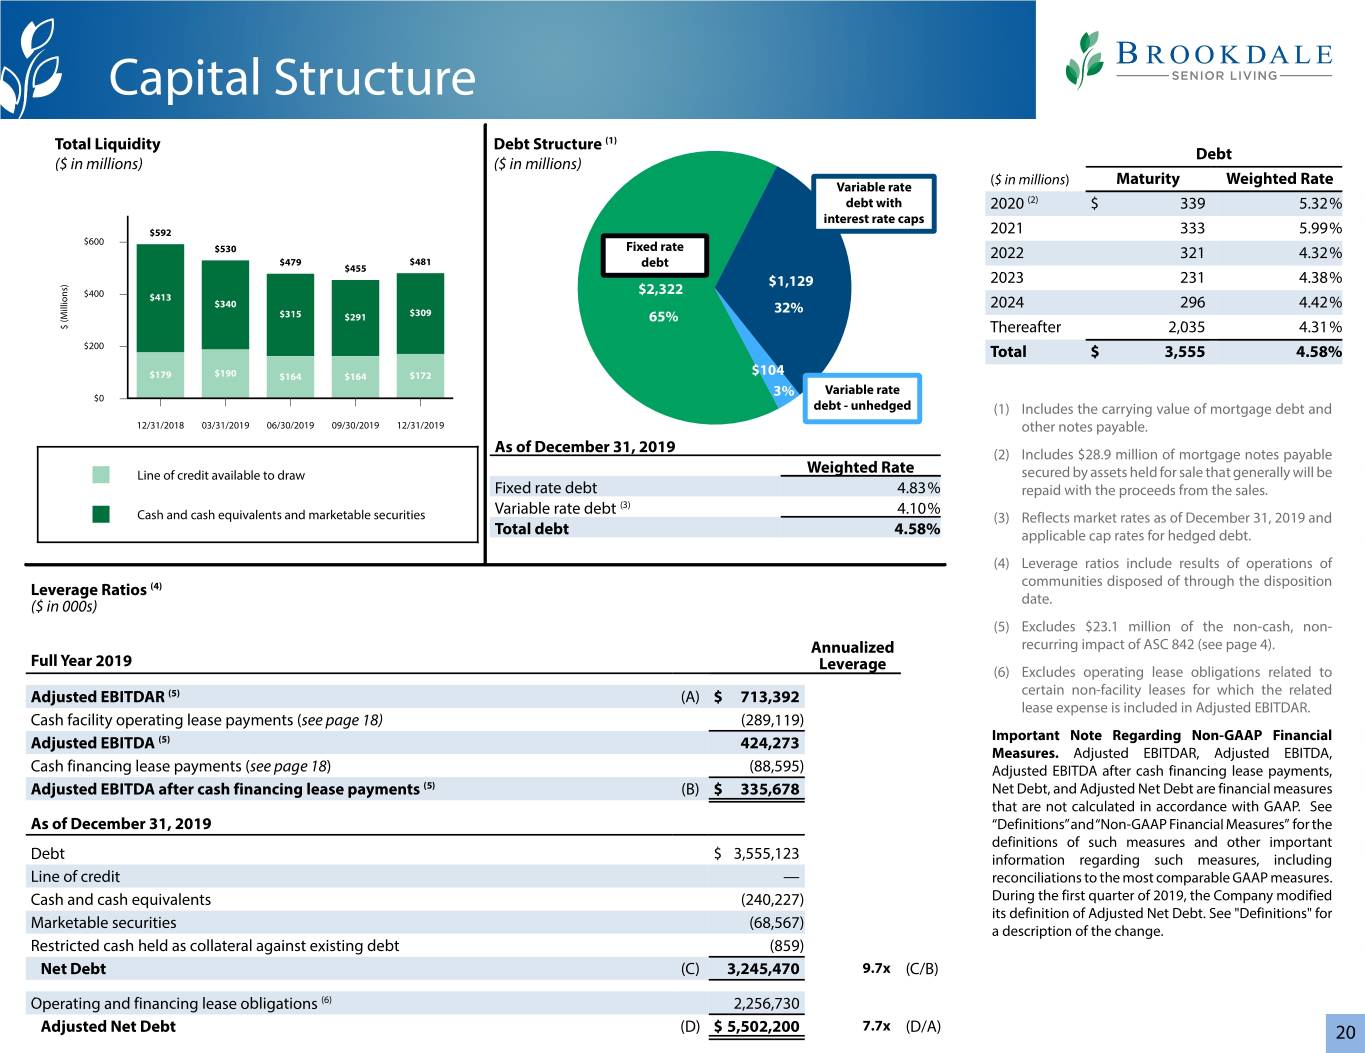
Lease Accounting Standard (ASC 842) Impact The Company’s adoption of the new lease accounting standard, effective January 1, 2019, impacted the timing of the revenue and cost recognition associated with its residency agreements. For the full year 2019, the impact of the adoption and application to its residency agreements had a negative, non-recurring net impact of $23.1 million to net income (loss) and Adjusted EBITDA, with no impact to net cash provided by (used in) operating activities or Adjusted Free Cash Flow. To aid in comparability between periods, the following presentations in this Supplement exclude the impact of adoption of the new lease accounting standard: (i) the Company’s results on a Same Community basis, (ii) RevPAR and RevPOR (other than as noted on this page), (iii) Interest Coverage, (iv) Lease Coverage, and (v) annualized leverage. All other presentations of the Company's 2019 results in this Supplement include the impact of the new lease accounting standard. Prior year amounts reflect the accounting under the former lease standard. The following table presents the impact of adoption of the new lease accounting standard to the Company’s quarterly and full year results from its application to the Company's residency agreements and costs related thereto for the senior housing portfolio. For the first, second, and third quarter impact of the adoption for each senior housing segment, see the supplemental information furnished as Exhibit 99.2 to the Current Reports on Form 8-K filed with the SEC on May 6, 2019, August 5, 2019, and November 5, 2019. 1Q 2019 2Q 2019 Q3 2019 4Q 2019 Full Year 2019 Consolidated Assisted Assisted ($ in 000s, except RevPAR and Total Senior Total Senior Total Senior Total Senior Independent Living and Total Senior Independent Living and RevPOR) Housing Housing Housing Housing Living Memory Care CCRCs Housing Living Memory Care CCRCs Resident fee revenue $ 2,780 $ 5,299 $ 7,958 $ 10,383 $ 2,963 $ 6,421 $ 999 $ 26,420 $ 8,725 $ 14,686 $ 3,009 Facility operating expense 9,210 11,826 13,955 14,533 3,496 9,695 1,342 49,524 12,661 31,560 5,303 Net income (loss) and Adjusted EBITDA (6,430) (6,527) (5,997) (4,150) (533) (3,274) (343) (23,104) (3,936) (16,874) (2,294) Foregoing impact is offset within working capital 6,430 6,527 5,997 4,150 533 3,274 343 23,104 3,936 16,874 2,294 Adjusted Free Cash Flow $ — $ — $ — $ — $ — $ — $ — $ — $ — $ — $ — RevPAR - Including impact of ASC 842 $ 4,118 $ 4,129 $ 4,157 $ 4,180 $ 3,624 $ 4,194 $ 5,223 $ 4,146 $ 3,638 $ 4,139 $ 5,161 RevPAR - Excluding impact of ASC 842 4,102 4,097 4,109 4,116 3,545 4,135 5,168 4,106 3,580 4,106 5,123 RevPOR - Including impact of ASC 842 $ 4,929 $ 4,948 $ 4,937 $ 4,946 $ 4,084 $ 5,019 $ 6,407 $ 4,940 $ 4,080 $ 5,012 $ 6,346 RevPOR - Excluding impact of ASC 842 4,909 4,909 4,880 4,871 3,994 4,948 6,341 4,893 4,014 4,971 6,298 4


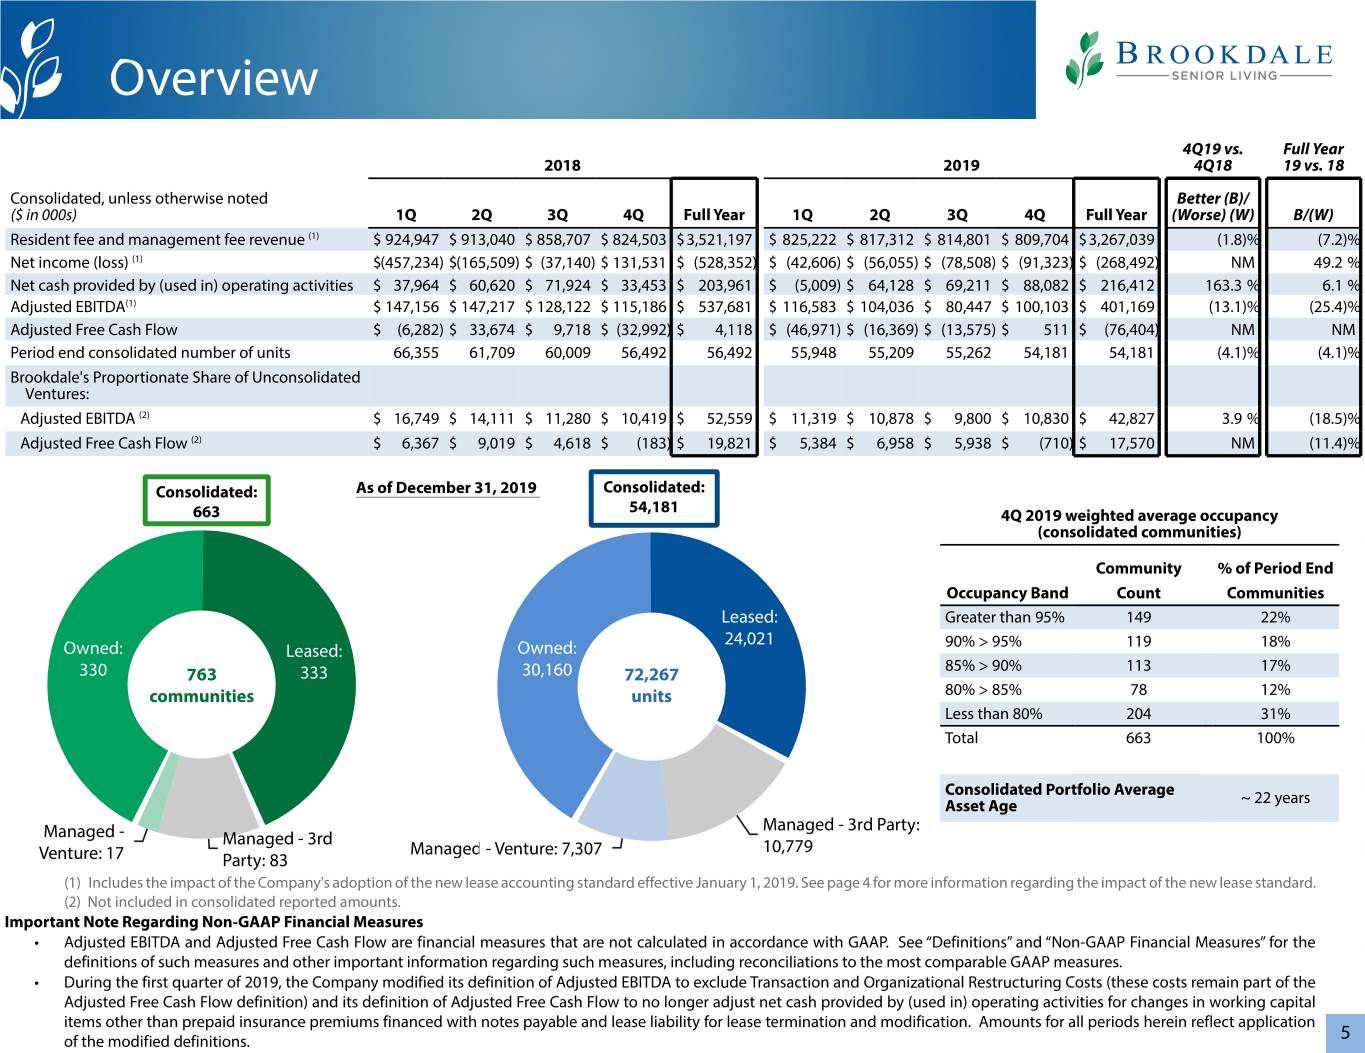
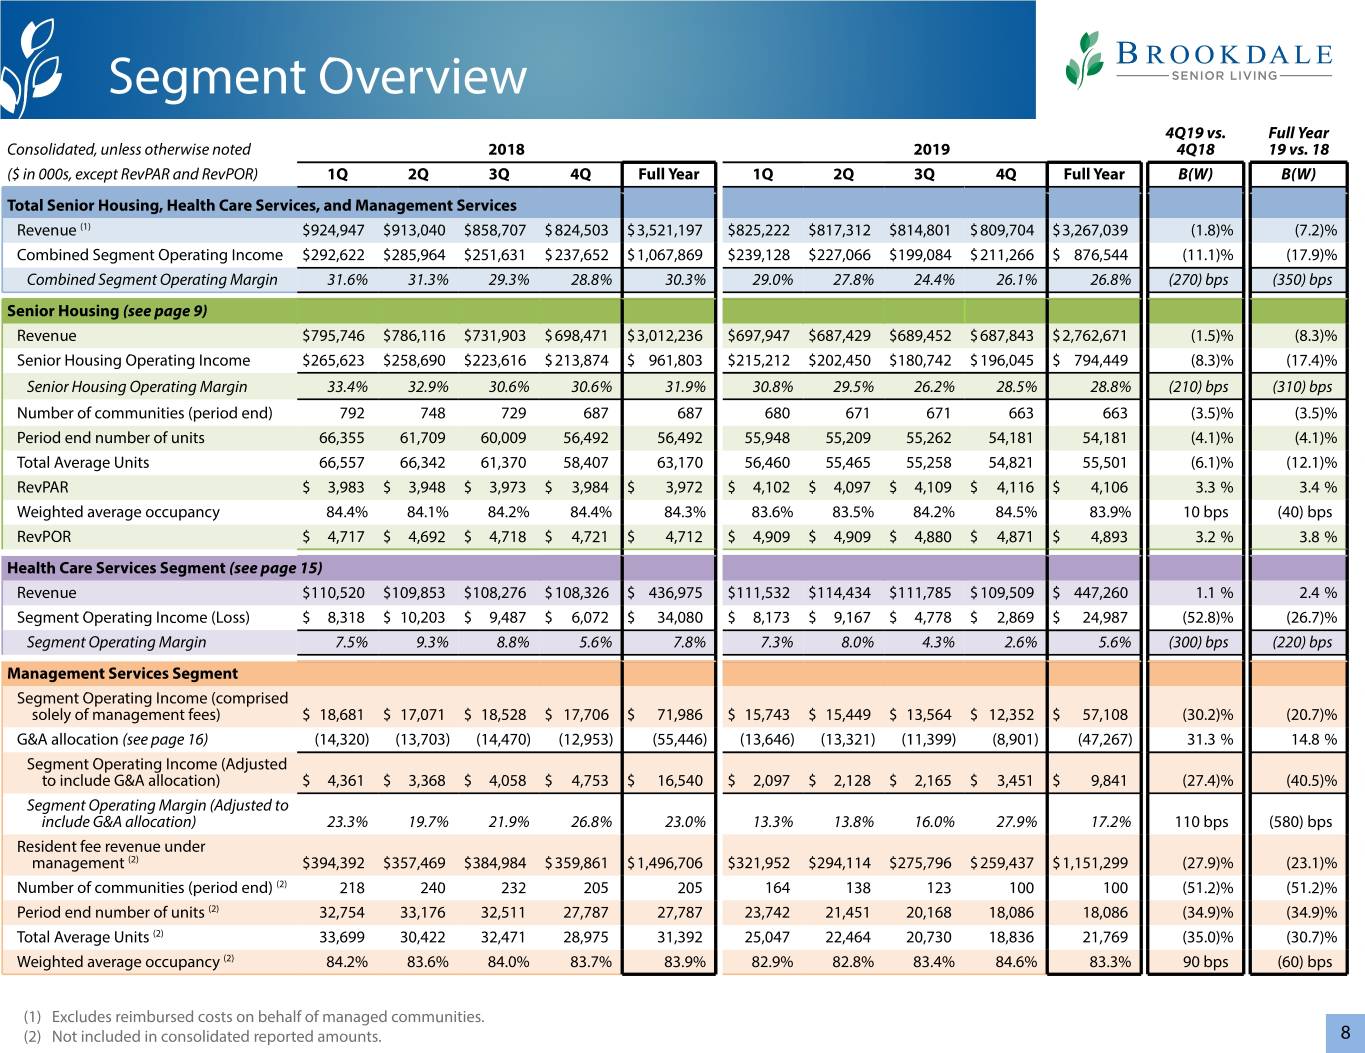
Overview 4Q19 vs. Full Year 2018 2019 4Q18 19 vs. 18 Consolidated, unless otherwise noted Better (B)/ ($ in 000s) 1Q 2Q 3Q 4Q Full Year 1Q 2Q 3Q 4Q Full Year (Worse) (W) B/(W) Resident fee and management fee revenue (1) $ 924,947 $ 913,040 $ 858,707 $ 824,503 $3,521,197 $ 825,222 $ 817,312 $ 814,801 $ 809,704 $3,267,039 (1.8)% (7.2)% Net income (loss) (1) $(457,234) $(165,509) $ (37,140) $ 131,531 $ (528,352) $ (42,606) $ (56,055) $ (78,508) $ (91,323) $ (268,492) NM 49.2 % Net cash provided by (used in) operating activities $ 37,964 $ 60,620 $ 71,924 $ 33,453 $ 203,961 $ (5,009) $ 64,128 $ 69,211 $ 88,082 $ 216,412 163.3 % 6.1 % Adjusted EBITDA(1) $ 147,156 $ 147,217 $ 128,122 $ 115,186 $ 537,681 $ 116,583 $ 104,036 $ 80,447 $ 100,103 $ 401,169 (13.1)% (25.4)% Adjusted Free Cash Flow $ (6,282) $ 33,674 $ 9,718 $ (32,992) $ 4,118 $ (46,971) $ (16,369) $ (13,575) $ 511 $ (76,404) NM NM Period end consolidated number of units 66,355 61,709 60,009 56,492 56,492 55,948 55,209 55,262 54,181 54,181 (4.1)% (4.1)% Brookdale's Proportionate Share of Unconsolidated Ventures: Adjusted EBITDA (2) $ 16,749 $ 14,111 $ 11,280 $ 10,419 $ 52,559 $ 11,319 $ 10,878 $ 9,800 $ 10,830 $ 42,827 3.9 % (18.5)% Adjusted Free Cash Flow (2) $ 6,367 $ 9,019 $ 4,618 $ (183) $ 19,821 $ 5,384 $ 6,958 $ 5,938 $ (710) $ 17,570 NM (11.4)% Consolidated: As of December 31, 2019 Consolidated: 54,181 663 4Q 2019 weighted average occupancy (consolidated communities) Community % of Period End Occupancy Band Count Communities Leased: Greater than 95% 149 22% 24,021 90% > 95% 119 18% Owned: Leased: Owned: 85% > 90% 113 17% 330 763 333 30,160 72,267 communities units 80% > 85% 78 12% Less than 80% 204 31% Total 663 100% Consolidated Portfolio Average Asset Age ~ 22 years Managed - 3rd Party: Managed - Managed - 3rd Managed - Venture: 7,307 10,779 Venture: 17 Party: 83 (1) Includes the impact of the Company's adoption of the new lease accounting standard effective January 1, 2019. See page 4 for more information regarding the impact of the new lease standard. (2) Not included in consolidated reported amounts. Important Note Regarding Non-GAAP Financial Measures • Adjusted EBITDA and Adjusted Free Cash Flow are financial measures that are not calculated in accordance with GAAP. See “Definitions” and “Non-GAAP Financial Measures” for the definitions of such measures and other important information regarding such measures, including reconciliations to the most comparable GAAP measures. • During the first quarter of 2019, the Company modified its definition of Adjusted EBITDA to exclude Transaction and Organizational Restructuring Costs (these costs remain part of the Adjusted Free Cash Flow definition) and its definition of Adjusted Free Cash Flow to no longer adjust net cash provided by (used in) operating activities for changes in working capital items other than prepaid insurance premiums financed with notes payable and lease liability for lease termination and modification. Amounts for all periods herein reflect application of the modified definitions. 5


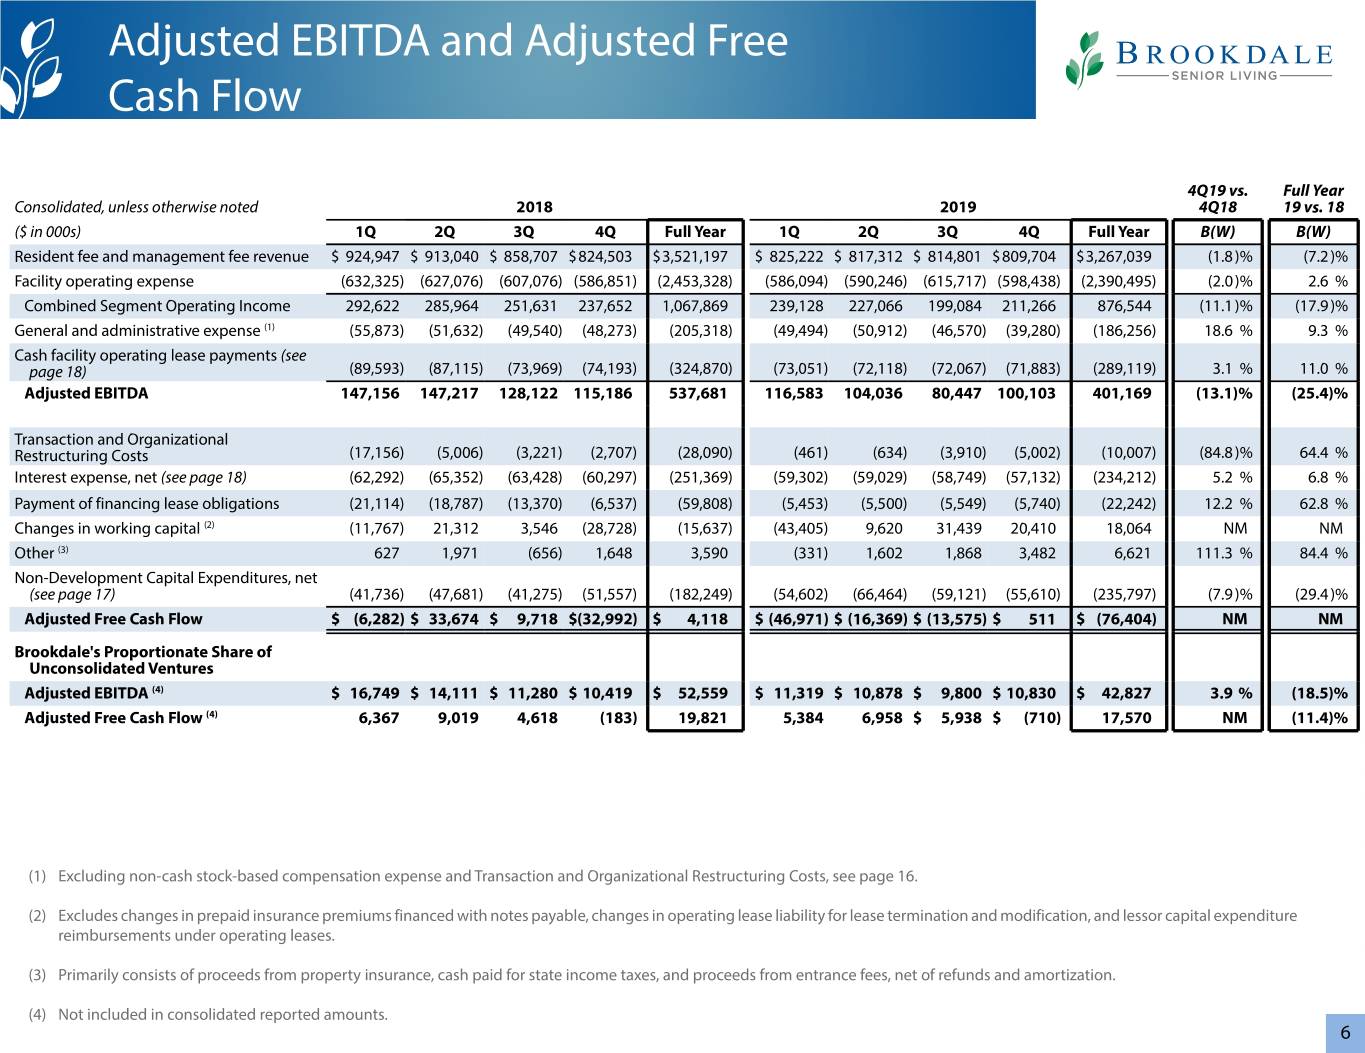
Adjusted EBITDA and Adjusted Free Cash Flow 4Q19 vs. Full Year Consolidated, unless otherwise noted 2018 2019 4Q18 19 vs. 18 ($ in 000s) 1Q 2Q 3Q 4Q Full Year 1Q 2Q 3Q 4Q Full Year B(W) B(W) Resident fee and management fee revenue $ 924,947 $ 913,040 $ 858,707 $824,503 $3,521,197 $ 825,222 $ 817,312 $ 814,801 $809,704 $3,267,039 (1.8)% (7.2)% Facility operating expense (632,325) (627,076) (607,076) (586,851) (2,453,328) (586,094) (590,246) (615,717) (598,438) (2,390,495) (2.0)% 2.6 % Combined Segment Operating Income 292,622 285,964 251,631 237,652 1,067,869 239,128 227,066 199,084 211,266 876,544 (11.1)% (17.9)% General and administrative expense (1) (55,873) (51,632) (49,540) (48,273) (205,318) (49,494) (50,912) (46,570) (39,280) (186,256) 18.6 % 9.3 % Cash facility operating lease payments (see page 18) (89,593) (87,115) (73,969) (74,193) (324,870) (73,051) (72,118) (72,067) (71,883) (289,119) 3.1 % 11.0 % Adjusted EBITDA 147,156 147,217 128,122 115,186 537,681 116,583 104,036 80,447 100,103 401,169 (13.1)% (25.4)% Transaction and Organizational Restructuring Costs (17,156) (5,006) (3,221) (2,707) (28,090) (461) (634) (3,910) (5,002) (10,007) (84.8)% 64.4 % Interest expense, net (see page 18) (62,292) (65,352) (63,428) (60,297) (251,369) (59,302) (59,029) (58,749) (57,132) (234,212) 5.2 % 6.8 % Payment of financing lease obligations (21,114) (18,787) (13,370) (6,537) (59,808) (5,453) (5,500) (5,549) (5,740) (22,242) 12.2 % 62.8 % Changes in working capital (2) (11,767) 21,312 3,546 (28,728) (15,637) (43,405) 9,620 31,439 20,410 18,064 NM NM Other (3) 627 1,971 (656) 1,648 3,590 (331) 1,602 1,868 3,482 6,621 111.3 % 84.4 % Non-Development Capital Expenditures, net (see page 17) (41,736) (47,681) (41,275) (51,557) (182,249) (54,602) (66,464) (59,121) (55,610) (235,797) (7.9)% (29.4)% Adjusted Free Cash Flow $ (6,282) $ 33,674 $ 9,718 $(32,992) $ 4,118 $ (46,971) $ (16,369) $ (13,575) $ 511 $ (76,404) NM NM Brookdale's Proportionate Share of Unconsolidated Ventures Adjusted EBITDA (4) $ 16,749 $ 14,111 $ 11,280 $ 10,419 $ 52,559 $ 11,319 $ 10,878 $ 9,800 $ 10,830 $ 42,827 3.9 % (18.5)% Adjusted Free Cash Flow (4) 6,367 9,019 4,618 (183) 19,821 5,384 6,958 $ 5,938 $ (710) 17,570 NM (11.4)% (1) Excluding non-cash stock-based compensation expense and Transaction and Organizational Restructuring Costs, see page 16. (2) Excludes changes in prepaid insurance premiums financed with notes payable, changes in operating lease liability for lease termination and modification, and lessor capital expenditure reimbursements under operating leases. (3) Primarily consists of proceeds from property insurance, cash paid for state income taxes, and proceeds from entrance fees, net of refunds and amortization. (4) Not included in consolidated reported amounts. 6


Adjusted EBITDA and Adjusted Free Cash Flow Distribution Consolidated 4Q 2019 Senior Senior Housing Housing Consolidated, unless otherwise noted Owned Leased Health Care Management ($ in 000s) Total Portfolio Portfolio Services Services Other (1) Resident fee and management fee revenue $ 809,704 $ 373,793 $ 314,050 $ 109,509 $ 12,352 $ — Facility operating expense (598,438) (273,557) (218,241) (106,640) — — Combined Segment Operating Income 211,266 100,236 95,809 2,869 12,352 — General and administrative expense (excluding non-cash stock-based compensation expense and transaction costs) (39,280) (13,553) (11,387) (5,439) (8,901) — Cash facility operating lease payments (71,883) — (70,880) — — (1,003) Adjusted EBITDA 100,103 86,683 13,542 (2,570) 3,451 (1,003) Transaction and Organizational Restructuring Costs (5,002) — — — — (5,002) Interest expense, net (57,132) (42,538) (16,394) — — 1,800 Payment of financing lease obligations (5,740) — (5,536) — — (204) Changes in working capital (2) 20,410 — — — — 20,410 Other 3,482 — 180 — — 3,302 Non-Development Capital Expenditures, net (55,610) (32,055) (13,347) — — (10,208) Adjusted Free Cash Flow $ 511 $ 12,090 $ (21,555) $ (2,570) $ 3,451 $ 9,095 CCRC Other Brookdale's Proportionate Share of Unconsolidated Ventures (see page 19) Total Venture Ventures Adjusted EBITDA (3) $ 10,830 $ 10,872 $ (42) Adjusted Free Cash Flow (3) (710) (675) (35) (1) Primarily consists of changes in working capital, transaction costs, corporate capital expenditures, interest income, and lease payments for corporate offices and information technology systems and equipment. (2) Excludes changes in prepaid insurance premiums financed with notes payable and lessor capital expenditure reimbursements under operating leases. (3) Not included in consolidated reported amounts. 7


Segment Overview 4Q19 vs. Full Year Consolidated, unless otherwise noted 2018 2019 4Q18 19 vs. 18 ($ in 000s, except RevPAR and RevPOR) 1Q 2Q 3Q 4Q Full Year 1Q 2Q 3Q 4Q Full Year B(W) B(W) Total Senior Housing, Health Care Services, and Management Services Revenue (1) $924,947 $913,040 $858,707 $824,503 $3,521,197 $825,222 $817,312 $814,801 $809,704 $3,267,039 (1.8)% (7.2)% Combined Segment Operating Income $292,622 $285,964 $251,631 $237,652 $1,067,869 $239,128 $227,066 $199,084 $211,266 $ 876,544 (11.1)% (17.9)% Combined Segment Operating Margin 31.6% 31.3% 29.3% 28.8% 30.3% 29.0% 27.8% 24.4% 26.1% 26.8% (270) bps (350) bps Senior Housing (see page 9) Revenue $795,746 $786,116 $731,903 $698,471 $3,012,236 $697,947 $687,429 $689,452 $687,843 $2,762,671 (1.5)% (8.3)% Senior Housing Operating Income $265,623 $258,690 $223,616 $213,874 $ 961,803 $215,212 $202,450 $180,742 $196,045 $ 794,449 (8.3)% (17.4)% Senior Housing Operating Margin 33.4% 32.9% 30.6% 30.6% 31.9% 30.8% 29.5% 26.2% 28.5% 28.8% (210) bps (310) bps Number of communities (period end) 792 748 729 687 687 680 671 671 663 663 (3.5)% (3.5)% Period end number of units 66,355 61,709 60,009 56,492 56,492 55,948 55,209 55,262 54,181 54,181 (4.1)% (4.1)% Total Average Units 66,557 66,342 61,370 58,407 63,170 56,460 55,465 55,258 54,821 55,501 (6.1)% (12.1)% RevPAR $ 3,983 $ 3,948 $ 3,973 $ 3,984 $ 3,972 $ 4,102 $ 4,097 $ 4,109 $ 4,116 $ 4,106 3.3 % 3.4 % Weighted average occupancy 84.4% 84.1% 84.2% 84.4% 84.3% 83.6% 83.5% 84.2% 84.5% 83.9% 10 bps (40) bps RevPOR $ 4,717 $ 4,692 $ 4,718 $ 4,721 $ 4,712 $ 4,909 $ 4,909 $ 4,880 $ 4,871 $ 4,893 3.2 % 3.8 % Health Care Services Segment (see page 15) Revenue $110,520 $109,853 $108,276 $108,326 $ 436,975 $111,532 $114,434 $111,785 $109,509 $ 447,260 1.1 % 2.4 % Segment Operating Income (Loss) $ 8,318 $ 10,203 $ 9,487 $ 6,072 $ 34,080 $ 8,173 $ 9,167 $ 4,778 $ 2,869 $ 24,987 (52.8)% (26.7)% Segment Operating Margin 7.5% 9.3% 8.8% 5.6% 7.8% 7.3% 8.0% 4.3% 2.6% 5.6% (300) bps (220) bps Management Services Segment Segment Operating Income (comprised solely of management fees) $ 18,681 $ 17,071 $ 18,528 $ 17,706 $ 71,986 $ 15,743 $ 15,449 $ 13,564 $ 12,352 $ 57,108 (30.2)% (20.7)% G&A allocation (see page 16) (14,320) (13,703) (14,470) (12,953) (55,446) (13,646) (13,321) (11,399) (8,901) (47,267) 31.3 % 14.8 % Segment Operating Income (Adjusted to include G&A allocation) $ 4,361 $ 3,368 $ 4,058 $ 4,753 $ 16,540 $ 2,097 $ 2,128 $ 2,165 $ 3,451 $ 9,841 (27.4)% (40.5)% Segment Operating Margin (Adjusted to include G&A allocation) 23.3% 19.7% 21.9% 26.8% 23.0% 13.3% 13.8% 16.0% 27.9% 17.2% 110 bps (580) bps Resident fee revenue under management (2) $394,392 $357,469 $384,984 $359,861 $1,496,706 $321,952 $294,114 $275,796 $259,437 $1,151,299 (27.9)% (23.1)% Number of communities (period end) (2) 218 240 232 205 205 164 138 123 100 100 (51.2)% (51.2)% Period end number of units (2) 32,754 33,176 32,511 27,787 27,787 23,742 21,451 20,168 18,086 18,086 (34.9)% (34.9)% Total Average Units (2) 33,699 30,422 32,471 28,975 31,392 25,047 22,464 20,730 18,836 21,769 (35.0)% (30.7)% Weighted average occupancy (2) 84.2% 83.6% 84.0% 83.7% 83.9% 82.9% 82.8% 83.4% 84.6% 83.3% 90 bps (60) bps (1) Excludes reimbursed costs on behalf of managed communities. (2) Not included in consolidated reported amounts. 8


Senior Housing Segments Consolidated 4Q19 vs. Full Year ($ in 000s, except RevPAR and RevPOR) 2018 2019 4Q18 19 vs. 18 1Q 2Q 3Q 4Q Full Year 1Q 2Q 3Q 4Q Full Year B(W) B(W) Independent Living Revenue $158,397 $159,293 $144,631 $137,656 $ 599,977 $135,694 $135,951 $136,874 $136,039 $ 544,558 (1.2)% (9.2)% Segment Operating Income $ 64,422 $ 65,134 $ 57,106 $ 53,947 $ 240,609 $ 52,876 $ 51,459 $ 49,414 $ 49,992 $ 203,741 (7.3)% (15.3)% Segment Operating Margin 40.7% 40.9% 39.5% 39.2% 40.1% 39.0% 37.9% 36.1% 36.7% 37.4% (250) bps (270) bps Number of communities (period end) 84 75 75 68 68 68 68 68 68 68 — — Period end number of units 15,045 13,559 13,550 12,419 12,419 12,430 12,460 12,511 12,514 12,514 0.8 % 0.8 % Total Average Units 15,045 15,083 13,553 12,973 14,164 12,430 12,440 12,511 12,514 12,474 (3.5)% (11.9)% RevPAR $ 3,509 $ 3,520 $ 3,557 $ 3,537 $ 3,530 $ 3,602 $ 3,592 $ 3,581 $ 3,545 $ 3,580 0.2 % 1.4 % Weighted average occupancy 87.7% 88.1% 89.5% 90.0% 88.8% 89.8% 89.1% 89.1% 88.7% 89.2% (130) bps 40 bps RevPOR $ 4,004 $ 3,993 $ 3,973 $ 3,930 $ 3,977 $ 4,012 $ 4,033 $ 4,018 $ 3,994 $ 4,014 1.6 % 0.9 % Assisted Living and Memory Care Revenue $532,280 $522,027 $483,125 $458,419 $1,995,851 $458,526 $450,225 $452,474 $454,713 $1,815,938 (0.8)% (9.0)% Segment Operating Income $176,538 $169,737 $144,701 $138,006 $ 628,982 $140,699 $133,144 $116,856 $127,937 $ 518,636 (7.3)% (17.5)% Segment Operating Margin 33.2% 32.5% 30.0% 30.1% 31.5% 30.7% 29.6% 25.8% 28.1% 28.6% (200) bps (290) bps Number of communities (period end) 681 645 627 593 593 586 577 577 573 573 (3.4)% (3.4)% Period end number of units 44,728 41,266 39,725 37,500 37,500 36,944 36,175 36,177 35,956 35,956 (4.1)% (4.1)% Total Average Units 44,773 44,403 40,933 38,807 42,229 37,477 36,451 36,173 36,140 36,560 (6.9)% (13.4)% RevPAR $ 3,963 $ 3,919 $ 3,934 $ 3,937 $ 3,939 $ 4,070 $ 4,092 $ 4,127 $ 4,135 $ 4,106 5.0 % 4.2 % Weighted average occupancy 83.4% 82.9% 82.7% 82.7% 83.0% 81.6% 82.1% 83.2% 83.6% 82.6% 90 bps (40) bps RevPOR $ 4,750 $ 4,725 $ 4,755 $ 4,759 $ 4,747 $ 4,988 $ 4,987 $ 4,962 $ 4,948 $ 4,971 4.0 % 4.7 % CCRCs Revenue $105,069 $104,796 $104,147 $102,396 $ 416,408 $103,727 $101,253 $100,104 $ 97,091 $ 402,175 (5.2)% (3.4)% Segment Operating Income $ 24,663 $ 23,819 $ 21,809 $ 21,921 $ 92,212 $ 21,637 $ 17,847 $ 14,472 $ 18,116 $ 72,072 (17.4)% (21.8)% Segment Operating Margin 23.5% 22.7% 20.9% 21.4% 22.1% 20.9% 17.6% 14.5% 18.7% 17.9% (270) bps (420) bps Number of communities (period end) 27 28 27 26 26 26 26 26 22 22 (15.4)% (15.4)% Period end number of units 6,582 6,884 6,734 6,573 6,573 6,574 6,574 6,574 5,711 5,711 (13.1)% (13.1)% Total Average Units 6,739 6,856 6,884 6,627 6,777 6,553 6,574 6,574 6,167 6,467 (6.9)% (4.6)% RevPAR $ 5,172 $ 5,079 $ 5,024 $ 5,128 $ 5,100 $ 5,232 $ 5,081 $ 5,012 $ 5,168 $ 5,123 0.8 % 0.5 % Weighted average occupancy 84.1% 83.0% 82.6% 83.1% 83.2% 82.9% 80.6% 80.4% 81.5% 81.3% (160) bps (190) bps RevPOR $ 6,160 $ 6,115 $ 6,082 $ 6,172 $ 6,132 $ 6,312 $ 6,305 $ 6,234 $ 6,341 $ 6,298 2.7 % 2.7 % 9


Senior Housing: Same Community (1) 4Q19 vs. Full Year Consolidated 2018 2019 4Q18 19 vs. 18 ($ in 000s, except RevPAR and RevPOR) 1Q 2Q 3Q 4Q Full Year 1Q 2Q 3Q 4Q Full Year B(W) B(W) Revenue $ 612,326 $ 605,701 $ 608,018 $ 607,802 $2,433,847 $ 622,525 $ 617,296 $ 619,109 $ 620,419 $2,479,349 2.1 % 1.9 % Community Labor Expense (262,498) (263,133) (271,739) (271,417) (1,068,787) (273,175) (276,254) (290,056) (288,581) (1,128,066) (6.3) % (5.5) % Other facility operating expense (136,686) (136,911) (140,129) (142,513) (556,239) (143,235) (145,286) (150,547) (140,766) (579,834) 1.2 % (4.2) % Facility operating expense (2) (399,184) (400,044) (411,868) (413,930) (1,625,026) (416,410) (421,540) (440,603) (429,347) (1,707,900) (3.7) % (5.1) % Same Community Operating Income $213,142 $205,657 $196,150 $193,872 $ 808,821 $206,115 $195,756 $178,506 $191,072 $ 771,449 (1.4) % (4.6) % Same Community Operating Margin 34.8% 34.0% 32.3% 31.9% 33.2% 33.1% 31.7% 28.8% 30.8% 31.1% (110) bps (210) bps Total Average Units 49,802 49,800 49,795 49,793 49,797 49,767 49,775 49,783 49,783 49,777 — — RevPAR $ 4,096 $ 4,052 $ 4,068 $ 4,065 $ 4,070 $ 4,167 $ 4,131 $ 4,143 $ 4,151 $ 4,148 2.1 % 1.9 % Weighted average occupancy 85.6% 85.1% 85.4% 85.2% 85.3% 84.3% 83.9% 84.7% 85.0% 84.5% (20) bps (80) bps RevPOR $ 4,786 $ 4,764 $ 4,762 $ 4,768 $ 4,770 $ 4,941 $ 4,922 $ 4,893 $ 4,885 $ 4,910 2.5 % 2.9 % (2) Same Community Operating Income / Weighted Average Occupancy Same Community RevPAR $4,167 $4,143 $4,151 85.6% $4,131 85.4% 85.2% $4,096 85.1% 85.0% $4,068 $4,065 84.7% $4,052 84.3% 83.9% $213,142 $205,657 $206,115 $196,150 $193,872 $195,756 $191,072 $178,506 1Q 2018 2Q 2018 3Q 2018 4Q 2018 1Q 2019 2Q 2019 3Q 2019 4Q 2019 1Q 2018 2Q 2018 3Q 2018 4Q 2018 1Q 2019 2Q 2019 3Q 2019 4Q 2019 (1) Same Community portfolio reflects 637 communities. (2) Excludes hurricane and natural disaster expense of $1.2 million and $2.5 million for the full year 2018 and 2019, respectively. 10


Senior Housing Segments: Same Community (1) 4Q19 vs. Full Year Consolidated 2018 2019 4Q18 19 vs. 18 ($ in 000s, except RevPAR and RevPOR) 1Q 2Q 3Q 4Q Full Year 1Q 2Q 3Q 4Q Full Year B(W) B(W) Independent Living Revenue $115,124 $115,228 $115,887 $116,679 $ 462,918 $119,042 $118,701 $118,981 $117,932 $ 474,656 1.1 % 2.5 % Community Labor Expense (40,217) (40,943) (41,156) (41,396) (163,712) (41,488) (42,652) (43,243) (43,117) (170,500) (4.2 )% (4.1 )% Other facility operating expense (27,284) (26,960) (27,809) (28,793) (110,846) (28,619) (28,969) (29,845) (28,395) (115,828) 1.4 % (4.5 )% Facility operating expense (67,501) (67,903) (68,965) (70,189) (274,558) (70,107) (71,621) (73,088) (71,512) (286,328) (1.9 )% (4.3 )% Same Community Operating Income $ 47,623 $ 47,325 $ 46,922 $ 46,490 $ 188,360 $ 48,935 $ 47,080 $ 45,893 $ 46,420 $ 188,328 (0.2 )% — Same Community Operating Margin 41.4% 41.1% 40.5% 39.8% 40.7% 41.1% 39.7% 38.6% 39.4% 39.7% (40) bps (100) bps Total Average Units 11,079 11,080 11,074 11,072 11,076 11,048 11,057 11,068 11,071 11,061 — (0.1 )% RevPAR $ 3,464 $ 3,467 $ 3,488 $ 3,513 $ 3,483 $ 3,592 $ 3,578 $ 3,583 $ 3,551 $ 3,576 1.1 % 2.7 % Weighted average occupancy 88.7% 89.1% 89.9% 90.5% 89.6% 90.1% 89.5% 89.9% 89.4% 89.7% (110) bps 10 bps RevPOR $ 3,904 $ 3,892 $ 3,879 $ 3,882 $ 3,889 $ 3,987 $ 3,998 $ 3,987 $ 3,972 $ 3,986 2.3 % 2.5 % Assisted Living and Memory Care Revenue $425,149 $419,951 $420,985 $418,737 $1,684,822 $430,388 $427,602 $429,958 $431,010 $1,718,958 2.9 % 2.0 % Community Labor Expense (186,672) (186,661) (194,078) (192,951) (760,362) (194,208) (195,938) (208,578) (207,581) (806,305) (7.6) % (6.0) % Other facility operating expense (92,650) (92,873) (94,833) (96,293) (376,649) (96,637) (98,467) (102,346) (94,592) (392,042) 1.8 % (4.1) % Facility operating expense (279,322) (279,534) (288,911) (289,244) (1,137,011) (290,845) (294,405) (310,924) (302,173) (1,198,347) (4.5) % (5.4) % Same Community Operating Income $145,827 $140,417 $132,074 $129,493 $ 547,811 $139,543 $133,197 $119,034 $ 128,837 $ 520,611 (0.5) % (5.0) % Same Community Operating Margin 34.3% 33.4% 31.4% 30.9% 32.5% 32.4% 31.1% 27.7% 29.9% 30.3% (100) bps (220) bps Total Average Units 34,465 34,462 34,463 34,463 34,463 34,462 34,461 34,458 34,458 34,460 — — RevPAR $ 4,112 $ 4,062 $ 4,072 $ 4,050 $ 4,074 $ 4,163 $ 4,136 $ 4,159 $ 4,169 $ 4,157 2.9 % 2.0 % Weighted average occupancy 84.6% 84.0% 84.1% 83.7% 84.1% 82.5% 82.4% 83.4% 83.9% 83.1% 20 bps (100) bps RevPOR $ 4,859 $ 4,838 $ 4,839 $ 4,838 $ 4,844 $ 5,044 $ 5,019 $ 4,988 $ 4,970 $ 5,005 2.7 % 3.3 % CCRCs Revenue $ 72,053 $ 70,522 $ 71,146 $ 72,386 $ 286,107 $ 73,095 $ 70,993 $ 70,170 $ 71,477 $ 285,735 (1.3) % (0.1) % Community Labor Expense (35,609) (35,529) (36,505) (37,070) (144,713) (37,479) (37,664) (38,235) (37,883) (151,261) (2.2) % (4.5) % Other facility operating expense (16,752) (17,078) (17,487) (17,427) (68,744) (17,979) (17,850) (18,356) (17,779) (71,964) (2.0) % (4.7) % Facility operating expense (52,361) (52,607) (53,992) (54,497) (213,457) (55,458) (55,514) (56,591) (55,662) (223,225) (2.1) % (4.6) % Same Community Operating Income $ 19,692 $ 17,915 $ 17,154 $ 17,889 $ 72,650 $ 17,637 $ 15,479 $ 13,579 $ 15,815 $ 62,510 (11.6) % (14.0) % Same Community Operating Margin 27.3% 25.4% 24.1% 24.7% 25.4% 24.1% 21.8% 19.4% 22.1% 21.9% (260) bps (350) bps Total Average Units 4,258 4,258 4,258 4,258 4,258 4,257 4,257 4,257 4,254 4,256 — — RevPAR $ 5,613 $ 5,494 $ 5,540 $ 5,631 $ 5,570 $ 5,693 $ 5,530 $ 5,463 $ 5,563 $ 5,562 (1.2) % (0.1) % Weighted average occupancy 85.2% 83.6% 83.9% 84.2% 84.2% 84.1% 81.9% 81.6% 82.1% 82.4% (210) bps (180) bps RevPOR $ 6,590 $ 6,571 $ 6,606 $ 6,676 $ 6,611 $ 6,770 $ 6,756 $ 6,698 $ 6,766 $ 6,748 1.3 % 2.1 % (1) Same Community portfolio reflects 62 Independent Living communities, 558 Assisted Living and Memory Care communities, and 17 CCRC communities. 11


Senior Housing Owned Portfolio 4Q19 vs. Full Year Consolidated 2018 2019 4Q18 19 vs. 18 ($ in 000s, except RevPAR and RevPOR) 1Q 2Q 3Q 4Q Full Year 1Q 2Q 3Q 4Q Full Year B(W) B(W) Resident fee revenue $ 383,910 $ 388,108 $387,585 $382,533 $1,542,136 $380,691 $375,900 $377,451 $373,793 $1,507,835 (2.3)% (2.2)% Facility operating expense (260,673) (265,066) (273,881) (270,659) (1,070,279) (269,078) (271,222) (285,422) (273,557) (1,099,279) (1.1)% (2.7)% Owned Portfolio Operating Income 123,237 123,042 113,704 111,874 471,857 111,613 104,678 92,029 100,236 408,556 (10.4)% (13.4)% G&A portfolio allocation (see page 16) (16,616) (14,924) (15,061) (14,641) (61,242) (15,693) (16,875) (15,759) (13,553) (61,880) 7.4 % (1.0)% Owned Portfolio Operating Income (Adjusted to include G&A portfolio allocation) $106,621 $108,118 $ 98,643 $ 97,233 $ 410,615 $ 95,920 $ 87,803 $ 76,270 $ 86,683 $ 346,676 (10.9)% (15.6)% Additional Information Interest expense: property level and corporate debt $ (45,727) $ (48,967) $ (46,891) $ (46,920) $ (188,505) $ (45,643) $ (45,193) $ (44,344) $ (42,538) $ (177,718) 9.3 % 5.7 % Community level capital expenditures, net (see page 17) $ (19,474) $ (18,295) $ (16,126) $ (18,972) $ (72,867) $ (24,967) $ (33,828) $ (33,144) $ (32,055) $ (123,994) (69.0)% (70.2)% Number of communities (period end) 358 363 363 344 344 338 336 336 330 330 (4.1)% (4.1)% Period end number of units 32,417 33,287 33,359 31,869 31,869 31,397 31,165 31,226 30,160 30,160 (5.4)% (5.4)% Total Average Units 32,549 33,255 33,338 33,062 33,051 31,840 31,262 31,222 30,784 31,277 (6.9)% (5.4)% RevPAR $ 3,932 $ 3,890 $ 3,875 $ 3,857 $ 3,888 $ 3,969 $ 3,976 $ 3,982 $ 3,984 $ 3,978 3.3 % 2.3 % Weighted average occupancy 84.3% 83.9% 84.0% 83.5% 83.9% 82.4% 82.6% 83.2% 83.6% 83.0% 10 bps (90) bps RevPOR $ 4,664 $ 4,637 $ 4,613 $ 4,619 $ 4,634 $ 4,815 $ 4,812 $ 4,783 $ 4,764 $ 4,794 3.1 % 3.5 % As of December 31, 2019 Interest Coverage 1.9x Net Debt (see page 20) $ 3,245,470 12


Senior Housing Leased Portfolio 4Q19 vs. Full Year Consolidated 2018 2019 4Q18 19 vs. 18 ($ in 000s, except RevPAR and RevPOR) 1Q 2Q 3Q 4Q Full Year 1Q 2Q 3Q 4Q Full Year B(W) B(W) Resident fee revenue $ 411,836 $ 398,008 $ 344,318 $ 315,938 $1,470,100 $ 317,256 $ 311,529 $ 312,001 $ 314,050 $1,254,836 (0.6)% (14.6)% Facility operating expense (269,450) (262,360) (234,406) (213,938) (980,154) (213,657) (213,757) (223,288) (218,241) (868,943) (2.0)% 11.3 % Leased Portfolio Operating Income 142,386 135,648 109,912 102,000 489,946 103,599 97,772 88,713 95,809 385,893 (6.1)% (21.2)% G&A portfolio allocation (see page 16) (17,824) (16,015) (13,380) (12,092) (59,311) (13,078) (13,986) (13,027) (11,387) (51,478) 5.8 % 13.2 % Leased Portfolio Operating Income (Adjusted to include G&A portfolio allocation) $124,562 $119,633 $ 96,532 $ 89,908 $430,635 $ 90,521 $ 83,786 $ 75,686 $ 84,422 $334,415 (6.1)% (22.3)% Additional Information Total cash facility lease payments on leased portfolio (see page 18) $(127,302) $(122,004) $(103,030) $ (94,090) $(446,426) $ (93,129) $ (92,337) $ (92,337) $ (92,810) $ (370,613) 1.4 % 17.0 % Community level capital expenditures, net (see page 17) $ (14,474) $ (15,159) $ (13,756) $ (12,530) $ (55,919) $ (18,419) $ (25,934) $ (22,162) $ (13,347) $ (79,862) (6.5)% (42.8)% Number of communities (period end) 434 385 366 343 343 342 335 335 333 333 (2.9)% (2.9)% Period end number of units 33,938 28,422 26,650 24,623 24,623 24,551 24,044 24,036 24,021 24,021 (2.4)% (2.4)% Total Average Units 34,008 33,087 28,032 25,345 30,119 24,620 24,203 24,036 24,037 24,224 (5.2)% (19.6)% RevPAR $ 4,032 $ 4,006 $ 4,090 $ 4,149 $ 4,063 $ 4,274 $ 4,254 $ 4,273 $ 4,286 $ 4,271 3.3 % 5.1 % Weighted average occupancy 84.6% 84.3% 84.5% 85.6% 84.7% 85.0% 84.5% 85.4% 85.6% 85.1% — 40 bps RevPOR $ 4,766 $ 4,752 $ 4,840 $ 4,847 $ 4,797 $ 5,028 $ 5,032 $ 5,004 $ 5,005 $ 5,017 3.3 % 4.6 % Lease Coverage as of December 31, 2019 0.88x Total operating and financing lease obligations (1) $2,225,845 (A) Total operating and financing lease obligations divided by total cash facility lease payments for the full year 2019 6.0 (A/B) Facility Lease Maturity Information as of December 31, 2019 Full Year 2019 Initial lease maturities Community count Total units Total cash facility lease payments 2020 38 1,714 $ 17,093 2021 4 445 6,486 2022 5 483 5,166 2023 4 889 17,900 2024 16 1,324 19,668 2025 122 10,323 177,781 Thereafter 144 8,843 125,053 Total 333 24,021 $ 369,147 (B) (1)Amount recognized on consolidated balance sheet reflects discounted future minimum lease payments and the residual value for financing lease obligations. Excludes operating lease obligations related to certain non-facility leases for which the related lease expense is included in Adjusted EBITDAR and corporate office and information technology leases. 13


New Supply Brookdale's Largest 20 Markets - Competitive Summary 4Q 2019 Weighted Average Occupancy Quadrant with highest demographic60 growth% & lowest new openings 90.3% Portland ) 86.2% 84.7% 1 ( 55% 85.4% Charlotte Denver h t Seattle w 79.9% o r Colorado Springs 83.7% G Austin 83.1% + k 50% Jacksonville 0 5 88.8% $ Phoenix h t 89.3% i 80.4% 89.6% 80.7% 77.0% w Orlando Detroit Kansas City Dallas Houston n 45% o i t a l u 74.7% p o San Antonio 83.0% 90.3% P 40% Sarasota Riverside + 83.3% 5 7 Cleveland e g 81.0% A Miami d e 35% t c 84.2% e j Los Angeles o r P 87.8% r Chicago Y 30% 5 25% 0% 2% 4% 6% 8% 10% 12% 14% 16% 1 Yr Projected Unit Opens % of Supply (2) Brookdale in NIC Markets 4Q19 Weighted Avg. 5YrProjected Avg 75+ Pop 1YrProjected Unit Opens as Occupancy (1) with $50K+ Growth (2) % of Supply (3) Brookdale Largest 20 Markets 84.8% 44.0% 4.8% All Other NIC Markets 84.3% 40.6% 4.1% (1) Brookdale proprietary data represents its consolidated senior housing portfolio. (2) ESRI data 2019-2024; Brookdale. (3) NIC MAP Supply Set, 4Q19 "New Construction" offering same-product with projected open dates through 4Q20; one year same product projected openings as a percent of current same-product supply within 20 minutes of Brookdale communities. 14


Health Care Services Consolidated 4Q19 vs. Full Year ($ in 000s) 2018 2019 4Q18 19 vs. 18 1Q 2Q 3Q 4Q Full Year 1Q 2Q 3Q 4Q Full Year B(W) B(W) Resident fee revenue Home health $ 85,490 $ 83,818 $ 81,722 $ 81,033 $ 332,063 $ 84,185 $ 85,233 $ 80,632 $ 77,440 $327,490 (4.4)% (1.4)% Hospice 19,327 19,676 20,574 21,257 80,834 21,722 23,184 25,258 26,062 96,226 22.6 % 19.0 % Outpatient therapy 5,685 6,359 5,980 6,036 24,060 5,625 6,017 5,895 6,007 23,544 (0.5)% (2.1)% Other health care services 18 — — — 18 — — — — — — (100.0)% Segment resident fee revenue 110,520 109,853 108,276 108,326 436,975 111,532 114,434 111,785 109,509 447,260 1.1 % 2.4 % Facility operating expense (102,202) (99,650) (98,789) (102,254) (402,895) (103,359) (105,267) (107,007) (106,640) (422,273) (4.3)% (4.8)% Segment Operating Income (Loss) $ 8,318 $ 10,203 $ 9,487 $ 6,072 $ 34,080 $ 8,173 $ 9,167 $ 4,778 $ 2,869 $ 24,987 (52.8)% (26.7)% Segment Operating Margin 7.5% 9.3% 8.8% 5.6 % 7.8% 7.3% 8.0% 4.3 % 2.6 % 5.6 % (300) bps (220) bps G&A allocation (see page 16) (7,113) (6,990) (6,629) (8,587) (29,319) (7,077) (6,730) (6,385) (5,439) (25,631) 36.7 % 12.6 % Segment Operating Income (Loss) (Adjusted to include G&A allocation) $ 1,205 $ 3,213 $ 2,858 $ (2,515) $ 4,761 $ 1,096 $ 2,437 $ (1,607) $ (2,570) $ (644) (2.2)% NM Segment Operating Margin (Adjusted to include G&A allocation) 1.1% 2.9% 2.6% (2.3)% 1.1% 1.0% 2.1% (1.4)% (2.3)% (0.1)% — (120) bps Additional Information Home health average daily census 15,497 15,238 14,890 15,335 15,238 15,904 15,966 15,357 14,618 15,457 (4.7)% 1.4 % Hospice average daily census 1,302 1,337 1,411 1,386 1,359 1,428 1,540 1,642 1,704 1,580 22.9 % 16.3 % Outpatient therapy treatment codes 167,170 176,065 168,569 171,544 683,348 158,543 169,924 171,578 180,834 680,879 5.4 % (0.4)% 15


G&A Expense Consolidated, unless otherwise noted 4Q19 vs. Full Year ($ in 000s) 2018 2019 4Q18 19 vs. 18 1Q 2Q 3Q 4Q Full Year 1Q 2Q 3Q 4Q Full Year B(W) B(W) G&A expense allocations (1) Senior Housing Owned Portfolio allocation $ 16,616 $ 14,924 $ 15,061 $ 14,641 $ 61,242 $ 15,693 $ 16,875 $ 15,759 $ 13,553 $ 61,880 7.4 % (1.0)% Senior Housing Leased Portfolio allocation 17,824 16,015 13,380 12,092 59,311 13,078 13,986 13,027 11,387 51,478 5.8% 13.2% Health Care Services allocation 7,113 6,990 6,629 8,587 29,319 7,077 6,730 6,385 5,439 25,631 36.7% 12.6% Management Services allocation 14,320 13,703 14,470 12,953 55,446 13,646 13,321 11,399 8,901 47,267 31.3% 14.8% Subtotal G&A expense allocations 55,873 51,632 49,540 48,273 205,318 49,494 50,912 46,570 39,280 186,256 18.6% 9.3% Non-cash stock-based compensation expense 8,406 6,269 6,035 5,357 26,067 6,356 6,030 5,929 4,711 23,026 12.1% 11.7% Transaction and Organizational Restructuring Costs 17,156 5,006 3,221 2,707 28,090 461 634 3,910 5,002 10,007 (84.8%) 64.4% General and administrative expense $ 81,435 $ 62,907 $ 58,796 $ 56,337 $ 259,475 $ 56,311 $ 57,576 $ 56,409 $ 48,993 $ 219,289 13.0 % 15.5 % 4Q19 vs. Full Year 2018 2019 4Q18 19 vs. 18 1Q 2Q 3Q 4Q Full Year 1Q 2Q 3Q 4Q Full Year B(W) B(W) Resident fee revenue $ 906,266 $ 895,969 $ 840,179 $ 806,797 $3,449,211 $ 809,479 $ 801,863 $ 801,237 $ 797,352 $3,209,931 (1.2)% (6.9)% Resident fee revenue under management (2) 394,392 357,469 384,984 359,861 1,496,706 321,952 294,114 275,796 259,437 1,151,299 (27.9)% (23.1)% Total (consolidated and under management) $1,300,658 $1,253,438 $1,225,163 $1,166,658 $4,945,917 $1,131,431 $1,095,977 $1,077,033 $1,056,789 $4,361,230 (9.4)% (11.8)% Allocated G&A Expense as a Percentage of Resident Fee Revenue (Consolidated and Under Management) G&A expense (excluding non-cash stock- based compensation expense and Transaction and Organizational Restructuring Costs) 4.3 % 4.1 % 4.0 % 4.1 % 4.2 % 4.4 % 4.6 % 4.3 % 3.7 % 4.3 % 40 bps (10) bps Non-cash stock-based compensation expense 0.6 % 0.5 % 0.5 % 0.5 % 0.5 % 0.6 % 0.6 % 0.6 % 0.4 % 0.5 % 10 bps — G&A expense (excluding Transaction and Organizational Restructuring Costs) 4.9 % 4.6 % 4.5 % 4.6 % 4.7 % 5.0 5.2 % 4.9 % 4.1 % 4.8 % 50 bps (10) bps Transaction and Organizational Restructuring Costs 1.4 % 0.4 % 0.3 % 0.2 % 0.6 % — 0.1 % 0.4 % 0.5 % 0.2 % (30) bps 40 bps G&A expense (including non-cash stock- based compensation expense and Transaction and Organizational Restructuring Costs) 6.3% 5.0% 4.8% 4.8% 5.2% 5.0% 5.3% 5.2% 4.6% 5.0% 20 bps 20 bps (1) G&A allocations are calculated using a methodology which the Company believes matches the type of general and administrative cost with the community, segment, or portfolio. Some of the allocations are based on direct utilization and some are based on formulas such as unit proportion. G&A allocations presented herein exclude non-cash stock-based compensation expense and Transaction and Organizational Restructuring Costs. (2) Not included in consolidated reported amounts. 16


Capital Expenditures 4Q19 vs. Full Year Consolidated 2018 2019 4Q18 19 vs. 18 ($ in 000s, except for community level capital expenditures, net, per weighted average unit) 1Q 2Q 3Q 4Q Full Year 1Q 2Q 3Q 4Q Full Year B(W) B(W) Community level capital expenditures, including allocations (1) Senior Housing Owned Portfolio $ 19,474 $ 18,295 $ 16,126 $ 18,972 $ 72,867 $ 24,967 $ 33,828 $ 33,144 $ 32,055 $ 123,994 (69.0) % (70.2) % Senior Housing Leased Portfolio 14,474 15,159 13,756 12,530 55,919 18,419 25,934 22,162 13,347 79,862 (6.5) % (42.8) % Community level capital expenditures, net (A) 33,948 33,454 29,882 31,502 128,786 43,386 59,762 55,306 45,402 203,856 (44.1) % (58.3) % Corporate capital expenditures (includes Health Care Services) 7,788 14,227 11,393 20,055 53,463 11,216 6,702 3,815 10,208 31,941 49.1 % 40.3 % Non-Development Capital Expenditures, net 41,736 47,681 41,275 51,557 182,249 54,602 66,464 59,121 55,610 235,797 (7.9) % (29.4) % Development Capital Expenditures, net 5,381 8,009 6,694 4,603 24,687 5,269 5,354 8,054 5,918 24,595 (28.6) % 0.4 % Total capital expenditures, net $ 47,117 $ 55,690 $ 47,969 $ 56,160 $206,936 $59,871 $71,818 $67,175 $61,528 $260,392 (9.6) % (25.8) % Lessor reimbursements: non-development capital expenditures 1,764 — — 10,401 12,165 — 1,000 11,043 22,766 34,809 Lessor reimbursements: development capital expenditures 615 80 1,014 — 1,709 — — — — — Change in related payables 17,096 (1,904) (92) (10,437) 4,663 184 (10,576) 5,870 13,413 8,891 Total cash paid for capital expenditures $ 66,592 $ 53,866 $ 48,891 $ 56,124 $225,473 $60,055 $62,242 $84,088 $97,707 $304,092 (74.1) % (34.9) % Senior Housing Total Average Units (see page 8) (B) 66,557 66,342 61,370 58,407 63,170 56,460 55,465 55,258 54,821 55,501 (6.1) % (12.1) % Community level capital expenditures, net, per weighted average unit (A/B) $ 510 $ 504 $ 487 $ 539 $ 2,039 $ 768 $ 1,077 $ 1,001 $ 828 $ 3,673 (53.6) % (80.1) % (1) The Company updated its methodology for the allocations of community level capital expenditures during the third quarter of 2018. Prior period amounts of community level capital expenditures, net presented herein have been recast to conform to the new methodology. 17


Cash Facility Lease Payments 4Q19 vs. Full Year Consolidated 2018 2019 4Q18 19 vs. 18 ($ in 000s) 1Q 2Q 3Q 4Q Full Year 1Q 2Q 3Q 4Q Full Year B(W) B(W) Operating Lease Obligations Facility lease expense $ 80,400 $ 81,960 $ 70,392 $ 70,542 $ 303,294 $ 68,668 $ 67,689 $ 67,253 $ 66,056 $ 269,666 Operating lease expense adjustment 8,103 4,066 2,487 2,562 17,218 4,383 4,429 4,814 5,827 19,453 Amortization of deferred gain 1,090 1,089 1,090 1,089 4,358 — — — — — Cash facility operating lease payments $ 89,593 $ 87,115 $ 73,969 $ 74,193 $ 324,870 $ 73,051 72,118 72,067 71,883 289,119 3.1 % 11.0 % Financing Lease Obligations Interest expense: financing lease obligations $ 22,931 $ 22,389 $ 20,896 $ 17,388 $ 83,604 $ 16,743 $ 16,649 $ 16,567 $ 16,394 $ 66,353 Non-cash interest expense on financing lease obligations (3,383) (3,063) (2,705) (1,743) (10,894) — — — — — Payment of financing lease obligations 21,114 18,787 13,370 6,537 59,808 5,453 5,500 5,549 5,740 22,242 Cash financing lease payments $ 40,662 $ 38,113 $ 31,561 $ 22,182 $ 132,518 $ 22,196 $ 22,149 22,116 22,134 88,595 0.2 % 33.1 % Total cash facility lease payments (1) $130,255 $125,228 $105,530 $ 96,375 $457,388 $ 95,247 $ 94,267 $ 94,183 $ 94,017 $377,714 2.4 % 17.4% Interest Expense Reconciliation to Income Statement Interest expense: financing lease obligations $ 22,931 $ 22,389 $ 20,896 $ 17,388 $ 83,604 $ 16,743 $ 16,649 $ 16,567 $ 16,394 $ 66,353 Non-cash interest expense on financing lease obligations (3,383) (3,063) (2,705) (1,743) (10,894) — — — — — Interest expense: financing lease obligations - cash payments 19,548 19,326 18,191 15,645 72,710 16,743 16,649 16,567 16,394 66,353 (4.8) % 8.7 % Interest income (2,983) (2,941) (1,654) (2,268) (9,846) (3,084) (2,813) (2,162) (1,800) (9,859) (20.6 )% 0.1 % Interest expense: debt 45,727 48,967 46,891 46,920 188,505 45,643 45,193 44,344 42,538 177,718 9.3 % 5.7 % Interest expense, net 62,292 65,352 63,428 60,297 251,369 59,302 59,029 58,749 57,132 234,212 5.2 % 6.8 % Amortization of deferred financing costs and debt premium (discount) 3,956 2,328 829 644 7,757 831 959 1,130 1,137 4,057 Change in fair value of derivatives (74) 217 10 250 403 148 27 37 1 213 Non-cash interest expense on financing lease obligations 3,383 3,063 2,705 1,743 10,894 — — — — — Interest income 2,983 2,941 1,654 2,268 9,846 3,084 2,813 2,162 1,800 9,859 Interest expense per income statement $ 72,540 $ 73,901 $ 68,626 $ 65,202 $280,269 $ 63,365 $ 62,828 $ 62,078 $ 60,070 $248,341 7.9 % 11.4% (1) Includes cash lease payments for leases of corporate offices and information technology systems and equipment. 18


Unconsolidated Ventures 4Q 2019 Full Year 2019 ($ in 000s) Total CCRC Venture (1) Other Ventures Total Resident fee revenue $ 110,150 $ 109,456 $ 694 $ 436,314 Facility operating expense (83,388) (82,647) (741) (329,638) General and administrative expense including management fees (5,528) (5,491) (37) (22,029) Adjusted EBITDA of unconsolidated ventures 21,234 21,318 (84) 84,647 Interest expense, net (5,716) (5,615) (101) (24,031) Proceeds from entrance fees, net of refunds 14,464 14,464 — 62,887 Entrance fee amortization (10,301) (10,301) — (39,471) Changes in working capital (6,631) (6,760) 129 (5,454) Other 27 27 — (117) Community level capital expenditures, net (14,471) (14,457) (14) (44,146) Adjusted Free Cash Flow of unconsolidated ventures $ (1,394) $ (1,324) $ (70) $ 34,315 Additional Information Brookdale's weighted average unit ownership percentage (period end) 51.0% 51.0% 50.0% 51.0% Non-recourse Net Debt principal of unconsolidated ventures (period end) $ 515,636 $ 515,751 $ (115) $ 515,636 Number of communities (period end) 17 16 1 17 Total Average Units of unconsolidated ventures 7,306 7,270 36 7,354 Weighted average occupancy 85.8% 85.8% 90.7% 85.6% Brookdale's Proportionate Share of Unconsolidated Ventures Adjusted EBITDA $ 10,830 $ 10,872 $ (42) $ 42,627 Proceeds from entrance fees, net of refunds $ 7,377 $ 7,377 $ — $ 32,072 Entrance fee amortization $ (5,254) $ (5,254) $ — $ (20,130) Adjusted Free Cash Flow $ (710) $ (675) $ (35) $ 17,570 Non-recourse Net Debt principal (period end) $ 262,976 $ 263,033 $ (57) $ 262,976 Total Average Units 3,726 3,708 18 3,751 (1) On January 31, 2020, the Company sold its interest in the CCRC Venture as part of the Definitive Agreements with Healthpeak, see page 28 for additional information. 19


Capital Structure Total Liquidity Debt Structure (1) Debt ($ in millions) ($ in millions) ($ in millions) Maturity Weighted Rate Variable rate debt with 2020 (2) $ 339 5.32% interest rate caps $592 2021 333 5.99% $600 $530 Fixed rate 2022 321 4.32% $479 $481 $455 debt 2023 231 4.38% ) $1,129 s n $400 $2,322 o $413 i l l $340 i 2024 296 4.42% $309 32% M $315 ( $291 65% $ Thereafter 2,035 4.31% $200 Total $ 3,555 4.58% $179 $190 $164 $164 $172 $104 Variable rate $0 3% debt - unhedged (1) Includes the carrying value of mortgage debt and 12/31/2018 03/31/2019 06/30/2019 09/30/2019 12/31/2019 other notes payable. As of December 31, 2019 (2) Includes $28.9 million of mortgage notes payable Line of credit available to draw Weighted Rate secured by assets held for sale that generally will be Fixed rate debt 4.83% repaid with the proceeds from the sales. Variable rate debt (3) 4.10% Cash and cash equivalents and marketable securities (3) Reflects market rates as of December 31, 2019 and Total debt 4.58% applicable cap rates for hedged debt. (4) Leverage ratios include results of operations of communities disposed of through the disposition Leverage Ratios (4) ($ in 000s) date. (5) Excludes $23.1 million of the non-cash, non- Annualized recurring impact of ASC 842 (see page 4). Full Year 2019 Leverage (6) Excludes operating lease obligations related to Adjusted EBITDAR (5) (A) $ 713,392 certain non-facility leases for which the related lease expense is included in Adjusted EBITDAR. Cash facility operating lease payments (see page 18) (289,119) Adjusted EBITDA (5) 424,273 Important Note Regarding Non-GAAP Financial Measures. Adjusted EBITDAR, Adjusted EBITDA, Cash financing lease payments (see page 18) (88,595) Adjusted EBITDA after cash financing lease payments, Adjusted EBITDA after cash financing lease payments (5) (B) $ 335,678 Net Debt, and Adjusted Net Debt are financial measures that are not calculated in accordance with GAAP. See As of December 31, 2019 “Definitions” and “Non-GAAP Financial Measures” for the definitions of such measures and other important Debt $ 3,555,123 information regarding such measures, including Line of credit — reconciliations to the most comparable GAAP measures. Cash and cash equivalents (240,227) During the first quarter of 2019, the Company modified its definition of Adjusted Net Debt. See "Definitions" for Marketable securities (68,567) a description of the change. Restricted cash held as collateral against existing debt (859) Net Debt (C) 3,245,470 9.7x (C/B) Operating and financing lease obligations (6) 2,256,730 Adjusted Net Debt (D) $ 5,502,200 7.7x (D/A) 20


Pro-Forma Net Asset Value Elements Consolidated ($ in millions. Amounts are as of or for the year ended December 31, 2019 unless otherwise noted) Pro-Forma Senior Housing Owned Portfolio (1) Owned Portfolio Operating Income (Loss) (Including G&A assumption) (2) $ 380.1 Net Debt (see page 32) $ 3,199.6 Total Average Units 31,993 Pro-Forma Senior Housing Leased Portfolio (1) Leased Portfolio Operating Income (Loss) (Including G&A assumption) (2) $ 305.7 Total cash facility lease payments on leased portfolio $ (330.7) Total operating and financing lease obligations (see page 32) $ 1,993.4 Total operating and financing lease obligations divided by total cash facility lease payments for the year ended December 31, 2019 6.0 Total Average Units 21,421 Health Care Services Segment Operating Income (Loss) (including G&A assumption) (2) $ (0.6) Shares outstanding (excluding 7,252,459 unvested restricted shares) 184,876,127 (1) Reflects pro-forma results of operations, net debt, operating and financing lease obligations, and units after giving effect to completed and pending transactions. See pages 25-28 and 32 for information regarding the impact of such transactions. (2) G&A assumptions are calculated as 5% and approximately 6% of Senior Housing and Health Care Services resident fee revenue, respectively. 21


Definitions Adjusted EBITDA is a non-GAAP performance measure that the Company defines as net Brookdale’s Proportionate Share of Adjusted EBITDA of Unconsolidated Ventures income (loss) excluding: benefit/provision for income taxes, non-operating income/ is calculated based on the Company’s equity ownership percentage and in a manner expense items, and depreciation and amortization; and further adjusted to exclude consistent with the Company’s definition of Adjusted EBITDA for its consolidated entities. income/expense associated with non-cash, non-operational, transactional, cost The Company’s investments in unconsolidated ventures are accounted for under the reduction or organizational restructuring items that management does not consider as equity method of accounting and, therefore, the Company’s proportionate share of part of the Company’s underlying core operating performance and that management Adjusted EBITDA of unconsolidated ventures does not represent the Company’s equity believes impact the comparability of performance between periods. For the periods in earnings/loss of unconsolidated ventures on its consolidated statement of operations. presented herein, such other items include non-cash impairment charges, gain/loss on facility lease termination and modification, operating lease expense adjustment, amortization of deferred gain, change in future service obligation, non-cash stock-based Brookdale’s Proportionate Share of Adjusted Free Cash Flow of Unconsolidated compensation expense, and Transaction and Organizational Restructuring Costs. During Ventures is calculated based on the Company’s equity ownership percentage and in a the first quarter of 2019, the Company modified its definition of Adjusted EBITDA to manner consistent with the Company’s definition of Adjusted Free Cash Flow for its exclude Transaction and Organizational Restructuring Costs, and amounts for all periods consolidated entities. The Company’s investments in its unconsolidated ventures are herein reflect application of the modified definition. accounted for under the equity method of accounting and, therefore, the Company’s proportionate share of Adjusted Free Cash Flow of unconsolidated ventures does not represent cash available to the Company’s consolidated business except to the extent it Adjusted EBITDAR is a non-GAAP financial measure that the Company defines as is distributed to the Company. Adjusted EBITDA before cash facility operating lease payments. Combined Segment Operating Income is defined by the Company as resident fee and Adjusted Free Cash Flow is a non-GAAP liquidity measure that the Company defines as management fee revenue of the Company, less facility operating expense. Combined net cash provided by (used in) operating activities before: distributions from Segment Operating Income does not include general and administrative expense or unconsolidated ventures from cumulative share of net earnings, changes in prepaid depreciation and amortization. insurance premiums financed with notes payable, changes in operating lease liability for lease termination and modification, cash paid/received for gain/loss on facility lease Community Labor Expense is a component of facility operating expense that includes termination and modification, and lessor capital expenditure reimbursements under regular and overtime salaries and wages, bonuses, paid-time-off and holiday wages, operating leases; plus: property insurance proceeds and proceeds from refundable payroll taxes, contract labor, employee benefits, and workers compensation. entrance fees, net of refunds; less: Non-Development Capital Expenditures and payment Development Capital Expenditures means capital expenditures for community of financing lease obligations. During the first quarter of 2019, the Company modified its expansions, major community redevelopment and repositioning projects, and the definition of Adjusted Free Cash Flow to no longer adjust net cash provided by (used in) development of new communities. Amounts of Development Capital Expenditures are operating activities for changes in working capital items other than prepaid insurance presented net of lessor reimbursements. premiums financed with notes payable and lease liability for lease termination and modification, and amounts for all periods herein reflect application of the modified Interest Coverage is calculated based on the trailing-twelve months Owned Portfolio definition. Operating Income adjusted for an implied 5% management fee and capital expenditures at $350/unit, divided by the trailing-twelve months property level and corporate debt Adjusted Net Debt is a non-GAAP financial measure that the Company defines as Net interest expense. For any trailing-twelve month period that includes one or more periods Debt, plus operating and financing lease obligations. Operating and financing lease from 2019, an adjustment was made to exclude the impact of applying the new lease obligations exclude operating lease obligations related to certain non-facility leases for accounting standard under ASC 842 for residency agreements. which the related lease expense is included in Adjusted EBITDAR. During the first quarter Lease Coverage is calculated based on the trailing-twelve months Leased Portfolio of 2019, the Company modified its definition of Adjusted Net Debt to no longer adjust Operating Income, excluding resident fee revenue and facility operating expense of Net Debt by cash operating, capital, and financing lease payments multiplied by 8 and communities disposed during such period adjusted for an implied 5% management fee instead utilizes operating and financing lease obligations for facility leases recorded on and capital expenditures at $350/unit, divided by the trailing-twelve months cash facility the Company's balance sheet to derive Adjusted Net Debt. lease payments for both operating leases and financing leases, excluding cash lease payments for leases of communities disposed during such period, corporate offices, and information technology systems and equipment, vehicles and other equipment. For any trailing-twelve month period that includes one or more periods from 2019, an adjustment was made to exclude the impact of applying the new lease accounting standard under ASC 842 for residency agreements. 22


Definitions Leased Portfolio Operating Income is defined by the Company as resident fee revenue Same Community information reflects historical results from senior housing operations (excluding Health Care Services segment revenue), less facility operating expense for the for same store communities (utilizing the Company's methodology for determining same Company’s Senior Housing Leased Portfolio. Leased Portfolio Operating Income does not store communities which generally excludes assets held for sale, communities acquired include general and administrative expense (unless otherwise noted) or depreciation and or disposed since the beginning of the prior year, and certain communities that have amortization. undergone or are undergoing expansion, redevelopment, and repositioning projects), and for the 2019 period, excludes the additional resident fee revenue and facility Net Debt is a non-GAAP financial measure that the Company defines as the total of its operating expense recognized as a result of application of the new lease accounting debt (mortgage debt and other notes payable) and the outstanding balance on the line standard under ASC 842. of credit, less unrestricted cash, marketable securities, and cash held as collateral against existing debt. Same Community Operating Income is defined by the Company as resident fee revenue (excluding Health Care Services segment revenue and, for the 2019 period, the additional NM means not meaningful. resident fee revenue recognized as a result of application of the new lease accounting Non-Development Capital Expenditures is comprised of corporate and community- standard under ASC 842), less facility operating expense (excluding hurricane and natural level capital expenditures, including those related to maintenance, renovations, disaster expense and, for the 2019 period, the additional facility operating expense upgrades, and other major building infrastructure projects for the Company’s recognized as a result of application of the new lease accounting standard under ASC communities. Non-Development Capital Expenditures does not include capital 842) for the Company's Same Community portfolio. Same Community Operating Income expenditures for community expansions, major community redevelopment and does not include general and administrative expense or depreciation and amortization. repositioning projects, and the development of new communities (i.e., Development Segment Operating Income (Loss) is defined by the Company as segment revenue less Capital Expenditures). Amounts of Non-Development Capital Expenditures are presented segment facility operating expense. Segment Operating Income (Loss) does not include net of lessor reimbursements. general and administrative expense (unless otherwise noted) or depreciation and Owned Portfolio Operating Income is defined by the Company as resident fee revenue amortization. Management Services Segment Operating Income excludes revenue for (excluding Health Care Services segment revenue), less facility operating expense for the reimbursements for which the Company is the primary obligor of costs incurred on behalf Company’s Senior Housing Owned Portfolio. Owned Portfolio Operating Income does of managed communities, and there is no facility operating expense associated with the not include general and administrative expense (unless otherwise noted) or depreciation Management Services segment. See the Segment Information note to the Company’s and amortization. consolidated financial statements for more information regarding the Company’s segments. RevPAR, or average monthly senior housing resident fee revenue per available unit, is Senior Housing Leased Portfolio represents Brookdale leased communities and does defined by the Company as resident fee revenue for the corresponding portfolio for the rd period (excluding Health Care Services segment revenue and entrance fee amortization, not include owned, managed – 3 party, or managed – venture communities. and, for the 2019 period, the additional resident fee revenue recognized as a result of the Senior Housing Operating Income is defined by the Company as segment revenue less application of the new lease accounting standard under ASC 842), divided by the segment facility operating expense for the Company’s Independent Living, Assisted weighted average number of available units in the corresponding portfolio for the period, Living and Memory Care, and CCRCs segments on an aggregate basis. Senior Housing divided by the number of months in the period. Operating Income does not include general and administrative expense or depreciation RevPOR, or average monthly senior housing resident fee revenue per occupied unit, is and amortization. defined by the Company as resident fee revenue for the corresponding portfolio for the Senior Housing Owned Portfolio represents Brookdale owned communities and does period (excluding Health Care Services segment revenue and entrance fee amortization, not include leased, managed – 3rd party, or managed – venture communities. and, for the 2019 period, the additional resident fee revenue recognized as a result of the application of the new lease accounting standard under ASC 842), divided by the Total Average Units represents the average number of units operated during the period. weighted average number of occupied units in the corresponding portfolio for the period, divided by the number of months in the period. Transaction and Organizational Restructuring Costs are general and administrative expenses. Transaction costs include those directly related to acquisition, disposition, financing, and leasing activity, the Company’s assessment of options and alternatives to enhance stockholder value, and stockholder relations advisory matters, and are primarily comprised of legal, finance, consulting, professional fees, and other third party costs. Organizational restructuring costs include those related to the Company’s efforts to reduce general and administrative expense and its senior leadership changes, including severance and retention costs. 23


Appendices Pro-Forma Financial Information 25 Definitive Agreements with Healthpeak 28 Non-GAAP Financial Measures 29 24


Pro-Forma Financial Information During 2019, the Company disposed of an aggregate of 14 owned communities, terminated triple-net lease obligations on an aggregate of 10 communities, and transitioned management agreements on 105 net communities. During January 2020, the Company: • acquired eight communities under the terms of a purchase option (the pro-forma results on the following pages include an assumption that the Company will finance the acquisition with approximately $28 million of non-recourse mortgage debt at a 4% interest rate) • completed certain transactions under definitive agreements with Healthpeak announced on October 1, 2019. See page 28 for a summary of the transactions. During 2020, the Company additionally expects: • to close on the dispositions of three owned communities classified as held for sale as of December 31, 2019 • termination of its triple-net lease obligations on three communities for which it has provided notice of nonrenewal • termination of certain of its management arrangements, including management arrangements on certain former unconsolidated ventures in which the Company sold its interest and interim management arrangements on formerly leased communities. The pro-forma results on the following pages summarize the Company’s actual consolidated results excluding the impact of the new lease standard and the impact of transactions as follows: • The pro-forma table for the full year on page 26 reflects the Company’s actual consolidated results excluding the impact of the new lease standard for the full year 2019 and the impact on those results assuming that the foregoing completed and expected transactions had closed on December 31, 2018. • The pro-forma table for the fourth quarter of 2019 table on page 27 reflects the Company’s actual consolidated results excluding the impact of the new lease standard for the three months ended December 31, 2019 and the impact on those results assuming that the foregoing completed and expected transactions had closed on September 30, 2019. The pro-forma results on the following pages do not include adjustments for: • Communities for which the Company has exercised its right to direct Ventas to market for sale and, subject to Ventas' receipt of an agreed upon sale price on or before December 31, 2020 and the other customary closing conditions, would be removed from the Master Lease and Security Agreement between the Company and Ventas. • The Company's option to cause terminations of leases upon the sale by Welltower of communities with an aggregate of base rent of up to $5 million. The closings of the various pending and expected transactions described above are, or will be, subject to the satisfaction of various conditions, including (where applicable) the receipt of regulatory approvals; however, there can be no assurance that the transactions will close or, if they do, when the actual closings will occur. 25


Pro-Forma Full Year 2019 Amounts Attributable to the Amounts October 1, 2019 Attributable to Actual Results Amounts Announced Other Net of Amounts Attributable to Transactions with Transactions Attributable to Transactions Actual Results Healthpeak Completed or Less: Impact the New Lease Completed on Net of Amounts Completed or Expected to be of New Lease Standard and or before Attributable to Expected to be Completed after Standard on Completed and Full Year December 31, Completed Completed after December 31, Actual Results Pending Consolidated Actual Results 2019 Transactions December 31, 2019(1) 2019 (2) Transactions ($ in 000s) (A) (B) (A+B) (C) (D) (E) (A+B+C+D+E=F) Senior Housing weighted average units operated 55,501 (1,384) 54,117 — (703) — 53,414 Senior Housing revenue $ 2,762,671 $ (54,080) $ 2,708,591 $ — $ (35,402) $ (26,420) $ 2,646,769 Health Care Services revenue 447,260 — 447,260 — — — 447,260 Management fee revenue 57,108 (8,932) 48,176 (22,042) (6,554) — 19,580 Resident fee and management fee revenue 3,267,039 (63,012) 3,204,027 (22,042) (41,956) (26,420) 3,113,609 Facility operating expense (2,390,495) 52,377 (2,338,118) — 37,782 49,524 (2,250,812) General and administrative expense (3) (186,256) — (186,256) 5,000 — — (181,256) Cash facility operating lease payments (289,119) 1,694 (287,425) 11,063 2,468 — (273,894) Adjusted EBITDA 401,169 (8,941) 392,228 (5,979) (1,706) 23,104 407,647 Transaction and Organizational Restructuring Costs (10,007) — (10,007) — — — (10,007) Interest expense, net (234,212) 493 (233,719) 8,501 4,828 — (220,390) Payment of financing lease obligations (22,242) — (22,242) 3,877 771 — (17,594) Changes in working capital (4) 18,064 — 18,064 — — (23,104) (5,040) Other 6,621 (207) 6,414 — — — 6,414 Non-Development Capital Expenditures, net (235,797) 1,639 (234,158) 7,000 6,814 — (220,344) Adjusted Free Cash Flow $ (76,404) $ (7,016) $ (83,420) $ 13,399 $ 10,707 $ — $ (59,314) Cash facility operating and financing lease payments $ 377,714 $ (1,694) $ 376,020 $ (30,325) $ (7,872) $ — $ 337,823 (1) Does not include a payment of a $100 million management termination fee by Healthpeak to the Company. (2) See page 4 for more information on the adoption impact of the new lease standard. Actual results include the impact of the new lease standard. (3) Excludes non-cash stock-based compensation expense and Transaction and Organizational Restructuring Costs. Brookdale scales general and administrative expense following disposal of communities. This is reflected in actual results as they occur, with the exception of an estimate of the anticipated scaling as a result of the definitive agreements with Healthpeak which is included in column C. (4) The pro-forma adjustments do not include assumptions on the impact to changes in working capital. Actual Results Less Amounts Pro-forma (from column F above) Senior Housing Senior Housing Attributable to Completed and Owned and Leased Specifically Identifiable Information, Owned Leased Health Care Services Pending Transactions and Other Portfolio Portfolio and Other (from column F above) Weighted average units operated 31,993 21,421 — 53,414 Senior Housing and Health Care Services revenue $ 1,542,019 $ 1,104,750 $ 447,260 $ 3,094,029 Facility operating expense $ (1,084,770) $ (743,769) $ (422,273) $ (2,250,812) Total cash facility lease payments and interest expense, net $ (183,913) $ (330,722) $ 2,757 $ (511,878) Non-Development Capital Expenditures, net $ (129,282) $ (59,121) $ (31,941) $ (220,344) 26


Pro-Forma Fourth Quarter 2019 Amounts Attributable to the Amounts October 1, 2019 Attributable to Actual Results Announced Other Net of Amounts Amounts Transactions with Transactions Attributable to Attributable to Actual Results Healthpeak Completed or Less: Impact the New Lease Transactions Net of Amounts Completed or Expected to be of New Lease Standard and Completed Attributable to Expected to be Completed after Standard on Completed and 4Q19 Actual during Completed December 31, Actual Pending Completed after (1) Consolidated Results 4Q19 Transactions December 31, 2019 2019 Results Transactions ($ in 000s) (A) (B) (A+B) (C) (D) (E) (A+B+C+D+E) Senior Housing weighted average units operated 54,821 (643) 54,178 — (714) — 53,464 Senior Housing revenue $ 687,843 $ (6,344) $ 681,499 $ — $ (9,180) $ (10,383) $ 661,936 Health Care Services revenue 109,509 — 109,509 — — — 109,509 Management fee revenue 12,352 (309) 12,043 (5,557) (1,634) — 4,852 Resident fee and management fee revenue 809,704 (6,653) 803,051 (5,557) (10,814) (10,383) 776,297 Facility operating expense (598,438) 7,019 (591,419) — 9,408 14,533 (567,478) General and administrative expense (2) (39,280) — (39,280) 1,250 — — (38,030) Cash facility operating lease payments (71,883) 44 (71,839) 2,839 622 — (68,378) Adjusted EBITDA 100,103 410 100,513 (1,468) (784) 4,150 102,411 Transaction and Organizational Restructuring Costs (5,002) — (5,002) — — — (5,002) Interest expense, net (57,132) 62 (57,070) 2,101 1,139 — (53,830) Payment of financing lease obligations (5,740) — (5,740) 1,005 264 — (4,471) Changes in working capital (3) 20,410 — 20,410 — — (4,150) 16,260 Other 3,482 — 3,482 — — — 3,482 Non-Development Capital Expenditures, net (55,610) 570 (55,040) 1,750 1,139 — (52,151) Adjusted Free Cash Flow $ 511 $ 1,042 $ 1,553 $ 3,388 $ 1,758 $ — $ 6,699 (1) See page 4 for more information on the adoption impact of the new lease standard. Actual results include the impact of the new lease standard. (2) Excludes non-cash stock-based compensation expense and Transaction and Organizational Restructuring Costs. Brookdale scales general and administrative expense following disposal of communities. This is reflected in actual results as they occur, with the exception of an estimate of the anticipated scaling as a result of the definitive agreements with Healthpeak which is included in column C. (3) The pro-forma adjustments do not include assumptions on the impact to changes in working capital. 27


Definitive Agreements with Healthpeak On October 1, 2019, the Company and Healthpeak entered into several definitive agreements providing for multiple transactions, including a Master Transactions and Cooperation Agreement and Equity Interest Purchase Agreement. The parties subsequently amended the agreements to include one additional entry fee CCRC as part of the Company’s sale of its interest in the CCRC Venture (rather than removing the CCRC from the CCRC Venture for joint marketing and sale). – In January 2020, the parties moved two entry fee CCRCs (889 units) into a new unconsolidated venture on substantially the same terms as the CCRC Venture to accommodate the sale of such two communities at a future date. – Sale of the two entry fee CCRCs is expected to occur over the next 15 months. Unconsolidated CCRC – On January 31, 2020, Healthpeak acquired the Company's 51% ownership interest in the CCRC Venture, which held 14 entry fee CCRCs (6,383 units) Venture Transactions for a total purchase price of approximately $295.2 million (representing an aggregate valuation of $1.06 billion less portfolio debt, subject to an estimated net working capital adjustment), which remains subject to a post-closing net working capital adjustment. – At the closing, the parties terminated the Company's existing management agreements with the 14 entry fee CCRCs, Healthpeak paid the Company a $100.0 million management agreement termination fee, and the Company transitioned operations of the entry fee CCRCs to a new operator. – On January 31, 2020, the Company acquired 18 communities (2,014) units from Healthpeak, upon which time the 18 communities were removed from the former master lease. – At the closing, the Company paid $405.5 million to acquire such communities and to reduce its annual rent under the amended and restated master lease. Triple-Net Lease – The Company funded the community acquisitions with $192.6 million of non-recourse mortgage financing and the proceeds from the multi-part Transactions transaction. The Company expects to obtain approximately $30.0 million of additional non-recourse mortgage financing on the communities. – At the closing, the parties amended and restated the Company's existing master lease pursuant to which the Company continues to lease 25 communities (2,711 units) from Healthpeak – Healthpeak to fund up to $35 million of capital expenditures at market yield for a five-year period to reposition and improve assets. – In addition, Healthpeak has agreed to transition one leased community (159 units) to a successor operator. Pro-Forma Impact – The pro-forma financial information on pages 26 and 27 include the impacts related to these transactions with Healthpeak. 28


Non-GAAP Financial Measures This Supplemental Information contains the financial measures Adjusted EBITDA, Adjusted EBITDAR, Adjusted EBITDA after cash financing lease payments, Adjusted Free Cash Flow, Net Debt, and Adjusted Net Debt (each as defined in the “Definitions” section), which are not calculated in accordance with U.S. GAAP ("GAAP"). Presentations of these non-GAAP financial measures are intended to aid investors in better understanding the factors and trends affecting the Company’s performance and liquidity. However, investors should not consider these non-GAAP financial measures as a substitute for financial measures determined in accordance with GAAP, including net income (loss), income (loss) from operations, net cash provided by (used in) operating activities, short-term debt, long-term debt less current portion, or current portion of long-term debt. Investors are cautioned that amounts presented in accordance with the Company’s definitions of these non-GAAP financial measures may not be comparable to similar measures disclosed by other companies because not all companies calculate non-GAAP measures in the same manner. Investors are urged to review the reconciliations set forth in this Appendix of these non-GAAP financial measures from the most comparable financial measures determined in accordance with GAAP and to review the information under “Reconciliations of Non-GAAP Financial Measures” in the Company’s earnings release dated February 18, 2020 for additional information regarding the Company’s use and the limitations of such non-GAAP financial measures. During the first quarter of 2019, the Company modified its definition of Adjusted EBITDA to exclude Transaction and Organizational Restructuring Costs (these costs remain part of the Adjusted Free Cash Flow definition) and its definition of Adjusted Free Cash Flow to no longer adjust net cash provided by (used in) operating activities for changes in working capital items other than prepaid insurance premiums financed with notes payable and lease liability for lease termination and modification. Amounts for all periods herein reflect application of the modified definitions. 29


Non-GAAP Financial Measures (continued) Adjusted EBITDA Reconciliation Consolidated ($ in 000s) 2018 2019 1Q 2Q 3Q 4Q Full Year 1Q 2Q 3Q 4Q Full Year Net income (loss) $(457,234) $(165,509) $ (37,140) $ 131,531 $(528,352) $ (42,606) $ (56,055) $ (78,508) $ (91,323) $ (268,492) Provision (benefit) for income taxes 15,585 (15,546) (17,763) (31,732) (49,456) 679 633 (1,800) (1,781) (2,269) Equity in (earnings) loss of unconsolidated ventures 4,243 1,324 1,340 1,897 8,804 526 991 2,057 970 4,544 Debt modification and extinguishment costs 35 9 33 11,600 11,677 67 2,672 2,455 53 5,247 Loss (gain) on sale of assets, net (43,431) (23,322) (9,833) (216,660) (293,246) 702 (2,846) (579) (4,522) (7,245) Other non-operating (income) loss (2,586) (5,505) 17 (6,025) (14,099) (2,988) (3,199) (3,763) (4,815) (14,765) Interest expense 72,540 73,901 68,626 65,202 280,269 63,365 62,828 62,078 60,070 248,341 Interest income (2,983) (2,941) (1,654) (2,268) (9,846) (3,084) (2,813) (2,162) (1,800) (9,859) Income (loss) from operations (413,831) (137,589) 3,626 (46,455) (594,249) 16,661 2,211 (20,222) (43,148) (44,498) Depreciation and amortization 114,255 116,116 110,980 106,104 447,455 96,888 94,024 93,550 94,971 379,433 Goodwill and asset impairment 430,363 16,103 5,500 37,927 489,893 391 3,769 2,094 43,012 49,266 Loss (gain) on facility lease termination and modification, net — 146,467 2,337 13,197 162,001 209 1,797 — 1,382 3,388 Operating lease expense adjustment (8,103) (4,066) (2,487) (2,562) (17,218) (4,383) (4,429) (4,814) (5,827) (19,453) Amortization of deferred gain (1,090) (1,089) (1,090) (1,089) (4,358) — — — — — Non-cash stock-based compensation expense 8,406 6,269 6,035 5,357 26,067 6,356 6,030 5,929 4,711 23,026 Transaction and Organizational Restructuring Costs 17,156 5,006 3,221 2,707 28,090 461 634 3,910 5,002 10,007 Adjusted EBITDA (1) $ 147,156 $ 147,217 $ 128,122 $ 115,186 $ 537,681 $ 116,583 $ 104,036 $ 80,447 $ 100,103 $ 401,169 (1) Adoption of the new lease accounting standard effective January 1, 2019 had a non-recurring impact to the Company’s full-year 2019 Adjusted EBITDA. Adjusted EBITDA for the three months and year ended December 31, 2019 includes a negative net impact of $4.1 million and $23.1 million, respectively, from such adoption. 30


Non-GAAP Financial Measures (continued) Adjusted EBITDAR; Adjusted EBITDA; and Adjusted EBITDA after Cash Financing Lease Payments Reconciliations (excluding the new lease standard impact) Consolidated ($ in 000s) Full Year 2019 Net income (loss) $ (268,492) Provision (benefit) for income taxes (2,269) Equity in (earnings) loss of unconsolidated ventures 4,544 Debt modification and extinguishment costs 5,247 Loss (gain) on sale of assets, net (7,245) Other non-operating (income) loss (14,765) Interest expense 248,341 Interest income (9,859) Income (loss) from operations (44,498) Depreciation and amortization 379,433 Goodwill and asset impairment 49,266 Loss (gain) on facility lease termination and modification, net 3,388 Facility lease expense 269,666 Non-cash stock-based compensation expense 23,026 Transaction and Organizational Restructuring Costs 10,007 Impact from new lease standard 23,104 Adjusted EBITDAR (excluding the new lease standard impact) $ 713,392 Facility lease expense (269,666) Operating lease expense adjustment (19,453) Adjusted EBITDA (excluding the new lease standard impact) $ 424,273 Interest expense: financing lease obligations (66,353) Payment of financing lease obligations (22,242) Adjusted EBITDA after cash financing lease payments (excluding the new lease standard impact) $ 335,678 31


Non-GAAP Financial Measures (continued) Net Debt and Adjusted Net Debt Reconciliations Pro - Forma Amounts Attributable to the October 1, 2019 Announced Transactions Amounts Attributable to with Healthpeak Other Transactions Actual Amounts Net of Completed or Expected to Completed or Expected to Amounts Attributable to Consolidated As of December 31, be Completed after be Completed after Completed and Pending ($ in 000s) 2019 December 31, 2019 December 31, 2019 Transactions Long-term debt (including current portion) $ 3,555,123 $ 185,100 $ (900) $ 3,739,323 Line of credit — — Cash and cash equivalents (240,227) (217,000) (13,100) (470,327) Marketable securities (68,567) (68,567) Cash held as collateral against existing debt (859) (859) Net Debt 3,245,470 $ (31,900) (1) $ (14,000) (2) $ 3,199,570 Operating and financing lease obligations 2,305,345 Operating lease obligations related to certain non-facility leases for which the related lease expense is included in Adjusted EBITDAR (48,615) Adjusted Net Debt $ 5,502,200 Adjusted Net Debt to Adjusted EBITDAR 7.7x Net Debt to Adjusted EBITDA after cash financing lease payments 9.7x Operating and financing lease obligations $ 2,305,345 $ (182,700) (3) $ (49,700) $ 2,072,945 Operating lease obligations related to certain non-facility leases for which the related lease expense is included in Adjusted EBITDAR (48,615) — — (48,615) Operating lease obligations related to corporate office and information technology leases $ (30,885) — — $ (30,885) Operating and financing lease obligations for Senior Housing Leased Portfolio $ 2,225,845 $ (182,700) $ (49,700) $ 1,993,445 (1) See page 28 for a summary of the transactions and expected impact. (2) Amounts include $39.3 million paid for the acquisition of eight previously leased communities in January 2020, approximately $28 million of non-recourse mortgage financing on the communities expected to be obtained, and an estimate of the cash proceeds from sales of assets held for sale, net of associated debt repayments. (3) Amount includes an estimate of the impact of lease terminations and anticipated modifications to operating and financing lease obligations utilizing an estimated 8% incremental borrowing rate to estimate the present value of minimum lease payments. 32


Non-GAAP Financial Measures (continued) Adjusted Free Cash Flow Reconciliation Consolidated 2018 2019 ($ in 000s) 1Q 2Q 3Q 4Q Full Year 1Q 2Q 3Q Q4 Full Year Net cash provided by (used in) operating activities $ 37,964 $ 60,620 $ 71,924 $ 33,453 $ 203,961 $ (5,009) $ 64,128 $ 69,211 $ 88,082 $ 216,412 Net cash provided by (used in) provided by investing activities 91,155 (79,643) (24,539) 301,801 288,774 (100,073) 19,774 (70,056) (75,184) (225,539) Net cash provided by (used in) financing activities (16,104) (185,876) (37,949) (85,134) (325,063) (16,636) (87,443) (8,755) (26,560) (139,394) Net increase (decrease) in cash, cash equivalents and restricted cash $ 113,015 $ (204,899) $ 9,436 $ 250,120 $ 167,672 $ (121,718) $ (3,541) $ (9,600) $ (13,662) $ (148,521) Net cash provided by (used in) operating activities $ 37,964 $ 60,620 $ 71,924 $ 33,453 $ 203,961 $ (5,009) $ 64,128 $ 69,211 $ 88,082 $ 216,412 Distributions from unconsolidated ventures from cumulative share of net earnings (408) (739) (1,012) (737) (2,896) (749) (781) (858) (1,084) (3,472) Change in prepaid insurance premiums financed with notes payable 18,633 (6,208) (6,181) (6,244) — 18,842 (6,752) (6,215) (5,875) — Changes in operating lease liability related to lease termination — 33,596 — — 33,596 — — — — — Cash paid for loss on facility operating lease termination and modification, net — 13,044 — 8,000 21,044 — — — — — Changes in liabilities for lessor capital expenditure reimbursements under operating leases — — — (10,400) (10,400) — (1,000) (11,043) (19,262) (31,305) Non-development capital expenditures, net (41,736) (47,681) (41,275) (51,557) (182,249) (54,602) (66,464) (59,121) (55,610) (235,797) Property insurance proceeds 156 — — 1,136 1,292 — — — — — Payment of financing lease obligations (21,114) (18,787) (13,370) (6,537) (59,808) (5,453) (5,500) (5,549) (5,740) (22,242) Proceeds from refundable entrance fees, net of refunds 223 (171) (368) (106) (422) — — — — — Adjusted Free Cash Flow $ (6,282) $ 33,674 $ 9,718 $ (32,992) $ 4,118 $ (46,971) $ (16,369) $ (13,575) $ 511 $ (76,404) 33


Non-GAAP Financial Measures (continued) Brookdale's Proportionate Share of Adjusted EBITDA of Unconsolidated Ventures (1) For purposes of this presentation, amounts for each line item represent the aggregate amounts of such line items for all the Company's unconsolidated ventures. ($ in 000s) 2018 2019 1Q 2Q 3Q 4Q Full Year 1Q 2Q 3Q 4Q Full Year Net income (loss) $ (22,662) $ (13,417) $ (6,674) $ (3,810) $ (46,563) $ (1,050) $ (1,983) $ (4,156) $ (1,906) $ (9,095) Provision (benefit) for income taxes 234 209 64 6 513 24 23 18 (8) 57 Debt modification and extinguishment costs (17) 135 13 1 132 21 — — 5 26 Loss (gain) on sale of assets, net (1,045) 3,885 — — 2,840 — (23) 23 — — Other non-operating (income) loss (903) (967) (5) — (1,875) — — 78 (19) 59 Interest expense 26,827 23,182 12,849 7,555 70,413 7,380 7,348 7,042 6,812 28,582 Interest income (757) (809) (830) (949) (3,345) (812) (865) (897) (832) (3,406) Income (loss) from operations 1,677 12,218 5,417 2,803 22,115 5,563 4,500 2,108 4,052 16,223 Depreciation and amortization 67,885 33,237 22,135 16,532 139,789 16,747 17,082 17,108 17,141 68,078 Asset impairment 155 118 63 1,445 1,781 295 7 — 42 344 Operating lease expense adjustment 4 4 — — 8 — — — — — Adjusted EBITDA of unconsolidated ventures $ 69,721 $ 45,577 $ 27,615 $ 20,780 $ 163,693 $ 22,605 $ 21,589 $ 19,216 $ 21,235 $ 84,645 Brookdale's Proportionate Share of Adjusted EBITDA of Unconsolidated Ventures $ 16,749 $ 14,111 $ 11,280 $ 10,419 $ 52,559 $ 11,319 $ 10,878 $ 9,800 $ 10,830 $ 42,827 (1) Not included in consolidated reported amounts. 34


Non-GAAP Financial Measures (continued) Brookdale's Proportionate Share of Adjusted Free Cash Flow of Unconsolidated Ventures (1) For purposes of this presentation, amounts for each line item represent the aggregate amounts of such line items for all the Company's unconsolidated ventures. ($ in 000s) 2018 2019 1Q 2Q 3Q 4Q Full Year 1Q 2Q 3Q 4Q Full Year Net cash provided by (used in) operating activities $ 50,262 $ 47,510 $ 24,497 $ 22,818 $145,087 $ 24,122 $ 31,259 $ 29,397 $ 19,868 $ 104,646 Net cash provided by (used in) investing activities (14,642) (15,746) (14,623) (15,478) (60,489) (8,011) (9,419) (12,097) (14,451) (43,978) Net cash provided by (used in) financing activities (23,279) (29,380) (9,702) (15,625) (77,986) (8,788) (16,449) (14,538) (16,102) (55,877) Net increase (decrease) in cash, cash equivalents and restricted cash $ 12,341 $ 2,384 $ 172 $ (8,285) $ 6,612 $ 7,323 $ 5,391 $ 2,762 $ (10,685) $ 4,791 Net cash provided by (used in) operating activities $ 50,262 $ 47,510 $ 24,497 $ 22,818 $145,087 $ 24,122 $ 31,259 29,397 19,868 $ 104,646 Non-development capital expenditures, net (20,061) (18,867) (14,822) (15,430) (69,180) (8,000) (9,681) (11,993) (14,471) (44,145) Property insurance proceeds 901 634 — — 1,535 — — — — — Proceeds from refundable entrance fees, net of refunds (6,712) (3,323) (2,500) (7,448) (19,983) (5,843) (7,790) (5,763) (6,790) (26,186) Adjusted Free Cash Flow of unconsolidated ventures $ 24,390 $ 25,954 $ 7,175 $ (60) $ 57,459 $ 10,279 $ 13,788 $ 11,641 $ (1,393) $ 34,315 Brookdale’s Proportionate Share of Adjusted Free Cash Flow of Unconsolidated Ventures $ 6,367 $ 9,019 $ 4,618 $ (183) $ 19,821 $ 5,384 $ 6,958 $ 5,938 $ (710) $ 17,570 (1) Not included in consolidated reported amounts. Brookdale Senior Living Inc. 111 Westwood Place, Suite 400 Brentwood, TN 37027 (615) 221-2250 www.brookdale.com 35