EXHIBIT 99.1
 | |||||
| FOR IMMEDIATE RELEASE | MEDIA CONTACT: | ||||
| Yahaira Garcia-Perea | |||||
| Marketing & Corporate Communications Manager | |||||
| 916-823-7214 | [email protected] | |||||
BANK OF MARIN BANCORP REPORTS SECOND QUARTER FINANCIAL RESULTS
QUARTERLY EPS OF $0.58, 14 BASIS POINT EXPANSION OF NET INTEREST MARGIN
NOVATO, CA, July 27, 2026 - Bank of Marin Bancorp, "Bancorp" (Nasdaq: BMRC), parent company of Bank of Marin, "Bank," completed another quarter of improved financial performance, reflecting continued enhanced profitability, earnings power and overall balance sheet strength. This performance was supported by progress across key financial and operating priorities:
•Increased earnings per share
•Expanded net interest margin
•Reduced funding costs
•Improved asset quality
•Sustained loan origination growth
•Improving capital ratios
BMRC reports net income of $9.2 million for the second quarter of 2026. This compares to net income of $8.5 million for the first quarter of 2026 and a net loss of $8.5 million (net income of $4.7 million non-GAAP) for the second quarter of 2025. Diluted earnings per share was $0.58 for the second quarter, compared to diluted earnings per share of $0.53 for the prior quarter and diluted loss per share of $0.53 (earnings per share of $0.29 non-GAAP) for the second quarter of the prior year. Continued net interest margin expansion largely drove these increases, contributing to a 100% year-over-year increase in quarterly diluted earnings per share on a non-GAAP basis.
Selected Financial Results
| Comparable (non-GAAP) Excluding Loss on Sale of Securities | Three months ended | Six months ended | |||||||||||||||||||||||||||
(in thousands, except per share amounts; unaudited) | June 30, 2026 | March 31, 2026 | % Change | June 30, 2025 | % Change | June 30, 2026 | June 30, 2025 | % Change | |||||||||||||||||||||
Pre-tax, pre-provision net income (loss) | |||||||||||||||||||||||||||||
Pre-tax, pre-provision net income (loss) (GAAP) | $ | 12,353 | $ | 11,597 | 6.5 | % | $ | (11,199) | NM | $ | 23,950 | $ | (4,643) | NM | |||||||||||||||
Comparable pre-tax, pre-provision net income (non-GAAP) | 12,353 | 11,597 | 6.5 | % | 7,537 | 63.9 | % | 23,950 | 14,093 | 69.9 | % | ||||||||||||||||||
Net income (loss) | |||||||||||||||||||||||||||||
Net income (loss) (GAAP) | 9,246 | 8,510 | 8.6 | % | (8,536) | NM | 17,756 | (3,660) | NM | ||||||||||||||||||||
| Comparable net income (non-GAAP) | 9,246 | 8,510 | 8.6 | % | 4,662 | 98.3 | % | 17,756 | 9,538 | 86.2 | % | ||||||||||||||||||
| Diluted earnings (loss) per share | |||||||||||||||||||||||||||||
| Weighted average diluted shares | |||||||||||||||||||||||||||||
| Diluted earnings (loss) per share (GAAP) | $ | 0.58 | $ | 0.53 | 9.4 | % | $ | (0.53) | NM | $ | 1.11 | $ | (0.23) | NM | |||||||||||||||
| Comparable diluted earnings per share (non-GAAP) | $ | 0.58 | $ | 0.53 | 9.4 | % | $ | 0.29 | 100.0 | % | $ | 1.11 | $ | 0.60 | 85.0 | % | |||||||||||||
| See complete Reconciliation of GAAP and Non-GAAP Financial Measures below | |||||||||||||||||||||||||||||
| Related non-GAAP tax benefit calculated using blended statutory rate of 29.5636% | |||||||||||||||||||||||||||||
| NM Not meaningful | |||||||||||||||||||||||||||||
Concurrent with this release, Bancorp issued presentation slides providing supplemental information, some of which will be discussed during the second quarter 2026 earnings call. The earnings release and presentation slides are intended to be reviewed together and can be found online on Bank of Marin’s website at www.bankofmarin.com. under “Investor Relations.”
1
"Our profitability continued to benefit from the successful balance sheet restructuring actions we implemented over the past year, along with positive trends in higher-yielding loan originations, prudent expense management and disciplined deposit pricing strategies," said President & CEO Tim Myers. "Those efforts contributed to continued net interest margin expansion and stronger capital ratios during the quarter. While period-end loan balances declined due to the substantial planned exit within one relationship, healthy loan production and a meaningful decline in criticized loans reflect our ongoing focus on strengthening the balance sheet and improving credit quality."
Additional highlights for the second quarter of 2026 included the following:
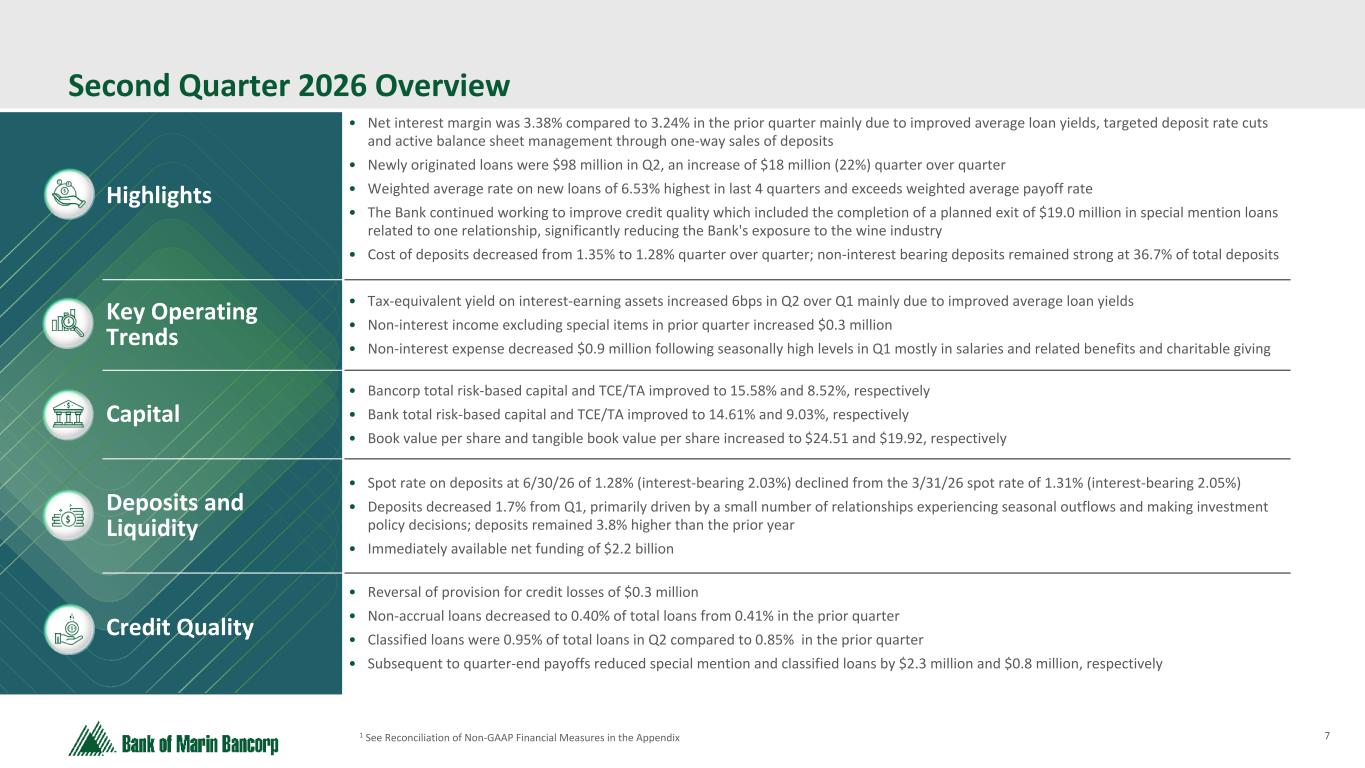
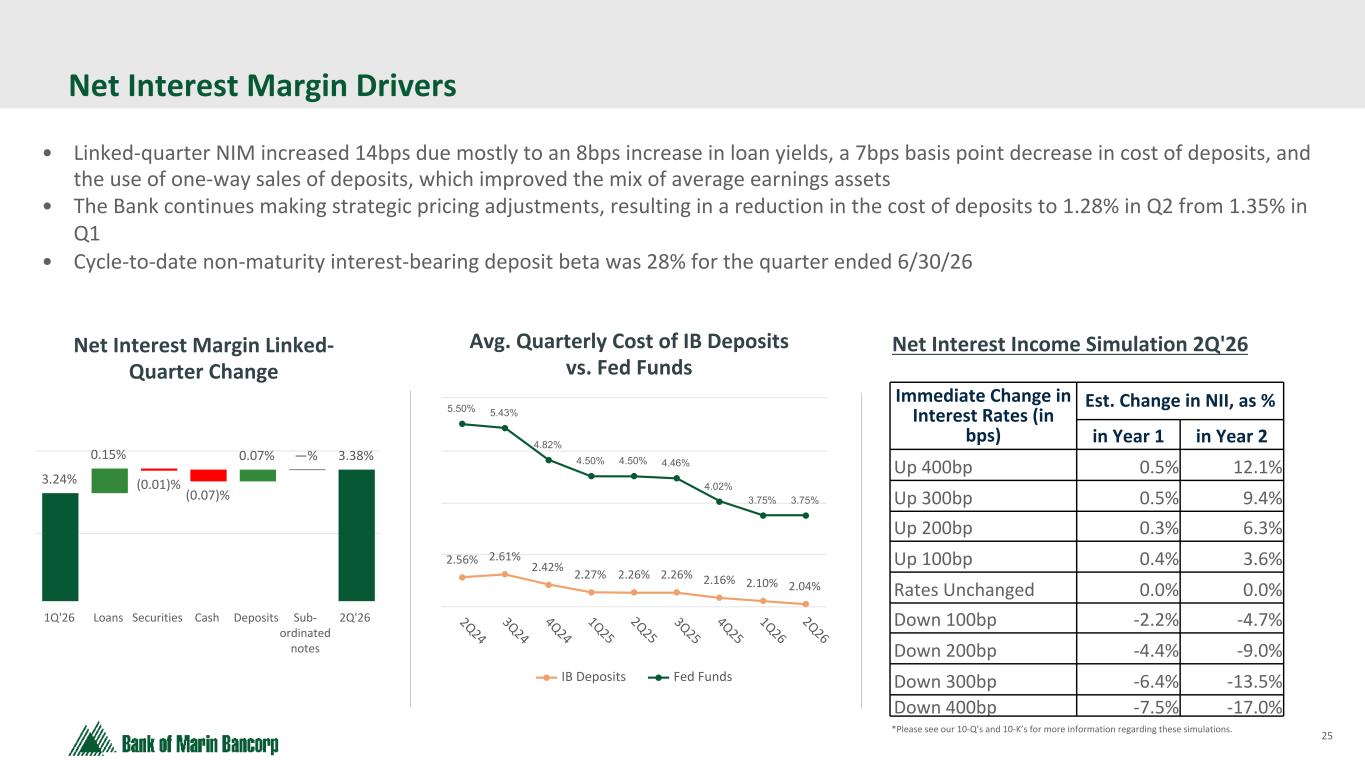
•The second quarter tax-equivalent net interest margin improved 14 basis points over the preceding quarter to 3.38% from 3.24% due largely to improved average loan yields of eight basis points, targeted deposit rate cuts that dropped the average cost of deposits and interest bearing deposits by seven and six basis points, respectively, and active balance sheet management through one-way sales of deposits contributing to the decrease of seven basis points in the quarterly cost of deposits.
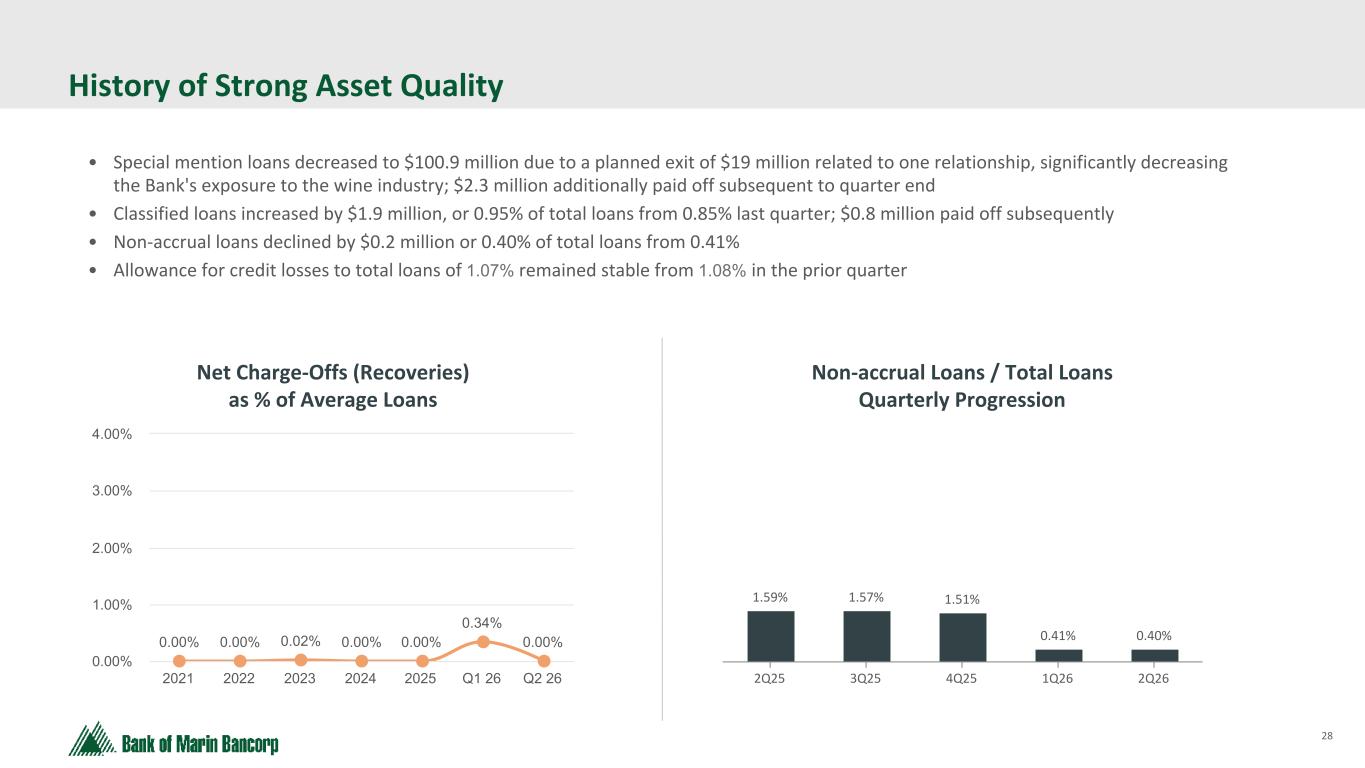
•During the quarter, the Bank continued working to improve credit quality which included the completion of a planned exit of $19.0 million in special mention loans related to one relationship, significantly reducing the Bank's exposure to the wine industry and reducing special mention loans to $100.9 million. Non-accrual loans declined by $191 thousand or 0.40% of total loans from 0.41%, while classified loans increased by $1.9 million, or 0.95% of total loans from 0.85% last quarter. Subsequent to quarter-end, the Bank received loan payoffs which reduced special mention loans and classified loans by $2.3 million and $785 thousand, respectively.
•The Bank recorded a reversal of the provision for credit losses on loans of $320 thousand in the second quarter of 2026 compared to no provision in the prior quarter. The allowance for credit losses was 1.07% and 1.08% of total loans at June 30, 2026 and March 31, 2026, respectively.
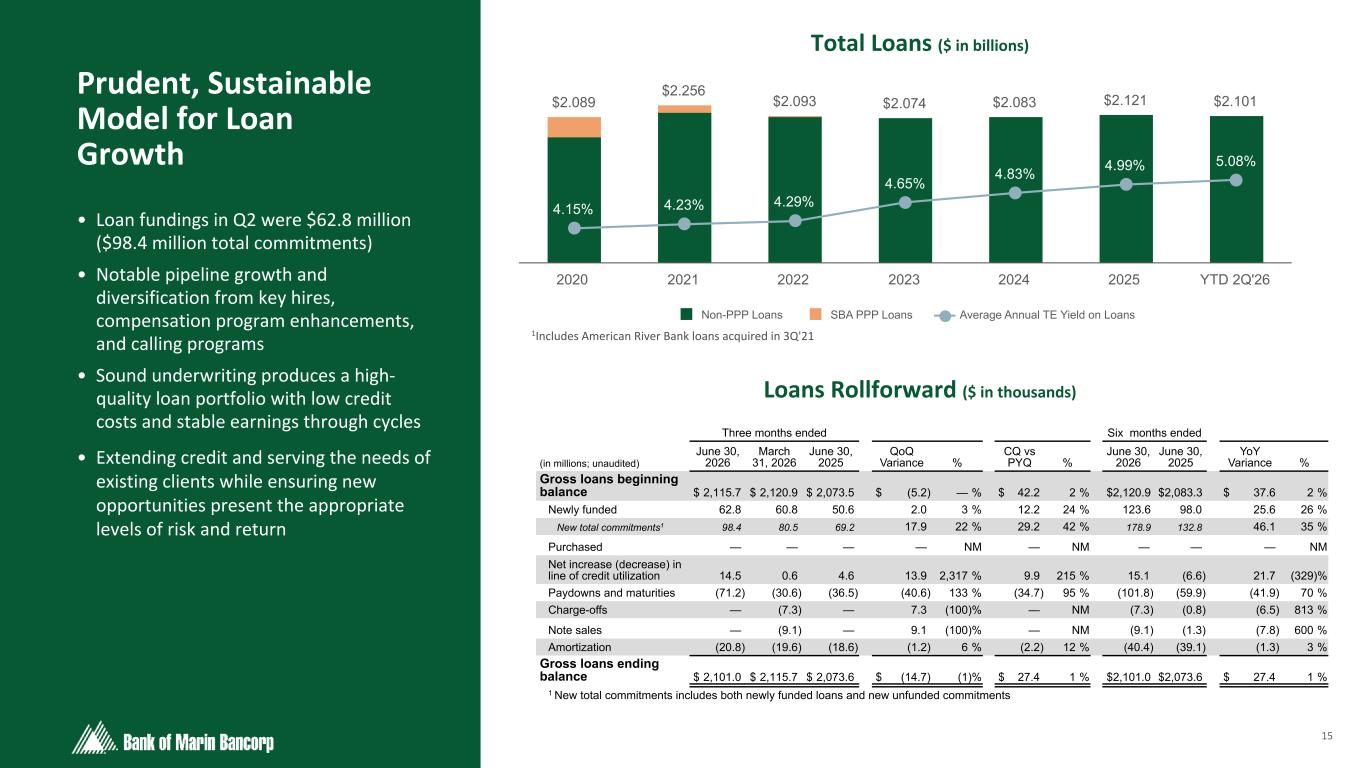
•Funded loans in the second quarter of 2026 of $62.8 million were 24% higher than the second quarter of the prior year and 3% higher than the prior quarter.
•Return on average assets ("ROA"), return on average equity ("ROE"), and the efficiency ratio improved on a GAAP basis from the prior quarter, as shown below. All three ratios benefited from increased revenue and reduced non-interest expense in the second quarter, mainly within salaries and related benefits and due to the annual charitable contributions made in the first quarter of 2026. Non-GAAP ratios for the prior year exclude the loss on security sales in that period, all other factors unchanged, and with adjustments made based on our blended statutory tax rate of 29.56%. See Reconciliation of GAAP and Non-GAAP Financial Measures below.
2
Operating Results
| Comparable (non-GAAP) Excluding Loss on Sale of Securities | Three months ended | Six months ended | ||||||||||||||||||
(in thousands, except per share amounts; unaudited) | June 30, 2026 | March 31, 2026 | June 30, 2025 | June 30, 2026 | June 30, 2025 | |||||||||||||||
| Return on average assets | ||||||||||||||||||||
| Average assets | $ | 3,850,140 | $ | 3,989,253 | $ | 3,737,794 | $ | 3,919,312 | $ | 3,732,957 | ||||||||||
| Return on average assets (GAAP) | 0.96 | % | 0.87 | % | (0.92) | % | 0.91 | % | (0.20) | % | ||||||||||
| Comparable return on average assets (non-GAAP) | 0.96 | % | 0.87 | % | 0.50 | % | 0.91 | % | 0.52 | % | ||||||||||
| Return on average equity | ||||||||||||||||||||
| Average stockholders' equity | $ | 395,328 | $ | 398,017 | $ | 439,187 | $ | 396,665 | $ | 438,187 | ||||||||||
| Return on average equity (GAAP) | 9.38 | % | 8.67 | % | (7.80) | % | 9.03 | % | (1.68) | % | ||||||||||
| Comparable return on average equity (non-GAAP) | 9.38 | % | 8.67 | % | 4.26 | % | 9.03 | % | 4.39 | % | ||||||||||
| Return on average tangible common equity | ||||||||||||||||||||
| Average goodwill and intangibles | $ | 74,393 | $ | 74,591 | $ | 75,230 | $ | 74,491 | $ | 75,336 | ||||||||||
| Average tangible common equity | $ | 320,935 | $ | 323,426 | $ | 363,957 | $ | 322,174 | $ | 362,851 | ||||||||||
| Return on average tangible common equity (GAAP) | 11.56 | % | 10.67 | % | (9.41) | % | 11.11 | % | (2.03) | % | ||||||||||
| Comparable return on average tangible common equity (non-GAAP) | 11.56 | % | 10.67 | % | 5.14 | % | 11.11 | % | 5.30 | % | ||||||||||
| Efficiency ratio | ||||||||||||||||||||
| Efficiency ratio (GAAP) | 63.62 | % | 66.03 | % | 219.76 | % | 64.82 | % | 112.77 | % | ||||||||||
| Comparable efficiency ratio (non-GAAP) | 63.62 | % | 66.03 | % | 73.17 | % | 64.82 | % | 74.42 | % | ||||||||||
| See complete Reconciliation of GAAP and Non-GAAP Financial Measures below | ||||||||||||||||||||
Related non-GAAP tax benefit calculated using blended statutory rate of 29.5636% | ||||||||||||||||||||
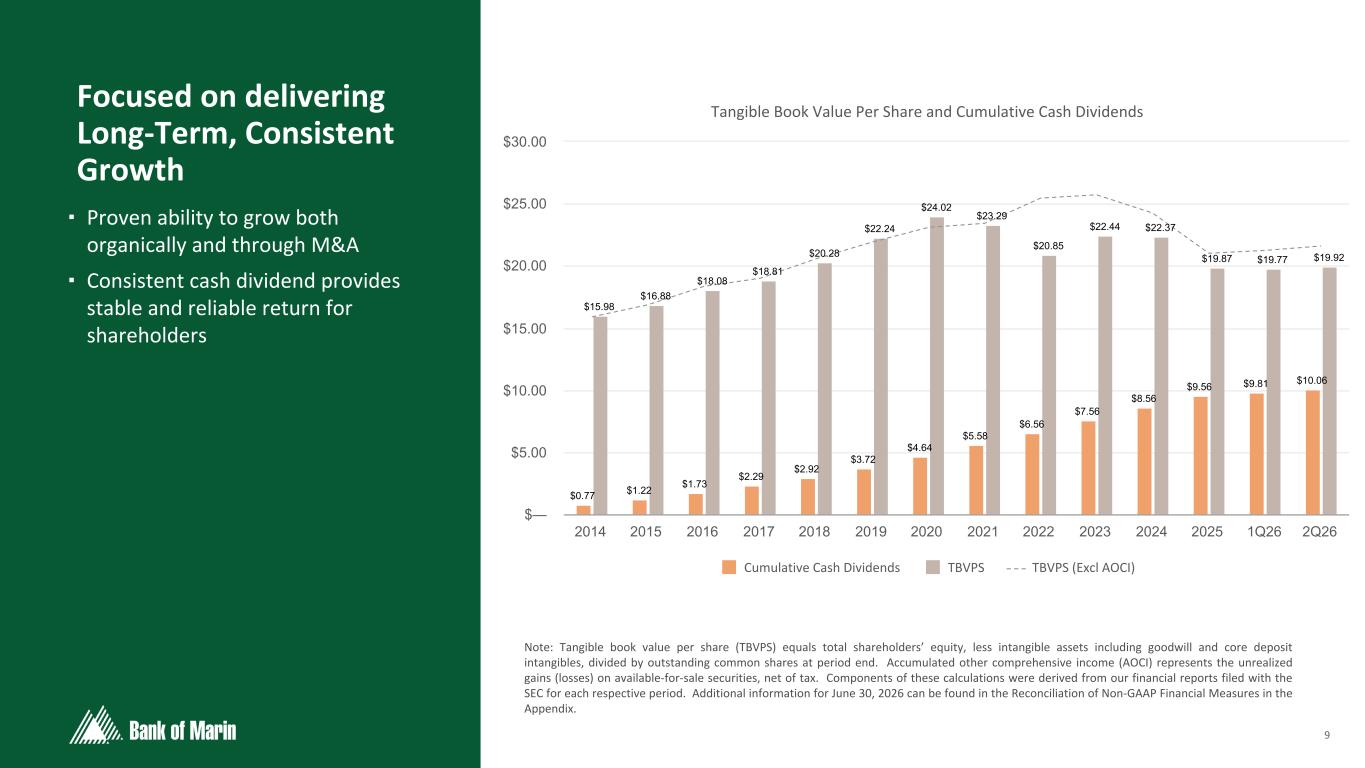
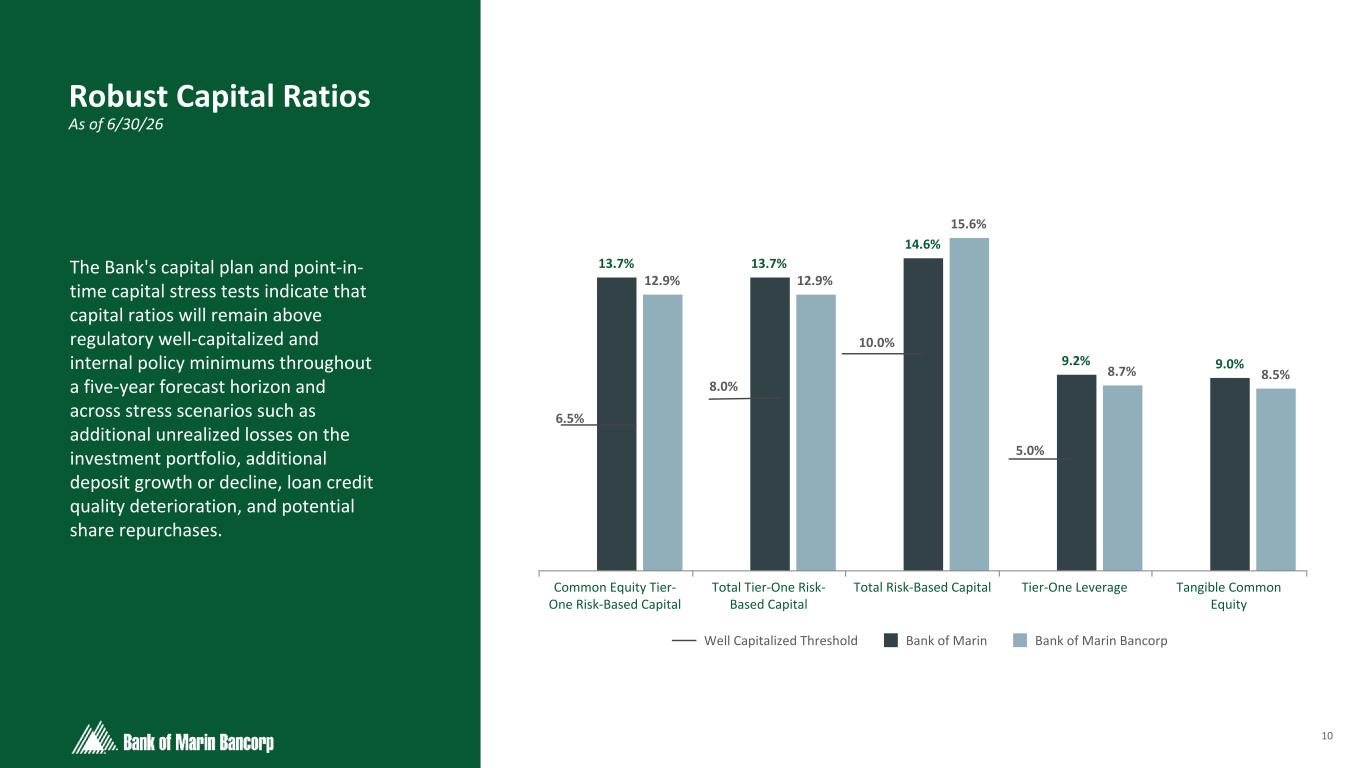
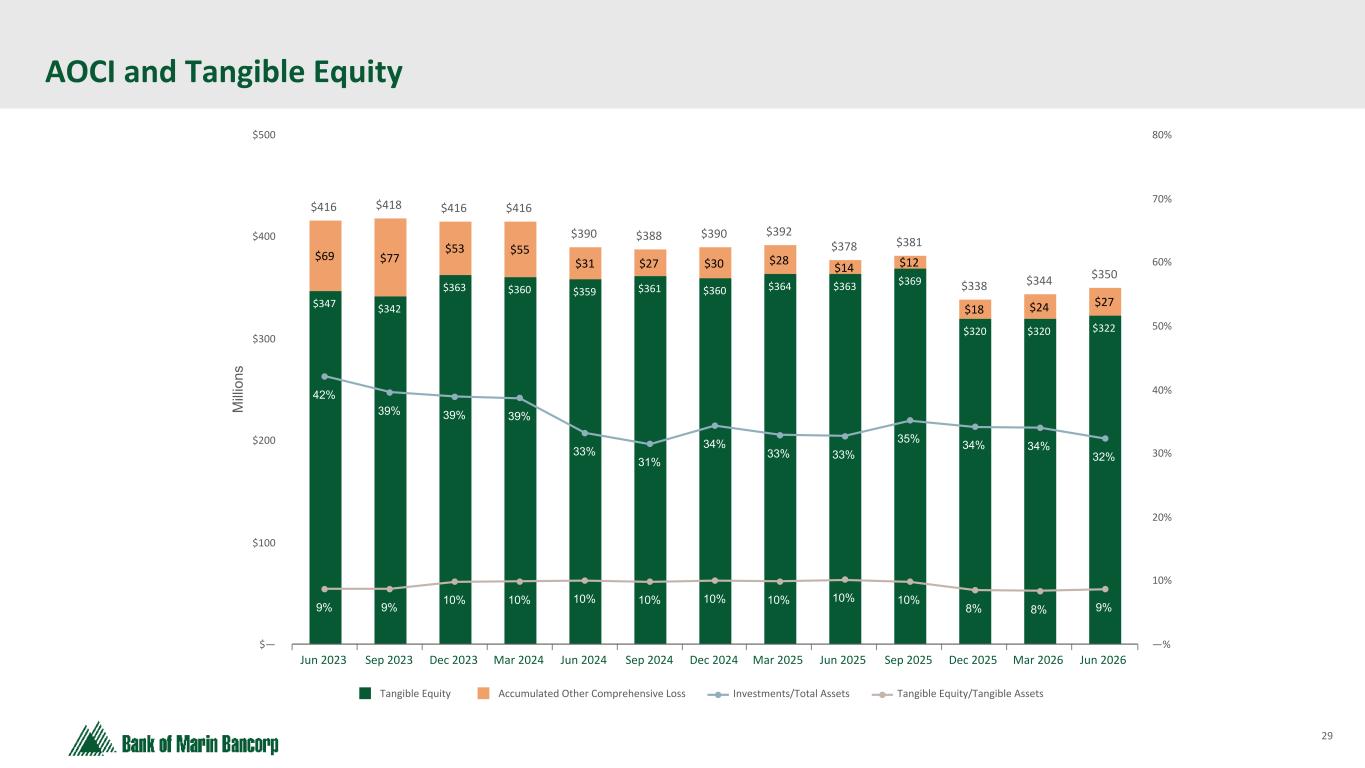
•Capital was above well-capitalized regulatory thresholds. Total risk-based capital improved by 32 basis points to 15.58% as of June 30, 2026 for Bancorp compared to 15.26% as of March 31, 2026. Bancorp's tangible common equity to tangible assets ("TCE ratio") improved by 19 basis points to 8.52% as of June 30, 2026. Bancorp's Tier I leverage ratio increased to 8.66% as of June 30, 2026 from 8.23% last quarter. Book value per share and tangible book value per share improved by $0.14 and $0.15 to $24.51 and $19.92, respectively.
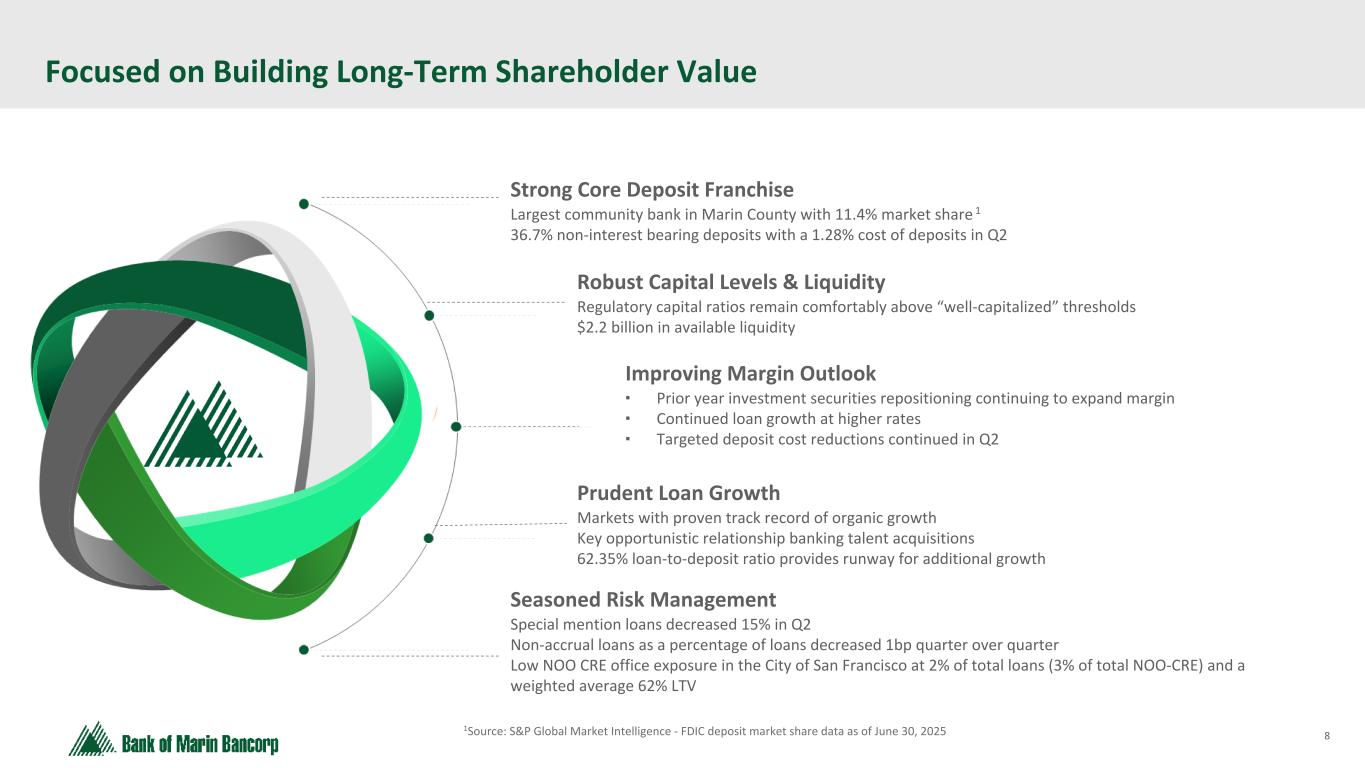
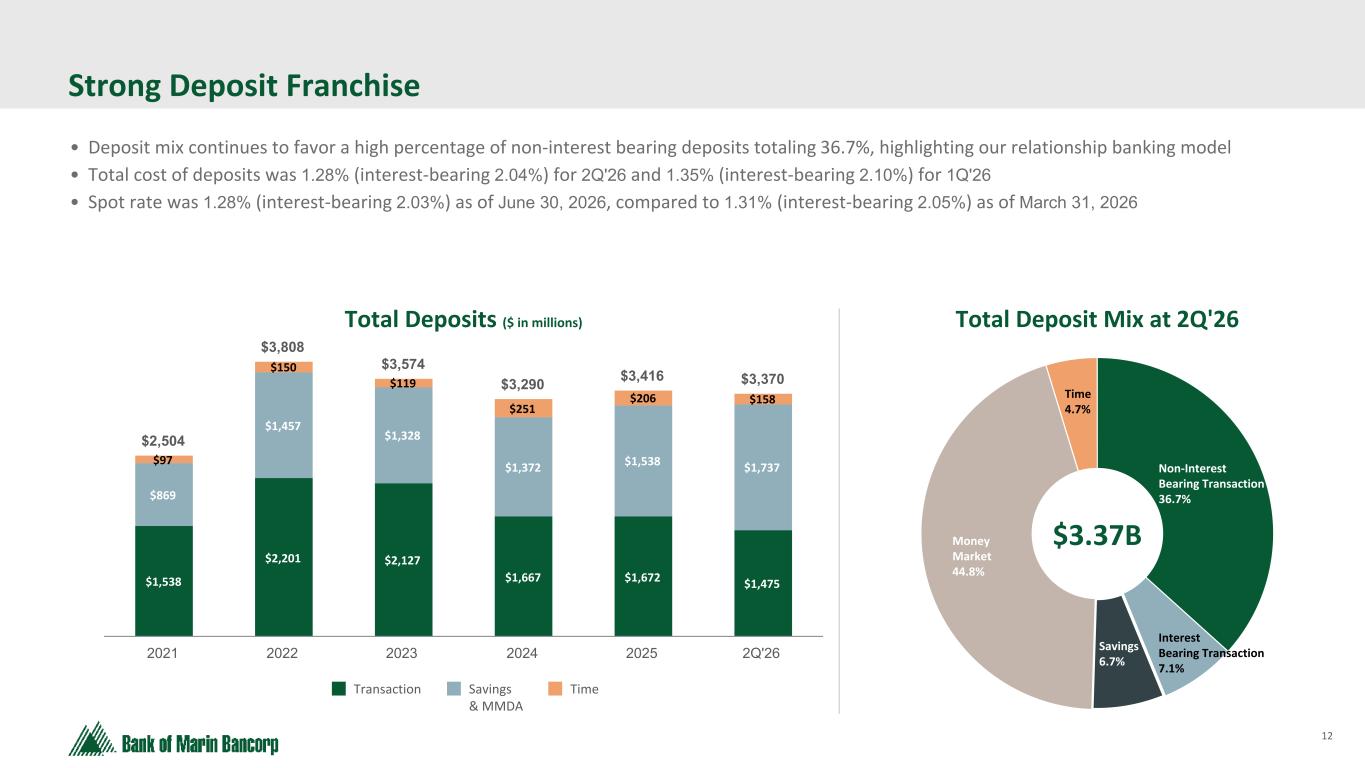
•The average cost of interest bearing deposits decreased from 2.10% to 2.04% in the second quarter of 2026 compared to the prior quarter, and the average cost of total deposits decreased from 1.35% to 1.28%. The quarter-end spot rate at March 31, 2026 of 1.31% dropped to 1.28% at June 30, 2026. Non-interest bearing deposits continued to make up a strong portion of total deposits at 36.7% as of June 30, 2026, compared to 35.9% last quarter.
•Total deposits decreased by $58.2 million, or 1.70%, to $3.370 billion as of June 30, 2026 compared to $3.428 billion as of March 31, 2026. The decrease was primarily attributable to a small number of relationships and reflected seasonal customer activity and investment decisions, rather than broader changes in deposit trends. In addition, seasonal tax-related outflows contributed to the second quarter decrease.
•The Board of Directors declared a cash dividend of $0.25 per share on July 23, 2026, which was the 85th consecutive quarterly dividend paid by Bancorp. The dividend is payable on August 13, 2026 to shareholders of record at the close of business on August 6, 2026.
“As expected, non-interest expense improved by $942 thousand in the quarter following elevated seasonal levels in the prior quarter, mainly in salaries and related benefits as well as charitable contributions,” said Chief Financial Officer Dave Bonaccorso. “Tax equivalent net interest margin expanded by 14 basis points during the quarter due to improved loan yields, targeted deposit rate cuts, and periodic one-way sales of deposits. We remain committed to actively managing our balance sheet to support our strategic growth while balancing profitability, liquidity, interest rate risk, and capital management."
Loans and Credit Quality
Loans decreased by $14.7 million for the second quarter and totaled $2.101 billion as of June 30, 2026, compared to $2.116 billion as of March 31, 2026. Second quarter 2026 new fundings were $62.8 million compared to $60.8 in
3
the prior quarter and $50.6 million in the second quarter of 2025. Second quarter 2026 payoffs included completion of a planned exit of $19.0 million in special mention loans related to one relationship.
| Three months ended | Six months ended | |||||||||||||||||||
| (in millions; unaudited) | June 30, 2026 | March 31, 2026 | June 30, 2025 | June 30, 2026 | June 30, 2025 | |||||||||||||||
| Gross loans beginning balance | $ | 2,115.7 | $ | 2,120.9 | $ | 2,073.5 | $ | 2,120.9 | $ | 2,083.3 | ||||||||||
Newly funded | 62.8 | 60.8 | 50.6 | 123.6 | 98.0 | |||||||||||||||
New total commitments1 | 98.4 | 80.5 | 69.2 | 178.9 | 132.8 | |||||||||||||||
| Purchased | — | — | — | — | — | |||||||||||||||
| Net increase (decrease) in line of credit utilization | 14.5 | 0.6 | 4.6 | 15.1 | (6.6) | |||||||||||||||
| Paydowns and maturities | (71.2) | (30.6) | (36.5) | (101.8) | (59.9) | |||||||||||||||
| Charge-offs | — | (7.3) | — | (7.3) | (0.8) | |||||||||||||||
Note sales | — | (9.1) | — | (9.1) | (1.3) | |||||||||||||||
| Amortization | (20.8) | (19.6) | (18.6) | (40.4) | (39.1) | |||||||||||||||
| Gross loans ending balance | $ | 2,101.0 | $ | 2,115.7 | $ | 2,073.6 | $ | 2,101.0 | $ | 2,073.6 | ||||||||||
1 New total commitments includes both newly funded loans and new unfunded commitments | ||||||||||||||||||||
Non-accrual loans declined by $191 thousand during the quarter to $8.5 million, or 0.40% of total loans, compared to $8.6 million, or 0.41%, at March 31, 2026. The reduction was driven primarily by pay offs and paydowns.
Classified loans increased by $1.9 million during the second quarter to $19.9 million, up from $17.9 million at March 31, 2026. The increase was due to the downgrade of six loans, of which $785 thousand has since paid off. All downgraded loans are paying as agreed.
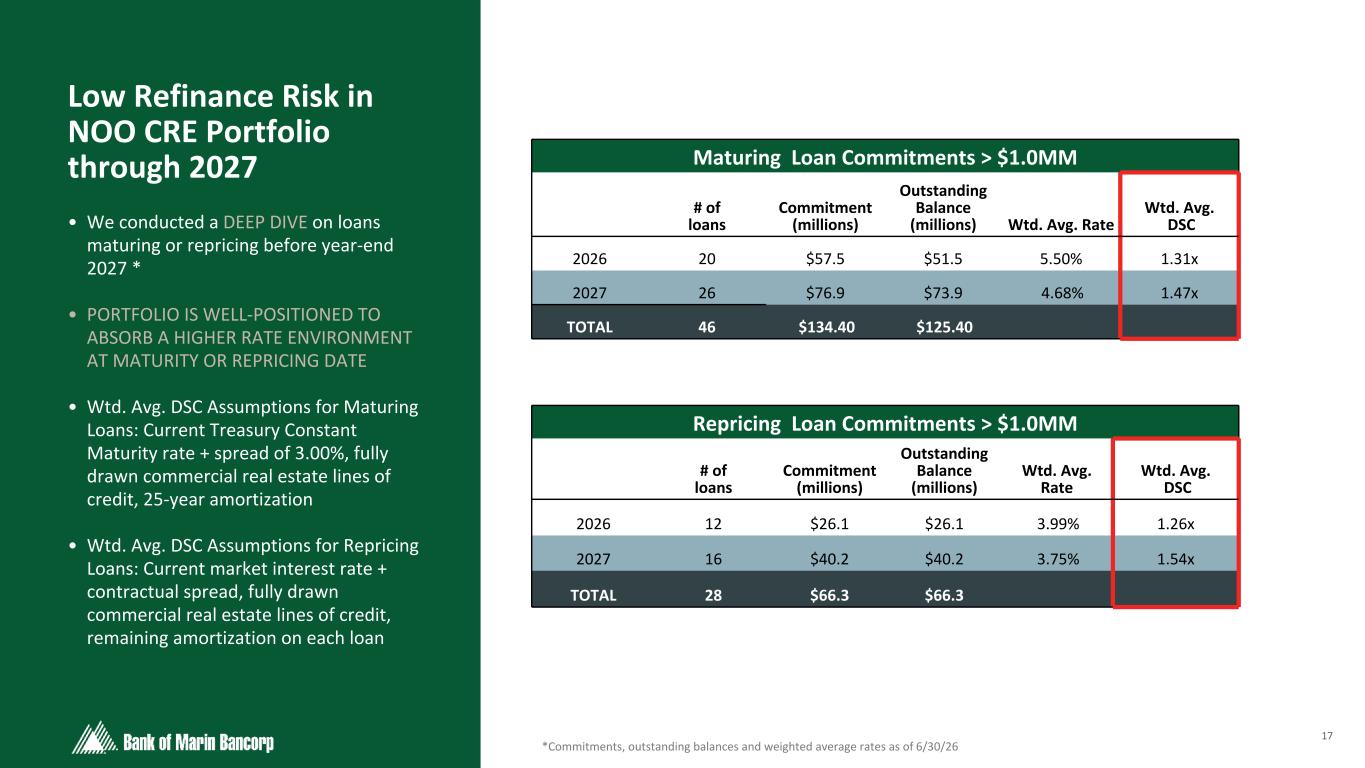
Loans designated as special mention, which are not considered adversely classified, decreased to $100.9 million at June 30, 2026, compared to $119.4 million at March 31, 2026, largely due to the planned exit of $19.0 million in loans related to one relationship.
Accruing loans past due 30 to 89 days totaled $2.0 million at June 30, 2026, up from $683 thousand at March 31, 2026.
Net charge-offs totaled $39 thousand in the second quarter of 2026 compared to $7.3 million in the prior quarter. The prior quarter net charge-offs were driven by charge offs of $7.2 million related to two non-accrual loans that were sold in the quarter. These charge‑offs were fully offset by specific reserves that were already in place for the two loans at that time.
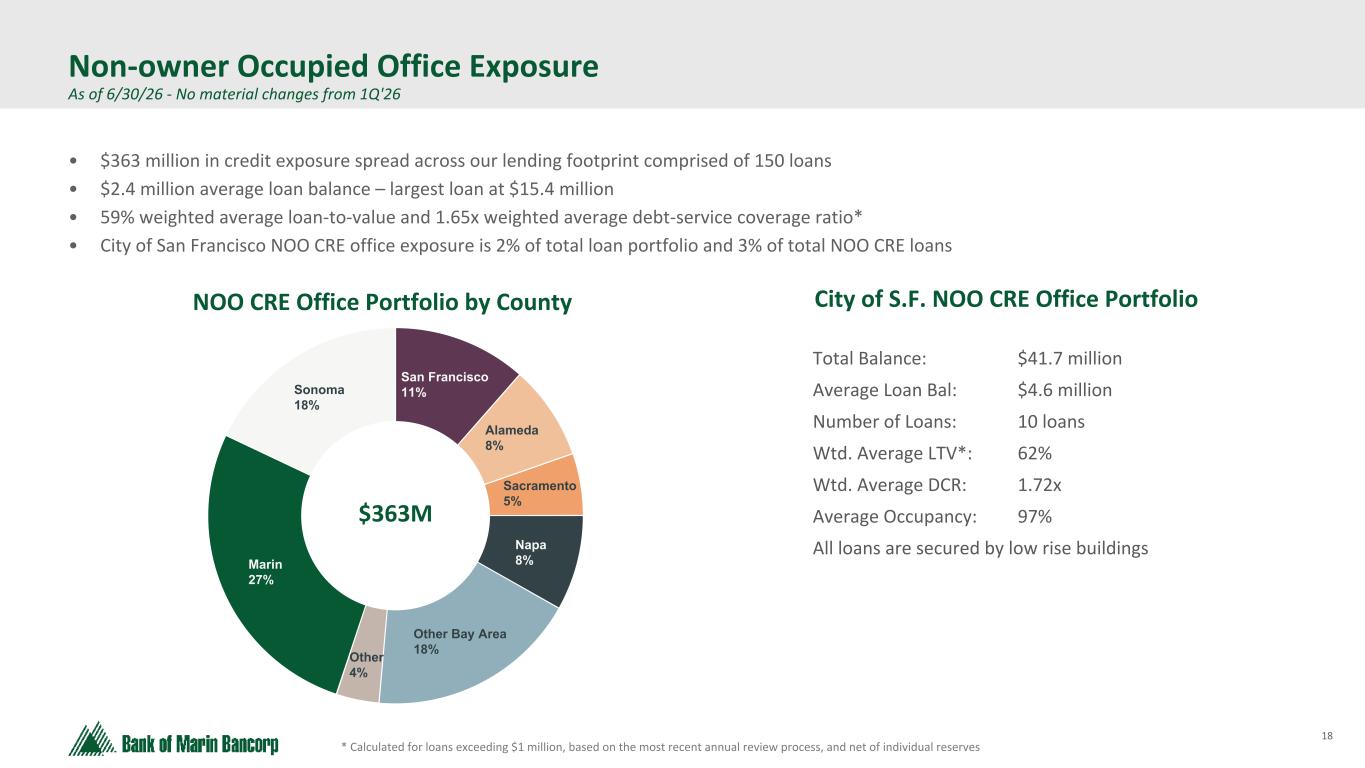
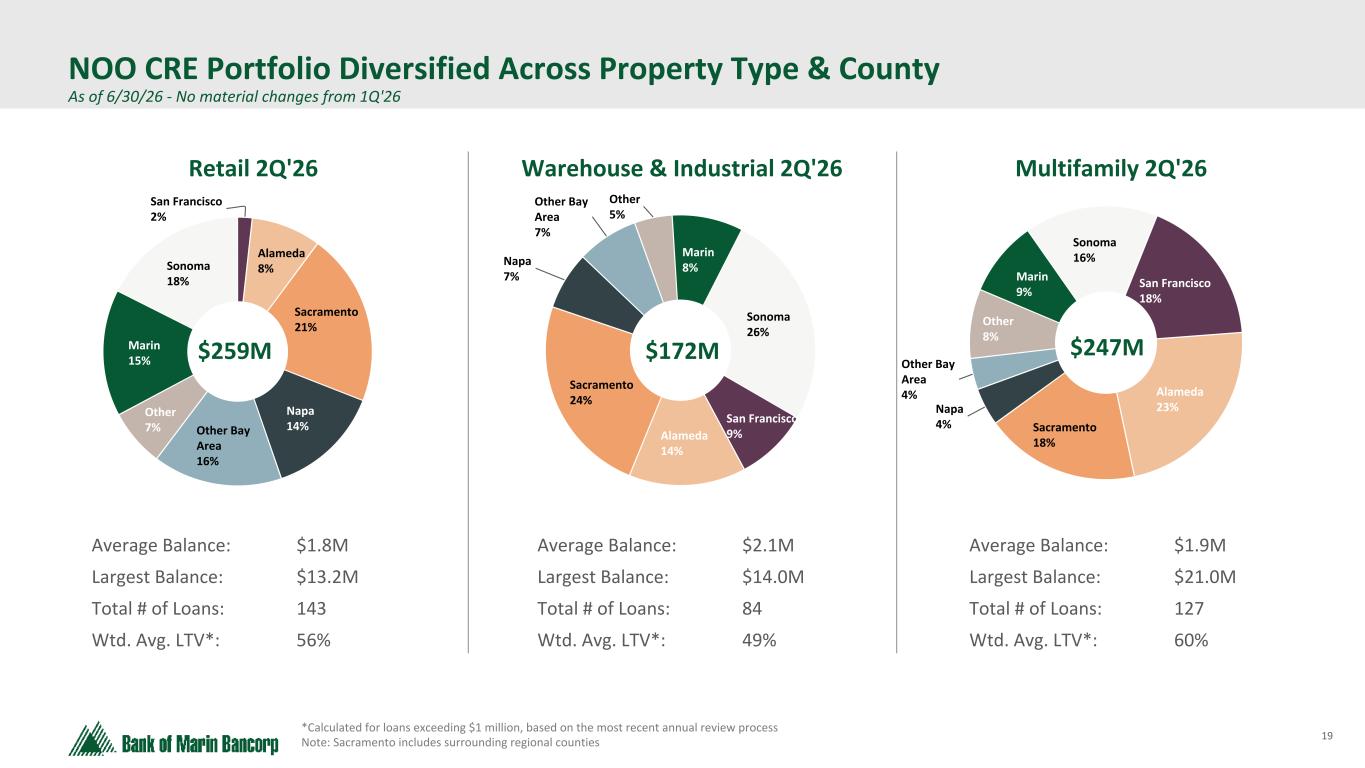
The Bank recorded a $320 thousand reversal of provision for credit losses on loans in the second quarter of 2026 driven by lower loan balances and improved credit quality in the non-owner occupied commercial real estate portfolio. There was no provision for credit losses in the prior quarter.
The ratio of allowance for credit losses to total loans remained stable at 1.07% at June 30, 2026 compared to 1.08% at March 31, 2026.
There was no provision for credit losses on unfunded loan commitments in the second quarter of 2026 or in the prior quarter.
Cash, Cash Equivalents and Restricted Cash
Total cash, cash equivalents and restricted cash were $279.6 million at June 30, 2026, an increase of $43.0 million compared to $236.6 million at March 31, 2026, largely due to investment security paydowns.
Investments
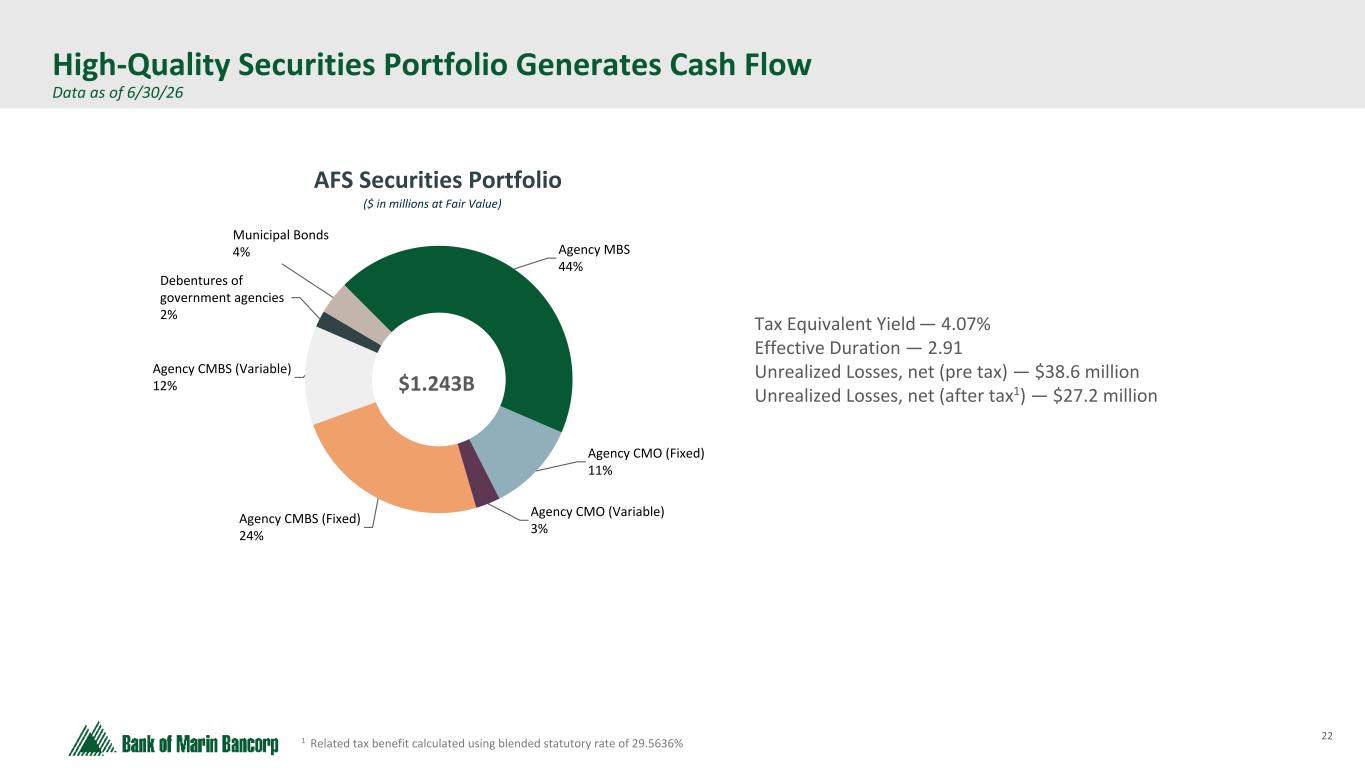
The investment securities portfolio totaled $1.243 billion at June 30, 2026, a decrease of $83.4 million from March 31, 2026. The decrease in the portfolio was due to principal repayments and calls/maturities totaling $77.6 million and $1.1 million, respectively, and an increase of $4.8 million in unrealized losses on available-for-sale ("AFS") securities. The portfolio is eligible for pledging to the Federal Home Loan Bank ("FHLB") and the Federal Reserve as collateral for borrowing, and is comprised of high credit quality investments with an average effective duration of 2.91. The portfolio generates cash flows monthly from interest, principal amortization and payoffs, which
4
supports the Bank's liquidity. Those cash flows totaled $92.1 million and $73.4 million in the second quarter of 2026 and the first quarter of 2026, respectively.
Deposits
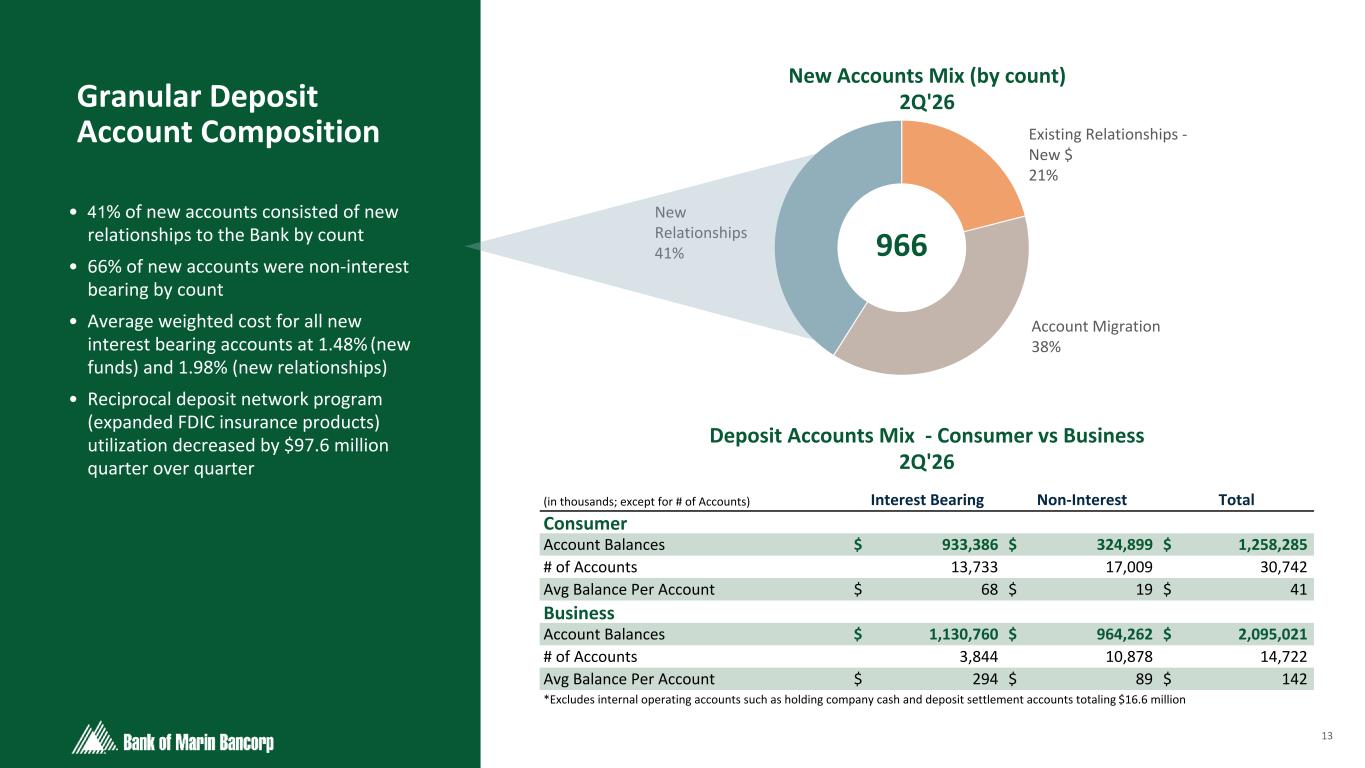
Deposits decreased $58.2 million, or 1.7%, to $3.370 billion at June 30, 2026, compared to $3.428 billion at March 31, 2026. The decrease was primarily attributable to a small number of relationships and reflected seasonal customer activity and investment decisions, rather than broader changes in deposit trends. In addition, seasonal tax-related outflows contributed to the second quarter decrease. Interest bearing transaction accounts decreased by $238.1 million while money market accounts increased by $198.1 million as a result of the transfer of approximately $170 million in reciprocal deposits during the quarter. As of June 30, 2026, total one-way sales decreased from $78.5 million to zero although the Bank sold an average of $94.7 million during the quarter which enhanced non-interest income and net interest margin. Non-interest bearing deposits continued to make up a strong 36.7% of total deposits at June 30, 2026, compared to 35.9% at March 31, 2026. The Bank's competitive and balanced approach to relationship management and focused outreach to customers seeking alternative options for banking solutions generated nearly 1,000 new accounts during the second quarter, 42% of which were new relationships.
Borrowings and Liquidity
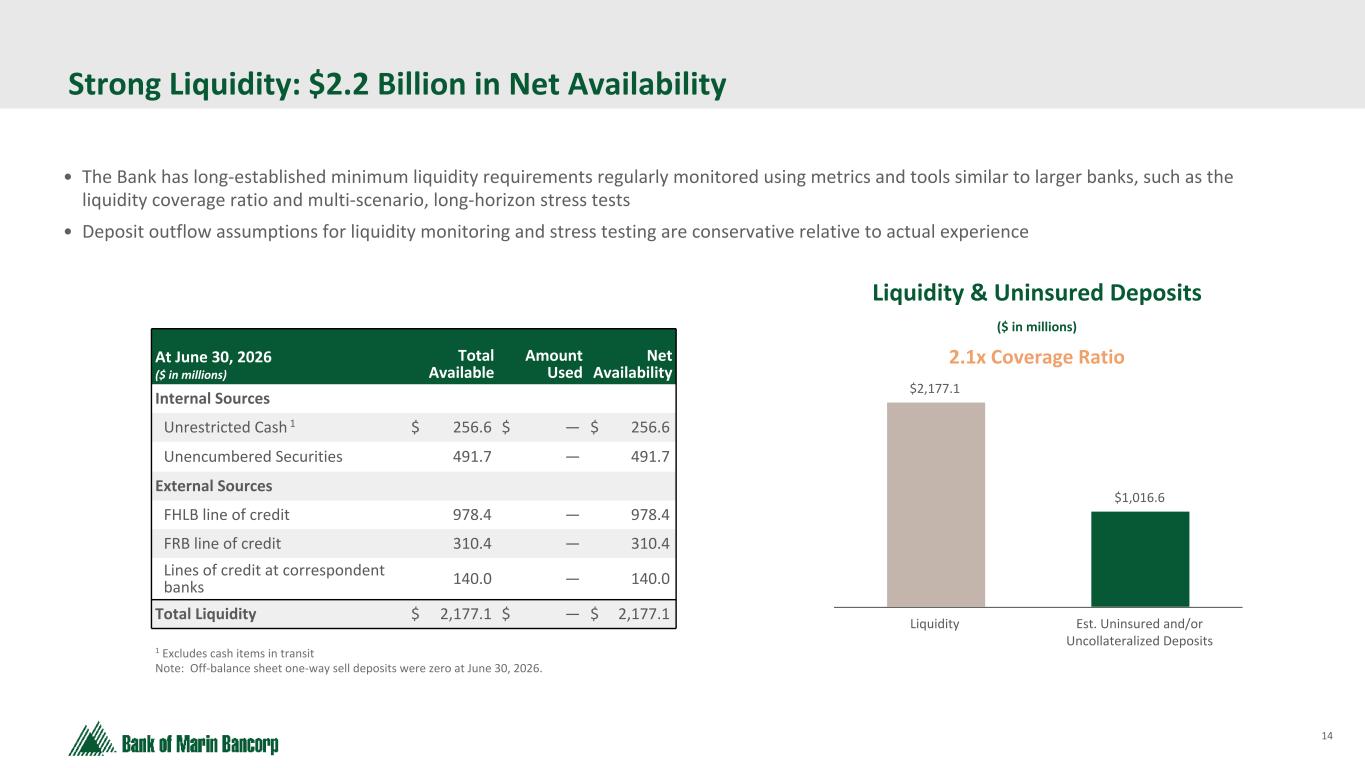
As of June 30, 2026, the Bank had no outstanding short-term borrowings, consistent with March 31, 2026. Net available funding sources, including unrestricted cash, unencumbered available-for-sale securities and total available borrowing capacity totaled $2.177 billion, or 65% of total deposits and 214% of estimated uninsured and/or uncollateralized deposits as of June 30, 2026.
The following table details the components of our contingent liquidity sources as of June 30, 2026.
(in millions) | Total Available | Amount Used | Net Availability | ||||||||
| Internal Sources | |||||||||||
Unrestricted cash 1 | $ | 256.6 | $ | — | $ | 256.6 | |||||
| Unencumbered securities at market value | 491.7 | — | 491.7 | ||||||||
| External Sources | |||||||||||
| FHLB line of credit | 978.4 | — | 978.4 | ||||||||
| FRB line of credit | 310.4 | — | 310.4 | ||||||||
| Lines of credit at correspondent banks | 140.0 | — | 140.0 | ||||||||
| Total Liquidity | $ | 2,177.1 | $ | — | $ | 2,177.1 | |||||
1 Excludes cash items in transit as of June 30, 2026.
Note: There were no off-balance sheet one-way sell deposits as of June 30, 2026.
Subordinated Notes
During the fourth quarter of 2025, Bancorp issued Fixed-to-Floating Subordinated Notes of $45.0 million with a final maturity date of December 1, 2035, to certain investors in a private placement to strengthen capital ratios as part of the balance sheet repositioning. The interest rate of the Bank’s subordinated notes is 6.75%, payable semi-annually in arrears on June 1 and December 1 of each year, which commenced on June 1, 2026. After December 1, 2030, the interest rate will be variable and equal Three-Month Term SOFR plus 335 basis points, resetting quarterly. Subordinated notes outstanding were $44.0 million, net of issuance costs, at June 30, 2026.
Capital Resources
Our capital ratios are summarized in the table below.
Capital Ratios | June 30, 2026 | March 31, 2026 | June 30, 2025 | |||||||||||||||||
(dollars in thousands) | Bancorp | Bank | Bancorp | Bank | Bancorp | Bank | ||||||||||||||
| Common Equity Tier 1 to RWA | 12.93 | % | 13.69 | % | 12.61 | % | 13.17 | % | 15.03 | % | 13.78 | % | ||||||||
| Total Tier I to RWA | 12.93 | % | 13.69 | % | 12.61 | % | 13.17 | % | 15.03 | % | 13.78 | % | ||||||||
| Total Capital to RWA | 15.58 | % | 14.61 | % | 15.26 | % | 14.09 | % | 16.25 | % | 15.00 | % | ||||||||
| Tier I Leverage Ratio to Avg Assets | 8.66 | % | 9.16 | % | 8.23 | % | 8.59 | % | 10.22 | % | 9.37 | % | ||||||||
| Tangible Common Equity to TA | 8.52 | % | 9.03 | % | 8.33 | % | 8.70 | % | 9.95 | % | 9.09 | % | ||||||||
5
Bancorp's tangible common equity to tangible assets ("TCE ratio") increased 19 basis points to 8.52% at June 30, 2026, compared to 8.33% at March 31, 2026. Bancorp's total capital to risk weighted assets increased 32 basis points to 15.58% at June 30, 2026, from 15.26% at March 31, 2026. The Bank's capital plan and point-in-time capital stress tests indicate that capital ratios will remain above regulatory well-capitalized and internal policy minimums throughout a five-year forecast horizon and across stress scenarios such as additional unrealized losses on the investment portfolio, additional deposit growth or decline, loan credit quality deterioration, and potential share repurchases. Book value per share and tangible book value per share improved by $0.14 and $0.15 to $24.51 and $19.92, respectively. Accumulated comprehensive income worsened by $3.4 million in the quarter due to higher market interest rates.
Earnings
Net Interest Income
Net interest income totaled $30.8 million for the second quarter of 2026, a $479 thousand increase from the prior quarter. This was driven by an increase of $733 thousand in interest income on loans, largely due to an 8 basis point increase in yields due to growth at higher rates. Also contributing significantly was the reduction of $934 thousand in interest expense on deposits, due to strategic rate decreases and active balance sheet management through one-way sales of deposits.
The net interest margin increased 14 basis points to 3.38% for the second quarter of 2026, compared to 3.24% for the prior quarter. The increase is mostly explained by an eight basis point increase in loan yields, a seven basis point decrease in cost of deposits, and the use of one-way sales of deposits, which improved the mix of average earnings assets.
Non-Interest Income
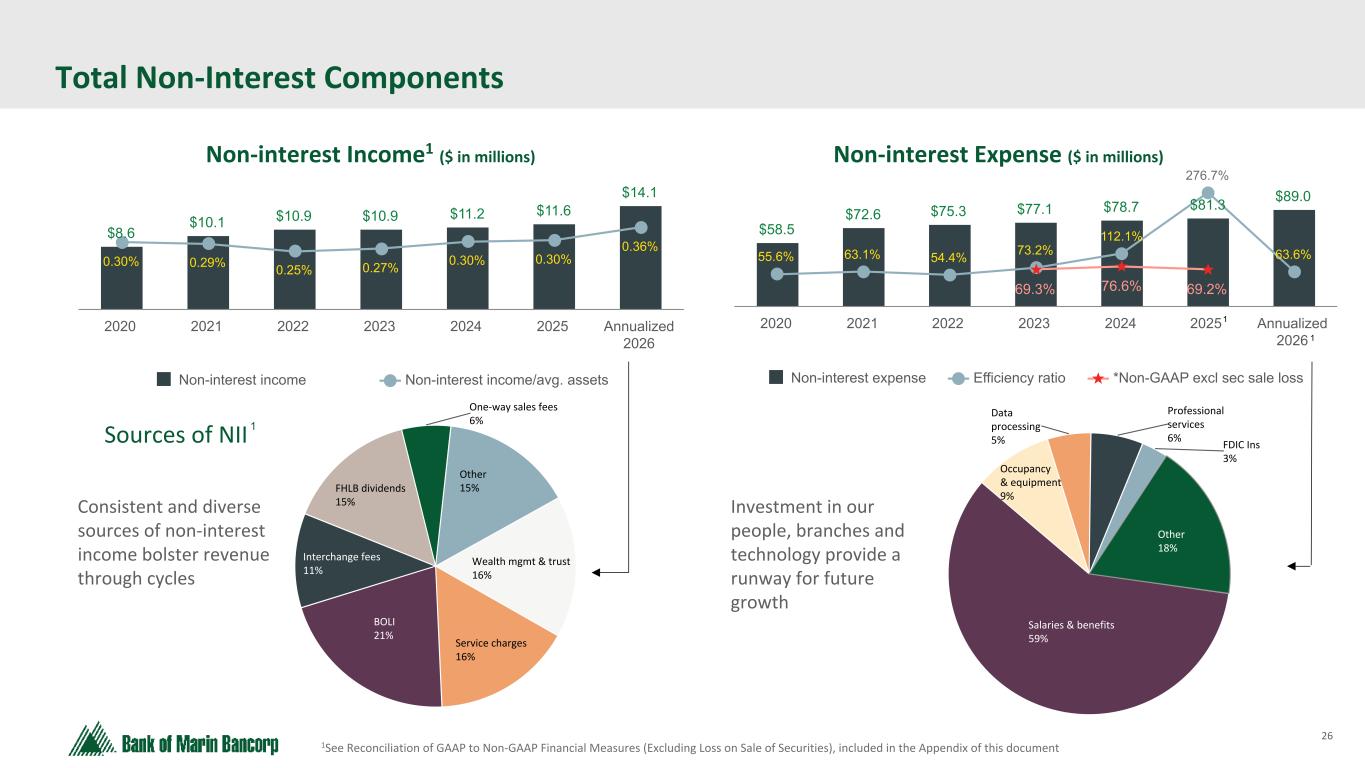
Non-interest income was $3.2 million for the second quarter of 2026, compared to $3.8 million for the prior quarter. The decrease of $665 thousand from the prior quarter was primarily attributable to a decrease in dividend income on FHLB stock of $656 thousand which included the $479 thousand special dividend received in the first quarter. There were also bank owned life insurance death benefits of $479 thousand received in the first quarter, not repeated in the second. These were partially offset by the increase in fee income within other income of $377 thousand due to one-way sales of deposits in the quarter, as mentioned above.
Non-Interest Expense
Non-interest expense totaled $21.6 million for the second quarter of 2026, compared to $22.5 million for the prior quarter, a decrease of $942 thousand, primarily driven by a decrease of $785 thousand in salaries and related benefits expense in the second quarter of 2026. Consistent with annual adjustments and our compensation cycle, the prior quarter expense included updated incentive bonus accruals, 401(k) contribution matching, profit sharing accruals, payroll taxes, and stock-based compensation grants, in addition to lower deferred loan origination costs. These were partially offset by customary annual salary increases effective April 2026 and an increased number of full-time equivalent employees. Also decreasing the quarterly expense was the $247 thousand reduction in charitable contributions since the majority of the annual giving campaign takes place in the first quarter of the year. Partially offsetting these was an increase of $278 thousand in professional services mostly related to audit, operations, compliance, information security and accounting fees.
Share Repurchase Program
On July 24, 2025, the Board of Directors authorized the repurchase of up to $25.0 million of its common stock effective July 24, 2025 through July 31, 2027. There were no repurchases in the second quarter of 2026 or in the first quarter of 2026. As of June 30, 2026, the amount remaining available for repurchase of shares was $23.9 million.
6
Statement Regarding use of Non-GAAP Financial Measures
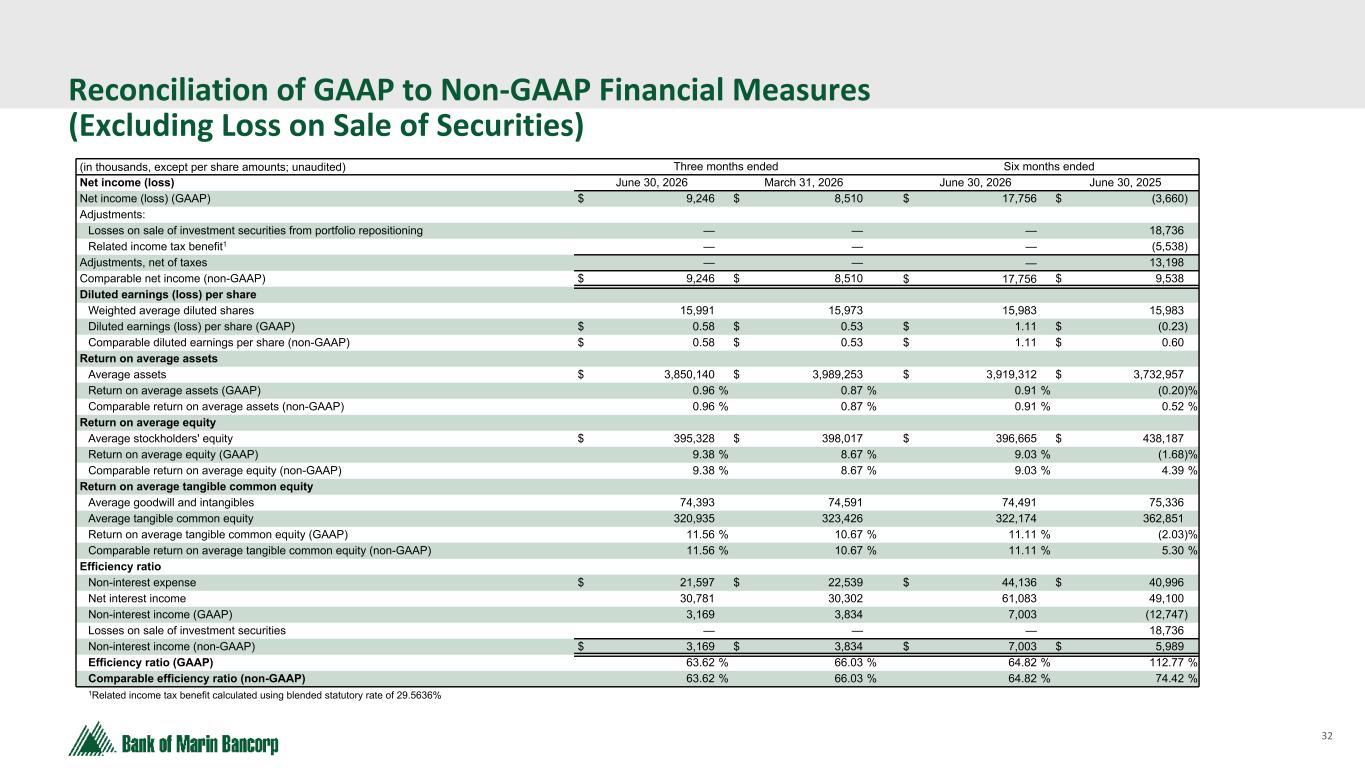
Financial results are presented in accordance with GAAP and with reference to certain non-GAAP financial measures. Management believes that providing selected financial measures that exclude the loss on sale of securities is useful to investors as the strategic short-term loss taken for long-term profitability makes the operational performance difficult to compare to other periods. Because there are limits to the usefulness of this or any other non-GAAP measure to investors, Bancorp encourages readers to consider its annual and quarterly consolidated financial statements and notes related thereto for their entirety, as filed with the Securities and Exchange Commission, and not to rely on any single financial measure. A reconciliation of the GAAP financial measures to comparable non-GAAP financial measures is presented below.
7
Reconciliation of GAAP and Non-GAAP Financial Measures
(in thousands, except per share amounts; unaudited) | Three months ended | Six months ended | ||||||||||||||||||
Pre-tax, pre-provision net income (loss) | June 30, 2026 | March 31, 2026 | June 30, 2025 | June 30, 2026 | June 30, 2025 | |||||||||||||||
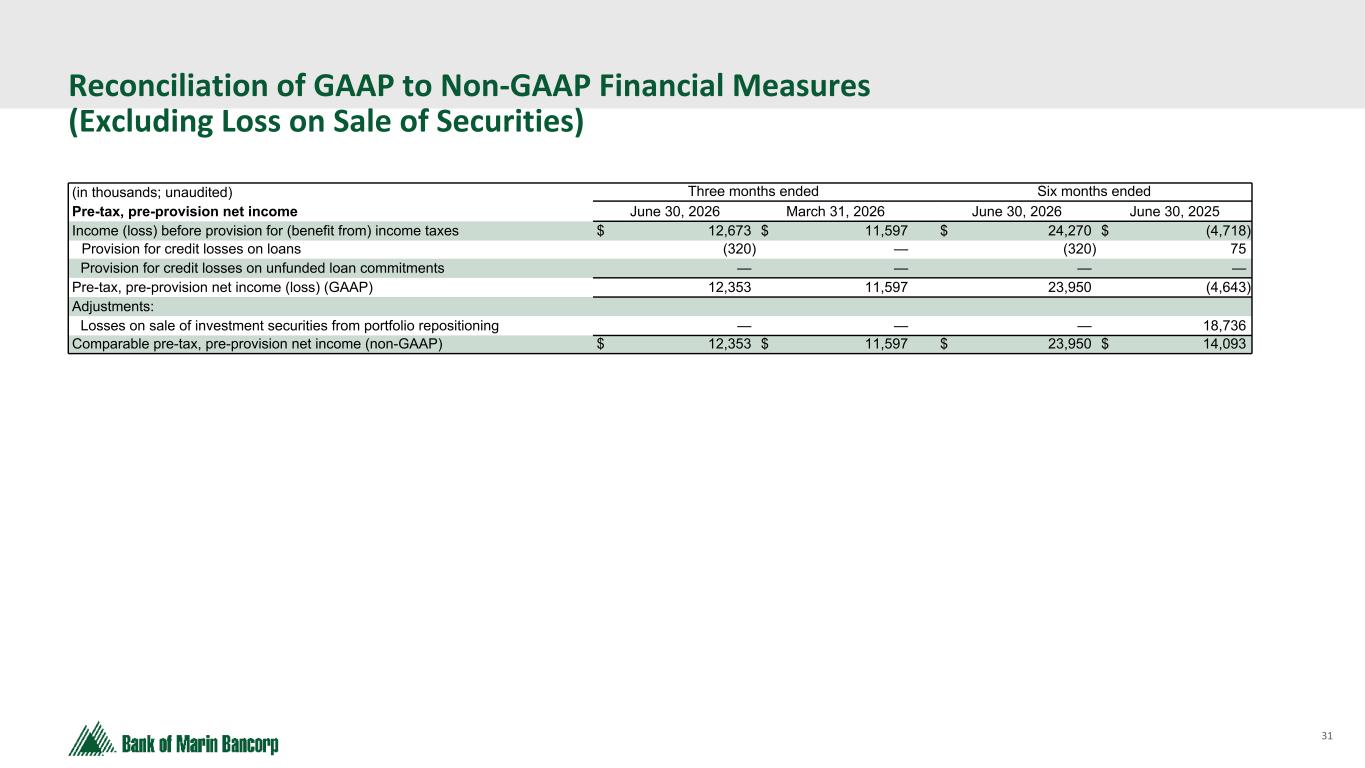
Income (loss) before provision for (benefit from) income taxes | $ | 12,673 | $ | 11,597 | $ | (11,199) | $ | 24,270 | $ | (4,718) | ||||||||||
| (Reversal of) provision for credit losses on loans | (320) | — | — | (320) | 75 | |||||||||||||||
Pre-tax, pre-provision net income (loss) (GAAP) | 12,353 | 11,597 | (11,199) | 23,950 | (4,643) | |||||||||||||||
| Adjustments: | ||||||||||||||||||||
| Losses on sale of investment securities from portfolio repositioning | — | — | 18,736 | — | 18,736 | |||||||||||||||
Comparable pre-tax, pre-provision net income (non-GAAP) | $ | 12,353 | $ | 11,597 | $ | 7,537 | $ | 23,950 | $ | 14,093 | ||||||||||
| Net income (loss) | ||||||||||||||||||||
Net income (loss) (GAAP) | $ | 9,246 | $ | 8,510 | $ | (8,536) | $ | 17,756 | $ | (3,660) | ||||||||||
| Adjustments: | ||||||||||||||||||||
| Losses on sale of investment securities from portfolio repositioning | — | — | 18,736 | — | 18,736 | |||||||||||||||
Related income tax benefit1 | — | — | (5,538) | — | (5,538) | |||||||||||||||
| Adjustments, net of taxes | — | — | 13,198 | — | 13,198 | |||||||||||||||
| Comparable net income (non-GAAP) | $ | 9,246 | $ | 8,510 | $ | 4,662 | $ | 17,756 | $ | 9,538 | ||||||||||
Diluted earnings (loss) per share | ||||||||||||||||||||
| Weighted average diluted shares | $ | 15,991 | $ | 15,973 | $ | 15,989 | $ | 15,983 | $ | 15,983 | ||||||||||
Diluted earnings (loss) per share (GAAP) | $ | 0.58 | $ | 0.53 | $ | (0.53) | $ | 1.11 | $ | (0.23) | ||||||||||
| Comparable diluted earnings per share (non-GAAP) | $ | 0.58 | $ | 0.53 | $ | 0.29 | $ | 1.11 | $ | 0.60 | ||||||||||
| Return on average assets | ||||||||||||||||||||
| Average assets | $ | 3,850,140 | $ | 3,989,253 | $ | 3,737,794 | $ | 3,919,312 | $ | 3,732,957 | ||||||||||
| Return on average assets (GAAP) | 0.96 | % | 0.87 | % | (0.92) | % | 0.91 | % | (0.20) | % | ||||||||||
| Comparable return on average assets (non-GAAP) | 0.96 | % | 0.87 | % | 0.50 | % | 0.91 | % | 0.52 | % | ||||||||||
| Return on average equity | ||||||||||||||||||||
| Average stockholders' equity | $ | 395,328 | $ | 398,017 | $ | 439,187 | $ | 396,665 | $ | 438,187 | ||||||||||
| Return on average equity (GAAP) | 9.38 | % | 8.67 | % | (7.80) | % | 9.03 | % | (1.68) | % | ||||||||||
| Comparable return on average equity (non-GAAP) | 9.38 | % | 8.67 | % | 4.26 | % | 9.03 | % | 4.39 | % | ||||||||||
| Return on average tangible common equity | ||||||||||||||||||||
| Average goodwill and intangibles | $ | 74,393 | $ | 74,591 | $ | 75,230 | $ | 74,491 | $ | 75,336 | ||||||||||
| Average tangible common equity | $ | 320,935 | $ | 323,426 | $ | 363,957 | $ | 322,174 | $ | 362,851 | ||||||||||
| Return on average tangible common equity (GAAP) | 11.56 | % | 10.67 | % | (9.41) | % | 11.11 | % | (2.03) | % | ||||||||||
| Comparable return on average tangible common equity (non-GAAP) | 11.56 | % | 10.67 | % | 5.14 | % | 11.11 | % | 5.30 | % | ||||||||||
| Efficiency ratio | ||||||||||||||||||||
| Non-interest expense | $ | 21,597 | $ | 22,539 | $ | 20,550 | $ | 44,136 | $ | 40,996 | ||||||||||
| Net interest income | $ | 30,781 | $ | 30,302 | $ | 24,972 | $ | 61,083 | $ | 49,100 | ||||||||||
| Non-interest income (GAAP) | $ | 3,169 | $ | 3,834 | $ | (15,621) | $ | 7,003 | $ | (12,747) | ||||||||||
| Losses on sale of investment securities from portfolio repositioning | $ | — | $ | — | $ | 18,736 | $ | — | $ | 18,736 | ||||||||||
| Non-interest income (non-GAAP) | $ | 3,169 | $ | 3,834 | $ | 3,115 | $ | 7,003 | $ | 5,989 | ||||||||||
| Efficiency ratio (GAAP) | 63.62 | % | 66.03 | % | 219.76 | % | 64.82 | % | 112.77 | % | ||||||||||
| Comparable efficiency ratio (non-GAAP) | 63.62 | % | 66.03 | % | 73.17 | % | 64.82 | % | 74.42 | % | ||||||||||
1Related tax benefit calculated using blended statutory rate of 29.5636% | ||||||||||||||||||||
8
Earnings Call and Webcast Information
Bank of Marin Bancorp (Nasdaq: BMRC) will present its second quarter financial results call via webcast on Monday, July 27, 2026 at 8:30 a.m. PT/11:30 a.m. ET. Investors can listen to the webcast online through Bank of Marin’s website at www.bankofmarin.com. under “Investor Relations.” To listen to the live call, please go to the website at least 15 minutes early to register, download and install any necessary audio software. For those who cannot listen to the live broadcast, a replay will be available at the same website location shortly after the call. Closed captioning will be available during the live webcast, as well as on the webcast replay.
About Bank of Marin Bancorp
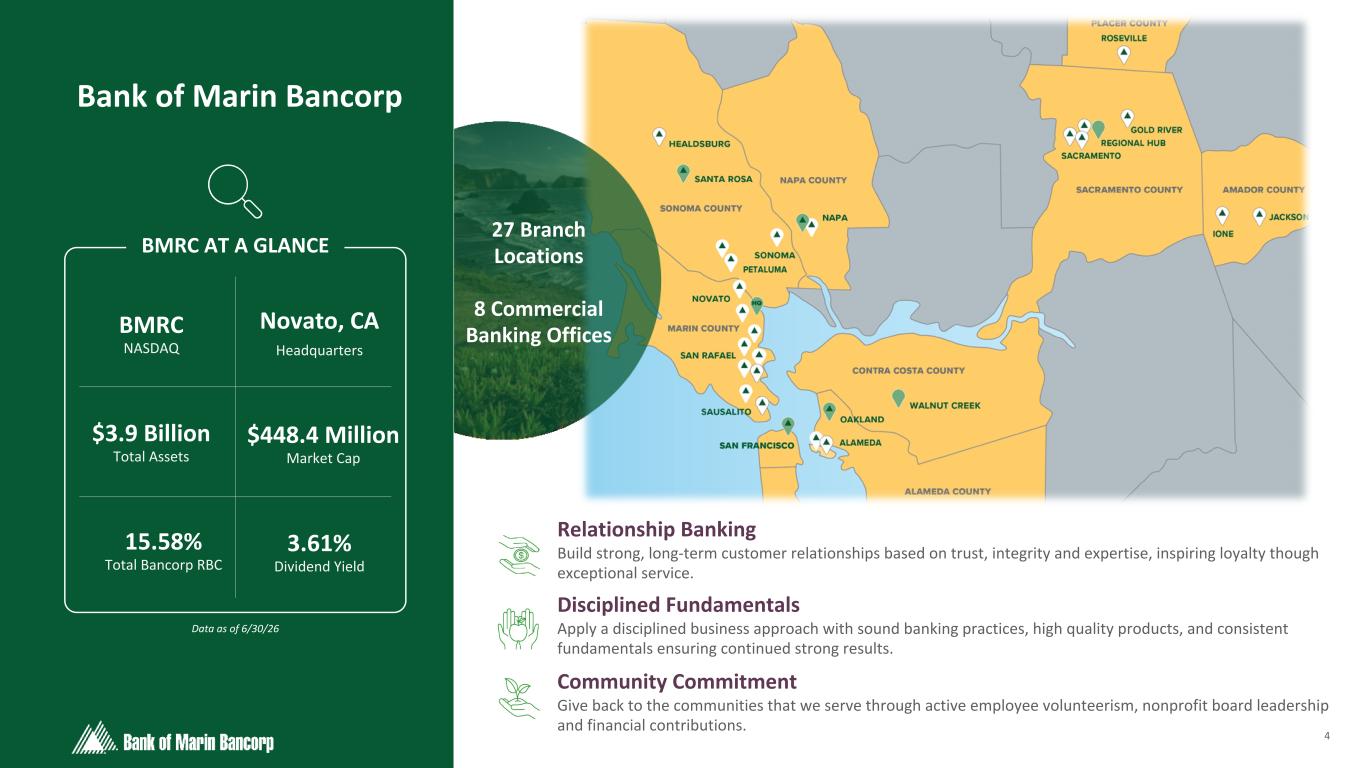
Founded in 1990 and headquartered in Novato, Bank of Marin is the wholly owned subsidiary of Bank of Marin Bancorp (Nasdaq: BMRC). A leading business and community bank with assets of $3.9 billion, Bank of Marin provides commercial and personal banking, specialty lending, and wealth management and trust services throughout its network of 27 branches and eight commercial banking offices serving Northern California. Specializing in providing legendary service to its clients and investing in its local communities, Bank of Marin has consistently been ranked one of the “Top Corporate Philanthropists" by San Francisco Business Times since 2003 and ranked top 13 in Sacramento Business Journal’s 2025 Corporate Direct Giving List. Additional honors include being recognized as one of North Bay Business Journal’s “Best Places to Work” in 2025 and induction into North Bay Biz’s “Best of” Hall of Fame in 2024. Bank of Marin Bancorp is included in the Russell 2000 Small-Cap Index and Nasdaq ABA Community Bank Index. For more information, visit www.bankofmarin.com.
Forward-Looking Statements
This release may contain certain forward-looking statements that are based on management's current expectations regarding economic, legislative, and regulatory issues that may impact Bancorp's earnings in future periods. Forward-looking statements can be identified by the fact that they do not relate strictly to historical or current facts. They often include the words “believe,” “expect,” “intend,” “estimate” or words of similar meaning, or future or conditional verbs such as “will,” “would,” “should,” “could” or “may.” Factors that could cause future results to vary materially from current management expectations include, but are not limited to, general economic conditions and the economic uncertainty in the United States and abroad, including economic or other disruptions to financial markets caused by the Trump administration's approach to tariffs and trade and the military action in Iran, acts of terrorism, war or other conflicts, impacts from inflation, supply chain disruptions, changes in interest rates (including the actions taken by the Federal Reserve to control inflation), California's unemployment rate, deposit flows, real estate values, and expected future cash flows on loans and securities; the impact of adverse developments at other banks, including bank failures, that impact general sentiment regarding the stability and liquidity of banks; costs or effects of acquisitions; competition; changes in accounting principles, policies or guidelines; changes in legislation or regulation; natural disasters (such as wildfires and earthquakes in our area); adverse weather conditions; interruptions of utility service in our markets for sustained periods; and other economic, competitive, governmental, regulatory and technological factors (including external fraud and cybersecurity threats) affecting our operations, pricing, products and services; and successful integration of acquisitions. These and other important factors are detailed in various securities law filings made periodically by Bancorp, copies of which are available from Bancorp without charge. Bancorp undertakes no obligation to release publicly the result of any revisions to these forward-looking statements that may be made to reflect events or circumstances after the date of this press release or to reflect the occurrence of unanticipated events.
9
| BANK OF MARIN BANCORP FINANCIAL HIGHLIGHTS | ||||||||||||||||||||
| Three months ended | Six months ended | |||||||||||||||||||
| (in thousands, except per share amounts; unaudited) | June 30, 2026 | March 31, 2026 | June 30, 2025 | June 30, 2026 | June 30, 2025 | |||||||||||||||
| Selected operating data and performance ratios: | ||||||||||||||||||||
| Net income (loss) | $ | 9,246 | $ | 8,510 | $ | (8,536) | $ | 17,756 | $ | (3,660) | ||||||||||
| Diluted earnings (loss) per common share | $ | 0.58 | $ | 0.53 | $ | (0.53) | $ | 1.11 | $ | (0.23) | ||||||||||
| Return on average assets | 0.96 | % | 0.87 | % | (0.92) | % | 0.91 | % | (0.20) | % | ||||||||||
| Return on average equity | 9.38 | % | 8.67 | % | (7.80) | % | 9.03 | % | (1.68) | % | ||||||||||
| Return on average tangible common equity | 11.55 | % | 10.67 | % | (9.41) | % | 11.11 | % | (2.03) | % | ||||||||||
| Efficiency ratio | 63.62 | % | 66.03 | % | 219.76 | % | 64.82 | % | 112.77 | % | ||||||||||
Tax-equivalent net interest margin | 3.38 | % | 3.24 | % | 2.83 | % | 3.31 | % | 2.80 | % | ||||||||||
| Cost of deposits | 1.28 | % | 1.35 | % | 1.39 | % | 1.32 | % | 1.39 | % | ||||||||||
| Cost of funds | 1.36 | % | 1.43 | % | 1.39 | % | 1.40 | % | 1.39 | % | ||||||||||
| Net charge-offs (recoveries) | $ | 39 | $ | 7,266 | $ | 52 | $ | 7,305 | $ | 877 | ||||||||||
| Net charge-offs to average loans | — | % | 0.34 | % | — | % | 0.35 | % | 0.04 | % | ||||||||||
| (in thousands; unaudited) | June 30, 2026 | March 31, 2026 | December 31, 2025 | ||||||||
| Selected financial condition data: | |||||||||||
| Total assets | $ | 3,856,720 | $ | 3,914,117 | $ | 3,904,778 | |||||
| Loans: | |||||||||||
| Commercial and industrial | $ | 162,434 | $ | 159,028 | $ | 159,898 | |||||
| Real estate: | |||||||||||
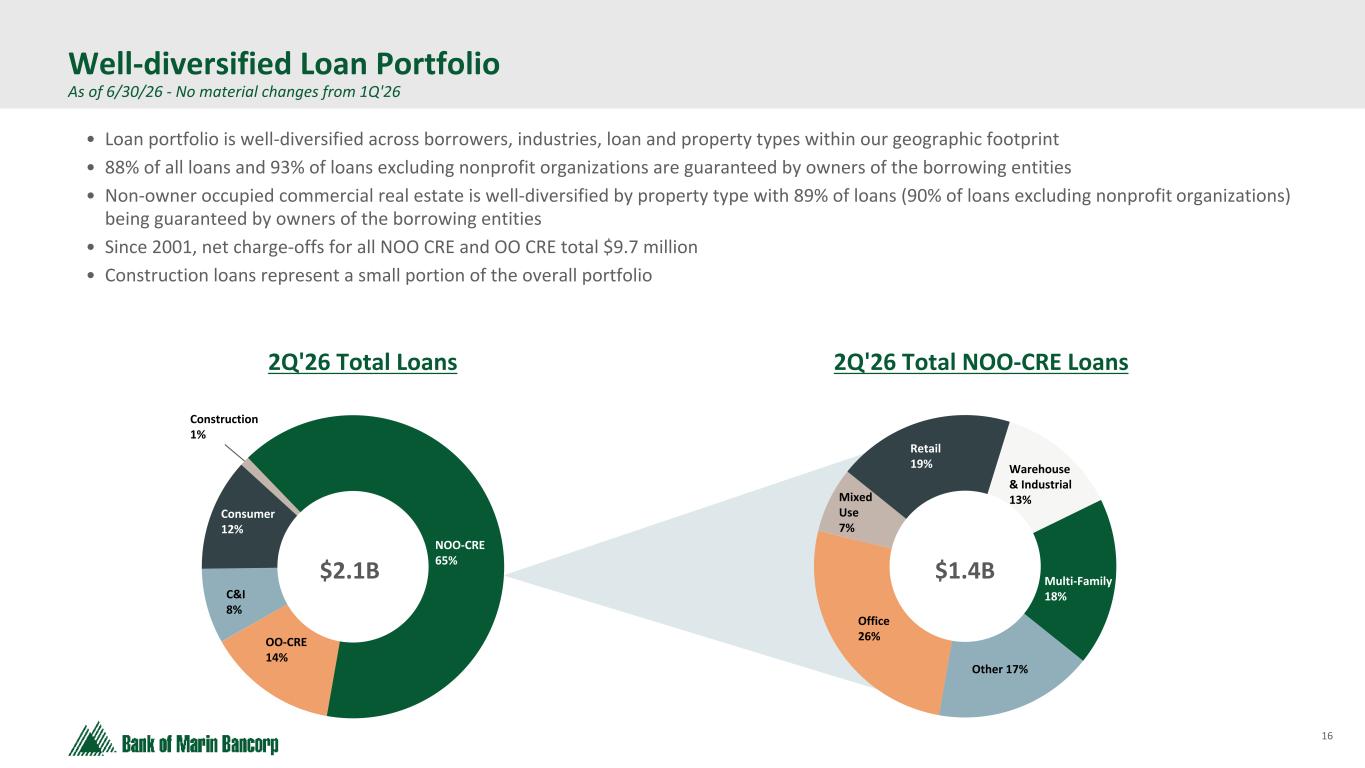
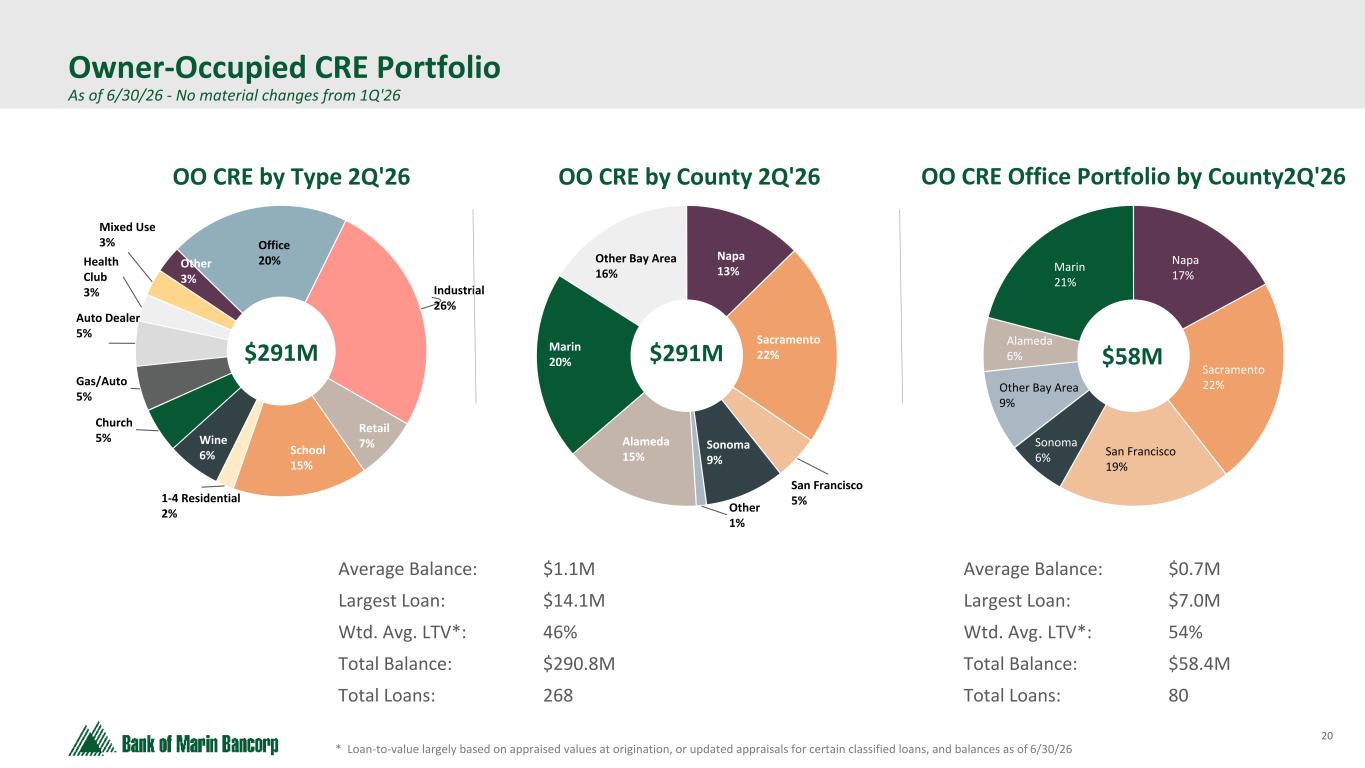
| Commercial owner-occupied | 288,744 | 308,905 | 310,219 | ||||||||
| Commercial non-owner occupied | 1,373,990 | 1,373,332 | 1,366,251 | ||||||||
| Construction | 16,317 | 14,215 | 15,101 | ||||||||
| Home equity | 101,404 | 98,445 | 99,222 | ||||||||
| Other residential | 100,710 | 105,502 | 110,614 | ||||||||
| Installment and other consumer loans | 57,377 | 56,292 | 59,548 | ||||||||
| Total loans | $ | 2,100,976 | $ | 2,115,719 | $ | 2,120,853 | |||||
Non-accrual loans: 1 | |||||||||||
| Commercial and industrial | $ | 5 | $ | 29 | $ | 524 | |||||
| Real estate: | |||||||||||
| Commercial owner-occupied | — | — | 315 | ||||||||
| Commercial non-owner occupied | 8,118 | 8,118 | 25,387 | ||||||||
| Home equity | 219 | 223 | 401 | ||||||||
| Other residential | 67 | 70 | 72 | ||||||||
| Installment and other consumer loans | 44 | 204 | 204 | ||||||||
| Total non-accrual loans | $ | 8,453 | $ | 8,644 | $ | 26,903 | |||||
| Non-accrual loans to total loans | 0.40 | % | 0.41 | % | 1.27 | % | |||||
| Classified loans (graded substandard and doubtful) | $ | 19,877 | $ | 17,939 | $ | 32,111 | |||||
| Classified loans as a percentage of total loans | 0.95 | % | 0.85 | % | 1.51 | % | |||||
| Total accruing loans 30-89 days past due | $ | 2,005 | $ | 683 | $ | 2,843 | |||||
Total accruing loans 90+ days past due 1 | $ | 297 | $ | — | $ | — | |||||
| Allowance for credit losses to total loans | 1.07 | % | 1.08 | % | 1.42 | % | |||||
| Allowance for credit losses to non-accrual loans | 2.66x | 2.64x | 1.12x | ||||||||
| Total deposits | $ | 3,369,900 | $ | 3,428,126 | $ | 3,415,542 | |||||
| Loan-to-deposit ratio | 62.35 | % | 61.72 | % | 62.09 | % | |||||
| Stockholders' equity | $ | 396,684 | $ | 394,492 | $ | 394,654 | |||||
| Book value per share | $ | 24.51 | $ | 24.37 | $ | 24.51 | |||||
Tangible book value per share | $ | 19.92 | $ | 19.77 | $ | 19.87 | |||||
Tangible common equity to tangible assets - Bank | 9.03 | % | 8.70 | % | 8.59 | % | |||||
Tangible common equity to tangible assets - Bancorp | 8.52 | % | 8.33 | % | 8.35 | % | |||||
| Total risk-based capital ratio - Bank | 14.61 | % | 14.09 | % | 13.90 | % | |||||
| Total risk-based capital ratio - Bancorp | 15.58 | % | 15.26 | % | 15.25 | % | |||||
| Tier I Leverage Ratio to Avg Assets - Bancorp | 8.66 | % | 8.23 | % | 8.26 | % | |||||
| Tier I Leverage Ratio to Avg Assets - Bank | 9.16 | % | 8.59 | % | 8.49 | % | |||||
| Full-time equivalent employees | 315 | 309 | 311 | ||||||||
10
BANK OF MARIN BANCORP CONSOLIDATED STATEMENTS OF CONDITION | ||
| (in thousands, except share data; unaudited) | June 30, 2026 | March 31, 2026 | December 31, 2025 | ||||||||
| Assets | |||||||||||
| Cash, cash equivalents and restricted cash | $ | 279,639 | $ | 236,644 | $ | 225,303 | |||||
| Investment securities: | |||||||||||
Available-for-sale (net of zero allowance for credit losses at June 30, 2026, March 31, 2026 and December 31, 2025, respectively) | 1,242,831 | 1,326,191 | 1,327,812 | ||||||||
| Total investment securities | 1,242,831 | 1,326,191 | 1,327,812 | ||||||||
| Loans, at amortized cost | 2,100,976 | 2,115,719 | 2,120,853 | ||||||||
| Allowance for credit losses on loans | (22,464) | (22,823) | (30,089) | ||||||||
| Loans, net of allowance for credit losses on loans | 2,078,512 | 2,092,896 | 2,090,764 | ||||||||
| Goodwill | 72,754 | 72,754 | 72,754 | ||||||||
| Bank-owned life insurance | 71,324 | 71,095 | 71,306 | ||||||||
| Operating lease right-of-use assets | 21,146 | 22,173 | 22,499 | ||||||||
| Bank premises and equipment, net | 8,016 | 7,960 | 8,059 | ||||||||
| Core deposit intangible, net | 1,520 | 1,716 | 1,916 | ||||||||
| Interest receivable and other assets | 80,978 | 82,688 | 84,365 | ||||||||
| Total assets | $ | 3,856,720 | $ | 3,914,117 | $ | 3,904,778 | |||||
| Liabilities and Stockholders' Equity | |||||||||||
| Liabilities | |||||||||||
| Deposits: | |||||||||||
| Non-interest bearing | $ | 1,237,322 | $ | 1,232,228 | $ | 1,254,416 | |||||
| Interest bearing: | |||||||||||
| Transaction accounts | 237,676 | 475,817 | 417,482 | ||||||||
| Savings accounts | 225,353 | 226,680 | 232,109 | ||||||||
| Money market accounts | 1,511,325 | 1,313,266 | 1,305,849 | ||||||||
| Time accounts | 158,224 | 180,135 | 205,686 | ||||||||
| Total deposits | 3,369,900 | 3,428,126 | 3,415,542 | ||||||||
| Borrowings and other obligations | 625 | 668 | 709 | ||||||||
| Subordinated notes, net | 43,955 | 43,905 | 43,905 | ||||||||
| Operating lease liabilities | 23,493 | 24,553 | 24,747 | ||||||||
| Interest payable and other liabilities | 22,063 | 22,373 | 25,269 | ||||||||
| Total liabilities | 3,460,036 | 3,519,625 | 3,510,124 | ||||||||
| Stockholders' Equity | |||||||||||
Preferred stock, no par value, Authorized - 5,000,000 shares, none issued | — | — | — | ||||||||
Common stock, no par value, Authorized - 30,000,000 shares; issued and outstanding - 16,186,611, 16,189,707 and 16,102,687 at June 30, 2026, March 31, 2026 and December 31, 2025, respectively | 216,050 | 215,648 | 214,910 | ||||||||
| Retained earnings | 207,843 | 202,645 | 198,163 | ||||||||
| Accumulated other comprehensive loss, net of taxes | (27,209) | (23,801) | (18,419) | ||||||||
| Total stockholders' equity | 396,684 | 394,492 | 394,654 | ||||||||
| Total liabilities and stockholders' equity | $ | 3,856,720 | $ | 3,914,117 | $ | 3,904,778 | |||||
11
BANK OF MARIN BANCORP CONSOLIDATED STATEMENTS OF COMPREHENSIVE INCOME | ||
| Three months ended | Six months ended | |||||||||||||||||||
| (in thousands, except per share amounts; unaudited) | June 30, 2026 | March 31, 2026 | June 30, 2025 | June 30, 2026 | June 30, 2025 | |||||||||||||||
| Interest income | ||||||||||||||||||||
| Interest and fees on loans | $ | 27,267 | $ | 26,534 | $ | 25,861 | $ | 53,801 | $ | 51,044 | ||||||||||
| Interest on investment securities | 13,427 | 13,869 | 8,423 | 27,296 | 16,684 | |||||||||||||||
| Interest on due from banks | 1,646 | 2,392 | 2,004 | 4,038 | 3,799 | |||||||||||||||
| Total interest income | 42,340 | 42,795 | 36,288 | 85,135 | 71,527 | |||||||||||||||
| Interest expense | ||||||||||||||||||||
| Interest on interest-bearing transaction accounts | 1,462 | 2,039 | 1,291 | 3,501 | 2,452 | |||||||||||||||
| Interest on savings accounts | 635 | 577 | 587 | 1,212 | 1,120 | |||||||||||||||
| Interest on money market accounts | 7,674 | 7,821 | 7,878 | 15,495 | 15,504 | |||||||||||||||
| Interest on time accounts | 965 | 1,242 | 1,559 | 2,207 | 3,349 | |||||||||||||||
| Interest on borrowings and other obligations | 6 | 6 | 1 | 12 | 2 | |||||||||||||||
| Interest on subordinated notes | 817 | 808 | — | 1,625 | — | |||||||||||||||
| Total interest expense | 11,559 | 12,493 | 11,316 | 24,052 | 22,427 | |||||||||||||||
| Net interest income | 30,781 | 30,302 | 24,972 | 61,083 | 49,100 | |||||||||||||||
| (Reversal of) provision for credit losses on loans | (320) | — | — | (320) | 75 | |||||||||||||||
| Provision for credit losses on unfunded loan commitments | — | — | — | — | — | |||||||||||||||
| Net interest income after provision for credit losses | 31,101 | 30,302 | 24,972 | 61,403 | 49,025 | |||||||||||||||
| Non-interest income | ||||||||||||||||||||
| Service charges on deposit accounts | 563 | 563 | 550 | 1,126 | 1,098 | |||||||||||||||
| Wealth management and trust services | 543 | 596 | 612 | 1,139 | 1,175 | |||||||||||||||
| Earnings on bank-owned life insurance, net | 442 | 487 | 429 | 929 | 905 | |||||||||||||||
| Debit card interchange fees, net | 397 | 362 | 410 | 759 | 806 | |||||||||||||||
| Dividends on Federal Home Loan Bank stock | 199 | 855 | 362 | 1,054 | 737 | |||||||||||||||
| Merchant interchange fees, net | 142 | 118 | 90 | 260 | 186 | |||||||||||||||
| Earnings on bank-owned life insurance death benefits | 59 | 479 | 238 | 538 | 306 | |||||||||||||||
| Losses on sale of investment securities | — | — | (18,736) | — | (18,736) | |||||||||||||||
| Other income | 824 | 374 | 424 | 1,198 | 776 | |||||||||||||||
| Total non-interest income (loss) | 3,169 | 3,834 | (15,621) | 7,003 | (12,747) | |||||||||||||||
| Non-interest expense | ||||||||||||||||||||
| Salaries and related benefits | 12,609 | 13,394 | 12,045 | 26,003 | 24,095 | |||||||||||||||
| Occupancy and equipment | 2,090 | 2,099 | 2,226 | 4,189 | 4,332 | |||||||||||||||
| Professional services | 1,371 | 1,093 | 908 | 2,464 | 1,845 | |||||||||||||||
| Data processing | 1,138 | 1,228 | 1,041 | 2,366 | 2,177 | |||||||||||||||
| Federal Deposit Insurance Corporation insurance | 555 | 730 | 421 | 1,285 | 809 | |||||||||||||||
| Information technology | 510 | 515 | 563 | 1,025 | 976 | |||||||||||||||
| Depreciation and amortization | 270 | 263 | 320 | 533 | 642 | |||||||||||||||
| Directors' expense | 261 | 285 | 279 | 546 | 583 | |||||||||||||||
| Amortization of core deposit intangible | 196 | 200 | 220 | 396 | 447 | |||||||||||||||
| Charitable contributions | 190 | 437 | 116 | 627 | 519 | |||||||||||||||
| Deposit network fees | 118 | 149 | 114 | 267 | 228 | |||||||||||||||
| Other expense | 2,289 | 2,146 | 2,297 | 4,435 | 4,343 | |||||||||||||||
| Total non-interest expense | 21,597 | 22,539 | 20,550 | 44,136 | 40,996 | |||||||||||||||
| Income (loss) before provision for (benefit from) income taxes | 12,673 | 11,597 | (11,199) | 24,270 | (4,718) | |||||||||||||||
| Provision for (benefit from) income taxes | 3,427 | 3,087 | (2,663) | 6,514 | (1,058) | |||||||||||||||
| Net income (loss) | $ | 9,246 | $ | 8,510 | $ | (8,536) | $ | 17,756 | $ | (3,660) | ||||||||||
| Net income (loss) per common share | ||||||||||||||||||||
| Basic | $ | 0.58 | $ | 0.53 | $ | (0.53) | $ | 1.11 | $ | (0.23) | ||||||||||
| Diluted | $ | 0.58 | $ | 0.53 | $ | (0.53) | $ | 1.11 | $ | (0.23) | ||||||||||
| Weighted average shares: | ||||||||||||||||||||
| Basic | 15,952 | 15,925 | 15,989 | 15,938 | 15,983 | |||||||||||||||
| Diluted | 15,991 | 15,973 | 15,989 | 15,983 | 15,983 | |||||||||||||||
| Comprehensive income (loss): | ||||||||||||||||||||
| Net income (loss) | $ | 9,246 | $ | 8,510 | $ | (8,536) | $ | 17,756 | $ | (3,660) | ||||||||||
| Other comprehensive (loss) income: | ||||||||||||||||||||
| Change in net unrealized (losses) gains on available-for-sale securities | (4,838) | (7,642) | (486) | (12,480) | 2,803 | |||||||||||||||
| Reclassification adjustment for losses realized on the sale of available-for-sale securities in net loss | — | — | 18,736 | — | 18,736 | |||||||||||||||
| Amortization of net unrealized losses on securities transferred from available-for-sale to held-to-maturity | — | — | 365 | — | 705 | |||||||||||||||
| Other comprehensive (loss) income, before tax | (4,838) | (7,642) | 18,615 | (12,480) | 22,244 | |||||||||||||||
| Deferred tax (benefit) expense | (1,430) | (2,260) | 5,503 | (3,690) | 6,576 | |||||||||||||||
| Other comprehensive (loss) income, net of tax | (3,408) | (5,382) | 13,112 | (8,790) | 15,668 | |||||||||||||||
| Total comprehensive income | $ | 5,838 | $ | 3,128 | $ | 4,576 | $ | 8,966 | $ | 12,008 | ||||||||||
12
| BANK OF MARIN BANCORP | ||
| AVERAGE STATEMENTS OF CONDITION AND ANALYSIS OF NET INTEREST INCOME | ||
| Three months ended | Three months ended | |||||||||||||||||||||||||
| June 30, 2026 | March 31, 2026 | |||||||||||||||||||||||||
| Interest | Interest | |||||||||||||||||||||||||
| Average | Income/ | Yield/ | Average | Income/ | Yield/ | |||||||||||||||||||||
| (in thousands) | Balance | Expense | Rate | Balance | Expense | Rate | ||||||||||||||||||||
| Assets | ||||||||||||||||||||||||||
Interest-earning deposits with banks 1 | $ | 176,889 | $ | 1,646 | 3.68 | % | $ | 265,720 | $ | 2,392 | 3.60 | % | ||||||||||||||
Investment securities 2, 3 | 1,329,846 | 13,465 | 4.05 | % | 1,374,555 | 13,906 | 4.05 | % | ||||||||||||||||||
Loans 1, 3, 4, 5 | 2,113,964 | 27,382 | 5.12 | % | 2,114,052 | 26,646 | 5.04 | % | ||||||||||||||||||
Total interest-earning assets 1 | 3,620,699 | 42,493 | 4.64 | % | 3,754,327 | 42,944 | 4.58 | % | ||||||||||||||||||
| Cash and non-interest-bearing due from banks | 32,830 | 32,496 | ||||||||||||||||||||||||
| Bank premises and equipment, net | 7,965 | 8,007 | ||||||||||||||||||||||||
| Interest receivable and other assets, net | 188,646 | 194,423 | ||||||||||||||||||||||||
| Total assets | $ | 3,850,140 | $ | 3,989,253 | ||||||||||||||||||||||
| Liabilities and Stockholders' Equity | ||||||||||||||||||||||||||
| Interest-bearing transaction accounts | $ | 363,579 | $ | 1,462 | 1.61 | % | $ | 464,323 | $ | 2,039 | 1.78 | % | ||||||||||||||
| Savings accounts | 235,698 | 635 | 1.08 | % | 228,635 | 577 | 1.02 | % | ||||||||||||||||||
| Money market accounts | 1,351,175 | 7,674 | 2.28 | % | 1,367,142 | 7,821 | 2.32 | % | ||||||||||||||||||
| Time accounts including CDARS | 165,017 | 965 | 2.35 | % | 192,553 | 1,242 | 2.62 | % | ||||||||||||||||||
Borrowings and other obligations 1 | 640 | 6 | 3.71 | % | 683 | 6 | 3.66 | % | ||||||||||||||||||
| Subordinated notes, net | 43,923 | 817 | 7.44 | % | 43,873 | 808 | 7.36 | % | ||||||||||||||||||
| Total interest-bearing liabilities | 2,160,032 | 11,559 | 2.15 | % | 2,297,209 | 12,493 | 2.21 | % | ||||||||||||||||||
| Demand accounts | 1,247,995 | 1,244,595 | ||||||||||||||||||||||||
| Interest payable and other liabilities | 46,785 | 49,432 | ||||||||||||||||||||||||
| Stockholders' equity | 395,328 | 398,017 | ||||||||||||||||||||||||
| Total liabilities & stockholders' equity | $ | 3,850,140 | $ | 3,989,253 | ||||||||||||||||||||||
Tax-equivalent net interest income/margin 1 | $ | 30,934 | 3.38 | % | $ | 30,451 | 3.24 | % | ||||||||||||||||||
Reported net interest income/margin 1 | $ | 30,781 | 3.36 | % | $ | 30,302 | 3.23 | % | ||||||||||||||||||
| Tax-equivalent net interest rate spread | 2.49 | % | 2.37 | % | ||||||||||||||||||||||
| Six months ended | Six months ended | |||||||||||||||||||||||||
| June 30, 2026 | June 30, 2025 | |||||||||||||||||||||||||
| Interest | Interest | |||||||||||||||||||||||||
| Average | Income/ | Yield/ | Average | Income/ | Yield/ | |||||||||||||||||||||
| (in thousands) | Balance | Expense | Rate | Balance | Expense | Rate | ||||||||||||||||||||
| Assets | ||||||||||||||||||||||||||
Interest-earning deposits with banks 1 | $ | 221,059 | $ | 4,038 | 3.63 | % | $ | 172,136 | $ | 3,799 | 4.39 | % | ||||||||||||||
Investment securities 2, 3 | 1,352,077 | 27,370 | 4.05 | % | 1,269,850 | 16,822 | 2.65 | % | ||||||||||||||||||
Loans 1, 3, 4, 5 | 2,114,008 | 54,028 | 5.08 | % | 2,073,423 | 51,254 | 4.92 | % | ||||||||||||||||||
Total interest-earning assets 1 | 3,687,144 | 85,436 | 4.61 | % | 3,515,409 | 71,875 | 4.07 | % | ||||||||||||||||||
| Cash and non-interest-bearing due from banks | 32,664 | 37,608 | ||||||||||||||||||||||||
| Bank premises and equipment, net | 7,986 | 7,046 | ||||||||||||||||||||||||
| Interest receivable and other assets, net | 191,518 | 172,894 | ||||||||||||||||||||||||
| Total assets | $ | 3,919,312 | $ | 3,732,957 | ||||||||||||||||||||||
| Liabilities and Stockholders' Equity | ||||||||||||||||||||||||||
| Interest-bearing transaction accounts | $ | 413,673 | $ | 3,501 | 1.71 | % | $ | 339,058 | $ | 2,452 | 1.46 | % | ||||||||||||||
| Savings accounts | 232,186 | 1,212 | 1.05 | % | 224,798 | 1,120 | 1.00 | % | ||||||||||||||||||
| Money market accounts | 1,359,115 | 15,495 | 2.30 | % | 1,210,326 | 15,504 | 2.58 | % | ||||||||||||||||||
| Time accounts including CDARS | 178,709 | 2,207 | 2.49 | % | 223,057 | 3,349 | 3.03 | % | ||||||||||||||||||
Borrowings and other obligations 1 | 661 | 12 | 3.61 | % | 111 | 2 | 3.08 | % | ||||||||||||||||||
FHLB long-term borrowings 1 | — | — | — | % | — | — | — | % | ||||||||||||||||||
Subordinated debenture 1, 5 | 43,898 | 1,625 | 7.40 | % | — | — | — | % | ||||||||||||||||||
| Total interest-bearing liabilities | 2,228,242 | 24,052 | 2.18 | % | 1,997,350 | 22,427 | 2.26 | % | ||||||||||||||||||
| Demand accounts | 1,246,304 | 1,252,711 | ||||||||||||||||||||||||
| Interest payable and other liabilities | 48,101 | 44,709 | ||||||||||||||||||||||||
| Stockholders' equity | 396,665 | 438,187 | ||||||||||||||||||||||||
| Total liabilities & stockholders' equity | $ | 3,919,312 | $ | 3,732,957 | ||||||||||||||||||||||
Tax-equivalent net interest income/margin 1 | $ | 61,384 | 3.31 | % | $ | 49,448 | 2.80 | % | ||||||||||||||||||
Reported net interest income/margin 1 | $ | 61,083 | 3.29 | % | $ | 49,100 | 2.78 | % | ||||||||||||||||||
| Tax-equivalent net interest rate spread | 2.43 | % | 1.81 | % | ||||||||||||||||||||||
1 Interest income/expense is divided by actual number of days in the period times 360 days to correspond to stated interest rate terms, where applicable. | ||||||||||||||||||||||||||
2 Yields on available-for-sale securities are calculated based on amortized cost balances rather than fair value, as changes in fair value are reflected as a component of stockholders' equity. Investment security interest is earned on 30/360 day basis monthly. | ||||||||||||||||||||||||||
3 Yields and interest income on tax-exempt securities and loans are presented on a taxable-equivalent basis using the Federal statutory rate of 21 percent. | ||||||||||||||||||||||||||
4 Average balances on loans outstanding include non-performing loans. The amortized portion of net loan origination fees is included in interest income on loans, representing an adjustment to the yield. | ||||||||||||||||||||||||||
5 Net loan origination costs in interest income totaled $427 thousand, $398 thousand and $399 thousand for the three months ended June 30, 2026, March 31, 2026 and June 30, 2025 and totaled $825 thousand and $764 thousand for the six months ended June 30, 2026 and 2025, respectively. | ||||||||||||||||||||||||||
13