EXHIBIT 99.1
For Immediate Release
October 29, 2025
| | | | | |
Company Contact: Brent Maedl Director, Corporate Finance & Investor Relations 585.382.8507 | |
Broadstone Net Lease Announces Third Quarter 2025 Results
VICTOR, N.Y. – Broadstone Net Lease, Inc. (NYSE: BNL) (“BNL”, the “Company”, “we”, “our”, or “us”), today announced its operating results for the quarter ended September 30, 2025.
MANAGEMENT COMMENTARY
“Our strong third-quarter results reflect the continued success of our differentiated growth strategy as well as the deep expertise and strategic acumen of our team," said John Moragne, BNL's Chief Executive Officer. "This quarter we invested $204 million in an attractive pipeline of accretive acquisitions and development projects, collected 100% of our rents, resolved both the At Home and Claire's situations with all leases assumed and no bad debt incurred from either, and secured 1.2% sequential quarterly growth in contractual rental obligations. As a result, and reflecting our year-to-date success and our ongoing commitment to driving long-term shareholder value, we are raising our full-year guidance to $1.49 to $1.50 of AFFO per share, representing 4.2% to 4.9% growth for the year. We are proud of what we have accomplished so far but are no less determined to push BNL even higher."
THIRD QUARTER 2025 HIGHLIGHTS
| | | | | |
OPERATING
RESULTS | •Generated net income of $27.1 million, or $0.14 per diluted share, representing a 26.3% decrease compared to the same period in the prior year. The decrease is primarily related to a $10.1 million increase in interest expenses and a $5.9 million increase in the provision for impairment of investment in rental properties. |
•Generated adjusted funds from operations (“AFFO”) of $74.3 million, or $0.37 per diluted share, representing a 5.7% increase compared to the same period in the previous year. |
•Incurred $10.0 million of general and administrative expenses, representing a 14.4% increase compared to the same period in the prior year. Incurred core general and administrative expenses of $7.4 million, which excludes $2.5 million of stock-based compensation, and $0.1 million of non-capitalized transaction costs, representing an 8.7% increase compared to the same period in the prior year. Increases are largely driven by updated expectations for performance based incentives, and core general and administrative expenses remain in-line with full year guidance expectations. |
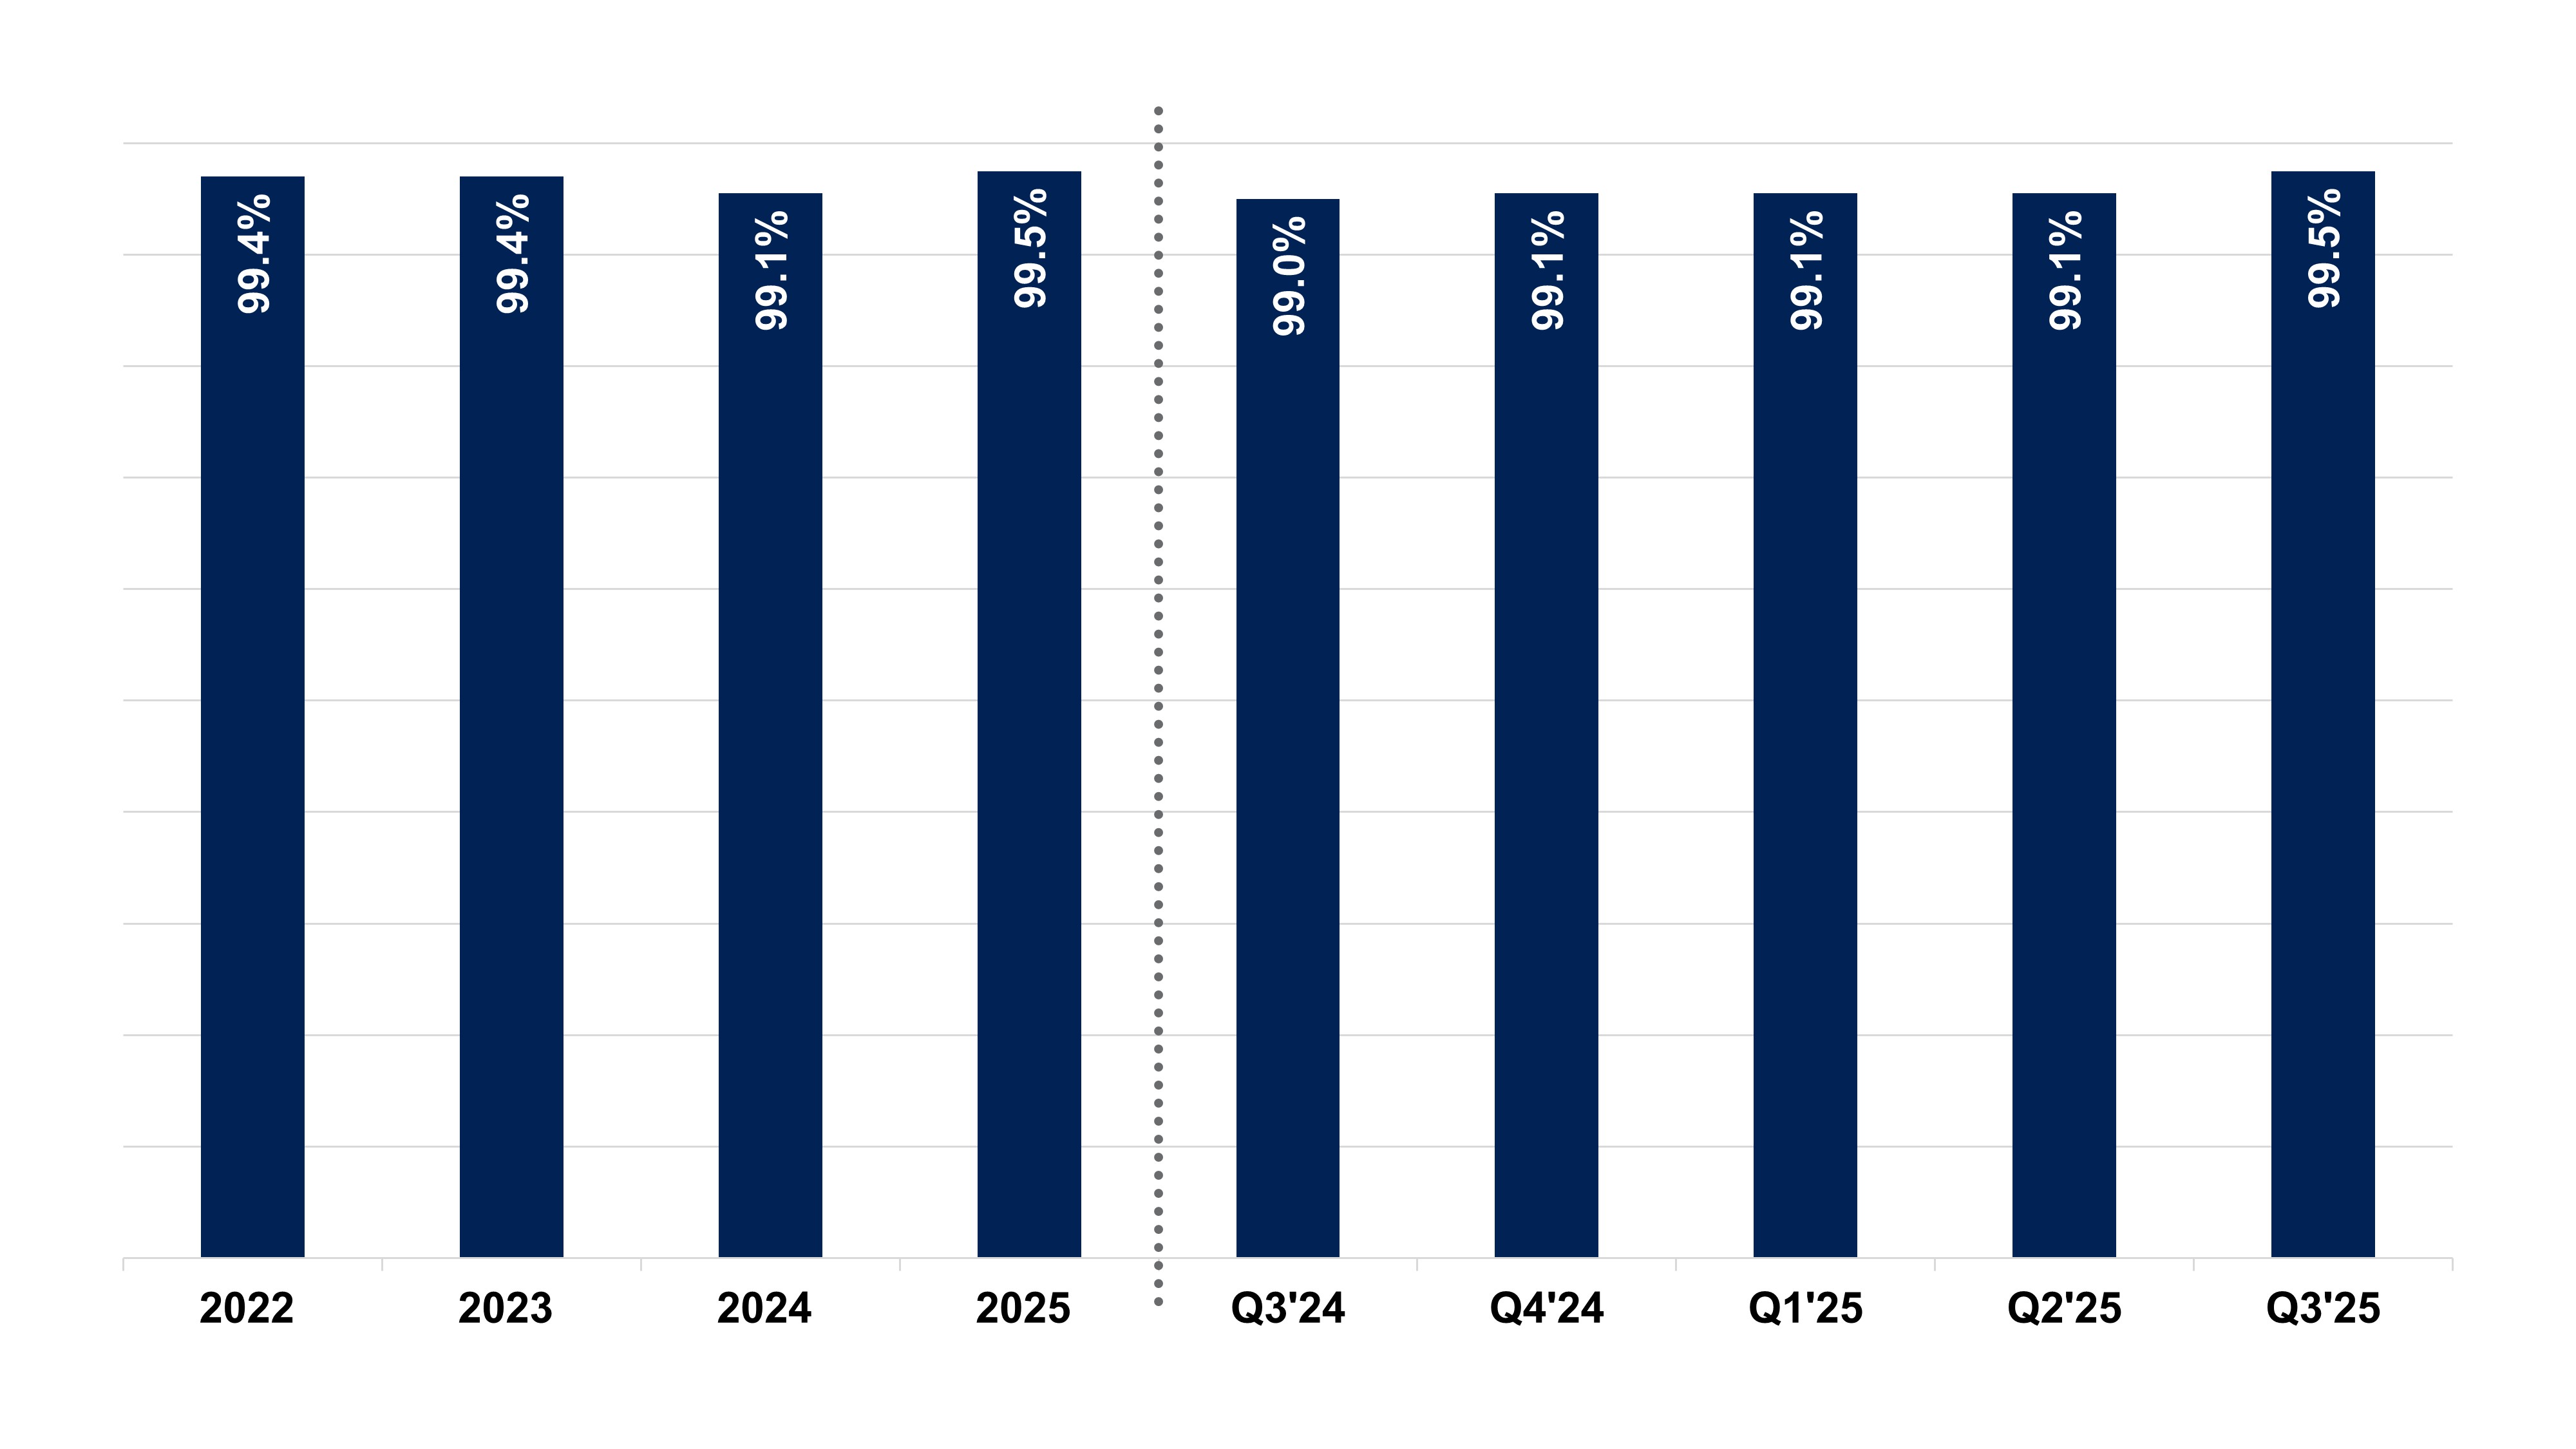
•Portfolio was 99.5% leased based on rentable square footage, with only three of our 759 properties vacant and not subject to a lease at quarter end. |
•Collected 100.0% of base rents due for the quarter for all properties under lease. |
•Successfully navigated through At Home and Claire's bankruptcy proceedings with all leases assumed and no concessions on rent. As a result of the lease assumptions, the Company does not anticipate realizing any lost rent in 2025 associated with either tenant, with Claire's already paid in full for 2025. |
| INVESTMENT & DISPOSITION ACTIVITY | •Invested $203.9 million quarter-to-date, including $139.5 million in new property acquisitions, $41.0 million in build-to-suit developments, $17.9 million in transitional capital, and $5.5 million in revenue generating capital expenditures. The completed acquisitions and revenue generating capital expenditures had a weighted average initial cash capitalization rate, lease term, and annual rent increase of 7.1%, 12.2 years, and 2.4%, respectively. The completed acquisitions had a weighted average straight-line yield of 8.1%. |
•Through the third quarter, we invested $433.0 million, including $253.2 million in new property acquisitions, $130.8 million in build-to-suit developments, $40.7 million in transitional capital, and $8.3 million in revenue generating capital expenditures. The completed acquisitions and revenue generating capital expenditures had a weighted average initial cash capitalization rate, lease term, and annual rent increase of 7.1%, 12.3 years, and 2.5%, respectively. The completed acquisitions have a weighted average straight-line yield of 8.2%. |
•Subsequent to quarter end through October 24, we invested $119.6 million, consisting of $100.2 million in new property acquisitions of industrial properties and $19.4 million of build-to-suit developments, bringing total year-to-date investment activity to $552.6 million. |
•We have a total of $235.8 million in remaining estimated investments for build-to-suit developments to be funded through the fourth quarter of 2026. Additionally, we have $67.0 million of acquisitions under control and $1.0 million of commitments to fund revenue generating capital expenditures with existing tenants. |
•During the quarter, we sold 12 properties for gross proceeds of $38.7 million at a weighted average cash capitalization rate of 7.0% on tenanted properties. |
| | | | | |
| CAPITAL MARKETS ACTIVITY | •On September 26, 2025, we completed a public offering of $350.0 million 5.00% senior unsecured notes due in 2032, issued at 99.15% of the principal amount. The proceeds were used to repay borrowings on the unsecured revolving credit facility, to fund investments in real estate, and for general corporate purposes. In conjunction with this offering, we terminated $335 million in existing interest rate swaps to realign our notional swap value with our floating rate exposure as a result of our public bond offering. |
| •Ended the quarter with total outstanding debt of $2.4 billion, Net Debt of $2.3 billion, a Net Debt to Annualized Adjusted EBITDAre ratio of 5.7x, and a Pro Forma Net Debt to Annualized Adjusted EBITDAre ratio of 5.4x. |
| •As of September 30, 2025, we had $904.2 million of capacity on our unsecured revolving credit facility. |
| •Declared a quarterly dividend of $0.29 per share. |
SUMMARIZED FINANCIAL RESULTS
| | | | | | | | | | | | | | | | | | | | | | | | | | | | | | | | |
| | For the Three Months Ended | | For the Nine Months Ended |
| (in thousands, except per share data) | | September 30,
2025 | | June 30,
2025 | | September 30,
2024 | | September 30,
2025 | | September 30,
2024 |
| Revenues | | $ | 114,167 | | | $ | 112,986 | | | $ | 108,397 | | | $ | 335,843 | | | $ | 319,670 | |
| | | | | | | | | | |
| Net income, including non-controlling interests | | $ | 27,065 | | | $ | 19,830 | | | $ | 37,268 | | | $ | 64,388 | | | $ | 141,382 | |
| Net earnings per share – diluted | | $ | 0.14 | | | $ | 0.10 | | | $ | 0.19 | | | $ | 0.33 | | | $ | 0.72 | |
| | | | | | | | | | |
| FFO | | $ | 70,969 | | | $ | 73,695 | | | $ | 73,818 | | | $ | 217,291 | | | $ | 220,679 | |
| FFO per share | | $ | 0.36 | | | $ | 0.37 | | | $ | 0.37 | | | $ | 1.10 | | | $ | 1.12 | |
| | | | | | | | | | |
| Core FFO | | $ | 70,386 | | | $ | 77,150 | | | $ | 73,971 | | | $ | 222,816 | | | $ | 221,045 | |
| Core FFO per share | | $ | 0.35 | | | $ | 0.39 | | | $ | 0.37 | | | $ | 1.12 | | | $ | 1.12 | |
| | | | | | | | | | |
| AFFO | | $ | 74,314 | | | $ | 74,308 | | | $ | 70,185 | | | $ | 220,434 | | | $ | 211,460 | |
| AFFO per share | | $ | 0.37 | | | $ | 0.38 | | | $ | 0.35 | | | $ | 1.11 | | | $ | 1.07 | |
| | | | | | | | | | |
| Diluted Weighted Average Shares Outstanding | | 197,632 | | 197,138 | | 196,932 | | 197,476 | | 196,799 |
FFO, Core FFO, and AFFO are measures that are not calculated in accordance with accounting principles generally accepted in the United States of America (“GAAP”). See the Reconciliation of Non-GAAP Measures later in this press release.
REAL ESTATE PORTFOLIO UPDATE
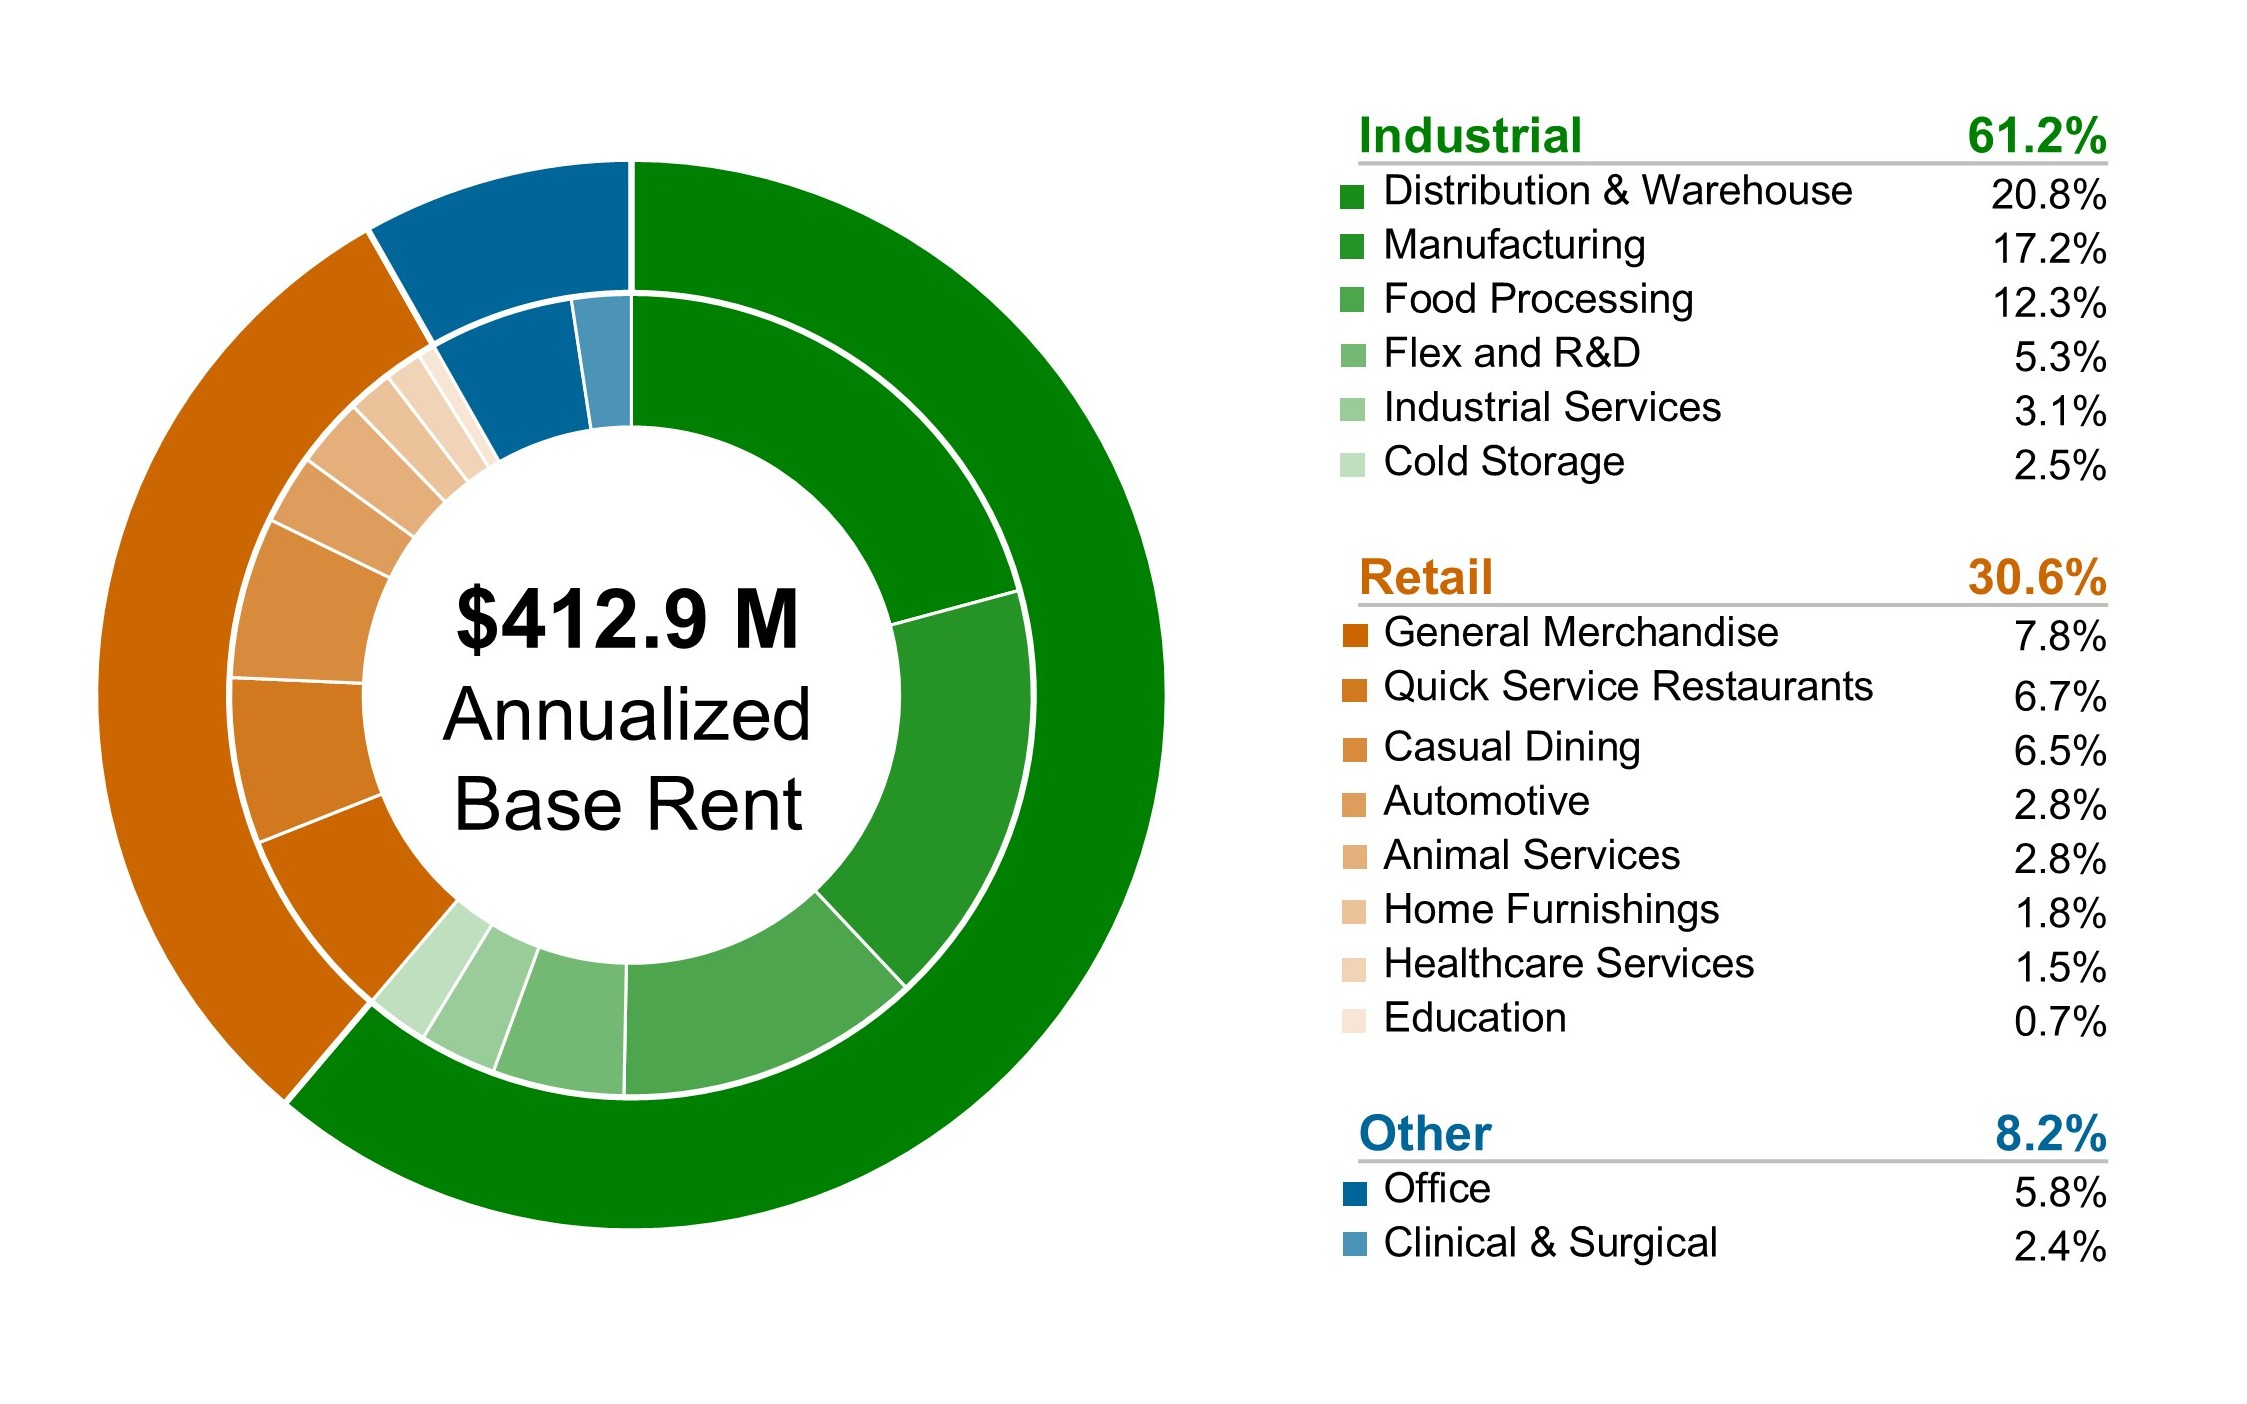
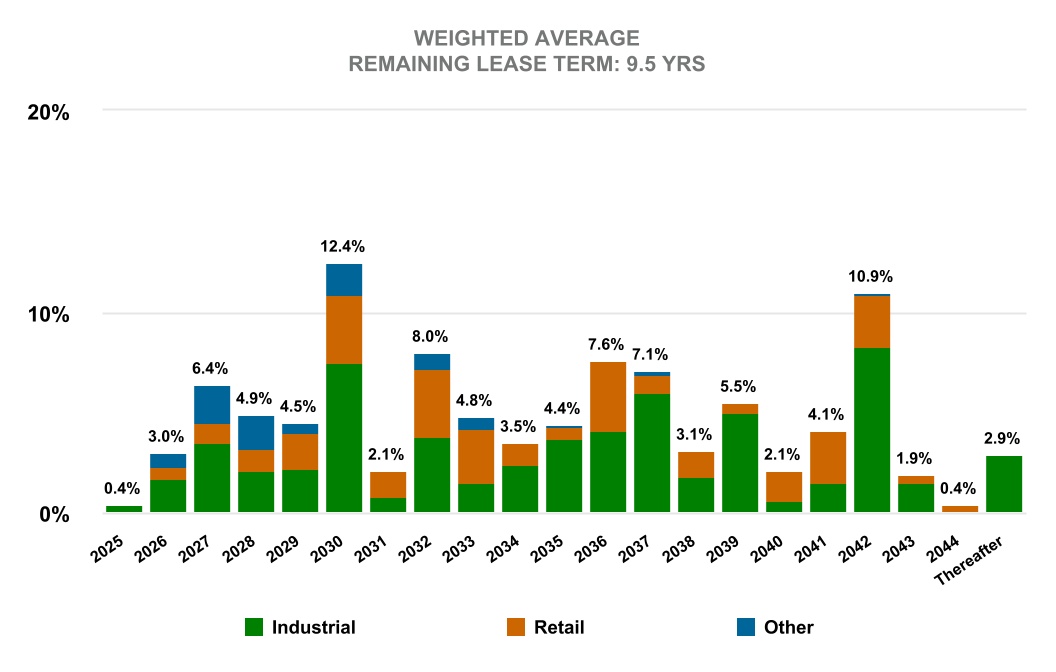
As of September 30, 2025, we owned a diversified portfolio of 759 individual net leased commercial properties with 752 properties located in 44 U.S. states and seven properties located in four Canadian provinces, comprising approximately 40.7 million rentable square feet of operational space. As of September 30, 2025, all but three of our properties were subject to a lease, and our properties were occupied by 204 different commercial tenants, with no single tenant accounting for more than 3.9% of our annualized base rent (“ABR”). Properties subject to a lease represent 99.5% of our portfolio’s rentable square footage. The ABR weighted average lease term and ABR weighted average annual rent increase, pursuant to leases on properties in the portfolio as of September 30, 2025, was 9.5 years and 2.0%, respectively.
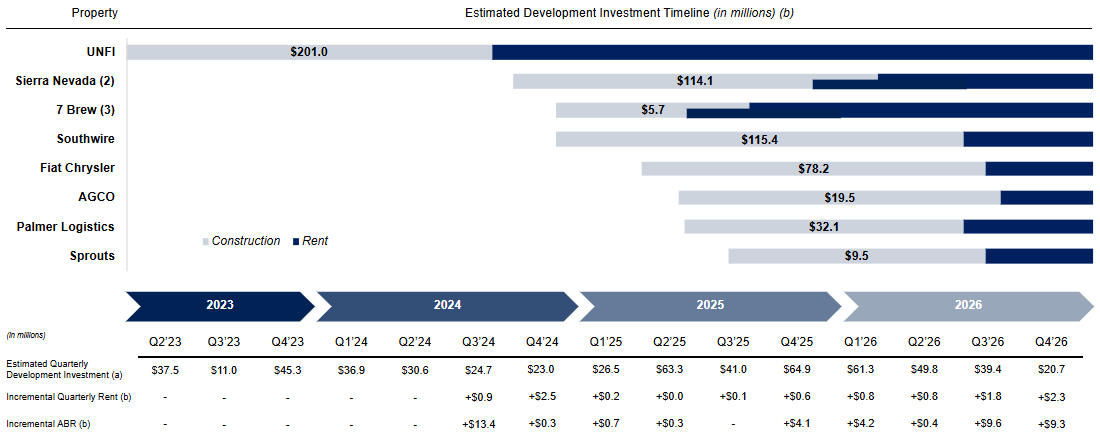
BUILD-TO-SUIT DEVELOPMENT PROJECTS
The following table summarizes our in-process and stabilized developments as of October 24, 2025. We have secured the land and started construction on eight in-process developments.
| | | | | | | | | | | | | | | | | | | | | | | | | | | | | | | | | | | | | | | | | | | | | | | | | | | | | | | | | | | | | | |
| Property | | Projected Rentable Square Feet | | Start Date | | Target Stabilization Date/Stabilized Date (c) | | Lease Term (Years) | | Annual Rent Escalations | | Estimated Total Project Investment (d) | | Cumulative Investment | | Estimated Remaining Investment | | Estimated Cash Capitalization Rate (e) | | Estimated Straight-line Yield |
| In-process retail: | | | | | | | | | | | | | | | | | | | | |
7 Brew
(Jacksonville - FL) | | 1 | | Jun. 2025 | | Oct. 2025 | | 15.0 | | 1.9 | % | | $ | 2,008 | | | $ | 1,411 | | | $ | 597 | | | 8.0 | % | | 8.8 | % |
Sprouts
(Bedford, TX) | | 22 | | Jul. 2025 | | Aug. 2026 | | 15.0 | | 0.9 | % | | $ | 9,533 | | | $ | 405 | | | $ | 9,128 | | | 7.2 | % | | 7.7 | % |
| In-process industrial: | | | | | | | | | | | | | | | | | | | | |
Sierra Nevada
(Dayton - OH) | | 122 | | Oct. 2024 | | Nov. 2025 | | 15.0 | | 3.0 | % | | 58,563 | | | 47,625 | | | $ | 10,938 | | | 7.5 | % | | 9.3 | % |
Sierra Nevada
(Dayton - OH) | | 122 | | Oct. 2024 | | Mar. 2026 | | 15.0 | | 3.0 | % | | 55,525 | | | 32,718 | | | $ | 22,807 | | | 7.7 | % | | 9.6 | % |
Southwire
(Bremen - GA) | | 1,178 | | Dec. 2024 | | Oct. 2026 | | 10.0 | | 2.8 | % | | 115,411 | | | 26,682 | | | $ | 88,729 | | | 7.8 | % | | 8.8 | % |
| Fiat Chrysler Automobile (Forsyth - GA) | | 422 | | Apr. 2025 | | Aug. 2026 | | 15.0 | | 2.8 | % | | 78,242 | | | 24,682 | | | $ | 53,560 | | | 6.9 | % | | 8.4 | % |
AGCO
(Vasaila - CA) | | 115 | | Jun. 2025 | | Aug. 2026 | | 12.0 | | 3.5 | % | | 19,523 | | | 14,317 | | | $ | 5,206 | | | 7.0 | % | | 8.5 | % |
Palmer Logistics (Midlothian, TX) (b) | | 270 | | Jul. 2025 | | Jul. 2026 | | 12.3 | | 3.5 | % | | 32,063 | | | 6,646 | | | $ | 25,417 | | | 7.6 | % | | 9.2 | % |
| | | | | | | | | | | | | | | | | | | | |
| Total / weighted average | | 2,252 | | | | | | 13.1 | | 2.9 | % | | 370,868 | | | 154,486 | | | 216,382 | | | 7.5 | % | | 8.9 | % |
| Stabilized industrial: | | | | | | | | | | | | | | | | | | | | |
UNFI
(Sarasota - FL) | | 1,016 | | May 2023 | | Stabilized - Sep. 2024 | | 15.0 | | 2.5 | % | | 200,958 | | | 200,958 | | | — | | | 7.2 | % | | 8.6 | % |
| Stabilized retail: | | | | | | | | | | | | | | | | | | | | |
7 Brew
(High Point - NC) | | 1 | | Dec. 2024 | | Stabilized - Jun. 2025 | | 15.0 | | 1.9 | % | | 1,975 | | | 1,975 | | | — | | | 8.0 | % | | 8.8 | % |
7 Brew
(Charleston - SC) | | 1 | | Feb. 2025 | | Stabilized - May 2025 | | 15.0 | | 1.9 | % | | 1,729 | | | 1,729 | | | — | | | 7.9 | % | | 8.8 | % |
| | | | | | | | | | | | | | | | | | | | |
| Total / weighted average | | 3,270 | | | | | | | 13.7 | | 2.7 | % | | $ | 575,530 | | | $ | 359,148 | | | $ | 216,382 | | | 7.4 | % | | 8.8 | % |
(a)Represents our pro-rata share of the estimated first year yield to be generated on a real estate investment, which was computed at the time of investment based on the estimated annual straight-line rental income computed in accordance with GAAP, divided by the estimated total project investment.
(b)Development represents our common and preferred equity investments in a consolidated joint venture, and exclude amounts attributed to non-controlling interest holders.
DISTRIBUTIONS
At its October 23, 2025, meeting our board of directors declared a quarterly dividend of $0.29 per common share and OP Unit to holders of record as of December 31, 2025, payable on or before January 15, 2026.
2025 GUIDANCE
For 2025, BNL expects to report AFFO of $1.49 to $1.50 per diluted share, revised up from $1.48 to $1.50, as a result of our portfolio's strong year-to-date performance.
The guidance is based on the following key assumptions:
(i)investments in real estate properties between $650 million and $750 million, revised up from $500 to $700 million;
(ii)dispositions of real estate properties between $75 million and $100 million, revised up from $50 million to $100 million; and
(iii)total core general and administrative expenses between $30 million to $31 million.
Our per share results are sensitive to both the timing and amount of real estate investments, property dispositions, and capital markets activities that occur throughout the year.
The Company does not provide guidance for the most comparable GAAP financial measure, net income, or a reconciliation of the forward-looking non-GAAP financial measure of AFFO to net income computed in accordance with GAAP, because it is unable to reasonably predict, without unreasonable efforts, certain items that would be contained in the GAAP measure, including items that are not indicative of the Company’s ongoing operations, including, without limitation, potential impairments of real estate assets, net gain/loss on dispositions of real estate assets, changes in allowance for credit losses, and stock-based compensation expense. These items are uncertain, depend on various factors, and could have a material impact on the Company’s GAAP results for the guidance periods.
CONFERENCE CALL AND WEBCAST
The Company will host its earnings conference call and audio webcast on Thursday, October 30, 2025, at 11:00 a.m. Eastern Time.
To access the live webcast, which will be available in listen-only mode, please visit: https://events.q4inc.com/attendee/532774299. If you prefer to listen via phone, U.S. participants may dial: 1-833-470-1428 (toll free) or 1-646-844-6383 (local), access code 237687. International access numbers are viewable here: https://www.netroadshow.com/conferencing/global-numbers?confId=89850.
A replay of the conference call webcast will be available approximately one hour after the conclusion of the live broadcast. To listen to a replay of the call via the web, which will be available for one year, please visit: https://investors.bnl.broadstone.com.
About Broadstone Net Lease, Inc.
BNL is an industrial-focused, diversified net lease REIT that invests in primarily single-tenant commercial real estate properties that are net leased on a long-term basis to a diversified group of tenants. Utilizing an investment strategy underpinned by strong fundamental credit analysis and prudent real estate underwriting, as of September 30, 2025, BNL’s diversified portfolio consisted of 759 individual net leased commercial properties with 752 properties located in 44 U.S. states and seven properties located in four Canadian provinces across the industrial, retail, and other property types.
Forward-Looking Statements
This press release contains “forward-looking” statements within the meaning of Section 27A of the Securities Act of 1933, as amended, and Section 21E of the Securities Exchange Act of 1934, as amended, regarding, among other things, our plans, strategies, and prospects, both business and financial. Such forward-looking statements can generally be identified by our use of forward-looking terminology such as “outlook,” “potential,” “may,” “will,” “should,” “could,” “seeks,” “approximately,” “projects,” “predicts,” “expect,” “intends,” “anticipates,” “estimates,” “plans,” “would be,” “believes,” “continues,” or the negative version of these words or other comparable words. Forward-looking statements, including our 2025 guidance and assumptions, involve known and unknown risks and uncertainties, which may cause BNL’s actual future results to differ materially from expected results, including, without limitation, risks and uncertainties related to general economic conditions, including but not limited to increases in the rate of inflation and/or interest rates, local real estate conditions, tenant financial health, property investments and acquisitions, and the timing and uncertainty of completing these property investments and acquisitions, and uncertainties regarding future distributions to our stockholders. These and other risks, assumptions, and uncertainties are described in Item 1A “Risk Factors” of the Company’s Annual Report on Form 10-K for the fiscal year ended December 31, 2024, which the Company filed with the SEC on February 20, 2025, and the Company’s Quarterly Report on Form 10-Q for the quarter ended March 31, 2025, which was filed with the SEC on May 1, 2025, both of which you are encouraged to read, and will be available on the SEC’s website at www.sec.gov. Please note that such Risk Factors will be updated, if necessary, through the filing of Quarterly Reports on Form 10-Q. Should one or more of these risks or uncertainties materialize, or should underlying assumptions prove incorrect, actual results may vary materially from those indicated or anticipated by such forward-looking statements. Accordingly, you are cautioned not to place undue reliance on these forward-looking statements, which speak only as of the date they are made. The Company assumes no obligation to, and does not currently intend to, update any forward-looking statements after the date of this press release, whether as a result of new information, future events, changes in assumptions, or otherwise.
Notice Regarding Non-GAAP Financial Measures
In addition to our reported results and net earnings per diluted share, which are financial measures presented in accordance with GAAP, this press release contains and may refer to certain non-GAAP financial measures, including Funds from Operations (“FFO”), Core Funds From Operations (“Core FFO”), AFFO, Net Debt, and Net Debt to Annualized Adjusted EBITDAre. We believe the use of FFO, Core FFO, and AFFO are useful to investors because they are widely accepted industry measures used by analysts and investors to compare the operating performance of REITs. FFO, Core FFO, and AFFO should not be considered alternatives to net income as a performance measure or to cash flows from operations, as reported on our statement of cash flows, or as a liquidity measure, and should be considered in addition to, and not in lieu of, GAAP financial measures. We believe presenting Net Debt to Annualized Adjusted EBITDAre is useful to investors because it provides information about gross debt less cash and cash equivalents, which could be used to repay debt, compared to our performance as measured using Annualized Adjusted EBITDAre. You should not consider our Annualized Adjusted EBITDAre as an alternative to net income or cash flows from operating activities determined in accordance with GAAP. A reconciliation of non-GAAP measures to the most directly comparable GAAP financial measure and statements of why management believes these measures are useful to investors are included below.
Broadstone Net Lease, Inc. and Subsidiaries
Condensed Consolidated Balance Sheets
(in thousands, except per share amounts)
| | | | | | | | | | | |
| September 30,
2025 | | December 31,
2024 |
| Assets | | | |
| Accounted for using the operating method: | | | |
| Land | $ | 778,177 | | | $ | 778,826 | |
| Land improvements | 359,210 | | | 357,142 | |
| Buildings and improvements | 3,954,112 | | | 3,815,521 | |
| Equipment | 16,070 | | | 15,843 | |
| Total accounted for using the operating method | 5,107,569 | | | 4,967,332 | |
| Less accumulated depreciation | (745,326) | | | (672,478) | |
| Accounted for using the operating method, net | 4,362,243 | | | 4,294,854 | |
| Accounted for using the direct financing method | 25,673 | | | 26,154 | |
| Accounted for using the sales-type method | 14,407 | | | 571 | |
| Property under development | 179,172 | | | 18,784 | |
| Investment in rental property, net | 4,581,495 | | | 4,340,363 | |
| Cash and cash equivalents | 81,966 | | | 14,845 | |
| Accrued rental income | 174,867 | | | 162,717 | |
| Tenant and other receivables, net | 3,573 | | | 3,281 | |
| Prepaid expenses and other assets | 59,866 | | | 41,584 | |
| Interest rate swap, assets | 19,590 | | | 46,220 | |
| Goodwill | 339,769 | | | 339,769 | |
| Intangible lease assets, net | 258,145 | | | 267,638 | |
| Total assets | $ | 5,519,271 | | | $ | 5,216,417 | |
| | | |
| Liabilities and equity | | | |
| Unsecured revolving credit facility | $ | 95,824 | | | $ | 93,014 | |
| Mortgages, net | 57,168 | | | 76,846 | |
| Unsecured term loans, net | 994,550 | | | 897,201 | |
| Senior unsecured notes, net | 1,190,315 | | | 846,064 | |
| Interest rate swap, liabilities | 1,994 | | | — | |
| Accounts payable and other liabilities | 55,662 | | | 48,983 | |
| Dividends payable | 58,665 | | | 58,317 | |
| Accrued interest payable | 9,488 | | | 5,837 | |
| Intangible lease liabilities, net | 43,096 | | | 48,731 | |
| Total liabilities | 2,506,762 | | | 2,074,993 | |
| | | |
| Commitments and contingencies | | | |
| | | |
| Equity | | | |
| Broadstone Net Lease, Inc. equity: | | | |
| Preferred stock, $0.001 par value; 20,000 shares authorized, no shares issued or outstanding | — | | | — | |
Common stock, $0.00025 par value; 500,000 shares authorized, 189,216 and 188,626 shares issued and outstanding at September 30, 2025 and December 31, 2024, respectively | 47 | | | 47 | |
| Additional paid-in capital | 3,463,010 | | | 3,450,584 | |
| Cumulative distributions in excess of retained earnings | (597,571) | | | (496,543) | |
| Accumulated other comprehensive income | 19,172 | | | 49,657 | |
| Total Broadstone Net Lease, Inc. equity | 2,884,658 | | | 3,003,745 | |
| Non-controlling interests | 127,851 | | | 137,679 | |
| Total equity | 3,012,509 | | | 3,141,424 | |
| Total liabilities and equity | $ | 5,519,271 | | | $ | 5,216,417 | |
Broadstone Net Lease, Inc. and Subsidiaries
Condensed Consolidated Statements of Income and Comprehensive (Loss) Income
(in thousands, except per share amounts)
| | | | | | | | | | | | | | | | | | | | | | | |
| For the Three Months Ended | | For the Nine Months Ended |
| September 30,
2025 | | June 30,
2025 | | September 30,
2025 | | September 30,
2024 |
| Revenues | | | | | | | |
| Lease revenues, net | $ | 114,167 | | | $ | 112,986 | | | $ | 335,843 | | | $ | 319,670 | |
| | | | | | | |
| Operating expenses | | | | | | | |
| Depreciation and amortization | 40,246 | | | 42,575 | | | 122,318 | | | 113,192 | |
| Property and operating expense | 6,198 | | | 5,003 | | | 16,688 | | | 17,976 | |
| General and administrative | 9,974 | | | 9,571 | | | 29,216 | | | 28,058 | |
| Provision for impairment of investment in rental properties | 6,999 | | | 11,939 | | | 35,067 | | | 31,311 | |
| Total operating expenses | 63,417 | | | 69,088 | | | 203,289 | | | 190,537 | |
| | | | | | | |
| Other income (expenses) | | | | | | | |
| Interest income | 182 | | | 122 | | | 403 | | | 952 | |
| Interest expense | (28,230) | | | (21,112) | | | (69,416) | | | (54,512) | |
| Gain on sale of real estate | 3,259 | | | 566 | | | 4,230 | | | 64,956 | |
| Income taxes | (208) | | | (199) | | | (763) | | | (649) | |
| Other (expenses) income | 1,312 | | | (3,445) | | | (2,620) | | | 1,502 | |
| Net income | 27,065 | | | 19,830 | | | 64,388 | | | 141,382 | |
| Net income attributable to non-controlling interests | (599) | | | 330 | | | (1,019) | | | (5,331) | |
| Net income attributable to Broadstone Net Lease, Inc. | $ | 26,466 | | | $ | 20,160 | | | $ | 63,369 | | | $ | 136,051 | |
| | | | | | | |
| Weighted average number of common shares outstanding | | | | | | | |
| Basic | 188,099 | | 188,041 | | 188,002 | | 187,408 |
| Diluted | 197,632 | | 197,138 | | 197,476 | | 196,799 |
| Net earnings per common share | | | | | | | |
| Basic | $ | 0.14 | | | $ | 0.11 | | | $ | 0.33 | | | $ | 0.72 | |
| Diluted | $ | 0.14 | | | $ | 0.10 | | | $ | 0.33 | | | $ | 0.72 | |
| | | | | | | |
| Comprehensive income (loss) | | | | | | | |
| Net income | $ | 27,065 | | | $ | 19,830 | | | $ | 64,388 | | | $ | 141,382 | |
| Other comprehensive income (loss) | | | | | | | |
| Change in fair value of interest rate swaps | (4,981) | | | (10,463) | | | (35,336) | | | (31,334) | |
| Realized loss (gain) on interest rate swaps | 6,103 | | | (6) | | | 6,091 | | | 216 | |
| Comprehensive income (loss) | 28,187 | | | 9,361 | | | 35,143 | | | 110,264 | |
| Comprehensive income (loss) attributable to non-controlling interests | (646) | | | 775 | | | 232 | | | (3,950) | |
Comprehensive income (loss) attributable to Broadstone Net Lease, Inc. | $ | 27,541 | | | $ | 10,136 | | | $ | 35,375 | | | $ | 106,314 | |
Reconciliation of Non-GAAP Measures
The following is a reconciliation of net income to FFO, Core FFO, and AFFO for the three months ended September 30, 2025, June 30, 2025, and September 30, 2024, and the nine months ended September 30, 2025, and September 30, 2024. Also presented is the weighted average number of shares of our common stock and OP Units used for the diluted per share computation:
| | | | | | | | | | | | | | | | | | | | | | | |
| For the Three Months Ended | | For the Nine Months Ended |
| (in thousands, except per share data) | September 30,
2025 | | June 30,
2025 | | September 30,
2025 | | September 30,
2024 |
| Net income | $ | 27,065 | | | $ | 19,830 | | | $ | 64,388 | | | $ | 141,382 | |
| Real property depreciation and amortization | 40,164 | | | 42,492 | | | 122,066 | | | 112,942 | |
| Gain on sale of real estate | (3,259) | | | (566) | | | (4,230) | | | (64,956) | |
| Provision for impairment on investment in rental properties | 6,999 | | | 11,939 | | | 35,067 | | | 31,311 | |
| FFO | $ | 70,969 | | | $ | 73,695 | | | $ | 217,291 | | | $ | 220,679 | |
| Net write-offs of accrued rental income | 755 | | | 3 | | | 2,987 | | | 2,556 | |
| Other non-core income from real estate transactions | (27) | | | (46) | | | (137) | | | (887) | |
| Cost of debt extinguishment | — | | | — | | | 166 | | | — | |
| Severance and employee transition costs | 1 | | | 53 | | | 55 | | | 199 | |
Other (income) expenses1 | (1,312) | | | 3,445 | | | 2,454 | | | (1,502) | |
| Core FFO | $ | 70,386 | | | $ | 77,150 | | | $ | 222,816 | | | $ | 221,045 | |
| Straight-line rent adjustment | (4,960) | | | (5,586) | | | (16,452) | | | (15,341) | |
| Adjustment to provision for credit losses | — | | | (13) | | | (13) | | | (17) | |
| Amortization of debt issuance costs | 1,357 | | | 1,328 | | | 3,922 | | | 2,949 | |
| Non-capitalized transaction costs | 125 | | | 142 | | | 383 | | | 653 | |
| Realized gain or loss on interest rate swaps and other non-cash interest expense | 6,116 | | | 7 | | | 6,126 | | | 216 | |
| Amortization of lease intangibles | (1,198) | | | (1,191) | | | (3,453) | | | (3,422) | |
| Stock-based compensation | 2,488 | | | 2,471 | | | 7,105 | | | 5,377 | |
| AFFO | $ | 74,314 | | | $ | 74,308 | | | $ | 220,434 | | | $ | 211,460 | |
Diluted WASO2 | 197,632 | | 197,138 | | 197,476 | | 196,799 |
Net earnings per diluted share3 | $ | 0.14 | | | $ | 0.10 | | | $ | 0.33 | | | $ | 0.72 | |
FFO per diluted share3 | 0.36 | | | 0.37 | | | 1.10 | | | 1.12 | |
Core FFO per diluted share3 | 0.35 | | | 0.39 | | | 1.12 | | | 1.12 | |
AFFO per diluted share3 | 0.37 | | | 0.38 | | | 1.11 | | | 1.07 | |
1Amount includes $1.3 million and $(3.4) million of unrealized foreign exchange gain (loss) for the three months ended September 30, 2025 and June 30, 2025, respectively, and $(2.4) million and $1.5 million of unrealized foreign exchange (loss) gain for the nine months ended September 30, 2025 and September 30, 2024, respectively, primarily associated with our Canadian dollar denominated revolving borrowings.
2Excludes 1,071,038 and 1,072,087 weighted average shares of unvested restricted common stock for the three months ended September 30, 2025 and June 30, 2025, respectively. Excludes 1,053,536 and 907,443 weighted average shares of unvested restricted common stock for the nine months ended September 30, 2025 and September 30, 2024, respectively.
3Excludes $0.3 million from the numerator for the three months ended September 30, 2025 and June 30, 2025, respectively. Excludes $0.9 million from the numerator for the nine months ended September 30, 2025 and September 30, 2024, respectively.
Our reported results and net earnings per diluted share are presented in accordance with GAAP. We also disclose FFO, Core FFO, and AFFO, each of which are non-GAAP measures. We believe the use of FFO, Core FFO, and AFFO are useful to investors because they are widely accepted industry measures used by analysts and investors to compare the operating performance of REITs. FFO, Core FFO, and AFFO should not be considered alternatives to net income as a performance measure or to cash flows from operations, as reported on our statement of cash flows, or as a liquidity measure and should be considered in addition to, and not in lieu of, GAAP financial measures.
We compute FFO in accordance with the standards established by the Board of Governors of Nareit, the worldwide representative voice for REITs and publicly traded real estate companies with an interest in the U.S. real estate and capital markets. Nareit defines FFO as GAAP net income or loss adjusted to exclude net gains (losses) from sales of certain depreciated real estate assets, depreciation and amortization expense from real estate assets, and impairment charges related to certain previously depreciated real estate assets. FFO is used by management, investors, and analysts to facilitate meaningful comparisons of operating performance between periods and among our peers, primarily because it excludes the effect of real estate depreciation and amortization and net gains (losses) on sales, which are based on historical costs and implicitly assume that the value of real estate diminishes predictably over time, rather than fluctuating based on existing market conditions.
We compute Core FFO by adjusting FFO, as defined by Nareit, to exclude certain GAAP income and expense amounts that we believe are infrequently recurring, unusual in nature, or not related to its core real estate operations, including write-offs or recoveries of accrued rental income, cost of debt extinguishments, lease termination fees and other non-core income from real estate transactions, gain on insurance recoveries, severance and employee transition costs, and other extraordinary items. Exclusion of these items from similar FFO-type metrics is common within the equity REIT industry, and management believes that presentation of Core FFO provides investors with a metric to assist in their evaluation of our operating performance across multiple periods and in comparison to the operating performance of our peers, because it removes the effect of unusual items that are not expected to impact our operating performance on an ongoing basis.
We compute AFFO, by adjusting Core FFO for certain revenues and expenses that are non-cash or unique in nature, including straight-line rents, adjustment to provision for credit losses, amortization of lease intangibles, amortization of debt issuance costs, amortization of net mortgage premiums, non-capitalized transaction costs such as acquisition costs related to deals that failed to transact, (gain) loss on interest rate swaps and other non-cash interest expense, deferred taxes, stock-based compensation, and other specified non-cash items. We believe that excluding such items assists management and investors in distinguishing whether changes in our operations are due to growth or decline of operations at our properties or from other factors. We use AFFO as a measure of our performance when we formulate corporate goals, and is a factor in determining management compensation. We believe that AFFO is a useful supplemental measure for investors to consider because it will help them to better assess our operating performance without the distortions created by non-cash revenues or expenses.
Specific to our adjustment for straight-line rents, our leases include cash rents that increase over the term of the lease to compensate us for anticipated increases in market rental rates over time. Our leases do not include significant front-loading or back-loading of payments, or significant rent-free periods. Therefore, we find it useful to evaluate rent on a contractual basis as it allows for comparison of existing rental rates to market rental rates.
FFO, Core FFO, and AFFO may not be comparable to similarly titled measures employed by other REITs, and comparisons of our FFO, Core FFO, and AFFO with the same or similar measures disclosed by other REITs may not be meaningful.
Neither the SEC nor any other regulatory body has passed judgment on the acceptability of the adjustments to FFO that we use to calculate Core FFO and AFFO. In the future, the SEC, Nareit or another regulatory body may decide to standardize the allowable adjustments across the REIT industry and in response to such standardization we may have to adjust our calculation and characterization of Core FFO and AFFO accordingly.
The following is a reconciliation of net income to EBITDA, EBITDAre, Adjusted EBITDAre, and Pro Forma Adjusted EBITDAre, debt to Net Debt and Pro Forma Net Debt, Net Debt to Annualized Adjusted EBITDAre, and Pro Forma Net Debt to Annualized Adjusted EBITDAre as of and for the three months ended September 30, 2025, June 30, 2025, and September 30, 2024:
| | | | | | | | | | | | | | | | | |
| For the Three Months Ended |
| (in thousands) | September 30,
2025 | | June 30,
2025 | | September 30,
2024 |
| Net income | $ | 27,065 | | | $ | 19,830 | | | $ | 37,268 | |
| Depreciation and amortization | 40,246 | | | 42,575 | | | 38,016 | |
| Interest expense | 28,230 | | | 21,112 | | | 18,178 | |
| Income taxes | 208 | | | 199 | | | 291 | |
| EBITDA | $ | 95,749 | | | $ | 83,716 | | | $ | 93,753 | |
| Provision for impairment of investment in rental properties | 6,999 | | | 11,939 | | | 1,059 | |
| Gain on sale of real estate | (3,259) | | | (566) | | | (2,441) | |
| EBITDAre | $ | 99,489 | | | $ | 95,089 | | | $ | 92,371 | |
Adjustment for current quarter investment activity1 | 1,797 | | | 573 | | | 4,080 | |
Adjustment for current quarter disposition activity2 | (257) | | | (490) | | | (66) | |
Adjustment to exclude non-recurring and other expenses3 | (177) | | | (332) | | | (201) | |
| Adjustment to exclude net write-offs of accrued rental income | 755 | | | 3 | | | — | |
| Adjustment to exclude realized / unrealized foreign exchange (gain) loss | (1,312) | | | 3,445 | | | 942 | |
| | | | | |
| Adjustment to exclude other income from real estate transactions | (43) | | | (46) | | | (887) | |
| Adjusted EBITDAre | $ | 100,252 | | | $ | 98,242 | | | $ | 96,239 | |
Estimated revenues from developments4 | 2,544 | | | 1,629 | | | — | |
| Pro Forma Adjusted EBITDAre | $ | 102,796 | | | $ | 99,871 | | | $ | 96,239 | |
| Annualized EBITDAre | 397,956 | | 380,356 | | 369,484 |
| Annualized Adjusted EBITDAre | 401,008 | | 392,968 | | 384,956 |
| Pro Forma Annualized Adjusted EBITDAre | 411,184 | | 399,484 | | 384,956 |
1Reflects an adjustment to give effect to all investments during the quarter, including developments that have reached rent commencement, as if they had been made as of the beginning of the quarter.
2Reflects an adjustment to give effect to all dispositions during the quarter as if they had been sold as of the beginning of the quarter.
3Amount includes less than $0.2 million of accelerated lease intangible amortization for the three months ended September 30, 2025. Amount includes less than $0.4 million of accelerated lease intangible amortization for the three months ended June 30, 2025. Amount includes $0.2 million of forfeited stock-based compensation expense for the three months ended September 30, 2024.
4Represents estimated contractual revenues based on in-process development spend to-date.
| | | | | | | | | | | | | | | | | |
| (in thousands) | September 30,
2025 | | June 30,
2025 | | September 30,
2024 |
| Debt | | | | | |
| Unsecured revolving credit facility | $ | 95,824 | | | $ | 197,880 | | | $ | 125,482 | |
| Unsecured term loans, net | 994,550 | | | 994,028 | | | 896,887 | |
| Senior unsecured notes, net | 1,190,315 | | | 846,441 | | | 845,875 | |
| Mortgages, net | 57,168 | | | 75,685 | | | 77,416 | |
| Debt issuance costs | 15,171 | | | 9,578 | | | 7,314 | |
| Gross Debt | 2,353,028 | | | 2,123,612 | | | 1,952,974 | |
| Cash and cash equivalents | (81,966) | | | (20,784) | | | (8,999) | |
| Restricted cash | (1,354) | | | (1,192) | | | (2,219) | |
| Net Debt | $ | 2,269,708 | | | $ | 2,101,636 | | | $ | 1,941,756 | |
Estimated net proceeds from forward equity agreements1 | (37,257) | | | (37,722) | | | (38,983) | |
| Pro Forma Net Debt | $ | 2,232,451 | | | $ | 2,063,914 | | | $ | 1,902,773 | |
| | | | | |
| Leverage Ratios: | | | | | |
| Net Debt to Annualized EBITDAre | 5.7x | | 5.5x | | 5.3x |
| Net Debt to Annualized Adjusted EBITDAre | 5.7x | | 5.3x | | 5.0x |
| Pro Forma Net Debt to Annualized Adjusted EBITDAre | 5.4x | | 5.2x | | 4.9x |
1Represents pro forma adjustment for estimated net proceeds from forward sale agreements that have not settled as if they have been physically settled for cash as of the period presented.
We define Net Debt as gross debt (total reported debt plus debt issuance costs) less cash and cash equivalents and restricted cash. We believe that the presentation of Net Debt to Annualized EBITDAre and Net Debt to Annualized Adjusted EBITDAre is useful to investors and analysts because these ratios provide information about gross debt less cash and cash equivalents, which could be used to repay debt, compared to our performance as measured using EBITDAre.
We compute EBITDA as earnings before interest, income taxes and depreciation and amortization. EBITDA is a measure commonly used in our industry. We believe that this ratio provides investors and analysts with a measure of our performance that includes our operating results unaffected by the differences in capital structures, capital investment cycles and useful life of related assets compared to other companies in our industry. We compute EBITDAre in accordance with the definition adopted by Nareit, as EBITDA excluding gains (losses) from the sales of depreciable property and provisions for impairment on investment in real estate. We believe EBITDA and EBITDAre are useful to investors and analysts because they provide important supplemental information about our operating performance exclusive of certain non-cash and other costs. EBITDA and EBITDAre are not measures of financial performance under GAAP, and our EBITDA and EBITDAre may not be comparable to similarly titled measures of other companies. You should not consider our EBITDA and EBITDAre as alternatives to net income or cash flows from operating activities determined in accordance with GAAP.
We are focused on a disciplined and targeted investment strategy, together with active asset management that includes selective sales of properties. We manage our leverage profile using a ratio of Net Debt to Annualized Adjusted EBITDAre, and Pro Forma Net Debt to Annualized Adjusted EBITDAre, each discussed further below, which we believe is a useful measure of our ability to repay debt and a relative measure of leverage, and is used in communications with our lenders and rating agencies regarding our credit rating. As we fund new investments using our unsecured Revolving Credit Facility, our leverage profile and Net Debt will be immediately impacted by current quarter investments. However, the full benefit of EBITDAre from new investments will not be received in the same quarter in which the properties are acquired. Additionally, EBITDAre for the quarter includes amounts generated by properties that have been sold during the quarter. Accordingly, the variability in EBITDAre caused by the timing of our investments and dispositions can temporarily distort our leverage ratios. We adjust EBITDAre (“Adjusted EBITDAre”) for the most recently completed quarter (i) to recalculate as if all investments and dispositions had occurred at the beginning of the quarter, (ii) to exclude certain GAAP income and expense amounts that are either non-cash, such as cost of debt extinguishments, realized or unrealized gains and losses on foreign currency transactions, or gains on insurance recoveries, or that we believe are one time, or unusual in nature because they relate to unique circumstances or transactions that had not previously occurred and which we do not anticipate occurring in the future, and (iii) to eliminate the impact of lease termination fees and other items that are not a result of normal operations. While investments in build-to-suit developments have an immediate impact to Net Debt, we do not make an adjustment to EBITDAre until the quarter in which the lease commences. We define our Pro Forma Adjusted EBITDAre as Adjusted EBITDAre adjusted to show the impact of estimated contractual revenues based on in-process development spend to-date. Our Pro Forma Net Debt is defined as Net Debt adjusted for estimated net proceeds from forward sale agreements that have not settled as if they have been physically settled for cash as of the period presented. We then annualize quarterly Adjusted EBITDAre and Pro Forma Adjusted EBITDAre by multiplying them by four (“Annualized Adjusted EBITDAre” and “Annualized Pro Forma Adjusted EBITDAre”). You should not unduly rely on this measure as it is based on assumptions and estimates that may prove to be inaccurate. Our actual reported EBITDAre for future periods may be significantly different from our Annualized Adjusted EBITDAre. Adjusted EBITDAre and Annualized Adjusted EBITDAre are not measurements of performance under GAAP, and our Adjusted EBITDAre and Annualized Adjusted EBITDAre may not be comparable to similarly titled measures of other companies. You should not consider our Adjusted EBITDAre and Annualized Adjusted EBITDAre as alternatives to net income or cash flows from operating activities determined in accordance with GAAP.
Exhibit 99.2
Table of Contents
| | | | | | | | |
BROADSTONE NET LEASE, INC. | www.broadstone.com | © 2025 Broadstone Net Lease, LLC. All rights reserved. | 2 | |
About the Data
This data and other information described herein are as of and for the three months ended September 30, 2025 unless otherwise indicated. Future performance may not be consistent with past performance and is subject to change and inherent risks and uncertainties. This information should be read in conjunction with Broadstone Net Lease, Inc.’s Annual Report on Form 10-K for the year ended December 31, 2024, and the Company's Quarterly Report on Form 10-Q for the quarter ended June 30, 2025, which was filed with the SEC on July 31, 2025, including the financial statements and the management’s discussion and analysis of financial condition and results of operations sections.
Forward Looking Statements
Information set forth herein contains forward-looking statements, which reflect our current views regarding our business, financial performance, growth prospects and strategies, market opportunities, and market trends. Forward-looking statements include all statements that are not historical facts. In some cases, you can identify these forward-looking statements by the use of words such as “outlook,” “believes,” “expects,” “potential,” “continues,” “may,” “will,” “should,” “could,” “would be,” “seeks,” “approximately,” “projects,” “predicts,” “intends,” “plans,” “estimates,” “anticipates,” or the negative version of these words or other comparable words. All of the forward-looking statements herein are subject to various risks and uncertainties. Assumptions relating to the foregoing involve judgments with respect to, among other things, future economic, competitive and market conditions, and future business decisions, all of which are difficult or impossible to predict accurately and many of which are beyond our control. Although we believe that the expectations reflected in such forward-looking statements are based on reasonable assumptions, our actual results, performance, and achievements could differ materially from those expressed in or by the forward-looking statements and may be affected by a variety of risks and other factors. Accordingly, there are or will be important factors that could cause actual outcomes or results to differ materially from such forward-looking statements. These factors include, but are not limited to, risks and uncertainties related to general economic conditions, including but not limited to increases in the rate of inflation and/or interest rates, local real estate conditions, tenant financial health, and property acquisitions and the timing of these investments and acquisitions. These and other risks, assumptions, and uncertainties are described in our filings with the SEC, which are available on the SEC’s website at www.sec.gov.
You are cautioned not to place undue reliance on any forward-looking statements included herein. All forward-looking statements are made as of the date of this document and the risk that actual results, performance, and achievements will differ materially from the expectations expressed or referenced herein will increase with the passage of time. We undertake no obligation to publicly update or review any forward-looking statement, whether as a result of new information, future developments, or otherwise, except as required by law.
IP Disclaimer
This document contains references to copyrights, trademarks, trade names, and service marks that belong to other companies. Broadstone Net Lease is not affiliated or associated with, and is not endorsed by and does not endorse, such companies or their products or services.
| | | | | | | | |
BROADSTONE NET LEASE, INC. | www.broadstone.com | © 2025 Broadstone Net Lease, LLC. All rights reserved. | 3 | |
Company Overview
Broadstone Net Lease, Inc. (NYSE:BNL) (the “Company”, “BNL”, “us”, “our”, and “we”) is an industrial-focused, diversified net lease real estate investment trust (“REIT”) that invests in primarily single-tenant commercial real estate properties that are net leased on a long-term basis to a diversified group of tenants. We primarily, and selectively, invest in real estate across industrial and retail property types. We target properties with credit worthy tenants in industries characterized by positive business drivers and trends, where the properties are an integral part of the tenants’ businesses and there are opportunities to secure long-term net leases. Through long-term net leases, our tenants are able to retain operational control of their strategically important locations, while allocating their debt and equity capital to fund core business operations rather than real estate ownership.
| | | | | | | | |
| Executive Team | | Board of Directors |
| | |
John D. Moragne Chief Executive Officer and Member, Board of Directors Ryan M. Albano President and Chief Operating Officer Kevin M. Fennell Executive Vice President, Chief Financial Officer and Treasurer John D. Callan, Jr. Senior Vice President, General Counsel, and Secretary Michael B. Caruso Senior Vice President, Underwriting & Strategy Will D. Garner Senior Vice President, Acquisitions Jennie L. O’Brien Senior Vice President and Chief Accounting Officer Molly Kelly Wiegel Senior Vice President, Human Resources & Administration | | Laurie A. Hawkes Chairman of the Board John D. Moragne Chief Executive Officer Michael A. Coke Jessica Duran Laura Felice Richard Imperiale David M. Jacobstein Joseph Saffire James H. Watters |
Company Contact Information
Brent Maedl
Director, Corporate Finance & Investor Relations
585-382-8507
Transfer Agent
Computershare Trust Company, N.A.
150 Royall Street
Canton, Massachusetts 02021
800-736-3001
| | | | | | | | |
BROADSTONE NET LEASE, INC. | www.broadstone.com | © 2025 Broadstone Net Lease, LLC. All rights reserved. | 4 | |
Quarterly Financial Summary
(unaudited, dollars in thousands except per share data)
| | | | | | | | | | | | | | | | | | | | | | | | | | | | | | | | |
| | Q3 2025 | | Q2 2025 | | Q1 2025 | | Q4 2024 | | Q3 2024 |
| Financial Summary | | | | | | | | | | |
| Investment in rental property | | $ | 5,147,649 | | | $ | 5,058,791 | | | $ | 5,032,276 | | | $ | 4,994,057 | | | $ | 5,018,626 | |
| Less accumulated depreciation | | (745,326) | | | (721,195) | | | (694,990) | | | (672,478) | | | (644,214) | |
| Property under development | | 179,172 | | | 116,635 | | | 35,492 | | | 18,784 | | | — | |
| Investment in rental property, net | | 4,581,495 | | | 4,454,231 | | | 4,372,778 | | | 4,340,363 | | | 4,374,412 | |
| Cash and cash equivalents | | 81,966 | | | 20,784 | | | 9,605 | | | 14,845 | | | 8,999 | |
| Restricted cash | | 1,354 | | | 1,192 | | | 1,428 | | | 1,148 | | | 2,219 | |
| Total assets | | 5,519,271 | | | 5,326,679 | | | 5,237,186 | | | 5,216,417 | | | 5,263,286 | |
| Unsecured revolving credit facility | | 95,824 | | | 197,880 | | | 174,122 | | | 93,014 | | | 125,482 | |
| Mortgages, net | | 57,168 | | | 75,685 | | | 76,260 | | | 76,846 | | | 77,416 | |
| Unsecured term loans, net | | 994,550 | | | 994,028 | | | 893,505 | | | 897,201 | | | 896,887 | |
| Senior unsecured notes, net | | 1,190,315 | | | 846,441 | | | 846,252 | | | 846,064 | | | 845,875 | |
| Total liabilities | | 2,506,762 | | | 2,290,858 | | | 2,156,372 | | | 2,074,993 | | | 2,124,927 | |
| Total Broadstone Net Lease, Inc. equity | | 2,884,658 | | | 2,906,693 | | | 2,949,734 | | | 3,003,745 | | | 2,999,074 | |
| Total equity (book value) | | 3,012,509 | | | 3,035,821 | | | 3,080,814 | | | 3,141,424 | | | 3,138,359 | |
| | | | | | | | | | |
| Revenues | | 114,167 | | | 112,986 | | | 108,690 | | | 112,130 | | | 108,397 | |
| General and administrative - other | | 7,486 | | | 7,100 | | | 7,525 | | | 7,951 | | | 6,893 | |
| Stock based compensation | | 2,488 | | | 2,471 | | | 2,147 | | | 1,977 | | | 1,829 | |
| General and administrative | | 9,974 | | | 9,571 | | | 9,672 | | | 9,928 | | | 8,722 | |
| Total operating expenses | | 63,417 | | | 69,088 | | | 70,785 | | | 77,369 | | | 54,811 | |
| Interest expense | | 28,230 | | | 21,112 | | | 20,074 | | | 19,564 | | | 18,178 | |
| Net income | | 27,065 | | | 19,830 | | | 17,493 | | | 27,607 | | | 37,268 | |
| Net earnings per common share, diluted | | $ | 0.14 | | | $ | 0.10 | | | $ | 0.09 | | | $ | 0.14 | | | $ | 0.19 | |
| | | | | | | | | | |
| FFO | | 70,969 | | | 73,695 | | | 72,627 | | | 80,003 | | | 73,818 | |
| FFO per share, diluted | | 0.36 | | | $ | 0.37 | | | $ | 0.37 | | | $ | 0.41 | | | $ | 0.37 | |
| Core FFO | | 70,386 | | | 77,150 | | | 75,280 | | | 74,427 | | | 73,971 | |
| Core FFO per share, diluted | | $ | 0.35 | | | $ | 0.39 | | | $ | 0.38 | | | $ | 0.38 | | | $ | 0.37 | |
| AFFO | | 74,314 | | | 74,308 | | | 71,812 | | | 70,532 | | | 70,185 | |
| AFFO per share, diluted | | $ | 0.37 | | | $ | 0.38 | | | $ | 0.36 | | | $ | 0.36 | | | $ | 0.35 | |
| | | | | | | | | | |
| Net cash provided by operating activities | | 64,190 | | | 79,280 | | | 71,459 | | | 63,911 | | | 67,303 | |
| Capital expenditures and improvements | | 542 | | | 614 | | | 1,106 | | | 2,205 | | | 1,180 | |
| Capital expenditures and improvements - revenue generating | | 5,624 | | | 1,994 | | | 13,242 | | | 3,755 | | | 6,351 | |
| Net cash (used in) provided by investing activities | | (174,054) | | | (131,258) | | | (85,335) | | | 27,338 | | | (65,618) | |
| Net cash provided by (used in) financing activities | | 171,208 | | | 62,921 | | | 8,916 | | | (86,474) | | | (10,363) | |
| Distributions declared | | 57,284 | | | 57,284 | | | 58,874 | | | 57,209 | | | 56,354 | |
| Distributions declared per diluted share | | $ | 0.290 | | | $ | 0.290 | | | $ | 0.290 | | | $ | 0.290 | | | $ | 0.290 | |
| | | | | | | | |
BROADSTONE NET LEASE, INC. | www.broadstone.com | © 2025 Broadstone Net Lease, LLC. All rights reserved. | 5 | |
Balance Sheet
(unaudited, in thousands)
| | | | | | | | | | | | | | | | | | | | | | | | | | | | | |
| September 30, 2025 | | June 30, 2025 | | March 31, 2025 | | December 31, 2024 | | September 30, 2024 |
| Assets | | | | | | | | | |
| Accounted for using the operating method: | | | | | | | | | |
| Land | $ | 778,177 | | | $ | 784,092 | | | $ | 780,817 | | | $ | 778,826 | | | $ | 784,545 | |
| Land improvements | 359,210 | | | 360,774 | | | 360,197 | | | 357,142 | | | 357,090 | |
| Buildings and improvements | 3,954,112 | | | 3,871,441 | | | 3,848,623 | | | 3,815,521 | | | 3,834,310 | |
| Equipment | 16,070 | | | 16,070 | | | 16,070 | | | 15,843 | | | 15,824 | |
| Total accounted for using the operating method | 5,107,569 | | | 5,032,377 | | | 5,005,707 | | | 4,967,332 | | | 4,991,769 | |
| Less accumulated depreciation | (745,326) | | | (721,195) | | | (694,990) | | | (672,478) | | | (644,214) | |
| Accounted for using the operating method, net | 4,362,243 | | | 4,311,182 | | | 4,310,717 | | | 4,294,854 | | | 4,347,555 | |
| Accounted for using the direct financing method | 25,673 | | | 25,845 | | | 25,999 | | | 26,154 | | | 26,285 | |
| Accounted for using the sales-type method | 14,407 | | | 569 | | | 570 | | | 571 | | | 572 | |
| Property under development | 179,172 | | | 116,635 | | | 35,492 | | | 18,784 | | | — | |
| Investment in rental property, net | 4,581,495 | | | 4,454,231 | | | 4,372,778 | | | 4,340,363 | | | 4,374,412 | |
| Investment in rental property and intangible lease assets held for sale, net | — | | | — | | | — | | | — | | | 38,779 | |
| Cash and cash equivalents | 81,966 | | | 20,784 | | | 9,605 | | | 14,845 | | | 8,999 | |
| Accrued rental income | 174,867 | | | 172,310 | | | 166,436 | | | 162,717 | | | 158,350 | |
| Tenant and other receivables, net | 3,573 | | | 3,605 | | | 2,581 | | | 3,281 | | | 2,124 | |
| Prepaid expenses and other assets | 59,866 | | | 55,815 | | | 52,260 | | | 41,584 | | | 36,230 | |
| Interest rate swap, assets | 19,590 | | | 23,490 | | | 29,681 | | | 46,220 | | | 27,812 | |
| Goodwill | 339,769 | | | 339,769 | | | 339,769 | | | 339,769 | | | 339,769 | |
| Intangible lease assets, net | 258,145 | | | 256,675 | | | 264,076 | | | 267,638 | | | 276,811 | |
| Total assets | $ | 5,519,271 | | | $ | 5,326,679 | | | $ | 5,237,186 | | | $ | 5,216,417 | | | $ | 5,263,286 | |
| Liabilities and equity | | | | | | | | | |
| Unsecured revolving credit facility | $ | 95,824 | | | $ | 197,880 | | | $ | 174,122 | | | $ | 93,014 | | | $ | 125,482 | |
| Mortgages, net | 57,168 | | | 75,685 | | | 76,260 | | | 76,846 | | | 77,416 | |
| Unsecured term loans, net | 994,550 | | | 994,028 | | | 893,505 | | | 897,201 | | | 896,887 | |
| Senior unsecured notes, net | 1,190,315 | | | 846,441 | | | 846,252 | | | 846,064 | | | 845,875 | |
| Interest rate swap, liabilities | 1,994 | | | 7,625 | | | 3,353 | | | — | | | 13,050 | |
| Accounts payable and other liabilities | 55,662 | | | 57,409 | | | 48,424 | | | 48,983 | | | 47,651 | |
| Dividends payable | 58,665 | | | 58,451 | | | 58,220 | | | 58,317 | | | 58,163 | |
| Accrued interest payable | 9,488 | | | 8,542 | | | 9,399 | | | 5,837 | | | 9,642 | |
| Intangible lease liabilities, net | 43,096 | | | 44,797 | | | 46,837 | | | 48,731 | | | 50,761 | |
| Total liabilities | 2,506,762 | | | 2,290,858 | | | 2,156,372 | | | 2,074,993 | | | 2,124,927 | |
| Equity | | | | | | | | | |
| Broadstone Net Lease, Inc. equity: | | | | | | | | | |
| Preferred stock, $0.001 par value | — | | | — | | | — | | | — | | | — | |
| Common stock, $0.00025 par value | 47 | | | 47 | | | 47 | | | 47 | | | 47 | |
| Additional paid-in capital | 3,463,010 | | | 3,459,939 | | | 3,456,041 | | | 3,450,584 | | | 3,450,116 | |
| Cumulative distributions in excess of retained earnings | (597,571) | | | (571,302) | | | (536,074) | | | (496,543) | | | (467,922) | |
| Accumulated other comprehensive income | 19,172 | | | 18,009 | | | 29,720 | | | 49,657 | | | 16,833 | |
| Total Broadstone Net Lease, Inc. equity | 2,884,658 | | | 2,906,693 | | | 2,949,734 | | | 3,003,745 | | | 2,999,074 | |
| Non-controlling interests | 127,851 | | | 129,128 | | | 131,080 | | | 137,679 | | | 139,285 | |
| Total equity | 3,012,509 | | | 3,035,821 | | | 3,080,814 | | | 3,141,424 | | | 3,138,359 | |
| Total liabilities and equity | $ | 5,519,271 | | | $ | 5,326,679 | | | $ | 5,237,186 | | | $ | 5,216,417 | | | $ | 5,263,286 | |
| | | | | | | | |
BROADSTONE NET LEASE, INC. | www.broadstone.com | © 2025 Broadstone Net Lease, LLC. All rights reserved. | 6 | |
Income Statement Summary
(unaudited, in thousands except per share data)
| | | | | | | | | | | | | | | | | | | | | | | | | | | | | |
| Three Months Ended |
| September 30, 2025 | | June 30, 2025 | | March 31, 2025 | | December 31, 2024 | | September 30, 2024 |
| Revenues | | | | | | | | | |
| Lease revenues, net | $ | 114,167 | | | $ | 112,986 | | | $ | 108,690 | | | $ | 112,130 | | | $ | 108,397 | |
| Operating expenses | | | | | | | | | |
| Depreciation and amortization | 40,246 | | | 42,575 | | | 39,497 | | | 42,987 | | | 38,016 | |
| Property and operating expense | 6,198 | | | 5,003 | | | 5,488 | | | 6,764 | | | 7,014 | |
| General and administrative | 9,974 | | | 9,571 | | | 9,672 | | | 9,928 | | | 8,722 | |
| Provision for impairment of investment in rental properties | 6,999 | | | 11,939 | | | 16,128 | | | 17,690 | | | 1,059 | |
| Total operating expenses | 63,417 | | | 69,088 | | | 70,785 | | | 77,369 | | | 54,811 | |
| Other income (expenses) | | | | | | | | | |
| Interest income | 182 | | | 122 | | | 99 | | | 42 | | | 70 | |
| Interest expense | (28,230) | | | (21,112) | | | (20,074) | | | (19,564) | | | (18,178) | |
| Gain on sale of real estate | 3,259 | | | 566 | | | 405 | | | 8,196 | | | 2,441 | |
| Income taxes | (208) | | | (199) | | | (355) | | | (527) | | | 291 | |
| Other income (expenses) | 1,312 | | | (3,445) | | | (487) | | | 4,699 | | | (942) | |
| Net income | 27,065 | | | 19,830 | | | 17,493 | | | 27,607 | | | 37,268 | |
| Net income attributable to non-controlling interests | (599) | | | 330 | | | (750) | | | (1,217) | | | (1,660) | |
| Net income attributable to Broadstone Net Lease, Inc. | $ | 26,466 | | | $ | 20,160 | | | $ | 16,743 | | | $ | 26,390 | | | $ | 35,608 | |
| | | | | | | | | |
| Weighted average number of common shares outstanding | | | | | | | | | |
Basic (a) | 188,099 | | 188,041 | | 187,865 | | 187,592 | | 187,496 |
Diluted (a) | 197,632 | | 197,138 | | 196,898 | | 196,697 | | 196,932 |
Net earnings per common share (b) | | | | | | | | | |
| Basic | $ | 0.14 | | | $ | 0.11 | | | $ | 0.09 | | | $ | 0.14 | | | $ | 0.19 | |
| Diluted | $ | 0.14 | | | $ | 0.10 | | | $ | 0.09 | | | $ | 0.14 | | | $ | 0.19 | |
(a)Excludes 1,071,038 weighted average shares of unvested restricted common stock for the three months ended September 30, 2025.
(b)Excludes $0.3 million from the numerator for the three months ended September 30, 2025, related to dividends declared on shares of unvested restricted common stock.
| | | | | | | | |
BROADSTONE NET LEASE, INC. | www.broadstone.com | © 2025 Broadstone Net Lease, LLC. All rights reserved. | 7 | |
Funds From Operations (FFO), Core Funds From Operations (Core FFO), and Adjusted Funds From Operations (AFFO)
(unaudited, in thousands except per share data)
| | | | | | | | | | | | | | | | | | | | | | | | | | | | | |
| Three Months Ended |
| September 30, 2025 | | June 30, 2025 | | March 31, 2025 | | December 31, 2024 | | September 30, 2024 |
| Net income | $ | 27,065 | | | $ | 19,830 | | | $ | 17,493 | | | $ | 27,607 | | | $ | 37,268 | |
| Real property depreciation and amortization | 40,164 | | | 42,492 | | | 39,411 | | | 42,902 | | | 37,932 | |
| Gain on sale of real estate | (3,259) | | | (566) | | | (405) | | | (8,196) | | | (2,441) | |
| Provision for impairment of investment in rental properties | 6,999 | | | 11,939 | | | 16,128 | | | 17,690 | | | 1,059 | |
| FFO | $ | 70,969 | | | $ | 73,695 | | | $ | 72,627 | | | $ | 80,003 | | | $ | 73,818 | |
| Net write-offs of accrued rental income | 755 | | | 3 | | | 2,228 | | | 120 | | | — | |
| Other non-core income from real estate transactions | (27) | | | (46) | | | (63) | | | (1,183) | | | (887) | |
| Cost of debt extinguishment | — | | | — | | | 165 | | | — | | | — | |
| Severance and employee transition costs | 1 | | | 53 | | | 1 | | | 187 | | | 98 | |
Other (income) expenses (a) | (1,312) | | | 3,445 | | | 322 | | | (4,700) | | | 942 | |
| Core FFO | $ | 70,386 | | | $ | 77,150 | | | $ | 75,280 | | | $ | 74,427 | | | $ | 73,971 | |
| Straight-line rent adjustment | (4,960) | | | (5,586) | | | (5,907) | | | (6,312) | | | (5,309) | |
| Adjustment to provision for credit losses | — | | | (13) | | | — | | | — | | | — | |
| Amortization of debt issuance costs | 1,357 | | | 1,328 | | | 1,237 | | | 983 | | | 983 | |
| Non-capitalized transaction costs | 125 | | | 142 | | | 117 | | | 299 | | | 25 | |
| Realized gain or loss on interest rate swaps and other non-cash interest expense | 6,116 | | | 7 | | | 2 | | | (6) | | | (5) | |
| Amortization of lease intangibles | (1,198) | | | (1,191) | | | (1,064) | | | (991) | | | (1,309) | |
| Stock-based compensation | 2,488 | | | 2,471 | | | 2,147 | | | 1,977 | | | 1,829 | |
| Deferred taxes | — | | | — | | | — | | | 155 | | | — | |
| AFFO | $ | 74,314 | | | $ | 74,308 | | | $ | 71,812 | | | $ | 70,532 | | | $ | 70,185 | |
| | | | | | | | | |
Diluted weighted average shares outstanding (b) | 197,632 | | | 197,138 | | | 196,898 | | | 196,697 | | | 196,932 | |
Net earnings per diluted share (c) | $ | 0.14 | | | $ | 0.10 | | | $ | 0.09 | | | $ | 0.14 | | | $ | 0.19 | |
FFO per diluted share (c) | 0.36 | | | 0.37 | | | 0.37 | | | 0.41 | | | 0.37 | |
Core FFO per diluted share (c) | 0.35 | | | 0.39 | | | 0.38 | | | 0.38 | | | 0.37 | |
AFFO per diluted share (c) | 0.37 | | | 0.38 | | | 0.36 | | | 0.36 | | | 0.35 | |
(a)Amount includes $1.3 million of unrealized and realized foreign exchange gain for the three months ended September 30, 2025, primarily associated with our Canadian dollar denominated revolver borrowings.
(b)Excludes 1,071,038 weighted average shares of unvested restricted common stock for the three months ended September 30, 2025.
(c)Excludes $0.3 million from the numerator for the three months ended September 30, 2025, related to dividends declared on shares of unvested restricted common stock.
| | | | | | | | |
BROADSTONE NET LEASE, INC. | www.broadstone.com | © 2025 Broadstone Net Lease, LLC. All rights reserved. | 8 | |
Lease Revenues Detail
(unaudited, in thousands)
| | | | | | | | | | | | | | | | | | | | | | | | | | | | | |
| Three Months Ended |
| September 30, 2025 | | June 30, 2025 | | March 31, 2025 | | December 31, 2024 | | September 30, 2024 |
| Contractual rental amounts billed for operating leases | $ | 102,270 | | | $ | 101,014 | | | $ | 99,314 | | | $ | 98,193 | | | $ | 96,596 | |
Adjustment to recognize contractual operating lease billings on a straight-line basis | 5,134 | | | 5,753 | | | 6,064 | | | 6,444 | | | 5,438 | |
| Net write-offs of accrued rental income | (755) | | | — | | | (2,228) | | | — | | | — | |
| Variable rental amounts earned | 732 | | | 718 | | | 680 | | | 1,098 | | | 644 | |
| Earned income from direct financing leases | 675 | | | 679 | | | 682 | | | 686 | | | 691 | |
| Interest income from sales-type leases | 326 | | | 14 | | | 14 | | | 15 | | | 14 | |
| Operating expenses billed to tenants | 5,752 | | | 4,795 | | | 4,944 | | | 5,400 | | | 5,537 | |
| Other income from real estate transactions | 43 | | | 63 | | | 77 | | | 1,054 | | | 907 | |
Adjustment to revenue recognized for uncollectible rental amounts billed, net | (10) | | | (50) | | | (857) | | | (760) | | | (1,430) | |
| Total lease revenues, net | $ | 114,167 | | | $ | 112,986 | | | $ | 108,690 | | | $ | 112,130 | | | $ | 108,397 | |
| | | | | | | | |
BROADSTONE NET LEASE, INC. | www.broadstone.com | © 2025 Broadstone Net Lease, LLC. All rights reserved. | 9 | |
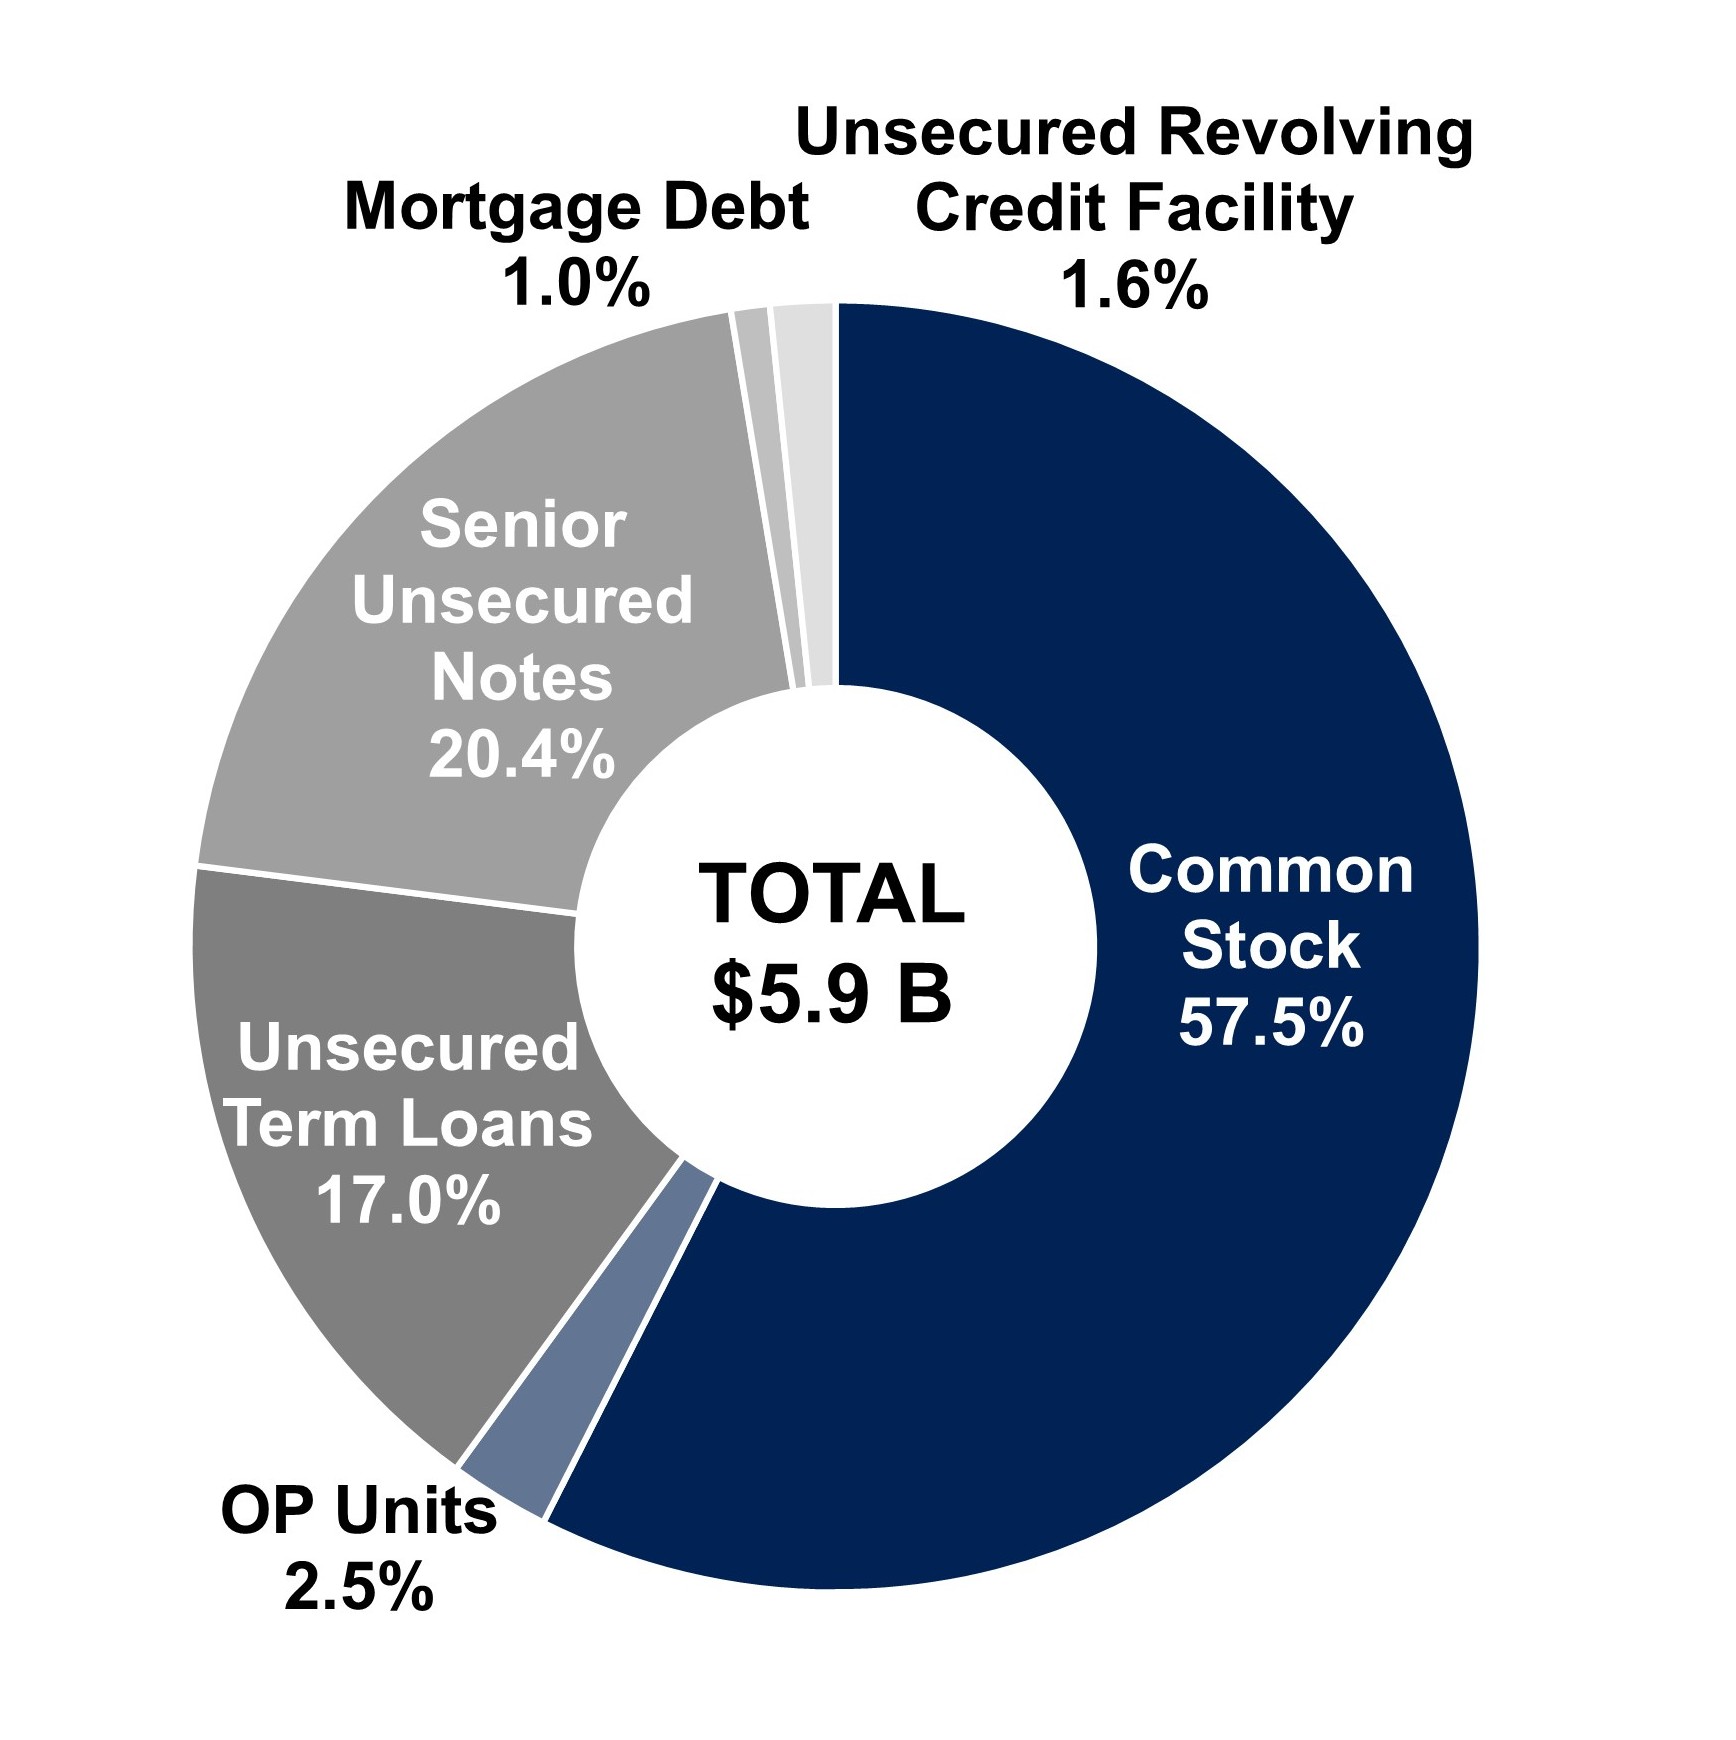
Capital Structure
(in thousands, except per share data)
| | | | | |
| EQUITY | |
| Shares of Common Stock | 189,216 | |
| OP Units | 8,315 | |
| Common Stock & OP Units | 197,531 | |
Price Per Share / Unit at September 30, 2025 | $ | 17.87 | |
| IMPLIED EQUITY MARKET CAPITALIZATION | $ | 3,529,879 | |
| % of Total Capitalization | 60.0 | % |
| DEBT | |
| Unsecured Revolving Credit Facility - 2026 | $ | 95,824 | |
| Unsecured Term Loans | 1,000,000 | |
| Unsecured Term Loan - 2027 | 200,000 | |
| Unsecured Term Loan - 2028 | 500,000 | |
| Unsecured Term Loan - 2029 | 300,000 | |
| Senior Unsecured Notes | 1,200,000 | |
| Senior Unsecured Notes - 2027 | 150,000 | |
| Senior Unsecured Notes - 2028 | 225,000 | |
| Senior Unsecured Notes - 2030 | 100,000 | |
| Senior Unsecured Public Notes - 2031 | 375,000 | |
Senior Unsecured Public Notes - 2032 | 350,000 | |
| Mortgage Debt - Various | 57,205 | |
| TOTAL DEBT | $ | 2,353,029 | |
| % of Total Capitalization | 40.0 | % |
| Floating Rate Debt % | 10.8 | % |
| Fixed Rate Debt % | 89.2 | % |
| Secured Debt % | 2.4 | % |
| Unsecured Debt % | 97.6 | % |
| |
| Total Capitalization | $ | 5,882,908 | |
| Less: Cash and Cash Equivalents | (81,966) | |
| Enterprise Value | $ | 5,800,942 | |
| | | | | | | | |
BROADSTONE NET LEASE, INC. | www.broadstone.com | © 2025 Broadstone Net Lease, LLC. All rights reserved. | 10 | |
Equity Rollforward
(in thousands)
| | | | | | | | | | | | | | | | | |
| Shares of Common Stock | | OP Units | | Total Diluted Shares |
Balance, January 1, 2025 | 188,626 | | 8,646 | | 197,272 |
Grants of restricted stock awards | 292 | | — | | 292 |
| Retirement of common shares under equity incentive plan | (86) | | — | | (86) |
| Forfeiture of restricted stock awards | (3) | | — | | (3) |
| OP unit conversion | 244 | | (244) | | — |
Balance, March 31, 2025 | 189,073 | | 8,402 | | 197,475 |
Grants of restricted stock awards | 61 | | — | | 61 |
| Forfeiture of restricted stock awards | (4) | | — | | (4) |
Balance, June 30, 2025 | 189,130 | | 8,402 | | 197,532 |
Grants of restricted stock awards | 1 | | — | | 1 |
| Forfeiture of restricted stock awards | (1) | | — | | (1) |
| OP unit conversion | 86 | | (86) | | — |
Balance, September 30, 2025 | 189,216 | | 8,316 | | 197,532 |
| | | | | | | | |
BROADSTONE NET LEASE, INC. | www.broadstone.com | © 2025 Broadstone Net Lease, LLC. All rights reserved. | 11 | |
Debt Outstanding
(in thousands)
| | | | | | | | | | | | | | | | | | | | | | | |
| September 30,
2025 | | December 31,
2024 | | Interest Rate | | Maturity Date |
| Unsecured revolving credit facility | $ | 95,824 | | | $ | 93,014 | | | applicable reference rate + 0.85% (a) | | Mar. 2029 (d) |
| Unsecured term loans: | | | | | | | |
| 2026 Unsecured Term Loan | — | | | 400,000 | | | one-month adjusted SOFR + 1.00% (b) | | Feb. 2026 (e) |
| 2027 Unsecured Term Loan | 200,000 | | | 200,000 | | | daily simple adjusted SOFR + 0.95% (c) | | Aug. 2027 |
| 2028 Unsecured Term Loan | 500,000 | | | — | | | one-month adjusted SOFR + 0.95% (b) | | Mar. 2028 (f) |
| 2029 Unsecured Term Loan | 300,000 | | | 300,000 | | | daily simple adjusted SOFR + 1.25% (c) | | Aug. 2029 |
| Total unsecured term loans | 1,000,000 | | | 900,000 | | | | | |
| Unamortized debt issuance costs, net | (5,450) | | | (2,799) | | | | | |
| Total unsecured term loans, net | 994,550 | | | 897,201 | | | | | |
| Senior unsecured notes: | | | | | | | |
| 2027 Senior Unsecured Notes - Series A | 150,000 | | | 150,000 | | | 4.84% | | Apr. 2027 |
| 2028 Senior Unsecured Notes - Series B | 225,000 | | | 225,000 | | | 5.09% | | Jul. 2028 |
| 2030 Senior Unsecured Notes - Series C | 100,000 | | | 100,000 | | | 5.19% | | Jul. 2030 |
| 2031 Senior Unsecured Public Notes | 375,000 | | | 375,000 | | | 2.60% | | Sep. 2031 |
| 2032 Senior Unsecured Public Notes | 350,000 | | | — | | | 5.00% | | Nov. 2032 |
| Total senior unsecured notes | 1,200,000 | | | 850,000 | | | | | |
| Unamortized debt issuance costs and original issuance discounts, net | (9,685) | | | (3,936) | | | | | |
| Total senior unsecured notes, net | 1,190,315 | | | 846,064 | | | | | |
| Total unsecured debt, net | $ | 2,280,689 | | | $ | 1,836,279 | | | | | |
(a)At September 30, 2025 and December 31, 2024, a balance of $24.0 million and $23.5 million, respectively, was subject to daily simple SOFR. The remaining balance of $100.0 million CAD borrowings remeasured to $71.8 million USD and $69.5 million USD, at September 30, 2025 and December 31, 2024, respectively, and was subject to daily simple CORRA of 2.56% and 3.32% at September 30, 2025 and December 31, 2024, respectively.
(b)At September 30, 2025 and December 31, 2024, one-month SOFR was 4.13% and 4.33%, respectively.
(c)At September 30, 2025 and December 31, 2024, overnight SOFR was 4.24% and 4.49%, respectively.
(d)The Company’s unsecured revolving credit facility contains two six-month extension options subject to certain conditions, including the payment of an extension fee equal to 0.0625% of the revolving commitments.
(e)The 2026 Unsecured Term Loan was paid in full on February 28, 2025 with borrowings from the 2028 Unsecured Term Loan.
(f)Our 2028 unsecured term loan reflected above contains two twelve-month extension options subject to certain conditions, including the payment of an extension fee equal to 0.125% of the aggregate principal amount of the loans outstanding under the 2028 term loan facility.
| | | | | | | | | | | | | | | | | | | | | | | | | | | | | | | | |
| Lender | | Origination
Date | | Maturity
Date | | Interest
Rate | | September 30,
2025 | | December 31,
2024 |
| Wilmington Trust National Association | | Apr. 2019 | | Feb. 2028 | | 4.92% | | $ | 41,762 | | | $ | 42,838 | |
| Wilmington Trust National Association | | Jun. 2018 | | Aug. 2025 | | 4.36% | | 0 | | | 18,283 | |
| PNC Bank | | Oct. 2016 | | Nov. 2026 | | 3.62% | | 15,443 | | | 15,792 | |
| Total mortgages | | | | | | | | 57,205 | | | 76,913 | |
| Debt issuance costs, net | | | | | | | | (37) | | | (67) | |
| Mortgages, net | | | | | | | | $ | 57,168 | | | $ | 76,846 | |
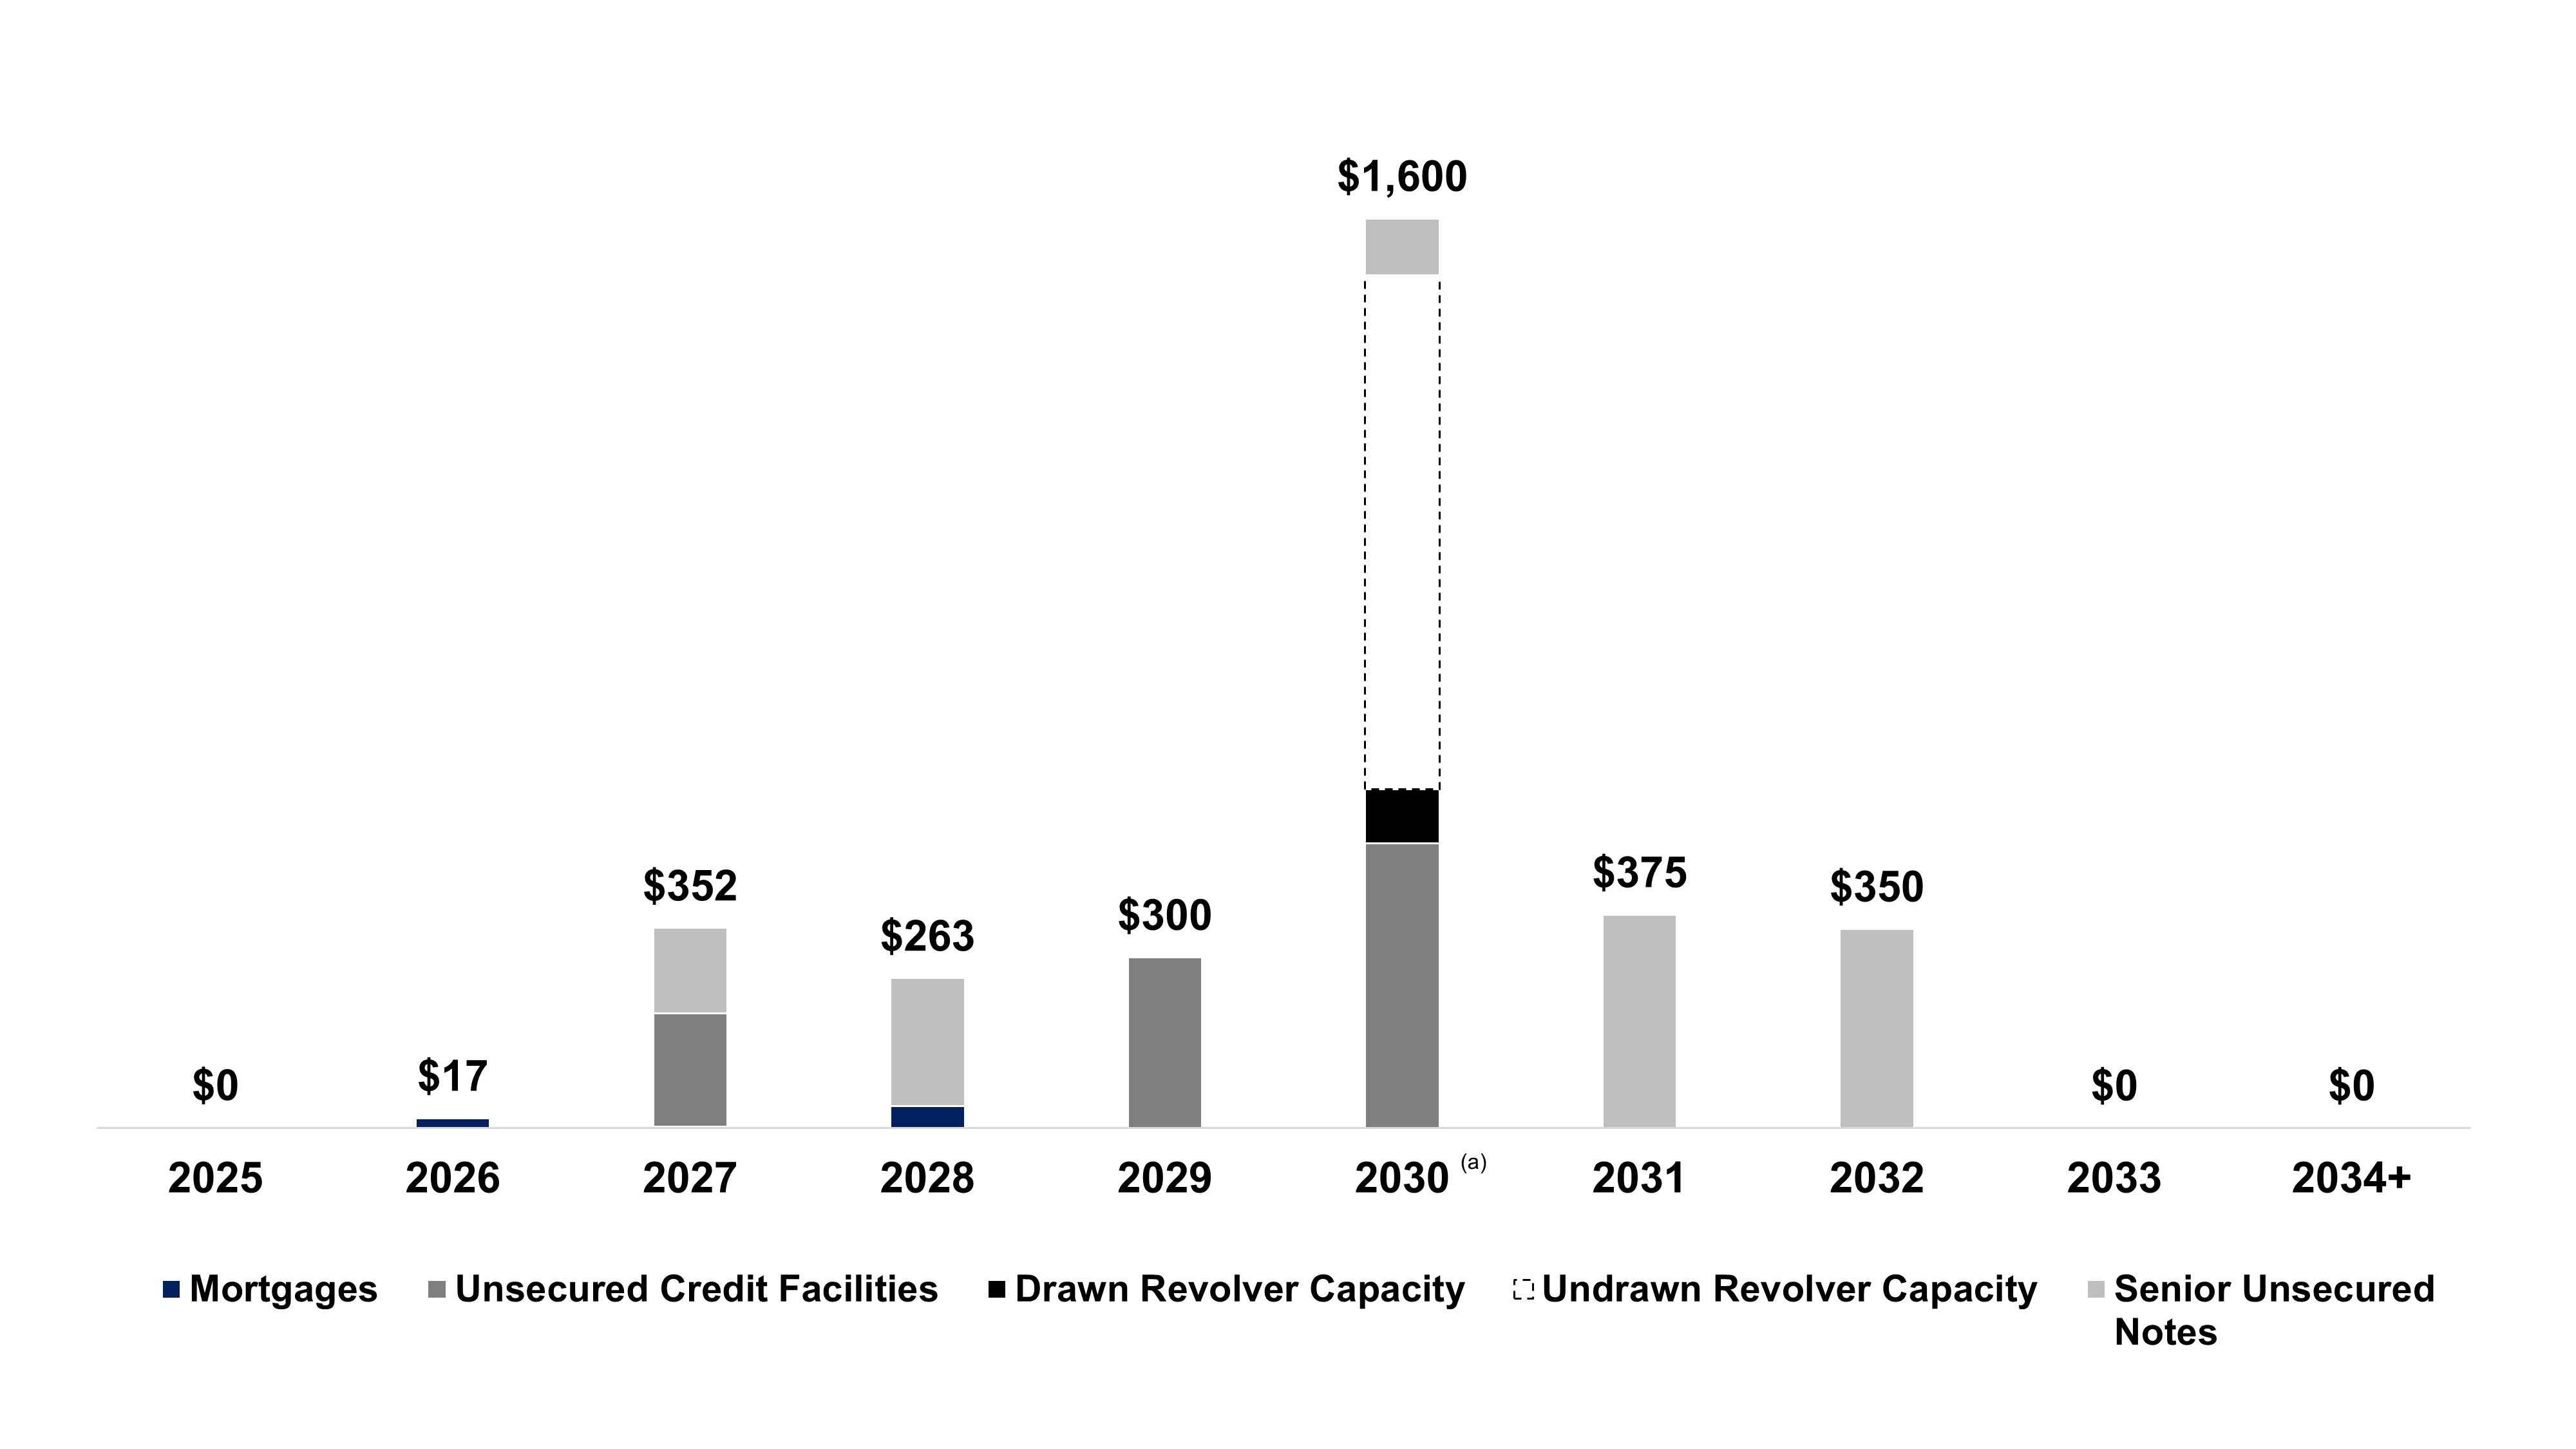
| | | | | | | | | | | | | | | | | | | | | | | | | | | | | |
| Year of Maturity | Revolving
Credit Facility | | Mortgages | | Term Loans | | Senior Notes | | Total |
| 2025 | $ | — | | | $ | 488 | | | $ | — | | | $ | — | | | $ | 488 | |
| 2026 | — | | | 16,843 | | | — | | | — | | | 16,843 | |
| 2027 | — | | | 1,596 | | | 200,000 | | | 150,000 | | | 351,596 | |
| 2028 | — | | | 38,278 | | | 500,000 | | | 225,000 | | | 763,278 | |
| 2029 | 95,824 | | | — | | | 300,000 | | | — | | | 395,824 | |
| Thereafter | — | | | — | | | — | | | 825,000 | | | 825,000 | |
| Total | $ | 95,824 | | | $ | 57,205 | | | $ | 1,000,000 | | | $ | 1,200,000 | | | $ | 2,353,029 | |
| | | | | | | | |
BROADSTONE NET LEASE, INC. | www.broadstone.com | © 2025 Broadstone Net Lease, LLC. All rights reserved. | 12 | |
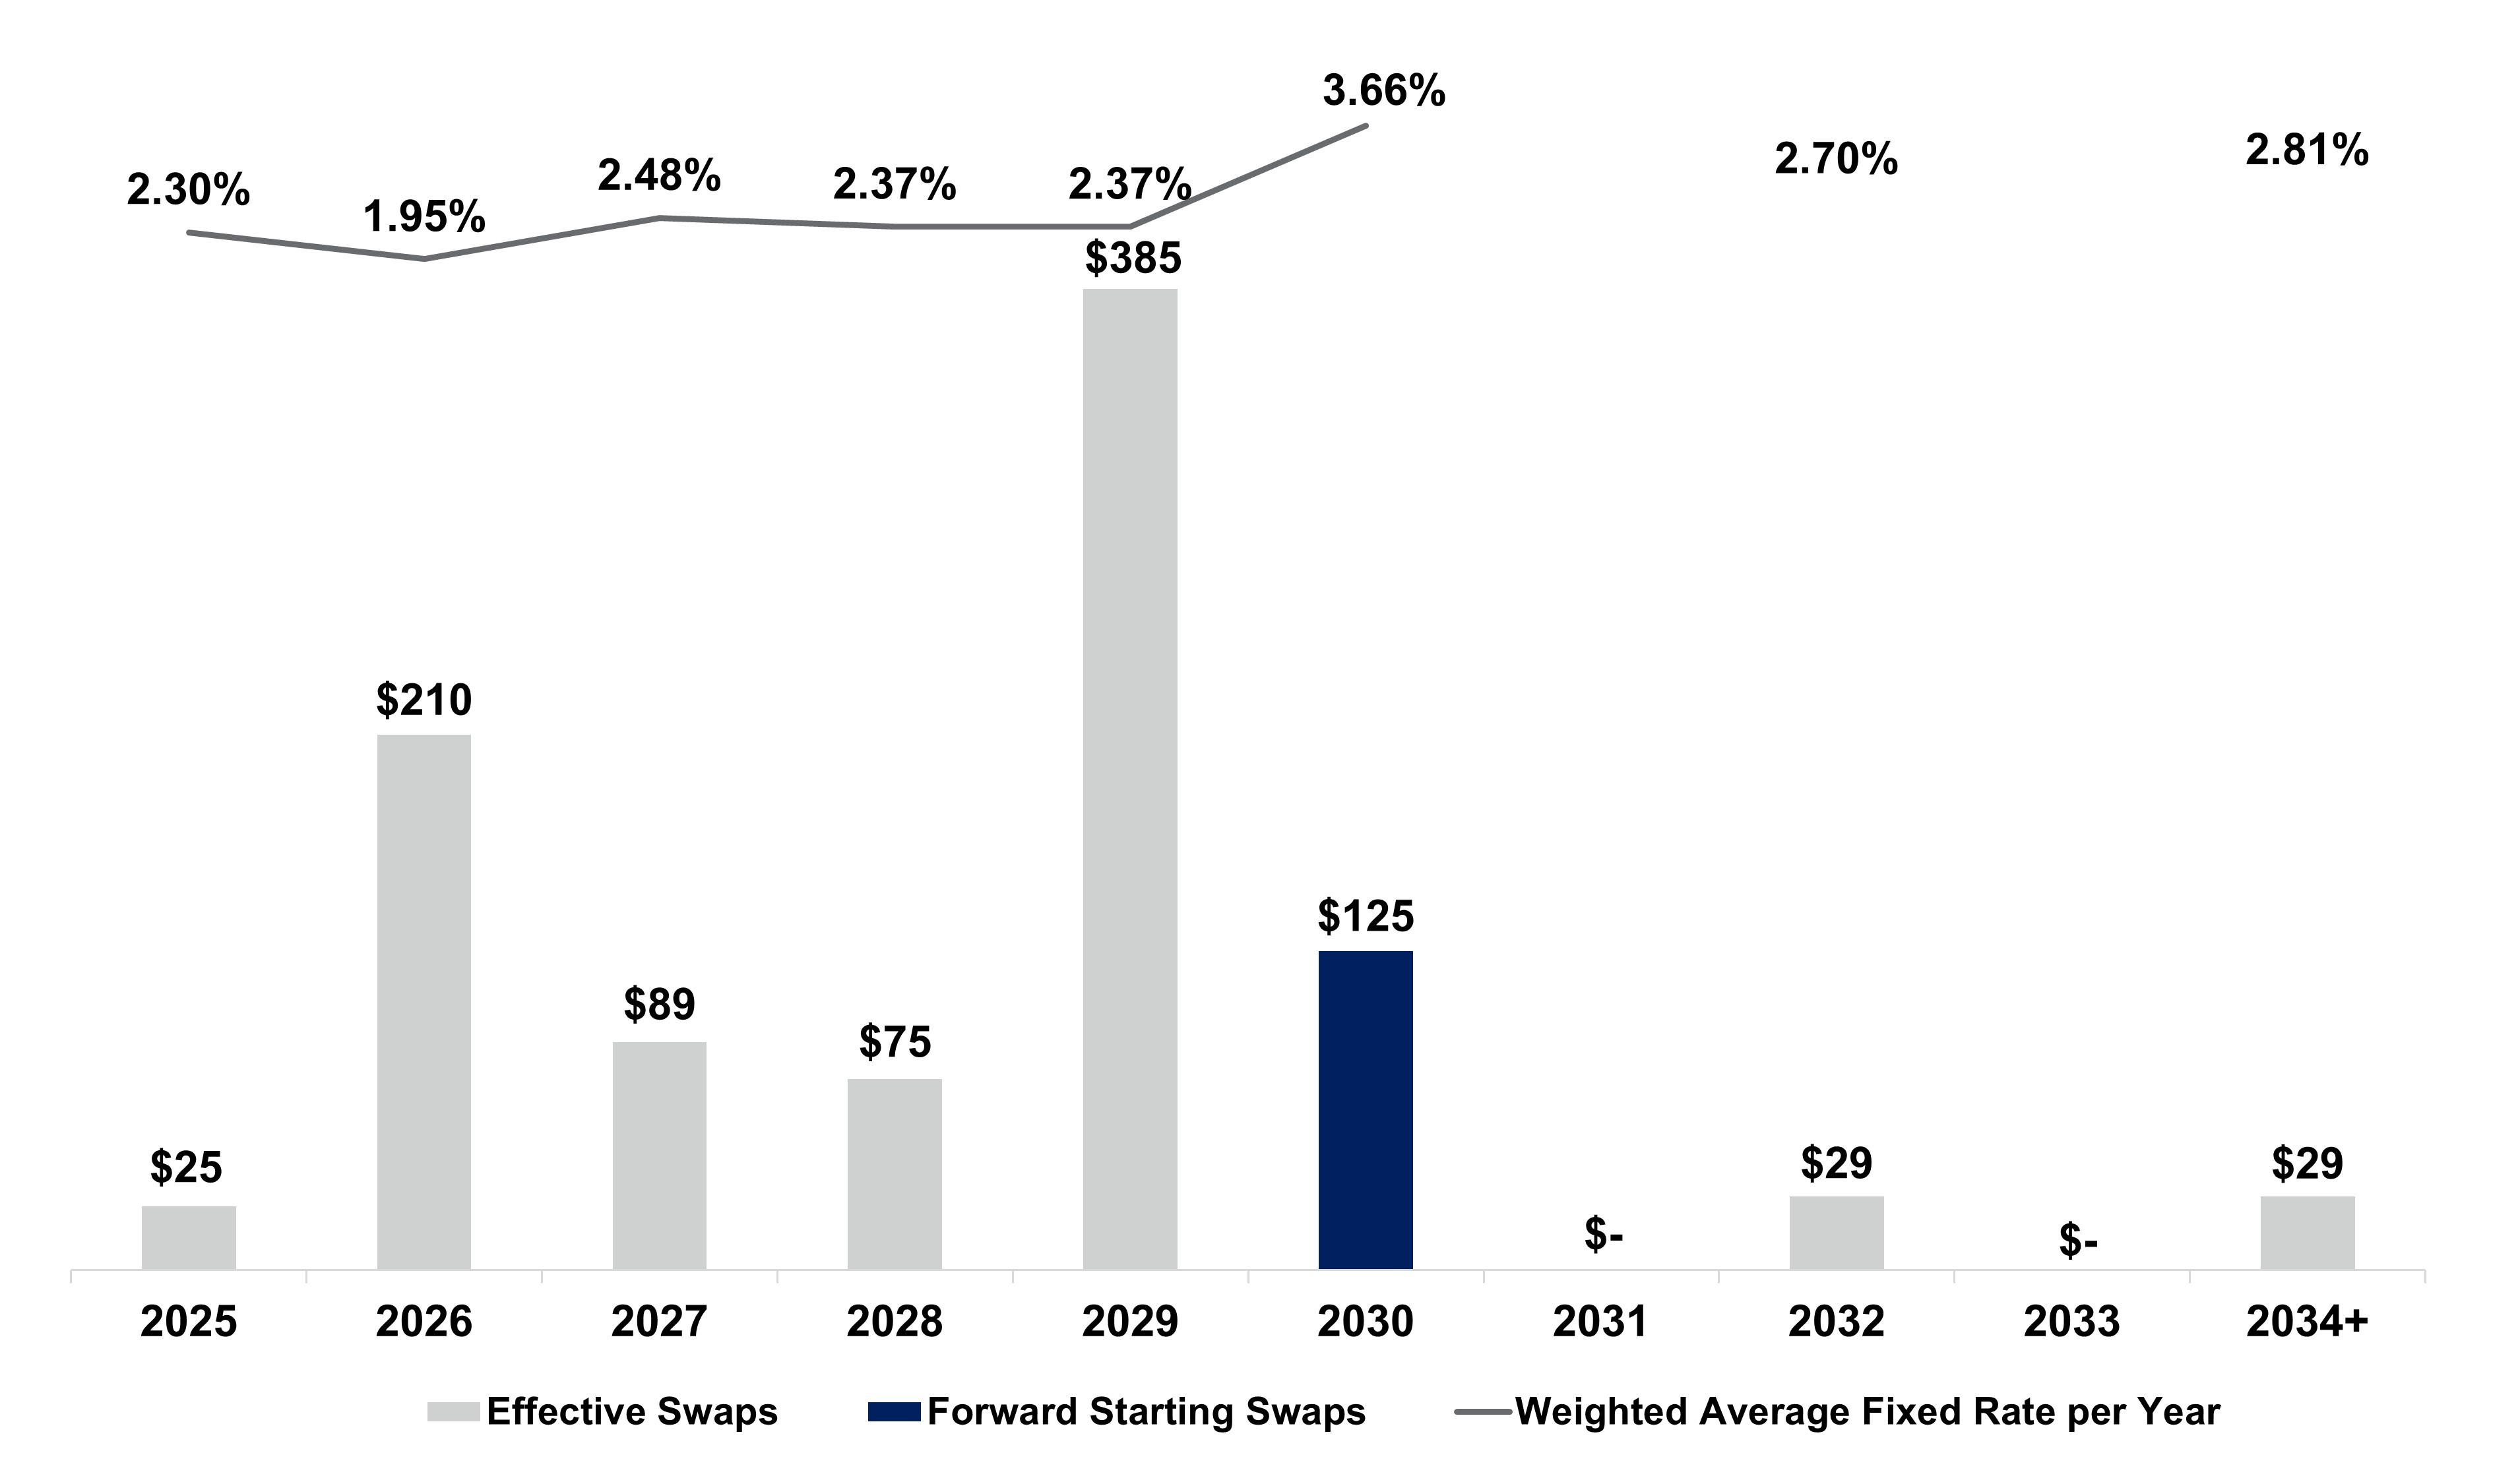
Interest Rate Swaps
(dollars in thousands)
| | | | | | | | | | | | | | | | | | | | | | | | | | | | | | | | |
| | | | | | | | September 30, 2025 |
| Counterparty | | Maturity Date (a) | | Fixed Rate (b) | | Variable Rate Index | | Notional
Amount | | Fair
Value |
Effective Swaps: (c) | | | | | | | | | | |
| Truist Financial Corporation | | December 2025 | | 2.30 | % | | daily compounded SOFR | | 25,000 | | | 112 | |
| Bank of Montreal | | January 2026 | | 1.92 | % | | daily compounded SOFR | | 25,000 | | | 140 | |
| Bank of Montreal | | January 2026 | | 2.05 | % | | daily compounded SOFR | | 40,000 | | | 211 | |
| Capital One, National Association | | January 2026 | | 2.08 | % | | daily compounded SOFR | | 35,000 | | | 182 | |
| Truist Financial Corporation | | January 2026 | | 1.93 | % | | daily compounded SOFR | | 25,000 | | | 139 | |
| Capital One, National Association | | April 2026 | | 2.68 | % | | daily compounded SOFR | | 15,000 | | | 97 | |
| Capital One, National Association | | July 2026 | | 1.32 | % | | daily compounded SOFR | | 35,000 | | | 651 | |
| Bank of Montreal | | December 2026 | | 2.33 | % | | daily compounded SOFR | | 10,000 | | | 158 | |
| Bank of Montreal | | December 2026 | | 1.99 | % | | daily compounded SOFR | | 25,000 | | | 500 | |
| Toronto-Dominion Bank | | March 2027 | | 2.46 | % | | daily compounded CORRA | | 14,365 | | (d) | 29 | |
| Wells Fargo Bank, N.A. | | April 2027 | | 2.72 | % | | daily compounded SOFR | | 25,000 | | | 305 | |
| Bank of Montreal | | December 2027 | | 2.37 | % | | daily compounded SOFR | | 25,000 | | | 585 | |
| Capital One, National Association | | December 2027 | | 2.37 | % | | daily compounded SOFR | | 25,000 | | | 583 | |
| Wells Fargo Bank, N.A. | | January 2028 | | 2.37 | % | | daily compounded SOFR | | 75,000 | | | 1,754 | |
| Bank of Montreal | | May 2029 | | 2.09 | % | | daily compounded SOFR | | 25,000 | | | 1,146 | |
| Regions Bank | | May 2029 | | 2.11 | % | | daily compounded SOFR | | 25,000 | | | 1,128 | |
| Regions Bank | | June 2029 | | 2.03 | % | | daily compounded SOFR | | 25,000 | | | 1,200 | |
| U.S. Bank National Association | | June 2029 | | 2.03 | % | | daily compounded SOFR | | 25,000 | | | 1,200 | |
| Regions Bank | | August 2029 | | 2.58 | % | | one-month SOFR | | 100,000 | | | 2,576 | |
| Toronto-Dominion Bank | | August 2029 | | 2.58 | % | | one-month SOFR | | 45,000 | | | 1,180 | |
| U.S. Bank National Association | | August 2029 | | 2.65 | % | | one-month SOFR | | 15,000 | | | 355 | |
| U.S. Bank National Association | | August 2029 | | 2.58 | % | | one-month SOFR | | 100,000 | | | 2,585 | |
| U.S. Bank National Association | | August 2029 | | 1.35 | % | | daily compounded SOFR | | 25,000 | | | 1,887 | |
| Regions Bank | | March 2032 | | 2.69 | % | | daily compounded CORRA | | 14,365 | | (d) | 185 | |
| U.S. Bank National Association | | March 2032 | | 2.70 | % | | daily compounded CORRA | | 14,365 | | (d) | 181 | |
| Bank of Montreal | | March 2034 | | 2.81 | % | | daily compounded CORRA | | 28,730 | | (e) | 521 | |
| | | | | | | | 841,825 | | | 19,590 | |
Forward Starting Swaps: (c) (f) | | | | | | | | | | |
| Toronto-Dominion Bank | | December 2030 | | 3.66 | % | | daily simple SOFR | | 70,000 | | | (1,110) | |
| Regions Bank | | December 2030 | | 3.66 | % | | daily simple SOFR | | 55,000 | | | (884) | |
| | | | | | | | 125,000 | | | (1,994) | |
| Total Swaps | | | | | | | | $ | 966,825 | | | $ | 17,596 | |
(a)The weighted average maturity date of effective swaps and effective swaps and forward starting swaps combined was 2.8 years and 3.1 years, respectively, at September 30, 2025.
(b)At September 30, 2025, the weighted average interest rate on all outstanding borrowings was 4.09%, inclusive of a weighted average fixed rate on effective interest rate swaps of 2.30%.
(c)The classification between “effective” and “forward starting” swaps is determined as of the most recent period presented.
(d)The contractual notional amount is $20.0 million CAD.
(e)The contractual notional amount is $40.0 million CAD.
(f)Forward starting swaps have effective dates that are five years prior to each respective maturity date.
| | | | | | | | |
BROADSTONE NET LEASE, INC. | www.broadstone.com | © 2025 Broadstone Net Lease, LLC. All rights reserved. | 13 | |
EBITDA, EBITDAre, and Other-Non GAAP Operating Measures
(unaudited, in thousands)
| | | | | | | | | | | | | | | | | | | | | | | | | | | | | |
| Three Months Ended |
| September 30, 2025 | | June 30, 2025 | | March 31, 2025 | | December 31, 2024 | | September 30, 2024 |
| Net income | $ | 27,065 | | | $ | 19,830 | | | $ | 17,493 | | | $ | 27,607 | | | $ | 37,268 | |
| Depreciation and amortization | 40,246 | | | 42,575 | | | 39,497 | | | 42,987 | | | 38,016 | |
| Interest expense | 28,230 | | | 21,112 | | | 20,074 | | | 19,565 | | | 18,178 | |
| Income taxes | 208 | | | 199 | | | 355 | | | 527 | | | 291 | |
| EBITDA | $ | 95,749 | | | $ | 83,716 | | | $ | 77,419 | | | $ | 90,686 | | | $ | 93,753 | |
| Provision for impairment of investment in rental properties | 6,999 | | | 11,939 | | | 16,128 | | | 17,690 | | | 1,059 | |
| Gain on sale of real estate | (3,259) | | | (566) | | | (405) | | | (8,197) | | | (2,441) | |
| EBITDAre | $ | 99,489 | | | $ | 95,089 | | | $ | 93,142 | | | $ | 100,179 | | | $ | 92,371 | |
Adjustment for current quarter investment activity (a) | 1,797 | | | 573 | | | 978 | | | 28 | | | 4,080 | |
Adjustment for current quarter disposition activity (b) | (257) | | | (490) | | | (135) | | | (11) | | | (66) | |
Adjustment to exclude non-recurring and other expenses (c) | (177) | | | (332) | | | 44 | | | 348 | | | (201) | |
| Adjustment to exclude net write-offs of accrued rental income | 755 | | | 3 | | | 2,228 | | | 120 | | | — | |
| Adjustment to exclude realized / unrealized foreign exchange (gain) loss | (1,312) | | | 3,445 | | | 322 | | | (4,699) | | | 942 | |
| Adjustment to exclude cost of debt extinguishment | — | | | — | | | 166 | | | — | | | — | |
| Adjustment to exclude other income from real estate transactions | (43) | | | (46) | | | (63) | | | (1,183) | | | (887) | |
| Adjusted EBITDAre | $ | 100,252 | | | $ | 98,242 | | | $ | 96,682 | | | $ | 94,782 | | | $ | 96,239 | |
Estimated revenues from developments (d) | 2,544 | | | 1,629 | | | 631 | | | 334 | | | — | |
| Pro Forma Adjusted EBITDAre | $ | 102,796 | | | $ | 99,871 | | | $ | 97,313 | | | $ | 95,116 | | | $ | 96,239 | |
| Annualized EBITDAre | $ | 397,956 | | | $ | 380,356 | | | $ | 372,568 | | | $ | 400,716 | | | $ | 369,484 | |
| Annualized Adjusted EBITDAre | 401,008 | | | 392,968 | | | 386,728 | | | 379,128 | | | 384,956 | |
| Pro Forma Annualized Adjusted EBITDAre | 411,184 | | | 399,484 | | | 389,252 | | | 380,464 | | | 384,956 | |
(a)Reflects an adjustment to give effect to all investments during the quarter, including developments that have reached rent commencement, as if they had been made as of the beginning of the quarter.
(b)Reflects an adjustment to give effect to all dispositions during the quarter as if they had been sold as of the beginning of the quarter.
(c)Amounts include less than $0.2 million of accelerated lease intangible amortization during the three months ended September 30, 2025.
(d)Represents estimated contractual revenues based on in-process development spend to-date.
| | | | | | | | | | | | | | | | | | | | | | | | | | | | | |
| Three Months Ended |
| September 30, 2025 | | June 30, 2025 | | March 31, 2025 | | December 31, 2024 | | September 30, 2024 |
| Adjusted EBITDAre | $ | 100,252 | | | $ | 98,242 | | | $ | 96,682 | | | $ | 94,782 | | | $ | 96,239 | |
| General and administrative (excluding certain expenses reflected above) | 9,984 | | | 9,524 | | | 9,628 | | | 9,581 | | | 8,924 | |
| Adjusted Net Operating Income ("NOI") | $ | 110,236 | | | $ | 107,766 | | | $ | 106,310 | | | $ | 104,363 | | | $ | 105,163 | |
| Straight-line rental revenue, net | (5,282) | | | (5,693) | | | (6,084) | | | (6,317) | | | (6,128) | |
| Other amortization and non-cash charges | (1,364) | | | (1,569) | | | (1,007) | | | (796) | | | (1,309) | |
| Adjusted Cash NOI | $ | 103,590 | | | $ | 100,504 | | | $ | 99,219 | | | $ | 97,250 | | | $ | 97,726 | |
| Annualized Adjusted NOI | $ | 440,944 | | | $ | 431,064 | | | $ | 425,240 | | | $ | 417,452 | | | $ | 420,652 | |
| Annualized Adjusted Cash NOI | 414,360 | | | 402,016 | | | 396,876 | | | 389,000 | | | 390,904 | |
| | | | | | | | |
BROADSTONE NET LEASE, INC. | www.broadstone.com | © 2025 Broadstone Net Lease, LLC. All rights reserved. | 14 | |
Net Debt Metrics
(in thousands)
| | | | | | | | | | | | | | | | | | | | | | | | | | | | | |
| September 30, 2025 | | June 30, 2025 | | March 31, 2025 | | December 31, 2024 | | September 30, 2024 |
| Debt | | | | | | | | | |
| Unsecured revolving credit facility | $ | 95,824 | | | $ | 197,880 | | | $ | 174,122 | | | $ | 93,014 | | | $ | 125,482 | |
| Unsecured term loans, net | 994,550 | | | 994,028 | | | 893,505 | | | 897,201 | | | 896,887 | |
| Senior unsecured notes, net | 1,190,315 | | | 846,441 | | | 846,252 | | | 846,064 | | | 845,875 | |
| Mortgages, net | 57,168 | | | 75,685 | | | 76,260 | | | 76,846 | | | 77,416 | |
| Debt issuance costs | 15,171 | | | 9,578 | | | 10,300 | | | 6,802 | | | 7,314 | |
| Gross Debt | 2,353,028 | | | 2,123,612 | | | 2,000,439 | | | 1,919,927 | | | 1,952,974 | |
| Cash and cash equivalents | (81,966) | | | (20,784) | | | (9,605) | | | (14,845) | | | (8,999) | |
| Restricted cash | (1,354) | | | (1,192) | | | (1,428) | | | (1,148) | | | (2,219) | |
| Net Debt | 2,269,708 | | | 2,101,636 | | | 1,989,406 | | | 1,903,934 | | | 1,941,756 | |
Estimated net proceeds from forward equity agreements (a) | (37,257) | | | (37,722) | | | (38,124) | | | (38,514) | | | (38,983) | |
| Pro Forma Net Debt | $ | 2,232,451 | | | $ | 2,063,914 | | | $ | 1,951,282 | | | $ | 1,865,420 | | | $ | 1,902,773 | |
| | | | | | | | | |
| Leverage Ratios: | | | | | | | | | |
| Net Debt to Annualized EBITDAre | 5.7x | | 5.5x | | 5.3x | | 4.8x | | 5.3x |
| Net Debt to Annualized Adjusted EBITDAre | 5.7x | | 5.3x | | 5.1x | | 5.0x | | 5.0x |
| Pro Forma Net Debt to Annualized Adjusted EBITDAre | 5.4x | | 5.2x | | 5.0x | | 4.9x | | 4.9x |
(a)Represents pro forma adjustment for estimated net proceeds from forward sale agreements that have not settled as if they have been physically settled for cash as of the period presented.
Covenants
The following is a summary of key financial covenants for the Company’s unsecured debt instruments. The covenants associated with the Revolving Credit Facility, Unsecured Term Loans with commercial banks, and the Series A-C Senior Unsecured Notes, are reported to the respective lenders via quarterly covenant reporting packages. The covenants associated with the Senior Unsecured Public Notes are not required to be reported externally to third parties, and are instead calculated in connection with borrowing activity and for financial reporting purposes only. These calculations, which are not based on U.S. GAAP measurements, are presented to investors to show that as of September 30, 2025, the Company believes it is in compliance with the covenants.
| | | | | | | | | | | | | | | | | | | | | | | | | | |
| Covenants | | Required | | Revolving Credit Facility and Unsecured Term Loans | | Senior Unsecured
Notes Series
A, B, & C | | Senior Unsecured Public Notes |
| Leverage ratio | | ≤ 0.60 to 1.00 | | 0.34 | | 0.37 | | Not Applicable |
| Secured indebtedness ratio | | ≤ 0.40 to 1.00 | | 0.01 | | 0.01 | | Not Applicable |
| Unencumbered coverage ratio | | ≥ 1.75 to 1.00 | | 4.47 | | Not Applicable | | Not Applicable |
| Fixed charge coverage ratio | | ≥ 1.50 to 1.00 | | 3.23 | | 3.23 | | Not Applicable |
| Total unsecured indebtedness to total unencumbered eligible property value | | ≤ 0.60 to 1.00 | | 0.37 | | 0.42 | | Not Applicable |
| Dividends and other restricted payments | | Only applicable in case of default | | Not Applicable | | Not Applicable | | Not Applicable |
| Aggregate debt ratio | | ≤ 0.60 to 1.00 | | Not Applicable | | Not Applicable | | 0.44 |
| Consolidated income available for debt to annual debt service charge | | ≥ 1.50 to 1.00 | | Not Applicable | | Not Applicable | | 7.76 |
| Total unencumbered assets to total unsecured debt | | ≥ 1.50 to 1.00 | | Not Applicable | | Not Applicable | | 2.29 |
| Secured debt ratio | | ≤ 0.40 to 1.00 | | Not Applicable | | Not Applicable | | 0.01 |
| | | | | | | | |
BROADSTONE NET LEASE, INC. | www.broadstone.com | © 2025 Broadstone Net Lease, LLC. All rights reserved. | 15 | |
Debt Maturities
(dollars in millions)
The Company utilizes diversified sources of debt capital including unsecured bank debt, unsecured notes, and secured mortgages (where appropriate).
| | |
Weighted Average Debt Maturity: 4.4 years (a) |
(a)Our Revolving Credit Facility reflected above assumes exercise of two six-month extension options subject to certain conditions, including the payment of an extension fee equal to 0.0625% of the revolving commitments. Our 2028 unsecured term loan reflected above assumes exercise of two twelve-month extension options subject to certain conditions, including the payment of an extension fee equal to 0.125% of the aggregate principal amount of the loans outstanding under the 2028 term loan facility.
Swap Maturities
(dollars in millions)
| | |
Weighted Average Effective Swap Maturity: 2.8 years Weighted Average Effective & Forward Starting Swap Maturity: 3.1 years |
| | | | | | | | |
BROADSTONE NET LEASE, INC. | www.broadstone.com | © 2025 Broadstone Net Lease, LLC. All rights reserved. | 16 | |
Investment Activity
(square feet and dollars in thousands)
The following tables summarize the Company’s investment activity during 2025.
| | | | | | | | | | | | | | |
| Q3 2025 | Q2 2025 | Q1 2025 | YTD 2025 |
| Acquisitions: | | | | |
| Number of transactions | 3 | 1 | 3 | 7 |
| Number of properties | 3 | 1 | 6 | 10 |
| Square feet | 1,080 | 348 | 438 | 1,866 |
| Acquisition price | $ | 139,462 | | $ | 54,722 | | $ | 59,004 | | $ | 253,188 | |
| Industrial | 118,128 | | 54,722 | | 41,088 | | 213,938 | |
| Retail | 21,334 | | — | | 17,916 | | 39,250 | |
| Initial cash capitalization rate | 7.1 | % | 7.1 | % | 7.2 | % | 7.1 | % |
| Straight-line yield | 8.1 | % | 8.2 | % | 8.3 | % | 8.2 | % |
| Weighted average lease term (years) | 12.0 | 10.7 | 13.6 | 12.1 |
| Weighted average annual rent increase | 2.4 | % | 3.0 | % | 2.6 | % | 2.6 | % |
| | | | |
| Build-to-suit developments: | | | | |
| Investments | $ | 40,999 | | $ | 63,295 | | $ | 26,494 | | $ | 130,788 | |
| | | | |
| Revenue generating capital expenditures: | | | | |
| Number of existing properties | 1 | — | 3 | 4 |
| Investments | $ | 5,507 | | $ | — | | $ | 2,835 | | $ | 8,342 | |
| Initial cash capitalization rate | 8.5 | % | — | % | 8.0 | % | 8.3 | % |
| Weighted average lease term (years) | 16.7 | — | 17.7 | 17.0 |
| Weighted average annual rent increase | 2.0 | % | — | % | 1.7 | % | 1.9 | % |
| | | | |
| Transitional capital: | | | | |
| Number of transactions | 2 | 2 | — | 4 |
Investments (a) | $ | 17,920 | $ | 22,781 | $ | — | $ | 40,701 |
| Cash capitalization rate | 7.8 | % | 7.8 | % | — | % | 7.8 | % |
| | | | |
| Total investments | $ | 203,894 | | $ | 140,798 | | $ | 88,333 | | $ | 433,025 | |
Total initial cash capitalization rate (b) | 7.1 | % | 7.1 | % | 7.2 | % | 7.1 | % |
Total weighted average lease term (years) (b) | 12.2 | 10.7 | 13.8 | 12.3 |
Total weighted average annual rent increase (b) | 2.4 | % | 3.0 | % | 2.5 | % | 2.5 | % |
(a)Refer below for property-level statistics relating to our transitional capital investments.
(b)Transitional capital, which represents a contractual yield on invested capital, and build-to-suit developments, which do not generate revenue during construction, are excluded from the calculations of total cash capitalization, weighted average lease terms, and weighted average rent increases.
| | | | | | | | |
BROADSTONE NET LEASE, INC. | www.broadstone.com | © 2025 Broadstone Net Lease, LLC. All rights reserved. | 17 | |
Build-to-Suit Development Projects
(square feet and dollars in thousands)
The following table summarizes the Company’s in-process developments as of September 30, 2025:
| | | | | | | | | | | | | | | | | | | | | | | | | | | | | | | | | | | | | | | | | | | | | | | | | | | | | | | | | | | | | | | | | | | | |
| Property | | Projected Rentable Square Feet | | Start Date (a) | | Target Stabilization Date/Stabilized Date (a) | | Lease Term (Years) | | Annual Rent Escalations | | Estimated Total Project Investment (a) | | Cumulative Investment | | QTD Q3 2025 Investment | | Estimated Remaining Investment | | Estimated Cash Capitalization Rate (a) | | Estimated Straight-line Yield |
| In-process retail: | | | | | | | | | | | | | | | | | | | | | | |
7 Brew
(Jacksonville - FL) | | 1 | | Jun. 2025 | | Oct. 2025 | | 15.0 | | 1.9 | % | | $ | 2,008 | | | $ | 1,411 | | | $ | 299 | | | $ | 597 | | | 8.0 | % | | 8.8 | % |
Sprouts
(Bedford, TX) | | 22 | | Jul. 2025 | | Aug. 2026 | | 15 | | 0.9 | % | | 9,533 | | | — | | | — | | | 9,533 | | | 7.2 | % | | 7.7 | % |
| In-process industrial: | | | | | | | | | | | | | | | | | | | | | | |
Sierra Nevada
(Dayton - OH) | | 122 | | Oct. 2024 | | Nov. 2025 | | 15.0 | | 3.0 | % | | 58,563 | | | 44,584 | | | 16,630 | | | 13,979 | | | 7.5 | % | | 9.3 | % |
Sierra Nevada
(Dayton - OH) | | 122 | | Oct. 2024 | | Mar. 2026 | | 15.0 | | 3.0 | % | | 55,525 | | | 27,652 | | | 9,811 | | | 27,873 | | | 7.7 | % | | 9.6 | % |
Southwire
(Bremen - GA) | | 1,178 | | Dec. 2024 | | Oct. 2026 | | 10.0 | | 2.8 | % | | 115,411 | | | 22,200 | | | 5,546 | | | 93,211 | | | 7.8 | % | | 8.8 | % |
| Fiat Chrysler Automobile (Forsyth - GA) | | 422 | | Apr. 2025 | | Aug. 2026 | | 15.0 | | 2.8 | % | | 78,242 | | | 19,635 | | | 6,569 | | | 58,607 | | | 6.9 | % | | 8.4 | % |
AGCO
(Vasaila - CA) | | 115 | | Jun. 2025 | | Aug. 2026 | | 12.0 | | 3.5 | % | | 19,523 | | | 14,314 | | | 222 | | | 5,209 | | | 7.0 | % | | 8.5 | % |
Palmer Logistics (Midlothian, TX) (b) | | 270 | | Jul. 2025 | | Jul. 2026 | | 12.3 | | 3.5 | % | | 32,063 | | | 5,260 | | | 1,922 | | | 26,803 | | | 7.6 | % | | 9.2 | % |
| | | | | | | | | | | | | | | | | | | | | | |
| Total / weighted average | | 2,252 | | | | | | 13.1 | | 2.9 | % | | 370,868 | | | 135,056 | | | 40,999 | | | 235,812 | | | 7.5 | % | | 8.9 | % |
| Stabilized industrial: | | | | | | | | | | | | | | | | | | | | | | |
UNFI
(Sarasota - FL) | | 1,016 | | May 2023 | | Stabilized - Sep. 2024 | | 15.0 | | 2.5 | % | | 200,958 | | | 200,958 | | | — | | | — | | | 7.2 | % | | 8.6 | % |
| Stabilized retail: | | | | | | | | | | | | | | | | | | | | | | |
7 Brew
(High Point - NC) | | 1 | | Dec. 2024 | | Stabilized - Jun. 2025 | | 15.0 | | 1.9 | % | | 1,975 | | | 1,975 | | | — | | | — | | | 8.0 | % | | 8.8 | % |
7 Brew
(Charleston - SC) | | 1 | | Feb. 2025 | | Stabilized - May 2025 | | 15.0 | | 1.9 | % | | 1,729 | | | 1,729 | | | — | | | — | | | 7.9 | % | | 8.8 | % |
| | | | | | | | | | | | | | | | | | | | | | |
| Total / weighted average | | 3,270 | | | | | | | 13.7 | | 2.7 | % | | $ | 575,530 | | | $ | 339,718 | | | $ | 40,999 | | | $ | 235,812 | | | 7.4 | % | | 8.8 | % |
(a)Refer to definitions and explanations appearing at the end of this supplemental document.
(b)Development represents our common and preferred equity investments in a consolidated joint venture, and exclude amounts attributed to non-controlling interest holders.
| | | | | | | | |
BROADSTONE NET LEASE, INC. | www.broadstone.com | © 2025 Broadstone Net Lease, LLC. All rights reserved. | 18 | |
The following table summarizes the timing of the Company’s construction investment, quarterly rent, and ABR for in-process and stabilized developments as of September 30, 2025:
(c)Based on estimates and assumptions regarding future events and circumstances that are subject to change. Actual timelines may differ due to a variety of factors including, but not limited to, the timing and progress of projects, fluctuations in construction or operating costs, and the negotiated terms and variability of project agreements. We expect to update project timelines quarterly if there are significant changes to the estimates.
(d)Represents aggregated Estimated Total Project Investment for all projects based on estimated timeline of investment dollars on a quarterly basis. Timing of investment amounts are expected to vary based on actual construction at the properties and will be updated if there are any significant changes to expected costs from quarter to quarter.
(e)Amounts calculated based on aggregate of each project's estimated rent upon stabilization in accordance with the timing of Target Stabilization Date. We expect to update our timing estimates on a quarterly basis.
| | | | | | | | |
BROADSTONE NET LEASE, INC. | www.broadstone.com | © 2025 Broadstone Net Lease, LLC. All rights reserved. | 19 | |
Transitional Capital
The following table summarizes the Company’s transitional capital investments, which are excluded from real estate investment portfolio statistics:
| | | | | |
| Q3 2025 |
| Transitional Capital: | |
| Retail Center - St. Louis, MO | |
| Type | Preferred Equity |
Investment (’000s) (a) | $ | 52,790 | |
Stabilized cash capitalization rate (b) | 8.0 | % |
| Annualized initial cash NOI yield | 7.6 | % |
Remaining term (years) (c) | 1.8 |
| Underlying property metrics | |
| Number of retail spaces | 28 |
| Rentable square footage (“SF”) (’000s) | 332 |
| Weighted average remaining lease term (years) | 5.8 |
Occupancy rate (based on SF) (d) | 95.2 | % |
| Quarterly rent collection | 100.0 | % |
| Industrial Park - Olyphant, PA | |
| Type | Preferred Equity |
Investment (’000s) (e) | $ | 22,287 | |
Stabilized cash capitalization rate (b) | 7.8 | % |
| Annualized initial cash NOI yield | — | % |
Remaining term (years) (f) | 2.8 |
| Industrial Park - Olyphant, PA | |
| Type | Preferred Equity |
Investment (’000s) (e) | $ | 17,830 | |
Stabilized cash capitalization rate (b) | 7.8 | % |
| Annualized initial cash NOI yield | — | % |
Remaining term (years) (f) | 2.8 |
| |
(a)Agreement includes an additional $7.8 million commitment of preferred capital. The remaining commitment at September 30, 2025 is $7.2 million.
(b)Represents stated yield with unpaid amounts accruing with preferential payment.
(c)Agreement contains two one-year extension options subject to a 0.50% fee. Repayment at end of term subject to a $3.5 million repayment fee.
(d)Includes executed leases where rent has not yet commenced.
(e)Preferred equity investment in a consolidated joint venture that has acquired entitled land designated for industrial build-to-suit development.
(f)Agreement contains two one-year extension options subject to a 0.25% fee for the first option, and 0.5% for the second option, and the right to transfer or sell our preferred equity at any time.
| | | | | | | | |
BROADSTONE NET LEASE, INC. | www.broadstone.com | © 2025 Broadstone Net Lease, LLC. All rights reserved. | 20 | |
Dispositions
(square feet and dollars in thousands)
The following table summarizes the Company’s property disposition activity during 2025.
| | | | | | | | | | | | | | | | | | | | | | | | | | | | | | | | |
| Q1 2025 | | | | | | | | | | |
| Property Type | | Number of Properties | | Square Feet | | Acquisition Price | | Disposition Price | | Net Book
Value |
| Other | | 3 | | 30 | | $ | 9,621 | | | $ | 7,385 | | | $ | 9,802 | |
| Total Properties | | 3 | | 30 | | 9,621 | | | 7,385 | | | 9,802 | |
| Weighted average cash cap rate | | | | | | | | | | 9.2 | % |
| | | | | | | | | | |
| Q2 2025 | | | | | | | | | | |
| Property Type | | Number of Properties | | Square Feet | | Acquisition Price | | Disposition Price | | Net Book
Value |
| Retail | | 6 | | 31 | | $ | 13,720 | | | $ | 7,548 | | | $ | 9,154 | |
| Other | | 2 | | 67 | | 26,700 | | | 5,550 | | | 7,473 | |
| Total Properties | | 8 | | 98 | | 40,420 | | | 13,098 | | | 16,628 | |
| Weighted average cash cap rate | | | | | | | | | | 9.5 | % |
| | | | | | | | | | |
| Q3 2025 | | | | | | | | | | |
| Property Type | | Number of Properties | | Square Feet | | Acquisition Price | | Disposition Price | | Net Book
Value |
| Retail | | 1 | | 6 | | $ | 2,506 | | | $ | 1,512 | | | $ | 1,757 | |
| Industrial | | 10 | | 410 | | 40,908 | | | 36,561 | | | 26,630 | |
| Other | | 1 | | 9 | | 1,791 | | | 650 | | | 1,938 | |
| Total Properties | | 12 | | 425 | | 45,205 | | | 38,723 | | | 30,325 | |
| Weighted average cash cap rate | | | | | | | | | | 7.0 | % |
| | | | | | | | | | |
| YTD 2025 | | | | | | | | | | |
| Property Type | | Number of Properties | | Square Feet | | Acquisition Price | | Disposition Price | | Net Book
Value |
| Retail | | 7 | | 37 | | $ | 16,226 | | | $ | 9,060 | | | $ | 10,911 | |
| Industrial | | 10 | | 410 | | 40,908 | | | 36,561 | | | 26,630 | |
| Other | | 6 | | 106 | | 38,112 | | | 13,585 | | | 19,213 | |
| Total Properties | | 23 | | 553 | | $ | 95,246 | | | $ | 59,206 | | | $ | 56,755 | |
| Weighted average cash cap rate | | | | | | | | | | 7.7 | % |
| | | | | | | | |
BROADSTONE NET LEASE, INC. | www.broadstone.com | © 2025 Broadstone Net Lease, LLC. All rights reserved. | 21 | |
Portfolio at a Glance: Key Metrics (a)
| | | | | | | | | | | | | | | | | | | | | | | | | | | | | | | | |
| | | September 30, 2025 | | June 30, 2025 | | March 31, 2025 | | December 31, 2024 | | September 30, 2024 |
| Properties | | 759 | | 766 | | 769 | | 765 | | 773 |
| U.S. States | | 44 | | 44 | | 44 | | 44 | | 44 |
| Canadian Provinces | | 4 | | 4 | | 4 | | 4 | | 4 |
| Total annualized base rent | | $412.9 | M | | $404.2 | M | | $401.3 | M | | $395.5 | M | | $398.2 | M |
| Total rentable square footage (“SF”) | | 40.7 | M | | 40.1 | M | | 39.8 | M | | 39.4 | M | | 39.7 | M |
| Tenants | | 204 | | | 205 | | | 204 | | | 202 | | | 203 | |
| Brands | | 195 | | | 195 | | | 192 | | | 190 | | | 191 | |
| Industries | | 56 | | | 56 | | | 55 | | | 55 | | | 55 | |
| Occupancy (based on SF) | | 99.5 | % | | 99.1 | % | | 99.1 | % | | 99.1 | % | | 99.0 | % |
| Rent Collection | | 100.0 | % | | 99.6 | % | | 99.1 | % | | 99.2 | % | | 99.1 | % |
| Top 10 tenant concentration | | 21.3 | % | | 21.8 | % | | 21.9 | % | | 21.9 | % | | 21.4 | % |
| Top 20 tenant concentration | | 34.7 | % | | 35.2 | % | | 35.3 | % | | 35.5 | % | | 34.9 | % |
Investment grade (tenant/guarantor) (b) | | 20.9 | % | | 20.7 | % | | 20.1 | % | | 20.2 | % | | 19.8 | % |
Financial reporting coverage (c) | | 96.6 | % | | 92.4 | % | | 94.1 | % | | 94.2 | % | | 94.0 | % |
| Rent coverage ratio (restaurants only) | | 3.2x | | 3.3x | | 3.2x | | 3.3x | | 3.3x |
| Weighted average annual rent increases | | 2.0 | % | | 2.0 | % | | 2.0 | % | | 2.0 | % | | 2.0 | % |
| Weighted average remaining lease term | | 9.5 years | | 9.7 years | | 10.0 years | | 10.2 years | | 10.3 years |
| Master leases (based on ABR) | | | | | | | | | | |
| Total portfolio | | 39.0 | % | | 40.1 | % | | 40.9 | % | | 41.4 | % | | 40.2 | % |
| Multi-site tenants | | 66.5 | % | | 68.3 | % | | 68.7 | % | | 69.1 | % | | 69.0 | % |
(a)Property metrics exclude transitional capital investments.
(b)Investment grade tenants are our tenants with a credit rating, and tenants that are subsidiaries or affiliates of companies with a credit rating, as of balance sheet date, of a Baa3/BBB- or higher from one of the three major rating agencies (Moody’s/S&P/Fitch).
(c)Includes 14.6% related to tenants not required to provide financial information under the terms of our lease, but whose financial statements are available publicly at September 30, 2025.
| | | | | | | | |
BROADSTONE NET LEASE, INC. | www.broadstone.com | © 2025 Broadstone Net Lease, LLC. All rights reserved. | 22 | |
Diversification: Tenants & Brands
Top 20 Tenants
| | | | | | | | | | | | | | | | | | | | | | | | | | | | | | | | | | | | | | |
| Tenant | | Property Type | | # of
Properties | | ABR
(’000s) | | ABR as a
% of Total
Portfolio | | Square
Feet
(’000s) | | SF as a
% of Total
Portfolio |
| Roskam Baking Company, LLC* | | Food Processing | | 7 | | $ | 16,236 | | | 3.9 | % | | 2,250 | | 5.5 | % |
| United Natural Foods, Inc. | | Distribution & Warehouse | | 1 | | 14,386 | | | 3.5 | % | | 1,016 | | 2.6 | % |
| AHF, LLC* | | Distribution & Warehouse/Manufacturing | | 8 | | 9,852 | | | 2.4 | % | | 2,284 | | 5.6 | % |
| Joseph T. Ryerson & Son, Inc | | Distribution & Warehouse | | 11 | | 8,116 | | | 2.0 | % | | 1,599 | | 4.0 | % |
| Jack’s Family Restaurants LP* | | Quick Service Restaurants | | 43 | | 7,605 | | | 1.8 | % | | 147 | | 0.4 | % |
| Dollar General Corporation | | General Merchandise | | 64 | | 6,606 | | | 1.6 | % | | 609 | | 1.5 | % |
| Tractor Supply Company | | General Merchandise | | 23 | | 6,525 | | | 1.6 | % | | 462 | | 1.1 | % |
J. Alexander's, LLC* | | Hotels, Restaurants & Leisure | | 16 | | 6,301 | | | 1.5 | % | | 132 | | 0.3 | % |
| Salm Partners, LLC* | | Food Processing | | 2 | | 6,276 | | | 1.5 | % | | 426 | | 1.0 | % |
| Nestle’ Dreyer's Ice Cream Company | | Cold Storage | | 2 | | 6,259 | | | 1.5 | % | | 503 | | 1.2 | % |
| Total Top 10 Tenants | | | | 177 | | $ | 88,162 | | | 21.3 | % | | 9,428 | | 23.2 | % |
| | | | | | | | | | | | |
| Hensley & Company* | | Distribution & Warehouse | | 3 | | $ | 6,231 | | | 1.5 | % | | 577 | | 1.4 | % |
| BluePearl Holdings, LLC** | | Animal Services | | 13 | | 5,905 | | | 1.4 | % | | 159 | | 0.4 | % |
| Axcelis Technologies, Inc. | | Flex and R&D | | 1 | | 5,900 | | | 1.4 | % | | 417 | | 1.0 | % |
| Owens & Minor | | Distribution & Warehouse | | 2 | | 5,785 | | | 1.4 | % | | 523 | | 1.3 | % |
| Red Lobster Hospitality & Red Lobster Restaurants LLC* | | Casual Dining | | 18 | | 5,674 | | | 1.4 | % | | 147 | | 0.4 | % |
| Outback Steakhouse of Florida LLC*(a) | | Casual Dining | | 22 | | 5,544 | | | 1.3 | % | | 140 | | 0.3 | % |
| Krispy Kreme Doughnut Corporation | | Quick Service Restaurants/
Food Processing | | 27 | | 5,538 | | | 1.3 | % | | 156 | | 0.4 | % |
| Big Tex Trailer Manufacturing Inc.* | | Automotive/Distribution & Warehouse/Manufacturing/Office | | 17 | | 5,259 | | | 1.3 | % | | 1,302 | | 3.2 | % |
| Jelly Belly Candy Company | | Distribution & Warehouse/Food Processing/General Merchandise | | 5 | | 4,790 | | | 1.2 | % | | 575 | | 1.4 | % |
| Carvana, LLC | | Industrial Services | | 2 | | 4,755 | | | 1.2 | % | | 230 | | 0.6 | % |
| Total Top 20 Tenants | | | | 287 | | $ | 143,543 | | | 34.7 | % | | 13,654 | | 33.6 | % |
(a)Property metrics exclude transitional capital investments.
*Subject to a master lease.
**Includes properties leased by multiple tenants, some, not all, of which are subject to master leases.
| | | | | | | | |
BROADSTONE NET LEASE, INC. | www.broadstone.com | © 2025 Broadstone Net Lease, LLC. All rights reserved. | 23 | |
Top 20 Tenant Descriptions (a)
| | | | | | | | |
BROADSTONE NET LEASE, INC. | www.broadstone.com | © 2025 Broadstone Net Lease, LLC. All rights reserved. | 24 | |
Top 20 Tenant Descriptions (a) (continued)
| | | | | | | | |
BROADSTONE NET LEASE, INC. | www.broadstone.com | © 2025 Broadstone Net Lease, LLC. All rights reserved. | 25 | |
Top 20 Brands
| | | | | | | | | | | | | | | | | | | | | | | | | | | | | | | | | | | | | | |
| Brand | | Property Type | | # of
Properties | | ABR
(’000s) | | ABR as a
% of Total
Portfolio | | Square
Feet
(’000s) | | SF as a
% of Total
Portfolio |
| Roskam Baking Company, LLC* | | Food Processing | | 7 | | $ | 16,236 | | | 3.9 | % | | 2,250 | | 5.5 | % |
| United Natural Foods, Inc. | | Distribution & Warehouse | | 1 | | 14,386 | | | 3.5 | % | | 1,016 | | 2.5 | % |
| AHF Products* | | Distribution & Warehouse/
Manufacturing | | 8 | | 9,852 | | | 2.4 | % | | 2,284 | | 5.6 | % |
| Ryerson | | Distribution & Warehouse | | 11 | | 8,116 | | | 2.0 | % | | 1,599 | | 3.9 | % |
| Jack's Family Restaurants* | | Quick Service Restaurants | | 43 | | 7,605 | | | 1.8 | % | | 147 | | 0.4 | % |
| Dollar General | | General Merchandise | | 64 | | 6,606 | | | 1.6 | % | | 609 | | 1.5 | % |
| Tractor Supply Company | | General Merchandise | | 23 | | 6,525 | | | 1.6 | % | | 462 | | 1.1 | % |
| Salm Partners, LLC* | | Food Processing | | 2 | | 6,276 | | | 1.5 | % | | 426 | | 1.0 | % |
| Nestle’ | | Cold Storage | | 2 | | 6,259 | | | 1.5 | % | | 503 | | 1.2 | % |
| Hensley* | | Distribution & Warehouse | | 3 | | 6,231 | | | 1.5 | % | | 577 | | 1.4 | % |
| Total Top 10 Brands | | | | 164 | | $ | 88,092 | | | 21.3 | % | | 9,873 | | 24.1 | % |
| | | | | | | | | | | | |
| BluePearl Veterinary Partners** | | Animal Services | | 13 | | 5,905 | | | 1.4 | % | | 159 | | 0.4 | % |
| Axcelis | | Flex and R&D | | 1 | | 5,900 | | | 1.4 | % | | 417 | | 1.0 | % |
| Owens & Minor Distribution, Inc. | | Industrial Services | | 2 | | 5,785 | | | 1.4 | % | | 523 | | 1.3 | % |
| Bob Evans Farms* | | Casual Dining/Food Processing | | 21 | | 5,680 | | | 1.4 | % | | 281 | | 0.7 | % |
| Red Lobster* | | Casual Dining | | 18 | | 5,674 | | | 1.4 | % | | 147 | | 0.4 | % |
| Krispy Kreme | | Quick Service Restaurants/
Food Processing | | 27 | | 5,538 | | | 1.3 | % | | 156 | | 0.4 | % |
| Big Tex Trailers* | | Automotive/Distribution & Warehouse/Manufacturing/Office | | 17 | | 5,259 | | | 1.3 | % | | 1,302 | | 3.2 | % |
| Outback Steakhouse* | | Casual Dining | | 20 | | 4,795 | | | 1.2 | % | | 126 | | 0.3 | % |
| Jelly Belly | | Distribution & Warehouse/Food Processing/General Merchandise | | 5 | | 4,790 | | | 1.2 | % | | 576 | | 1.4 | % |
| Carvana, LLC | | Industrial Services | | 2 | | 4,755 | | | 1.2 | % | | 230 | | 0.6 | % |
| Total Top 20 Brands | | | | 290 | | $ | 142,173 | | | 34.5 | % | | 13,790 | | 33.8 | % |
*Subject to a master lease.
**Includes properties leased by multiple tenants, some, not all, of which are subject to master leases.
| | | | | | | | |
BROADSTONE NET LEASE, INC. | www.broadstone.com | © 2025 Broadstone Net Lease, LLC. All rights reserved. | 26 | |
Diversification: Property Type
(rent percentages based on ABR)
| | | | | | | | |
BROADSTONE NET LEASE, INC. | www.broadstone.com | © 2025 Broadstone Net Lease, LLC. All rights reserved. | 27 | |
Diversification: Property Type (continued)
| | | | | | | | | | | | | | | | | | | | | | | | | | | | | | | | |
| Property Type | | # of Properties | | ABR
(’000s) | | ABR as a %
of Total
Portfolio | | Square Feet (’000s) | | SF as a %
of Total
Portfolio |
| Industrial | | | | | | | | | | |
| Distribution & Warehouse | | 53 | | $ | 85,810 | | | 20.8 | % | | 12,057 | | 29.7 | % |
| Manufacturing | | 79 | | 71,030 | | | 17.2 | % | | 12,270 | | 30.2 | % |
| Food Processing | | 34 | | 50,722 | | | 12.3 | % | | 5,736 | | 14.1 | % |
| Flex and R&D | | 10 | | 22,059 | | | 5.3 | % | | 1,589 | | 3.9 | % |
| Industrial Services | | 21 | | 13,000 | | | 3.1 | % | | 528 | | 1.3 | % |
| Cold Storage | | 3 | | 10,266 | | | 2.5 | % | | 723 | | 1.8 | % |
| In-process Developments | | 6 | | — | | | — | % | | — | | — | % |
| Untenanted | | 1 | | — | | | — | % | | 178 | | 0.4 | % |
| Industrial Total | | 207 | | 252,887 | | | 61.2 | % | | 33,081 | | 81.4 | % |
| Retail | | | | | | | | | | |
| General Merchandise | | 145 | | 32,572 | | | 7.8 | % | | 2,452 | | 6.0 | % |
| Quick Service Restaurants | | 153 | | 27,498 | | | 6.7 | % | | 515 | | 1.3 | % |
| Casual Dining | | 95 | | 26,731 | | | 6.5 | % | | 637 | | 1.6 | % |
| Automotive | | 64 | | 11,571 | | | 2.8 | % | | 760 | | 1.9 | % |
| Animal Services | | 27 | | 11,492 | | | 2.8 | % | | 421 | | 1.0 | % |
| Home Furnishings | | 13 | | 7,476 | | | 1.8 | % | | 797 | | 2.0 | % |
| Healthcare Services | | 18 | | 6,071 | | | 1.5 | % | | 220 | | 0.5 | % |
| Education | | 4 | | 2,952 | | | 0.7 | % | | 118 | | 0.3 | % |
| In-process Developments | | 2 | | — | | | — | % | | — | | — | % |
| Untenanted | | 2 | | — | | — | % | | 14 | | — | % |
| Retail Total | | 523 | | 126,363 | | | 30.6 | % | | 5,934 | | 14.6 | % |
| Other | | | | | | | | | | |
| Office | | 14 | | 23,967 | | | 5.8 | % | | 1,311 | | 3.2 | % |
| Clinical & Surgical | | 15 | | 9,727 | | | 2.4 | % | | 327 | | 0.8 | % |
| Other Total | | 29 | | 33,694 | | | 8.2 | % | | 1,638 | | 4.0 | % |
| Total | | 759 | | $ | 412,944 | | | 100.0 | % | | 40,653 | | 100.0 | % |
| | | | | | | | |
BROADSTONE NET LEASE, INC. | www.broadstone.com | © 2025 Broadstone Net Lease, LLC. All rights reserved. | 28 | |
Key Statistics by Property Type
| | | | | | | | | | | | | | | | | | | | | | | | | | | | | |
| Q3 2025 | | Q2 2025 | | Q1 2025 | | Q4 2024 | | Q3 2024 |
| Industrial | | | | | | | | | |
| Number of properties | 207 | | 215 | | 211 | | 210 | | 207 |
| Square feet (000s) | 33,081 | | 32,694 | | 32,231 | | 31,898 | | 31,898 |
| Weighted average lease term (years) | 10.3 | | 10.5 | | 10.7 | | 11.0 | | 11.1 |
| Weighted average annual rent escalation | 2.2 | % | | 2.1 | % | | 2.2 | % | | 2.1 | % | | 2.1 | % |
| Percentage of total ABR | 61.2 | % | | 60.7 | % | | 59.8 | % | | 59.6 | % | | 59.1 | % |
| | | | | | | | | |
| Retail | | | | | | | | | |
| Number of properties | 523 | | 521 | | 526 | | 520 | | 519 |
| Square feet (000s) | 5,934 | | 5,790 | | 5,820 | | 5,712 | | 5,692 |
| Weighted average lease term (years) | 9.5 | | 9.8 | | 10.0 | | 10.2 | | 10.5 |
| Weighted average annual rent escalation | 1.7 | % | | 1.7 | % | | 1.7 | % | | 1.7 | % | | 1.7 | % |
| Percentage of total ABR | 30.6 | % | | 31.0 | % | | 31.3 | % | | 31.2 | % | | 30.9 | % |
| | | | | | | | | |
| Other | | | | | | | | | |
| Number of properties | 29 | | 30 | | 32 | | 35 | | 47 |
| Square feet (000s) | 1,638 | | 1,647 | | 1,714 | | 1,744 | | 2,118 |
| Weighted average lease term (years) | 4.1 | | 4.2 | | 4.8 | | 5.0 | | 5.3 |
| Weighted average annual rent escalation | 2.4 | % | | 2.4 | % | | 2.4 | % | | 2.4 | % | | 2.4 | % |
| Percentage of total ABR | 8.2 | % | | 8.3 | % | | 8.9 | % | | 9.2 | % | | 10.0 | % |
| | | | | | | | |
BROADSTONE NET LEASE, INC. | www.broadstone.com | © 2025 Broadstone Net Lease, LLC. All rights reserved. | 29 | |
Diversification: Tenant Industry
| | | | | | | | | | | | | | | | | | | | | | | | | | | | | | | | |
| Tenant Industry | | # of Properties | | ABR
(’000s) | | ABR as a %
of Total
Portfolio | | Square Feet (’000s) | | SF as a %
of Total
Portfolio |
| Restaurants | | 252 | | $ | 55,071 | | | 13.3 | % | | 1,195 | | 2.9 | % |
| Packaged Foods & Meats | | 36 | | 51,452 | | | 12.5 | % | | 5,873 | | 14.4 | % |
| Food Distributors | | 7 | | 28,049 | | | 6.8 | % | | 2,534 | | 6.2 | % |
| Distributors | | 28 | | 21,936 | | | 5.3 | % | | 3,357 | | 8.3 | % |
| Healthcare Facilities | | 42 | | 21,220 | | | 5.1 | % | | 748 | | 1.8 | % |
| Specialty Stores | | 39 | | 21,207 | | | 5.1 | % | | 1,845 | | 4.5 | % |
| Auto Parts & Equipment | | 38 | | 19,003 | | | 4.6 | % | | 2,971 | | 7.3 | % |
| Home Furnishing Retail | | 17 | | 12,370 | | | 3.0 | % | | 1,692 | | 4.2 | % |
| Healthcare Services | | 18 | | 12,175 | | | 2.9 | % | | 663 | | 1.6 | % |
| Specialized Consumer Services | | 45 | | 11,698 | | | 2.8 | % | | 712 | | 1.8 | % |
| Metal & Glass Containers | | 8 | | 10,933 | | | 2.6 | % | | 2,206 | | 5.4 | % |
| General Merchandise Stores | | 100 | | 10,437 | | | 2.5 | % | | 928 | | 2.3 | % |
| Industrial Machinery | | 19 | | 9,932 | | | 2.4 | % | | 1,901 | | 4.7 | % |
| Forest Products | | 8 | | 9,852 | | | 2.4 | % | | 2,284 | | 5.6 | % |
| Electronic Components | | 2 | | 6,765 | | | 1.6 | % | | 466 | | 1.1 | % |
| Other (41 industries) | | 97 | | 110,844 | | | 27.1 | % | | 11,086 | | 27.4 | % |
| Untenanted properties | | 3 | | — | | | — | % | | 192 | | 0.5 | % |
| Total | | 759 | | $ | 412,944 | | | 100.0 | % | | 40,653 | | 100.0 | % |
| | | | | | | | |
BROADSTONE NET LEASE, INC. | www.broadstone.com | © 2025 Broadstone Net Lease, LLC. All rights reserved. | 30 | |
Diversification: Geography
(rent percentages based on ABR)
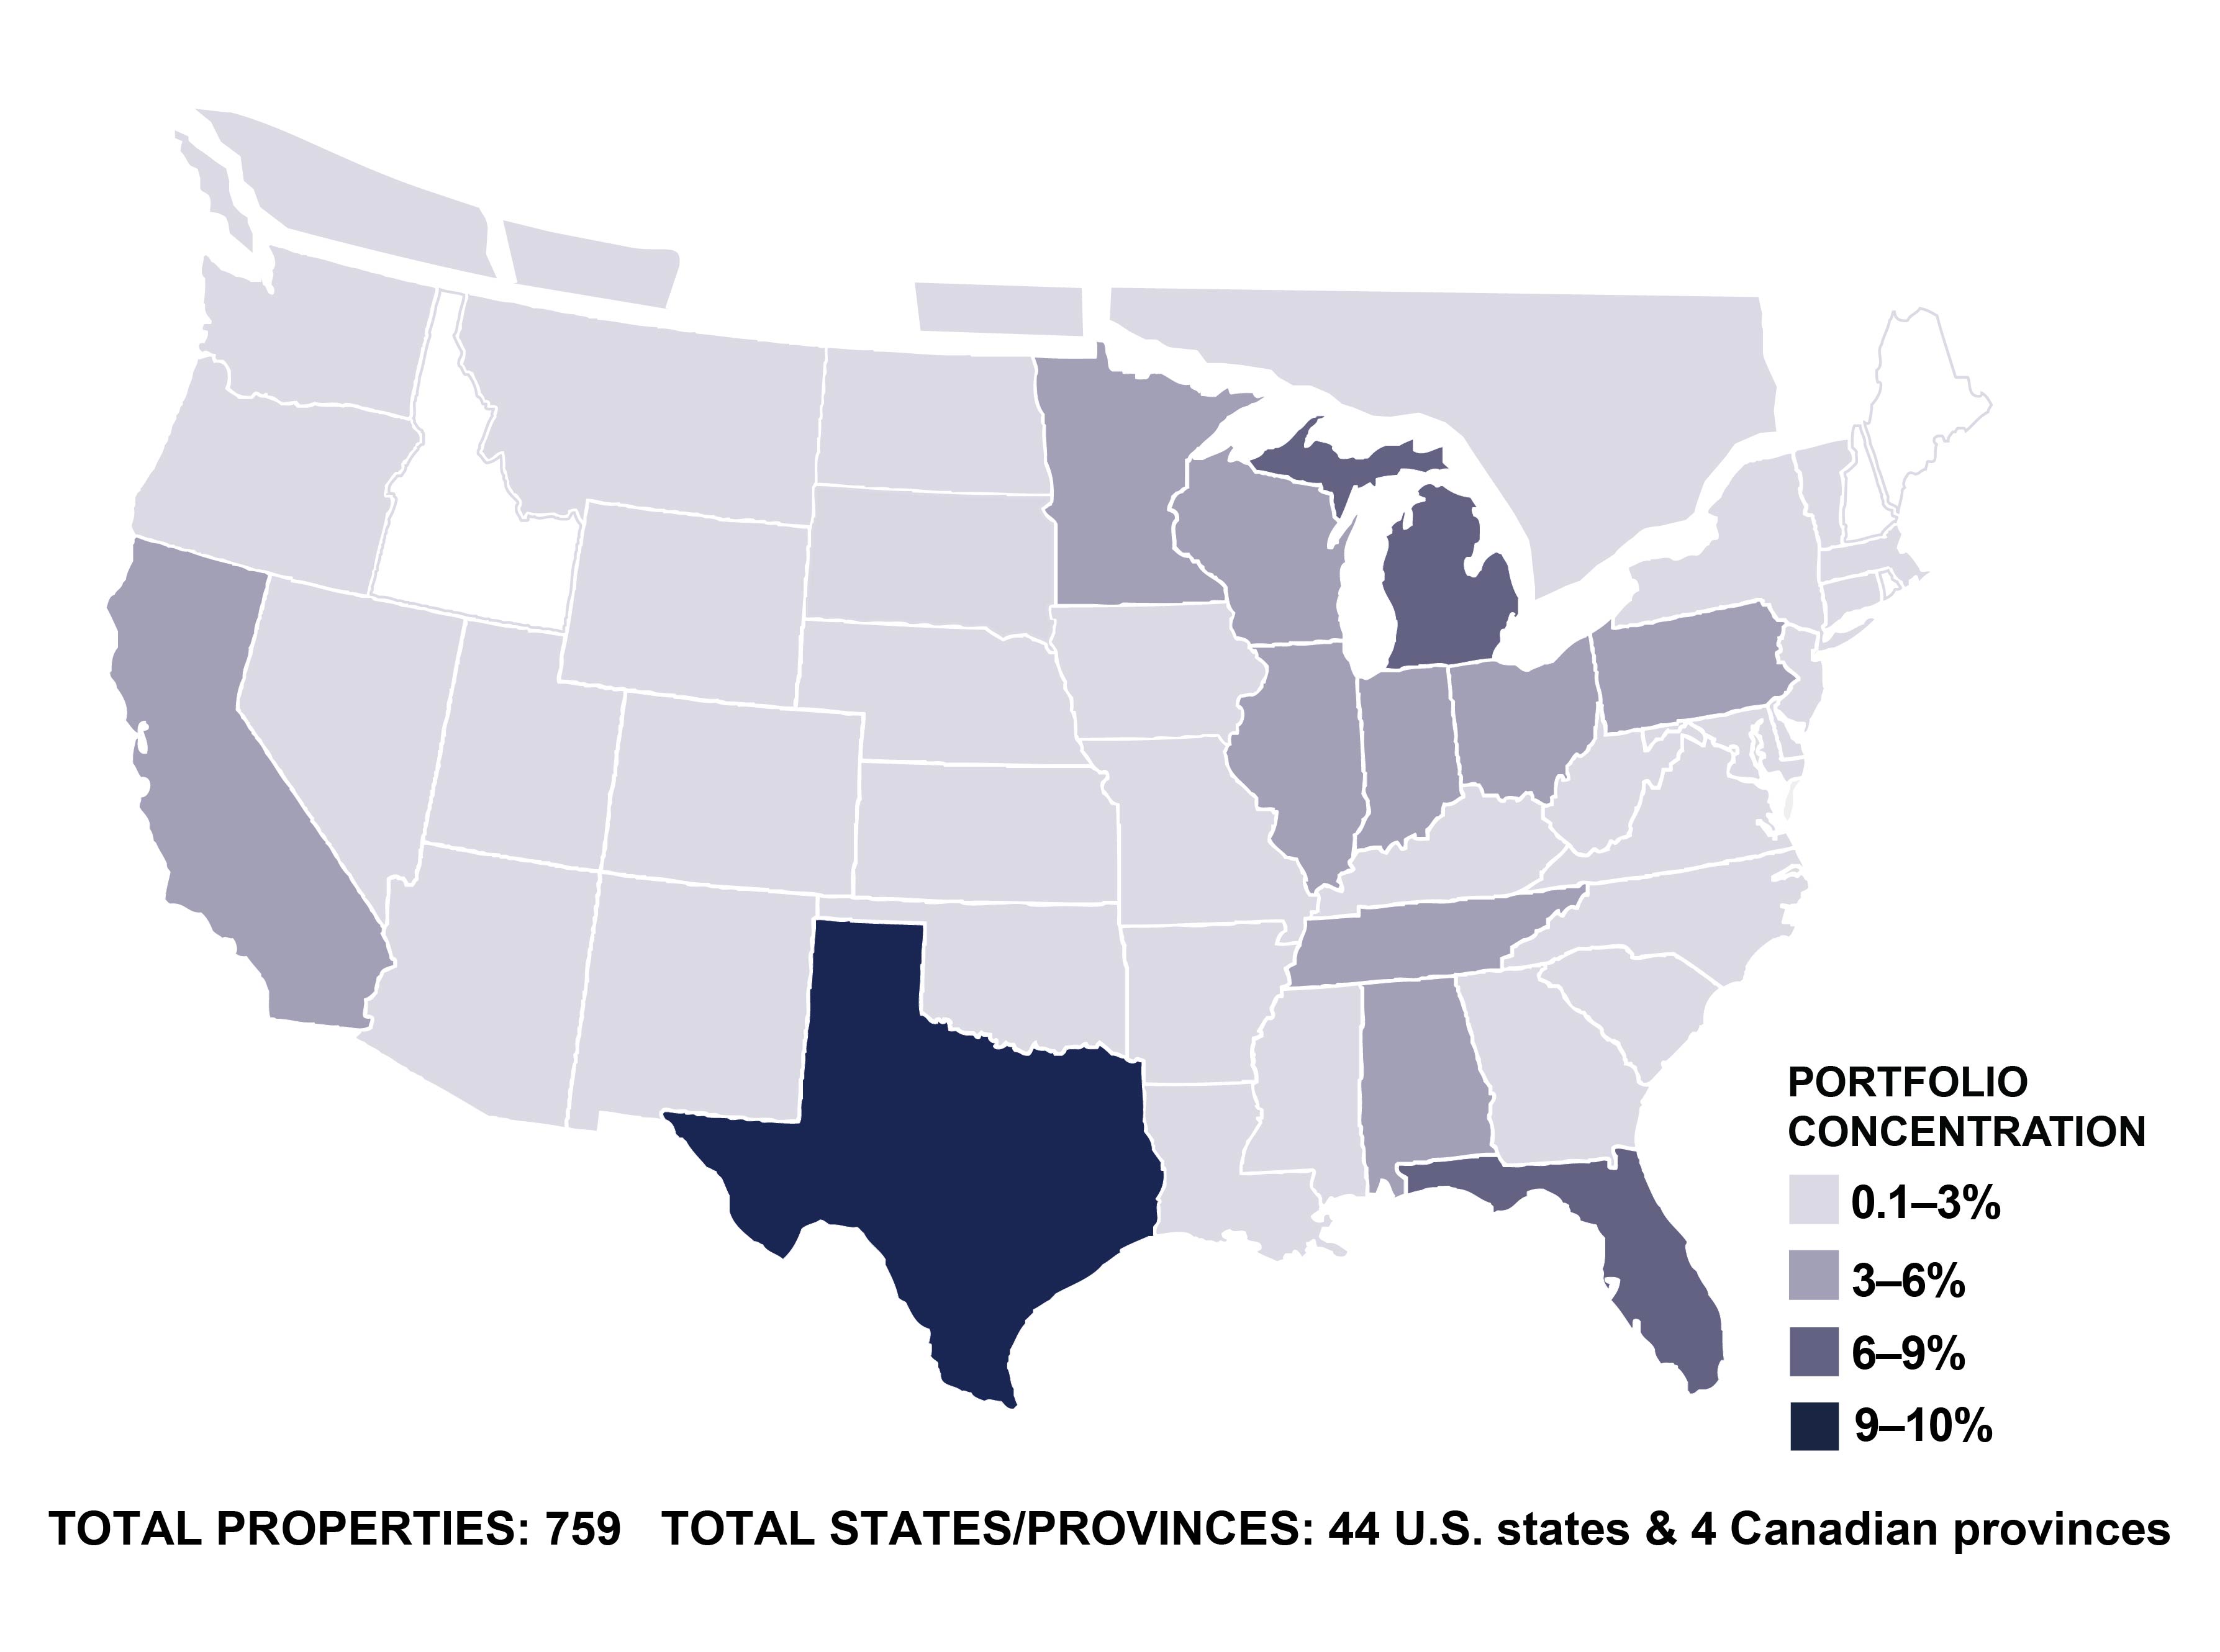
| | | | | | | | | | | | | | | | | | | | | | | | | | | | | | | | | | | | | | | | | | | | | | | | | | | | | | | | | | | | | | | | | | | | | | | |
State /
Province | | # of
Properties | | ABR
(’000s) | | ABR as
a % of
Total
Portfolio | | Square
Feet
(’000s) | | SF as a
% of
Total
Portfolio | | | State /
Province | | # of
Properties | | ABR
(’000s) | | ABR as
a % of
Total
Portfolio | | Square
Feet
(’000s) | | SF as a
% of
Total
Portfolio |
| TX | | 66 | | $ | 37,820 | | | 9.2 | % | | 3,562 | | 8.8 | % | | | SD | | 2 | | $ | 4,524 | | | 1.1 | % | | 340 | | 0.8 | % |
| MI | | 51 | | 36,592 | | | 8.9 | % | | 4,009 | | 9.9 | % | | | MS | | 12 | | 4,160 | | | 1.0 | % | | 607 | | 1.5 | % |
| FL | | 29 | | 26,212 | | | 6.3 | % | | 1,643 | | 4.0 | % | | | LA | | 5 | | 3,833 | | | 0.9 | % | | 211 | | 0.5 | % |
| IL | | 29 | | 23,097 | | | 5.6 | % | | 2,364 | | 5.8 | % | | | NE | | 6 | | 3,438 | | | 0.8 | % | | 492 | | 1.2 | % |
| CA | | 16 | | 22,586 | | | 5.5 | % | | 2,215 | | 5.5 | % | | | SC | | 13 | | 3,379 | | | 0.8 | % | | 304 | | 0.7 | % |
| MN | | 21 | | 20,164 | | | 4.9 | % | | 3,051 | | 7.5 | % | | | WA | | 14 | | 3,349 | | | 0.8 | % | | 148 | | 0.4 | % |
| WI | | 23 | | 18,744 | | | 4.5 | % | | 1,909 | | 4.7 | % | | | IA | | 4 | | 2,922 | | | 0.7 | % | | 622 | | 1.5 | % |
| OH | | 49 | | 16,891 | | | 4.1 | % | | 1,584 | | 3.9 | % | | | NM | | 9 | | 2,795 | | | 0.7 | % | | 107 | | 0.3 | % |
| TN | | 48 | | 15,383 | | | 3.7 | % | | 1,083 | | 2.7 | % | | | UT | | 3 | | 2,768 | | | 0.7 | % | | 280 | | 0.7 | % |
| IN | | 27 | | 14,343 | | | 3.5 | % | | 1,687 | | 4.1 | % | | | CO | | 4 | | 2,612 | | | 0.6 | % | | 126 | | 0.3 | % |
| PA | | 23 | | 13,029 | | | 3.2 | % | | 2,169 | | 5.3 | % | | | MD | | 3 | | 2,155 | | | 0.5 | % | | 205 | | 0.5 | % |
| AL | | 53 | | 12,981 | | | 3.1 | % | | 949 | | 2.3 | % | | | CT | | 2 | | 1,938 | | | 0.5 | % | | 55 | | 0.1 | % |
| GA | | 35 | | 12,173 | | | 2.9 | % | | 1,576 | | 3.9 | % | | | MT | | 7 | | 1,728 | | | 0.4 | % | | 43 | | 0.1 | % |
| NC | | 26 | | 9,963 | | | 2.4 | % | | 961 | | 2.4 | % | | | DE | | 4 | | 1,175 | | | 0.3 | % | | 133 | | 0.3 | % |
| KY | | 23 | | 9,296 | | | 2.3 | % | | 927 | | 2.3 | % | | | ND | | 2 | | 1,073 | | | 0.3 | % | | 24 | | 0.1 | % |
| MO | | 19 | | 9,076 | | | 2.2 | % | | 1,260 | | 3.1 | % | | | VT | | 2 | | 439 | | | 0.1 | % | | 24 | | 0.1 | % |
| WV | | 18 | | 8,982 | | | 2.2 | % | | 1,232 | | 3.0 | % | | | WY | | 1 | | 338 | | | 0.1 | % | | 21 | | 0.1 | % |
| AZ | | 7 | | 8,956 | | | 2.2 | % | | 747 | | 1.8 | % | | | NV | | 1 | | 277 | | | 0.1 | % | | 6 | | 0.0 | % |
| OK | | 25 | | 8,704 | | | 2.1 | % | | 1,006 | | 2.5 | % | | | OR | | 1 | | 136 | | | 0.0 | % | | 9 | | 0.0 | % |
| AR | | 10 | | 7,589 | | | 1.8 | % | | 340 | | 0.8 | % | | | Total U.S. | | 752 | | $ | 404,890 | | | 98.0 | % | | 40,224 | | 98.9 | % |
| NY | | 28 | | 7,410 | | | 1.8 | % | | 562 | | 1.4 | % | | | BC | | 2 | | $ | 4,698 | | | 1.1 | % | | 253 | | 0.6 | % |
| MA | | 3 | | 6,332 | | | 1.5 | % | | 444 | | 1.1 | % | | | ON | | 3 | | 2,049 | | | 0.6 | % | | 101 | | 0.3 | % |
| KS | | 10 | | 5,318 | | | 1.3 | % | | 643 | | 1.6 | % | | | AB | | 1 | | 963 | | | 0.2 | % | | 50 | | 0.1 | % |
| NJ | | 3 | | 5,137 | | | 1.2 | % | | 366 | | 0.9 | % | | | MB | | 1 | | 344 | | | 0.1 | % | | 25 | | 0.1 | % |
| VA | | 15 | | 5,073 | | | 1.2 | % | | 178 | | 0.4 | % | | | Total Canada | | 7 | | $ | 8,054 | | | 2.0 | % | | 429 | | 1.1 | % |
| | | | | | | | | | | | | Grand Total | | 759 | | $ | 412,944 | | | 100.0 | % | | 40,653 | | 100.0 | % |
| | | | | | | | |
BROADSTONE NET LEASE, INC. | www.broadstone.com | © 2025 Broadstone Net Lease, LLC. All rights reserved. | 31 | |
Lease Expirations
(rent percentages based on ABR)
| | | | | | | | | | | | | | | | | | | | | | | | | | | | | | | | | | | | | | |
| Expiration Year | | # of Properties | | # of Leases | | ABR
('000s) | | ABR as a % of Total Portfolio | | Square Feet ('000s) | | SF as a % of Total Portfolio |
| 2025 | | 1 | | 1 | | $ | 1,737 | | | 0.4 | % | | 99 | | 0.2 | % |
| 2026 | | 23 | | 24 | | 12,207 | | | 3.0 | % | | 913 | | 2.2 | % |
| 2027 | | 28 | | 30 | | 26,256 | | | 6.4 | % | | 2,257 | | 5.6 | % |
| 2028 | | 28 | | 28 | | 20,043 | | | 4.9 | % | | 1,793 | | 4.4 | % |
| 2029 | | 60 | | 35 | | 18,473 | | | 4.5 | % | | 2,587 | | 6.4 | % |
| 2030 | | 99 | | 62 | | 51,403 | | | 12.4 | % | | 4,806 | | 11.8 | % |
| 2031 | | 32 | | 27 | | 8,496 | | | 2.1 | % | | 854 | | 2.1 | % |
| 2032 | | 61 | | 46 | | 32,877 | | | 8.0 | % | | 3,481 | | 8.6 | % |
| 2033 | | 50 | | 24 | | 19,778 | | | 4.8 | % | | 1,495 | | 3.7 | % |
| 2034 | | 38 | | 27 | | 14,654 | | | 3.5 | % | | 1,245 | | 3.1 | % |
| 2035 | | 23 | | 18 | | 18,103 | | | 4.4 | % | | 2,314 | | 5.7 | % |
| 2036 | | 88 | | 23 | | 31,554 | | | 7.6 | % | | 3,158 | | 7.8 | % |
| 2037 | | 22 | | 12 | | 29,233 | | | 7.1 | % | | 2,777 | | 6.8 | % |
| 2038 | | 35 | | 34 | | 12,819 | | | 3.1 | % | | 1,212 | | 3.0 | % |
| 2039 | | 15 | | 11 | | 22,741 | | | 5.5 | % | | 1,805 | | 4.4 | % |
| 2040 | | 32 | | 10 | | 8,778 | | | 2.1 | % | | 359 | | 0.9 | % |
| 2041 | | 39 | | 8 | | 17,018 | | | 4.1 | % | | 1,367 | | 3.4 | % |
| 2042 | | 58 | | 13 | | 45,099 | | | 10.9 | % | | 4,803 | | 11.8 | % |
| 2043 | | 3 | | 2 | | 8,050 | | | 1.9 | % | | 517 | | 1.3 | % |
| 2044 | | 3 | | 3 | | 1,660 | | | 0.4 | % | | 103 | | 0.3 | % |
| Thereafter | | 10 | | 3 | | 11,965 | | | 2.9 | % | | 2,516 | | 6.0 | % |
| Total leased properties | | 748 | | 441 | | 412,944 | | | 100.0 | % | | 40,461 | | 99.5 | % |
| In-process developments | | 8 | | 8 | | — | | | — | % | | — | | — | % |
| Untenanted properties | | 3 | | 3 | | — | | | — | % | | 192 | | 0.5 | % |
| Total properties | | 759 | | 452 | | $ | 412,944 | | | 100.0 | % | | 40,653 | | 100.0 | % |
| | | | | | | | |
BROADSTONE NET LEASE, INC. | www.broadstone.com | © 2025 Broadstone Net Lease, LLC. All rights reserved. | 32 | |
Occupancy
Occupancy by Rentable Square Footage
Change in Occupancy
| | | | | |
| Number of properties |
Vacant properties at January 1, 2025 | 2 |
Lease expirations (a) | 2 |
| Leasing activities | (2) |
Vacant properties at March 31, 2025 | 2 |
Lease expirations (a) | 5 |
| Leasing activities | (2) |
| Vacant dispositions | (3) |
Vacant properties at June 30, 2025 | 2 |
Lease expirations (a) | 16 |
| Leasing activities | (12) |
| Vacant dispositions | (3) |
Vacant properties at September 30, 2025 | 3 |
(a)Includes scheduled and unscheduled expirations (including leases rejected in bankruptcy), as well as future expirations resolved and effective in the periods indicated above.
| | | | | | | | |
BROADSTONE NET LEASE, INC. | www.broadstone.com | © 2025 Broadstone Net Lease, LLC. All rights reserved. | 33 | |
Definitions and Explanations
Adjusted NOI, Annualized Adjusted NOI, Adjusted Cash NOI and Annualized Adjusted Cash NOI: Our reported results and net earnings per diluted share are presented in accordance with accounting principles generally accepted in the United States of America (GAAP). Adjusted NOI and Adjusted Cash NOI are non-GAAP financial measures that we believe are useful to assess property-level performance. We compute Adjusted NOI by adjusting Adjusted EBITDAre (defined below) to exclude general and administrative expenses incurred at the corporate level. Given the net lease nature of our portfolio, we do not incur general and administrative expenses at the property level. To compute Adjusted Cash NOI, we adjust Adjusted NOI to exclude non-cash items included in total revenues and property expenses, such as straight-line rental revenue and other amortization and non-cash items, based on an estimate calculated as if all investment and disposition activity that took place during the quarter had occurred on the first day of the quarter. We then annualize quarterly Adjusted NOI and Adjusted Cash NOI by multiplying each amount by four to compute Annualized Adjusted NOI and Annualized Adjusted Cash NOI, respectively, which are also non-GAAP financial measures. We believe Adjusted NOI and Adjusted Cash NOI provide useful and relevant information because they reflect only those income and expense items that are incurred at the property level and present such items on an unlevered basis. We believe that the exclusion of certain non-cash revenues and expenses from Adjusted Cash NOI is a useful supplemental measure for investors to consider because it will help them to better assess our operating performance without the distortions created by non-cash revenues or expenses. You should not unduly rely on Annualized Adjusted NOI and Annualized Adjusted Cash NOI as they are based on assumptions and estimates that may prove to be inaccurate. Our actual reported Adjusted NOI and Adjusted Cash NOI for future periods may be significantly different from our Annualized Adjusted NOI and Annualized Adjusted Cash NOI. Additionally, our computation of Adjusted NOI and Adjusted Cash NOI may differ from the methodology for calculating these metrics used by companies in our industry, and, therefore, may not be comparable to similarly titled measures reported by other companies.
Adjusted Secured Overnight Financing Rate (SOFR): We define Adjusted SOFR as the current one month term SOFR plus an adjustment of 0.10% per the terms of our credit facilities.
Annualized Base Rent (ABR): We define ABR as the annualized contractual cash rent due for the last month of the reporting period, excluding the impacts of short-term rent deferrals, abatements, or free rent, and adjusted to remove rent from properties sold during the month and to include a full month of contractual cash rent for investments made during the month.
Cash Capitalization Rate: Cash Capitalization Rate represents either (1) for acquisitions and new build-to-suit developments, our pro-rata share of the estimated first year cash yield to be generated on a real estate investment, which was estimated at the time of investment based on the contractually specified cash base rent for the first full year after the date of the investment, divided by the purchase price for the property excluding capitalized acquisition costs, or (2) for dispositions, the property’s ABR in effect immediately prior to the disposition, divided by the disposition price, or (3) for transitional capital, the contractual cash yield to be generated on total invested capital.
EBITDA, EBITDAre, Adjusted EBITDAre, Pro Forma Adjusted EBITDAre, Annualized EBITDAre, Annualized Adjusted EBITDAre, and Pro Forma Annualized Adjusted EBITDAre: EBITDA, EBITDAre, Adjusted EBITDAre, Pro Forma Adjusted EBITDAre, Annualized EBITDAre, Annualized Adjusted EBITDAre, and Pro Forma Annualized Adjusted EBITDAre are non-GAAP financial measures. We compute EBITDA as earnings before interest, income taxes and depreciation and amortization. EBITDA is a measure commonly used in our industry. We believe that this ratio provides investors and analysts with a measure of our performance that includes our operating results unaffected by the differences in capital structures, capital investment cycles and useful life of related assets compared to other companies in our industry. We compute EBITDAre in accordance with the definition adopted by Nareit. Nareit defines EBITDAre as EBITDA excluding gains (loss) from the sales of depreciable property and provisions for impairment on investment in real estate. We believe EBITDA and EBITDAre are useful to investors and analysts because they provide important supplemental information about our operating performance exclusive of certain non-cash and other costs. Adjusted EBITDAre represents EBITDAre, adjusted to reflect revenue producing investments and dispositions for the quarter as if such investments and dispositions had occurred at the beginning of the quarter, and to exclude certain GAAP income and expense amounts that are either non-cash, such as cost of debt extinguishments, realized or unrealized gains and losses on foreign currency transactions, or gains on insurance recoveries, or that we believe are one time, or unusual in nature because they relate to unique circumstances or transactions that had not previously occurred and which we do not anticipate occurring in the future, and to eliminate the impact of lease termination fees, and other items that are not a result of normal operations. While investments in build-to-suit developments have an immediate impact to Net Debt, we do not make an adjustment to EBITDAre until the quarter in which the lease commences. We define our Pro Forma Adjusted EBITDAre as Adjusted EBITDAre adjusted to show the impact of estimated contractual revenues based on in-process development spend to-date. Our Pro Forma Net Debt is defined as Net Debt adjusted for estimated net proceeds from forward sale agreements that have not settled as if they have been physically settled for cash as of the period presented. We then annualize quarterly Adjusted EBITDAre and Pro Forma Adjusted EBITDAre by multiplying them by four (“Annualized Adjusted EBITDAre” and “Annualized Pro Forma Adjusted EBITDAre”). You should not unduly rely on this measure as it is based on assumptions and estimates that may prove to be inaccurate. Our actual reported EBITDAre for future periods may be significantly different from our Annualized Adjusted EBITDAre. Adjusted EBITDAre and Annualized Adjusted EBITDAre are not measurements of performance under GAAP, and our Adjusted EBITDAre and Annualized Adjusted EBITDAre may not be comparable to similarly titled measures of other companies. You should not consider our Adjusted EBITDAre and Annualized Adjusted EBITDAre as alternatives to net income or cash flows from operating activities determined in accordance with GAAP.
Funds From Operations (FFO), Core Funds From Operations (Core FFO), and Adjusted Funds From Operations (AFFO): FFO, Core FFO, and AFFO are non-GAAP measures. We believe the use of FFO, Core FFO, and AFFO are useful to investors because they are widely accepted industry measures used by analysts and investors to compare the operating performance of REITs. FFO, Core FFO, and AFFO should not be considered alternatives to net income as a performance measure or to cash flows from operations, as reported on our statement of cash flows, or as a liquidity measure and should be considered in addition to, and not in lieu of, GAAP financial measures. We compute Core FFO by adjusting FFO to exclude certain GAAP income and expense amounts that we believe are infrequently recurring, unusual in nature, or not related to its core real estate operations, including write-offs or recoveries of accrued rental income, lease termination fees and other non-core income from real estate transactions, severance and employee transition costs, and other extraordinary items. We compute AFFO by adjusting Core FFO for certain revenues and expenses that are non-cash or unique in nature, including straight-line rents, amortization of lease intangibles, amortization of debt issuance costs, adjustment to provision for credit losses, non-capitalized transaction costs such as acquisition costs related to deals that failed to transact, (gain) loss on interest rate swaps and other non-cash interest expense, deferred taxes, stock-based compensation, and other specified non-cash items.
| | | | | | | | |
BROADSTONE NET LEASE, INC. | www.broadstone.com | © 2025 Broadstone Net Lease, LLC. All rights reserved. | 34 | |
Definitions and Explanations (continued)
Gross Debt: We define Gross Debt as total debt plus debt issuance costs and original issuance discount.
Net Debt: Net Debt is a non-GAAP financial measure. We define Net Debt as our Gross Debt less cash and cash equivalents and restricted cash.
Occupancy: Occupancy or a specified percentage of our portfolio that is “occupied” or “leased” means as of a specified date the quotient of (1) the total rentable square footage of our properties minus the square footage of our properties that are vacant and from which we are not receiving any rental payment, and (2) the total square footage of our properties.
Rent Coverage Ratio: Rent Coverage Ratio means the ratio of tenant-reported or, when available, management’s estimate, based on tenant-reported financial information, of annual earnings before interest, taxes, depreciation, amortization, and cash rent attributable to the leased property (or properties, in the case of a master lease) to the annualized base rental obligation as of a specified date.
Straight-line Yield: Straight-line yield represents our pro-rata share of the estimated first year yield to be generated on a real estate investment, which was computed at the time of investment based on the straight-line annual rental income computed in accordance with GAAP, divided by the purchase price.
Definitions Related to Development Properties:
•Estimated Total Project Investment: Represents the estimated costs to be incurred to complete development of each project. We expect to update our estimates upon completion of the project, or sooner if there are any significant changes to expected costs from quarter to quarter. Excludes capitalized costs consisting of capitalized interest and other acquisition costs.
•Estimated Cash Capitalization Rate: Calculated by dividing the estimated first year cash yield to be generated on a real estate investment by the Estimated Total Project Investment for the property.
•Estimated Straight-line Yield: Represents the estimated first year yield to be generated on a real estate investment, which was computed at the time of investment based on the estimated annual straight-line rental income computed in accordance with GAAP, divided by the Estimated Total Project Investment.
•Start Date: The Start Date represents the period in which we have begun physical construction on a property.
•Target Stabilization Date: The Target Stabilization Date is our current estimate of the period in which we will have substantially completed a project and the project is made available for occupancy. We expect to update our timing estimates on a quarterly basis.
| | | | | | | | |
BROADSTONE NET LEASE, INC. | www.broadstone.com | © 2025 Broadstone Net Lease, LLC. All rights reserved. | 35 | |