Exhibit 99.2

Supplemental Financial PresentationMay 10, 2022
Important Information Forward-Looking Statements This presentation contains forward-looking statements
that are subject to risks and uncertainties. All statements other than statements of historical fact included in this presentation are forward-looking statements. You can identify forward-looking statements by the fact that they generally
include words such as "anticipate," "estimate," "expect," "project," "plan,“ "intend," "believe," “outlook” and other words of similar meaning in connection with any discussion of the timing or nature of future operating or financial
performance or other events but not all forward-looking statements contain these identifying words. These forward-looking statements are based on assumptions that the Company’s management has made in light of their industry experience and on
their perceptions of historical trends, current conditions, expected future developments and other factors they believe are appropriate under the circumstances. As you consider this presentation, you should understand that these statements
are not guarantees of performance or results. They involve risks, uncertainties (some of which are beyond the Company’s control) and assumptions. These risks, uncertainties and assumptions include, but are not limited to, the following: the
effect of COVID-19 on our business operations, growth strategies, store traffic, employee availability, financial condition, liquidity and cash flow; decreases in consumer spending due to declines in consumer confidence, local and national
economic conditions, including inflation, or changes in consumer preferences; the Company’s failure to maintain and enhance its strong brand image; the Company’s failure to compete effectively, to maintain good relationships with its key
suppliers, and to improve and expand its exclusive product offerings; supply chain disruptions; and the Company’s ability to effectively execute on its growth strategy. The Company discusses the foregoing risks and other risks in greater
detail under the heading “Risk factors” in the periodic reports filed by the Company with the Securities and Exchange Commission. Although the Company believes that these forward-looking statements are based on reasonable assumptions, you
should be aware that many factors could affect the Company’s actual financial results and cause them to differ materially from those anticipated in the forward-looking statements. Because of these factors, the Company cautions that you should
not place undue reliance on any of these forward-looking statements. New risks and uncertainties arise from time to time, and it is impossible for the Company to predict those events or how they may affect the Company. Further, any
forward-looking statement speaks only as of the date on which it is made. Except as required by law, the Company does not intend to update or revise the forward-looking statements in this presentation after the date of this presentation.
Industry and Market InformationStatements in this presentation concerning our industry and the markets in which we operate, including our general expectations and competitive position, business opportunity and market size, growth and share,
are based on information from independent industry organizations and other third-party sources, data from our internal research and management estimates. Management estimates are derived from publicly available information and the information
and data referred to above and are based on assumptions and calculations made by us based upon our interpretation of such information and data. The information and data referred to above are imprecise and may prove to be inaccurate because
the information cannot always be verified with complete certainty due to the limitations on the availability and reliability of raw data, the voluntary nature of the data gathering process and other limitations and uncertainties. As a result,
please be aware that the data and statistical information in this presentation may differ from information provided by our competitors or from information found in current or future studies conducted by market research institutes, consultancy
firms or independent sources. COVID-19 ImpactIn December 2019, a novel strain of coronavirus (“COVID-19”) was reported in Wuhan, China. Since first being reported, COVID-19 spread to numerous countries around the world, including the U.S.,
resulting in the World Health Organization declaring the outbreak a global pandemic on March 11, 2020. COVID-19 has had and may continue to have a significant impact on economic conditions and consumer confidence. There remains significant
uncertainty around the duration and impact of the COVID-19 pandemic on the U.S. economy and consumer confidence. These and other effects make it more challenging for us to estimate the future performance of our business, particularly over the
near-to-medium term. For more information about the risks, uncertainties, and other factors that could affect our future results, please see the risks described in our Annual Report on Form 10-K, our Quarterly Report on Form 10-Q and our
subsequent filings with the Securities and Exchange Commission.
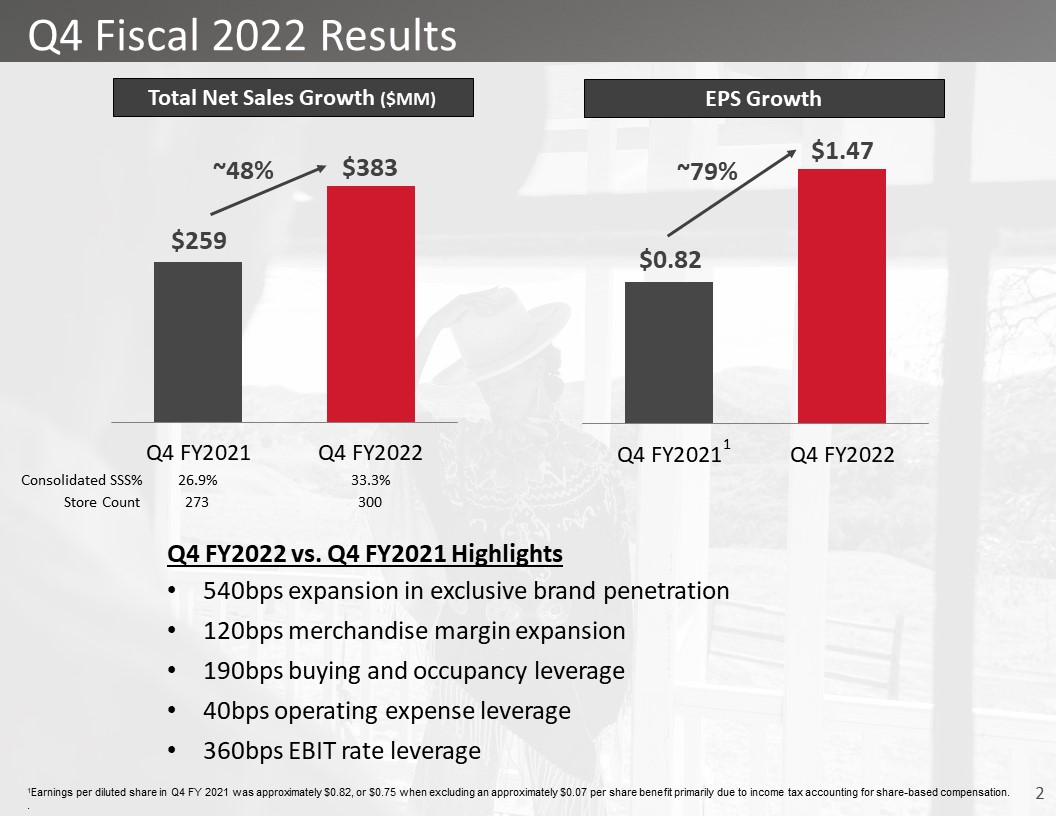
Q4 Fiscal 2022 Results Total Net Sales Growth ($MM) EPS Growth Consolidated
SSS% 26.9% 33.3% 1 Q4 FY2022 vs. Q4 FY2021 Highlights540bps expansion in exclusive brand penetration120bps merchandise margin expansion190bps buying and occupancy leverage40bps operating expense leverage360bps EBIT rate leverage Store
Count 273 300 ~48% 1Earnings per diluted share in Q4 FY 2021 was approximately $0.82, or $0.75 when excluding an approximately $0.07 per share benefit primarily due to income tax accounting for share-based compensation. .
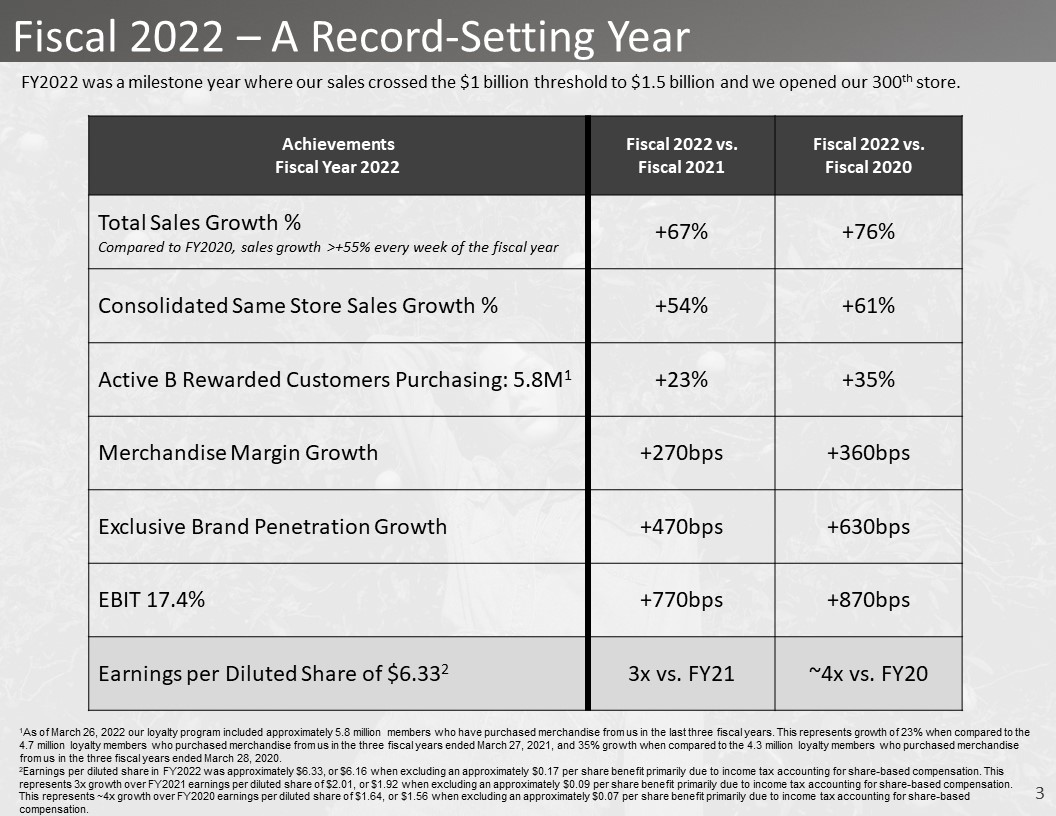
Fiscal 2022 – A Record-Setting Year AchievementsFiscal Year 2022 Fiscal 2022 vs. Fiscal 2021 Fiscal
2022 vs.Fiscal 2020 Total Sales Growth %Compared to FY2020, sales growth >+55% every week of the fiscal year +67% +76% Consolidated Same Store Sales Growth % +54% +61% Active B Rewarded Customers Purchasing:
5.8M1 +23% +35% Merchandise Margin Growth +270bps +360bps Exclusive Brand Penetration Growth +470bps +630bps EBIT 17.4% +770bps +870bps Earnings per Diluted Share of $6.332 3x vs. FY21 ~4x vs. FY20 FY2022 was a milestone year
where our sales crossed the $1 billion threshold to $1.5 billion and we opened our 300th store. 1As of March 26, 2022 our loyalty program included approximately 5.8 million members who have purchased merchandise from us in the last three
fiscal years. This represents growth of 23% when compared to the 4.7 million loyalty members who purchased merchandise from us in the three fiscal years ended March 27, 2021, and 35% growth when compared to the 4.3 million loyalty members who
purchased merchandise from us in the three fiscal years ended March 28, 2020. 2Earnings per diluted share in FY2022 was approximately $6.33, or $6.16 when excluding an approximately $0.17 per share benefit primarily due to income tax
accounting for share-based compensation. This represents 3x growth over FY2021 earnings per diluted share of $2.01, or $1.92 when excluding an approximately $0.09 per share benefit primarily due to income tax accounting for share-based
compensation. This represents ~4x growth over FY2020 earnings per diluted share of $1.64, or $1.56 when excluding an approximately $0.07 per share benefit primarily due to income tax accounting for share-based compensation. .
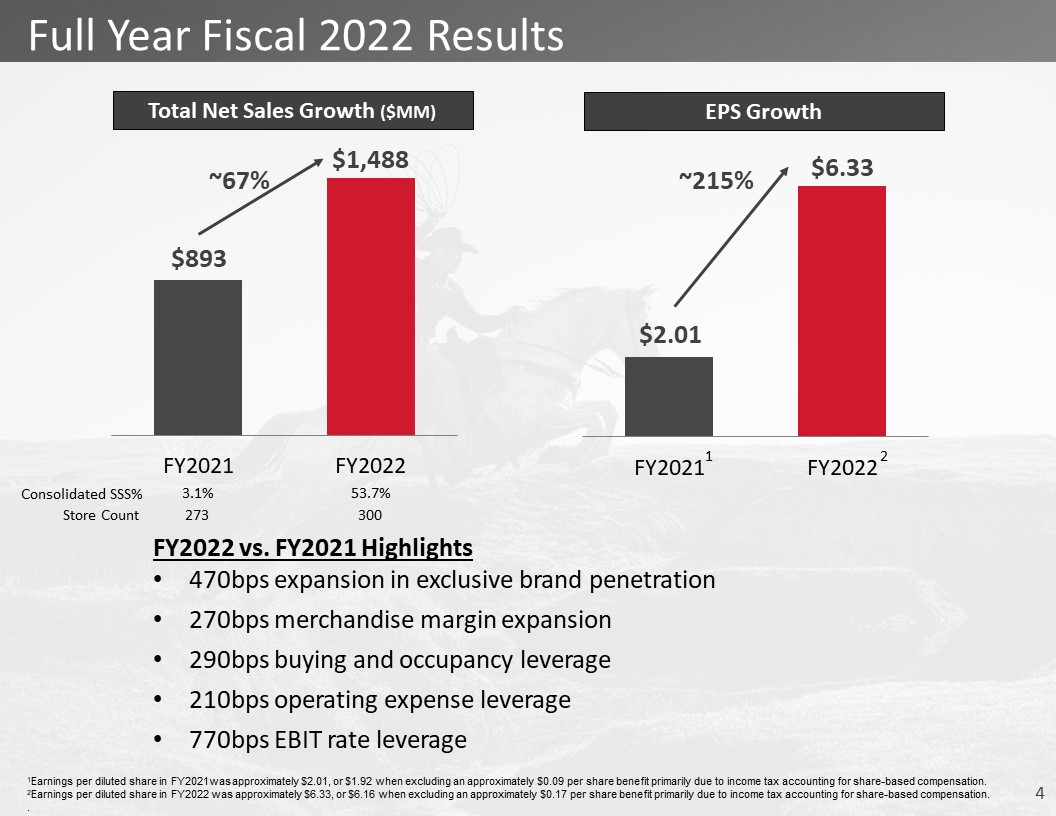
Full Year Fiscal 2022 Results Total Net Sales Growth ($MM) EPS Growth Consolidated
SSS% 3.1% 53.7% FY2022 vs. FY2021 Highlights470bps expansion in exclusive brand penetration270bps merchandise margin expansion290bps buying and occupancy leverage210bps operating expense leverage770bps EBIT rate leverage 1 Store
Count 273 300 ~67% 1Earnings per diluted share in FY2021was approximately $2.01, or $1.92 when excluding an approximately $0.09 per share benefit primarily due to income tax accounting for share-based compensation.2Earnings per diluted
share in FY2022 was approximately $6.33, or $6.16 when excluding an approximately $0.17 per share benefit primarily due to income tax accounting for share-based compensation..
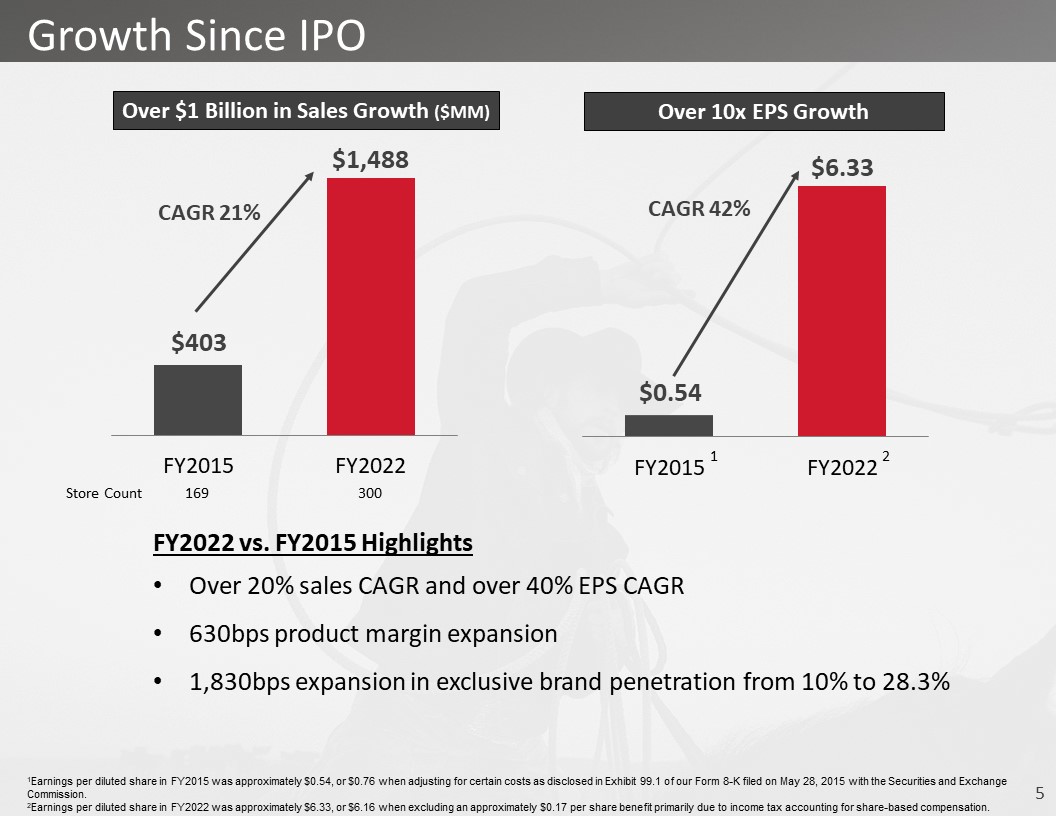
Growth Since IPO Over $1 Billion in Sales Growth ($MM) Over 10x EPS Growth 169 300 FY2022 vs.
FY2015 HighlightsOver 20% sales CAGR and over 40% EPS CAGR630bps product margin expansion1,830bps expansion in exclusive brand penetration from 10% to 28.3% 1 Store Count CAGR 21% CAGR 42% 1Earnings per diluted share in FY2015 was
approximately $0.54, or $0.76 when adjusting for certain costs as disclosed in Exhibit 99.1 of our Form 8-K filed on May 28, 2015 with the Securities and Exchange Commission. 2Earnings per diluted share in FY2022 was approximately $6.33, or
$6.16 when excluding an approximately $0.17 per share benefit primarily due to income tax accounting for share-based compensation..
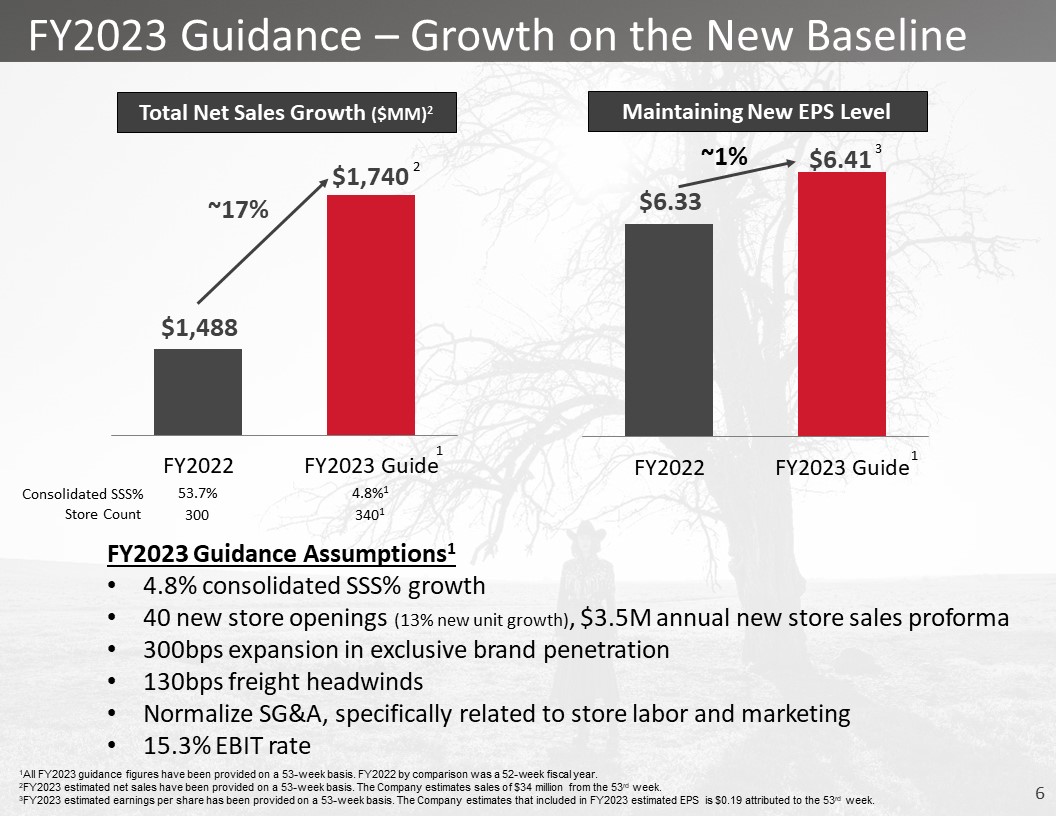
FY2023 Guidance – Growth on the New Baseline Total Net Sales Growth ($MM)2 Maintaining New EPS
Level FY2023 Guidance Assumptions14.8% consolidated SSS% growth 40 new store openings (13% new unit growth), $3.5M annual new store sales proforma300bps expansion in exclusive brand penetration130bps freight headwindsNormalize SG&A,
specifically related to store labor and marketing15.3% EBIT rate Consolidated SSS% 53.7% 4.8%1 Store Count 300 3401 1All FY2023 guidance figures have been provided on a 53-week basis. FY2022 by comparison was a 52-week fiscal year.
2FY2023 estimated net sales have been provided on a 53-week basis. The Company estimates sales of $34 million from the 53rd week. 3FY2023 estimated earnings per share has been provided on a 53-week basis. The Company estimates that included
in FY2023 estimated EPS is $0.19 attributed to the 53rd week. . ~1% 1 2 3
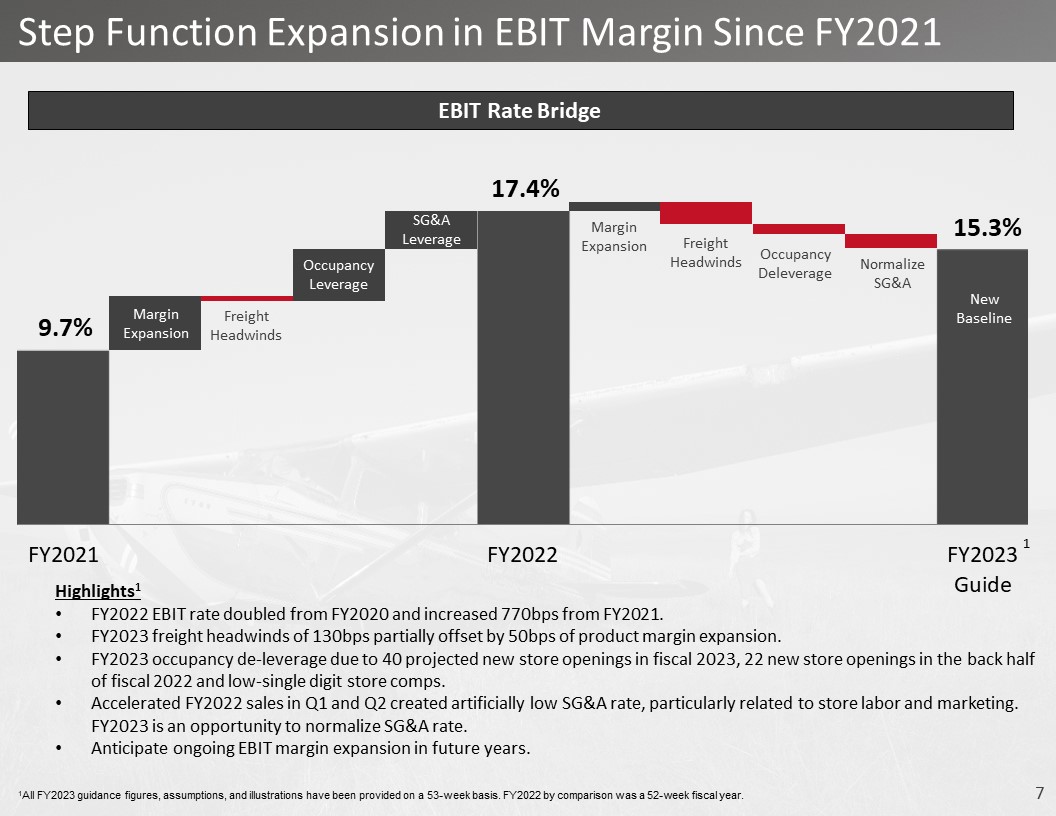
Step Function Expansion in EBIT Margin Since FY2021 EBIT Rate
Bridge 9.7% 17.4% MarginExpansion OccupancyLeverage SG&A Leverage FreightHeadwinds 15.3% MarginExpansion FreightHeadwinds OccupancyDeleverage NormalizeSG&A NewBaseline Highlights1FY2022 EBIT rate doubled from
FY2020 and increased 770bps from FY2021.FY2023 freight headwinds of 130bps partially offset by 50bps of product margin expansion.FY2023 occupancy de-leverage due to 40 projected new store openings in fiscal 2023, 22 new store openings in the
back half of fiscal 2022 and low-single digit store comps.Accelerated FY2022 sales in Q1 and Q2 created artificially low SG&A rate, particularly related to store labor and marketing. FY2023 is an opportunity to normalize SG&A
rate.Anticipate ongoing EBIT margin expansion in future years. 1All FY2023 guidance figures, assumptions, and illustrations have been provided on a 53-week basis. FY2022 by comparison was a 52-week fiscal year. 1
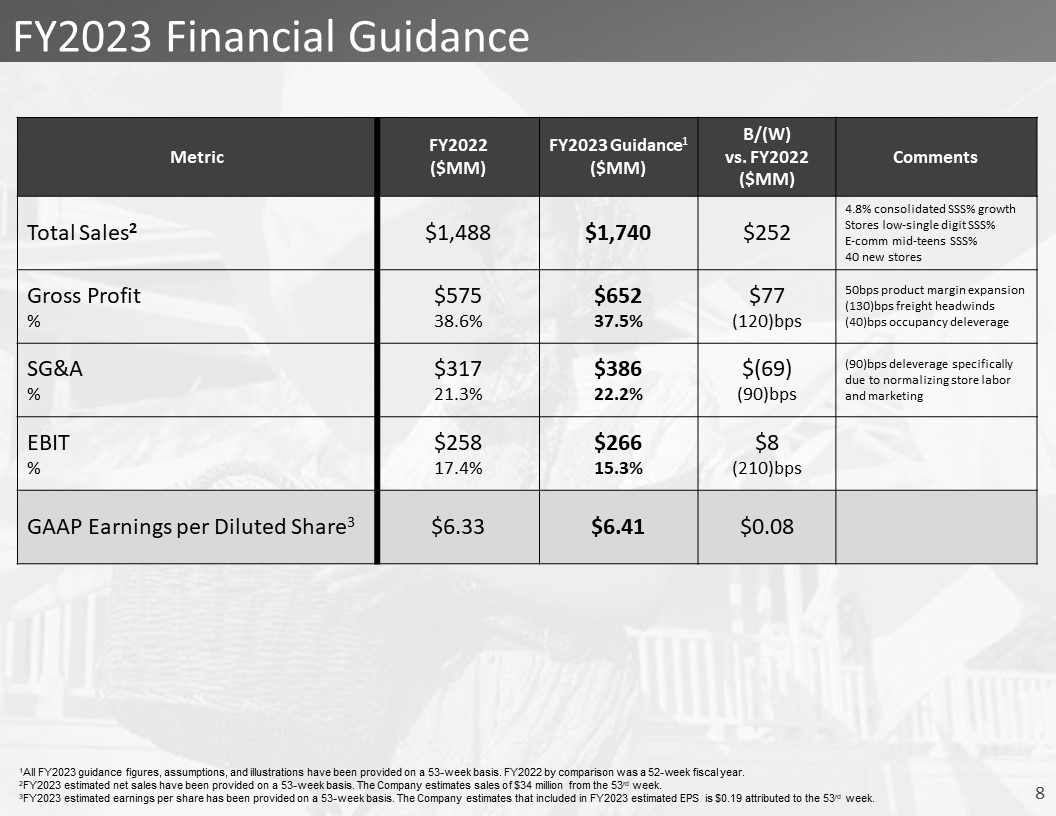
FY2023 Financial Guidance Metric FY2022($MM) FY2023 Guidance1 ($MM) B/(W)vs.
FY2022($MM) Comments Total Sales2 $1,488 $1,740 $252 4.8% consolidated SSS% growthStores low-single digit SSS%E-comm mid-teens SSS%40 new stores Gross Profit% $57538.6% $65237.5% $77(120)bps 50bps product margin expansion(130)bps
freight headwinds(40)bps occupancy deleverage SG&A% $31721.3% $38622.2% $(69)(90)bps (90)bps deleverage specifically due to normalizing store labor and marketing EBIT% $25817.4% $26615.3% $8(210)bps GAAP Earnings per Diluted
Share3 $6.33 $6.41 $0.08 1All FY2023 guidance figures, assumptions, and illustrations have been provided on a 53-week basis. FY2022 by comparison was a 52-week fiscal year.2FY2023 estimated net sales have been provided on a 53-week
basis. The Company estimates sales of $34 million from the 53rd week. 3FY2023 estimated earnings per share has been provided on a 53-week basis. The Company estimates that included in FY2023 estimated EPS is $0.19 attributed to the 53rd week.
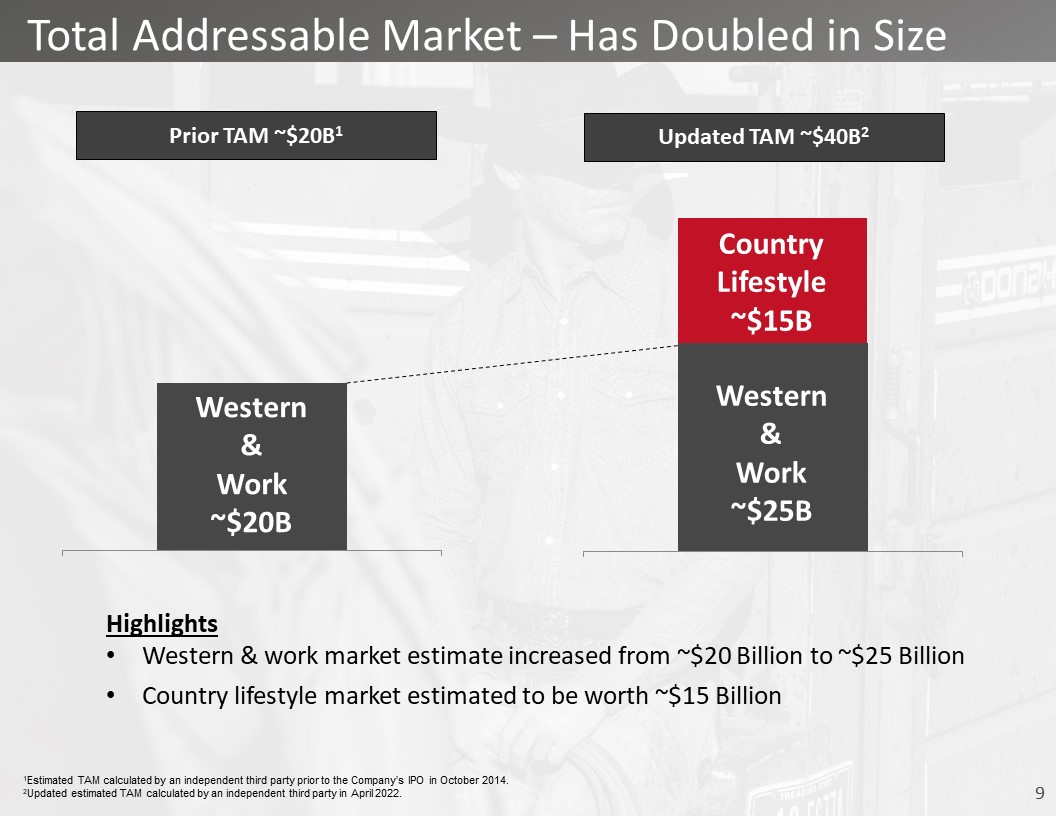
Total Addressable Market – Has Doubled in Size Prior TAM ~$20B1 Updated TAM
~$40B2 CountryLifestyle~$15B Western&Work~$20B HighlightsWestern & work market estimate increased from ~$20 Billion to ~$25 BillionCountry lifestyle market estimated to be worth ~$15 Billion Western&Work~$25B 1Estimated TAM
calculated by an independent third party prior to the Company’s IPO in October 2014. 2Updated estimated TAM calculated by an independent third party in April 2022. .
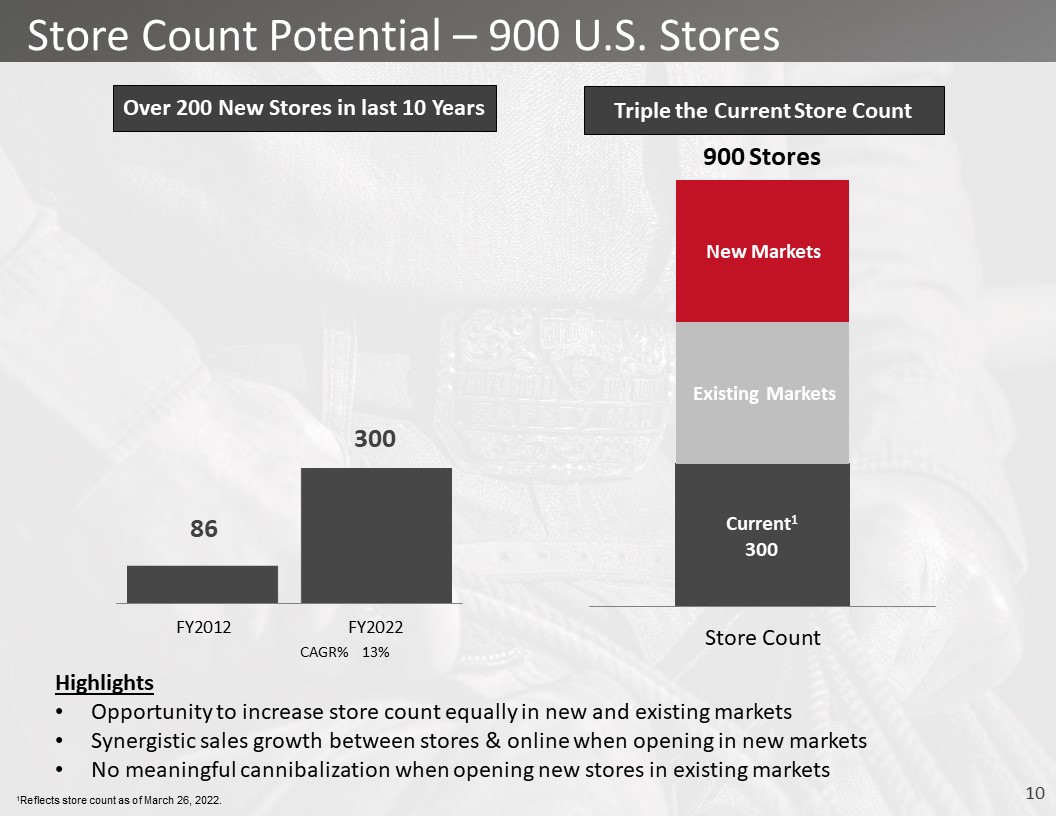
HighlightsOpportunity to increase store count equally in new and existing marketsSynergistic sales
growth between stores & online when opening in new marketsNo meaningful cannibalization when opening new stores in existing markets Store Count Potential – 900 U.S. Stores Over 200 New Stores in last 10 Years Triple the Current Store
Count CAGR% 13% Existing Markets New Markets 900 Stores 1Reflects store count as of March 26, 2022.
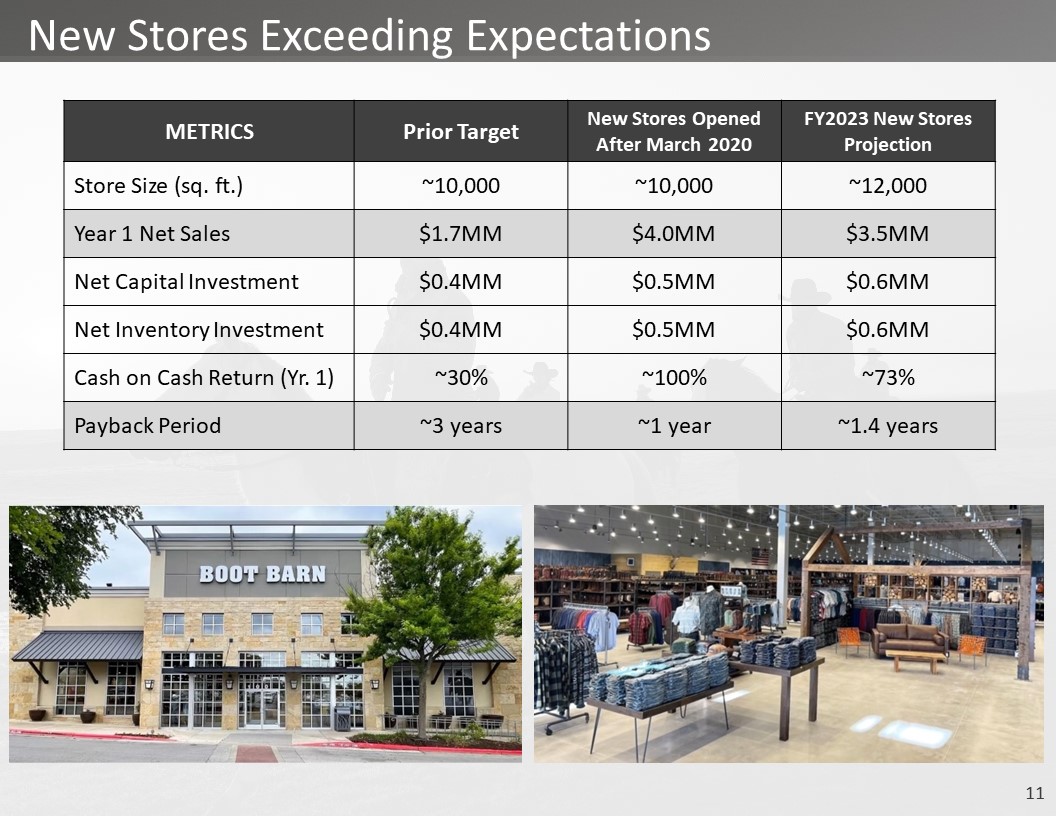
New Stores Exceeding Expectations METRICS Prior Target New Stores Opened After March 2020 FY2023
New Stores Projection Store Size (sq. ft.) ~10,000 ~10,000 ~12,000 Year 1 Net Sales $1.7MM $4.0MM $3.5MM Net Capital Investment $0.4MM $0.5MM $0.6MM Net Inventory Investment $0.4MM $0.5MM $0.6MM Cash on Cash Return (Yr.
1) ~30% ~100% ~73% Payback Period ~3 years ~1 year ~1.4 years
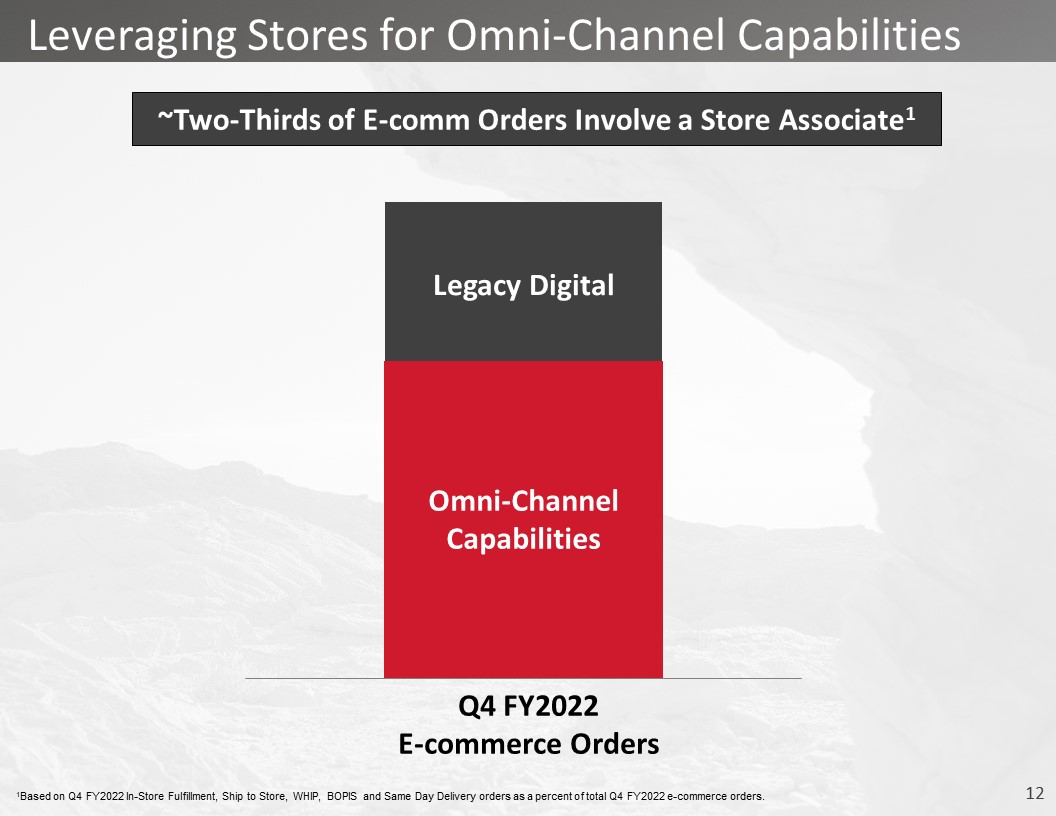
Leveraging Stores for Omni-Channel Capabilities ~Two-Thirds of E-comm Orders Involve a Store
Associate1 1Based on Q4 FY2022 In-Store Fulfillment, Ship to Store, WHIP, BOPIS and Same Day Delivery orders as a percent of total Q4 FY2022 e-commerce orders. Omni-ChannelCapabilities Legacy Digital Q4 FY2022E-commerce Orders
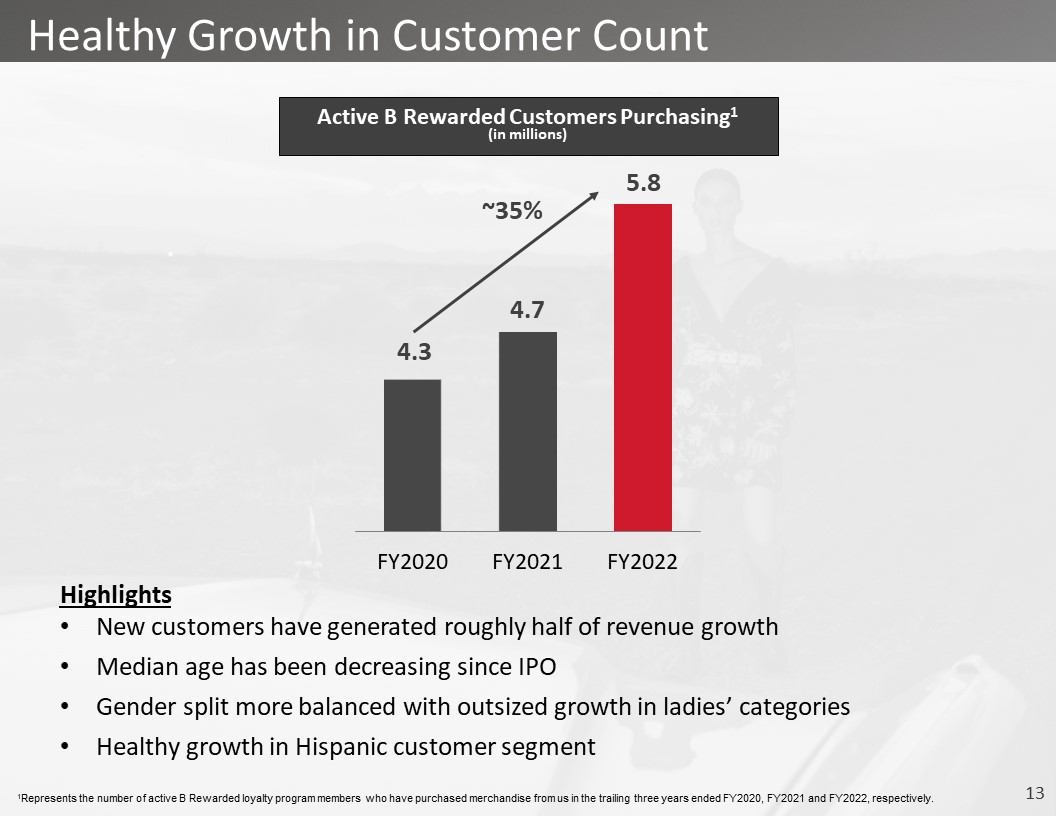
Healthy Growth in Customer Count Active B Rewarded Customers Purchasing1(in millions) HighlightsNew
customers have generated roughly half of revenue growthMedian age has been decreasing since IPOGender split more balanced with outsized growth in ladies’ categoriesHealthy growth in Hispanic customer segment 1Represents the number of active
B Rewarded loyalty program members who have purchased merchandise from us in the trailing three years ended FY2020, FY2021 and FY2022, respectively.
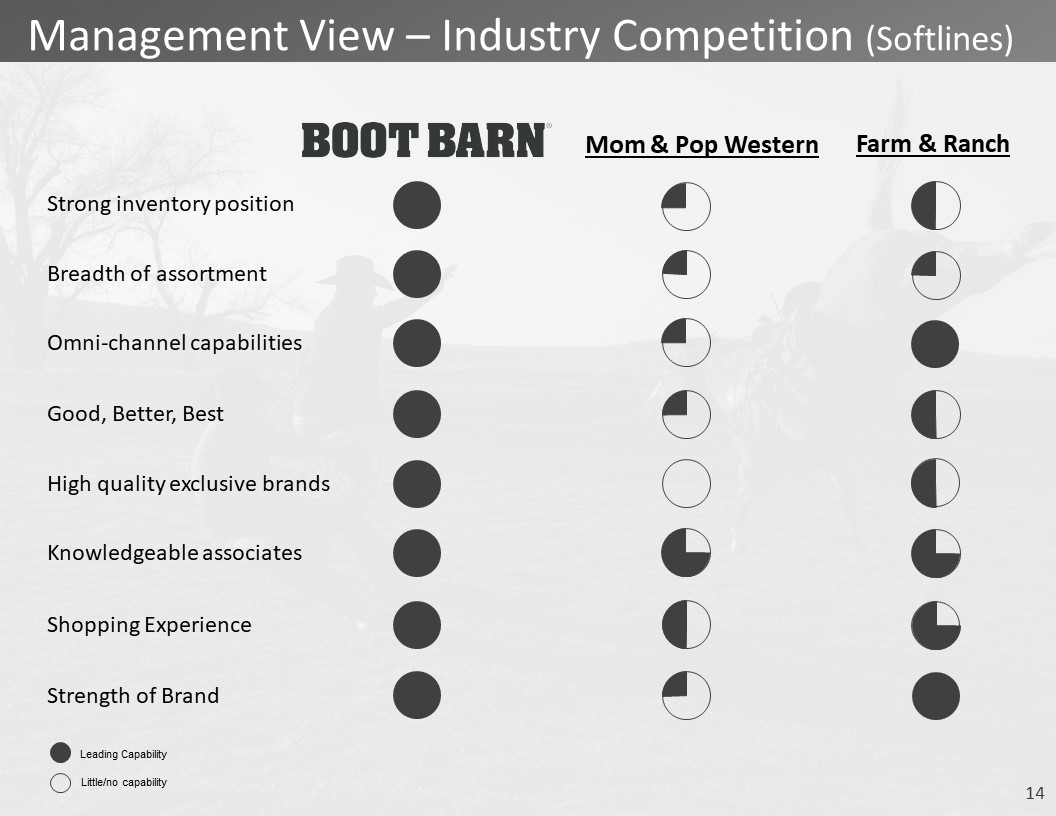
Management View – Industry Competition (Softlines) Strong inventory position Mom & Pop
Western Breadth of assortment Omni-channel capabilities Good, Better, Best High quality exclusive brands Knowledgeable associates Farm & Ranch Shopping
Experience Strength of Brand Leading Capability Little/no capability
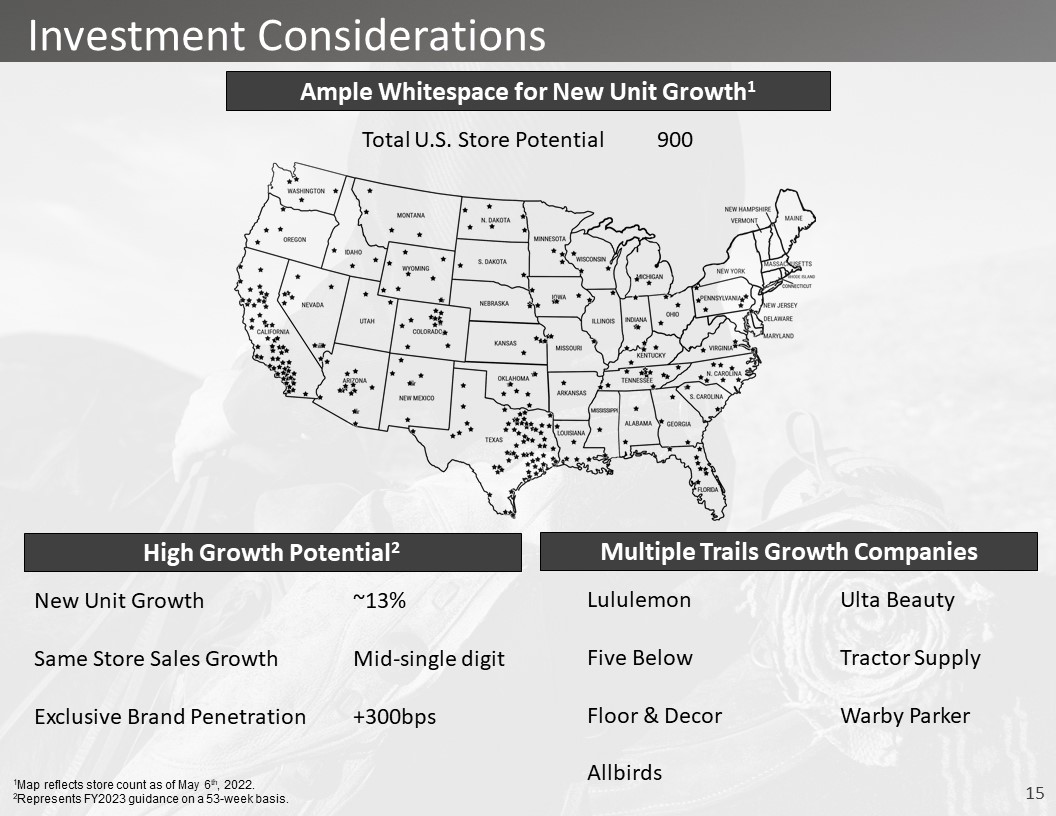
Investment Considerations Ample Whitespace for New Unit Growth1 Multiple Trails Growth
Companies LululemonFive BelowFloor & DecorAllbirds Ulta BeautyTractor SupplyWarby Parker High Growth Potential2 New Unit GrowthSame Store Sales GrowthExclusive Brand Penetration ~13%Mid-single digit+300bps 1Map reflects store count
as of May 6th, 2022. 2Represents FY2023 guidance on a 53-week basis. Total U.S. Store Potential 900
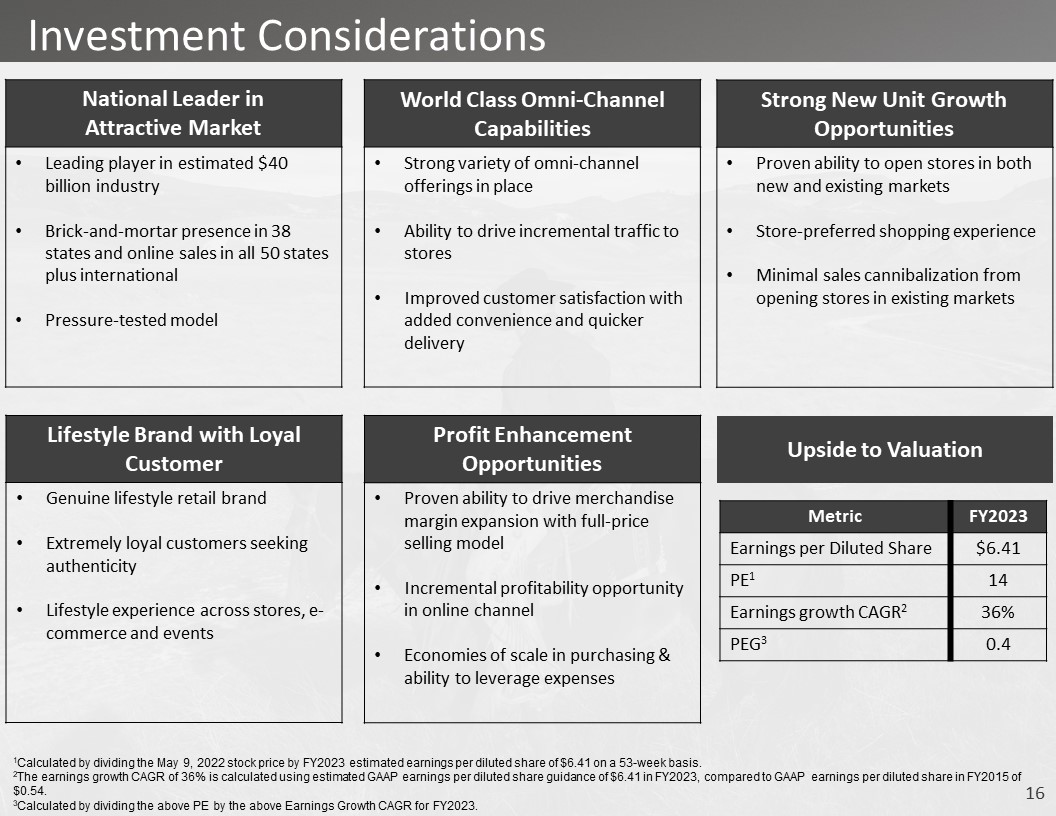
Upside to Valuation Metric FY2023 Earnings per Diluted Share $6.41 PE1 14 Earnings growth
CAGR2 36% PEG3 0.4 1Calculated by dividing the May 9, 2022 stock price by FY2023 estimated earnings per diluted share of $6.41 on a 53-week basis. 2The earnings growth CAGR of 36% is calculated using estimated GAAP earnings per diluted
share guidance of $6.41 in FY2023, compared to GAAP earnings per diluted share in FY2015 of $0.54.3Calculated by dividing the above PE by the above Earnings Growth CAGR for FY2023. National Leader in Attractive Market Leading player in
estimated $40 billion industryBrick-and-mortar presence in 38 states and online sales in all 50 states plus internationalPressure-tested model World Class Omni-Channel Capabilities Strong variety of omni-channel offerings in placeAbility
to drive incremental traffic to storesImproved customer satisfaction with added convenience and quicker delivery Strong New Unit Growth Opportunities Proven ability to open stores in both new and existing marketsStore-preferred shopping
experienceMinimal sales cannibalization from opening stores in existing markets Lifestyle Brand with Loyal Customer Genuine lifestyle retail brandExtremely loyal customers seeking authenticityLifestyle experience across stores, e-commerce
and events Profit Enhancement Opportunities Proven ability to drive merchandise margin expansion with full-price selling modelIncremental profitability opportunity in online channelEconomies of scale in purchasing & ability to leverage
expenses Investment Considerations

investor.bootbarn.com