
UNITED STATES
SECURITIES AND EXCHANGE COMMISSION
 Washington, D.C. 20549
 
 
FORM 8-K
 
CURRENT REPORT
 
Pursuant to Section 13 or 15(d) of the Securities Exchange Act of 1934
 
 
Date of Report (Date of earliest event reported): July 27, 2022
 
 
Boot Barn Holdings, Inc.
(Exact name of registrant as specified in its charter)
 
Delaware
 
001-36711
 
90-0776290
(State or other jurisdiction
of incorporation)
 
(Commission
File Number)
 
(I.R.S. Employer
Identification No.)
 
 
15345 Barranca Parkway, Irvine, California
 
92618
(Address of principal executive offices)
 
(Zip Code)
 
 
(949) 453-4400
(Registrant’s telephone number, including area code)

Not applicable
(Former name or former address, if changed since last report)

Check the appropriate box below if the Form 8-K filing is intended to simultaneously satisfy the filing obligation of the registrant under any of the following provisions:


Written communications pursuant to Rule 425 under the Securities Act (17 CFR 230.425)


Soliciting material pursuant to Rule 14a-12 under the Exchange Act (17 CFR 240.14a-12)


Pre-commencement communications pursuant to Rule 14d-2(b) under the Exchange Act (17 CFR 240.14d-2(b))


Pre-commencement communications pursuant to Rule 13e-4(c) under the Exchange Act (17 CFR 240.13e-4(c))

Indicate by check mark whether the registrant is an emerging growth company as defined in Rule 405 of the Securities Act of 1933 (§230.405 of this chapter) or Rule 12b-2 of the Securities Exchange Act of 1934 (§240.12b-2 of this chapter).
 
  Emerging growth company
 
☐ If an emerging growth company, indicate by check mark if the registrant has elected not to use the extended transition period for complying with any new or revised financial accounting standards provided pursuant to section 13(a) of the Exchange Act.

Securities registered pursuant to Section 12(b) of the Act:

Title of each class
Trading Symbol
Name of each exchange on which registered
Common Stock, $0.0001 par value
BOOT
The New York Stock Exchange


Item 2.02     Results of Operations and Financial Condition
 
On July 27, 2022, Boot Barn Holdings, Inc. issued a press release announcing certain financial results for its fiscal first quarter ended June 25, 2022. The press release is attached hereto as Exhibit 99.1.

The information provided in this Item 2.02, including Exhibit 99.1, is intended to be “furnished” and shall not be deemed “filed” for purposes of Section 18 of the Securities Exchange Act of 1934, as amended (the “Exchange Act”), or otherwise subject to the liabilities of that section, nor shall it be deemed incorporated by reference into any other filing under the Securities Act of 1933, as amended, or the Exchange Act, except as expressly set forth by specific reference in such a filing.

Item 7.01     Regulation FD Disclosure.
 
Boot Barn Holdings, Inc. (the “Company”) is furnishing this Current Report on Form 8-K in connection with the disclosure of information contained in a supplemental financial presentation (the “Presentation”) to be used by the Company at various meetings with institutional investors and analysts. This information may be amended or updated at any time and from time to time through another Current Report on Form 8-K or other means. A copy of the Presentation is furnished herewith as Exhibit 99.2 and is incorporated into this Item 7.01 by reference.
 
The information furnished in this Item 7.01, including Exhibits 99.1 and 99.2, is being furnished and shall not be deemed to be “filed” for the purposes of Section 18 of the Securities Exchange Act of 1934, as amended, or otherwise subject to the liabilities of that section, nor shall it be deemed to be incorporated by reference into any registration statement filed pursuant to the Securities Act of 1933, as amended, except as may be expressly set forth by specific reference in such filing.
 
The Company expressly disclaims any obligation to update or revise any of the information contained in the Presentation.
 
The Presentation is available on the Company’s investor relations website located at investor.bootbarn.com, although the Company reserves the right to discontinue that availability at any time.

Item 9.01.     Financial Statements and Exhibits.

Exhibit 104
The cover page of this Current Report on Form 8-K, formatted in Inline XBRL.


SIGNATURES
 
Pursuant to the requirements of the Securities Exchange Act of 1934, the registrant has duly caused this report to be signed on its behalf by the undersigned hereunto duly authorized.
 
 
BOOT BARN HOLDINGS, INC.
   
Date:  July 27, 2022
By:
/s/ James M. Watkins
   
Name: James M. Watkins
   
Title: Chief Financial Officer and Secretary
(Principal Financial Officer and Principal
Accounting Officer)


Exhibit 99.1

Boot Barn Holdings, Inc. Announces First Quarter Fiscal Year 2023 Financial Results

IRVINE, Calif.--(BUSINESS WIRE)--July 27, 2022--Boot Barn Holdings, Inc. (NYSE: BOOT) today announced its financial results for the first fiscal quarter ended June 25, 2022. The Company has also filed a Supplemental Financial Presentation that has been made available at investor.bootbarn.com.

For the quarter ended June 25, 2022:

  • Net sales increased 19.4% over the prior-year period to $365.9 million.
  • Same store sales increased 10.0% compared to the prior-year period, comprised of an increase in retail store same store sales of 10.1% and an increase in e-commerce same store sales of 9.3%.
  • Net income was $39.3 million, or $1.29 per diluted share, compared to $40.6 million, or $1.35 per diluted share in the prior-year period. Net income per diluted share in the current-year and prior-year periods includes an approximately $0.03 and $0.09 per share benefit, respectively, primarily due to income tax accounting for share-based compensation. Excluding the tax benefits, net income per diluted share in both periods was $1.26.
  • The Company opened 11 new stores bringing its total count to 311.

“Our first quarter performance represents a strong start to the new year,” said Jim Conroy, President and Chief Executive Officer. “Following the tremendous growth and profitability we achieved in fiscal 2022, we are very pleased to report another quarter of double-digit same store sales growth and earnings per share that were ahead of our expectations. Our merchandise and marketing strategies combined with our expanding omni-channel capabilities continue to fuel strong full-price selling in stores and online. Our new stores are proving to be highly productive and we feel great about our real estate pipeline. We believe the addition of these new stores will help us to further gain share in the combined $40 billion western, work and country lifestyle markets. Given the current tone of the business, we continue to expect total sales to grow double digits versus last year driven by new store openings with same store sales flat to growing low single digits.”

Operating Results for the First Quarter Ended June 25, 2022 Compared to the First Quarter Ended June 26, 2021

  • Net sales increased 19.4% to $365.9 million from $306.3 million in the prior-year period. Consolidated same store sales increased 10.0% with retail store same store sales up 10.1% and e-commerce same store sales up 9.3%. The increase in net sales was the result of the increase in consolidated same store sales and the incremental sales from new stores opened over the past twelve months.
  • Gross profit was $137.8 million, or 37.7% of net sales, compared to $116.4 million, or 38.0% of net sales, in the prior-year period. Gross profit increased primarily due to increased sales. The decrease in gross profit rate of 30 basis points was driven by 70 basis points of deleverage in buying, occupancy and distribution center costs, partially offset by a 40 basis-point increase in merchandise margin. Merchandise margin increased 40 basis points despite a 70 basis-point headwind from increased freight charges. The merchandise margin expansion was primarily a result of growth in exclusive brand penetration and better full-price selling.

  • Selling, general and administrative expenses were $85.4 million, or 23.3% of net sales, compared to $62.8 million, or 20.5% of net sales, in the prior-year period. The increase in selling, general and administrative expenses was primarily a result of higher store payroll and overhead, in addition to increased marketing expenses in the current-year period compared to the prior-year period. Selling, general and administrative expenses as a percentage of net sales increased by 280 basis points primarily as a result of higher store labor and marketing expense as a percentage of sales.
  • Income from operations decreased $1.2 million to $52.4 million, or 14.3% of net sales, compared to $53.6 million, or 17.5% of net sales, in the prior-year period, primarily due to higher selling, general and administrative expenses.
  • Net income was $39.3 million, or $1.29 per diluted share, compared to net income of $40.6 million, or $1.35 per diluted share in the prior-year period. Net income per diluted share in the current-year and prior-year periods includes an approximately $0.03 and $0.09 per share benefit, respectively, primarily due to income tax accounting for share-based compensation. Excluding the tax benefits, net income per diluted share was $1.26 in both the current-year and prior-year periods.

Current Business

The following table includes same store sales and total net sales growth for the periods indicated below:


  Four Weeks
Fiscal April

  Four Weeks
Fiscal May

  Five Weeks
Fiscal June

  Thirteen
Weeks Ended
June 25, 2022
 

  Preliminary
Four Weeks
Fiscal July


Retail Stores SSS
 

8.1

%


14.8

%


8.1

%


10.1

%


1.5

%


E-commerce SSS
 

13.1

%


8.5

%


6.4

%


9.3

%


(4.3)

%


Total SSS
 

8.8

%


13.9

%


7.9

%


10.0

%


0.6

%


Total Net Sales Growth
 

18.3

%


22.8

%


17.7

%


19.4

%


10.1

%


Balance Sheet Highlights as of June 25, 2022

  • Cash of $16.0 million.
  • $74.9 million drawn under our revolving credit facility, which was expanded earlier this month by $70 million to a capacity of $250 million and extended to July 2027.

Fiscal Year 2023 Outlook

In light of recent macroeconomic uncertainty, the Company is providing updated guidance for the fiscal year ending April 1, 2023, superseding in its entirety the previous guidance issued in its fourth quarter and fiscal year 2022 earnings report on May 10, 2022. As a result, for the fiscal year ending April 1, 2023, the Company now expects:

  • To open 40 new stores.
  • Total sales of $1.68 billion to $1.70 billion, representing growth of 12.9% to 14.2% over the prior year.
  • Same store sales range of approximately flat to 2.0%.
  • Income from operations between $247 million and $255 million. This represents approximately 14.7% to 15.0% of sales.
  • Interest expense of $4 million.
  • Effective tax rate of 25.2% for the remaining nine months of the year.
  • Net income of $182.7 million to $188.6 million.
  • Net income per diluted share of $6.00 to $6.20 based on 30.5 million weighted average diluted shares outstanding.
  • Capital expenditures between $80 million and $87 million.
  • Fiscal year 2023 is a 53-week year and the Company expects to generate approximately $34 million of sales and earn approximately $0.19 per diluted share in the 53rd week, which is included in the above guidance range.

For the fiscal second quarter ending September 24, 2022, the Company expects:

  • Total sales of $339 million to $346 million, with same store sales of approximately flat.
  • Net income per diluted share of $0.87 to $0.93 based on 30.4 million weighted average diluted shares outstanding.

Conference Call Information

A conference call to discuss the financial results for the first quarter of fiscal year 2023 is scheduled for today, July 27, 2022, at 4:30 p.m. ET (1:30 p.m. PT). Investors and analysts interested in participating in the call are invited to dial (877) 451-6152. The conference call will also be available to interested parties through a live webcast at investor.bootbarn.com. Please visit the website and select the “Events and Presentations” link at least 15 minutes prior to the start of the call to register and download any necessary software. A Supplemental Financial Presentation is also available on the investor relations section of the Company’s website. A telephone replay of the call will be available until August 27, 2022, by dialing (844) 512-2921 (domestic) or (412) 317-6671 (international) and entering the conference identification number: 13731781. Please note participants must enter the conference identification number in order to access the replay.


About Boot Barn

Boot Barn is the nation’s leading lifestyle retailer of western and work-related footwear, apparel and accessories for men, women and children. The Company offers its loyal customer base a wide selection of work and lifestyle brands. As of the date of this release, Boot Barn operates 313 stores in 39 states, in addition to an e-commerce channel www.bootbarn.com. The Company also operates www.sheplers.com, the nation’s leading pure play online western and work retailer and www.countryoutfitter.com, an e-commerce site selling to customers who live a country lifestyle. For more information, call 888-Boot-Barn or visit www.bootbarn.com.

Forward Looking Statements

This press release contains forward-looking statements that are subject to risks and uncertainties. All statements other than statements of historical fact included in this press release are forward-looking statements. Forward-looking statements refer to our current expectations and projections relating to, by way of example and without limitation, our financial condition, liquidity, profitability, results of operations, margins, plans, objectives, strategies, future performance, business and industry. You can identify forward-looking statements by the fact that they do not relate strictly to historical or current facts. These statements may include words such as "anticipate", "estimate", "expect", "project", "plan“, "intend", "believe", “may”, “might”, “will”, “could”, “should”, “can have”, “likely”, “outlook” and other words and terms of similar meaning in connection with any discussion of the timing or nature of future operating or financial performance or other events, but not all forward-looking statements contain these identifying words. These forward-looking statements are based on assumptions that the Company’s management has made in light of their industry experience and on their perceptions of historical trends, current conditions, expected future developments and other factors they believe are appropriate under the circumstances. As you consider this press release, you should understand that these statements are not guarantees of performance or results. They involve risks, uncertainties (some of which are beyond the Company’s control) and assumptions. These risks, uncertainties and assumptions include, but are not limited to, the following: the effect of COVID-19 on our business operations, growth strategies, store traffic, employee availability, financial condition, liquidity and cash flow; decreases in consumer spending due to declines in consumer confidence, local economic conditions or changes in consumer preferences; the Company’s ability to effectively execute on its growth strategy; and the Company’s failure to maintain and enhance its strong brand image, to compete effectively, to maintain good relationships with its key suppliers, and to improve and expand its exclusive product offerings. The Company discusses the foregoing risks and other risks in greater detail under the heading “Risk factors” in the periodic reports filed by the Company with the Securities and Exchange Commission. Although the Company believes that these forward-looking statements are based on reasonable assumptions, you should be aware that many factors could affect the Company’s actual financial results and cause them to differ materially from those anticipated in the forward-looking statements. Because of these factors, the Company cautions that you should not place undue reliance on any of these forward-looking statements. New risks and uncertainties arise from time to time, and it is impossible for the Company to predict those events or how they may affect the Company. Further, any forward-looking statement speaks only as of the date on which it is made. Except as required by law, the Company does not intend to update or revise the forward-looking statements in this press release after the date of this press release.


Boot Barn Holdings, Inc.

Consolidated Balance Sheets

(In thousands, except per share data)

(Unaudited)


June 25,
March 26,


2022


2022

Assets


Current assets:


Cash and cash equivalents
$

16,014


$

20,674


Accounts receivable, net

9,240


9,662


Inventories

534,380


474,300


Prepaid expenses and other current assets

57,781


37,195


Total current assets

617,415


541,831


Property and equipment, net

177,447


155,247


Right-of-use assets, net

264,569


241,147


Goodwill

197,502


197,502


Intangible assets, net

60,797


60,813


Other assets

3,488


3,315


Total assets
$

1,321,218


$

1,199,855


Liabilities and stockholders’ equity


Current liabilities:


Line of credit
$

74,873


$

28,549


Accounts payable

151,638


131,394


Accrued expenses and other current liabilities

119,229


133,408


Short-term lease liabilities

45,116


43,117


Total current liabilities

390,856


336,468


Deferred taxes

28,470


26,895


Long-term lease liabilities

259,976


234,584


Other liabilities

2,382


2,232


Total liabilities

681,684


600,179


Stockholders’ equity:


Common stock, $0.0001 par value; June 25, 2022 - 100,000 shares authorized, 29,995 shares issued; March 26, 2022 - 100,000 shares authorized, 29,820 shares issued

3


3


Preferred stock, $0.0001 par value; 10,000 shares authorized, no shares issued or outstanding


Additional paid-in capital

204,002


199,054


Retained earnings

444,795


405,477


Less: Common stock held in treasury, at cost, 188 and 135 shares at June 25, 2022 and March 26, 2022, respectively

(9,266

)


(4,858

)

Total stockholders’ equity

639,534


599,676


Total liabilities and stockholders’ equity
$

1,321,218


$

1,199,855


Boot Barn Holdings, Inc.

Consolidated Statements of Operations

(In thousands, except per share data)

(Unaudited)


Thirteen Weeks Ended


June 25,


June 26,


2022


2021


Net sales
$

365,856


$

306,327


Cost of goods sold

228,026


189,900


Gross profit

137,830


116,427


Selling, general and administrative expenses

85,405


62,784


Income from operations

52,425


53,643


Interest expense

725


2,563


Other (loss)/income, net

(273

)


104


Income before income taxes

51,427


51,184


Income tax expense

12,109


10,539


Net income
$

39,318


$

40,645


Earnings per share:


Basic
$

1.32


$

1.38


Diluted
$

1.29


$

1.35


Weighted average shares outstanding:


Basic

29,747


29,361


Diluted

30,386


30,213


Boot Barn Holdings, Inc.

Consolidated Statements of Cash Flows

(In thousands)

(Unaudited)


Thirteen Weeks Ended


June 25,
June 26,


2022


2021

Cash flows from operating activities


Net income
$

39,318


$

40,645


Adjustments to reconcile net income to net cash (used in)/provided by operating activities:


Depreciation

8,022


6,152


Stock-based compensation

4,701


3,201


Amortization of intangible assets

16


18


Noncash lease expense

11,119


9,221


Amortization and write-off of debt issuance fees and debt discount

44


1,064


Loss/(gain) on disposal of assets

177


(4

)

Gain on adjustment of right-of-use assets and lease liabilities


(33

)

Deferred taxes

1,575


(5,891

)

Changes in operating assets and liabilities:


Accounts receivable, net

600


4,912


Inventories

(60,080

)


(21,002

)

Prepaid expenses and other current assets

(20,630

)


(7,309

)

Other assets

(173

)


(457

)

Accounts payable

18,024


5,252


Accrued expenses and other current liabilities

(21,523

)


19,071


Other liabilities

150


568


Operating leases

(7,108

)


(9,080

)

Net cash (used in)/provided by operating activities
$

(25,768

)


$

46,328


Cash flows from investing activities


Purchases of property and equipment
$

(20,835

)


$

(9,294

)

Net cash used in investing activities
$

(20,835

)


$

(9,294

)

Cash flows from financing activities


Borrowings on line of credit - net
$

46,324


$


Repayments on debt and finance lease obligations

(220

)


(61,682

)

Tax withholding payments for net share settlement

(4,408

)


(2,476

)

Proceeds from the exercise of stock options

247


3,616


Net cash provided by/(used in) financing activities
$

41,943


$

(60,542

)


Net decrease in cash and cash equivalents

(4,660

)


(23,508

)

Cash and cash equivalents, beginning of period

20,674


73,148


Cash and cash equivalents, end of period
$

16,014


$

49,640


Supplemental disclosures of cash flow information:


Cash paid for income taxes
$

19,226


$


Cash paid for interest
$

534


$

1,496


Supplemental disclosure of non-cash activities:


Unpaid purchases of property and equipment
$

17,473


$

4,130


Boot Barn Holdings, Inc.

Store Count


Quarter Ended


Quarter Ended


Quarter Ended


Quarter Ended


Quarter Ended


Quarter Ended


Quarter Ended


Quarter Ended


June 25,


March 26,


December 25,


September 25,


June 26,


March 27,


December 26,


September 26,


2022


2022


2021


2021


2021


2021


2020


2020

Store Count (BOP)

300


289


278


276


273


266


265


264

Opened/Acquired

11


11


11


3


3


8


1


1

Closed


(1)


(1)


Store Count (EOP)

311


300


289


278


276


273


266


265

Boot Barn Holdings, Inc.

Selected Store Data


Thirteen Weeks Ended


June 25,


March 26,


December 25,


September 25,


June 26,


March 27,


December 26,


September 26,


2022


2022


2021


2021


2021


2021


2020


2020


Selected Store Data:


Same Store Sales growth/(decline)

10.0

%


33.3

%


54.2

%


61.7

%


78.9

%


26.9

%


4.6

%


(5.1

)%


Stores operating at end of period

311


300


289


278


276


273


266


265


Total retail store square footage, end of period (in thousands)

3,333


3,194


3,063


2,940


2,915


2,854


2,787


2,779


Average store square footage, end of period

10,717


10,648


10,597


10,575


10,563


10,455


10,477


10,486


Average net sales per store (in thousands)
$

1,031


$

1,094


$

1,372


$

965


$

942


$

792


$

889


$

565


Contacts

Investor Contact:
ICR, Inc.
Brendon Frey, 203-682-8216
[email protected]

or

Company Contact:
Boot Barn Holdings, Inc.
Mark Dedovesh
Vice President, Investor Relations & Financial Planning
[email protected]

Exhibit 99.2

 Supplemental Financial Presentation  July 27, 2022 
 

 Important Information  Forward-Looking Statements   This presentation contains forward-looking statements that are subject to risks and uncertainties. All statements other than statements of historical fact included in this presentation are forward-looking statements. You can identify forward-looking statements by the fact that they generally include words such as "anticipate," "estimate," "expect," "project," "plan,“ "intend," "believe," “outlook” and other words of similar meaning in connection with any discussion of the timing or nature of future operating or financial performance or other events but not all forward-looking statements contain these identifying words. These forward-looking statements are based on assumptions that the Company’s management has made in light of their industry experience and on their perceptions of historical trends, current conditions, expected future developments and other factors they believe are appropriate under the circumstances. As you consider this presentation, you should understand that these statements are not guarantees of performance or results. They involve risks, uncertainties (some of which are beyond the Company’s control) and assumptions. These risks, uncertainties and assumptions include, but are not limited to, the following: the effect of COVID-19 on our business operations, growth strategies, store traffic, employee availability, financial condition, liquidity and cash flow; decreases in consumer spending due to declines in consumer confidence, local and national economic conditions, including inflation, or changes in consumer preferences; the Company’s failure to maintain and enhance its strong brand image; the Company’s failure to compete effectively, to maintain good relationships with its key suppliers, and to improve and expand its exclusive product offerings; supply chain disruptions; and the Company’s ability to effectively execute on its growth strategy. The Company discusses the foregoing risks and other risks in greater detail under the heading “Risk factors” in the periodic reports filed by the Company with the Securities and Exchange Commission. Although the Company believes that these forward-looking statements are based on reasonable assumptions, you should be aware that many factors could affect the Company’s actual financial results and cause them to differ materially from those anticipated in the forward-looking statements. Because of these factors, the Company cautions that you should not place undue reliance on any of these forward-looking statements. New risks and uncertainties arise from time to time, and it is impossible for the Company to predict those events or how they may affect the Company. Further, any forward-looking statement speaks only as of the date on which it is made. Except as required by law, the Company does not intend to update or revise the forward-looking statements in this presentation after the date of this presentation.   Industry and Market Information  Statements in this presentation concerning our industry and the markets in which we operate, including our general expectations and competitive position, business opportunity and market size, growth and share, are based on information from independent industry organizations and other third-party sources, data from our internal research and management estimates. Management estimates are derived from publicly available information and the information and data referred to above and are based on assumptions and calculations made by us based upon our interpretation of such information and data. The information and data referred to above are imprecise and may prove to be inaccurate because the information cannot always be verified with complete certainty due to the limitations on the availability and reliability of raw data, the voluntary nature of the data gathering process and other limitations and uncertainties. As a result, please be aware that the data and statistical information in this presentation may differ from information provided by our competitors or from information found in current or future studies conducted by market research institutes, consultancy firms or independent sources.   Recent Developments  Our business and opportunities for growth depend on consumer discretionary spending, and as such, our results are particularly sensitive to economic conditions and consumer confidence. Inflation (which has occurred over the past twelve months and is continuing) and other challenges affecting the global economy could impact our operations and will depend on future developments, which are uncertain. These and other effects make it more challenging for us to estimate the future performance of our business, particularly over the near-to-medium term. For further discussion of the uncertainties and business risks affecting the Company, see Item 1A, Risk Factors, of our Fiscal 2022 10-K.  
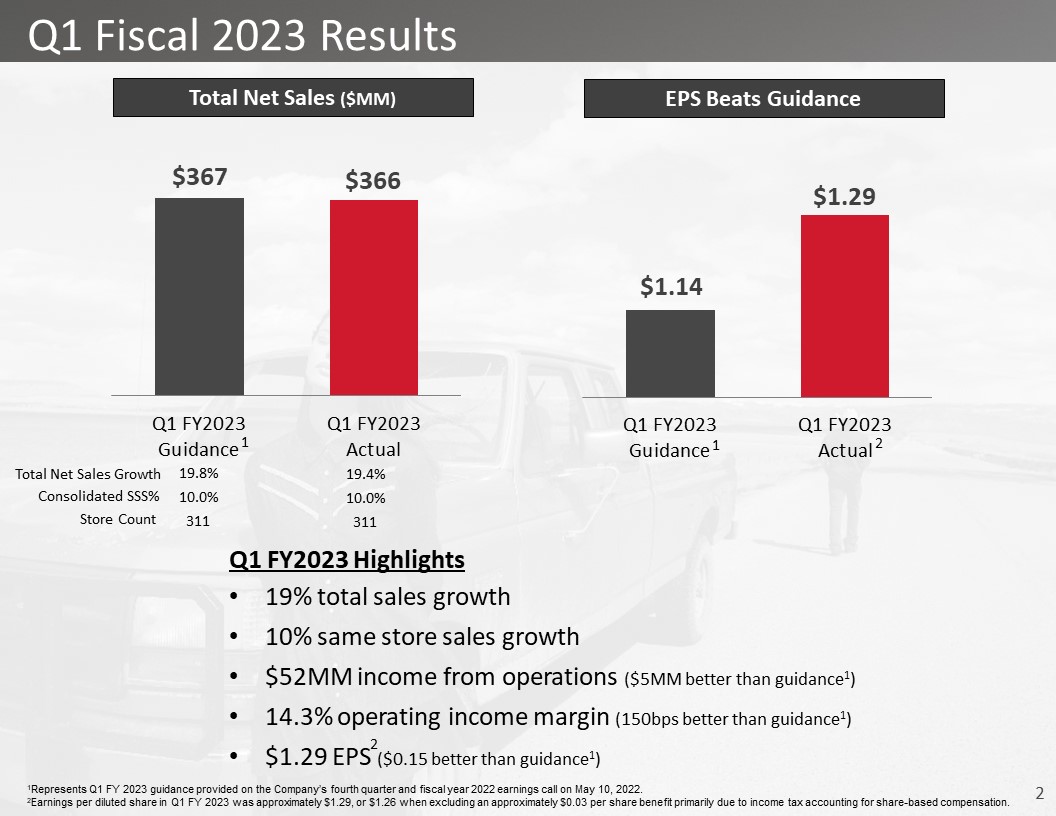
 

 Q1 Fiscal 2023 Results  Total Net Sales ($MM)  EPS Beats Guidance  Consolidated SSS%  10.0%  Q1 FY2023 Highlights  19% total sales growth   10% same store sales growth  $52MM income from operations ($5MM better than guidance1)  14.3% operating income margin (150bps better than guidance1)  $1.29 EPS ($0.15 better than guidance1)  Store Count  311  1Represents Q1 FY 2023 guidance provided on the Company’s fourth quarter and fiscal year 2022 earnings call on May 10, 2022.  2Earnings per diluted share in Q1 FY 2023 was approximately $1.29, or $1.26 when excluding an approximately $0.03 per share benefit primarily due to income tax accounting for share-based compensation.   .   10.0%  311  Total Net Sales Growth  19.4%  19.8%  2  2  1  1 
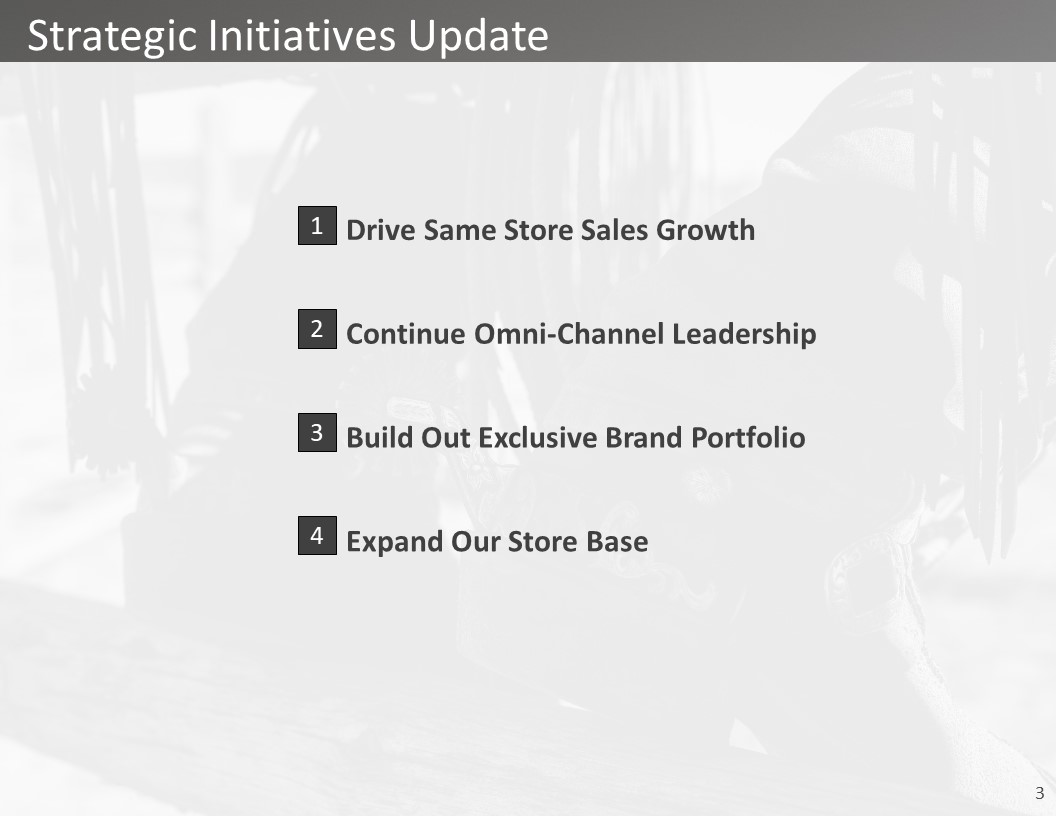
 

 Strategic Initiatives Update  1  2  3  4  Drive Same Store Sales Growth  Continue Omni-Channel Leadership  Build Out Exclusive Brand Portfolio  Expand Our Store Base 
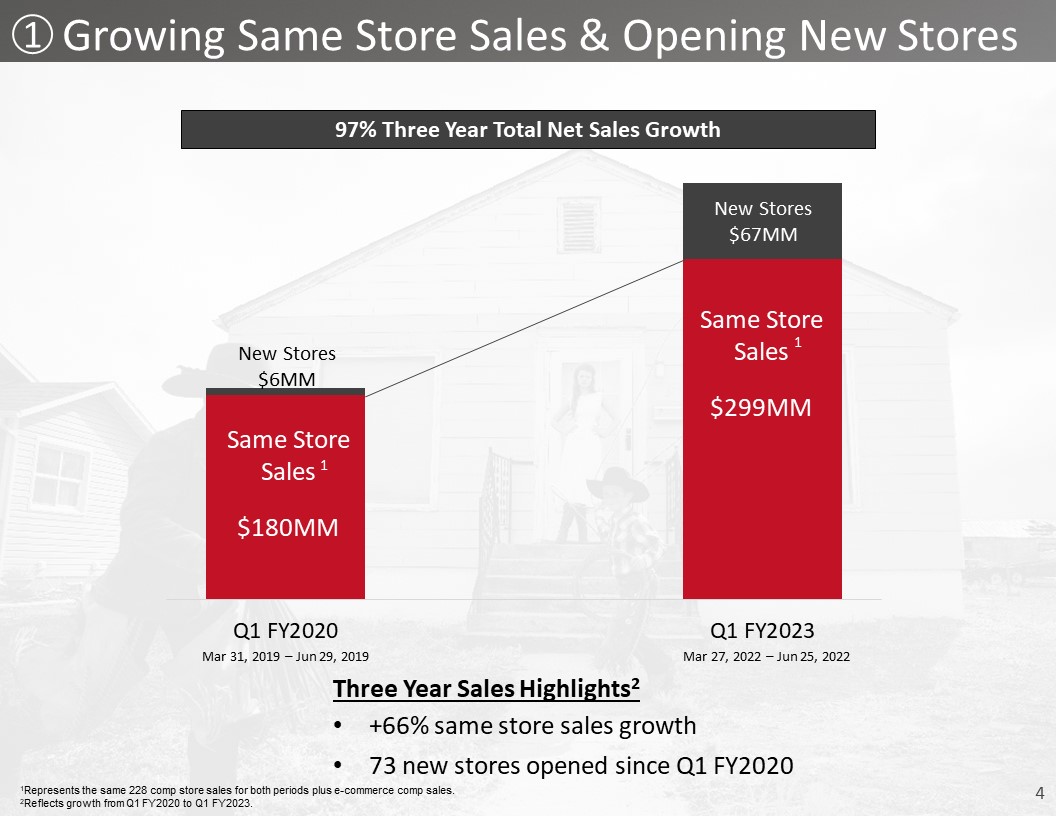
 

 Growing Same Store Sales & Opening New Stores  Same Store Sales  $180MM  New Stores   $6MM  Same Store Sales  $299MM  New Stores  $67MM  97% Three Year Total Net Sales Growth  Three Year Sales Highlights2  +66% same store sales growth  73 new stores opened since Q1 FY2020  1Represents the same 228 comp store sales for both periods plus e-commerce comp sales.  2Reflects growth from Q1 FY2020 to Q1 FY2023.  1  Mar 31, 2019 – Jun 29, 2019  Mar 27, 2022 – Jun 25, 2022  1  1 
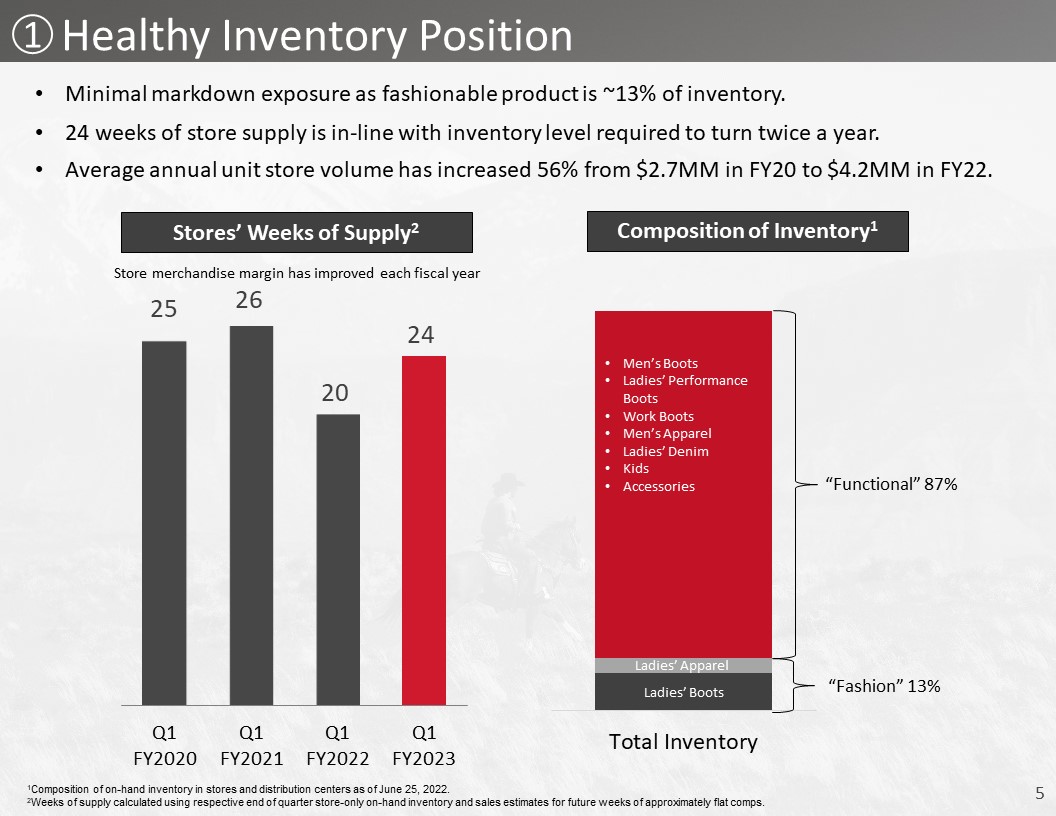
 

 Healthy Inventory Position  Men’s Boots  Ladies’ Performance Boots  Work Boots  Men’s Apparel  Ladies’ Denim  Kids  Accessories  Ladies’ Apparel  Ladies’ Boots  “Fashion” 13%  Composition of Inventory1  Stores’ Weeks of Supply2  “Functional” 87%  Store merchandise margin has improved each fiscal year  1Composition of on-hand inventory in stores and distribution centers as of June 25, 2022.  2Weeks of supply calculated using respective end of quarter store-only on-hand inventory and sales estimates for future weeks of approximately flat comps.  Minimal markdown exposure as fashionable product is ~13% of inventory.  24 weeks of store supply is in-line with inventory level required to turn twice a year.  Average annual unit store volume has increased 56% from $2.7MM in FY20 to $4.2MM in FY22.  1 
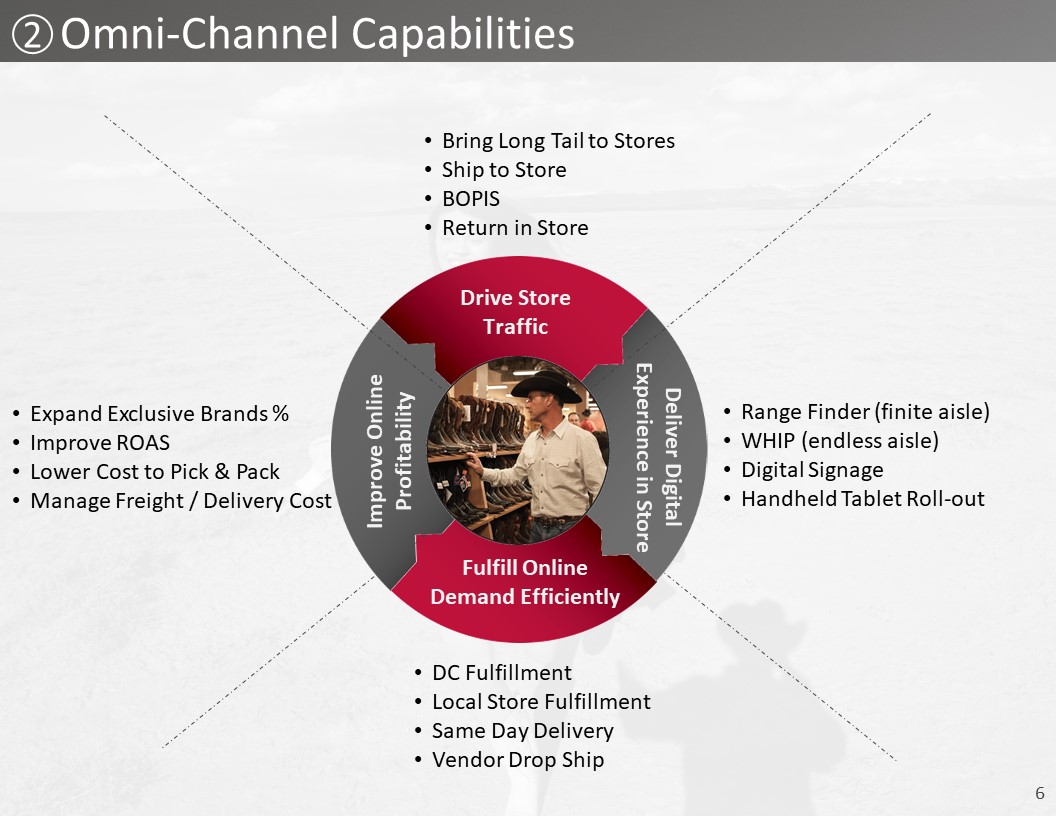
 

 Omni-Channel Capabilities  Fulfill Online Demand Efficiently  Improve Online Profitability  Deliver Digital  Experience in Store  Drive Store  Traffic  Expand Exclusive Brands %  Improve ROAS  Lower Cost to Pick & Pack  Manage Freight / Delivery Cost  Bring Long Tail to Stores  Ship to Store  BOPIS  Return in Store  Range Finder (finite aisle)  WHIP (endless aisle)  Digital Signage  Handheld Tablet Roll-out  DC Fulfillment  Local Store Fulfillment  Same Day Delivery  Vendor Drop Ship  2 
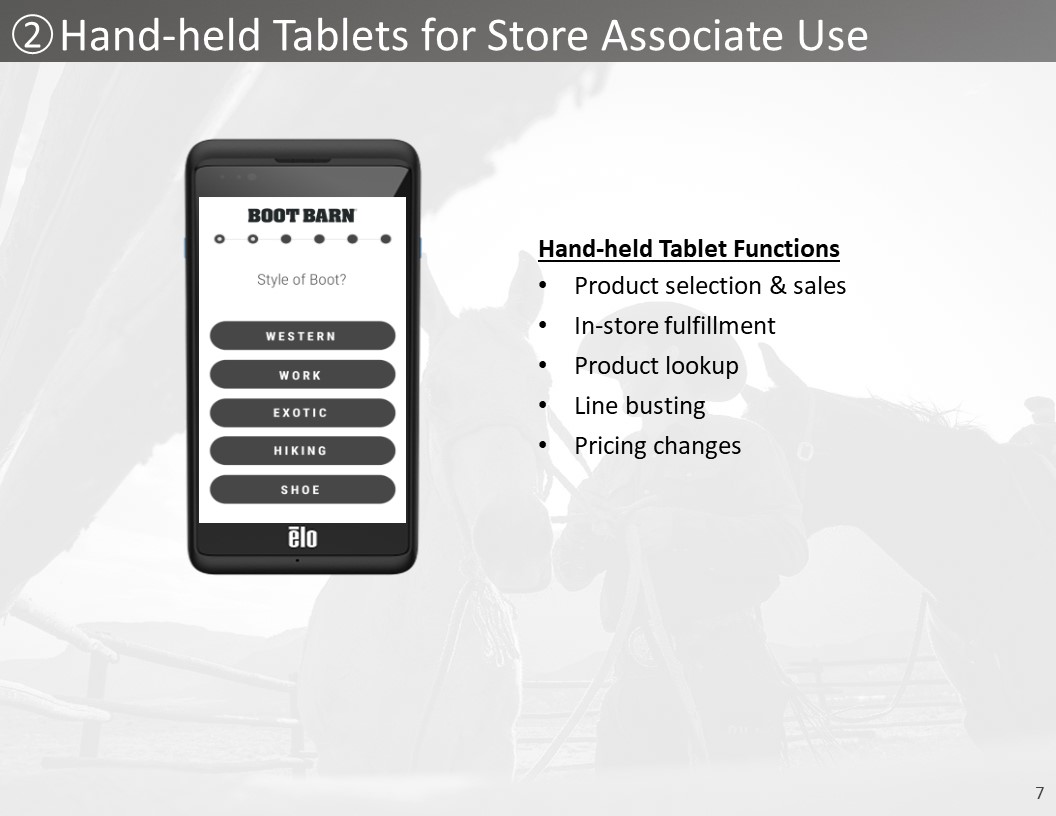
 

 Hand-held Tablets for Store Associate Use  2  Hand-held Tablet Functions  Product selection & sales  In-store fulfillment  Product lookup  Line busting  Pricing changes 
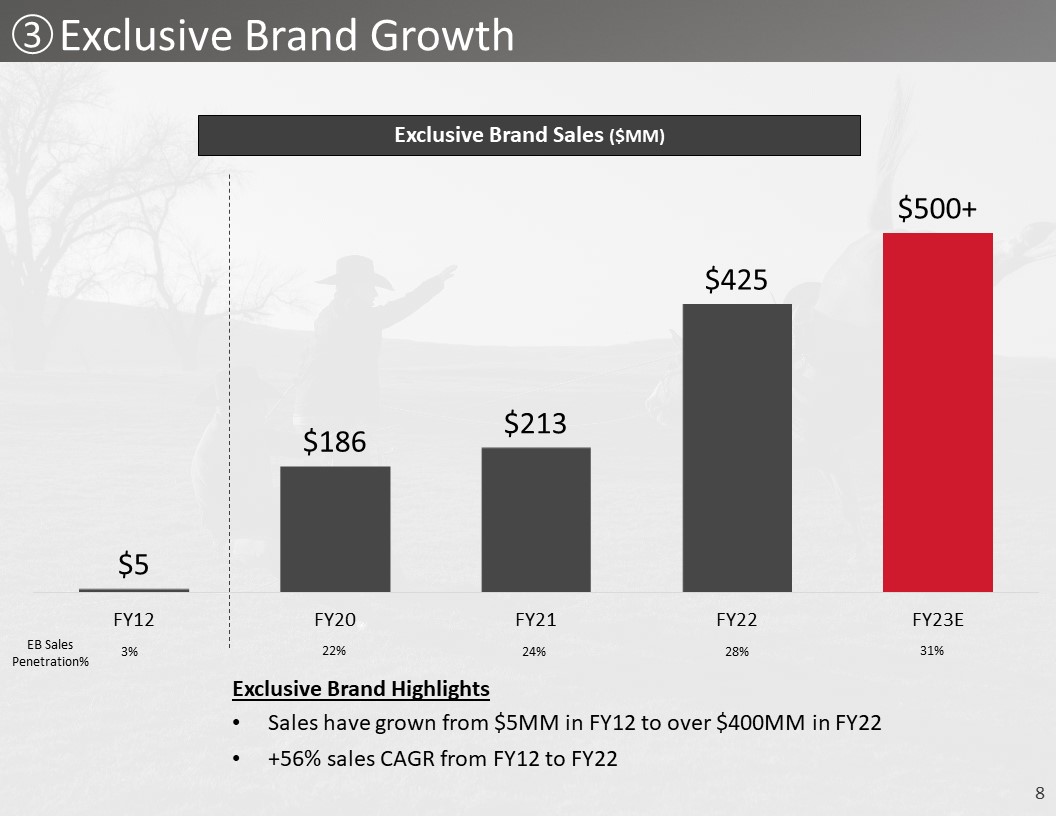
 

 Exclusive Brand Growth  3  Exclusive Brand Sales ($MM)  Exclusive Brand Highlights  Sales have grown from $5MM in FY12 to over $400MM in FY22  +56% sales CAGR from FY12 to FY22  EB Sales Penetration%  3%  24%  28%  31%  22% 
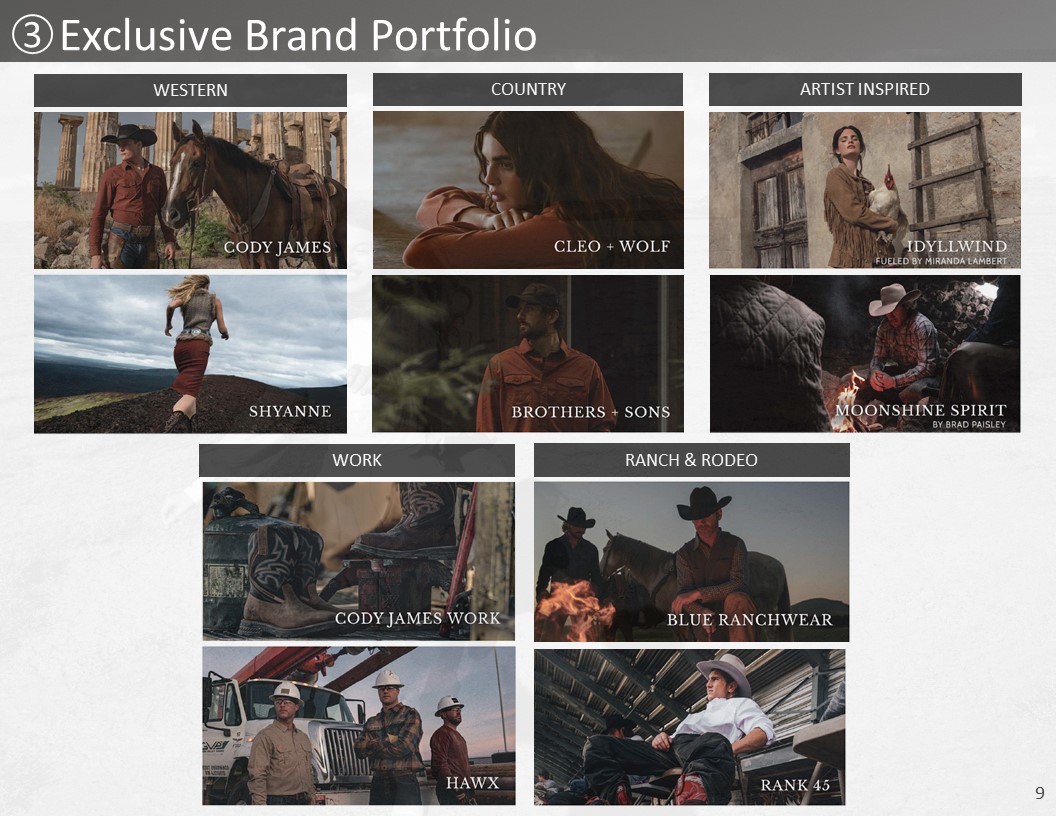
 

 Exclusive Brand Portfolio  3  ARTIST INSPIRED  WORK  WESTERN  COUNTRY  RANCH & RODEO 
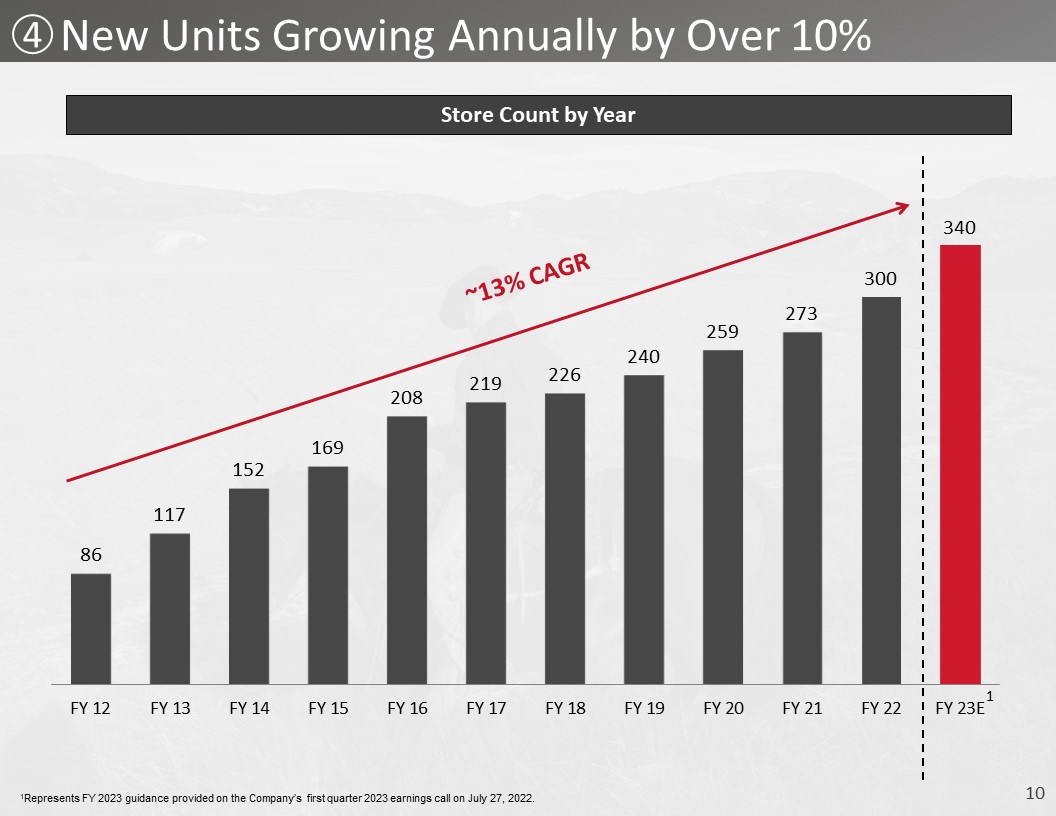
 

 New Units Growing Annually by Over 10%  4  ~13% CAGR  Store Count by Year  1Represents FY 2023 guidance provided on the Company’s first quarter 2023 earnings call on July 27, 2022.   1 
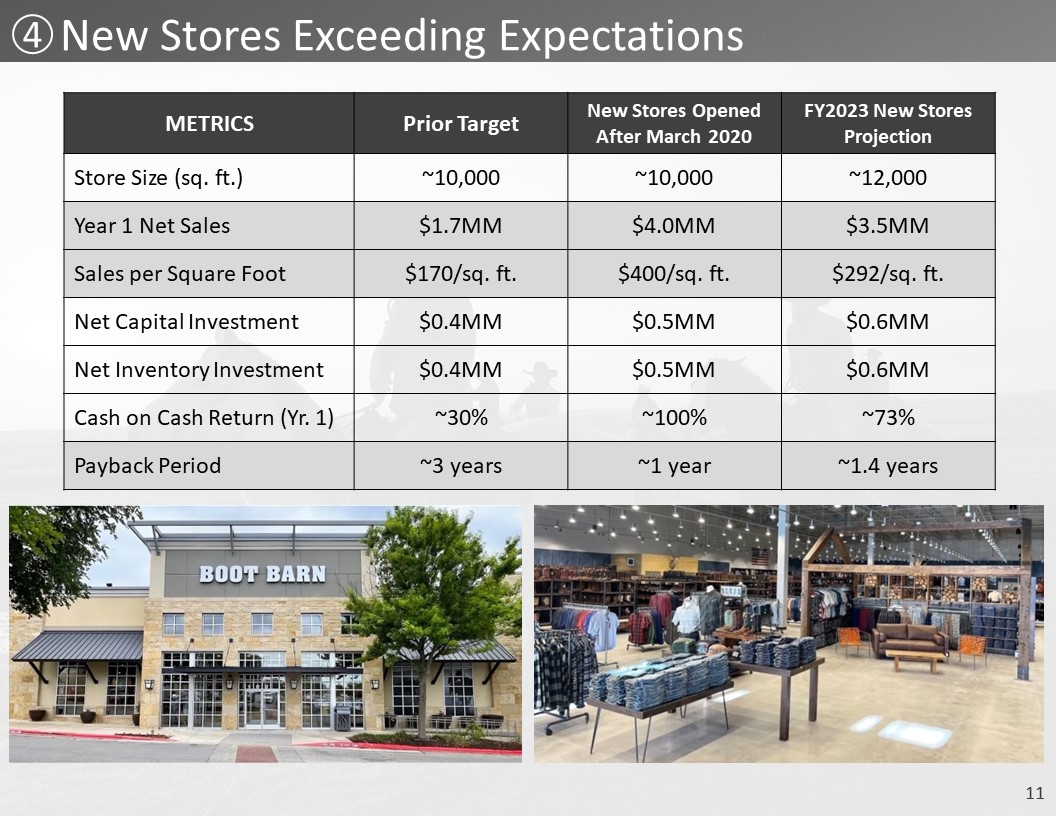
 

 New Stores Exceeding Expectations  METRICS  Prior Target  New Stores Opened After March 2020  FY2023 New Stores Projection  Store Size (sq. ft.)  ~10,000  ~10,000  ~12,000  Year 1 Net Sales  $1.7MM  $4.0MM  $3.5MM  Sales per Square Foot  $170/sq. ft.  $400/sq. ft.  $292/sq. ft.  Net Capital Investment  $0.4MM  $0.5MM  $0.6MM  Net Inventory Investment  $0.4MM  $0.5MM  $0.6MM  Cash on Cash Return (Yr. 1)  ~30%  ~100%  ~73%  Payback Period  ~3 years  ~1 year  ~1.4 years  4 
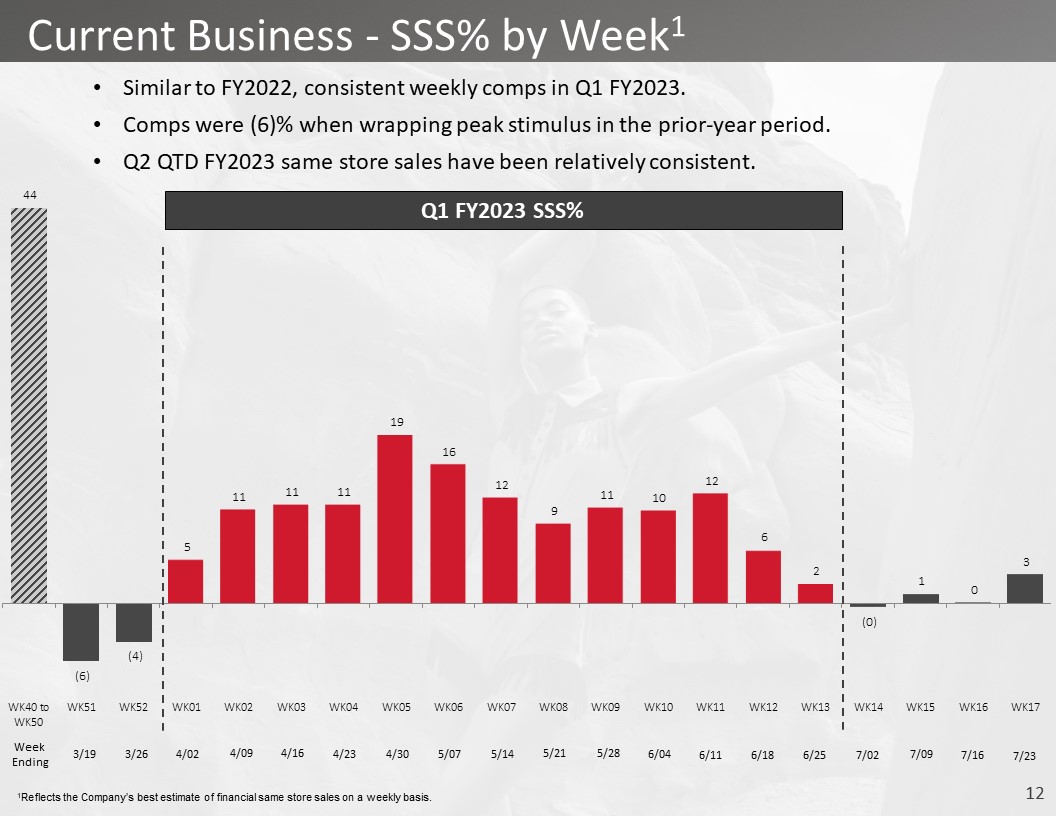
 

 Current Business - SSS% by Week1  Q1 FY2023 SSS%  Week  Ending  3/19  3/26  4/02  4/09  4/16  4/23  4/30  5/07  5/14  5/21  5/28  6/04  6/11  6/18  6/25  7/02  7/09  7/16  Similar to FY2022, consistent weekly comps in Q1 FY2023.  Comps were (6)% when wrapping peak stimulus in the prior-year period.  Q2 QTD FY2023 same store sales have been relatively consistent.  1Reflects the Company’s best estimate of financial same store sales on a weekly basis.  7/23 
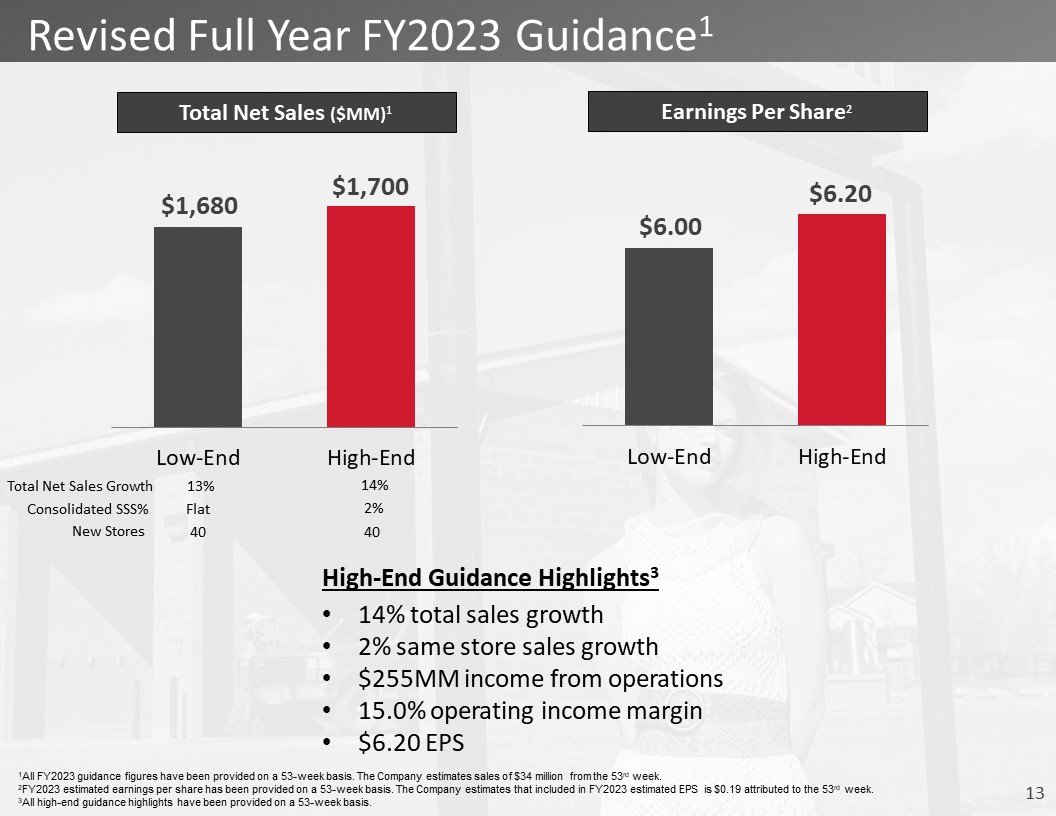
 

 New Stores  40  High-End Guidance Highlights3  14% total sales growth   2% same store sales growth  $255MM income from operations  15.0% operating income margin   $6.20 EPS  Revised Full Year FY2023 Guidance1  Total Net Sales ($MM)1  Earnings Per Share2  Consolidated SSS%  2%  40  1All FY2023 guidance figures have been provided on a 53-week basis. The Company estimates sales of $34 million from the 53rd week.   2FY2023 estimated earnings per share has been provided on a 53-week basis. The Company estimates that included in FY2023 estimated EPS is $0.19 attributed to the 53rd week.  3All high-end guidance highlights have been provided on a 53-week basis.   .   Total Net Sales Growth  14%  13%  Flat 
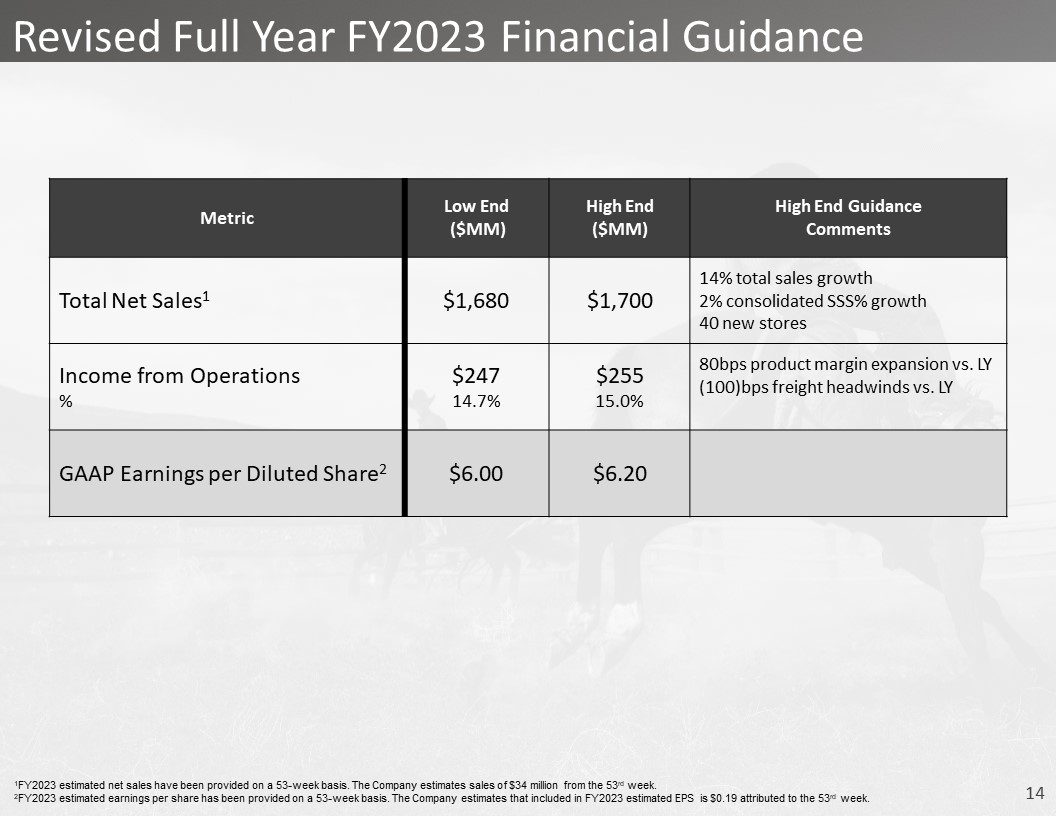
 

 Revised Full Year FY2023 Financial Guidance  Metric  Low End   ($MM)  High End  ($MM)  High End Guidance   Comments  Total Net Sales1  $1,680  $1,700  14% total sales growth  2% consolidated SSS% growth  40 new stores  Income from Operations  %  $247  14.7%  $255  15.0%  80bps product margin expansion vs. LY  (100)bps freight headwinds vs. LY  GAAP Earnings per Diluted Share2  $6.00  $6.20  1FY2023 estimated net sales have been provided on a 53-week basis. The Company estimates sales of $34 million from the 53rd week.   2FY2023 estimated earnings per share has been provided on a 53-week basis. The Company estimates that included in FY2023 estimated EPS is $0.19 attributed to the 53rd week.    
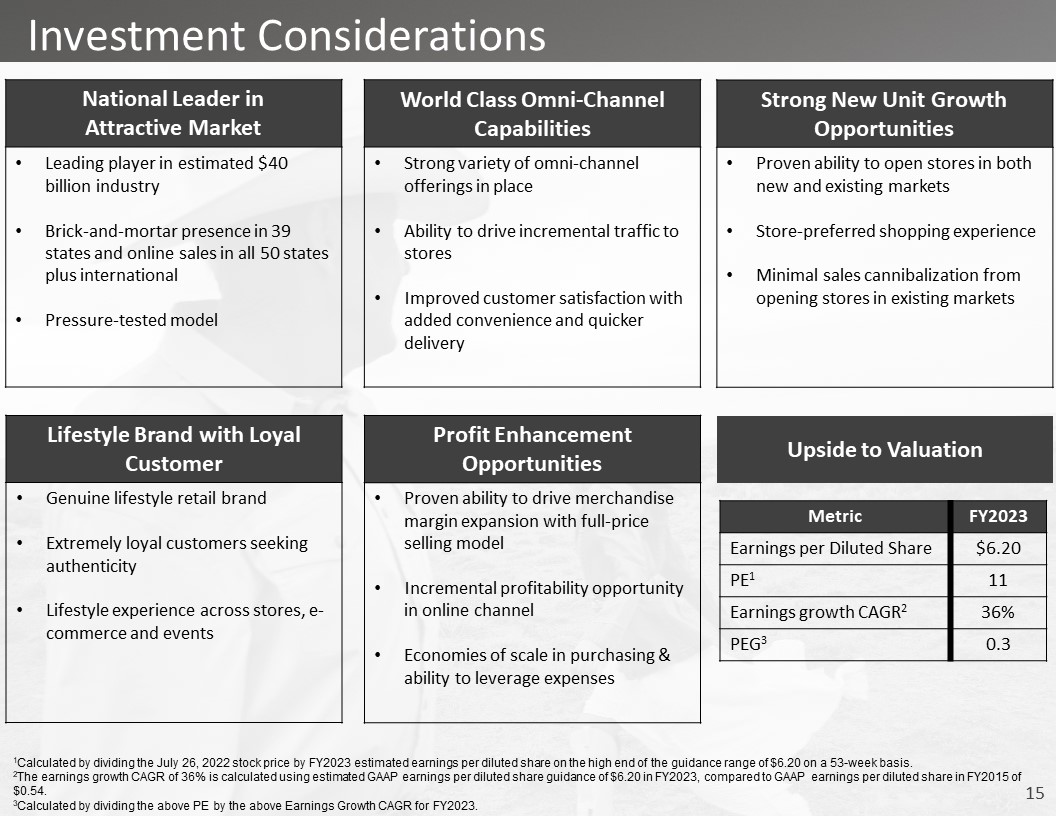
 

 Upside to Valuation  Metric  FY2023  Earnings per Diluted Share  $6.20  PE1  11  Earnings growth CAGR2  36%  PEG3  0.3  1Calculated by dividing the July 26, 2022 stock price by FY2023 estimated earnings per diluted share on the high end of the guidance range of $6.20 on a 53-week basis.   2The earnings growth CAGR of 36% is calculated using estimated GAAP earnings per diluted share guidance of $6.20 in FY2023, compared to GAAP earnings per diluted share in FY2015 of $0.54.  3Calculated by dividing the above PE by the above Earnings Growth CAGR for FY2023.   National Leader in   Attractive Market  Leading player in estimated $40 billion industry  Brick-and-mortar presence in 39 states and online sales in all 50 states plus international  Pressure-tested model   World Class Omni-Channel Capabilities  Strong variety of omni-channel offerings in place  Ability to drive incremental traffic to stores  Improved customer satisfaction with added convenience and quicker delivery  Strong New Unit Growth Opportunities  Proven ability to open stores in both new and existing markets  Store-preferred shopping experience  Minimal sales cannibalization from opening stores in existing markets  Lifestyle Brand with Loyal Customer  Genuine lifestyle retail brand  Extremely loyal customers seeking authenticity  Lifestyle experience across stores, e-commerce and events  Profit Enhancement Opportunities  Proven ability to drive merchandise margin expansion with full-price selling model  Incremental profitability opportunity in online channel  Economies of scale in purchasing & ability to leverage expenses  Investment Considerations 
 

 investor.bootbarn.com